
A Systematic Literature Review of Learning-Based Traffic Accident Prediction Models Based on Heterogeneous Sources


Abstract
:1. Introduction
2. Materials and Methods
2.1. Planning the Review
Research Questions
- RQ01. What are the data sources used by learning-based traffic accident prediction models?
- RQ02. Where were the datasets used by the prediction models extracted from?
- RQ03. What shortcomings are present in the prediction models?
- RQ04. What are the most common algorithms used by the prediction models?
- RQ05. What are the evaluation metrics used by the prediction models?
- RQ06. What is the performance obtained from the prediction models?
- RQ07. What percentages of the data are used by the models for training, validation, and testing?
2.2. Conducting the Review
2.2.1. Search Strategy
2.2.2. Study Selection
- Inclusion criteria
- -
- IC01. Published in science, technology, and transportation journals and proceedings;
- -
- IC02. Peer-reviewed research papers;
- -
- IC03. Articles proposing traffic accident prediction models.
- Exclusion criteria
- -
- EC01. Published in health, psychology, or medical journals and proceedings;
- -
- EC02. Literature reviews, mapping studies, chapters in books, theses, technical reports, research proposals, lectures notes, or handbooks;
- -
- EC03. Published in preprint platforms;
- -
- EC04. Articles without full text;
- -
- EC05. Articles proposing traffic accident detection models.
2.2.3. Study Quality Assessment
- AQ01. Does the study present evaluation metrics
- If the number of metrics = 1, the value is 0.5;
- If the number of metrics > 1, the value is 1.0.
Determining the real causes of traffic accidents is complex because they depend on many factors. Thus, the success of such a prediction model lies in correlating different data sources. - AQ02. Does the prediction model correlate information from different data sources?
- If the number of data sources = 1, the value is 0.5;
- If the number of data sources > 1, the value is 1.0.
Proposing a prediction model by choosing one algorithm and calculating a metric is somewhat imprecise. This process requires an analysis of the model with several baseline algorithms to identify the best one based on indicators and metric values. - AQ03. Does the prediction model use different automatic learning algorithms?
- If 0 < the number of algorithms ≤ 2, the value is 0.5;
- If the number of algorithms > 2, the value is 1.0.
In general, the prediction models have to deal with high dimensionality and imbalance in information, poor handling of long-scale datasets, or insufficient capacities to process and analyze information. Our study also needs to know the challenges faced by traffic accident prediction models. - AQ04. Does the study present challenges that the prediction models must face?
- If the study presents any challenge, the value is 1.0.
- AQ05. Does the study include missing data treatment?
- If the study includes any data missing treatment, the value es 1.0.
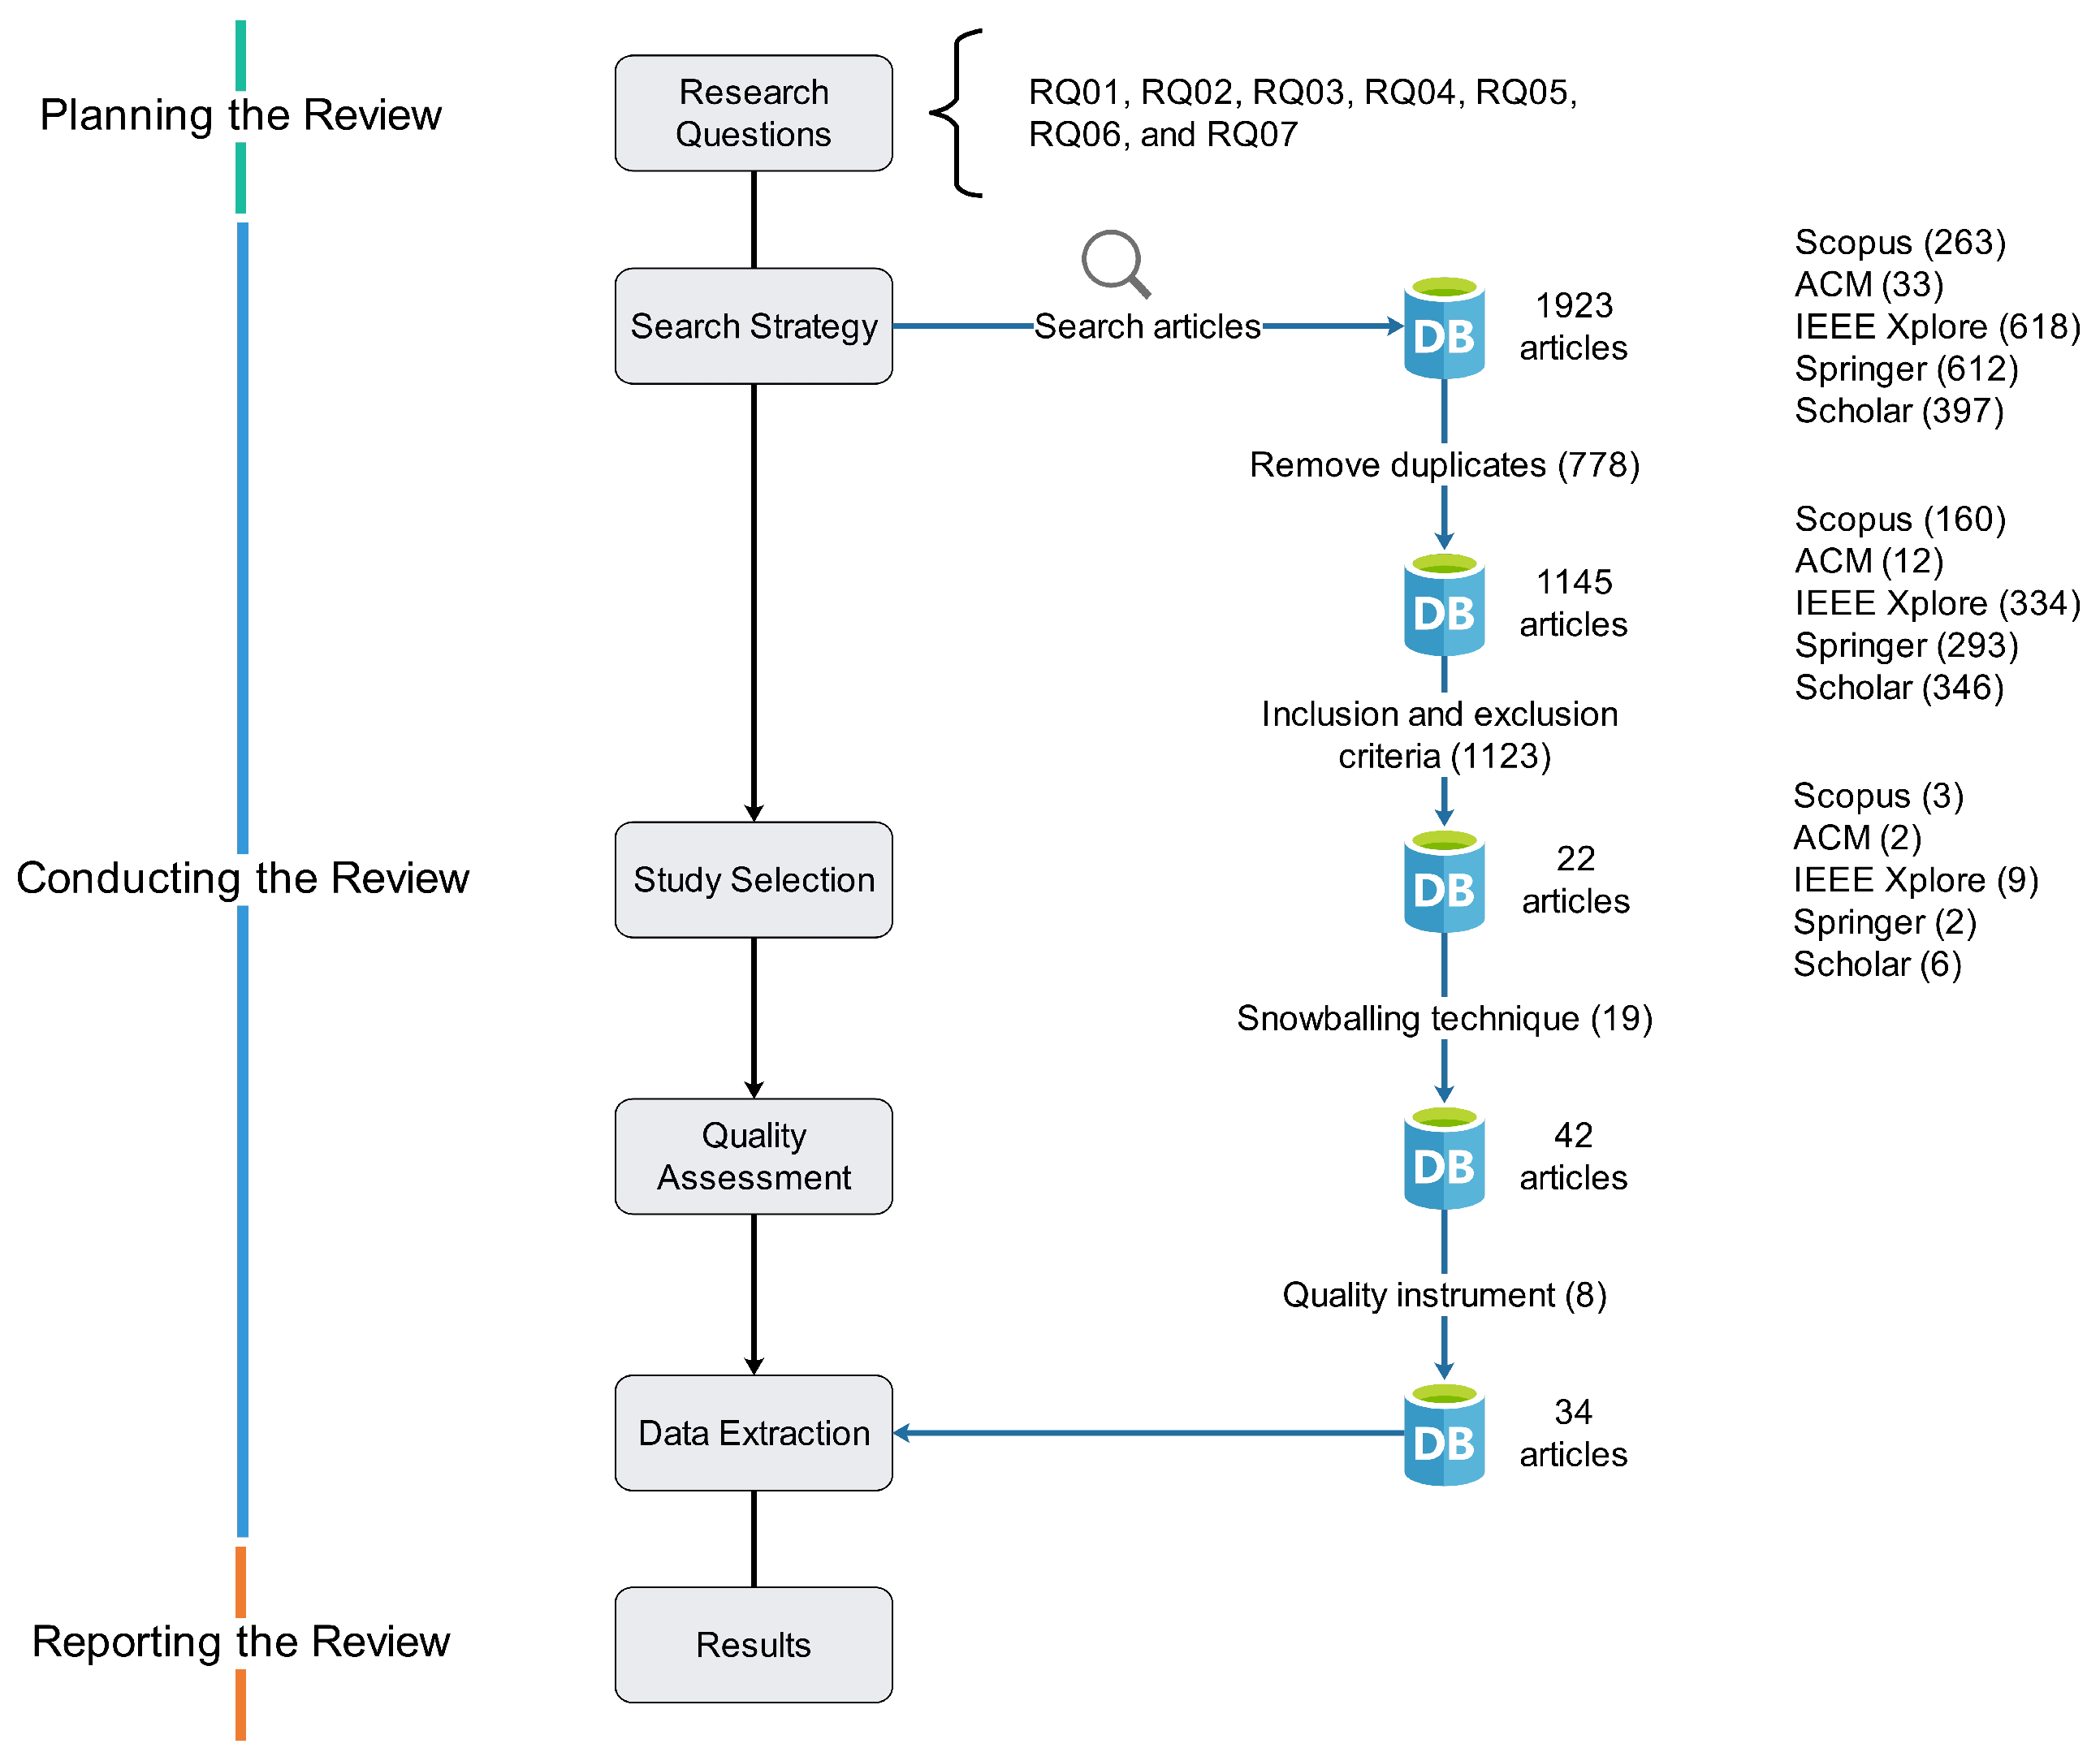
We established, as a selection criterion, that only if the sum of all five questions is greater than or equal to the value defined as the boundary for the first quartile, then the primary study is accepted; otherwise, it is rejected. This value corresponds to 2.5. The research community has widely accepted this selection criterion [11,18]. Table A1 presents the quality instrument and its results, and Figure 1 presents the phase of Conducting the Review. As observed, 1923 articles were found after performing the search strategy activity. Then, 778 duplicate articles were removed, giving a total of 1145 articles. Once the inclusion and exclusion criteria were applied, 1123 articles were excluded, giving a total of 22 articles. After performing the snowballing technique, 20 articles were added, giving a total of 42 articles. Finally, eight articles were rejected because they did not fulfill the quality criterion. Thus, the number of selected primary studies reached 34 papers. Table 2 presents the primary studies that were selected.
2.2.4. Data Extraction
3. Results
3.1. Study Overview
3.2. RQ01
- Vehicle data: identifier, time, location, type, speed, condition, seat belt, pick up and pick off time;
- Driver’s data: age, gender, education level, collision factors (sleepiness and boredom), and involvement of alcohol and drugs;
- Weather conditions: sun, cloud, rain, snow, fog, sleet, crosswind, sand, dawn, dusk, visibility, temperature, precipitation, snowfall, pressure, wind speed, humidity, hail, storm, wind direction, and dew point;
- Light conditions: headlights, streetlights, sunlight, and night light;
- Traffic accidents: vehicles involved, collision type, collision description, the direction of the road, number of killed or injured people, severity, human situation, number of property damage only collisions, number of collisions with casualties and dead, presence of traffic objects, road segment, event type, security level, collision month, vehicle failure, police report, and origin of the collision;
- Traffic flow: vehicle speed according to radar, number of vehicles, occupancy, average speed, annual average daily traffic, driving direction, and lane identifier;
- Traffic events: closures, constructions, broken vehicles, collisions, congestion, and blocked lanes;
- Road infrastructure: geometric characteristics (road length, road shape, road alignment, road type, number of lanes, horizontal curve radius, width of shoulder, slope, tunnel, imperfections, intersections, entrance and exit ramp, and speed limits), and road signs (warning, priority, information, facilities, and service);
- Taxi trips: pick-up and drop-off timestamp, pick-up and drop-off location, trip distance, payment information, taxi zones, and taxi speed;
- Points of interest: place, category, and location;
- Population: *not shown;
- Other: topographic map, digital elevation map, land use, satellite images, the area size of census blocks, special calendar dates, geographical area, trip survey, and bike trip.
3.3. RQ02
- Open platforms: Kaggle and Open Data;
- Government platforms: Institutions of statistics and census, geographical and meteorological organizations, and departments of police and transportation;
- Internet services: MapQuest Traffic, Microsoft Bing Map Traffic, The Weather Channel, Weather Underground, Google Earth Satellite Image, and Twitter;
- Simulators: AIMSUN, VISSIM, PreScan, and Paramics Discovery;
- Applications: Intelligent Transportation Systems (ITS) and Real-Time Monitoring Systems;
- Others: Questionnaires.
3.4. RQ03
- Non-inclusion of spatial heterogeneity within the zones of study;
- Information imbalance (the amount of useless data is greater than useful data) because most data are non-accident related;
- Insufficient capacities to process and analyze an enormous amount of data;
- Poor handling of long-scale datasets. It is not practical to work with huge amounts of raw data; therefore, it is necessary to select relevant features to be extracted. If this selection is not made adequately, the generated models will not work correctly;
- Not having enough related information to train and test the models (e.g., it is essential to have information about traffic accidents and normal traffic conditions from the same segment).
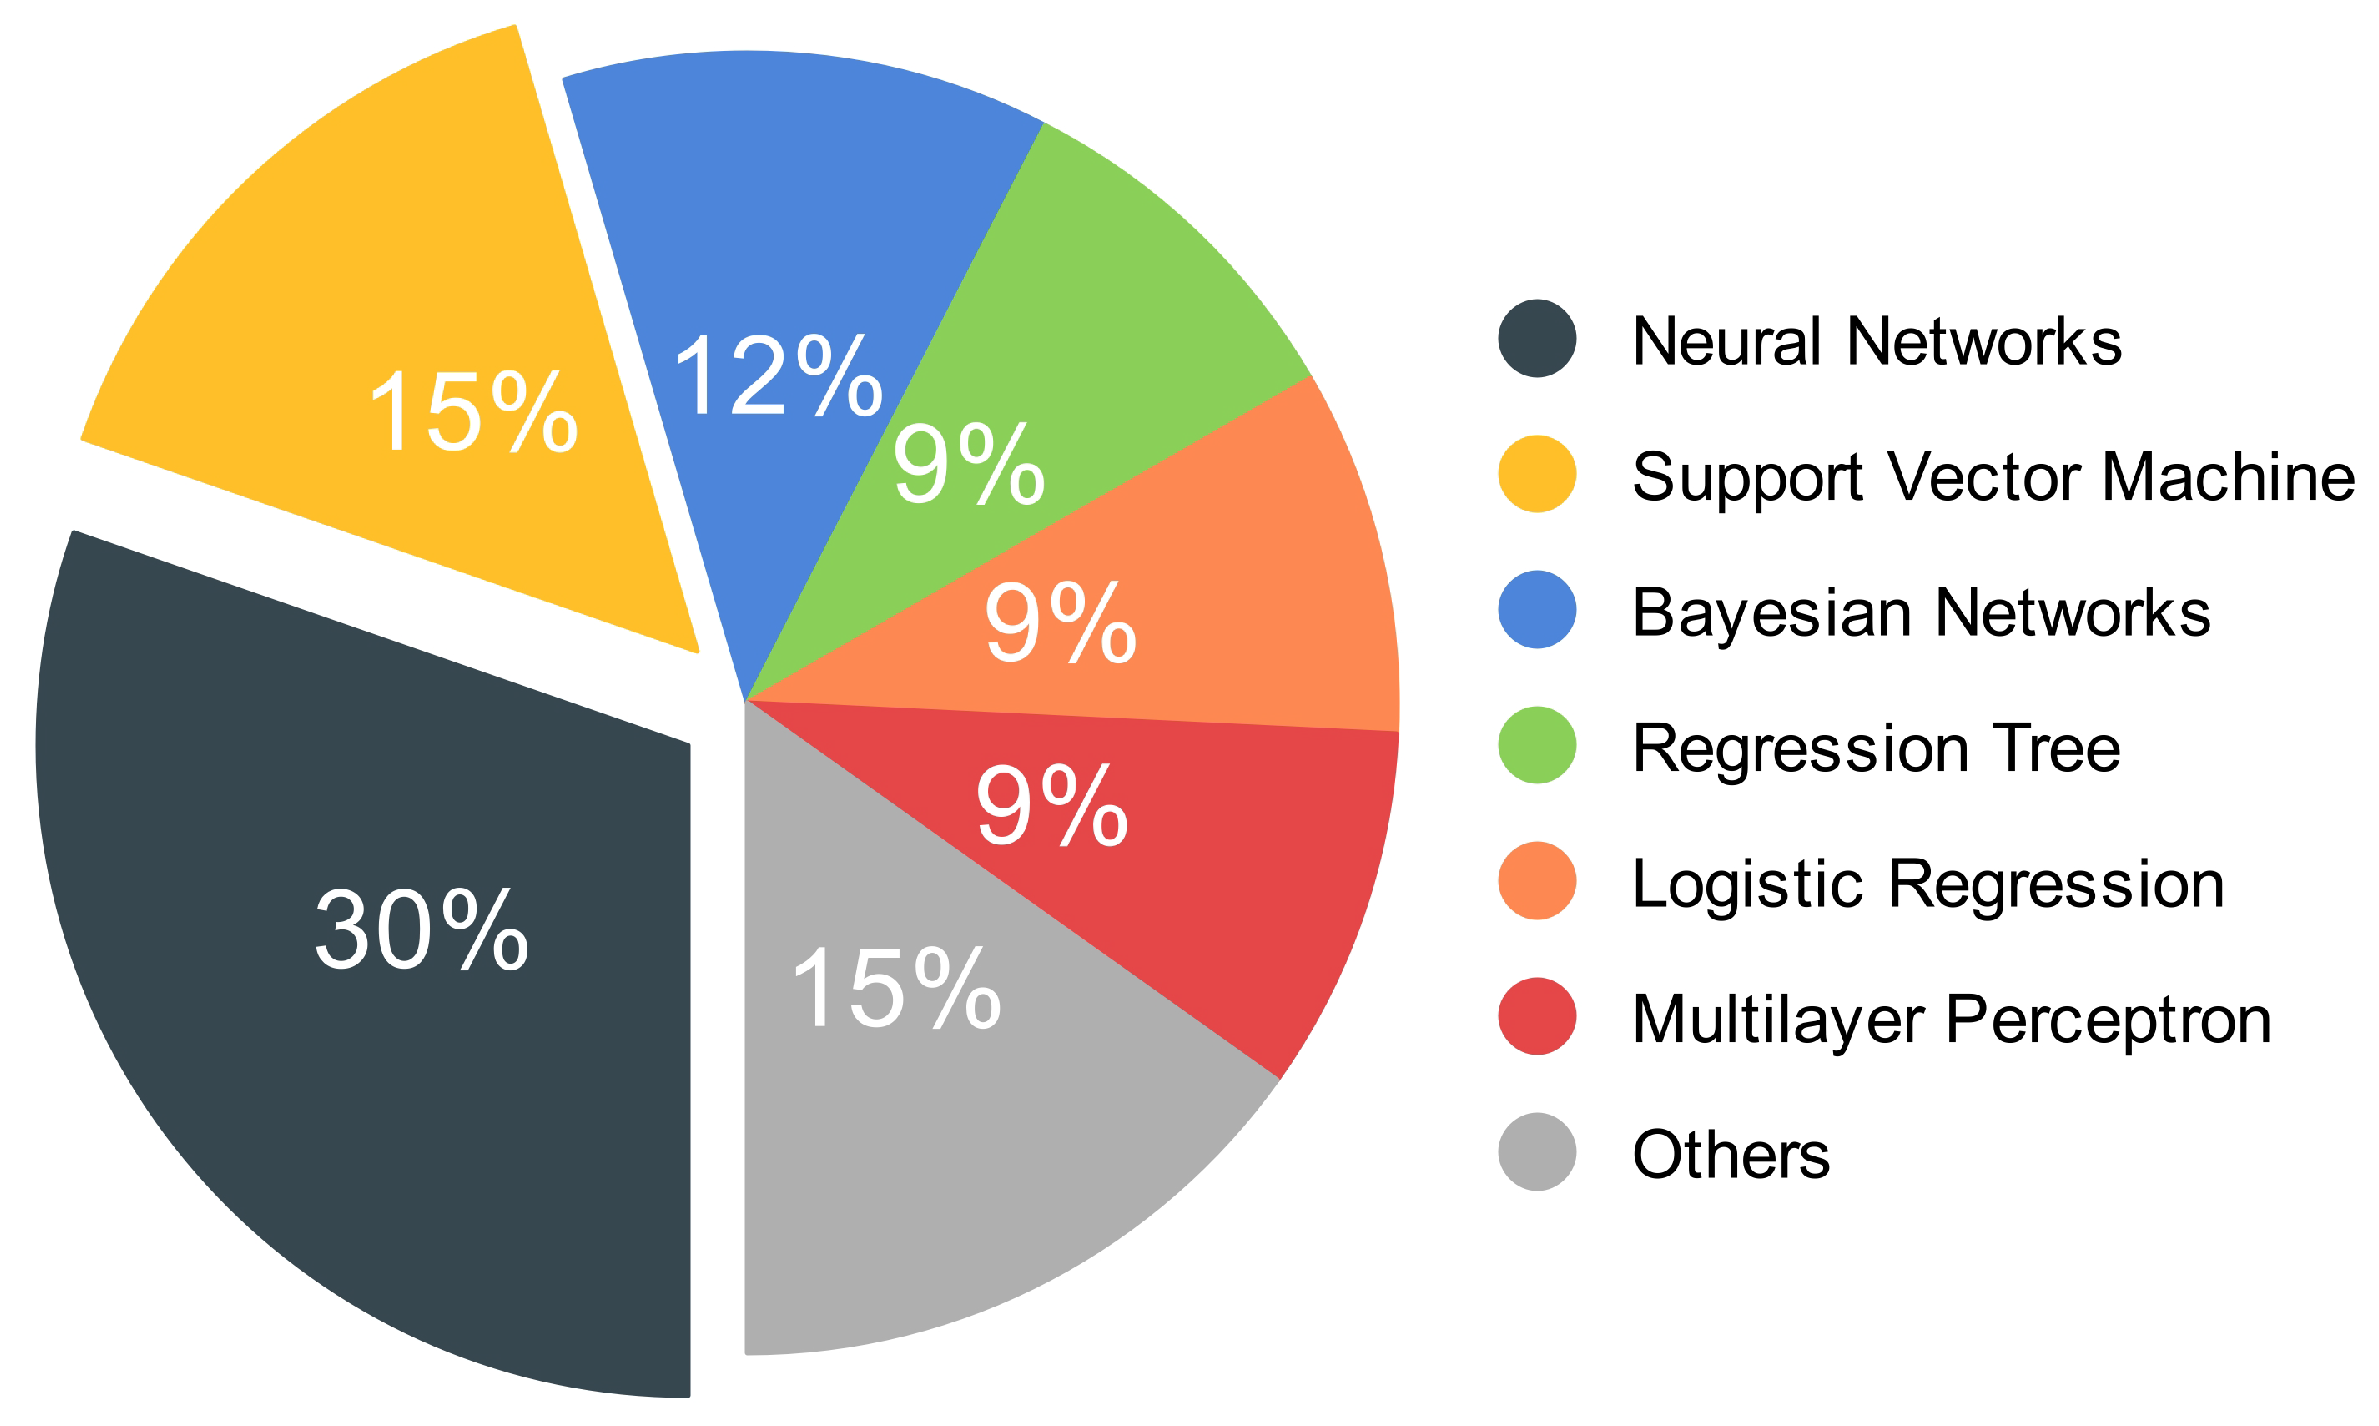
3.5. RQ04
3.6. RQ05
- For classification problems: Prediction Accuracy Rate (PAR)/Accuracy, True Positive Rate (TPR)/Sensitivity/Recall, False Positive Rate (FPR)/Fall-Out, F1 Score, and Area Under Curve (AUC);
- For regression problems: Mean Absolute Error (MAE), Mean Relative Error (MRE), Root Mean-Square Error (RMSE), and Mean Squared Error (MSE).
- For classification: PAR, TPR, and F1 Score;
- For regression: RMSE and MAE.
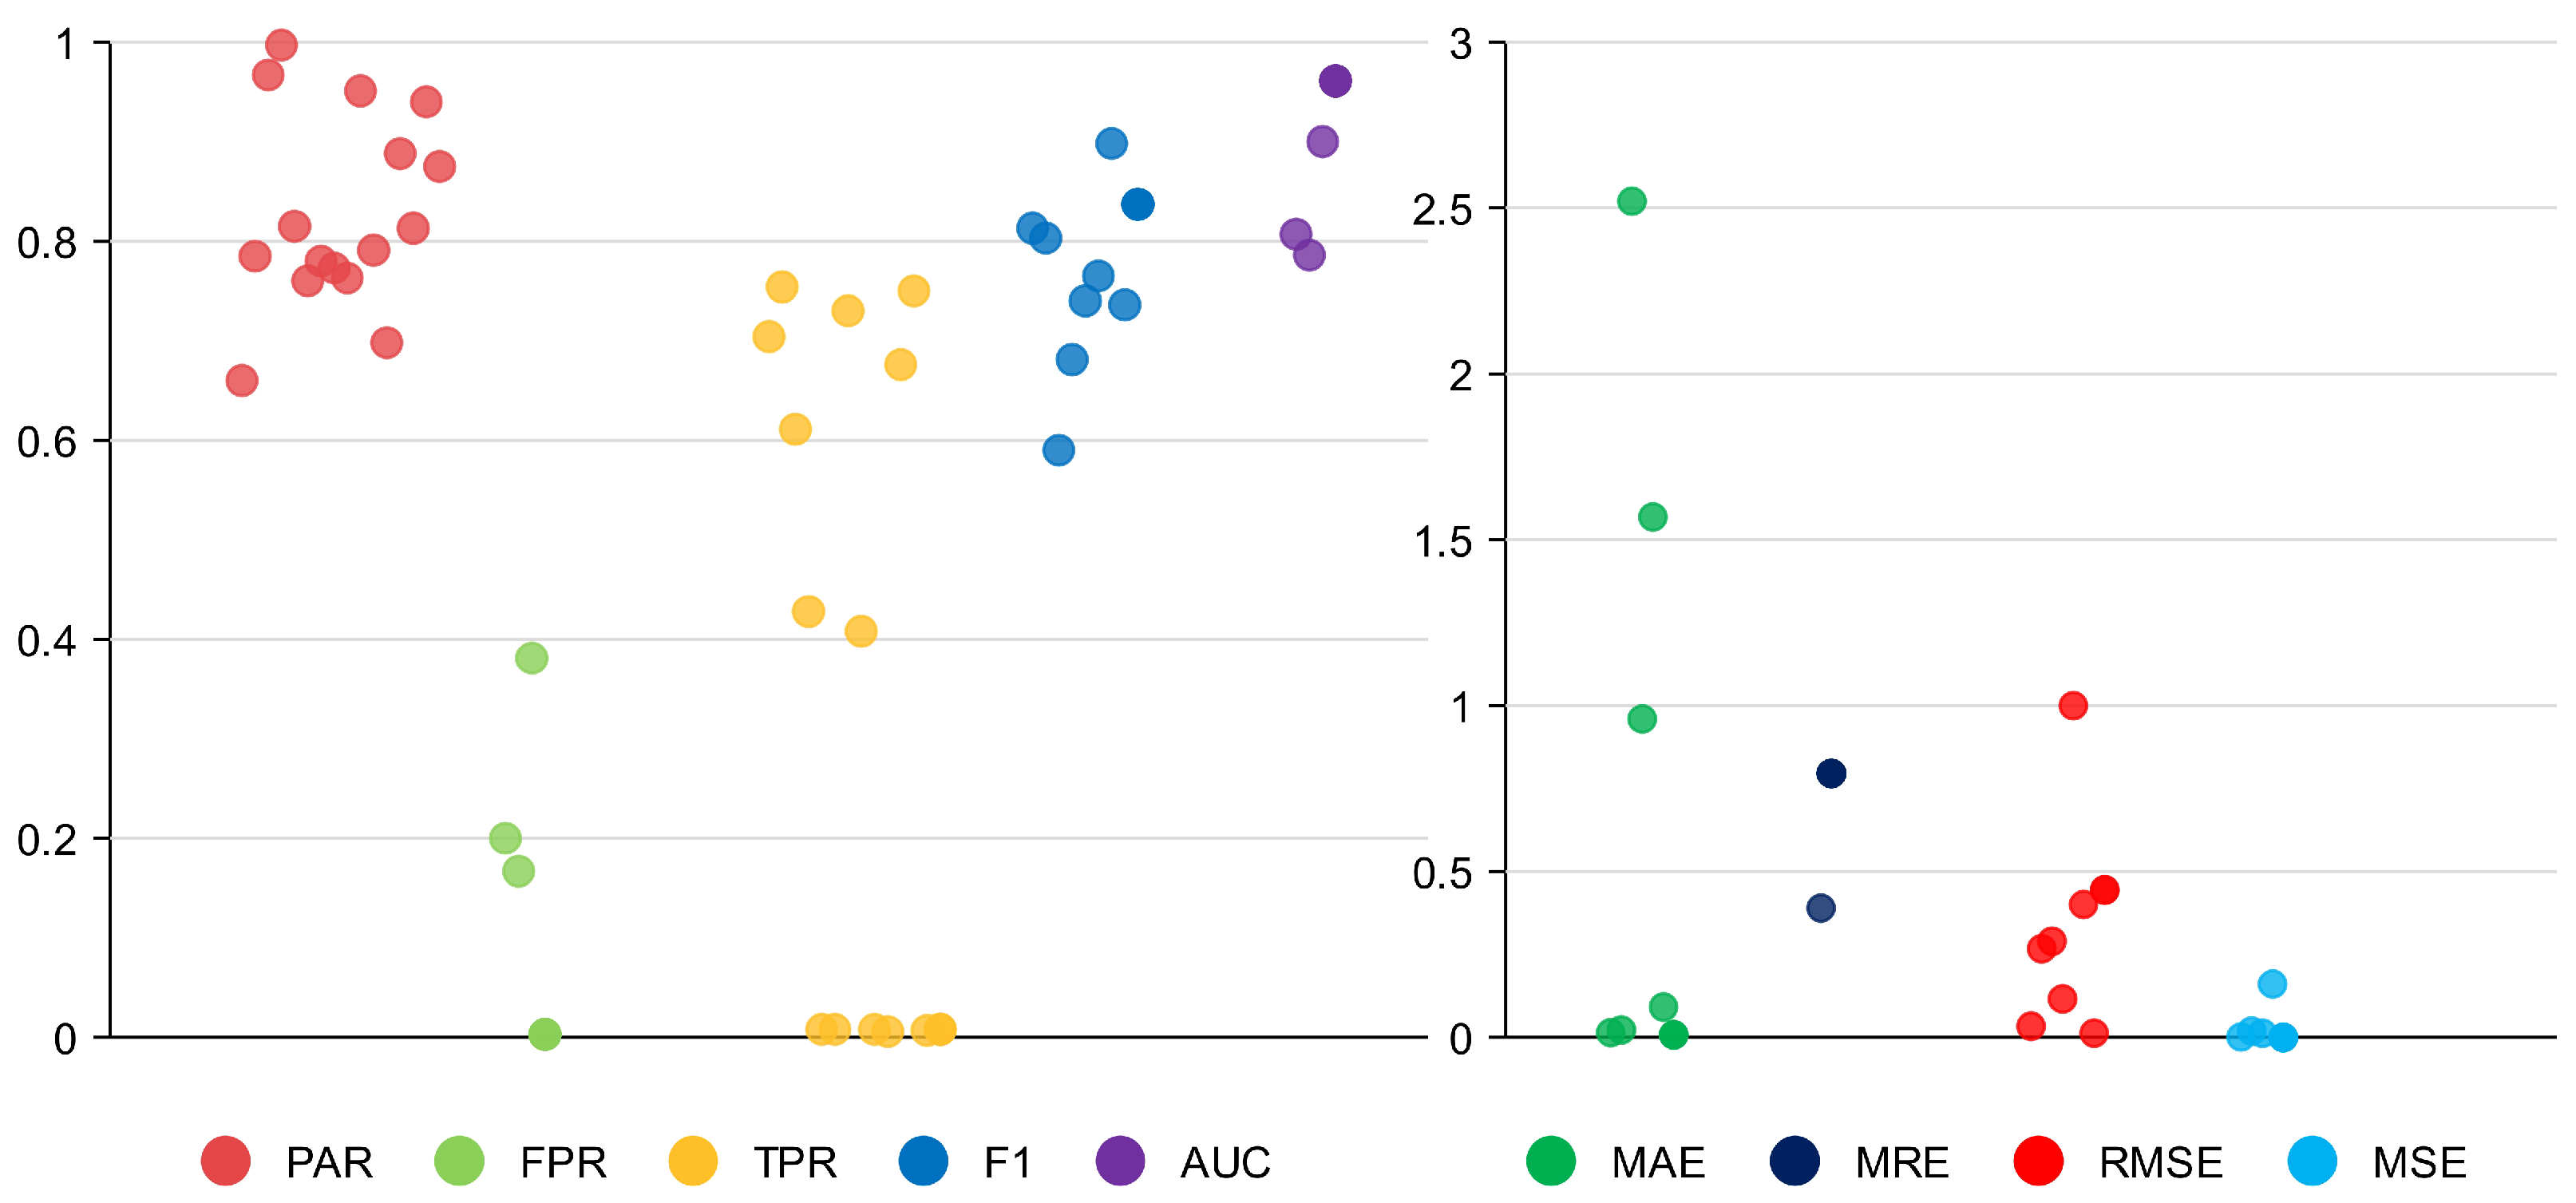
3.7. RQ06
- Accuracy (%):PS01 ≫ 66.00 PS05 ≫ 78.50 PS06 ≫ 96.70 PS08 ≫ 99.79 PS11 ≫ 81.58PS14 ≫ 76.00 PS16 ≫ 78.00 PS18 ≫ 77.34 PS19 ≫ 76.35 PS23 ≫ 95.12PS24 ≫ 79.12 PS25 ≫ 69.80 PS29 ≫ 88.89 PS30 ≫ 81.30 PS33 ≫ 94.00PS34 ≫ 87.54
- Sensitivity (%):PS02 ≫ 70.46 PS04 ≫ 75.40 PS07 ≫ 66.11 PS26 ≫ 75.03
- F1 score:PS09 ≫ 0.813 PS10 ≫ 0.803 PS12 ≫ 0.590 PS15 ≫ 0.681
- Root Mean-Square Error:PS03 ≫ 0.034 PS13 ≫ 0.290 PS17 ≫ 0.116 PS32 ≫ 0.444
- Mean Absolute Error:PS20 ≫ 0.960 PS27 ≫ 1.569 PS28 ≫ 0.092 PS31 ≫ 0.008
- Area Under Curve:PS21 ≫ 0.900
3.8. RQ07
- For training: [60.0–83.0]%
- For validation: [9.0–30.0]%
- For testing: [10.0–40.0]%
4. Discussion
5. Conclusions
Author Contributions
Funding
Acknowledgments
Conflicts of Interest
Abbreviations
| PAHO | The Pan American Health Organization |
| WHO | The World Health Organization |
| GSRRS | Global Status Report on Road Safety |
| SVM | Support Vector Machine |
| HMM | Hidden Markov Model |
| LSTM | Long Short-Term Memory |
| VDS | Vehicle Detection Sensor |
| DBSCAN | Density-Based Spatial Clustering of Applications with Noise |
| NN | Neural Network |
| LASSO | Least Absolute Shrinkage and Selection Operator |
Appendix A

| Title | AQ01 | AQ02 | AQ03 | AQ04 | AQ05 | Total |
|---|---|---|---|---|---|---|
| A Bayesian network based framework for real… [4] | 1.0 | 1.0 | 0.5 | 1.0 | 0.0 | 3.5 |
| A Bayesian network model for real-time crash… [19] | 1.0 | 1.0 | 0.5 | 1.0 | 0.0 | 3.5 |
| A crash-prediction model for multilane roads [54] | 0.0 | 1.0 | 1.0 | 0.0 | 0.0 | 2.0 |
| A deep learning approach to the Citywide… [20] | 1.0 | 0.5 | 1.0 | 1.0 | 0.0 | 3.5 |
| A genetic programming model for real-time crash… [7] | 0.5 | 1.0 | 0.5 | 1.0 | 0.0 | 3.0 |
| A model of traffic accident prediction based on… [21] | 0.5 | 1.0 | 0.5 | 1.0 | 0.0 | 3.0 |
| A New Framework of Vehicle Collision… [22] | 0.5 | 1.0 | 0.5 | 1.0 | 0.0 | 3.0 |
| A novel variable selection method based on… [9] | 1.0 | 1.0 | 0.5 | 1.0 | 1.0 | 4.5 |
| A real-time autonomous highway accident… [23] | 1.0 | 0.5 | 1.0 | 1.0 | 0.0 | 3.5 |
| A real-time explainable traffic collision inference… [24] | 1.0 | 1.0 | 1.0 | 1.0 | 0.0 | 4.0 |
| A rear-end collision prediction scheme based on… [55] | 0.5 | 0.5 | 0.5 | 0.0 | 0.0 | 1.5 |
| A semantic-based classification and regression… [25] | 1.0 | 1.0 | 0.5 | 1.0 | 0.0 | 3.5 |
| A spatiotemporal deep learning approach for… [26] | 1.0 | 1.0 | 1.0 | 1.0 | 0.0 | 4.0 |
| Accident risk prediction based on heterogeneous… [27] | 1.0 | 1.0 | 1.0 | 1.0 | 0.0 | 4.0 |
| Crash prediction based on random effect… [28] | 1.0 | 1.0 | 0.5 | 1.0 | 0.0 | 3.5 |
| Data integration and clustering for real time crash… [5] | 0.0 | 1.0 | 0.5 | 1.0 | 0.0 | 2.5 |
| Deep dynamic fusion network for traffic accident… [29] | 1.0 | 1.0 | 1.0 | 1.0 | 0.0 | 4.0 |
| Evaluating the Performance of Explainable… [30] | 1.0 | 0.5 | 1.0 | 1.0 | 0.0 | 3.5 |
| Hetero-ConvLSTM: A deep learning approach to… [31] | 1.0 | 1.0 | 1.0 | 1.0 | 0.0 | 4.0 |
| Highway crash detection and risk estimation… [32] | 1.0 | 1.0 | 0.5 | 1.0 | 1.0 | 4.5 |
| Highway traffic accident prediction using VDS… [33] | 1.0 | 1.0 | 1.0 | 1.0 | 0.0 | 4.0 |
| Intelligent algorithm in a smart wearable device… [56] | 0.0 | 1.0 | 0.5 | 0.0 | 0.0 | 1.5 |
| Learning deep representation from big and… [34] | 1.0 | 1.0 | 1.0 | 1.0 | 0.0 | 4.0 |
| Operational forecasting of road traffic accidents… [35] | 0.5 | 1.0 | 0.5 | 1.0 | 0.0 | 3.0 |
| Predicting crashes on expressway ramps with… [36] | 1.0 | 1.0 | 0.5 | 1.0 | 0.0 | 3.5 |
| Predicting motor vehicle crashes using Support… [52] | 0.0 | 0.5 | 0.5 | 1.0 | 0.0 | 2.0 |
| Predicting traffic accidents through… [37] | 1.0 | 1.0 | 1.0 | 1.0 | 1.0 | 5.0 |
| Prediction of Crash Severity on Two-Lane, Two… [38] | 1.0 | 1.0 | 1.0 | 1.0 | 1.0 | 5.0 |
| Real-time crash prediction for expressway… [8] | 1.0 | 1.0 | 0.5 | 1.0 | 0.0 | 3.5 |
| Real-time crash prediction in an urban… [6] | 0.5 | 1.0 | 1.0 | 1.0 | 0.0 | 3.5 |
| RiskCast: Social sensing based traffic risk… [39] | 0.5 | 1.0 | 1.0 | 0.0 | 0.0 | 2.5 |
| Real-time estimation of accident likelihood for… [57] | 0.0 | 1.0 | 0.5 | 0.0 | 0.0 | 1.5 |
| Road traffic accidents prediction modelling: An… [58] | 1.0 | 1.0 | 0.0 | 0.0 | 0.0 | 2.0 |
| Road Traffic Injury Prevention Using DBSCAN… [59] | 0.0 | 0.5 | 0.5 | 1.0 | 0.0 | 2.0 |
| SDCAE: Stack Denoising Convolutional… [40] | 1.0 | 1.0 | 1.0 | 1.0 | 0.0 | 4.0 |
| Stack ResNet for Short-term Accident Risk… [41] | 1.0 | 1.0 | 1.0 | 1.0 | 0.0 | 4.0 |
| Support vector machine in crash prediction at… [42] | 1.0 | 1.0 | 0.5 | 0.0 | 0.0 | 2.5 |
| TA-STAN: A Deep Spatial-Temporal… [43] | 1.0 | 1.0 | 1.0 | 0.0 | 0.0 | 3.0 |
| Traffic accident prediction based on deep… [44] | 1.0 | 1.0 | 1.0 | 1.0 | 0.0 | 4.0 |
| Traffic accident prediction model using… [45] | 0.5 | 1.0 | 1.0 | 0.0 | 0.0 | 2.5 |
| Traffic accident prediction using 3-D… [60] | 0.0 | 0.5 | 0.5 | 0.0 | 0.0 | 1.0 |
| Utilizing Machine Learning Models to Predict… [46] | 1.0 | 1.0 | 1.0 | 1.0 | 1.0 | 5.0 |
| ID | Data Source | Type 1 | Type 2 | Variables |
|---|---|---|---|---|
| PS01 | traffic flow | real | variable | vehicle speed, number of vehicles… |
| traffic accidents | real | variable | date, time, location, vehicles involved… | |
| PS02 | traffic flow | real | variable | vehicle speed, flow, and occupancy |
| traffic accidents | real | variable | time, location, and collision description | |
| PS03 | traffic accidents | real | variable | time and location |
| PS04 | weather conditions | real | variable | clear and adverse |
| traffic flow | real | variable | vehicle speed, number of vehicles… | |
| PS05 | weather conditions | real | variable | sun, cloud, rain, snow, fog, sleet… |
| traffic flow | real | variable | vehicle speed, number of vehicles… | |
| PS06 | weather conditions | simulated | variable | rain, snow, and fog |
| light conditions | simulated | variable | sun, headlights, and streetlight | |
| PS07 | weather conditions | real | variable | type and visibility |
| traffic accidents | Not available | |||
| traffic flow | real | variable | vehicle speed, volume, and occupancy | |
| PS08 | traffic accidents | real | variable | date, time, location… |
| traffic flow | real | variable | date, time, number of vehicles… | |
| PS09 | weather conditions | real | variable | tweets (snow, sleet, fog…) |
| traffic accidents | real | variable | time, street name, location… | |
| traffic events | real | variable | tweets (closures, incidents…) | |
| PS10 | vehicle data | real | static | type and seat belt |
| driver’s data | real | static | age, gender, and education level | |
| weather conditions | real | variable | visibility | |
| light conditions | Not available | |||
| traffic accidents | real | variable | time, day of week, severity… | |
| road infrastructure | real | static | geometric characteristics | |
| others | real | static | topographic map… | |
| PS11 | weather conditions | real | variable | average temperature, precipitation… |
| traffic accidents | real | variable | date, time, location, collision type… | |
| taxi trips | real | variable | pick-up timestamp, pick-up location… | |
| traffic flow | real | variable | volume | |
| road infrastructure | real | static | road length, road type, and intersections | |
| population | real | static | Not available | |
| others | real | static | land use | |
| PS12 | weather conditions | real | variable | temperature, pressure, humidity… |
| traffic events | real | variable | collision, broken vehicle, congestion… | |
| road infrastructure | real | static | warning, priority, information… | |
| PS13 | weather conditions | real | variable | visibility |
| traffic accidents | real | variable | number of property damage only… | |
| traffic flow | real | variable | average speed limit… | |
| road infrastructure | real | static | road length, curvature… | |
| PS14 | weather conditions | simulated | variable | street identifier, temperature, snow… |
| traffic accidents | simulated | variable | time, location… | |
| traffic flow | simulated | variable | Not available | |
| road infrastructure | simulated | static | geometric characteristics | |
| points of interest | simulated | static | location | |
| PS15 | traffic accidents | real | variable | timestamp, location… |
| traffic events | real | variable | timestamp, location, and category | |
| points of interest | real | static | place, category, and location | |
| PS16 | weather conditions | real | variable | Not available |
| traffic accidents | real | variable | date, time, city, state… | |
| PS17 | weather conditions | real | variable | precipitation, temperature… |
| traffic accidents | real | variable | time and location | |
| road infrastructure | real | static | speed limits and volume | |
| others | real | static | satellite images | |
| PS18 | traffic accidents | real | variable | identifier, timestamp, location… |
| traffic flow | real | variable | volume, average speed, and occupancy | |
| PS19 | weather conditions | real | variable | Not available |
| traffic accidents | real | variable | time, day, location, number of dead… | |
| traffic flow | real | variable | time, number of lanes, volume, density… | |
| road infrastructure | real | static | road shape and alignment | |
| PS20 | traffic accidents | real | variable | time, location, and security level |
| pedestrian mobility | real | variable | identifier and location | |
| PS21 | weather conditions | undefined | variable | categories |
| light conditions | undefined | variable | categories | |
| traffic accidents | undefined | variable | time, day of week, and collision month | |
| traffic flow | undefined | variable | type and state of the control device… | |
| road infrastructure | undefined | static | speed limit, road type, pavement type… | |
| traffic events | undefined | variable | type | |
| PS22 | traffic accidents | real | static | time, location, vehicles involved… |
| traffic flow | real | variable | average speed, volume, average… | |
| road infrastructure | real | static | road type, road length, tolls… | |
| weather data | real | variable | visibility and road surface | |
| PS23 | weather data | real | variable | precipitation, temperature… |
| traffic accidents | real | variable | time and location | |
| traffic flow | real | variable | speed limits and annual average daily… | |
| population | real | static | Not available | |
| others | real | static | area size of census blocks | |
| PS24 | vehicle data | real | static | type |
| driver’s data | real | static | age, gender, education level… | |
| weather conditions | real | variable | sun, fog, rain, snow, storm, dry, wet… | |
| light conditions | real | variable | day or night | |
| traffic accidents | real | variable | time, day of week, and vehicle failure | |
| road infrastructure | real | static | road width, imperfections… | |
| others | real | static | topographic map and digital elevation… | |
| PS25 | weather conditions | real | variable | type, wind direction and speed… |
| traffic accidents | real | variable | time, location, collision type… | |
| traffic flow | real | variable | number of vehicles, occupancy… | |
| road infrastructure | real | static | entrance and exit ramp | |
| PS26 | vehicle data | real | static / | identifier, time, vehicle speed, and type |
| variable | ||||
| traffic accidents | real | variable | date, time, location, and collision type | |
| PS27 | traffic accidents | real | variable | tweets and police report |
| PS28 | traffic accidents | real | variable | identifier, time, location… |
| traffic flow | real | variable | device identifier, timestamp… | |
| PS29 | weather conditions | real | variable | precipitation, snowfall, temperature… |
| road infrastructure | real | static | number of lanes, road type… | |
| pedestrian mobility | real | variable | people’s arrivals and departures | |
| points of interest | real | static | place, location, and category | |
| population | real | static | Not available | |
| others | real | static | weekends and holidays | |
| PS30 | traffic accidents | real | variable | number of dead and victims… |
| road infrastructure | real | static | road width, segment length… | |
| population | real | static | Not available | |
| others | real | static | geographical area, income… | |
| PS31 | vehicle data | real | variable | location, pick up and pick off time |
| weather conditions | real | variable | date, time, location, temperature… | |
| traffic accidents | real | variable | time, place, street, collision reason | |
| road infrastructure | real | static | geometric characteristics | |
| taxi trips | real | static | taxi zones | |
| points of interest | real | static | name, location, and category | |
| others | real | variable | start and end point | |
| PS32 | weather conditions | real | variable | temperature, dew point, humidity… |
| traffic accidents | real | variable | time and location | |
| road infrastructure | real | static | name and points for roads… | |
| taxi trips | real | variable | time, location, and speed | |
| points of interest | real | static | name, location, and category | |
| PS33 | vehicle data | simulated | variable | speed and vehicle condition |
| driver’s data | simulated | static | age, involvement of alcohol and drugs | |
| weather conditions | simulated | variable | Not available | |
| PS34 | traffic accidents | real | variable | age, gender, injury, collision year… |
| traffic flow | real | variable | volume | |
| road infrastructure | real | static | geometric characteristics (speed limits) |
| ID | Datasets/Services | Simulators |
|---|---|---|
| PS01 | Metropolitan Expressway Company Limited and Vehicle Collision and Normal Traffic Condition [61] | |
| PS02 | California Department of Transportation and Highway Performance Measurement System [62] | |
| PS03 | Beijing traffic accident data | |
| PS04 | The Statewide Integrated Traffic Records System [63], Highway Performance Measurement System [64], and Interstate 880 Highway | |
| PS05 | Interstate 15 Highway | |
| PS06 | Prescan [65] and Matlab/Simulink | |
| PS07 | Virginia Department of Transportation [66] and Interstate 64 Highway | |
| PS08 | Intelligent Transportation Systems and Real-Time Monitoring System [67] | |
| PS09 | Twitter API [68] and New York City Open Data [69] | |
| PS10 | National Cartographic Centre [70], Ministry of Roads and Urban Development [71], Meteorological Organization [72], and Highway Police [73] | |
| PS11 | New York of Police Department (Vehicle collisions) [69], New York City Taxi and Limousine Commission, Taxi GPS Data [74], New York City Department of Transportation [75], United States Census Bureau (TIGER files) [76], New York City Department of City Planning [77], and National Climatic Data Center [78] | |
| PS12 | US-Accidents dataset [79], MapQuest Traffic [80], and Microsoft Bing Map Traffic [81] | |
| PS13 | Washington State Department of Transportation [82], Highway Safety Information System [83], and Digital Roadway Interactive Visualization and Evaluation Network [84] | |
| PS14 | Paramics Microsimulation [85], AIMSUN [86], and VISSIM [87] | |
| PS15 | New York Police Department (Traffic Accident Dataset) [69], Points of Interest from New York City [88], and New York City’s governmental platform [88] | |
| PS16 | US Accidents (A Countrywide Traffic Accident Dataset) [89] and The Weather Channel [90] | |
| PS17 | Iowa Department of Transportation [91], Iowa Department of Transportation (RWIS) [92], Iowa Department of Transportation (Iowa DOT GIS) [93], and Google Earth Satellite Image [94] | |
| PS18 | Iowa Department of Transportation (Traffic Management Centers Reports) [91], Iowa DOT (Interstate 235 (I-235) and Traffic Flow) [91] | |
| PS19 | Korea Expressway Corporation (Traffic Flow) [95] and Korean National Policy Agency (Traffic Accidents) [96] | |
| PS20 | Japan traffic accident data and Japan human mobility data | |
| PS21 | Not available | |
| PS22 | Signal Four Analytics [97], Central Florida Expressway Authority [98], and National Climatic Data Center (Weather Data) [78] | |
| PS23 | Iowa Department of Transportation (Vehicle collisions) [91], Stage IV radar rainfall [99], Iowa Department of Transportation (RWIS) [92], Iowa Department of Transportation (Iowa DOT GIS) [93], and Census Data [76] | |
| PS24 | Iran National Cartographic Center [70], Ministry of Roads and Urban Development Islamic Republic of Iran [71], Iran Meteorological Organization [72], National Geographical Organization of Iran [100], and the Information and Technology Department of the Iranian Traffic Police [73] | |
| PS25 | Signal Four Analytics [97], National Climatic Data Center [78] and Central Florida Expressway Authority [98] | |
| PS26 | Autopista Central [101] and Department of Geophysics of University of Chile [102] | |
| PS27 | New York City Police Department (Public Traffic Accident Report) [103] | |
| PS28 | Xiamen traffic accident data and Vehicle License Plate Recognition sensors | |
| PS29 | New York City data | |
| PS30 | Florida Department of Transportation (Crash Analysis Reporting System) [104], FDOT (Roadway Characteristics Inventory) [104], Map of Hillsborough, and United States Census Report [76] | |
| PS31 | New York of Police Department (Vehicle collisions) [69], New York City Taxi and Limousine Commission (Trip Data) [74], National Climatic Data Center (Weather Data) [78], and New York City Open Data [69] | |
| PS32 | Beijing’s datasets about traffic accidents and Weather Underground [105] | |
| PS33 | Questionnaires filled by drivers, pedestrians, and others | |
| PS34 | Office of Highway Safety Planning (Michigan Traffic Crash Facts Dataset) [106] |
References
- World Health Organization. Global Status Report on Road Safety 2018; WHO: Geneva, Switzerland, 2018.
- Pan American Health Organization. Status of Road Safety in the Region of the Americas 2018; PAHO: Washington, DC, USA, 2019. [Google Scholar]
- Yasin Çodur, M.; Tortum, A. An artificial neural network model for highway accident prediction: A case study of Erzurum, Turkey. PROMET-Traffic Transp. 2015, 27, 217–225. [Google Scholar] [CrossRef] [Green Version]
- Hossain, M.; Muromachi, Y. A Bayesian network based framework for real-time crash prediction on the basic freeway segments of urban expressways. Accid. Anal. Prev. 2012, 45, 373–381. [Google Scholar] [CrossRef]
- Paikari, E.; Moshirpour, M.; Alhajj, R.; Far, B.H. Data integration and clustering for real time crash prediction. In Proceedings of the 2014 IEEE 15th International Conference on Information Reuse and Integration (IEEE IRI 2014), Redwood City, CA, USA, 13–15 August 2014; pp. 537–544. [Google Scholar]
- Basso, F.; Basso, L.J.; Bravo, F.; Pezoa, R. Real-time crash prediction in an urban expressway using disaggregated data. Transp. Res. Part C Emerg. Technol. 2018, 86, 202–219. [Google Scholar] [CrossRef]
- Xu, C.; Wang, W.; Liu, P. A genetic programming model for real-time crash prediction on freeways. IEEE Trans. Intell. Transp. Syst. 2012, 14, 574–586. [Google Scholar] [CrossRef]
- Wang, L.; Abdel-Aty, M.; Shi, Q.; Park, J. Real-time crash prediction for expressway weaving segments. Transp. Res. Part C Emerg. Technol. 2015, 61, 1–10. [Google Scholar] [CrossRef]
- Lin, L.; Wang, Q.; Sadek, A.W. A novel variable selection method based on frequent pattern tree for real-time traffic accident risk prediction. Transp. Res. Part C Emerg. Technol. 2015, 55, 444–459. [Google Scholar] [CrossRef]
- Kitchenham, B. Procedures for Performing Systematic Reviews; Joint Technical Report; Keele University: Keele, UK, 2004; pp. 1–26. [Google Scholar]
- Kitchenham, B.; Brereton, O.P.; Budgen, D.; Turner, M.; Bailey, J.; Linkman, S. Systematic literature reviews in software engineering–A systematic literature review. Inf. Softw. Technol. 2009, 51, 7–15. [Google Scholar] [CrossRef]
- Cavacini, A. What is the best database for computer science journal articles? Scientometrics 2015, 102, 2059–2071. [Google Scholar] [CrossRef]
- Pan, R.; Yang, T.; Cao, J.; Lu, K.; Zhang, Z. Missing data imputation by K nearest neighbours based on grey relational structure and mutual information. Appl. Intell. 2015, 43, 614–632. [Google Scholar] [CrossRef]
- Wang, S.; Li, B.; Yang, M.; Yan, Z. Missing Data Imputation for Machine Learning. In International Conference on Internet of Things as a Service; Springer: Berlin/Heidelberg, Germany, 2018; pp. 67–72. [Google Scholar]
- Idri, A.; Kadi, I.; Abnane, I.; Fernandez-Aleman, J.L. Missing data techniques in classification for cardiovascular dysautonomias diagnosis. Med. Biol. Eng. Comput. 2020, 58, 2863–2878. [Google Scholar] [CrossRef] [PubMed]
- Nugroho, H.; Utama, N.P.; Surendro, K. Class center-based firefly algorithm for handling missing data. J. Big Data 2021, 8, 1–14. [Google Scholar] [CrossRef]
- Nagarajan, G.; Babu, L.D. Missing data imputation on biomedical data using deeply learned clustering and L2 regularized regression based on symmetric uncertainty. Artif. Intell. Med. 2022, 123, 102214. [Google Scholar] [CrossRef] [PubMed]
- Jaramillo-Yánez, A.; Benalcázar, M.E.; Mena-Maldonado, E. Real-time hand gesture recognition using surface electromyography and machine learning: A systematic literature review. Sensors 2020, 20, 2467. [Google Scholar] [CrossRef]
- Wu, M.; Shan, D.; Wang, Z.; Sun, X.; Liu, J.; Sun, M. A Bayesian Network Model for Real-time Crash Prediction Based on Selected Variables by Random Forest. In Proceedings of the 2019 5th International Conference on Transportation Information and Safety (ICTIS), Liverpool, UK, 14–17 July 2019; pp. 670–677. [Google Scholar]
- Ren, H.; Song, Y.; Wang, J.; Hu, Y.; Lei, J. A deep learning approach to the citywide traffic accident risk prediction. In Proceedings of the 2018 21st International Conference on Intelligent Transportation Systems (ITSC), Maui, HI, USA, 4–7 November 2018; pp. 3346–3351. [Google Scholar]
- Wenqi, L.; Dongyu, L.; Menghua, Y. A model of traffic accident prediction based on convolutional neural network. In Proceedings of the 2017 2nd IEEE International Conference on Intelligent Transportation Engineering (ICITE), Singapore, 1–3 September 2017; pp. 198–202. [Google Scholar]
- Xiong, X.; Chen, L.; Liang, J. A new framework of vehicle collision prediction by combining SVM and HMM. IEEE Trans. Intell. Transp. Syst. 2017, 19, 699–710. [Google Scholar] [CrossRef]
- Ozbayoglu, M.; Kucukayan, G.; Dogdu, E. A real-time autonomous highway accident detection model based on big data processing and computational intelligence. In Proceedings of the 2016 IEEE International Conference on Big Data (Big Data), Washington, DC, USA, 5–8 December 2016; pp. 1807–1813. [Google Scholar]
- Liu, X.; Lan, Y.; Zhou, Y.; Shen, C.; Guan, X. A real-time explainable traffic collision inference framework based on probabilistic graph theory. Knowl.-Based Syst. 2021, 212, 106442. [Google Scholar] [CrossRef]
- Effati, M.; Sadeghi-Niaraki, A. A semantic-based classification and regression tree approach for modelling complex spatial rules in motor vehicle crashes domain. Wiley Interdiscip. Rev. Data Min. Knowl. Discov. 2015, 5, 181–194. [Google Scholar] [CrossRef]
- Bao, J.; Liu, P.; Ukkusuri, S.V. A spatiotemporal deep learning approach for citywide short-term crash risk prediction with multi-source data. Accid. Anal. Prev. 2019, 122, 239–254. [Google Scholar] [CrossRef]
- Moosavi, S.; Samavatian, M.H.; Parthasarathy, S.; Teodorescu, R.; Ramnath, R. Accident risk prediction based on heterogeneous sparse data: New dataset and insights. In Proceedings of the 27th ACM SIGSPATIAL International Conference on Advances in Geographic Information Systems, Chicago, IL, USA, 5–8 November 2019; pp. 33–42. [Google Scholar]
- Yan, Y.; Zhang, Y.; Yang, X.; Hu, J.; Tang, J.; Guo, Z. Crash prediction based on random effect negative binomial model considering data heterogeneity. Phys. A Stat. Mech. Its Appl. 2020, 547, 123858. [Google Scholar] [CrossRef]
- Huang, C.; Zhang, C.; Dai, P.; Bo, L. Deep dynamic fusion network for traffic accident forecasting. In Proceedings of the 28th ACM International Conference on Information and Knowledge Management, Beijing, China, 3–7 November 2019; pp. 2673–2681. [Google Scholar]
- Parra, C.; Ponce, C.; Rodrigo, S.F. Evaluating the Performance of Explainable Machine Learning Models in Traffic Accidents Prediction in California. In Proceedings of the 2020 39th International Conference of the Chilean Computer Science Society (SCCC), Coquimbo, Chile, 16–20 November 2020; pp. 1–8. [Google Scholar]
- Yuan, Z.; Zhou, X.; Yang, T. Hetero-convlstm: A deep learning approach to traffic accident prediction on heterogeneous spatio-temporal data. In Proceedings of the 24th ACM SIGKDD International Conference on Knowledge Discovery & Data Mining, London, UK, 19–23 August 2018; pp. 984–992. [Google Scholar]
- Huang, T.; Wang, S.; Sharma, A. Highway crash detection and risk estimation using deep learning. Accid. Anal. Prev. 2020, 135, 105392. [Google Scholar] [CrossRef]
- Park, S.h.; Kim, S.m.; Ha, Y.g. Highway traffic accident prediction using VDS big data analysis. J. Supercomput. 2016, 72, 2815–2831. [Google Scholar] [CrossRef]
- Chen, Q.; Song, X.; Yamada, H.; Shibasaki, R. Learning deep representation from big and heterogeneous data for traffic accident inference. In Proceedings of the AAAI Conference on Artificial Intelligence, Phoenix, AZ, USA, 12–17 February 2016; Volume 30. [Google Scholar]
- Golovnin, O.; Sidorova, E. Operational Forecasting of Road Traffic Accidents via Neural Network Analysis of Big Data. CEUR Workshop Proc. 2020, 2667, 23–26. [Google Scholar]
- Wang, L.; Shi, Q.; Abdel-Aty, M. Predicting crashes on expressway ramps with real-time traffic and weather data. Transp. Res. Rec. 2015, 2514, 32–38. [Google Scholar] [CrossRef]
- Yuan, Z.; Zhou, X.; Yang, T.; Tamerius, J.; Mantilla, R. Predicting traffic accidents through heterogeneous urban data: A case study. In Proceedings of the 6th international workshop on urban computing (UrbComp 2017), Halifax, NS, Canada, 13–17 August 2017; Volume 14, p. 10. [Google Scholar]
- Effati, M.; Rajabi, M.A.; Hakimpour, F.; Shabani, S. Prediction of crash severity on two-lane, two-way roads based on fuzzy classification and regression tree using geospatial analysis. J. Comput. Civ. Eng. 2015, 29, 04014099. [Google Scholar] [CrossRef]
- Zhang, Y.; Wang, H.; Zhang, D.; Lu, Y.; Wang, D. Riskcast: Social sensing based traffic risk forecasting via inductive multi-view learning. In Proceedings of the 2019 IEEE/ACM International Conference on Advances in Social Networks Analysis and Mining (ASONAM), Vancouver, BC, Canada, 27–30 August 2019; pp. 154–157. [Google Scholar]
- Chen, C.; Fan, X.; Zheng, C.; Xiao, L. Sdcae: Stack denoising convolutional autoencoder model for accident risk prediction via traffic big data. In Proceedings of the 2018 Sixth International Conference on Advanced Cloud and Big Data (CBD), Lanzhou, China, 12–15 August 2018; pp. 328–333. [Google Scholar]
- Zhou, Z.; Chen, L.; Zhu, C.; Wang, P. Stack ResNet For Short-term Accident Risk Prediction Leveraging Cross-domain Data. In Proceedings of the 2019 Chinese Automation Congress (CAC), Hangzhou, China, 22–24 November 2019; pp. 782–787. [Google Scholar]
- Dong, N.; Huang, H.; Zheng, L. Support vector machine in crash prediction at the level of traffic analysis zones: Assessing the spatial proximity effects. Accid. Anal. Prev. 2015, 82, 192–198. [Google Scholar] [CrossRef]
- Zhu, L.; Li, T.; Du, S. TA-STAN: A deep spatial-temporal attention learning framework for regional traffic accident risk prediction. In Proceedings of the 2019 International Joint Conference on Neural Networks (IJCNN), Budapest, Hungary, 14–19 July 2019; pp. 1–8. [Google Scholar]
- Yu, L.; Du, B.; Hu, X.; Sun, L.; Lv, W.; Huang, R. Traffic Accident Prediction Based on Deep Spatio-Temporal Analysis. In Proceedings of the 2019 IEEE SmartWorld, Ubiquitous Intelligence & Computing, Advanced & Trusted Computing, Scalable Computing & Communications, Cloud & Big Data Computing, Internet of People and Smart City Innovation (SmartWorld/SCALCOM/UIC/ATC/CBDCom/IOP/SCI), Leicester, UK, 19–23 August 2019; pp. 995–1002. [Google Scholar]
- Sharma, B.; Katiyar, V.K.; Kumar, K. Traffic accident prediction model using support vector machines with Gaussian kernel. In Proceedings of the Fifth International Conference on Soft Computing for Problem Solving, Saharanpur, Uttar Pradesh, India, 18–25 December 2015; pp. 1–10. [Google Scholar]
- Al Mamlook, R.E.; Abdulhameed, T.Z.; Hasan, R.; Al-Shaikhli, H.I.; Mohammed, I.; Tabatabai, S. Utilizing Machine Learning Models to Predict the Car Crash Injury Severity among Elderly Drivers. In Proceedings of the 2020 IEEE International Conference on Electro Information Technology (EIT), Chicago, IL, USA, 31 July–1 August 2020; pp. 105–111. [Google Scholar]
- Data Science Dojo. 101 Machine Learning Algorithms for Data Science with Cheat Sheets. Available online: https://online.datasciencedojo.com/blogs/101-machine-learning-algorithms-for-data-science-with-cheat-sheets (accessed on 24 November 2021).
- Bhowan, U.; Zhang, M.; Johnston, M. Genetic programming for classification with unbalanced data. In European Conference on Genetic Programming; Springer: Berlin/Heidelberg, Germany, 2010; pp. 1–13. [Google Scholar]
- Touahmia, M. Identification of risk factors influencing road traffic accidents. Eng. Technol. Appl. Sci. Res. 2018, 8, 2417–2421. [Google Scholar] [CrossRef]
- Gebru, M.K. Road traffic accident: Human security perspective. Int. J. Peace Dev. Stud. 2017, 8, 15–24. [Google Scholar]
- Bucsuházy, K.; Matuchová, E.; Zúvala, R.; Moravcová, P.; Kostíková, M.; Mikulec, R. Human factors contributing to the road traffic accident occurrence. Transp. Res. Procedia 2020, 45, 555–561. [Google Scholar] [CrossRef]
- Li, X.; Lord, D.; Zhang, Y.; Xie, Y. Predicting motor vehicle crashes using support vector machine models. Accid. Anal. Prev. 2008, 40, 1611–1618. [Google Scholar] [CrossRef]
- Joseph, V.R.; Vakayil, A. SPlit: An Optimal Method for Data Splitting. arXiv 2021, arXiv:2012.10945. [Google Scholar] [CrossRef]
- Caliendo, C.; Guida, M.; Parisi, A. A crash-prediction model for multilane roads. Accid. Anal. Prev. 2007, 39, 657–670. [Google Scholar] [CrossRef]
- Chen, C.; Xiang, H.; Qiu, T.; Wang, C.; Zhou, Y.; Chang, V. A rear-end collision prediction scheme based on deep learning in the Internet of Vehicles. J. Parallel Distrib. Comput. 2018, 117, 192–204. [Google Scholar] [CrossRef]
- Wang, Z.; Wan, Q.; Qin, Y.; Fan, S.; Xiao, Z. Intelligent algorithm in a smart wearable device for predicting and alerting in the danger of vehicle collision. J. Ambient Intell. Humaniz. Comput. 2020, 11, 3841–3852. [Google Scholar] [CrossRef]
- Oh, J.S.; Oh, C.; Ritchie, S.G.; Chang, M. Real-time estimation of accident likelihood for safety enhancement. J. Transp. Eng. 2005, 131, 358–363. [Google Scholar] [CrossRef]
- Ihueze, C.C.; Onwurah, U.O. Road traffic accidents prediction modelling: An analysis of Anambra State, Nigeria. Accid. Anal. Prev. 2018, 112, 21–29. [Google Scholar] [CrossRef] [PubMed]
- Chantamit-o pas, P.; Pongpum, W.; Kongsaksri, K. Road Traffic Injury Prevention Using DBSCAN Algorithm. In Proceedings of the International Conference on Neural Information Processing, Bangkok, Thailand, 18–22 November 2020; pp. 180–187. [Google Scholar]
- Hu, W.; Xiao, X.; Xie, D.; Tan, T.; Maybank, S. Traffic accident prediction using 3-D model-based vehicle tracking. IEEE Trans. Veh. Technol. 2004, 53, 677–694. [Google Scholar] [CrossRef]
- Metropolitan Expressway Company Limited. Metropolitan Expressway Company Limited. Available online: https://www.shutoko.co.jp/en/index/ (accessed on 24 November 2021).
- California Department of Transportation. Highway Performance Monitoring System (HPMS) Data. Available online: https://dot.ca.gov/programs/research-innovation-system-information/highway-performance-monitoring-system (accessed on 24 November 2021).
- Statewide Integrated Traffic Records System. Statewide Integrated Traffic Records System. Available online: https://www.chp.ca.gov/programs-services/services-information/switrs-internet-statewide-integrated-traffic-records-system (accessed on 24 November 2021).
- US Department of Transportation. Highway Performance Monitoring System. Available online: https://www.fhwa.dot.gov/policyinformation/hpms.cfm (accessed on 24 November 2021).
- TASS International. Prescan. Available online: https://tass.plm.automation.siemens.com/prescan-overview (accessed on 24 November 2021).
- Virginia Government. Virginia Department of Transportation. Available online: https://www.virginiadot.org/ (accessed on 24 November 2021).
- Istanbul Municipal Traffic Control Development. Intelligent Transportation System. Available online: https://www.isbak.istanbul/en/intelligent-transportation-systems/traffic-management-systems/ (accessed on 24 November 2021).
- Twitter. Twitter API. Available online: https://developer.twitter.com/en/products/twitter-api (accessed on 24 November 2021).
- City of New York. New York City Open Data. Available online: https://opendata.cityofnewyork.us/ (accessed on 24 November 2021).
- Government of Iran. Iran National Cartographic Center. Available online: https://www.ncc.gov.ir/en/ (accessed on 24 November 2021).
- Government of Iran. Ministry of Roads and Urban Development Islamic Republic of Iran. Available online: https://www.mrud.ir/en (accessed on 24 November 2021).
- Ministry of Roads and Urban Development. Iran Meteorological Organization. Available online: https://www.irimo.ir/index.php (accessed on 24 November 2021).
- Government of Iran. Iranian Police. Available online: https://www.police.ir (accessed on 24 November 2021).
- New York City Government. New York City and Limousine Commission (Trip Data). Available online: https://www1.nyc.gov/site/tlc/index.page (accessed on 24 November 2021).
- New York City Government. New York City Department of Transportation. Available online: https://www1.nyc.gov/html/dot/html/home/home.shtml (accessed on 24 November 2021).
- The United States Government. United States Census Bureau. Available online: https://www.census.gov/ (accessed on 24 November 2021).
- New York City Department of City Planning. New York City Department of City Planning. Available online: https://www1.nyc.gov/site/planning/index.page (accessed on 24 November 2021).
- National Oceanic and Atmospheric Administration. National Centers for Environmental Information. Available online: https://www.ncei.noaa.gov/ (accessed on 24 November 2021).
- Sobhan Moosavi. US-Accidents. Available online: https://smoosavi.org/datasets/us_accidents (accessed on 24 November 2021).
- AOL. MapQuest. Available online: https://www.mapquest.com/ (accessed on 24 November 2021).
- Microsoft. Bing Maps. Available online: https://www.bing.com/maps (accessed on 24 November 2021).
- State of Washington Government. Washington State Department of Transportation. Available online: https://wsdot.wa.gov/ (accessed on 24 November 2021).
- U.S. Department of Transportation. Highway Safety Information System. Available online: https://www.hsisinfo.org/ (accessed on 24 November 2021).
- Washington State Department of Transportation. Digital Roadway Interactive Visualization and Evaluation Network. Available online: https://wsdot.wa.gov/research/reports/800/digital-roadway-interactive-visualization-and-evaluation-network-applications (accessed on 24 November 2021).
- Paramics Microsimulation SYSTRA Ltd. Paramics Microsimulation. Available online: https://www.paramics.co.uk/en/ (accessed on 24 November 2021).
- AIMSUN. AIMSUN Next. Available online: https://www.aimsun.com/ (accessed on 24 November 2021).
- PTV Group. VISSIM. Available online: https://www.ptvgroup.com/en/solutions/products/ptv-vissim/ (accessed on 24 November 2021).
- New York City Government. New York City’s Governmental Platform. Available online: https://www1.nyc.gov/ (accessed on 24 November 2021).
- Sobhan Moosavi. US Accidents, A Countrywide Traffic Accident Dataset. Available online: https://www.kaggle.com/sobhanmoosavi/us-accidents (accessed on 24 November 2021).
- The Weather Channel. The Weather Channel. Available online: https://weather.com/ (accessed on 24 November 2021).
- Iowa Government. Iowa Department of Transportation. Available online: http://iowadot.gov/ (accessed on 24 November 2021).
- Iowa State University. Iowa Environmental Mesonet. Available online: https://mesonet.agron.iastate.edu/request/rwis/traffic.phtml (accessed on 24 November 2021).
- Iowa State University. Iowa Dot Gis. Available online: https://gis.iowadot.gov/public/rest/services/RAMS (accessed on 24 November 2021).
- Google LLC. Google Earth. Available online: https://earth.google.com/web/ (accessed on 24 November 2021).
- Korea Expressway Corporation. Korea Expressway Corporation. Available online: http://www.ex.co.kr/ (accessed on 24 November 2021).
- Korean National Policy Agency. Korean National Policy Agency. Available online: https://www.police.go.kr/eng/main.do (accessed on 24 November 2021).
- Department of Urban and Regional Planning. Signal Four Analytics. Available online: https://s4.geoplan.ufl.edu/ (accessed on 24 November 2021).
- Central Florida Expressway Authority. Central Florida Expressway Authority. Available online: https://www.cfxway.com/ (accessed on 24 November 2021).
- University Corporation for Atmospheric Research. NCEP/EMC 4KM Gridded Data (GRIB) Stage IV Data. Available online: https://data.eol.ucar.edu/dataset/21.093 (accessed on 24 November 2021).
- Government of Iran. National Geographical Organization of Iran. Available online: https://www.ngo-iran.ir (accessed on 24 November 2021).
- Vías Chile. Autopista Central. Available online: https://www.autopistacentral.cl/ (accessed on 24 November 2021).
- University of Chile. Department of Geophysics. Available online: http://ingenieria.uchile.cl/english-version/departments/97225/geophysics (accessed on 24 November 2021).
- City of New York. New York City Open Data (Motor Vehicle Collisions). Available online: https://data.cityofnewyork.us/Public-Safety/Motor-Vehicle-Collisions-Crashes/h9gi-nx95 (accessed on 24 November 2021).
- Florida Department of Transportation. Crash Data Systems and Mapping. Available online: https://www.fdot.gov/safety/safetyengineering/crash-data-systems-and-mapping (accessed on 24 November 2021).
- The Weather Company (IBM). Weather Underground. Available online: https://www.wunderground.com/ (accessed on 24 November 2021).
- Office of Highway Safety Planning. Michigan Traffic Crash Facts Dataset. Available online: https://www.michigantrafficcrashfacts.org/ (accessed on 24 November 2021).


| Database Search Engine | ID | Command Search | Search Date | Total |
|---|---|---|---|---|
| Scopus | SS01 | ALL(real-time AND “traffic accident*” AND (predicti* OR forecast*) AND learning AND heterogeneous AND “data source*”) | 48 | |
| SS02 | ALL(“traffic accident*” AND (predicti* OR forecast*) AND learning AND heterogeneous AND “data source*”) | 1 April 2021 | 61 | |
| SS03 | ALL(“traffic accident*” AND (predicti* OR forecast*) AND learning AND “data source*”) | 154 | ||
| 263 | ||||
| ACM | SS01 | [All:real-time] AND [All:“traffic accident*”] AND [[All:predicti*] OR [All:forecast*]] AND [All:learning] AND [All:heterogeneous] AND [All:“data source*”] | 10 | |
| SS02 | [All: “traffic accident*”] AND [[All:predicti*] OR [All:forecast*]] AND [All:learning] AND [All:heterogeneous] AND [All: “data source*”] | 1 April 2021 | 10 | |
| SS03 | [All: “traffic accident*”] AND [[All:predicti*] OR [All:forecast*]] AND [All:learning] AND [All:"data source*"] | 13 | ||
| 33 | ||||
| IEEExplore | SS01 | “Full Text & Metadata”:real-time AND “Full Text & Metadata”:“traffic accident*” AND (“Full Text & Metadata”:predicti* OR “Full Text & Metadata”:forecast*) AND “Full Text & Metadata”:learning AND “Full Text & Metadata”:heterogeneous AND “Full Text & Metadata”:“data source*” | 122 | |
| SS02 | “Full Text & Metadata”:“traffic accident*” AND (“Full Text & Metadata”:predicti* OR “Full Text & Metadata”:forecast*) AND “Full Text & Metadata”:learning AND “Full Text & Metadata”:heterogeneous AND “Full Text & Metadata”:“data source*” | 1 April 2021 | 136 | |
| SS03 | “Full Text & Metadata”:“traffic accident*” AND (“Full Text & Metadata”:predicti* OR “Full Text & Metadata”:forecast*) AND “Full Text & Metadata”:learning AND “Full Text & Metadata”:“data source*” | 360 | ||
| 618 | ||||
| Springer | SS01 | real-time AND “traffic accident*” AND (predicti* OR forecast*) AND learning AND heterogeneous AND “data source*” | 115 | |
| SS02 | “traffic accident*” AND (predicti* OR forecast*) AND learning AND heterogeneous AND “data source*” | 1 April 2021 | 145 | |
| SS03 | “traffic accident*” AND (predicti* OR forecast*) AND learning AND “data source*” | 352 | ||
| 612 | ||||
| Scholar | SS01 | real-time AND “traffic accident*” AND (predicti* OR forecast*) AND learning AND heterogeneous AND “data source*” | 1 April 2021 | 397 |
| 397 |
| ID | Authors | Title | Year | Type |
|---|---|---|---|---|
| PS01 | Hossain et al. [4] | A Bayesian network based framework for real-time crash prediction on the basic freeway segments of urban expressways | 2012 | Journal |
| PS02 | Wu et al. [19] | A Bayesian network model for real-time crash prediction based on selected variables by random forest | 2019 | Conference |
| PS03 | Ren et al. [20] | A Deep Learning Approach to the Citywide Traffic Accident Risk Prediction | 2018 | Conference |
| PS04 | Xu et al. [7] | A genetic programming model for real-time crash prediction on freeways | 2013 | Journal |
| PS05 | Wenqi et al. [21] | A model of traffic accident prediction based on convolutional neural network | 2017 | Conference |
| PS06 | Xiong et al. [22] | A New Framework of Vehicle Collision Prediction by Combining SVM and HMM | 2018 | Journal |
| PS07 | Lin et al. [9] | A novel variable selection method based on frequent pattern tree for real-time traffic accident risk prediction | 2015 | Journal |
| PS08 | Ozbayoglu et al. [23] | A real-time autonomous highway accident detection model based on big data processing and computational intelligence | 2016 | Conference |
| PS09 | Liu et al. [24] | A real-time explainable traffic collision inference framework based on probabilistic graph theory | 2021 | Journal |
| PS10 | Effati et al. [25] | A semantic-based classification and regression tree approach for modelling complex spatial rules in motor vehicle crashes domain | 2015 | Journal |
| PS11 | Bao et al. [26] | A spatiotemporal deep learning approach for citywide short-term crash risk prediction with multi-source data | 2019 | Journal |
| PS12 | Moosavi et al. [27] | Accident risk prediction based on heterogeneous sparse data: New dataset and insights | 2019 | Conference |
| PS13 | Yan et al. [28] | Crash prediction based on random effect negative binomial model considering data heterogeneity | 2020 | Journal |
| PS14 | Paikari et al. [5] | Data integration and clustering for real time crash prediction | 2014 | Conference |
| PS15 | Huang et al. [29] | Deep dynamic fusion network for traffic accident forecasting | 2019 | Conference |
| PS16 | Parra et al. [30] | Evaluating the Performance of Explainable Machine Learning Models in Traffic Accidents Prediction in California | 2020 | Conference |
| PS17 | Yuan et al. [31] | Hetero-ConvLSTM: A deep learning approach to traffic accident prediction on heterogeneous spatio-temporal data | 2018 | Conference |
| PS18 | Huang et al. [32] | Highway crash detection and risk estimation using deep learning | 2018 | Journal |
| PS19 | Park et al. [33] | Highway traffic accident prediction using VDS big data analysis | 2016 | Journal |
| PS20 | Chen et al. [34] | Learning deep representation from big and heterogeneous data for traffic accident inference | 2016 | Conference |
| PS21 | Golovnin et al. [35] | Operational forecasting of road traffic accidents via neural network analysis of big data | 2020 | Journal |
| PS22 | Wang et al. [36] | Predicting Crashes on Expressway Ramps with Real-Time Traffic and Weather Data | 2015 | Journal |
| PS23 | Yuan et al. [37] | Predicting traffic accidents through heterogeneous urban data: A case study | 2017 | Conference |
| PS24 | Effati et al. [38] | Prediction of Crash Severity on Two-Lane, Two-Way Roads Based on Fuzzy Classification and Regression Tree Using Geospatial Analysis | 2015 | Journal |
| PS25 | Wang et al. [8] | Real-time crash prediction for expressway weaving segments | 2015 | Journal |
| PS26 | Basso et al. [6] | Real-time crash prediction in an urban expressway using disaggregated data | 2018 | Journal |
| PS27 | Zhang et al. [39] | RiskCast: Social sensing based traffic risk forecasting via inductive multi-view learning | 2019 | Conference |
| PS28 | Chen et al. [40] | SDCAE: Stack Denoising Convolutional Autoencoder Model for Accident Risk Prediction Via Traffic Big Data | 2018 | Conference |
| PS29 | Zhou et al. [41] | Stack ResNet for Short-term Accident Risk Prediction Leveraging Cross-domain Data | 2019 | Conference |
| PS30 | Dong et al. [42] | Support vector machine in crash prediction at the level of traffic analysis zones: Assessing the spatial proximity effects | 2015 | Journal |
| PS31 | Zhu et al. [43] | TA-STAN: A Deep Spatial-Temporal Attention Learning Framework for Regional Traffic Accident Risk Prediction | 2019 | Conference |
| PS32 | Yu et al. [44] | Traffic accident prediction based on deep spatio-temporal analysis | 2019 | Conference |
| PS33 | Sharma et al. [45] | Traffic accident prediction model using support vector machines with Gaussian kernel | 2016 | Conference |
| PS34 | Al Mamlook et al. [46] | Utilizing Machine Learning Models to Predict the Car Crash Injury Severity among Elderly Drivers | 2020 | Conference |
| ID | Algorithms | ||
|---|---|---|---|
| Algorithms/Probability Models | Ranking/Variables Selection | Categories | |
| PS01 | Bayesian Belief Net | Random Multinomial Logit | Classification |
| PS02 | Bayesian Network | Random Forest | Classification/Ensemble |
| PS03 | Long Short-Term Memory Neural Network | Neural Networks | |
| PS04 | Genetic Programming | Random Forest | Evolutionary Computation/ Ensemble |
| PS05 | Convolutional Neural Network | Neural Networks | |
| PS06 | Support Vector Machine | Classification | |
| PS07 | Bayesian Network | Frequent Pattern Tree/Random Forest | Classification |
| PS08 | K-Nearest Neighbor/Regression Tree/Feed Forward Neural Network | Classification/Ensemble/ Neural Networks | |
| PS09 | Bayesian Network | Classification | |
| PS10 | Ontology-based Classification and Regression Tree | Classification/Regression | |
| PS11 | Convolutional Long Short-Term Memory Neural Network | Neural Networks | |
| PS12 | Deep Neural Network | Neural Networks | |
| PS13 | Negative Binomial/Random Negative Binomial | Probability Distributions | |
| PS14 | Bayesian Network | Classification | |
| PS15 | Multilayer Perceptron | Neural Networks | |
| PS16 | Gradient Boosting | Ensemble | |
| PS17 | Convolutional Long Short-Term Memory | Neural Networks | |
| PS18 | Convolutional Neural Network | Neural Networks | |
| PS19 | K-Means/Logistic Regression | Clustering/Classification | |
| PS20 | Stack Denoise Autoencoder | Neural Networks | |
| PS21 | Rumelhart Multilayer Perceptron | Neural Networks | |
| PS22 | Bayesian Logistic Regression | Random Forest | Classification/Ensemble |
| PS24 | Fuzzy Classification and Regression Tree | Classification/Regression | |
| PS25 | Bayesian Logistic Regression | Random Forest | Classification/Ensemble |
| PS26 | Support Vector Machine/Logistic Regression | Random Forest | Classification |
| PS27 | Multi-view Learning | Not available | |
| PS28 | Stack Denoise Convolutional Autoencoder | Neural Networks | |
| PS29 | Convolutional Neural Network | Neural Networks | |
| PS30 | Support Vector Machine with radial-basis function | Classification | |
| PS31 | Deep Learning | Neural Networks | |
| PS32 | Long Short-Term Memory Neural Network and Fully Connected Network | Neural Networks | |
| PS33 | Support Vector Machine with Gaussian kernel | Classification | |
| PS34 | Light Gradient Boosting Machine | Ensemble | |
| ID | Evaluation Metrics | AUC | Percentage of Data | Compared with | |||||||||
|---|---|---|---|---|---|---|---|---|---|---|---|---|---|
| MAE | MRE | RMSE | MSE | PAR % | FPR % | TPR % | F1 | Train. % | Valid. % | Test. % | |||
| PS01 | 66.00 | 20.00 | Not available | ||||||||||
| PS02 | 16.07 | 70.46 | K-Nearest Neighbor, Support Vector Machine, and Logistic Regression | ||||||||||
| PS03 | 0.014 | 0.034 | 0.001 | LASSO and Ridge Regression, Support Vector Regression, Decision Tree Regression, Random Forest Regression, Multilayer Perceptron, and Autoregressive Moving Average | |||||||||
| PS04 | 75.40 | Binary Logistic Regression | |||||||||||
| PS05 | 78.50 | 60.0 | 40.0 | Backpropagation Network | |||||||||
| PS06 | 96.70 | 75.0 | 25.0 | Not available | |||||||||
| PS07 | 38.16 | 61.11 | 80.0 | 20.0 | K-Nearest Neighbor | ||||||||
| PS08 | 99.79 | 42.86 | K-Nearest Neighbor/Regression Tree | ||||||||||
| PS09 | 0.887 | 0.813 | var. | var. | Artificial Neural Network, Bayesian Regression, and Naive Bayes | ||||||||
| PS10 | 0.267 | 0.818 | 0.803 | 0.807 | 70.0 | 30.0 | Not available | ||||||
| PS11 | 0.023 | 0.019 | 81.58 | 0.34 | Convolutional Neural Network, Long Short-Term Memory Neural Network, Artificial Neural Network, and Gradient Boosting Regression Tree | ||||||||
| PS12 | 0.590 | 83.0 | 17.0 | Logistic Regression and Gradient Boosting | |||||||||
| PS13 | 2.520 | 0.290 | Negative Binomial | ||||||||||
| PS14 | 76.0 | Not available | |||||||||||
| PS15 | 0.681 | 0.786 | Support Vector Regression, Logistic Regression, Deep Neural Network, Long-Short Term Memory, and Recurrent Neural Network | ||||||||||
| PS16 | 78.00 | 73.00 | 0.740 | 70.0 | 30.0 | Decision Tree and Random Forest | |||||||
| PS17 | 0.116 | 0.013 | 79.0 | 9.0 | 12.0 | Least Squares Linear Regression, Decision Tree Regression, Deep Neural Network, Fully Connected Long Short-Term Memory, and Convolutional Long Short-Term Memory | |||||||
| PS18 | 77.34 | 0.765 | 80.0 | 20.0 | Convolutional Neural Network | ||||||||
| PS19 | 76.35 | 40.83 | 75.0 | Logistic Regression and Support Vector Machine | |||||||||
| PS20 | 0.96 | 0.39 | 1.0 | 80.0 | 20.0 | Decision Tree, Logistic Regression, and Support Vector Machine | |||||||
| PS21 | 0.90 | Not available | |||||||||||
| PS22 | 90.49 | 90.40 | 0.971 | 70.0 | 30.0 | Not available | |||||||
| PS23 | 95.12 | 0.868 | 0.898 | 0.961 | var. | var. | Support Vector Machine, Decision Tree, and Random Forest | ||||||
| PS24 | 79.12 | 0.68 | Classification and Regression Tree and Support Vector Machine | ||||||||||
| PS25 | 69.80 | 67.60 | 70.0 | 30.0 | Not available | ||||||||
| PS26 | 75.03 | 80.0 | 20.0 | Support Vector Machine | |||||||||
| PS27 | 1.569 | Linear Regression /Ridge Regression/Multilayer Perceptron | |||||||||||
| PS28 | 0.092 | 0.796 | 80.0 | 20.0 | Logistic Regression, Random Forest, Decision Tree, Linear Regression, and Stack Denoise Autoencoder | ||||||||
| PS29 | 0.40 | 0.16 | 88.89 | 87.0 | 13.0 | Auto-Regressive Integrated Moving Average, and Convolutional Long Short-Term Memory Neural Network | |||||||
| PS30 | 81.3 | 80.0 | 20.0 | Support Vector Machine with linear | |||||||||
| PS31 | 0.0082 | 0.0131 | 0.0001 | 67.0 | 11.0 | 22.0 | Linear Regression, Long Short-Term Memory Neural Network, Denoising Auto-Encoder, XGBoost, and Seq2Seq | ||||||
| PS32 | 0.444 | 0.723 | 0.773 | 0.736 | 70.0 | 10.0 | 20.0 | Logistic Regression, Least Absolute Shrinkage and Selection Operator, Support Vector Machine, and Decision Tree | |||||
| PS33 | 94.0 | 70.0 | 20.0 | 10.0 | Multilayer Perceptron and Support Vector Machine with poly kernel | ||||||||
| PS34 | 87.54 | 0.814 | 0.837 | 80.0 | 20.0 | Logistic Regression, Decision Tree, Random Forest, and Naive Bayesian | |||||||
Publisher’s Note: MDPI stays neutral with regard to jurisdictional claims in published maps and institutional affiliations. |
© 2022 by the authors. Licensee MDPI, Basel, Switzerland. This article is an open access article distributed under the terms and conditions of the Creative Commons Attribution (CC BY) license (https://creativecommons.org/licenses/by/4.0/).
Share and Cite
Marcillo, P.; Valdivieso Caraguay, Á.L.; Hernández-Álvarez, M. A Systematic Literature Review of Learning-Based Traffic Accident Prediction Models Based on Heterogeneous Sources. Appl. Sci. 2022, 12, 4529. https://doi.org/10.3390/app12094529
Marcillo P, Valdivieso Caraguay ÁL, Hernández-Álvarez M. A Systematic Literature Review of Learning-Based Traffic Accident Prediction Models Based on Heterogeneous Sources. Applied Sciences. 2022; 12(9):4529. https://doi.org/10.3390/app12094529
Chicago/Turabian StyleMarcillo, Pablo, Ángel Leonardo Valdivieso Caraguay, and Myriam Hernández-Álvarez. 2022. "A Systematic Literature Review of Learning-Based Traffic Accident Prediction Models Based on Heterogeneous Sources" Applied Sciences 12, no. 9: 4529. https://doi.org/10.3390/app12094529