
Typhoon-Induced Failure Process and Collapse Mechanism of Super-Large Cooling Tower Based on WRF-CFD-LS/DYNA Nesting Technology


Abstract
:1. Introduction
2. Project Overview
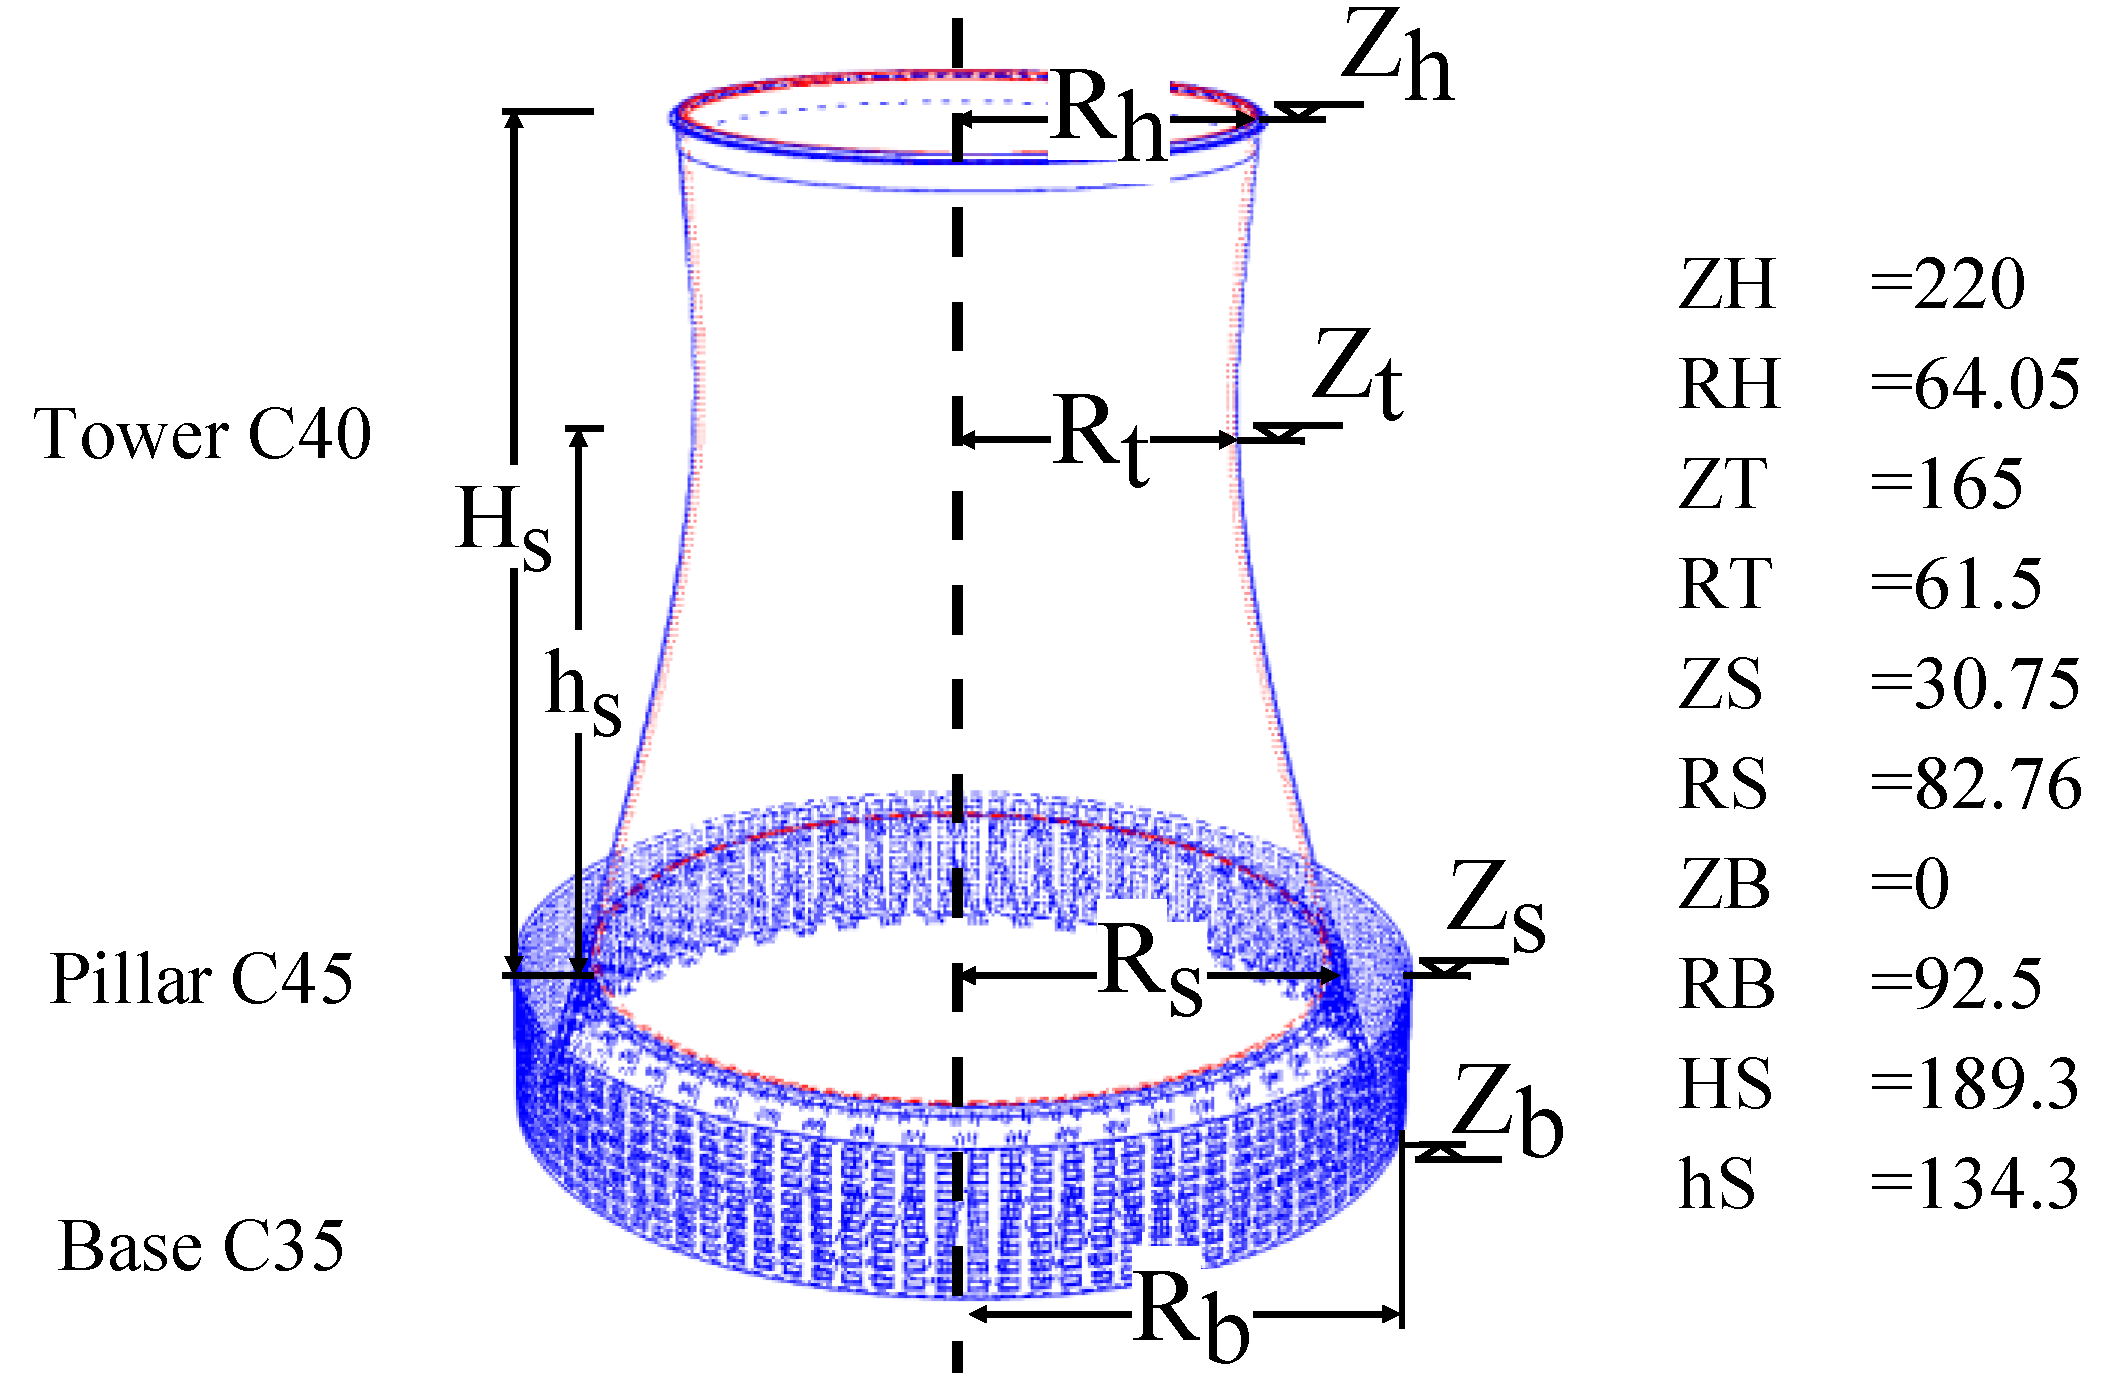
2.1. Structure
2.2. Typhoon
3. WRF-CFD Wind Field Downscaling Technology
3.1. Simulation of Typhoon Field by WRF Model
3.1.1. WRF Mode Introduction
3.1.2. Physical Scheme Selection and Parameter Settings
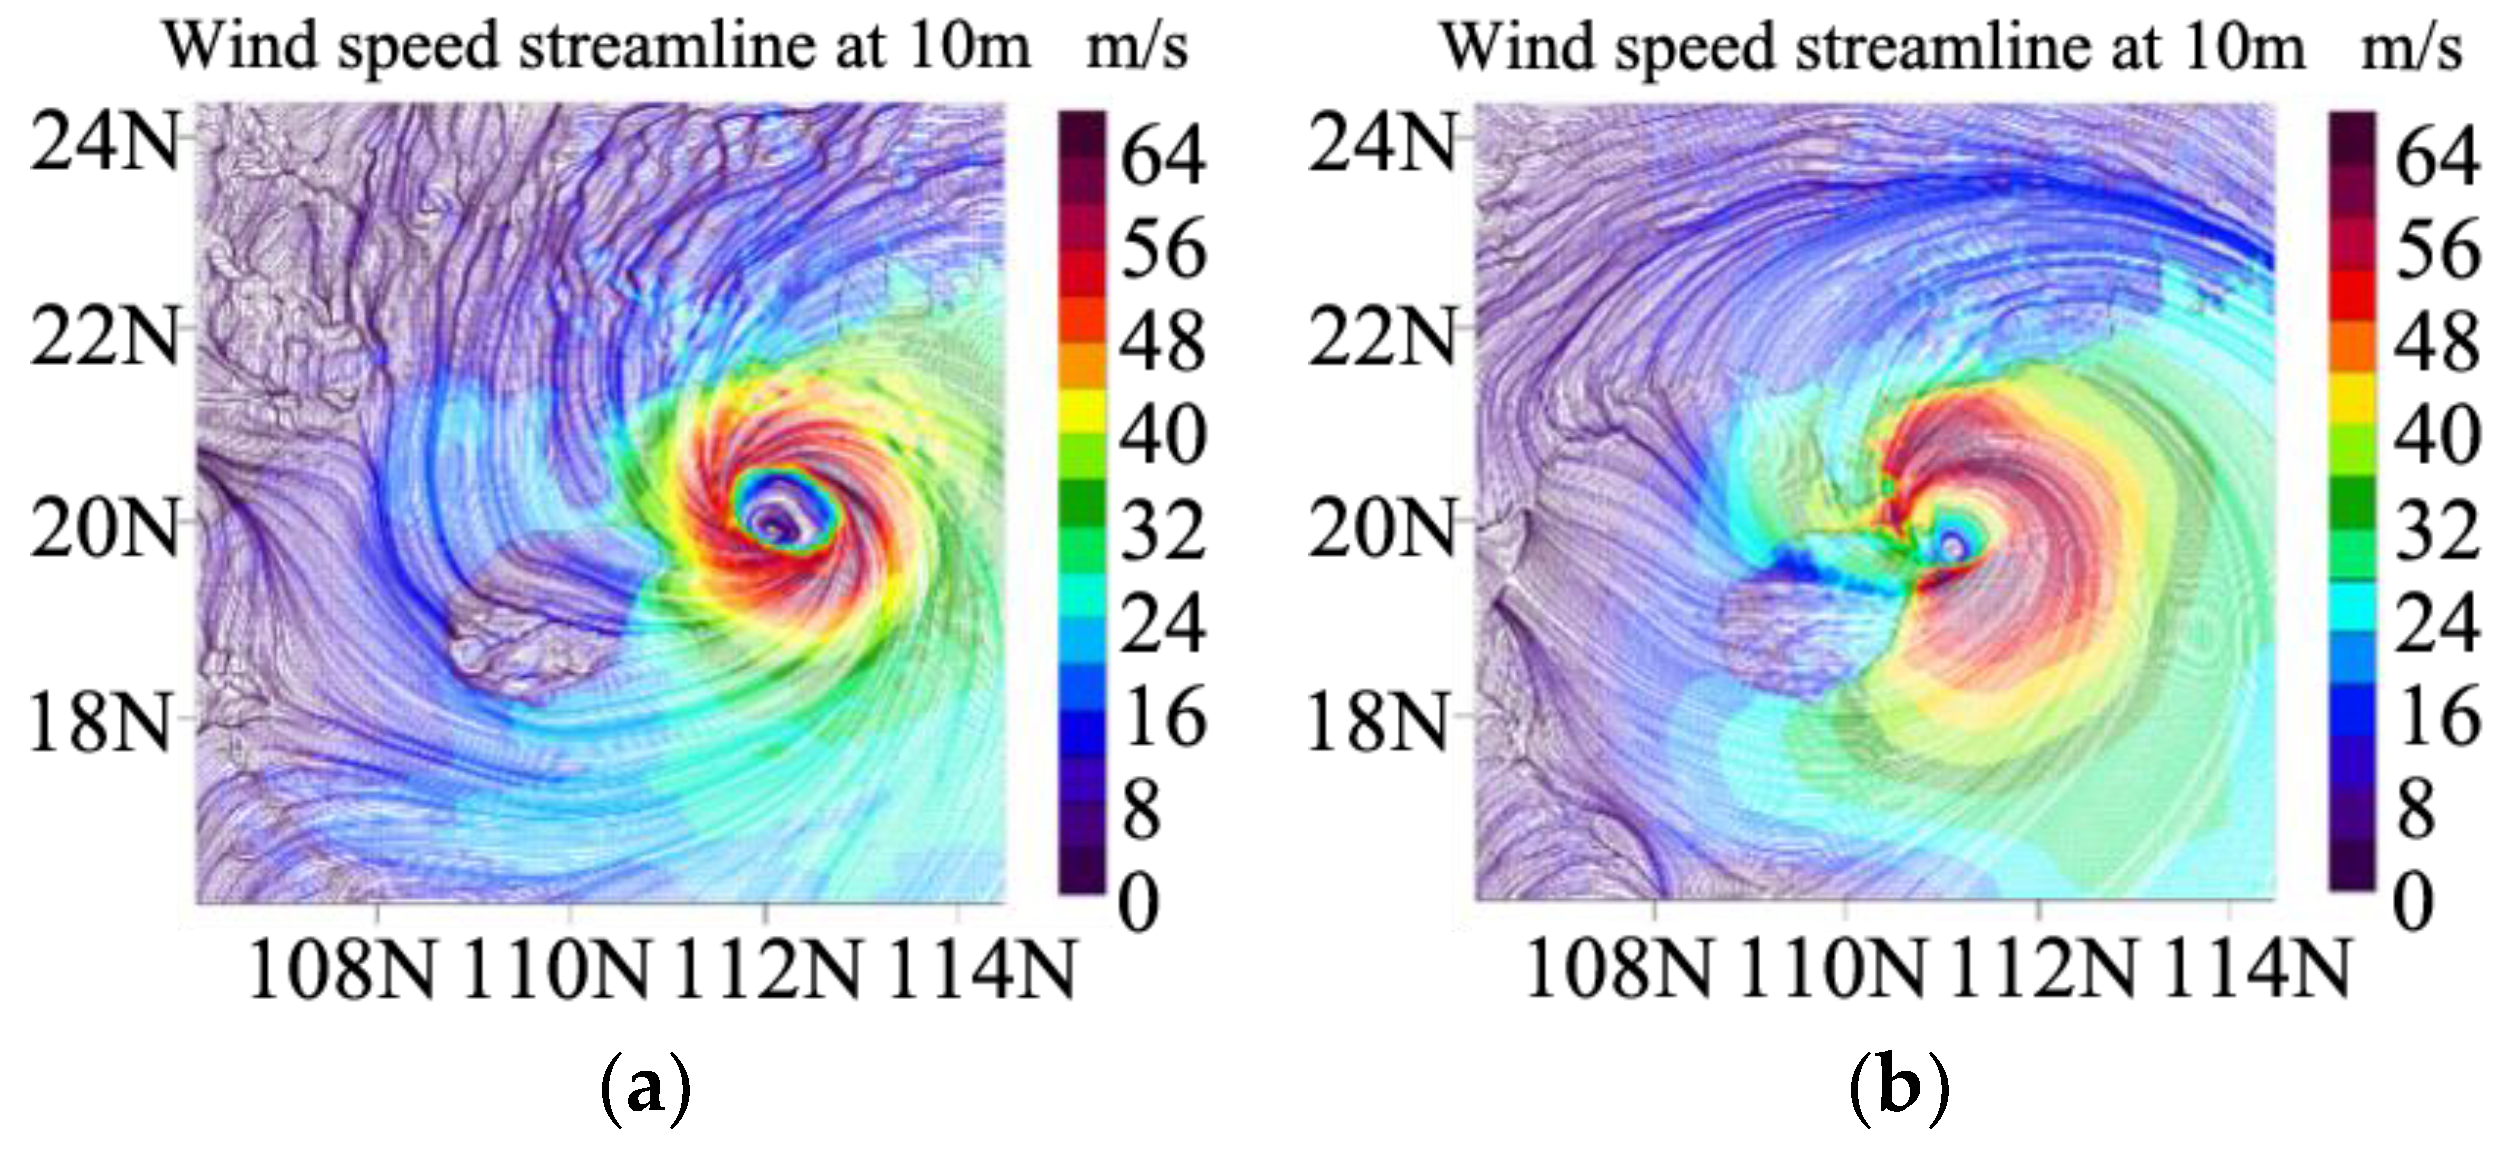
3.1.3. Typhoon Wind Field Characteristics
3.2. Simulation of Nested Wind Field by CFD Model
3.2.1. CFD Model Introduction
3.2.2. Mesh Division and Parameter Settings
3.2.3. Validity and Aerodynamic Characteristics
4. Analysis of the Entire Collapse Process
4.1. LS-DYNA Explicit Dynamic Analysis
4.1.1. Finite Element Model
4.1.2. Dynamic Characteristic Analysis
4.1.3. Contact Model and Loading Method
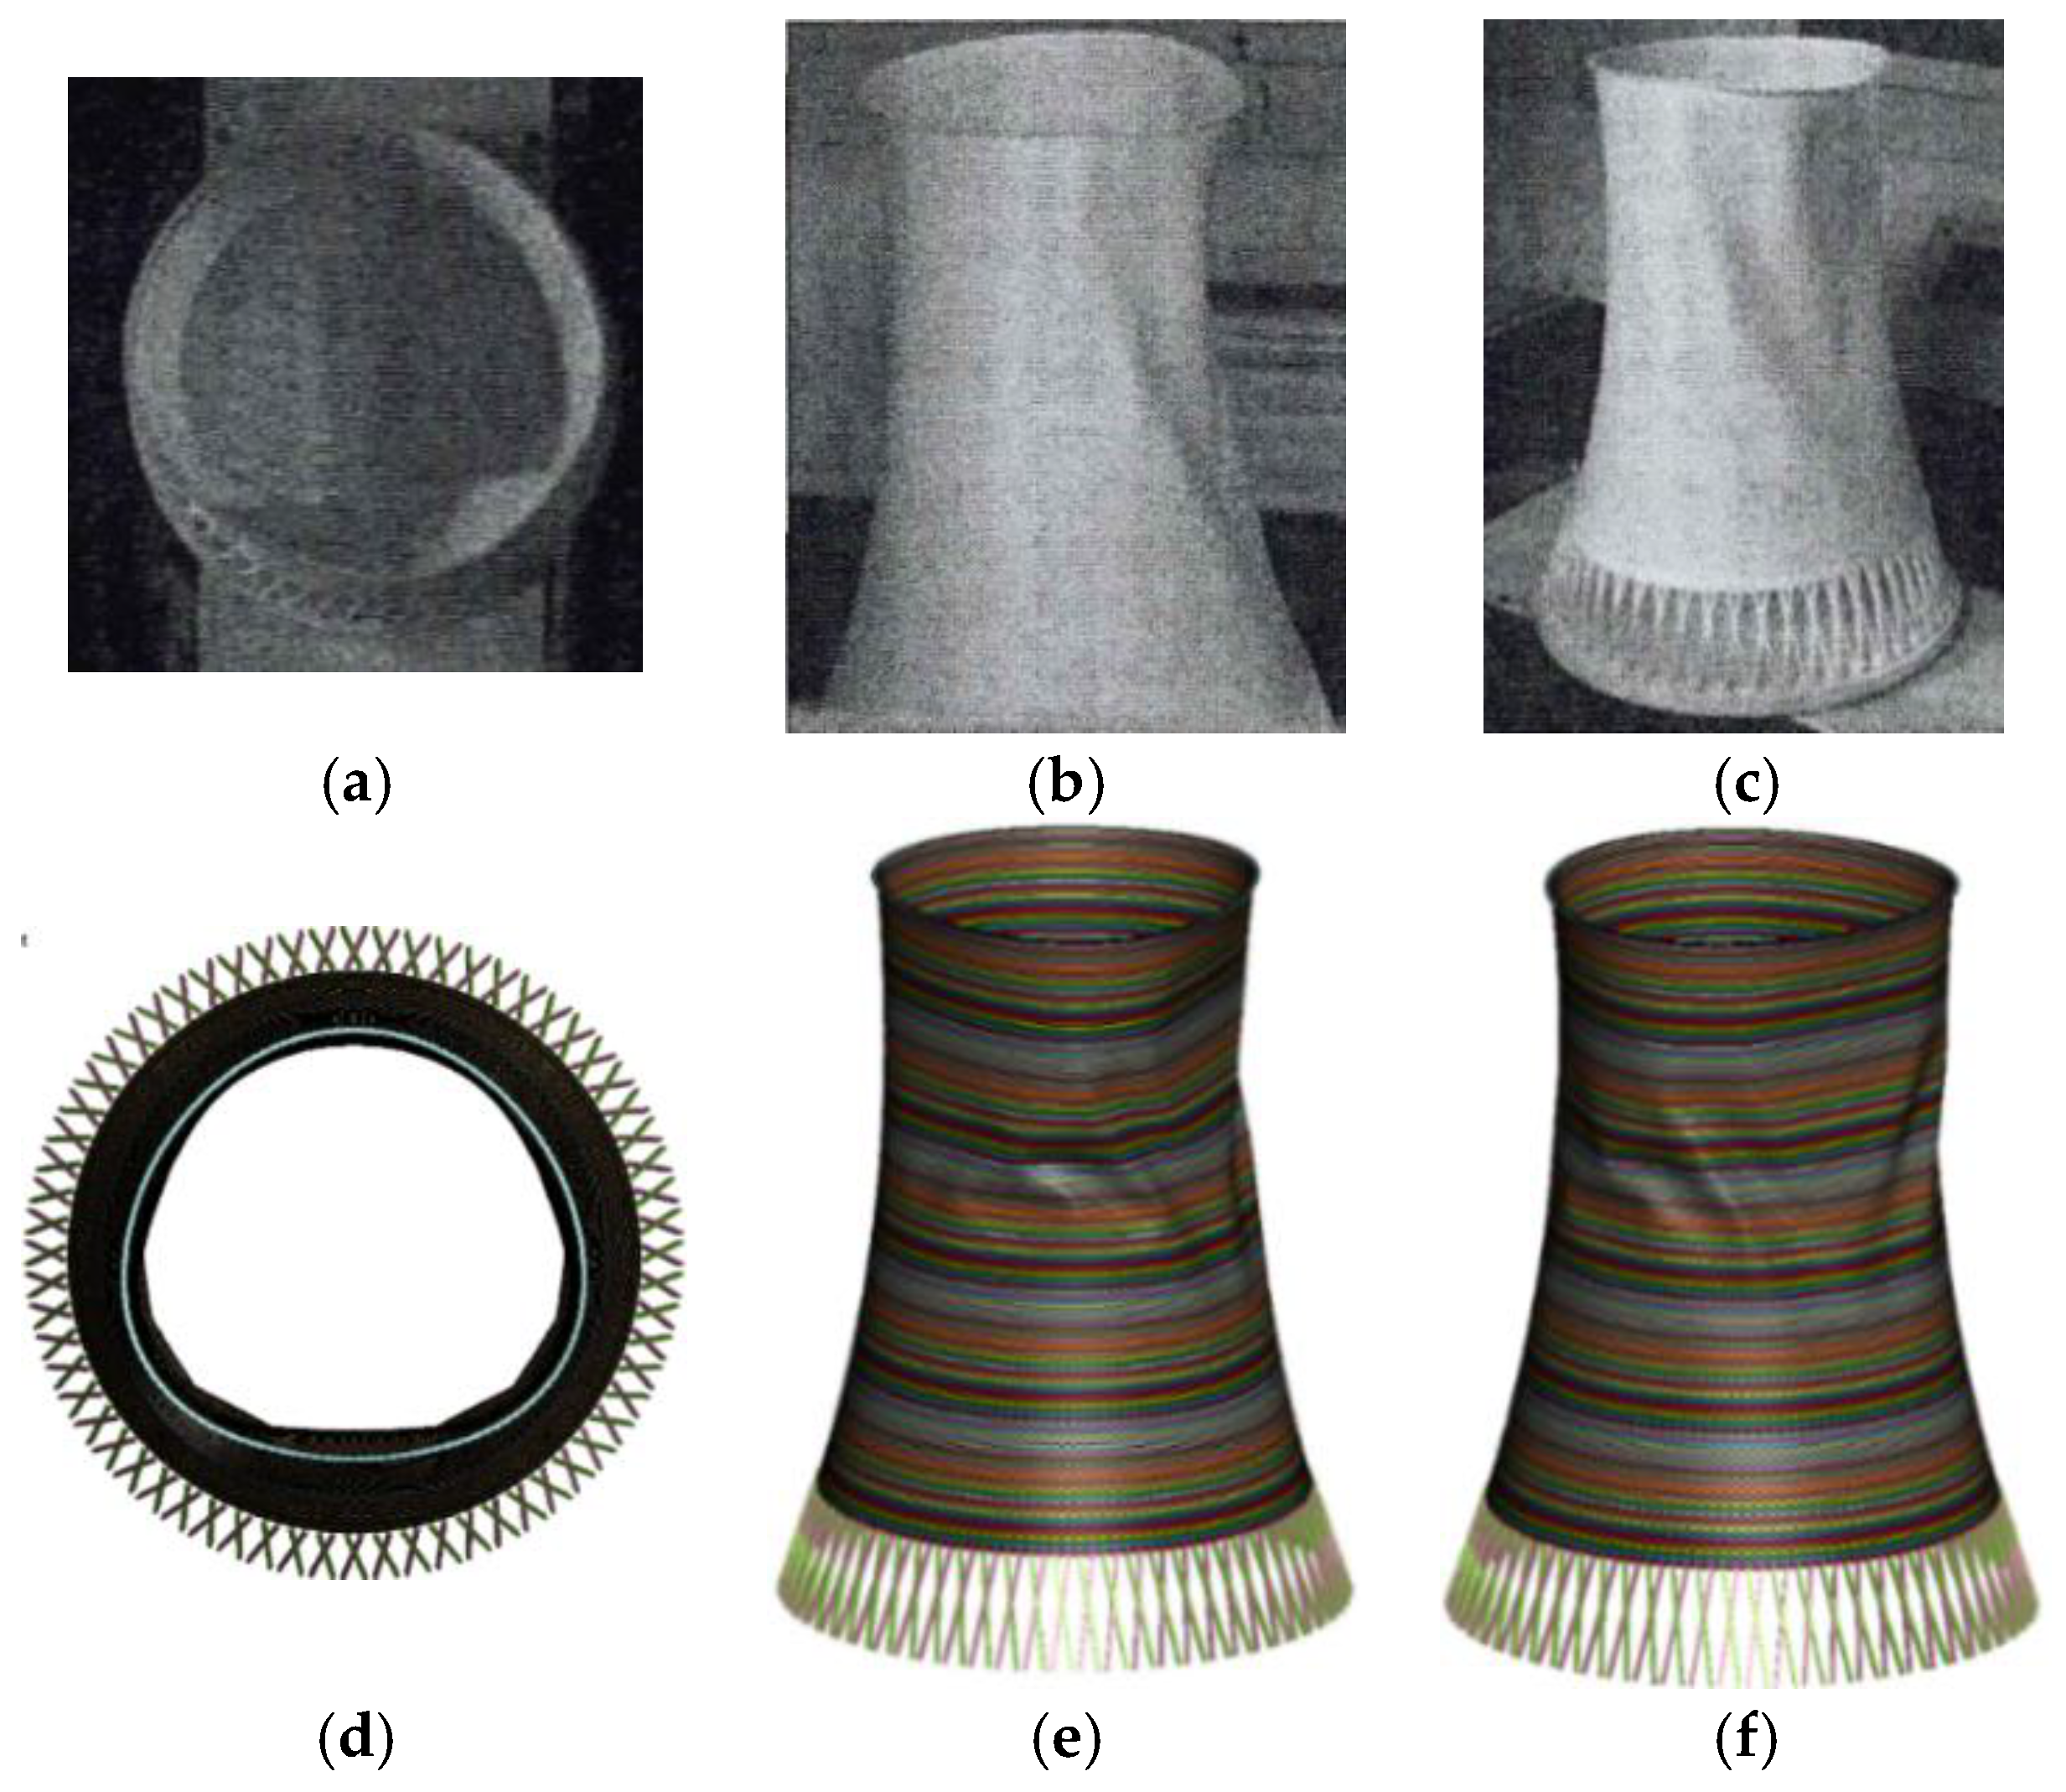
4.1.4. Validation
4.2. Analysis of the Collapse Mechanism
4.2.1. Weakness Analysis
4.2.2. Analysis of Collapsed Form
4.2.3. Time-History Analysis of Collapse
4.2.4. Analysis of Force Mechanism
5. Conclusions
- (1)
- The Rammasun typhoon wind speed profile obtained based on the WRF model is considered. The fitted value of the typhoon ground roughness index is 0.087, which is 27.5% less than the normal wind speed profile index of Type A, and the basic wind speed of Typhon “Rammasun” is 16.59 m/s, which is increased by 13.6% compared with Type A wind.
- (2)
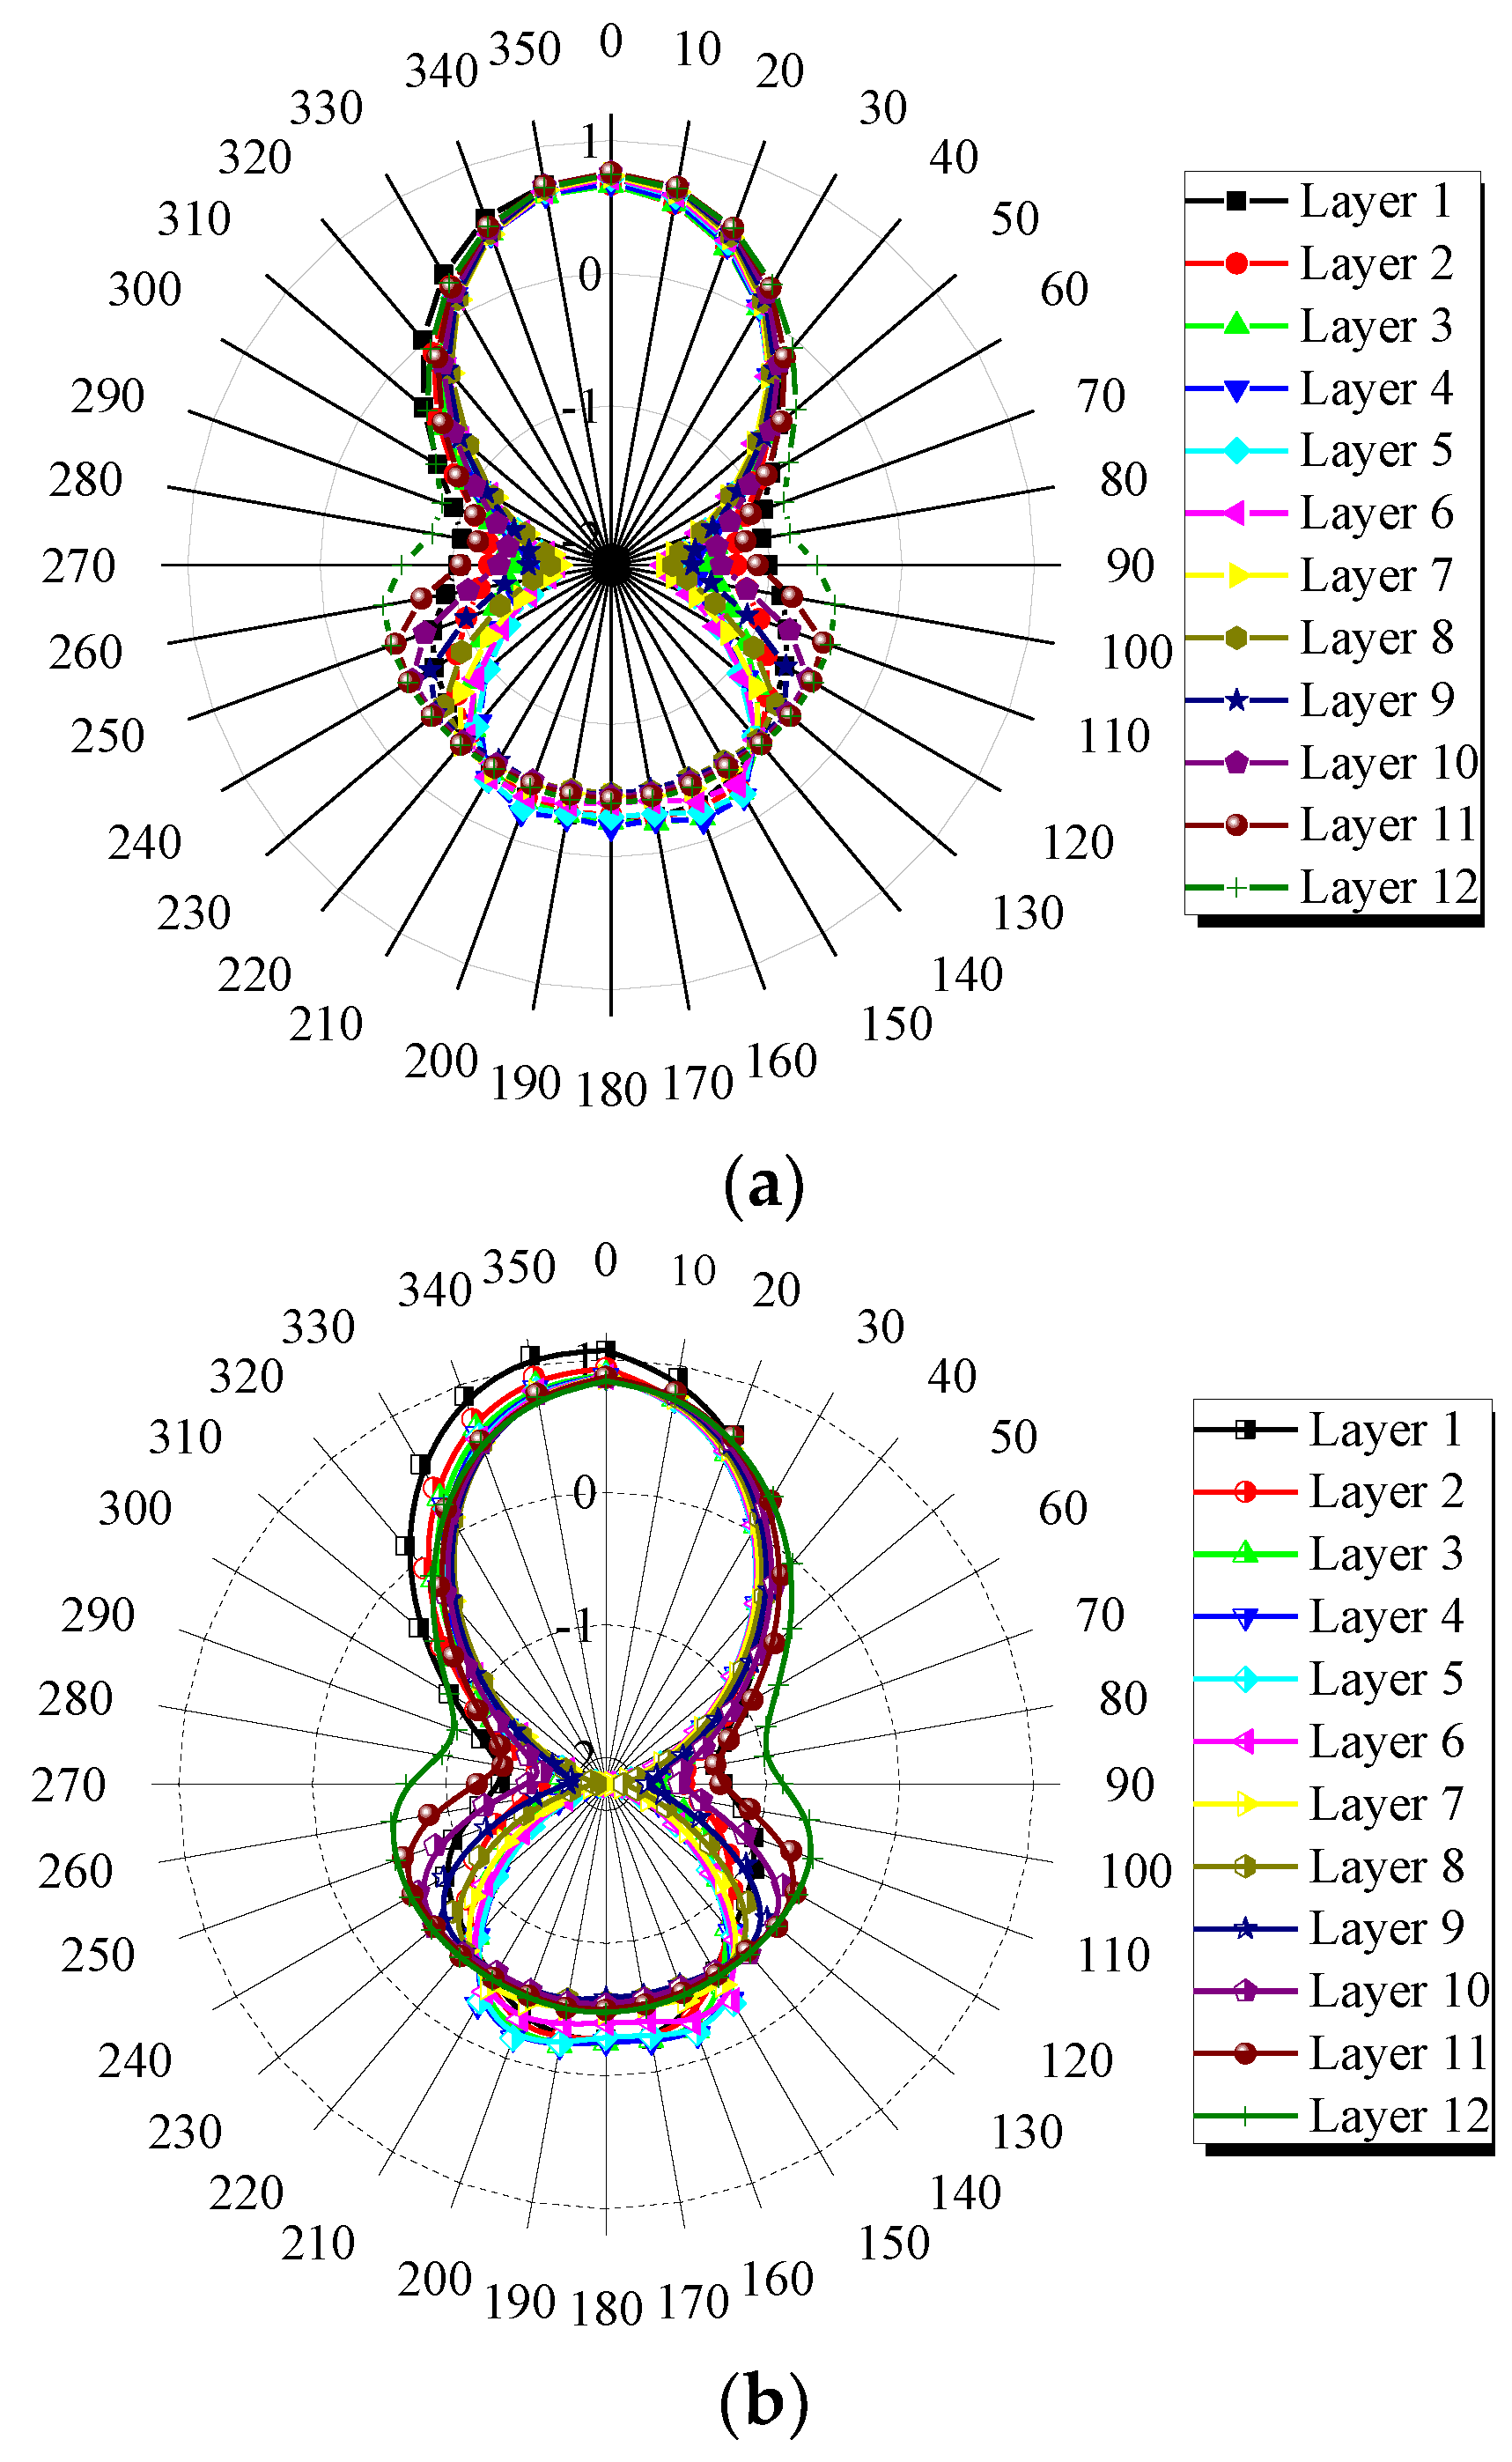
- The pressure at the typical area (15 m below the throat) under typhoon loading is significantly greater than that under the normal wind. The maximum increase in average pressure coefficients at the windward side and side wind surfaces of the cooling tower is 46.8% and 34.6%, respectively. There is a larger amplitude in the 3D aerodynamic distribution of the tower and more severe airflow vortex shedding and turbulence under typhoons.
- (3)
- The weak points in the process of wind-induced collapse are located in the high-stress ratio area (40–120 m above the ±62° meridians of the tower) and the fold area, which is prone to shear failure. The maximum displacement of the cooling tower first appears above the throat. With the progression of collapse, it moves down to the throat and, finally, quickly moves to the tower’s top rigid ring area after the rigid ring breaks. The typhoon-induced collapse process begins with a large deformation of the throat, which shows folds within the ±62° meridians on both sides, eventually leading to collapse due to uncoordinated deformation.
- (4)
- The wind-induced collapse mechanism can be divided into two types: an arch mechanism and a suspension line mechanism. In the elastic phase of low deformation, resistance to structural collapse mainly comes from the bending bearing capacity of the arch-shaped thin shell. After entering the plastic phase of large deformation, a plastic hinge is formed at the windward point of the tower top and the structure’s continuous collapse is resisted by the axial tension of the tower.
Author Contributions
Funding
Institutional Review Board Statement
Informed Consent Statement
Data Availability Statement
Conflicts of Interest
References
- Croll, J.G.; Kaleli, F.; Kemp, K.O.; Munro, J. A simplified approach to the analysis of geometrically imperfect cooling tower shells. Eng. Struct. 1979, 1, 92–98. [Google Scholar] [CrossRef]
- Niemann, H.; Pröpper, H. Some properties of fluctuating wind pressures on a full-scale cooling tower. J. Wind Eng. Ind. Aerodyn. 1975, 1, 349–359. [Google Scholar] [CrossRef]
- Kato, S.; Yokoo, Y. Effects of geometric imperfections on stress distributions in cooling towers. Eng. Struct. 1980, 2, 150–156. [Google Scholar] [CrossRef]
- Harte, R.; Krätzig, W.B. Large-scale cooling towers as part of an efficient and cleaner energy-generating technology. Thin-Walled Struct. 2002, 40, 651–664. [Google Scholar] [CrossRef]
- Ke, S.T.; Ge, Y.J.; Zhao, L.; Tamura, Y. Stability and reinforcement analysis of superlarge exhaust cooling towers based on a wind tunnel test. J. Struct. Eng. 2015, 141, 04015066. [Google Scholar] [CrossRef]
- GB/T 50102-2014; Code for Design of Cooling for Industrial Circulating Water. The Ministry of Structure of the People’s Republic of China: Beijing, China, 2014. (In Chinese)
- Bailey, J.R.B.; Levitan, M.L. Lessons learned and mitigation options for hurricanes. Process Saf. Prog. 2008, 27, 41–47. [Google Scholar] [CrossRef]
- Ke, S.T.; Xu, L. Aerodynamic performance analysis of large-scale wind turbine system considering the effect of mesoscale typhoon. J. Southeast Univ. 2019, 49, 137–144. (In Chinese) [Google Scholar]
- Kuok, S.-C.; Yuen, K.-V. Structural health monitoring of a reinforced concrete building during the severe typhoon ‘Vicente’ in 2012. Sci. World J. 2013, 2013, 509350. [Google Scholar] [CrossRef] [Green Version]
- Li, Q.S.; Li, X.; He, Y.C. Monitoring wind characteristics and structural performance of a supertall building during a landfall typhoon. J. Struct. Eng. 2016, 142, 04016097. [Google Scholar] [CrossRef]
- Lei, L.; Fei, H.; Jiang, J.; Cheng, X. An application of the RAMS/FLUENT system on the multi-scale numerical simulation of the urban surface layer-a preliminary study. Adv. Atmos. Sci. 2007, 24, 271–280. [Google Scholar] [CrossRef]
- Talbot, C.; Bouzeid, E.; Smith, J. Nested mesoscale large-eddy simulations with WRF: Performance in real test cases. J. Hydrometeorol. 2012, 13, 1421–1441. [Google Scholar] [CrossRef]
- Zhou, Y.; Wang, S.L.; Zhao, N.; Li, F. Experimental research and finite element analysis of progressive collapse resistance of RC. Chem. Eng. Trans. 2016, 51, 1015–1020. [Google Scholar]
- GSA. Progressive Collapse Analysis and Design Guidelines for New Federal Office Buildings and Major Modernization Project; USA General Service Bureau: Omaha, NE, USA, 2005.
- UFC 4-023-03; Design of Structures to Resist Progressive Collapse. US Department of Defense: Arlington, VA, USA, 2009. (In Chinese)
- CECS 392—2014; Design Codes for Building Structure Collapse. The Ministry of Structure of the People’s Republic of China: Beijing, China, 2014. (In Chinese)
- Wu, H.X.; Ke, S.T.; Wang, F.T.; Ge, Y.-J. Numerical Simulation and Force Performance Analysis of Wind-Induced Collapse of Super Large Cooling Towers. Eng. Mech. 2020, 37, 199–207. (In Chinese) [Google Scholar]
- Xu, Y.Z.; Bai, G.L. Analysis of random buckling bearing capacity of super large cooling tower considering variability of concrete materials. Eng. Mech. 2012, 29, 208–212. (In Chinese) [Google Scholar]
- Gu, X.L.; Yin, X.J.; Lin, F.; Wang, Y. Simulation and collapse prevention design of building structure collapse process. J. Build. Struct. 2010, 31, 179–187. (In Chinese) [Google Scholar]
- Bosman, P.B.; Strickland, I.G.; Prukl, R. Strengthening of natural draught cooling tower shells with stiffening rings. Eng. Struct. 1996, 20, 909–914. [Google Scholar]
- Zhang, J.F.; Ge, Y.J.; Zhao, L. Study on global aerostatic stability of hyperboloidal cooling tower based on the wind tunnel tests. Eng. Mech. 2012, 29, 68–77. (In Chinese) [Google Scholar]
- Ma, H.H.; Li, Z.Y.; Li, S.Z. Stability analysis and performance comparison of large-scale hyperbolic steel cooling towers with different latticed shell systems. J. Constr. Steel Res. 2019, 160, 559–578. [Google Scholar] [CrossRef]
- Sabouri-Ghoumi, S.; Kharrazi, M.H.K.; Javidan, P. Effect of stiffening rings on buckling stability of R.C. hyperbolic cooling towers. Thin-Walled Struct. 2006, 44, 152–158. [Google Scholar] [CrossRef]
- Zhao, H.; Bai, G.L.; Xu, Y.Z. The influence of initial imperfections on the ultimate bearing capacity of super-large hyperbolic cooling towers. In Proceedings of the 11th International Symposium on Structural Engineering, Guangzhou, China, 18–20 December 2010; Volume 2, pp. 1265–1270. [Google Scholar]
- Skamarock, W.C.; Klemp, J.B.; Dudhia, J.; Gill, D.O.; Liu, Z.; Berner, J.; Wang, W.; Powers, J.G.; Duda, M.G.; Barker, D.; et al. A Description of the Advanced Research WRF Version 4; NCAR Technical Note NCAR/TN-556+STR; National Center for Atmospheric Research: Boulder, CO, USA, 2019; 145p. [Google Scholar]
- Japan Meteorological Agency. RSMC Tokyo-Typhoon Center Japan. 2014. Available online: https://www.data.jma.go.jp/yoho/data/typhoon/T1409.pdf (accessed on 20 July 2014).
- Ke, S.; Wang, H.; Ge, Y. Interference effect and the working mechanism of wind loads in super-large cooling towers under typical four-tower arrangements. J. Wind Eng. Ind. Aerodyn. 2017, 170, 197–213. [Google Scholar] [CrossRef]
- Wang, H.; Ke, S.T.; Ge, Y.J.; Tamura, Y. Extreme and spectrum characteristics of wind loads on super-large cooling tower under different four-tower combinations. Adv. Struct. Eng. 2018, 22, 1238–1250. [Google Scholar] [CrossRef]
- Lu, W.D.; Zhou, L.M.; Jin, M.Z. The static and buckling analysis of reinforced concrete cooling tower under considering geometric and material nonlinearities. In Proceedings of the 3rd International Symposium on Natural Draught Cooling Tower, IASS, Paris, France, 24–26 April 1989; pp. 259–271. [Google Scholar]
- Madurapperuma, M.; Niwa, K. Concrete material models in ls-dyna for impact analysis of reinforced concrete structures. Appl. Mech. Mater. 2014, 566, 173–178. [Google Scholar]
- Ke, S.T.; Ge, Y.J.; Zhao, L.; Tamura, Y. A new methodology for analysis of equivalent static wind loads on super-large cooling towers. J. Wind Eng. Ind. Aerodyn. 2012, 111, 30–39. [Google Scholar] [CrossRef]
- Li, W.; Ke, S.; Yang, J.; Wu, H.; Wang, F.; Han, G. Wind-induced collapse mechanism and failure criteria of super-large cooling tower based on layered shell element model. J. Wind Eng. Ind. Aerodyn. 2022, 221, 104907. [Google Scholar] [CrossRef]
- Gu, X.L.; Yu, Q.Q.; Li, Y.; Lin, F. Collapse process analysis of reinforced concrete super-large cooling towers induced by failure of columns. J. Perform. Constr. Facil. 2017, 31, 04017037. [Google Scholar] [CrossRef]
- Chopra, A.K. Dynamics of Structures: Theory and Applications to Earthquake Engineering; Pearson Education Asia Limited: Beijing, China; Tsinghua University Press: Beijing, China, 2004. [Google Scholar]
- Ke, S.T.; Yu, W.; Zhu, P. Full-scale measurements and damping ratio properties of cooling towers with typical heights and configurations. Thin-Walled Struct. 2018, 124, 437–448. [Google Scholar] [CrossRef]
- Sun, Q.C. Experimental Study and Finite Element Analysis of the Overall Stability of Natural Ventilation Cooling Tower. Master’s Thesis, Zhejiang University, Zhejiang, China, 2017; pp. 17–24. (In Chinese). [Google Scholar]


| WRF Parameter | D01 Area | D02 Area | D03 Area |
|---|---|---|---|
| Horizontal resolution | 13.5 km | 4.5 km | 1.5 km |
| Integration time step | 240 s | 120 s | 40 s |
| Planetary boundary layer | Mellor–Yamada–Janjic′ (MYJ) boundary layer | ||
| Cumulus convection parameterization | Kain–Fritsch scheme | ||
| Land surface process | Heat diffusion scheme | ||
| Longwave radiation | Rapid Radiative Transfer Model (RRTM) scheme | ||
| Short-wave radiation | Dudhia scheme | ||
| Near-surface | Monin–Obukhov scheme | ||
| Microphysical process | Lin et al.’s scheme | ||
| Pattern dynamic framework | Advanced Research WRF (ARW) non-static | ||
| Mesh Scheme | ① | ② | ③ | ④ | ⑤ |
|---|---|---|---|---|---|
| Total number of cells | 1.3 million | 5.1 million | 9.8 million | 12.8 million | 18.8 million |
| Mesh minimum orthogonal mass | 0.14 | 0.37 | 0.52 | 0.62 | 0.64 |
| Mesh skew | 0.96 | 0.88 | 0.81 | 0.73 | 0.72 |
| Windward pressure coefficient | 0.91 | 0.87 | 0.84 | 0.80 | 0.79 |
| Component | Tower | Pillar |
|---|---|---|
| Elastic modulus E (GPa) | 32.5 | 33.5 |
| Yield stress (MPa) | 8 | 8 |
| Tangent modulus (MPa) | 150 | 150 |
| Hardening parameters H | 0 | 0 |
| Strain rate parameter C | 40 | 40 |
| Strain rate parameter P | 5 | 5 |
| Failure strain ε | 0.25 | 0.25 |
| Order | 1, 2 | 5, 6 | 25 | 48, 49 | 98, 99 |
| Natural frequency | 0.68 | 0.72 | 1.36 | 1.91 | 2.86 |
| Mode shape |  |  |  |  |  |
 |  |  |  |  |
Publisher’s Note: MDPI stays neutral with regard to jurisdictional claims in published maps and institutional affiliations. |
© 2022 by the authors. Licensee MDPI, Basel, Switzerland. This article is an open access article distributed under the terms and conditions of the Creative Commons Attribution (CC BY) license (https://creativecommons.org/licenses/by/4.0/).
Share and Cite
Wu, H.; Ke, S.; Wang, F.; Wang, W. Typhoon-Induced Failure Process and Collapse Mechanism of Super-Large Cooling Tower Based on WRF-CFD-LS/DYNA Nesting Technology. Appl. Sci. 2022, 12, 4178. https://doi.org/10.3390/app12094178
Wu H, Ke S, Wang F, Wang W. Typhoon-Induced Failure Process and Collapse Mechanism of Super-Large Cooling Tower Based on WRF-CFD-LS/DYNA Nesting Technology. Applied Sciences. 2022; 12(9):4178. https://doi.org/10.3390/app12094178
Chicago/Turabian StyleWu, Hongxin, Shitang Ke, Feitian Wang, and Weihua Wang. 2022. "Typhoon-Induced Failure Process and Collapse Mechanism of Super-Large Cooling Tower Based on WRF-CFD-LS/DYNA Nesting Technology" Applied Sciences 12, no. 9: 4178. https://doi.org/10.3390/app12094178