Article

Low Temperature Step Annealing Synthesis of the Ti2AlN MAX Phase to Fabricate MXene Quantum Dots

Department of Energy Science, Sungkyunkwan University, Suwon 16419, Korea
*
Author to whom correspondence should be addressed.
These authors contributed equally to this work.
Appl. Sci. 2022, 12(9), 4154; https://doi.org/10.3390/app12094154
Submission received: 18 March 2022 / Revised: 18 April 2022 / Accepted: 18 April 2022 / Published: 20 April 2022
(This article belongs to the Topic Optical and Optoelectronic Materials and Applications)

Abstract

:
We present the synthesis of the Ti2AlN MAX phase using two-step annealing at temperatures of 600 °C and 1100 °C, the lowest synthesis temperatures reported so far. After the successful synthesis of the Ti2AlN MAX phase, two-dimensional Ti2N MXene was prepared through wet chemical etching and further fragmented into light emitting MXene quantum dots (MQDs) with a size of 3.2 nm by hydrothermal method. Our MQDs displayed a 6.9% quantum yield at a 310 nm wavelength of excitation, suggesting promising nanophotonic applications.

1. Introduction

The MAX phases are a family of advanced ceramic materials comprised of hexagonal layered transition metal carbides, nitrides, and carbonitrides, which have been explored for more than a decade [1,2]. Generally, the MAX phases are denoted as Mn+1AXn, where M is an early transition metal (Sc, V, Ti, etc.), A is an element from group 13–16, and X is either nitrogen or carbon with a stoichiometry of n = 1, 2, 3 [3]. The crystal structure of the MAX phases contains a hexagonal lattice with space group P63/mmc in which adjacent Mn+1Xn octahedral sites are interleaved with atomic monolayers of A atoms [4]. The MAX phases have been given considerable attention owing to their unique and interesting combination of metallic as well as ceramic properties [5]. Because of their metallic character, MAX phases exhibit high thermal and electrical conductivity along with thermal shock resistance. The ceramic property of the MAX phase material enables it to possess remarkable oxidation and corrosion resistance at high temperature operations [6]. Owing to their fascinating properties, more than 155 MAX phases have currently been synthesized [5].
Among the numerous MAX phases, ternary MAX phases based on the Ti-Al-N system are more demanding because of their oxidation resistance at high temperatures [4,7]. The synthesis of bulk Ti2AlN in a single phase is difficult owing to its strong chemical bonding [8] and low stability [9], which provides an opportunity to investigate and explore different methods for the synthesis of Ti2AlN MAX phase. Thus, the bulk Ti2AlN MAX phase had been synthesized via multiple methods. The spectrum of these methods is broad and includes high-temperature synthesis [10,11,12,13], molten salt synthesis [14,15,16], hot isostatic pressing (HIP) [17,18,19], hot pressing (HP) [20,21,22], field assisted sintering technology (FAST) [6], spark plasma sintering (SPS) [4,6,23,24], ultra-high vacuum (UHV) deposition chamber reactive magnetron sputtering [1], microwave sintering [2], and shock-activated reaction synthesis [25].
As MAX phases possess both ceramic and metallic properties, their synthesis at low temperatures is difficult. Previous studies have reported the presence of significant amounts of impurities such as TiN, Ti3Al, TiAl, AlN, Al2Ti, and Al3Ti [2,15,21] during the synthesis of MAX phases at temperatures lower than 1400–1500 °C. Thus, most of the previous methods for synthesizing Ti2AlN require a high temperature, which entails much more investment and is not easily available in common laboratories. One of the main hindrances to synthesizing MAX phase materials is the use of an expensive apparatus because commonly available furnaces have temperature limitations and can only be used at temperatures of 1100–1200 °C or less. Thus, there is always a strong demand for new, easily accessible, simple, and low-cost methods for the synthesis of Ti2AlN MAX phases with better crystal quality and lower temperature (~1100 °C) systems compared to the methods described in previous works.
The ternary MAX phase can be easily converted into two-dimensional (2D) layered MXene sheets using a simple wet chemical etching process [10] and can be further reduced to zero-dimensional MXene quantum dots (MQDs) [26]. Similar to 2D materials such as graphene [27] and transition metal dichalcogenide (TMD)-based quantum dots [28,29,30], MQDs have become a center of interest for many researchers because of their excellent properties, such as good light emission [31,32], selective metal ion sensing [33,34,35,36], nontoxicity [26,37,38], biocompatibility [26], hydrophilicity [35], and functionalization [39,40]. Owing to their interesting optical properties, they can be used as crucial materials in optical sensors [41,42], bio-imaging [34], optical modulator [43] etc. Comparatively, carbide MQDs [44,45] derived from the MAX phase containing a carbide group such as V2AlC [46], Nb2AlC [33], and Ti3AlC2 [39] have been studied more than nitride MQDs [10,26]; thus, the exploration and broad study of the properties and applications of nitride based MQDs are necessary.
In this study, we introduce a new step annealing method to synthesize the Ti2AlN MAX phase at a relatively lower temperature compared to previously reported methods and soaking times. This method includes a two-step annealing process at 600 °C and 1100 °C, which is a comparatively lower temperature than previous techniques, and yields a better quality Ti2AlN MAX phase with completely removed unavoidable impurities such as TiN, which were mostly obtained during synthesis at low temperatures. The as-synthesized Ti2AlN MAX phase was etched out using wet chemical etching to prepare its corresponding 2D MXene sheets, which were further decomposed into light emitting MQDs by a hydrothermal process. The formation of the Ti2AlN samples, Ti2N Mxene sheets, and MQDs was further confirmed and comprehensively visualized and studied by X-ray diffraction (XRD), field emission scanning electron microscopy (FE-SEM), high-resolution transmission electron microscopy (HR-TEM), Raman spectroscopy, photoluminescence (PL) spectroscopy, X-ray photon spectroscopy (XPS) and Ultraviolet-visible (UV-vis) spectroscopy.

2. Materials and Methods

2.1. Synthesis of Ti2AlN MAX Phase via Step Annealing Method

Commercial powders of elemental titanium (Ti, −325 mesh, Sigma Aldrich, St. Louis, MO, USA), aluminum (Al, −325 mesh, Sigma Aldrich), and aluminum nitride (AlN, Sigma Aldrich) were used as the initial precursors for the preparation of the Ti2AlN MAX phase. All powders were used as received without further treatment.
The precursor ratio of starting powder mixtures of 2Ti + 0.8Al + AlN was used. Since Al could evaporate and dissociate during the processing, which inhibits the single-phase synthesis of Ti2AlN [47], an excess amount of Al was introduced to compensate for the Al loss. Ti, Al, and AlN powders were weighed on a precision scale (0.0001 g) at a molar ratio of 2:0.8:1. Powder mixtures and zirconia balls were sealed in a dry environment with a dew point of nearly −55 °C to avoid the introduction of moisture during the milling process. The powders were thoroughly ball-milled in a stainless-steel vessel by using a Fritsch Pulverisette planetary mill [11]. The powders were finely milled using a unique set of milling conditions in two steps, using a powder-to-ball ratio of 1:4. In step 1, a low rpm of 270 was used, and the powders were milled for 6 h, whereas in step 2, a high rpm of 400 was used for another 6 h of milling. These steps in the milling process enabled the thorough mixing of the precursors. The high-rpm step plays a significant role in the mechanical activation [48] of the mixed powders. Mechanical activation helps the disintegration of constituents to yield smaller sized powders while increasing the active surface area. Consequently, decreasing the time and the temperature of synthesis are desirable for Ti2AlN synthesis. The mixed powders were placed in a stainless-steel die and compacted into 13 mm diameter pellets by applying a uniaxial pressure of 4 MPa.
For this particular step annealing synthesis method, the pellets were placed in an alumina crucible and placed in a double-tube furnace, where a constant flow of argon gas was maintained throughout the thermal annealing process. This method includes two different steps, involving different heating rates and temperatures. First, a heating rate of 5 °C/min was used to reach 600 °C with a soaking time of 1 h. Second, a relatively high heating rate of 20 °C/min was used to reach 1100 °C from 600 °C, and the sample was soaked for 3 h at that temperature. After completion of the synthesis process, the pellets were naturally cooled to room temperature and ground with an agate mortar pestle to obtain Ti2AlN MAX phase powder.

2.2. Synthesis of MXene and MQDs

Ti2N MXene was prepared by chemical etching of the Al layers from the Ti2AlN MAX phase by following a previously reported method [10]. During the chemical etching process, the etchant was prepared by dissolving 6 g KF in 5M HCl then 1 g of the MAX phase was added to 20 mL of the prepared etchant solution and kept undisturbed for 3 h. Subsequently, the etching solution with the MAX phase was bath-sonicated for 1 h at 40 °C to accelerate intercalation, which further assisted the exfoliation process. Subsequently, the solution was centrifuged and washed with DI water until the pH became neutral. Finally, the MXene sheets were filtered and dried overnight at 40 °C. The yield of MXene formation was found to be approximately 70%, which is comparable to the previously reported yield [10].
MQDs were synthesized using a hydrothermal method followed by centrifugation [35]. The obtained Ti2N MXene after Al etching from Ti2AlN MAX was dispersed in DI water, and the pH of the solution was adjusted to 10 by the addition of ammonium hydroxide (NH4OH) solution. This solution was poured into a Teflon container that was placed in an autoclave. The autoclave was then placed in an oven at 100 °C for 6 h and cooled to room temperature. After cooling, the solution was centrifuged (10,000 rpm) for 20 min, and the MQDs were collected as dispersed in the supernatant. The supernatant was carefully separated and stored in a refrigerator for frequent use for further characterization.

2.3. XRD, PL, Raman Spectroscopy, UV-Vis Absorption, PL Excitation (PLE), Quantum Yield (QY), FE-SEM, XPS and HR-TEM Measurements

The XRD patterns of the Ti2AlN MAX phase and corresponding Ti2N MXene were recorded using a Bruker AXS diffractometer (D2 PHASER A26-X1-A2B0B2A Karlsruhe, Germany) at room temperature. Raman spectra were recorded using a WITec confocal microscope system (Alpha-300 SR, WITec GmbH, Ulm, Germany) equipped with a 100× objective lens (N.A. = 0.9) with an excitation wavelength of 532 nm. UV-Vis absorption spectra of the Ti2N MQDs were recorded in deionized water (Optizen UV-Vis spectrometer). PL and PLE spectra were measured using a Cary Eclipse spectrometer. The quantum yield of the Rhodamine 6G (R6G) solution was measured using a Quantaurus-QY, Hamamatsu Photonics spectrometer. FE-SEM (JSM-7600F, JEOL Corp., Tokyo, Japan) images of the Ti2AlN MAX phase and Ti2N MXene were captured at field voltages ranging from 5 kV to 10 kV. XPS of MQDs was recorded using X-ray photon spectrometer (ESCALAB250). The HR-TEM (JEM-3010, JEOL Corp.) images of the MQDs were obtained at 300 kV.

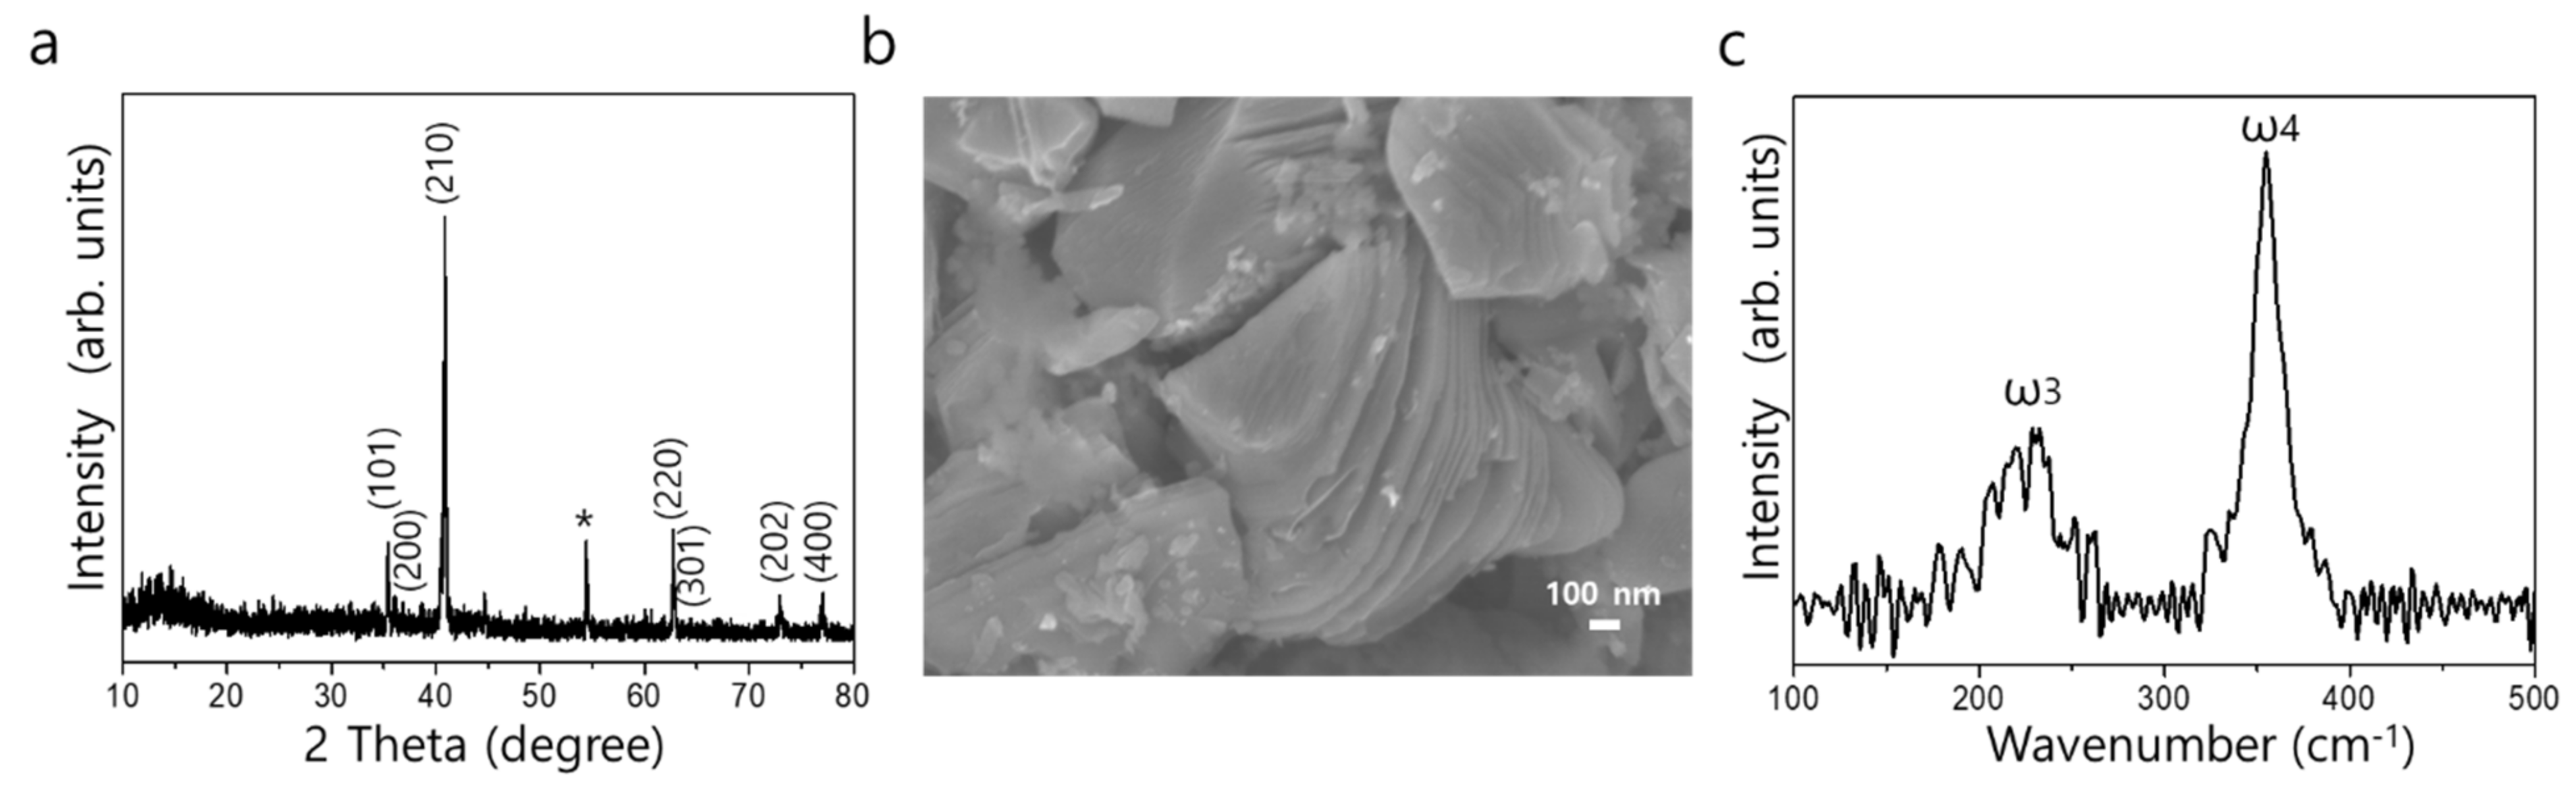
3. Results and Discussion

The schematic diagram in Figure 1 illustrates a brief process of the new step annealing method for synthesizing the (211) Ti2AlN MAX phase beginning from the precursors. This is comprehensively explained in the experimental section. Generally, MAX phase ceramics are synthesized at high temperatures [49], and it is very difficult to obtain relative purity at lower temperatures. As illustrated in the schematic diagram, the 3D ceramic MAX phase of Ti2AlN was prepared using a unique step annealing method in an argon environment after pelletizing the precursors. In this particular method, a temperature soaking step at 600 °C for 1 h was maintained in step 1 because the melting point of Al is relatively low compared to other precursors, that is, 660 °C, which causes inevitable weight loss at higher temperatures [47]. The desorption of Al occurs at temperatures greater than 600 °C because of its high vapor pressure [50]. The absence of Al at high temperatures can change the composition of the reaction system. To overcome this phenomenon, the precursor ratio was initially adjusted and excess of Al was added to the composition. The increased formation of TiN phase impurities occurs in the temperature range of 900 °C to 1000 °C [50]. Therefore, from step 1 to step 2 of annealing, a higher step rate of 20° min−1 was used to inhibit TiN formation. In step 2, the temperature soaking step was maintained at 1100 °C for 3 h to complete the MAX phase synthesis.
The XRD pattern of the as-synthesized Ti2AlN MAX phase was recorded in the range of 10°−80° within 2θ angle using CuKα radiation (λ = 1.54 Å) with a step size of 0.01°, as shown in Figure 2a. The Ti2AlN MAX phase synthesized by the step annealing method with the optimized precursor ratio, indicated by the black profile in Figure 2a, contains most of the diffraction peaks of Ti2AlN and small amounts of TiAl with a peak position at 38.9° as an impurity. The prominent peaks in the pattern were observed at 12.9°, 34.6°, 35.2°, 39.6°, 40.0°, 43.9°, 53.6°, 59.4°, 62.0°, 72.3°, 76.1° and 76.4° 2θ degree angles. All the diffraction peaks of the as-synthesized max phase can be indexed to the Ti2AlN reflections from JCPDS card no. 00-055-0434, which indicates the high purity of the as-synthesized Ti2AlN MAX phase. This is consistent with previously reported XRD results [10,51]. The c-lattice parameter (c-LP) of the two-step annealed Ti2AlN presented in Table 1 was calculated to be 13.59 Å using “unit cell” software from the XRD patterns explained in Figure 2a, and it closely matches with the reported Ti2AlN c-LP value [21]. This is strong evidence of high purity of the as-synthesized MAX phase. For comparison, Ti2AlN was also synthesized by a typical annealing process at 1100 °C without any step; its XRD pattern (red profile) is also shown in Figure 2a, which contains a prominent TiN peak at 42.6° and other impurities such as Ti2Al5 at 43.3° along with many unspecified peaks. This comparative study of the XRD patterns clearly shows the improvement of the step annealing method over the normal annealing method. The FE-SEM image shown in Figure 2b depicts the layered compact structure, which is a typical signature of the MAX phases [4], confirming the successful synthesis of the 3D MAX phase using the unique step annealing method. Because the peak positions in the Raman spectra are correlated to the vibrational modes distinctive to a specific material, Raman spectroscopy is a powerful tool for identifying and characterizing the fingerprint of materials. The vibrational modes for the 211 MAX phases are theorized to be 24, but only four modes are Raman active and can be observed [52]. Of these four modes, ω3 is infrared and Raman active, whereas the ω4, ω1, and ω2 modes are only Raman active [52]. For the Ti2AlN MAX phase, the ω3 and ω4 modes are associated with the parallel and perpendicular vibrations of the Ti-Ti planes, whereas the ω1 and ω2 vibrational modes arise from the shear vibrations of the Ti-Al planes [10,51,53]. The representative Raman spectra of step annealed Ti2AlN are shown in Figure 2c, where all four Raman active modes are clearly observed at the peak positions of 149 cm−11), 229 cm−12), 234 cm−13), and 365 cm−14), providing strong evidence for the formation of the Ti2AlN MAX phase [10,51,54].
The step annealed Ti2AlN MAX phase was further etched by wet chemical etching to obtain multilayered Ti2N MXene sheets. In this particular method, the Al layer was removed by acid-salt treatment of the Ti2AlN MAX phase in a KF-HCl etchant solution [10,26,45,55]. The effective formation and phase composition of multilayered Ti2N MXene sheets were analyzed using XRD, FE-SEM, and Raman spectroscopy respectively, and the corresponding results are demonstrated in Figure 3. The prominent peaks observed in the XRD pattern were consistent with previously reported results for Ti2N MXene, and they were indexed according to the JCPDS card no. 00-017-0386 of Ti2N, as shown in Figure 3a. Comparative analysis of the XRD patterns of the Ti2AlN MAX phase and Ti2N MXene shows that the sharp peak assigned to the (0 0 2) peak in the Ti2AlN MAX phase completely disappeared, and a broad curve was observed at that position. This observation may have resulted from the removal of the Al layer between two consecutive Ti2N MXene layers [26]. Similarly, the intense peak assigned to the (1 0 3) plane observed in the Ti2AlN MAX phase was completely absent in the XRD pattern of Ti2N MXene, which is significant evidence of the effective etching of the Al layer from the Ti2AlN MAX phase [10,26]. A new peak at approximately 54.4° marked with “*” in Figure 3a is observed, which is assigned to the XRD signal of the potassium fluoride (KF) residue [56], which was used along with HCl in the etchant. This may have remained in the exfoliated Ti2N MXene layers during the washing process. The formation of Ti2N MXene was further confirmed by FE-SEM. The FE-SEM image in Figure 3b shows the typical morphological characteristics of MXenes [55,57,58]. The etched Ti2N MXene showed visible delamination and increased space between the layers owing to the removal of the Al layer. In some areas, stacked layers appear instead of the delaminated and opened layers. This may be attributed to the intercalation of K+ or water ions between the Ti2N layers during the etching process. The presence of only two vibration modes at 222 cm−13) and 355 cm−14) confirms the formation of Ti2N MXene sheets after etching the Al layer from the Ti2AlN MAX phase observed in the Raman spectrum shown in Figure 3c. Comparative analysis of the Raman spectra of the Ti2AlN MAX phase and the as-synthesized Ti2N MXene sheets shows that the Ti-Al vibration mode (ω1) is completely absent in the case of the Ti2N MXene sheets, indicating the complete removal of the Al layer and formation of the Ti2N MXene structure. Simultaneously, a clear red shift in the peak positions of ω3 and ω4 was observed for the Ti2N MXene sheets compared to its parent MAX phase, clearly showing better etching of the Al layer along with exfoliation [10].
The exfoliated Ti2N MXene sheets were further decomposed into 0D Ti2N MQDs using a simple hydrothermal method similar to the synthesis of QDs of other 2D materials, such as graphene and TMDs [30,59,60]. The effective synthesis of Ti2N MQDs is based on two crucial steps: first, the Al layer is etched from the 3D Ti2AlN MAX phase to obtain 2D Ti2N MXene, and second, the MXene nanosheets are broken down into ultra-small Ti2N MQDs, which determines the quality of the MQDs [26]. Since MXene is metastable it may yield its oxidation products in alkaline medium at high temperature reaction system. However, we emphasize that the hydrothermal reaction process at 100 °C using NH4OH solution was adopted for the synthesis of MQDs where surface-terminated -NH groups from the NH4OH solution maintain the crystal structure of pristine MXene, preventing the formation of TiO2 or TiO2 quantum dots [35]. The morphology and size of the Ti2N MQDs were analyzed by HR-TEM and are presented in Figure 4a,b, respectively. The low-and high-magnification HR-TEM images in Figure 4a,b reveal the formation of uniform and ultra-small Ti2N MQDs, respectively. The fringes observed in the single MQD in the HR-TEM image presented in Figure 4b are highly parallel with separation distance of 0.26 nm that corresponds to (1 0 1) lattice space of the Ti2N [26] and reveal good crystallization of the Ti2N MQDs. The fast Fourier transform (FFT) pattern of the MQDs is shown in the inset of Figure 4b. The average lateral diameter of the Ti2N MQDs was determined to be 3.2 ± 0.2 nm from the bell-shaped size distribution curve, as shown in Figure 4c, which matches the size of the single MQD shown in Figure 4b. The element distribution was measured by XPS and the content of nitrogen in the MQDs was approximately 17.6%, which is comparable with the previously reported value of Ti2N MXene [10].
To study and understand the optical properties of the as-synthesized Ti2N MQDs, absorption, PLE, and PL spectra were acquired from aqueous Ti2N MQDs, and the results are presented in Figure 5. As-synthesized Ti2N MQDs exhibited the PL emission with the peak wavelength around at 420 nm upon the excitation wavelength between 390 nm to 230 nm (Figure 5c). The demonstration of PL behavior indicated the successful fabrication of light emitting Ti2N MQDs. The light emitting properties were observable due to quantum confinement effect which caused the bandgap expansion of semi-metal MXene that were previously observed from the fabrication of other MQDs and 2D material-derived QDs [26,33,35,46,60,61]. PLE spectrum is the plot of PL intensity at a fixed detection wavelength vs. the excitation wavelength. Because PLE intensity corresponds to the probability of optical transition, PLE spectra resemble the absorption spectra but with higher signal-to-noise ratio [62]. In our case, we performed PLE measurements to understand the correlation between PLE with PL and UV-vis absorption spectra. The measurement was done by fixing the detection wavelength of 410 ± 10 nm with varying excitation wavelengths ranging 225–400 nm. As shown in Figure 5a (black curve), the PLE spectrum displayed the two distinct peaks at 233 nm and 310 nm, which were consistent with the two absorption edges of the absorption spectrum (blue curve) [63]. The PLQY of 3 μM concentration of R6G solution in methanol has been found to be ~100% under visible excitation and can be used as the reference material to estimate the PLQY of other emissive materials [64]. The PLQY of MQDs was estimated using the following equation [65], which is presented in Figure 5b.
Φ M Q D s = Φ R e f   I M Q D s P L / A M Q D s I R e f P L / A R e f
Here, ΦMQDs is the QY of the MQDs to be measured, ΦRef is the QY of the reference, I M Q D s P L represents the PL intensity of the MQDs, I R e f P L represents the PL intensity of the reference, AMQDs is the absorption of the MQDs, and ARef is the absorption of the reference.
The maximum PLQY was estimated to be ~6.9% with 310 nm excitation, which is consistent with the PLE and PL results presented in Figure 5a. Furthermore, excitation wavelength (within UV, ranging from 230 nm to 390 nm) dependent PL spectra were obtained, which are broad in shape owing to the inhomogeneous size distribution of MQDs in aqueous solution [61,66], as shown in Figure 5c. Red shifts in the PL peak positions along with a decrease in intensity were observed for the excitation wavelengths from 310 nm to 390 nm, which may be due to the various sizes of the MQDs dispersed in the aqueous medium. Under the higher wavelength (lower energy) excitation, the small MQDs with a large band gap will be less excited, resulting in a lesser intensity due to the loss of emission at short wavelengths along with red-shifted peak positions and vice-versa. Remarkably, we observed a high intensity of the emission under excitation at ~ 230 nm and 310 nm, which may be due to most of the MQDs being excited under this illumination. This is quite consistent with our absorption, PLE, and PLQY results shown in Figure 5a,b.

4. Conclusions

The Ti2AlN MAX phase was prepared by two-steps annealing method at a significantly lower temperature than that used in previous methods. Furthermore, 2D MXene and MQDs were obtained that displayed efficient PL upon UV light absorption. The facile method of light emitting MQDs reported here will help expand the use of MXene and MQDs in nanophotonic applications.

Author Contributions

Experimentation, methodology, formal analysis, original draft preparation, S.A. Manuscript review, data analysis and editing, funding acquisition, S.R. SEM characterization, T.T.T. Manuscript review and editing, J.S. Spectroscopy setup, A.S.S. Supervision, project administration, funding acquisition, resources, J.K. All authors have read and agreed to the published version of the manuscript.

Funding

J.K. acknowledges the financial support from the National Research Foundation of Korea (2021R1A6A1A03039696; 2022R1A2C2A009412). S.R. acknowledges the financial support from the National Research Foundation of Korea (2019R1I1A1A01062630).

Conflicts of Interest

The authors declare no conflict of interest.

References

  1. Joelsson, T.; Hörling, A.; Birch, J.; Hultman, J. Single-crystal Ti2AlN thin films. Appl. Phys. Lett. 2005, 86, 111913. [Google Scholar] [CrossRef]
  2. Liu, W.; Qiu, C.; Zhou, J.; Ding, Z.; Zhou, X.; Du, S.; Han, Y.H.; Huang, Q. Fabrication of Ti2AlN ceramics with orientation growth behavior by the microwave sintering method. J. Eur. Ceram. Soc. 2015, 35, 1385–1391. [Google Scholar] [CrossRef]
  3. Li, M.; Lu, J.; Luo, k.; Li, Y.; Chang, K.; Chen, K.; Zhou, J.; Rosen, J.; Hultman, L.; Eklund, P.; et al. Element Replacement Approach by Reaction with Lewis Acidic Molten Salts to Synthesize Nanolaminated MAX Phases and MXenes. J. Am. Chem. Soc. 2019, 141, 4730–4737. [Google Scholar] [CrossRef] [Green Version]
  4. Salvo, C.; Chicardi, E.; Poyato, R.; García-Garrido, C.; Jiménez, J.A.; López-Pernía, C.; Tobosque, P.; Mangalaraja, R.V. Synthesis and characterization of a nearly single bulk Ti2AlN max phase obtained from Ti/AlN powder mixture through spark plasma sintering. Materials 2021, 14, 2217. [Google Scholar] [CrossRef] [PubMed]
  5. Sokol, M.; Natu, V.; Kota, S.; Barsoum, M.W. On the Chemical Diversity of the MAX Phases. Trends Chem. 2019, 1, 210–223. [Google Scholar] [CrossRef]
  6. Li, X.; Gonzalez-Julian, J.; Malzbender, J. Fabrication and mechanical performance of Ti2AlN prepared by FAST/SPS. J. Eur. Ceram. Soc. 2020, 40, 4445–4453. [Google Scholar] [CrossRef]
  7. Wang, X.H.; Zhou, Y.C. Layered Machinable and Electrically Conductive Ti2AlC and Ti3AlC2 Ceramics: A Review. J. Mater. Sci. Technol. 2010, 26, 385–416. [Google Scholar] [CrossRef]
  8. Sun, Z.; Music, D.; Ahuja, R.; Schneider, J.M. Ab initio study of M2AlN (M = Ti, V, Cr). J. Phys. Condens. Matter. 2005, 17, L15–L19. [Google Scholar] [CrossRef]
  9. Gao, J.; Li, C.; Wang, N.; Du, Z. Thermodynamic analysis of the Ti-Al-N system. J. Univ. Sci. Technol. Beijing 2008, 15, 420–424. [Google Scholar] [CrossRef]
  10. Soundiraraju, B.; George, B.K. Two-Dimensional Titanium Nitride (Ti2N) MXene: Synthesis, Characterization, and Potential Application as Surface-Enhanced Raman Scattering Substrate. ACS Nano 2017, 11, 8892–8900. [Google Scholar] [CrossRef]
  11. Din, M.F.U.; Yang, C.; Tang, Y.; Tian, Y.; Luo, Y.; Wu, Y.; Que, W. Efficient and cost-effective method to synthesize highly purified Ti4AlN3 and Ti2AlN. J. Adv. Dielectr. 2019, 9, 1950008. [Google Scholar] [CrossRef] [Green Version]
  12. Kovalev, D.Y.; Luginina, M.A.; Sytschev, A.E. Reaction synthesis of the Ti2AlN MAX-phase. Russ. J. Non-Ferrous Met. 2017, 58, 303–307. [Google Scholar] [CrossRef]
  13. Kondakov, A.A.; Studenikin, I.A.; Linde, A.V.; Kondakova, N.A.; Grachev, V.V. Synthesis of Ti2AlN MAX-phase by sintering in vacuum. IOP Conf. Ser. Mater. Sci. Eng. 2019, 558, 012017. [Google Scholar] [CrossRef]
  14. Ding, H.; Li, Y.; Lu, J.; Chen, K.; Li, M.; Persson, P.O.A.; Hultman, L.; Eklund, P.; Du, S.; Huang, Z.; et al. Synthesis of MAX phases Nb2CuC and Ti2(Al0.1Cu0.9)N by A-site replacement reaction in molten salts. Mater. Res. Lett. 2019, 7, 510–516. [Google Scholar] [CrossRef] [Green Version]
  15. Roy, C.; Banerjee, P.; Bhattacharyya, S. Molten salt shielded synthesis (MS3) of Ti2AlN and V2AlC MAX phase powders in open air. J. Eur. Ceram. Soc. 2020, 40, 923–929. [Google Scholar] [CrossRef]
  16. Dash, A.; Vaßen, R.; Guillon, O.; Gonzalez-Julian, J. Molten salt shielded synthesis of oxidation prone materials in air. Nat. Mater. 2019, 18, 465–470. [Google Scholar] [CrossRef]
  17. Scabarozi, T.; Ganguly, A.; Hettinger, J.D.; Loflan, S.E.; Amini, S.; Finkel, P.; El-Raghy, T.; Barsoum, M.W. Electronic and thermal properties of Ti3Al (C0.5, N0.5)2, Ti2Al (C0.5, N0.5) and Ti2AlN. J. Appl. Phys. 2008, 104, 073713. [Google Scholar] [CrossRef]
  18. Gonzalez-Julian, J. Processing of MAX phases: From synthesis to applications. J. Am. Ceram. Soc. 2021, 104, 659–690. [Google Scholar] [CrossRef]
  19. Barsoum, M.W.; Ali, M.; El-Raghy, T. Processing and characterization of Ti2AlC, Ti2AlN, and Ti2AlC0.5N0.5. Metall. Mater. Trans. A 2000, 31, 1857–1865. [Google Scholar] [CrossRef]
  20. Lane, N.J.; Vogel, S.C.; Barsoum, M.W. Temperature-dependent crystal structures of Ti2AlN and Cr2GeC as determined from high temperature neutron diffraction. J. Am. Ceram. Soc. 2011, 94, 3473–3479. [Google Scholar] [CrossRef]
  21. Lin, Z.J.; Zhuo, M.J.; Li, M.S.; Wang, J.Y.; Zhou, Y.C. Synthesis and microstructure of layered-ternary Ti2AlN ceramic. Scr. Mater. 2007, 56, 1115–1118. [Google Scholar] [CrossRef]
  22. Ming, Y.; Yan-lin, C.; Bing-chu, M.; Jiao-qun, Z. Synthesis of high-purity Ti2AlN ceramic by hot pressing. Trans. Nonferrous Met. Soc. China 2008, 18, 82–85. [Google Scholar]
  23. Lyu, J.; Kashkarov, E.B.; Travitzky, N.; Syrtanov, M.S.; Lider, A.M. Sintering of MAX-phase materials by spark plasma and other methods. J. Mater. Sci. 2021, 56, 1980–2015. [Google Scholar] [CrossRef]
  24. Cui, B.; Sa, R.; Jayaseelan, D.D.; Inam, F.; Reece, M.J.; Lee, W.E. Microstructural evolution during high-temperature oxidation of spark plasma sintered Ti2AlN ceramics. Acta Mater. 2012, 60, 1079–1092. [Google Scholar] [CrossRef] [Green Version]
  25. Jordan, J.L.; Thadhani, N.N. Effect of Shock-Activation on Post-shock Reaction Synthesis of Ternary Ceramics. AIP Conf. Proc. 2002, 620, 1097–1100. [Google Scholar]
  26. Shao, J.; Zhang, J.; Jiang, C.; Lin, J.; Huang, P. Biodegradable titanium nitride MXene quantum dots for cancer phototheranostics in NIR-I/II biowindows. Chem. Eng. J. 2020, 400, 126009. [Google Scholar] [CrossRef]
  27. Chung, S.; Revia, R.A.; Zhang, M. Graphene Quantum Dots and Their Applications in Bioimaging, Biosensing, and Therapy. Adv. Mater. 2021, 33, 1904362. [Google Scholar] [CrossRef]
  28. Ding, X.; Peng, F.; Zhou, J.; Gong, W.; Slaven, G.; Loh, K.P.; Lim, C.T.; Leong, D.T. Defect engineered bioactive transition metals dichalcogenides quantum dots. Nat. Commun. 2019, 10, 41. [Google Scholar] [CrossRef]
  29. Xu, Y.; Yan, L.; Li, X.; Xu, H. Fabrication of transition metal dichalcogenides quantum dots based on femtosecond laser ablation. Sci. Rep. 2019, 9, 2931. [Google Scholar] [CrossRef]
  30. Roy, S.; Neupane, G.P.; Dhakal, K.P.; Lee, J.B.; Yun, S.J.; Han, G.H.; Kim, J.K. Observation of charge transfer in heterostructures composed of MoSe2 quantum dots and a monolayer of MoS2 or WSe2. J. Phys. Chem. C 2017, 121, 1997–2007. [Google Scholar] [CrossRef]
  31. Soleymaniha, M.; Shahbazi, M.A.; Rafieerad, A.R.; Maleki, A.; Amiri, A. Promoting Role of MXene Nanosheets in Biomedical Sciences: Therapeutic and Biosensing Innovations. Adv. Healthc. Mater. 2019, 8, 1801137. [Google Scholar] [CrossRef] [PubMed] [Green Version]
  32. Naguib, M.; Mochalin, V.N.; Barsoum, M.W.; Gogotsi, Y. 25th anniversary article: MXenes: A new family of two-dimensional materials. Adv. Mater. 2014, 26, 992–1005. [Google Scholar] [CrossRef] [PubMed]
  33. Yang, G.; Zhao, J.; Yi, S.; Wan, X.; Tang, J. Biodegradable and photostable Nb2C MXene quantum dots as promising nanofluorophores for metal ions sensing and fluorescence imaging. Sens. Actuators B Chem. 2020, 309, 127735. [Google Scholar] [CrossRef]
  34. Desai, M.L.; Basu, H.; Singhal, R.K.; Saha, S.; Kailasa, S.K. Ultra-small two dimensional MXene nanosheets for selective and sensitive fluorescence detection of Ag+ and Mn2+ ions. Colloids Surf. A 2019, 565, 70–77. [Google Scholar] [CrossRef]
  35. Xue, Q.; Zhang, H.; Zhu, M.; Pei, Z.; Li, H.; Wang, Z.; Huang, Y.; Huang, Y.; Deng, Q.; Zhou, J.; et al. Photoluminescent Ti3C2 MXene Quantum Dots for Multicolor Cellular Imaging. Adv. Mater. 2017, 29, 1604847. [Google Scholar] [CrossRef] [PubMed]
  36. Zhang, Q.; Sun, Y.; Liu, M.; Liu, Y. Selective detection of Fe3+ ions based on fluorescence MXene quantum dots via a mechanism integrating electron transfer and inner filter effect. Nanoscale 2020, 12, 1826–1832. [Google Scholar] [CrossRef]
  37. Yong, K.-T.; Law, W.-C.; Hu, R.; Ye, L.; Liu, L.; Swihart, M.T.; Prasad, P.N. Nanotoxicity assessment of quantum dots: From cellular to primate studies. Chem. Soc. Rev. 2013, 42, 1236–1250. [Google Scholar] [CrossRef]
  38. Hoshino, A.; Hanada, S.; Yamamoto, K. Toxicity of nanocrystal quantum dots: The relevance of surface modifications. Arch. Toxicol. 2011, 85, 707–720. [Google Scholar] [CrossRef]
  39. Ai, F.; Fu, C.; Cheng, G.; Zhang, H.; Feng, Y.; Yan, X.; Zheng, X. Amino-Functionalized Ti3C2 MXene Quantum Dots as Photoluminescent Sensors for Diagnosing Histidine in Human Serum. ACS Appl. Nano Mater. 2021, 4, 8192–8199. [Google Scholar] [CrossRef]
  40. Guan, Q.; Ma, J.; Yang, W.; Zhang, R.; Zhang, X.; Dong, X.; Fan, Y.; Cai, L.; Cao, Y.; Zhang, Y.; et al. Highly fluorescent Ti3C2 MXene quantum dots for macrophage labeling and Cu2+ ion sensing. Nanoscale 2019, 11, 14123–14133. [Google Scholar] [CrossRef]
  41. Miao, S.; Chen, D.; Madani, A.; Jorgensen, M.R.; Bolaños Quiñones, V.A.; Ma, L.; Hickey, S.G.; Eychmüller, A.; Schmidt, O.G. Optofluidic Sensor: Evaporation Kinetics Detection of Solvents Dissolved with Cd3P2 Colloidal Quantum Dots in a Rolled-Up Microtube. Ade. Opt. Mater. 2015, 3, 187–193. [Google Scholar] [CrossRef]
  42. Madani, A.; Ma, L.; Miao, S.; Jorgensen, M.R.; Schmidt, O.G. Luminescent nanoparticles embedded in TiO2 microtube cavities for the activation of whispering-gallery-modes extending from the visible to the near infrared. Nanoscale 2016, 8, 9498–9503. [Google Scholar] [CrossRef] [PubMed]
  43. Wang, C.; Chen, Q.; Chen, H.; Liu, J.; Song, Y.; Liu, J.; Li, D.; Ge, Y.; Gong, Y.; Zhang, Y.; et al. Boron quantum dots all-optical modulator based on efficient photothermal effect. Opto-Electron. Adv. 2021, 4, 200032. [Google Scholar] [CrossRef]
  44. Yang, F.; Ge, Y.; Yin, T.; Guo, J.; Zhang, F.; Tang, X.; Qiu, M.; Liang, W.; Xu, N.; Wang, C.; et al. Ti3C2Tx MXene Quantum Dots with Enhanced Stability for Ultrafast Photonics. ACS Appl. Nano Mater. 2020, 3, 11850–11860. [Google Scholar] [CrossRef]
  45. Sharbirin, A.S.; Akhtar, S.; Kim, J.Y. Light-emitting MXene quantum dots. Opto-Electron. Adv. 2021, 4, 200077. [Google Scholar] [CrossRef]
  46. Huang, D.; Xie, Y.; Lu, D.; Wang, Z.; Wang, J.; Yu, H.; Zhang, H. Demonstration of a White Laser with V2C MXene-Based Quantum Dots. Adv. Mater. 2019, 31, 1901117. [Google Scholar] [CrossRef]
  47. Venkatkarthick, R.; Rodthongkum, N.; Zhang, X.; Wang, S.; Pattananuwat, P.; Zhao, Y.; Liu, R.; Qin, J. Vanadium-Based Oxide on Two-Dimensional Vanadium Carbide MXene (V2Ox@V2CTx) as Cathode for Rechargeable Aqueous Zinc-Ion Batteries. ACS Appl. Energy Mater. 2020, 3, 4677–4689. [Google Scholar] [CrossRef]
  48. Salvo, C.; Chicardi, E.; García-Garrido, C.; Poyato, R.; Jiménez, J.A.; Mangalaraja, R.V. Study of the Influence of Sintering Atmosphere and Mechanical Activation on the Synthesis of Bulk Ti2AlN MAX Phase Obtained by Spark Plasma Sintering. Materials 2021, 14, 4574. [Google Scholar] [CrossRef]
  49. Tunca, B.; Lapauw, T.; Delville, R.; Neuville, D.R.; Hennet, L.; Thiaudière, D.; Ouisse, T.; Hadermann, J.; Vleugels, J.; Lambrinou, K. Synthesis and Characterization of Double Solid Solution (Zr,Ti)2(Al,Sn)C MAX Phase Ceramics. Inorg. Chem. 2019, 58, 6669–6683. [Google Scholar] [CrossRef]
  50. Wang, Z.; Liu, J.; Wang, L.; Li, X.; Ke, P.; Wang, A. Dense and high-stability Ti2AlN MAX phase coatings prepared by the combined cathodic arc/sputter technique. Appl. Surf. Sci. 2017, 396, 1435–1442. [Google Scholar] [CrossRef]
  51. Chen, W.; Tang, J.; Lin, X.; Ai, Y.; Ye, N. Formation mechanism of high-purity Ti2AlN powders under microwave sintering. Materials 2020, 13, 5356. [Google Scholar] [CrossRef] [PubMed]
  52. Presser, V.; Naguib, M.; Chaput, L.; Togo, A.; Hug, G.; Barsoum, M.W. First-order Raman scattering of the MAX phases: Ti2AlN, Ti2AlC0.5N0.5, Ti2AlC, (Ti0.5V0.5)2AlC, V2AlC, Ti3AlC2, and Ti3GeC2. J. Raman Spectrosc. 2012, 43, 168–172. [Google Scholar] [CrossRef]
  53. Spanier, J.E.; Gupta, S.; Amer, M.; Barsoum, M.W. Vibrational behavior of the Mn+1AXn phases from first-order Raman scattering (M = Ti, V, Cr, A = Si, X = C, N). Phys. Rev. B 2005, 71, 012103. [Google Scholar] [CrossRef] [Green Version]
  54. Gröner, L.; Lutz, K.; Sabine, O.; Alexander, F.; Marco, W.; Frank, M.; Frank, B.; Chris, E. Microstructural investigations of polycrystalline Ti2AlN prepared by physical vapor deposition of Ti-AlN multilayers. Surf. Coat. Technol. 2018, 343, 166–171. [Google Scholar] [CrossRef]
  55. Szuplewska, A.; Rozmysłowska-Wojciechowska, A.; Poźniak, S.; Wojciechowski, T.; Birowska, M.; Popielski, M.; Chudy, M.; Ziemkowska, W.; Chlubny, L.; Moszczyńska, D.; et al. Multilayered stable 2D nano-sheets of Ti2NTx MXene: Synthesis, characterization, and anticancer activity. J. Nanobiotech. 2019, 17, 114. [Google Scholar] [CrossRef]
  56. Sandesh, S.; Shanbhag, G.V.; Halgeri, A.B. Transesterification of Glycerol to Glycerol Carbonate Using KF/Al2O3 Catalyst: The Role of Support and Basicity. Catal. Lett. 2013, 143, 1226–1234. [Google Scholar] [CrossRef]
  57. Jastrzebska, A.M.; Karwoska, E.; Wojciechowski, T.; Ziemkowska, W.; Rozmyslowska, A.; Chlubny, L.; Olszyna, A. The Atomic Structure of Ti2C and Ti3C2 MXenes is Responsible for Their Antibacterial Activity toward E. coli Bacteria. J. Mater. Eng. Perform. 2019, 28, 1272–1277. [Google Scholar] [CrossRef]
  58. Rozmysłowska-Wojciechowska, A.; Wojciechowski, T.; Ziemkowska, W.; Chlubny, L.; Olszyna, A.; Jastrzębska, A.M. Surface interactions between 2D Ti3C2/Ti2C MXenes and lysozyme. Appl. Surf. Sci. 2019, 473, 409–418. [Google Scholar] [CrossRef]
  59. Liu, Y.; Zhou, Q.; Yuan, Y.; Wu, Y. Hydrothermal synthesis of fluorescent carbon dots from sodium citrate and polyacrylamide and their highly selective detection of lead and pyrophosphate. Carbon 2017, 115, 550–560. [Google Scholar] [CrossRef]
  60. Huang, H.; Du, C.; Shi, H.; Feng, X.; Li, J.; Tan, Y.; Song, W. Water-Soluble Monolayer Molybdenum Disulfide Quantum Dots with Upconversion Fluorescence. Part. Part. Syst. Charact. 2015, 32, 72–79. [Google Scholar] [CrossRef]
  61. Jin, H.; Baek, B.; Kim, D.; Wu, F.; Batteas, J.D.; Cheon, J.; Son, D.H. Effects of Direct Solvent-Quantum Dot Interaction on the Optical Properties of Colloidal Monolayer WS2 Quantum Dots. Nano Lett. 2017, 17, 7471–7477. [Google Scholar] [CrossRef] [PubMed]
  62. Brocke, T. Electronic Raman Spectroscopy on Semiconductor Quantum Dots; Cuvillier Verlag: Göttingen, Germany, 2007; pp. 15–17. [Google Scholar]
  63. Sharbirin, A.S.; Roy, S.; Tran, T.T.; Akhtar, S.; Singh, J.; Duong, D.L.; Kim, J. Light-Emitting Ti2N (MXene) Quantum Dots: Synthesis, Characterization and Theoritical Calculations. J. Mater. Chem. C 2022. [Google Scholar] [CrossRef]
  64. Magde, D.; Wong, R.; Seybold, P.G. Fluorescence Quantum Yields and Their Relation to Lifetimes of Rhodamine 6G and Fluorescein in Nine Solvents: Improved Absolute Standards for Quantum Yields. Photochem. Photobiol. 2002, 75, 327–334. [Google Scholar] [CrossRef]
  65. Roy, S.; Sharbirin, A.S.; Lee, Y.; Kim, W.B.; Kim, T.S.; Cho, K.; Kang, K.; Jung, H.S.; Kim, J. Measurement of quantum yields of monolayer TMDs using dye-dispersed PMMA thin films. Nanomaterials 2020, 10, 1032. [Google Scholar] [CrossRef] [PubMed]
  66. Pan, D.; Guo, L.; Zhang, J.; Xi, C.; Xue, Q.; Hunag, H.; Li, J.; Zhang, Z.; Yu, W.; Chen, z.; et al. Cutting sp2 clusters in graphene sheets into colloidal graphene quantum dots with strong green fluorescence. J. Mater. Chem. 2012, 22, 3314–3318. [Google Scholar] [CrossRef]
Figure 1. Schematic illustration of Ti2AlN MAX phase synthesis by step annealing method.
Applsci 12 04154 g001
Figure 2. (a) XRD pattern, (b) FE–SEM image, and (c) Raman spectrum of as-synthesized Ti2AlN MAX phase.
Applsci 12 04154 g002
Figure 3. (a) XRD pattern, (b) FE–SEM image, (c) Raman spectrum of the layered Ti2N MXene sheets.
Applsci 12 04154 g003
Figure 4. HR–TEM images (a) low, (b) high magnification, inset FFT image and (c) size distribution curve of the synthesized Ti2N MQDs.
Applsci 12 04154 g004
Figure 5. (a) UV-visible, PLE and PL spectra. Excitation wavelength dependent (b) PLQY and (c) PL spectra of the synthesized Ti2N MQDs.
Applsci 12 04154 g005
Table 1. Crystallographic details on structural determination of as-synthesized Ti2AlN MAX phase.
Ti2AlNJCPDS-00-055-0434As-Synthesized
Unit cell dimension (Å)a = 2.989
c = 13.614
a = 2.995
c = 13.593
Cell volume (Å)3105.33105.63
Publisher’s Note: MDPI stays neutral with regard to jurisdictional claims in published maps and institutional affiliations.

