
Research on an Improved SOM Model for Damage Identification of Concrete Structures

Abstract
:1. Introduction
2. Self-Organizing Map
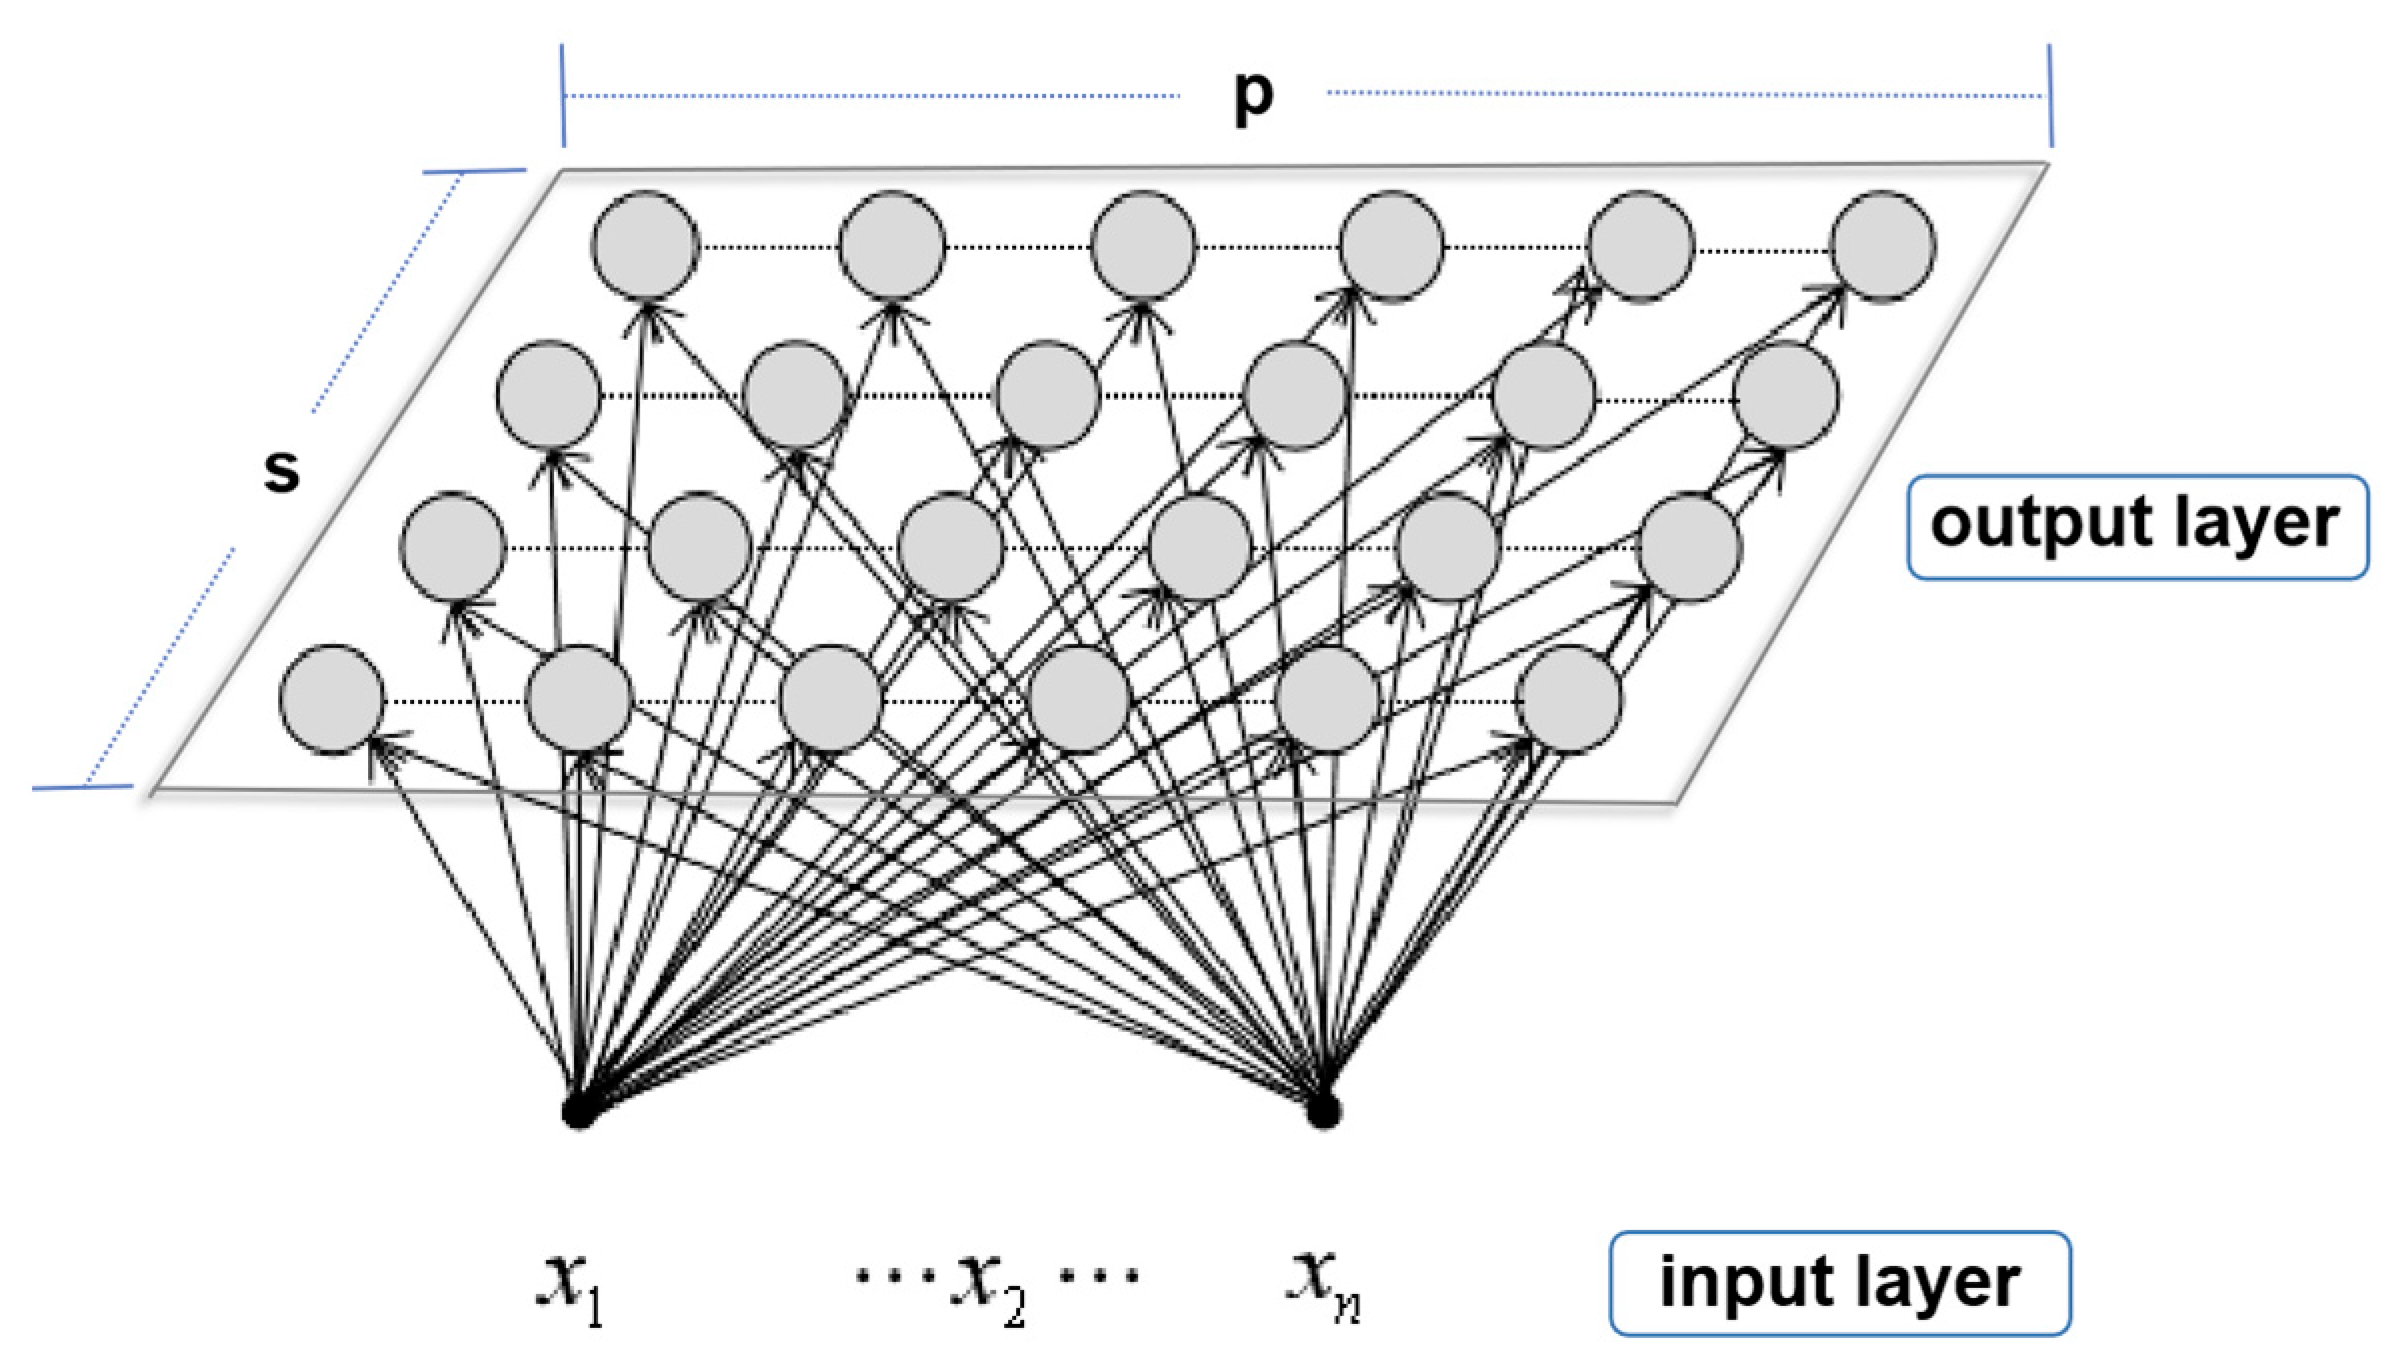
2.1. Network Structure
2.2. Network Algorithm
- I.
- Initialize. Generally, the weight vector will be given any value in the interval [0, 1], represented by . The learning rate is .
- II.
- Set input vector input. The input vector is the network model training sample:
- III.
- Derive Euclidean Distance. represents the weight between the input layer neuron i, and the mapping layer neuron j. Derive the Euclidean distance between the input vector and the weight vector to get the specific position of the neuron. The Euclidean distance is calculated as:
- IV.
- Label the winning neuron. The winning neuron position is the position of the neuron with the minimum Euclidean distance between the input vector and the weight vector. The input vector is denoted by , the winning neuron is denoted by c, Then its calculation formula is:
- V.
- Adjust weights. Correct the input neuron and the neuron connection weights in the neighborhood according to Equation (3):
- VI.
- Calculate the output value :
3. Improved SOM Damage Identification Method
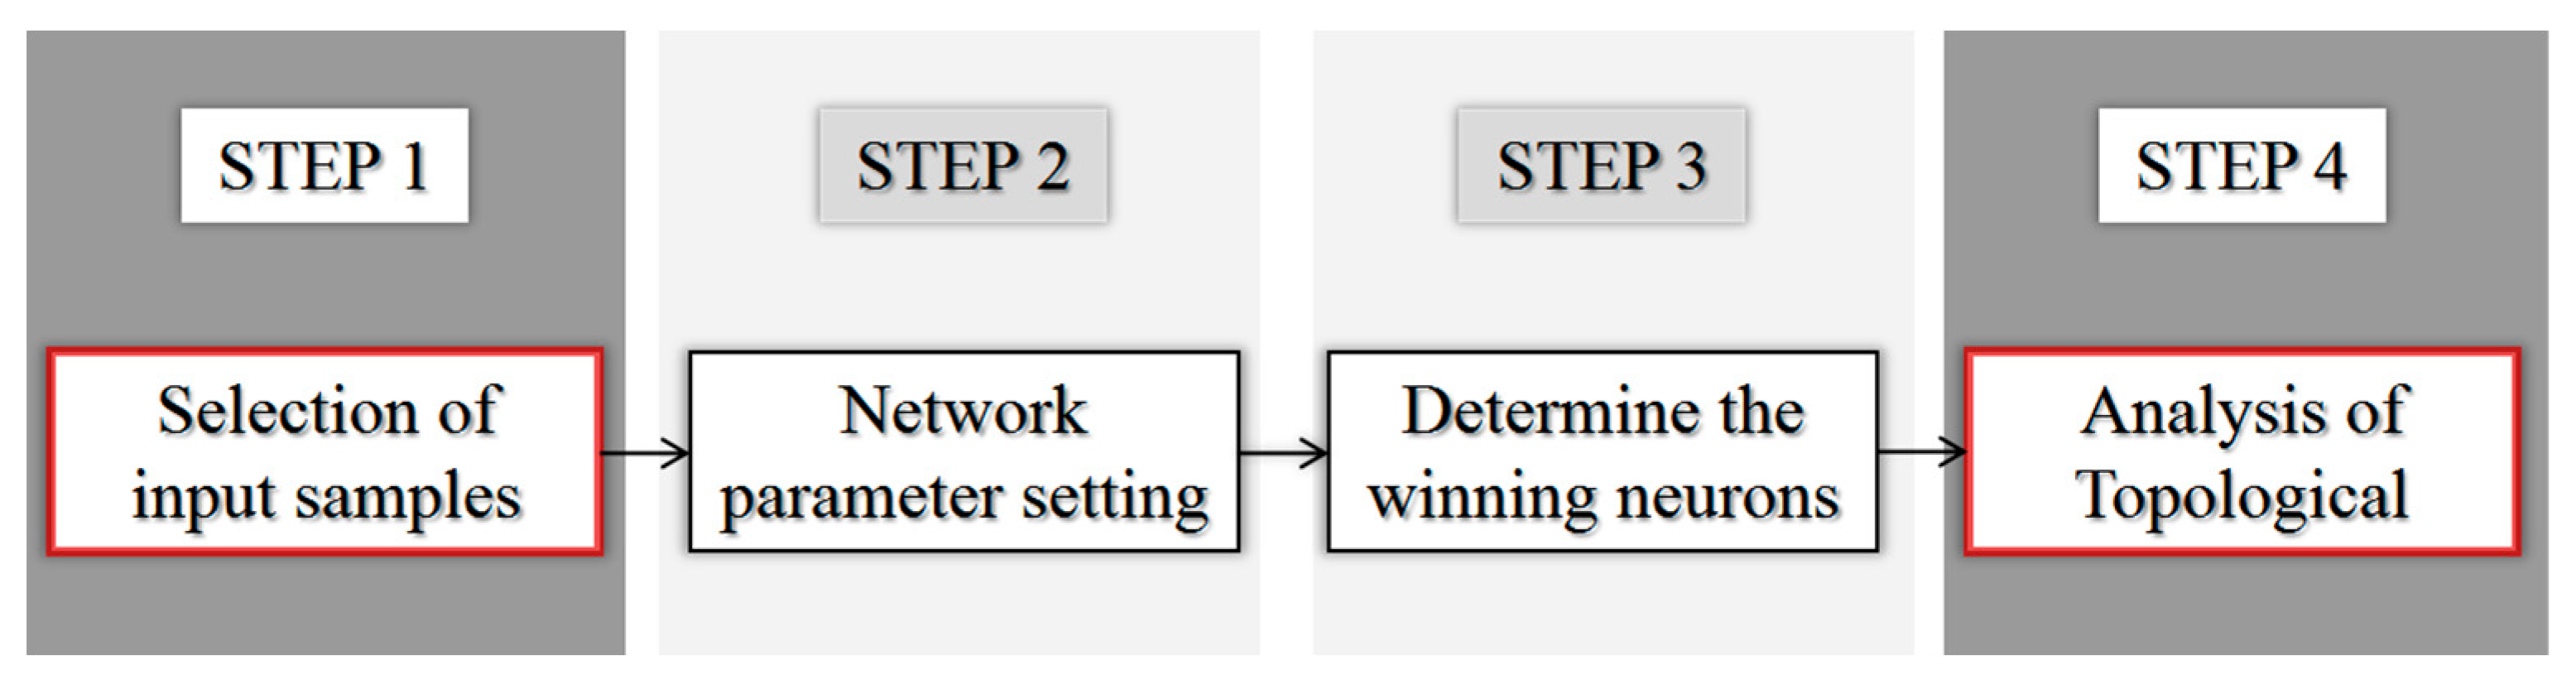
3.1. Construction of Damage Identification Model
3.2. SOM Improvement Method
- a.
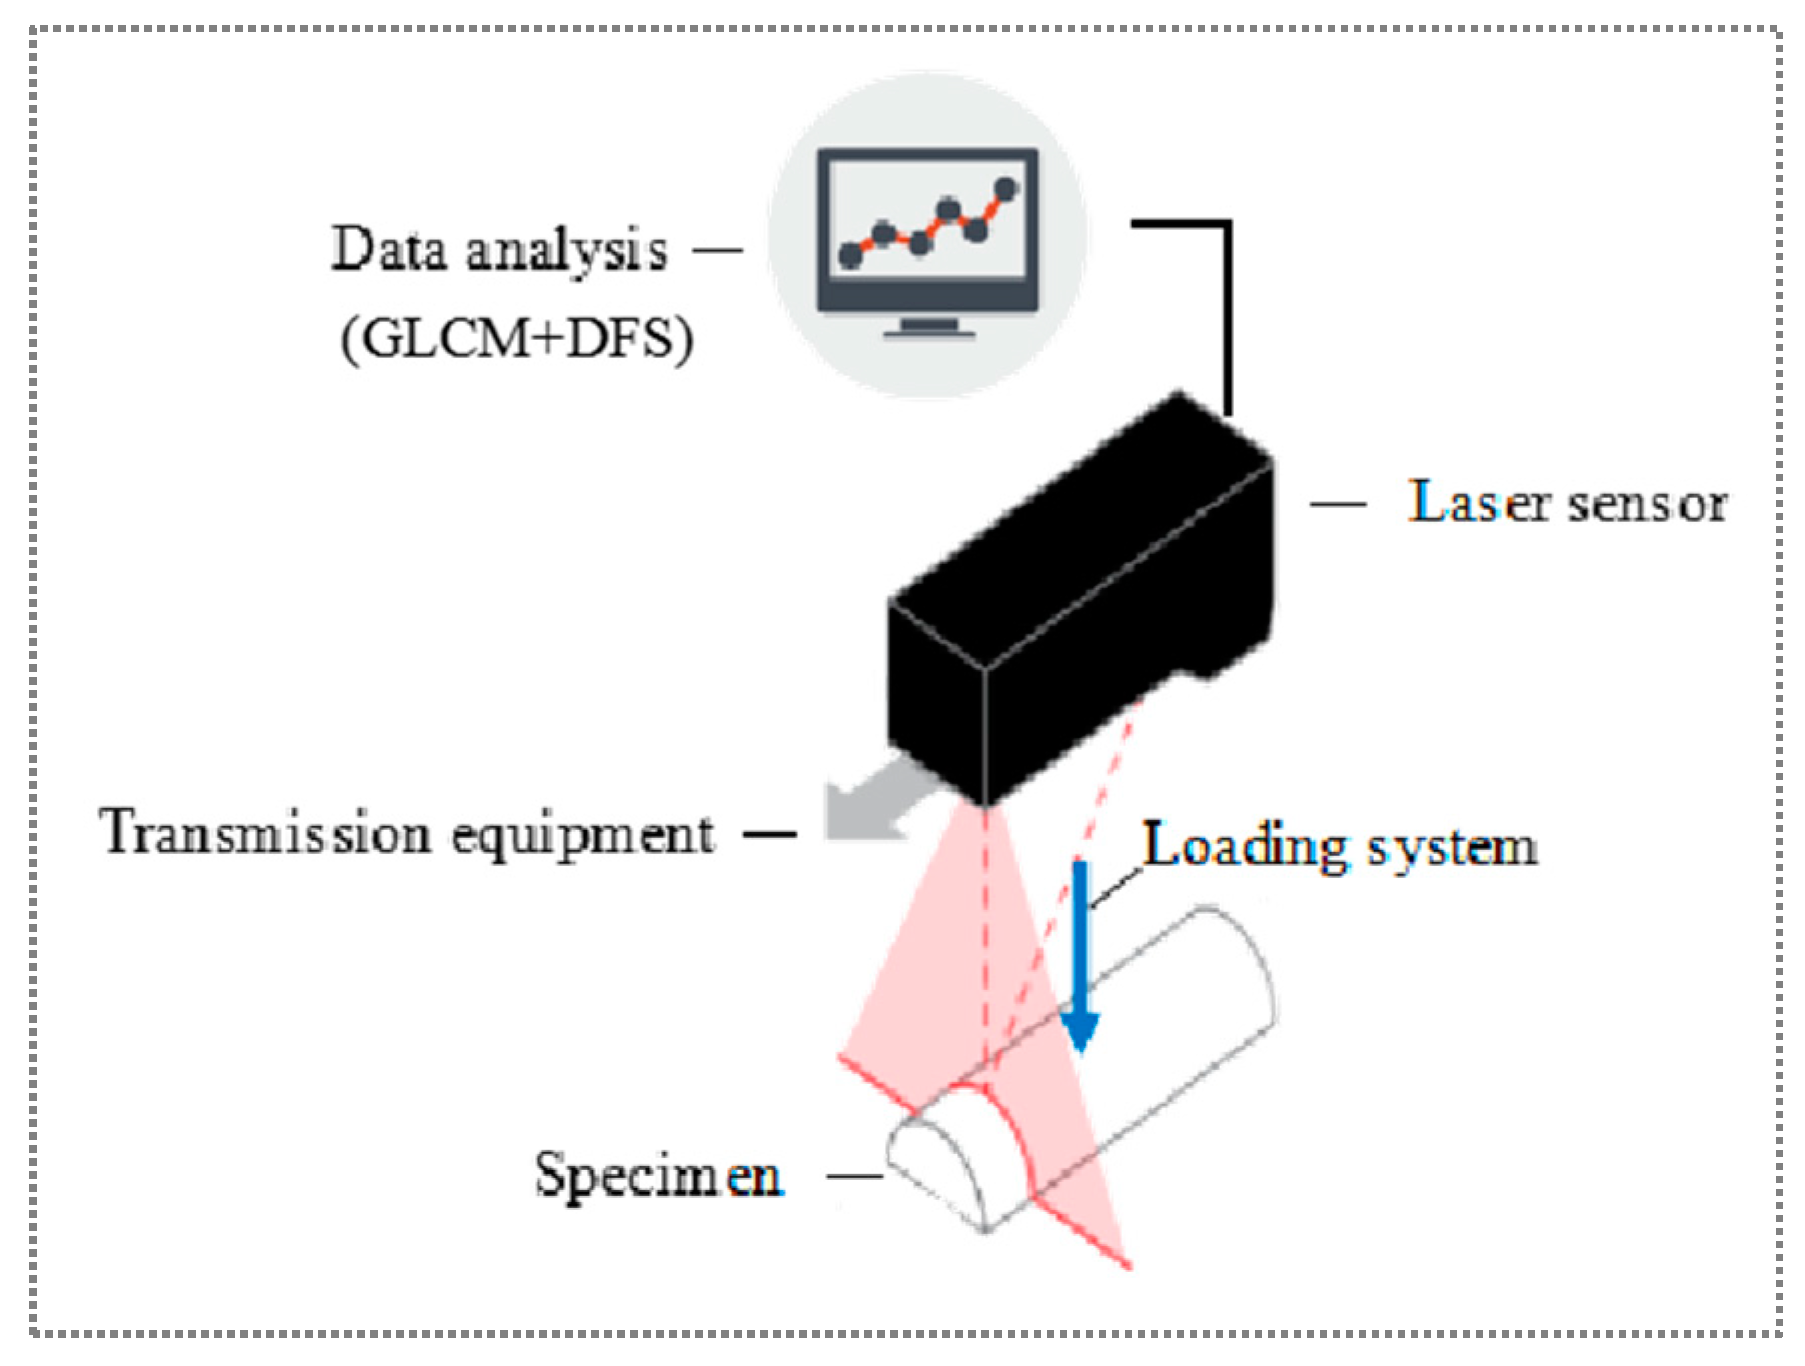
- Selection of input samples
- b.
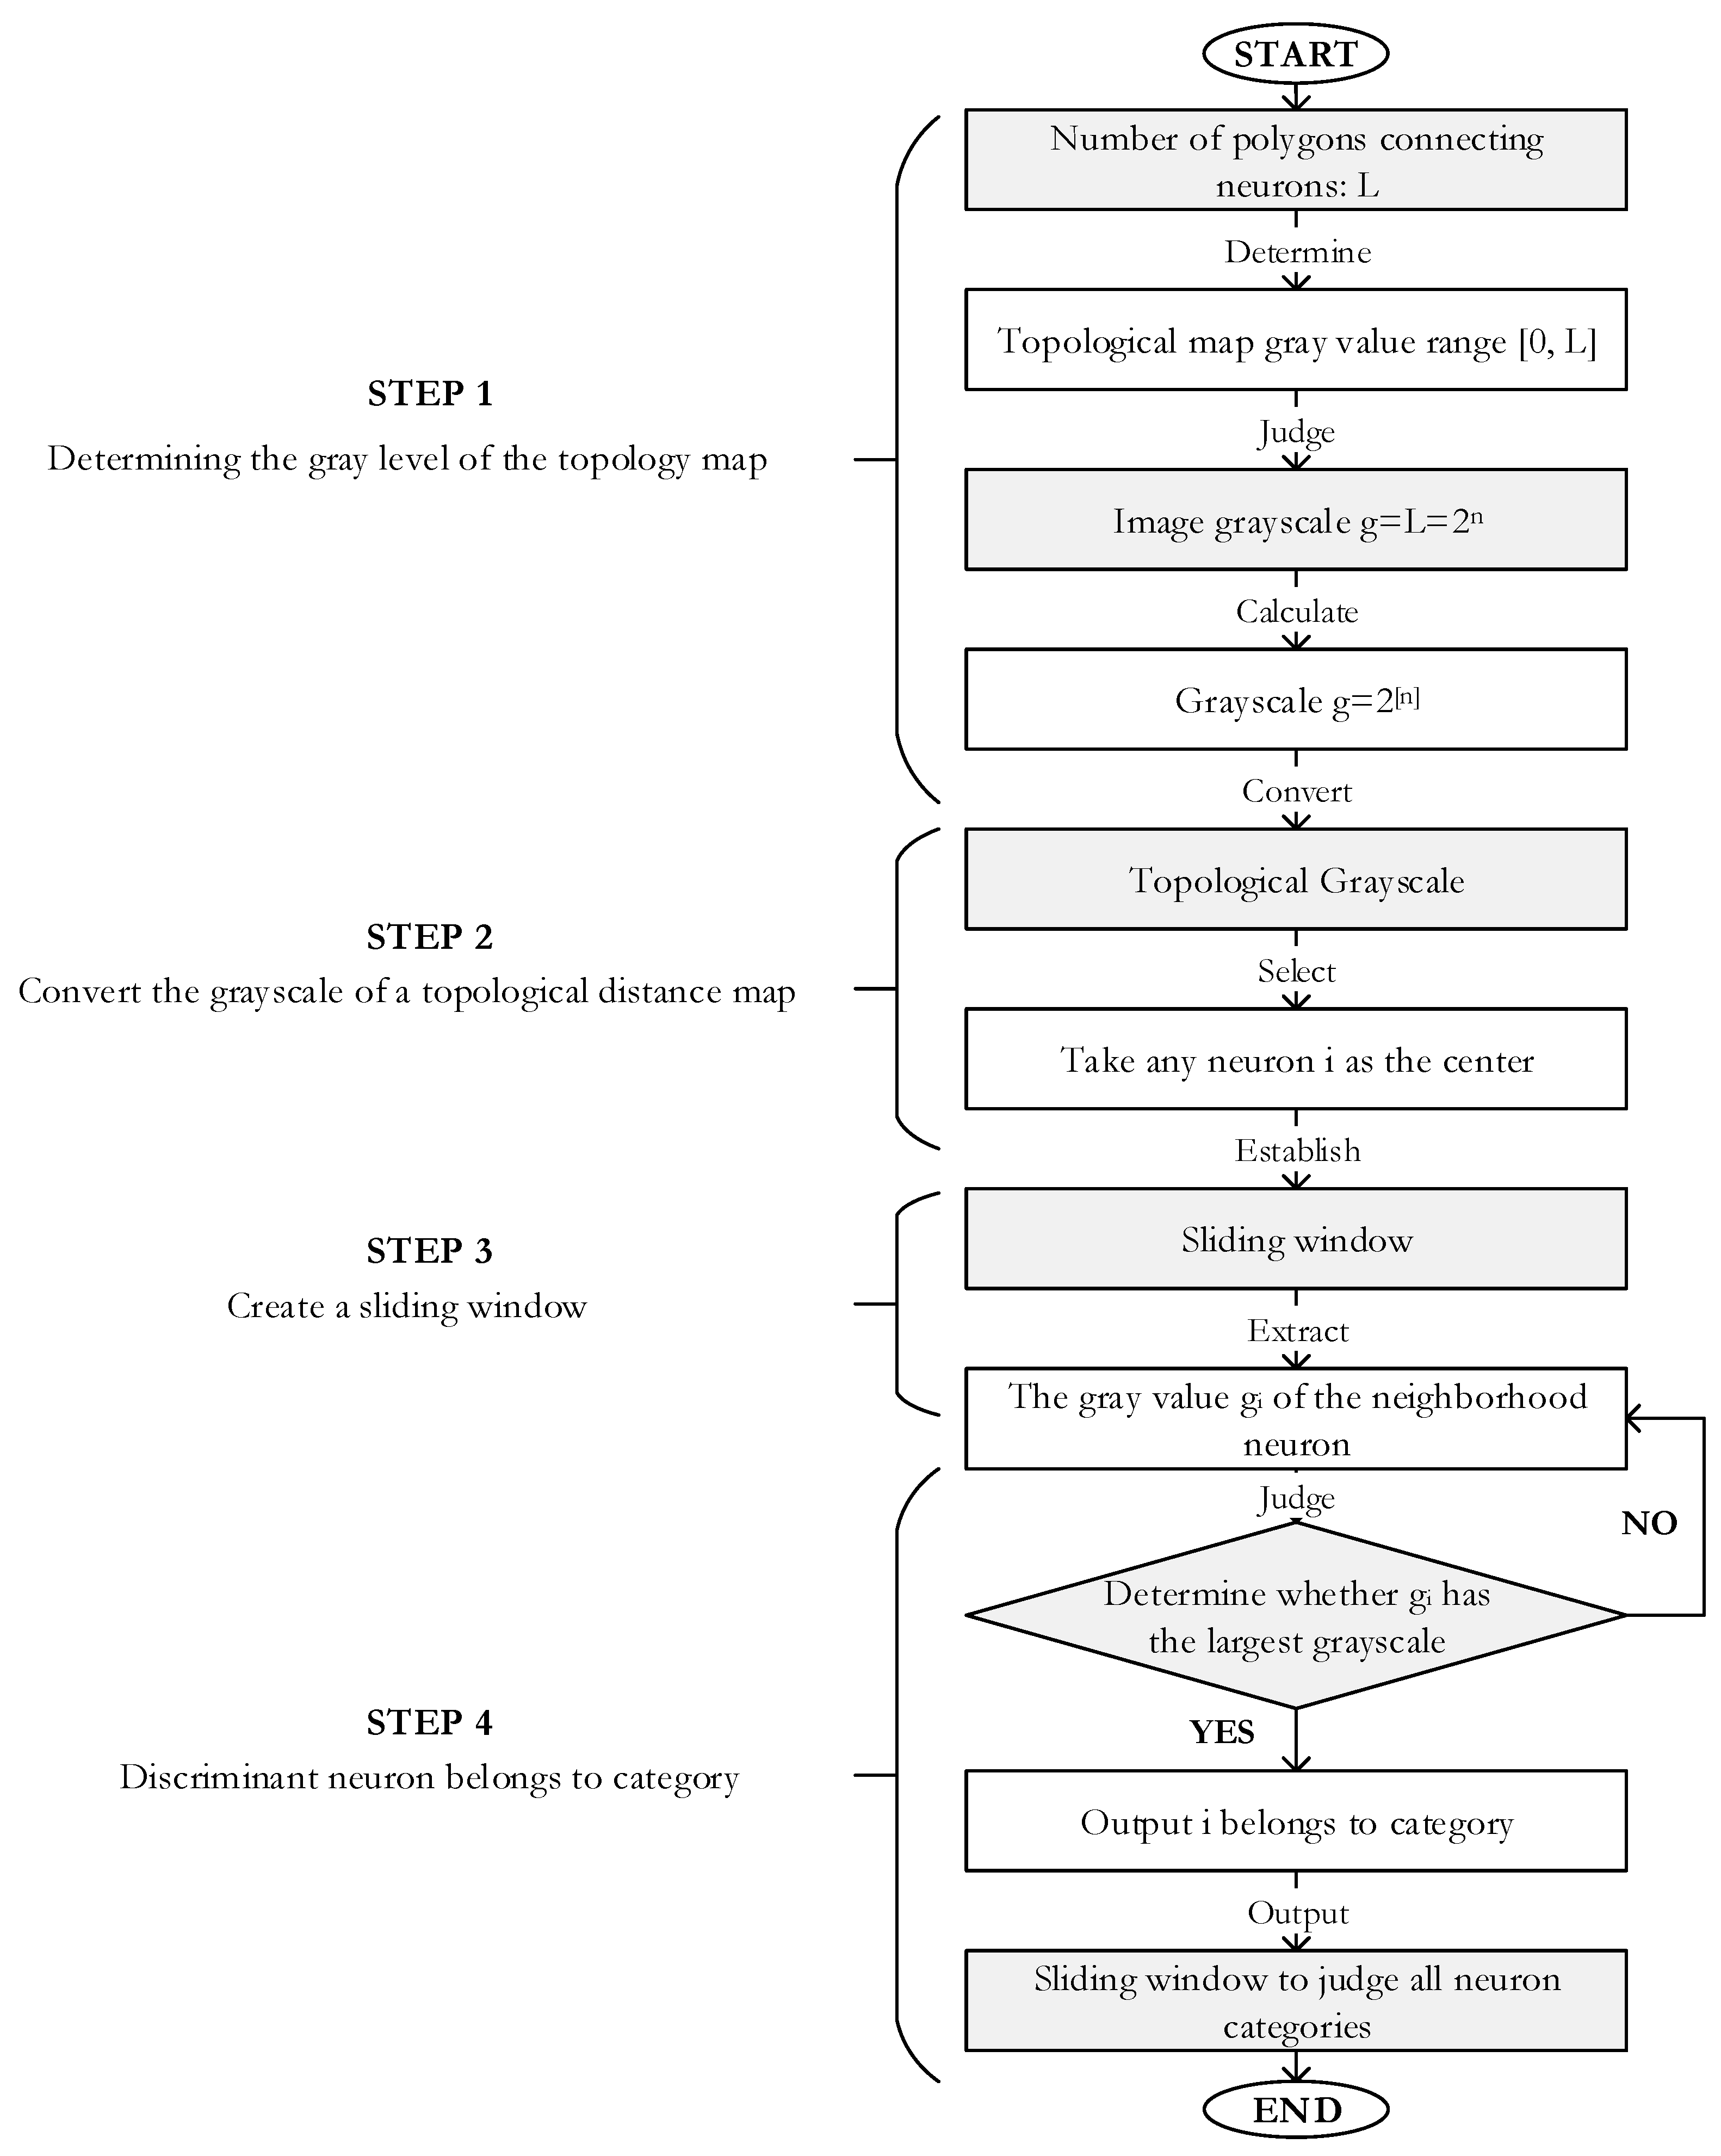
- Analysis of topology map
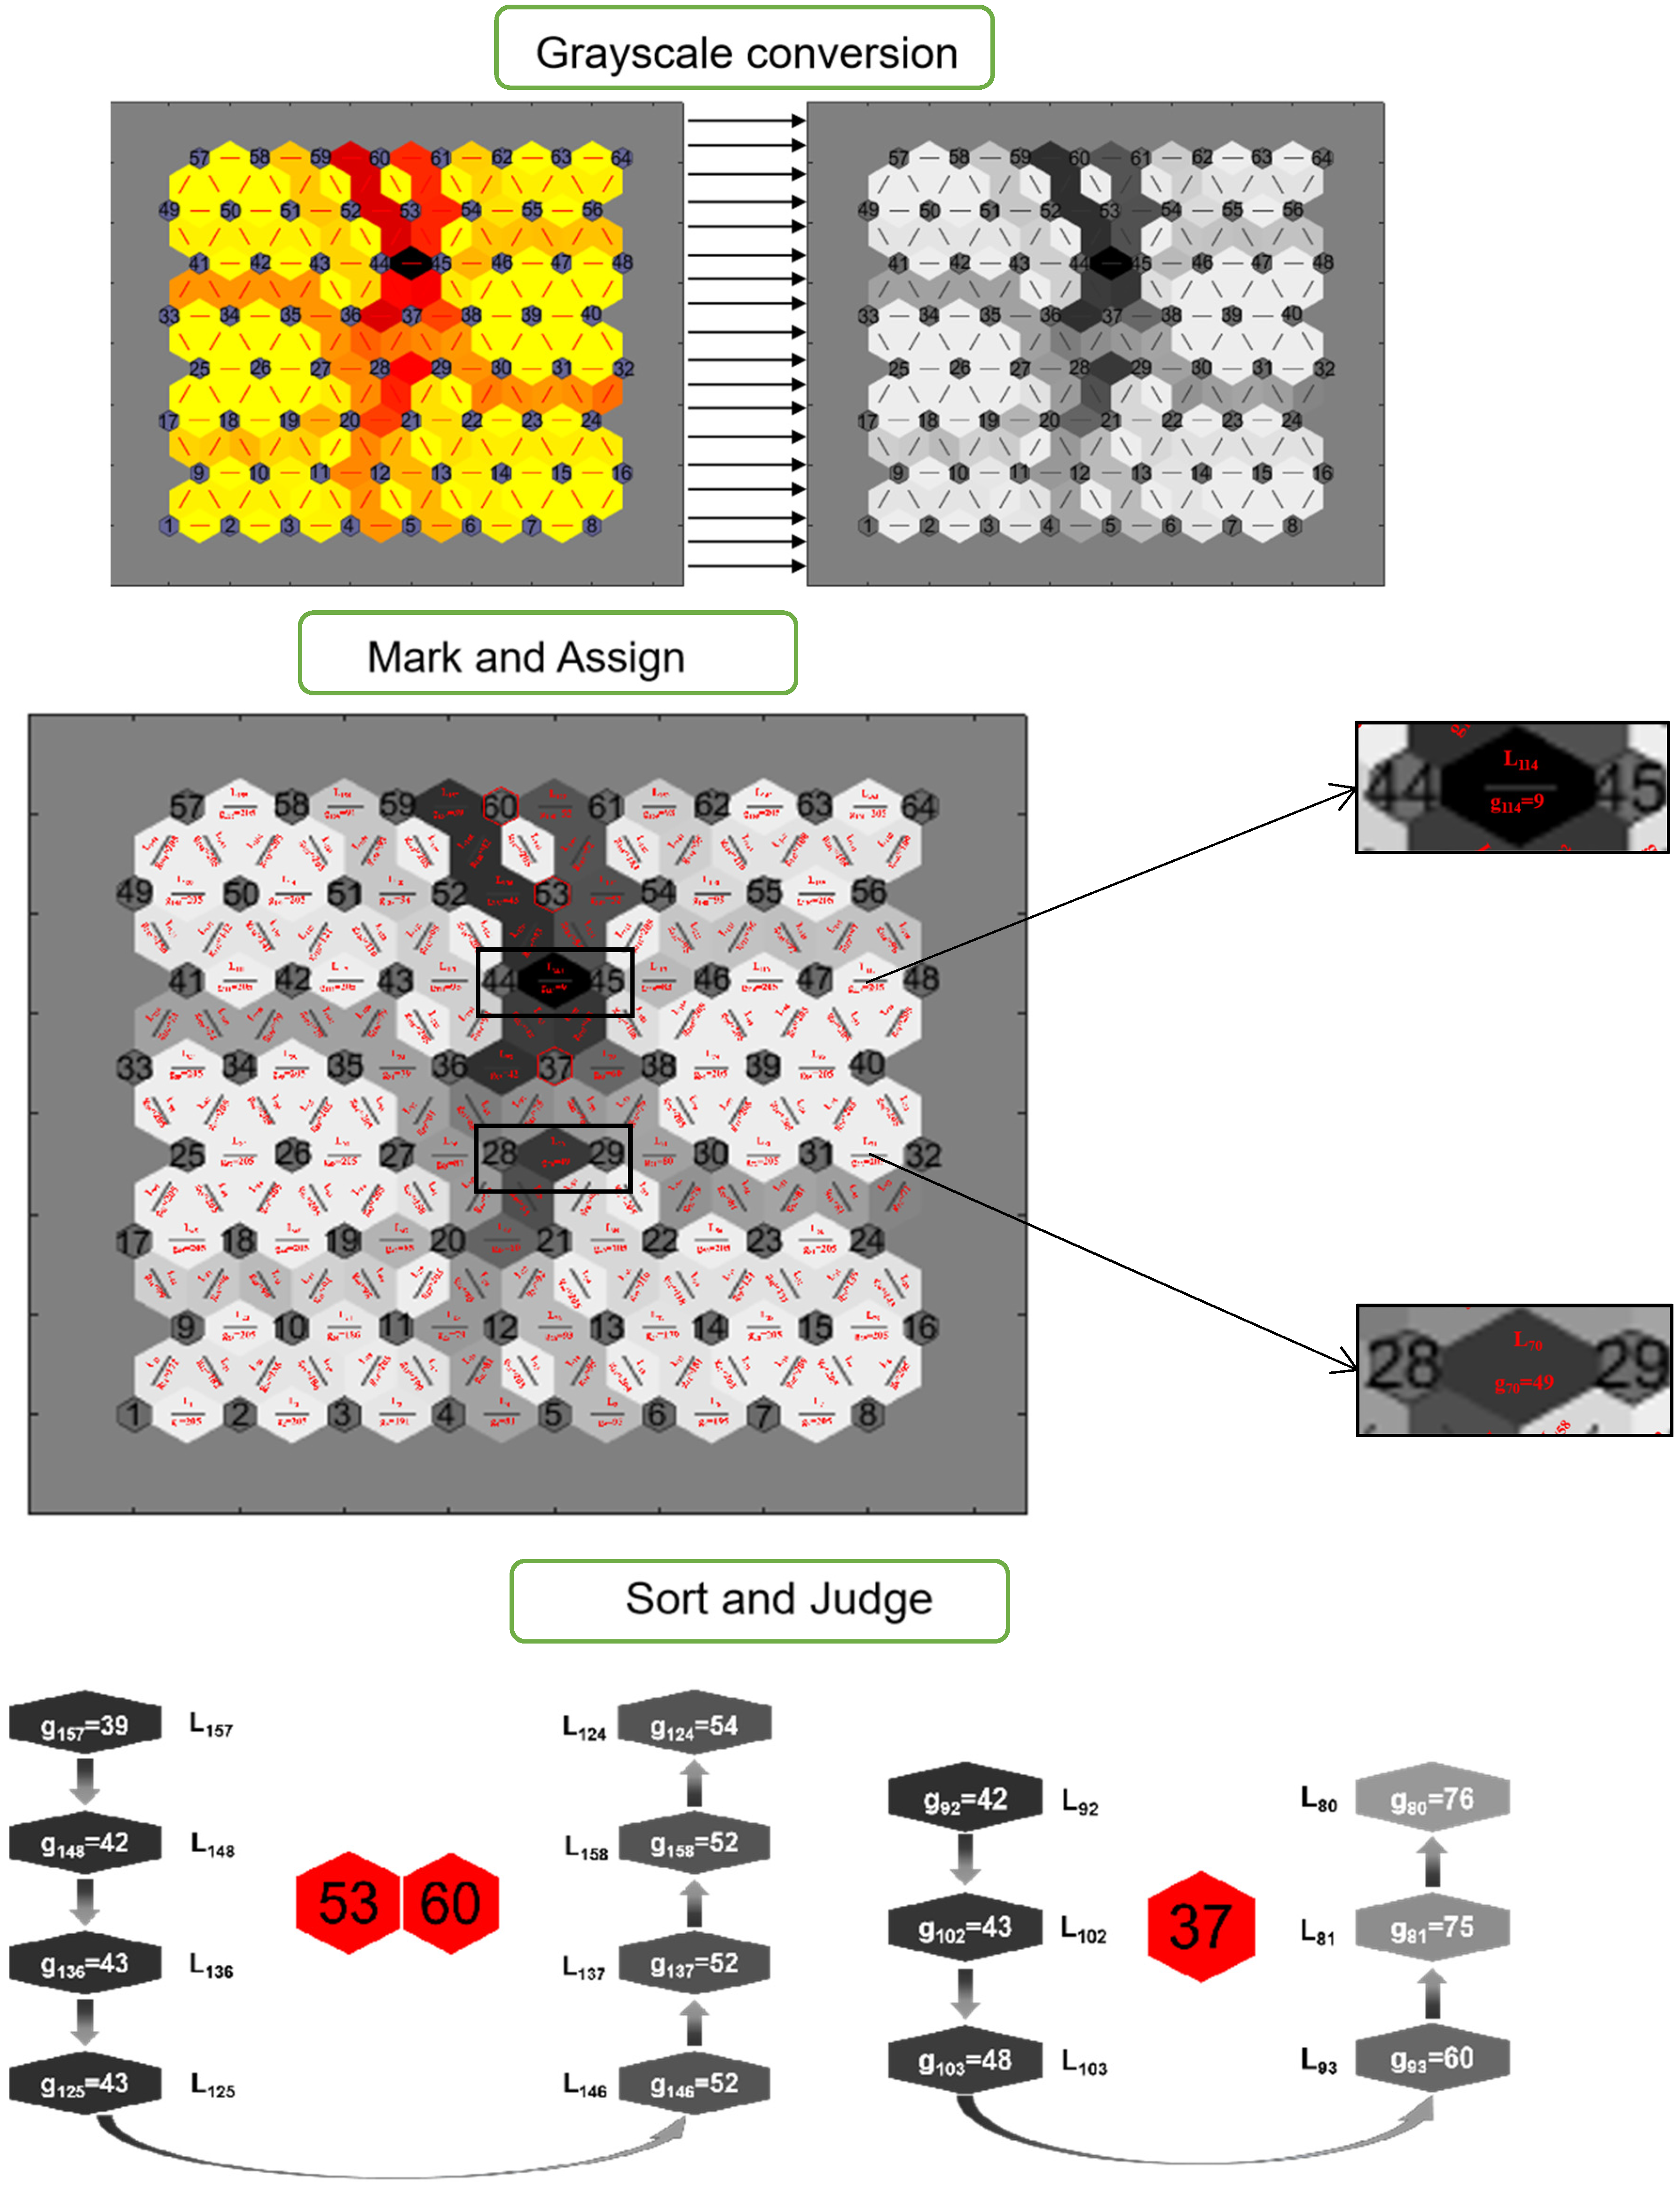
- The first step is to determine the grayscale of the topology map:
- The second step is to grayscale the topological distance map:
- The third step is to create a sliding window:
- The fourth step is to discriminate the category of neurons:
4. Experiments and Results Analysis
4.1. Selection of Input Samples of RPC Bending Fatigue Damage Identification Model
4.2. Parameter Setting of RPC Bending Fatigue Damage SOM Network Model
4.3. Determining the Winning Neurons of RPC Bending Fatigue Damage Model
4.4. Neuron Topology Analysis for RPC Bending Fatigue Damage SOM Network Model
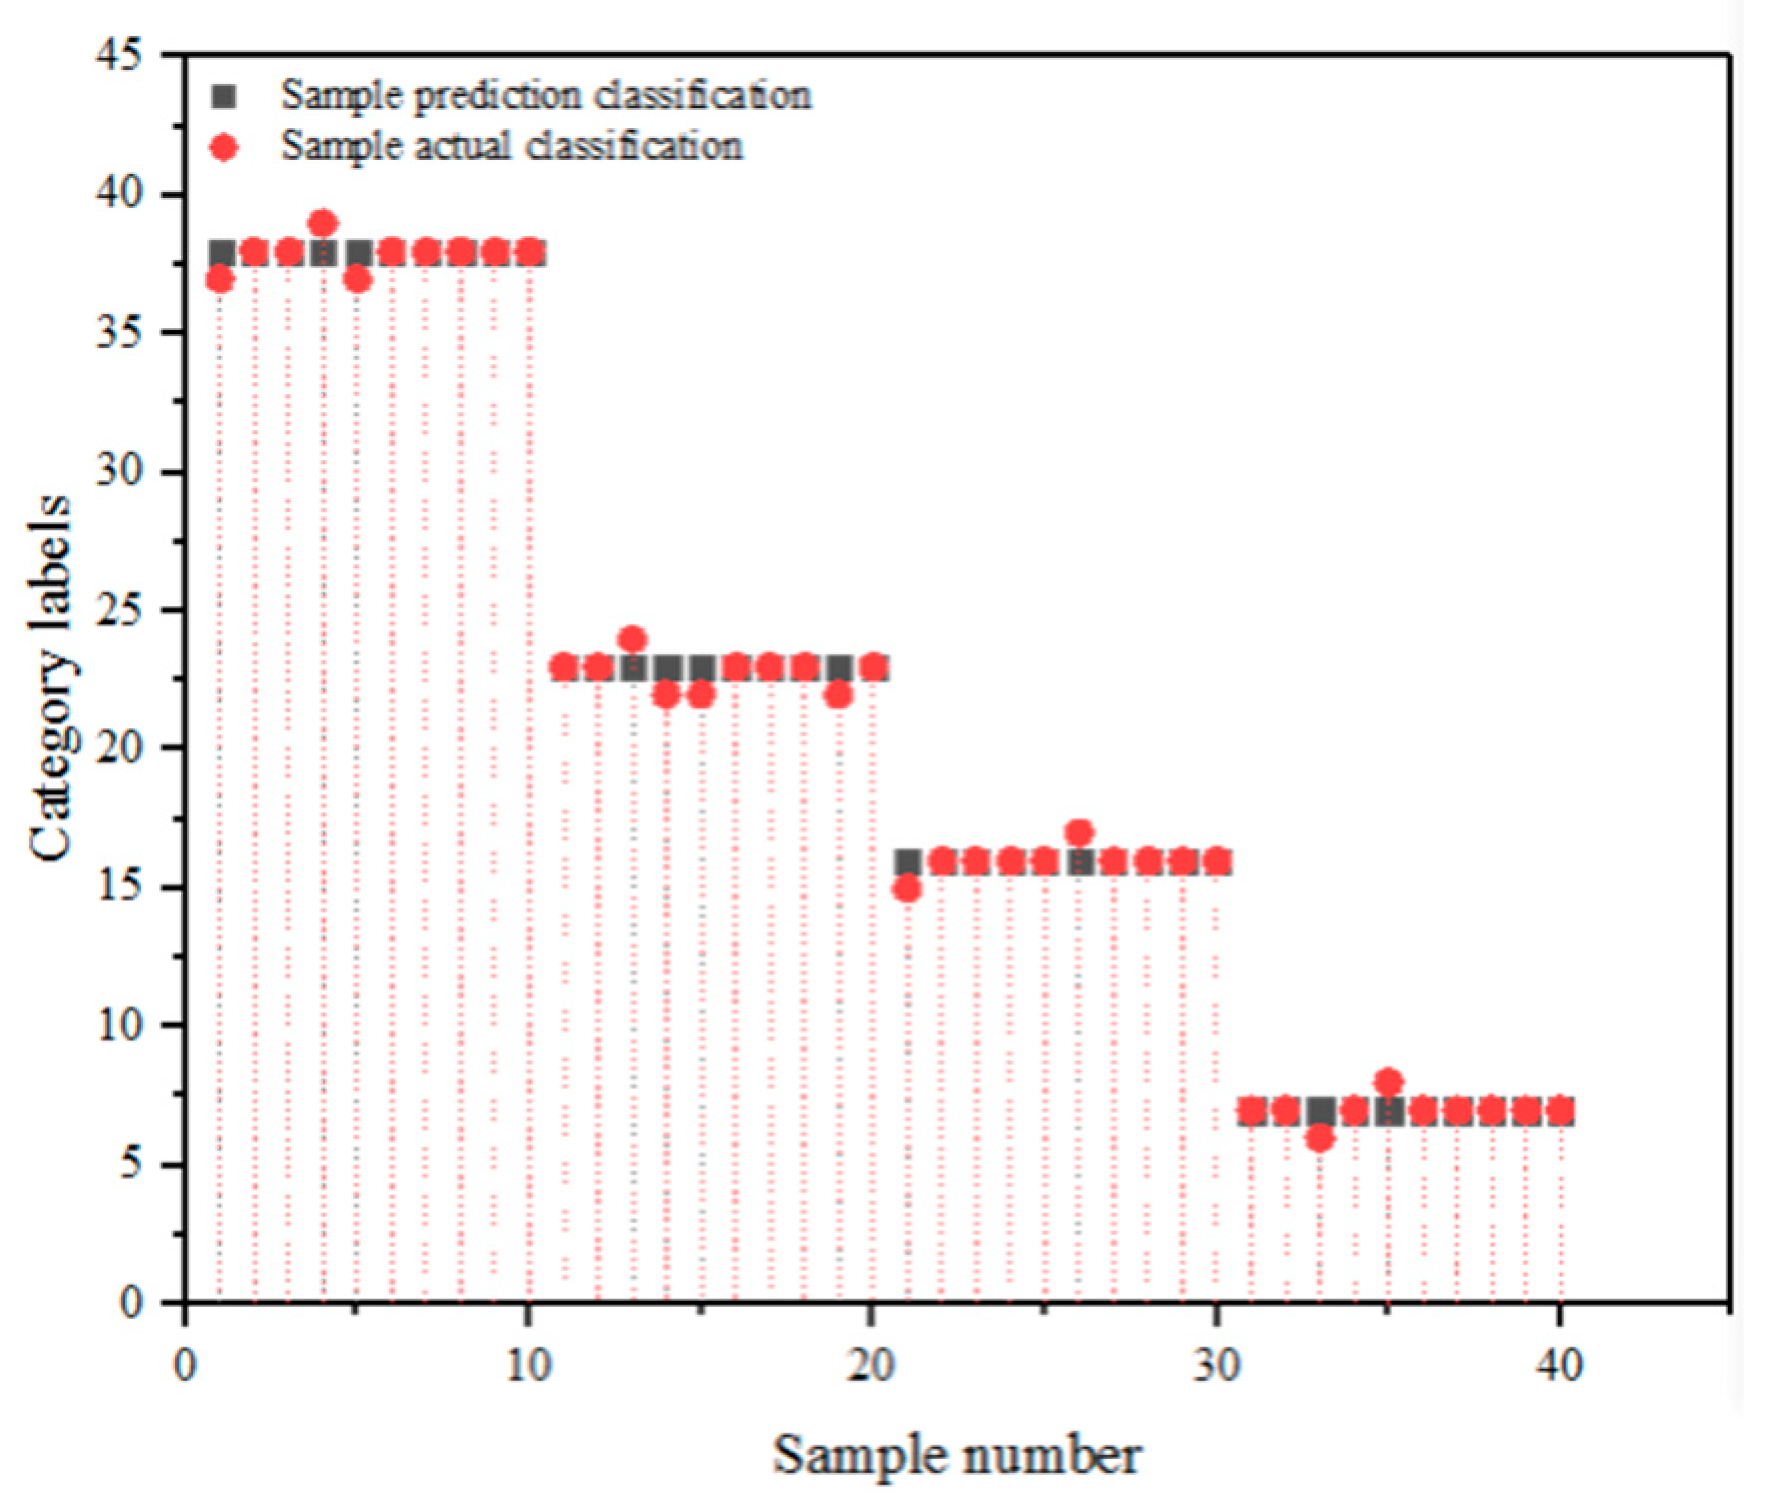
4.5. Testing of Improved Algorithm Models
5. Discussion
6. Conclusions
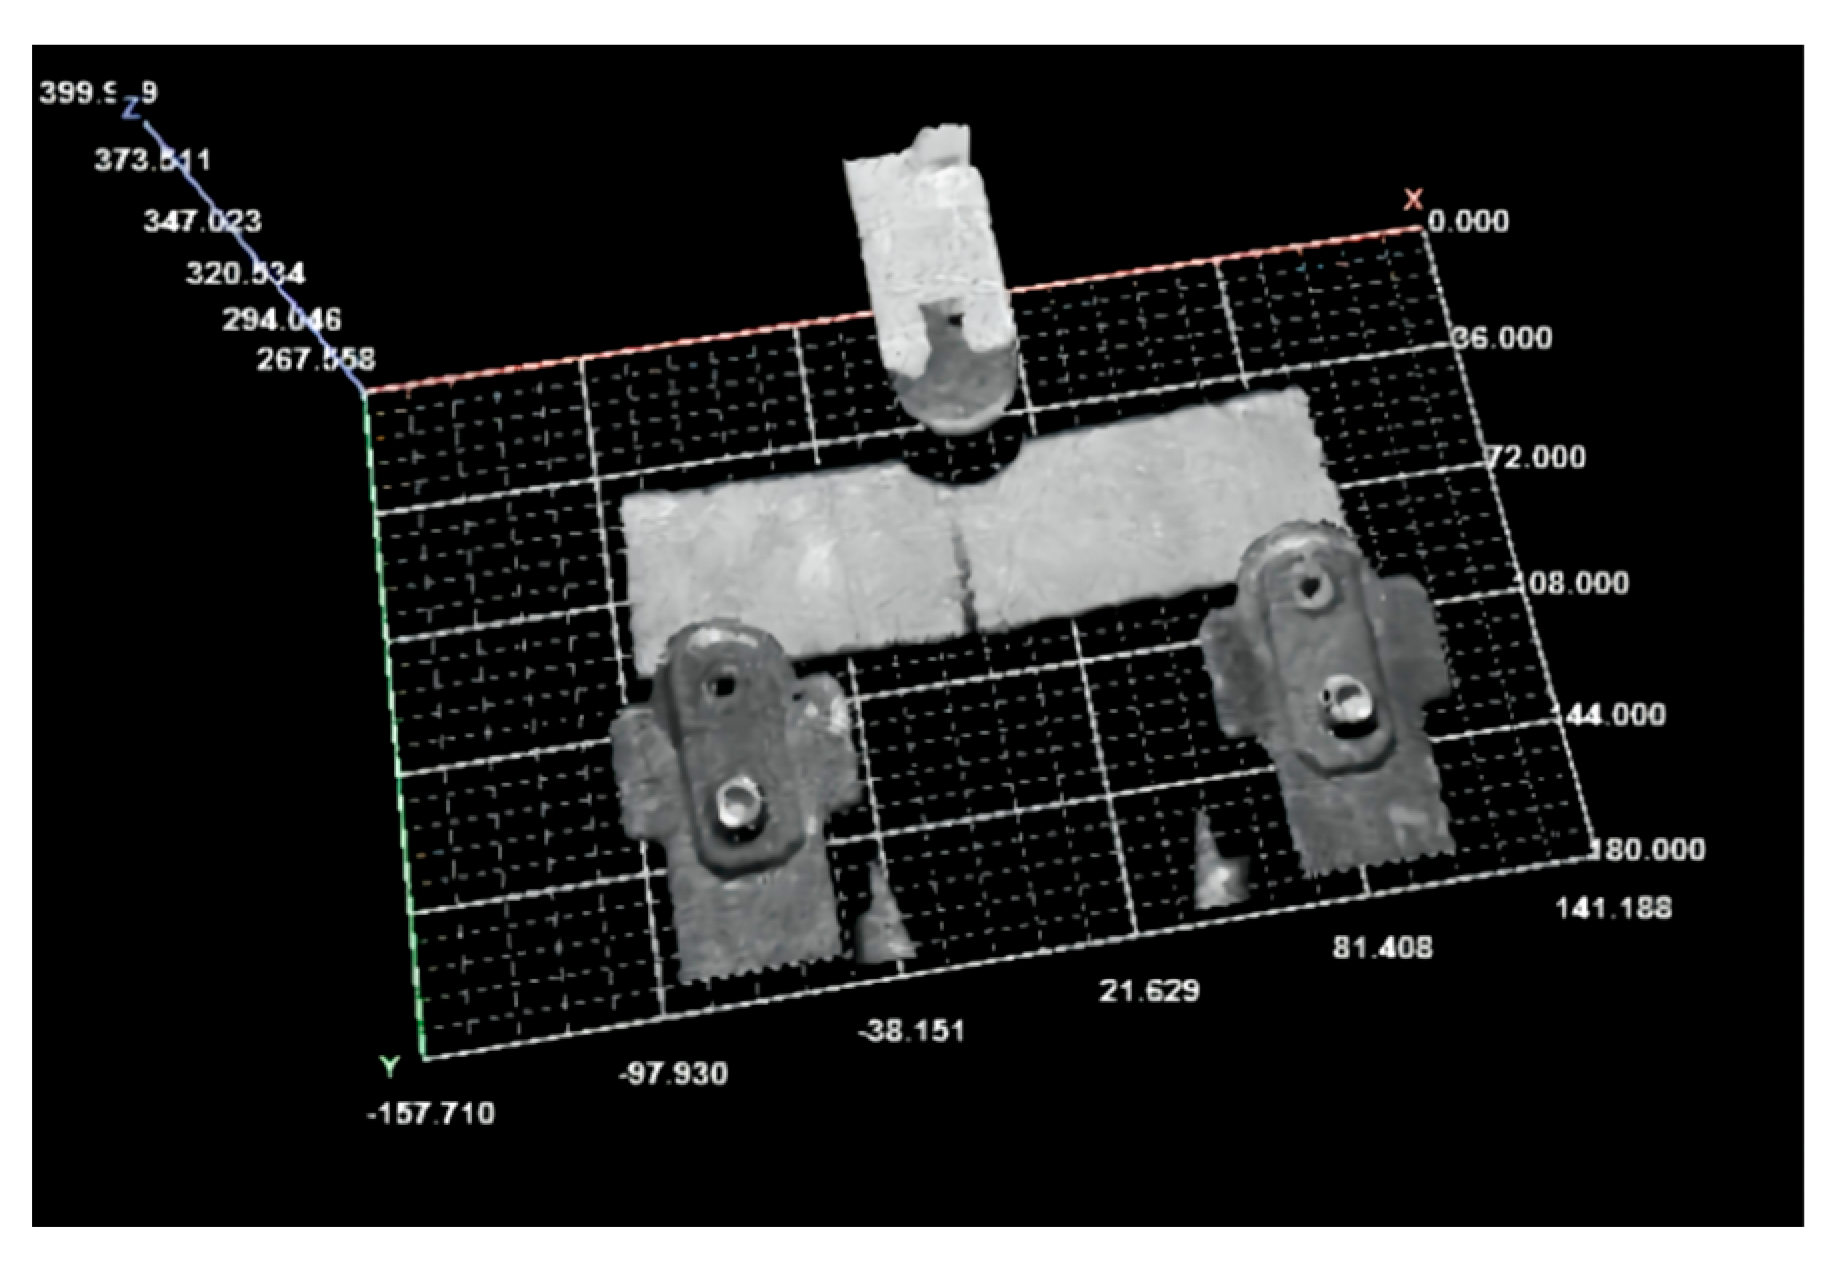
- Combined with the self-developed 3D laser scanning system and GLCM theory, the input sample selection method of the SOM network is improved;
- Based on the principle of the network topology map analysis and its image characteristics, the concept of the topology grayscale map and the TOP-G algorithm method, and process for the SOM topology map analysis are proposed for the first time;
- Based on the active powder concrete bending fatigue loading test, the damage (cracks, sags, honeycombs and holes) identification research of the improved SOM algorithm model was carried out.
Author Contributions
Funding
Institutional Review Board Statement
Informed Consent Statement
Data Availability Statement
Conflicts of Interest
References
- Irfan, M.S.; Khan, T.; Hussain, T.; Liao, K.; Umer, R. Carbon coated piezoresistive fiber sensors: From process monitoring to structural health monitoring of composites—A review. Compos. Part A Appl. Sci. Manuf. 2021, 141, 106236. [Google Scholar] [CrossRef]
- Clementi, F.; Formisano, A.; Milani, G.; Ubertini, F. Structural Health Monitoring of Architectural Heritage: From the past to the Future Advances. Int. J. Archit. Herit. 2021, 15, 1–4. [Google Scholar] [CrossRef]
- Mishra, M.; Lourenço, P.B.; Ramana, G.V. Structural health monitoring of civil engineering structures by using the internet of things: A review. J. Build. Eng. 2021, 48, 103954. [Google Scholar] [CrossRef]
- Farrar, C.R.; Worden, K. An introduction to structural health monitoring. Philos. Trans. R. Soc. A Math. Phys. Eng. Sci. 2007, 365, 303–315. [Google Scholar] [CrossRef] [PubMed]
- Gerhardt, L. Pattern recognition and machine learning. IEEE Trans. Autom. Control 2003, 19, 461–462. [Google Scholar] [CrossRef]
- Kot, P.; Muradov, M.; Gkantou, M.; Kamaris, G.S.; Hashim, K.; Yeboah, D. Recent Advancements in Non-Destructive Testing Techniques for Structural Health Monitoring. Appl. Sci. 2021, 11, 2750. [Google Scholar] [CrossRef]
- Sony, S.; Dunphy, K.; Sadhu, A.; Capretz, M. A systematic review of convolutional neural network-based structural condition assessment techniques. Eng. Struct. 2020, 226, 111347. [Google Scholar] [CrossRef]
- Sakiyama, F.I.H.; Lehmann, F.A.; Garrecht, H. Structural Health Monitoring of Concrete Structures using Fibre Optic Based Sensors: A Review. Mag. Concr. Res. 2019, 73, 174–194. [Google Scholar] [CrossRef]
- Wu, Z.; Pan, S.; Chen, F.; Long, G.; Zhang, C.; Philip, S.Y. A Comprehensive Survey on Graph Neural Networks. IEEE Trans. Neural Netw. Learn. Syst. 2019, 32, 4–24. [Google Scholar] [CrossRef] [Green Version]
- Hou, R.; Xia, Y. Review on the new development of vibration-based damage identification for civil engineering structures: 2010–2019. J. Sound Vib. 2020, 491, 115741. [Google Scholar] [CrossRef]
- Wang, S.; Li, J.; Luo, H.; Zhu, H. Damage identification in underground tunnel structures with wavelet based residual force vector. Eng. Struct. 2019, 178, 506–520. [Google Scholar] [CrossRef]
- Alavi, A.H.; Hasni, H.; Lajnef, N.; Chatti, K.; Faridazar, F. Damage detection using self-powered wireless sensor data: An evolutionary approach. Measurement 2016, 82, 254–283. [Google Scholar] [CrossRef]
- Martinez-Luengo, M.; Kolios, A.; Wang, L. Structural health monitoring of offshore wind turbines: A review through the Statistical Pattern Recognition Paradigm. Renew. Sustain. Energy Rev. 2016, 64, 91–105. [Google Scholar] [CrossRef] [Green Version]
- Won, J.; Park, J.W.; Jang, S.; Jin, K.; Kim, Y. Automated Structural Damage Identification Using Data Normalization and 1-Dimensional Convolutional Neural Network. Appl. Sci. 2021, 11, 2610. [Google Scholar] [CrossRef]
- Abdeljaber, O.; Avci, O.; Kiranyaz, M.S.; Boashash, B.; Sodano, H.; Inman, D.J. 1-D CNNs for Structural Damage Detection: Verification on a Structural Health Monitoring Benchmark Data. Neurocomputing 2018, 275, 1308–1317. [Google Scholar] [CrossRef]
- Lin, C.J.; Wu, N.J. An ANN Model for Predicting the Compressive Strength of Concrete. Appl. Sci. 2021, 11, 3798. [Google Scholar] [CrossRef]
- Tan, X.; Sun, X.; Chen, W.; Du, B.; Ye, J.; Sun, L. Investigation on the data augmentation using machine learning algorithms in structural health monitoring information. Struct. Health Monit. 2021, 20, 2054–2068. [Google Scholar] [CrossRef]
- Tenreiro, A.F.G.; Lopes, A.M.; da Silva, L.F. A review of structural health monitoring of bonded structures using electromechanical impedance spectroscopy. Struct. Health Monit. 2022, 21, 228–249. [Google Scholar] [CrossRef]
- Barontini, A.; Masciotta, M.G.; Amado-Mendes, P.; Ramos, L.F.; Lourenço, P.B. Negative selection algorithm based methodology for online structural health monitoring. Eng. Struct. 2021, 229, 111662. [Google Scholar] [CrossRef]
- Pathirage, C.S.N.; Li, J.; Li, L.; Hao, H.; Liu, W.; Ni, P. Structural damage identification based on autoencoder neural networks and deep learning. Eng. Struct. 2018, 172, 13–28. [Google Scholar] [CrossRef]
- Bao, Y.; Tang, Z.; Li, H.; Zhang, Y. Computer vision and deep learning–based data anomaly detection method for structural health monitoring. Struct. Health Monit. 2019, 18, 401–421. [Google Scholar] [CrossRef]
- Rajadurai, R.S.; Kang, S.T. Automated Vision-Based Crack Detection on Concrete Surfaces Using Deep Learning. Appl. Sci. 2021, 11, 5229. [Google Scholar] [CrossRef]
- Mantawy, I.M.; Mantawy, M.O. Convolutional neural network based structural health monitoring for rocking bridge system by encoding time-series into images. Struct. Control Health Monit. 2022, 29, e2897. [Google Scholar] [CrossRef]
- Miorelli, R.; Fisher, C.; Kulakovskyi, A.; Chapuis, B.; Mesnil, O.; D’Almeida, O. Defect sizing in guided wave imaging structural health monitoring using convolutional neural network. NDT E Int. 2021, 122, 102480. [Google Scholar]
- Zhang, B.; Hong, X.; Liu, Y. Deep Convolutional Neural Network Probability Imaging for Plate Structural Health Monitoring Using Guided Waves. IEEE Trans. Instrum. Meas. 2021, 70, 1–10. [Google Scholar] [CrossRef]
- Gu, J.; Peng, Y.; Lu, H.; Chang, X.; Cao, S.; Chen, G.; Cao, B. An optimized variational mode decomposition method and its application in vibration signal analysis of bearings. Struct. Health Monit. 2021, 1–22. [Google Scholar] [CrossRef]
- Zhan, J.; Wang, C.; Fang, Z. Condition Assessment of Joints in Steel Truss Bridges Using a Probabilistic Neural Network and Finite Element Model Updating. Sustainability 2021, 13, 1474. [Google Scholar] [CrossRef]
- Finotti, R.P.; Barbosa, F.d.S.; Cury, A.A.; Pimentel, R.L. Numerical and Experimental Evaluation of Structural Changes Using Sparse Auto-Encoders and SVM Applied to Dynamic Responses. Appl. Sci. 2021, 11, 11965. [Google Scholar] [CrossRef]
- Sadeghi, F.; Yu, Y.; Zhu, X.; Li, J. Damage identification of steel-concrete composite beams based on modal strain energy changes through general regression neural network. Eng. Struct. 2021, 244, 112824. [Google Scholar] [CrossRef]
- Angulo-Saucedo, G.A.; Leon-Medina, J.X.; Pineda-Muñoz, W.A.; Torres-Arredondo, M.A.; Tibaduiza, D.A. Damage Classification Using Supervised Self-Organizing Maps in Structural Health Monitoring. Sensors 2022, 22, 1484. [Google Scholar] [CrossRef]
- Sun, J.; Chen, X.; Fu, Z.; Lacidogna, G. Damage Pattern Recognition and Crack Propagation Prediction for Crumb Rubber Concrete Based on Acoustic Emission Techniques. Appl. Sci. 2021, 11, 11476. [Google Scholar] [CrossRef]
- Sofi, A.; Regita, J.J.; Rane, B.; Lau, H.H. Structural health monitoring using wireless smart sensor network—An overview. Mech. Syst. Signal Process. 2022, 163, 108113. [Google Scholar] [CrossRef]
- Yapar, O.; Basu, P.K.; Volgyesi, P.; Ledeczi, A. Structural health monitoring of bridges with piezoelectric AE sensors. Eng. Fail. Anal. 2015, 56, 150–169. [Google Scholar] [CrossRef] [Green Version]
- Kang, F.; Liu, J.; Li, J.; Li, S. Concrete dam deformation prediction model for health monitoring based on extreme learning machine. Struct. Control Health Monit. 2017, 24, e1997. [Google Scholar] [CrossRef]
- Amezquita-Sanchez, J.P.; Adeli, H. Signal Processing Techniques for Vibration-Based Health Monitoring of Smart Structures. Arch. Comput. Methods Eng. 2016, 23, 1–15. [Google Scholar] [CrossRef]
- Zhang, Y.; Simsek, M.; Kantarci, B. Empowering Self-Organized Feature Maps for AI-Enabled Modeling of Fake Task Submissions to Mobile Crowdsensing Platforms. IEEE Internet Things J. 2020, 8, 1334–1346. [Google Scholar] [CrossRef]
- Li, K.; Wang, J.; Qi, D. Research on crack identification and monitoring method of concrete structure based on G-S-G. J. Vib. Shock. 2020, 39, 101–108. [Google Scholar]
- Czarnecki, S.; Shariq, M.; Nikoo, M.; Sadowski, Ł. An intelligent model for the prediction of the compressive strength of cementitious composites with ground granulated blast furnace slag based on ultrasonic pulse velocity measurements. Measurement 2021, 172, 108951. [Google Scholar] [CrossRef]
- Li, K.; Wang, J.; Qi, D. The development and application of an original 3D laser scanning: A precise and nondestructive structural measurements system. Frat. Integrità Strutt. 2020, 14, 386–397. [Google Scholar] [CrossRef]


| Input Sample | Sample Name | Characterized Properties |
|---|---|---|
| P1 | ASM | Uniformity |
| P2 | ENT | Complexity |
| P3 | INM | Stability |
| P4 | COR | Correlation |
| P5 | IDM | Volatility |
| P6 | VAR | Circularity |
| Training Steps | Clustering Results | |||
|---|---|---|---|---|
| Honeycomb | Hole | Sag | Crack | |
| 10 | 55 | 37 | 37 | 55 |
| 50 | 43 | 37 | 37 | 55 |
| 100 | 43 | 1 | 37 | 37 |
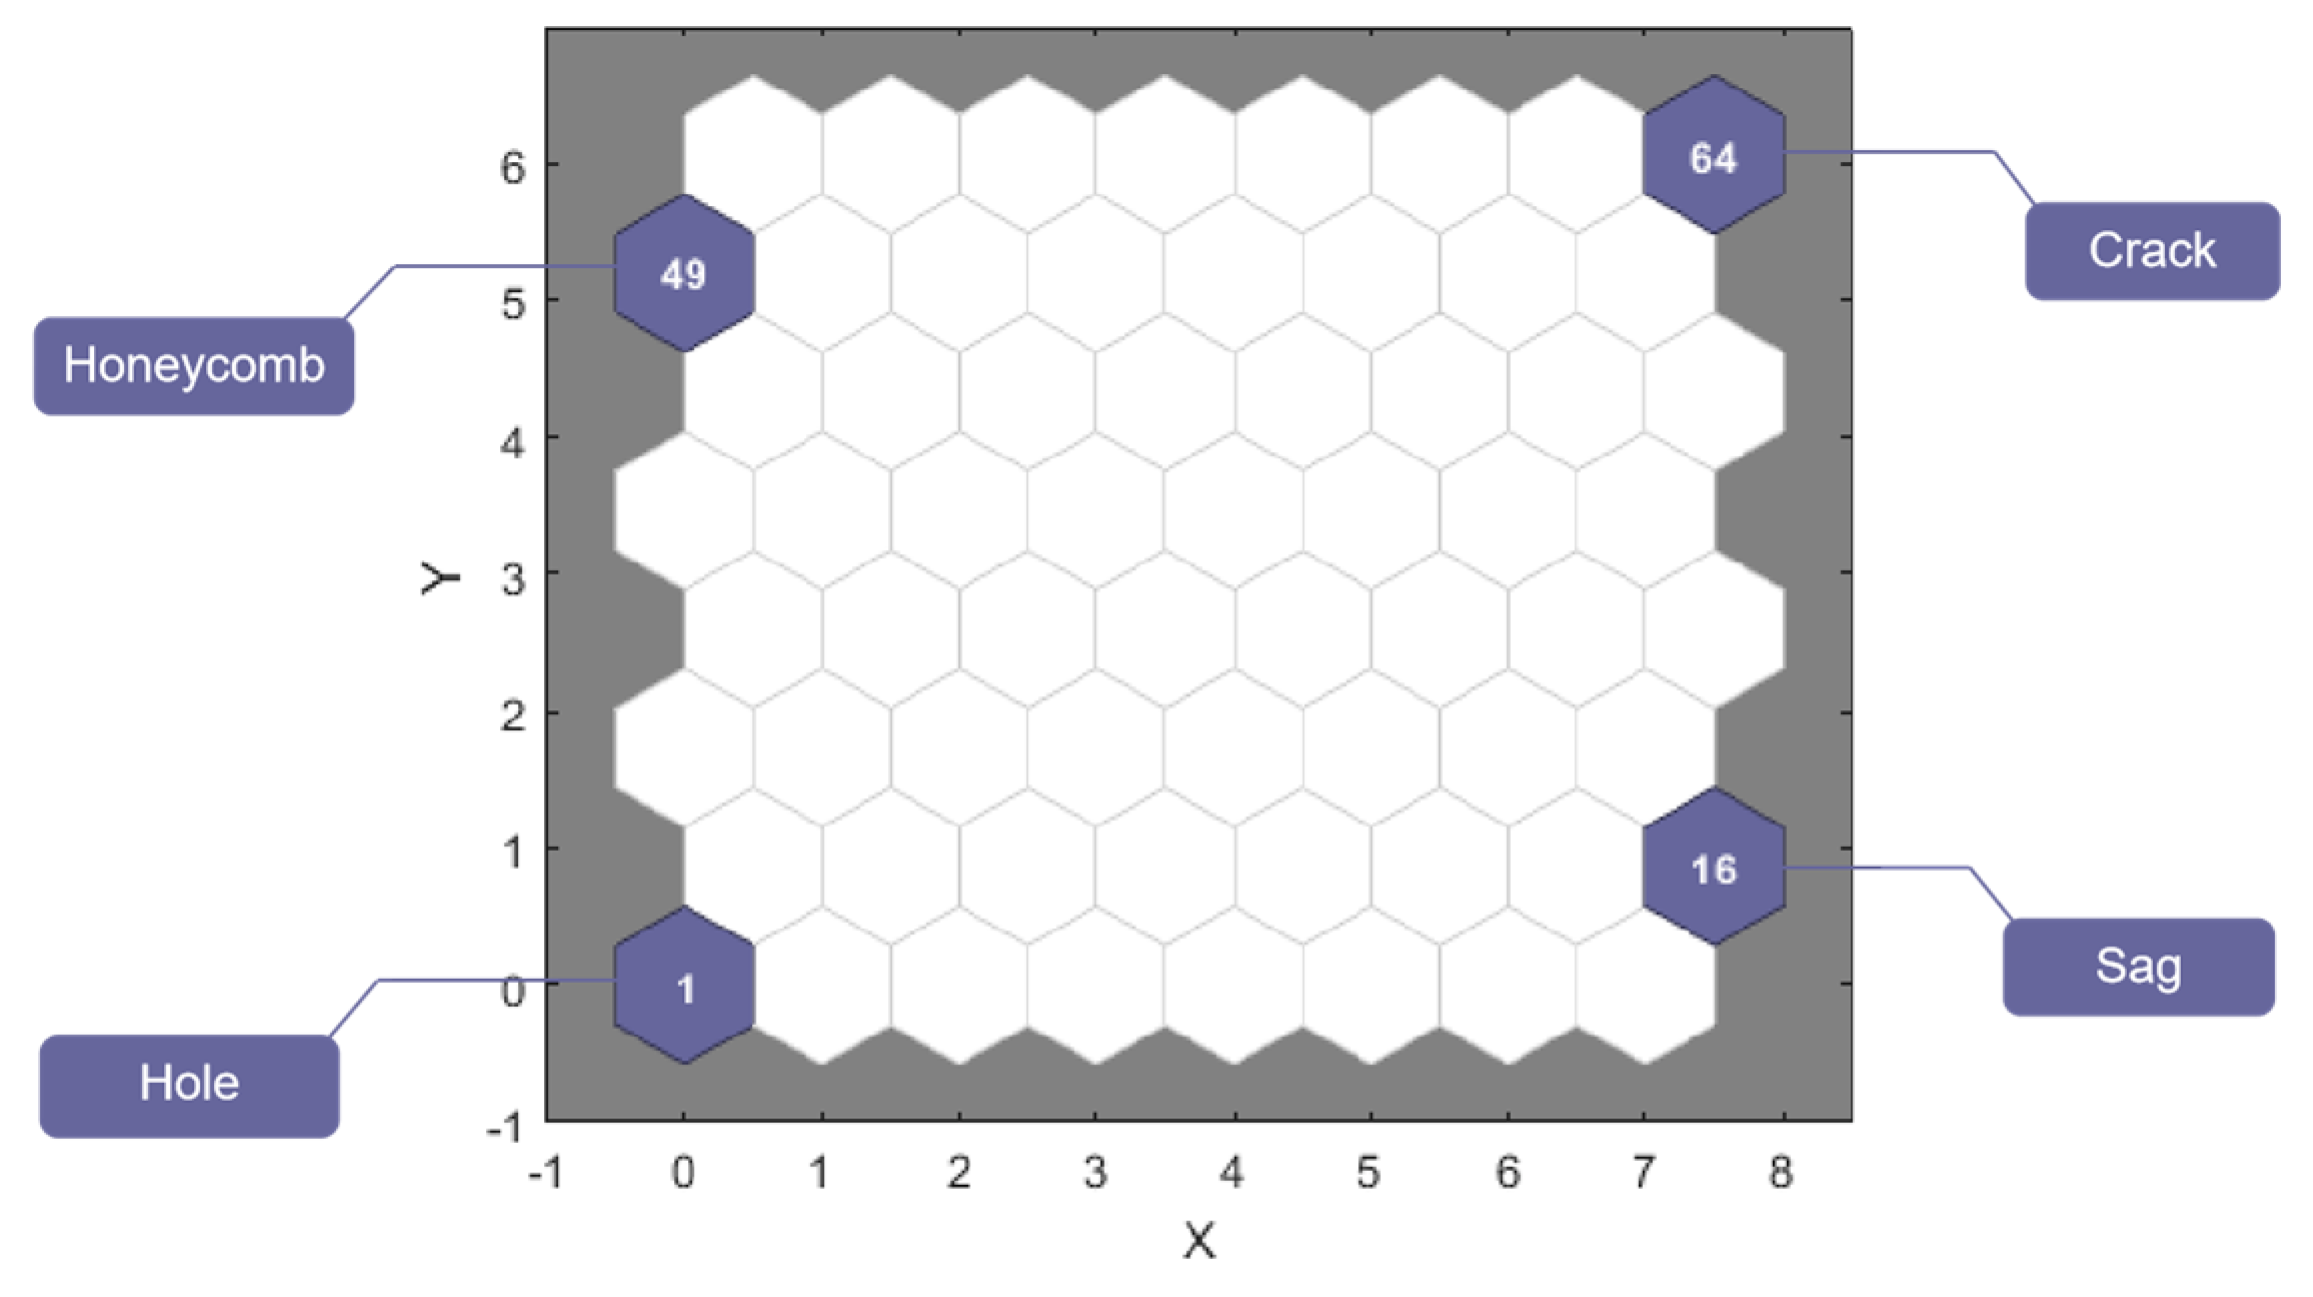
| 200 | 49 | 1 | 16 | 64 |
| 500 | 49 | 1 | 16 | 64 |
| 1000 | 49 | 1 | 16 | 64 |
| Damage Type | Sample Classification Number |
|---|---|
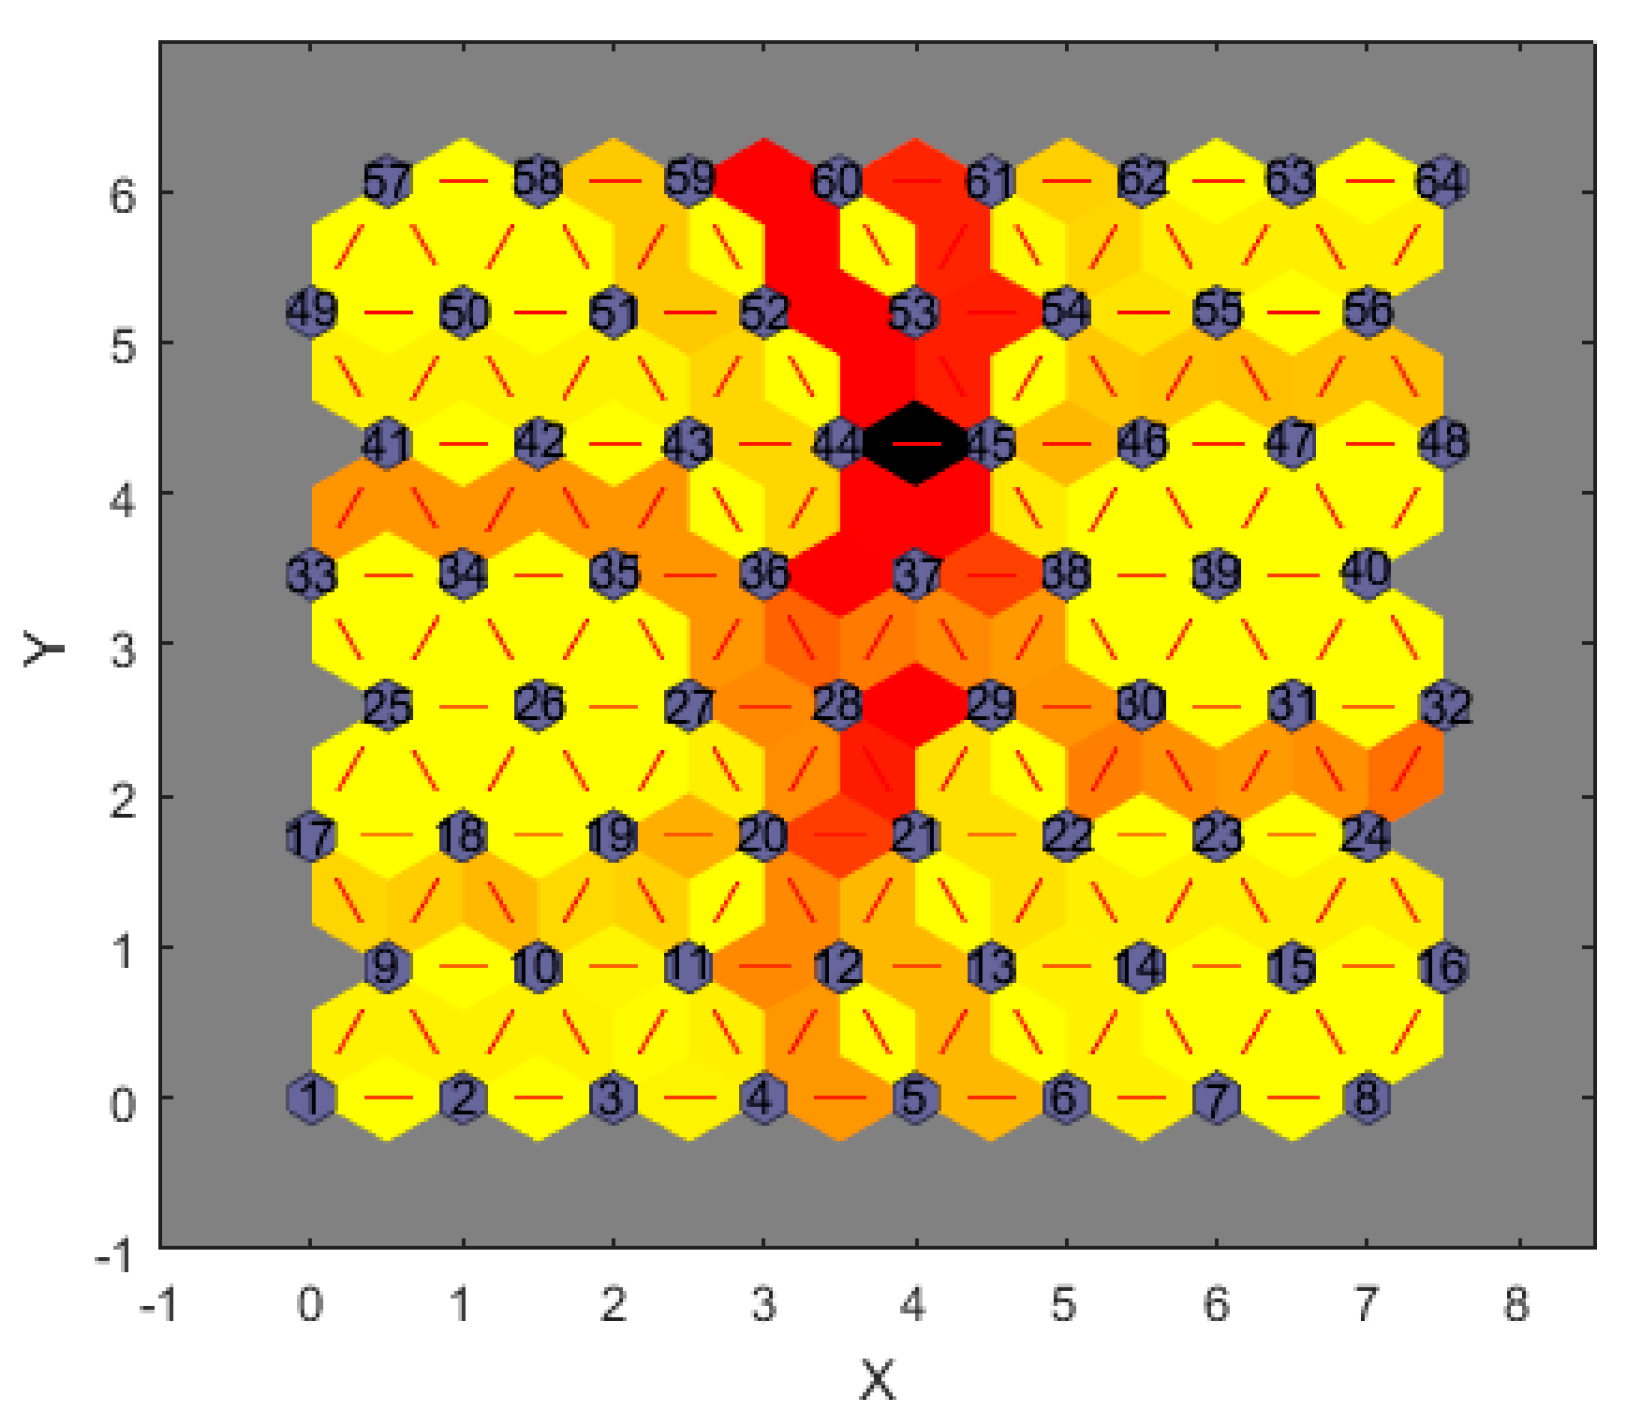
| Honeycomb | 36, 41, 42, 43, 44, 49, 50, 51, 52, 57, 58, 59 |
| Hole | 1, 2, 3, 4, 9, 10, 11, 17, 18, 19, 20, 25, 26, 27, 33, 34, 35 |
| Sag | 5, 6, 7, 8, 11, 12, 13, 14, 15, 16, 21, 22, 23, 24, 29 |
| Crack | 30, 31, 32, 38, 39, 40, 45, 46, 47, 48, 54, 55, 56, 61, 62, 63, 64 |
| Unknown type | 37, 53, 60 |
| Damage Type | Winning Neuron Classification Label | Sample Serial Number |
|---|---|---|
| Cracks | 38 | 1, 2, 3, 4, 5, 6, 7, 8, 9, 10 |
| Holes | 16 | 11, 12, 13, 14, 15, 16, 17, 18, 19, 20 |
| Honeycombs | 23 | 21, 22, 23, 24, 25, 26, 27, 28, 29, 30 |
| Sags | 7 | 31, 32, 33, 34, 35, 36, 37, 38, 39, 40 |
Publisher’s Note: MDPI stays neutral with regard to jurisdictional claims in published maps and institutional affiliations. |
© 2022 by the authors. Licensee MDPI, Basel, Switzerland. This article is an open access article distributed under the terms and conditions of the Creative Commons Attribution (CC BY) license (https://creativecommons.org/licenses/by/4.0/).
Share and Cite
Liu, J.; Li, K. Research on an Improved SOM Model for Damage Identification of Concrete Structures. Appl. Sci. 2022, 12, 4152. https://doi.org/10.3390/app12094152
Liu J, Li K. Research on an Improved SOM Model for Damage Identification of Concrete Structures. Applied Sciences. 2022; 12(9):4152. https://doi.org/10.3390/app12094152
Chicago/Turabian StyleLiu, Jinxin, and Kexin Li. 2022. "Research on an Improved SOM Model for Damage Identification of Concrete Structures" Applied Sciences 12, no. 9: 4152. https://doi.org/10.3390/app12094152