1. Introduction
Earth fissure, a discontinuous and broken rupture on the ground surface, could be formed as a result of tectonic activity [
1,
2,
3,
4]. This lesser-known geohazard feature has the potential to impact the environment by causing significant damage to civil foundations such as roads, dams, buildings, and underground pipes due to stress. The fissures pose significant risks to farmlands, properties, and infrastructures. Ground surface discontinuities, on the other hand, can be interpreted as indicators of deformation history and stress patterns. In structural geology, analysis, evidence, and their corresponding interpretations can provide a proper consideration in controlling physical processes and supporting any related hazard assessment [
5]. Analyzing the structural discontinuities such as faults, joints, bedding planes, and fractures in hard-rock slopes allows us to define unstable areas [
6,
7,
8,
9,
10]. In contrast, the analysis of surface fissures in soft-rock slopes may imply an explanation for future failures, which is frequently accounted for as a geo-indicator of a fault zone’s activity phases [
11]. In some areas, the characteristics of the surface fissure affect water infiltration and drainage, which in turn affects the kinematic response of slopes to hydrogeological events and the groundwater system. Large fissures along a fault may be detectable in very high-resolution (VHR) space-borne images [
12], but their widths are typically in the decimeter range, and the real-time kinematic (RTK) technique and airborne photographs can provide sufficient details to detect them.
In this paper, we investigate the mechanism of ground fissure formation in the Birjand area (as a case study) using tectonic analyses, taking into account the scientific importance of ground fissures and the potential for environmental damage.
The tectonics of the study area is characterized by active faulting, instrumental earthquakes, and young volcanism around a rigid block (Lut block) in eastern Iran. Tectonic activity along the western and eastern boundaries of the Lut Block contributes significantly to geomorphic landscapes and natural hazards [
13,
14,
15,
16,
17,
18]. The Sistan suture zone (SSZ) is overprinted by the Nehbandan fault system at Lut’s eastern boundary. Some splays of this fault with EW strikes, such as the North Birjand fault, are located in the center of the Sistan suture zone. These faults with reverse and left-lateral strike-slip movements formed some fault-propagation folds in the Quaternary sediments. Due to its proximity to cities such as Birjand, the study of structural features associated with the North Birjand fault (e.g., fissure structures) is critical.
2. Geological Setting
The NS active faults on the western and eastern margins of the Lut block in eastern Iran are among the fastest-slipping faults [
19,
20,
21]. They are currently slipping laterally at a rate of 4.4 ± 0.4 and 5.6 ± 0.6, respectively [
22,
23,
24]. The weighted average direction of the compressional stress in the eastern margin of the Lut, as determined by the seismic strain rate (SSR), focal mechanism stress inversion (FMSI), and GPS-derived strain rates (GSRs), was obtained at about N20°E [
25]. This direction is positively correlated with the faults’ mechanism in the region. As a result, the region’s NS and EW faults exhibit right-lateral and left-lateral movement in addition to dip-slip movements.
The character of convergence along the Arabian–Iranian plate boundary changes radically eastward from the Zagros ranges to the Makran region, where the northward subduction of the oceanic part of the Arabian Plate beneath the Lut and Afghan blocks in the northwestern Indian Ocean has mainly affected the seismicity and deformation of eastern Iran [
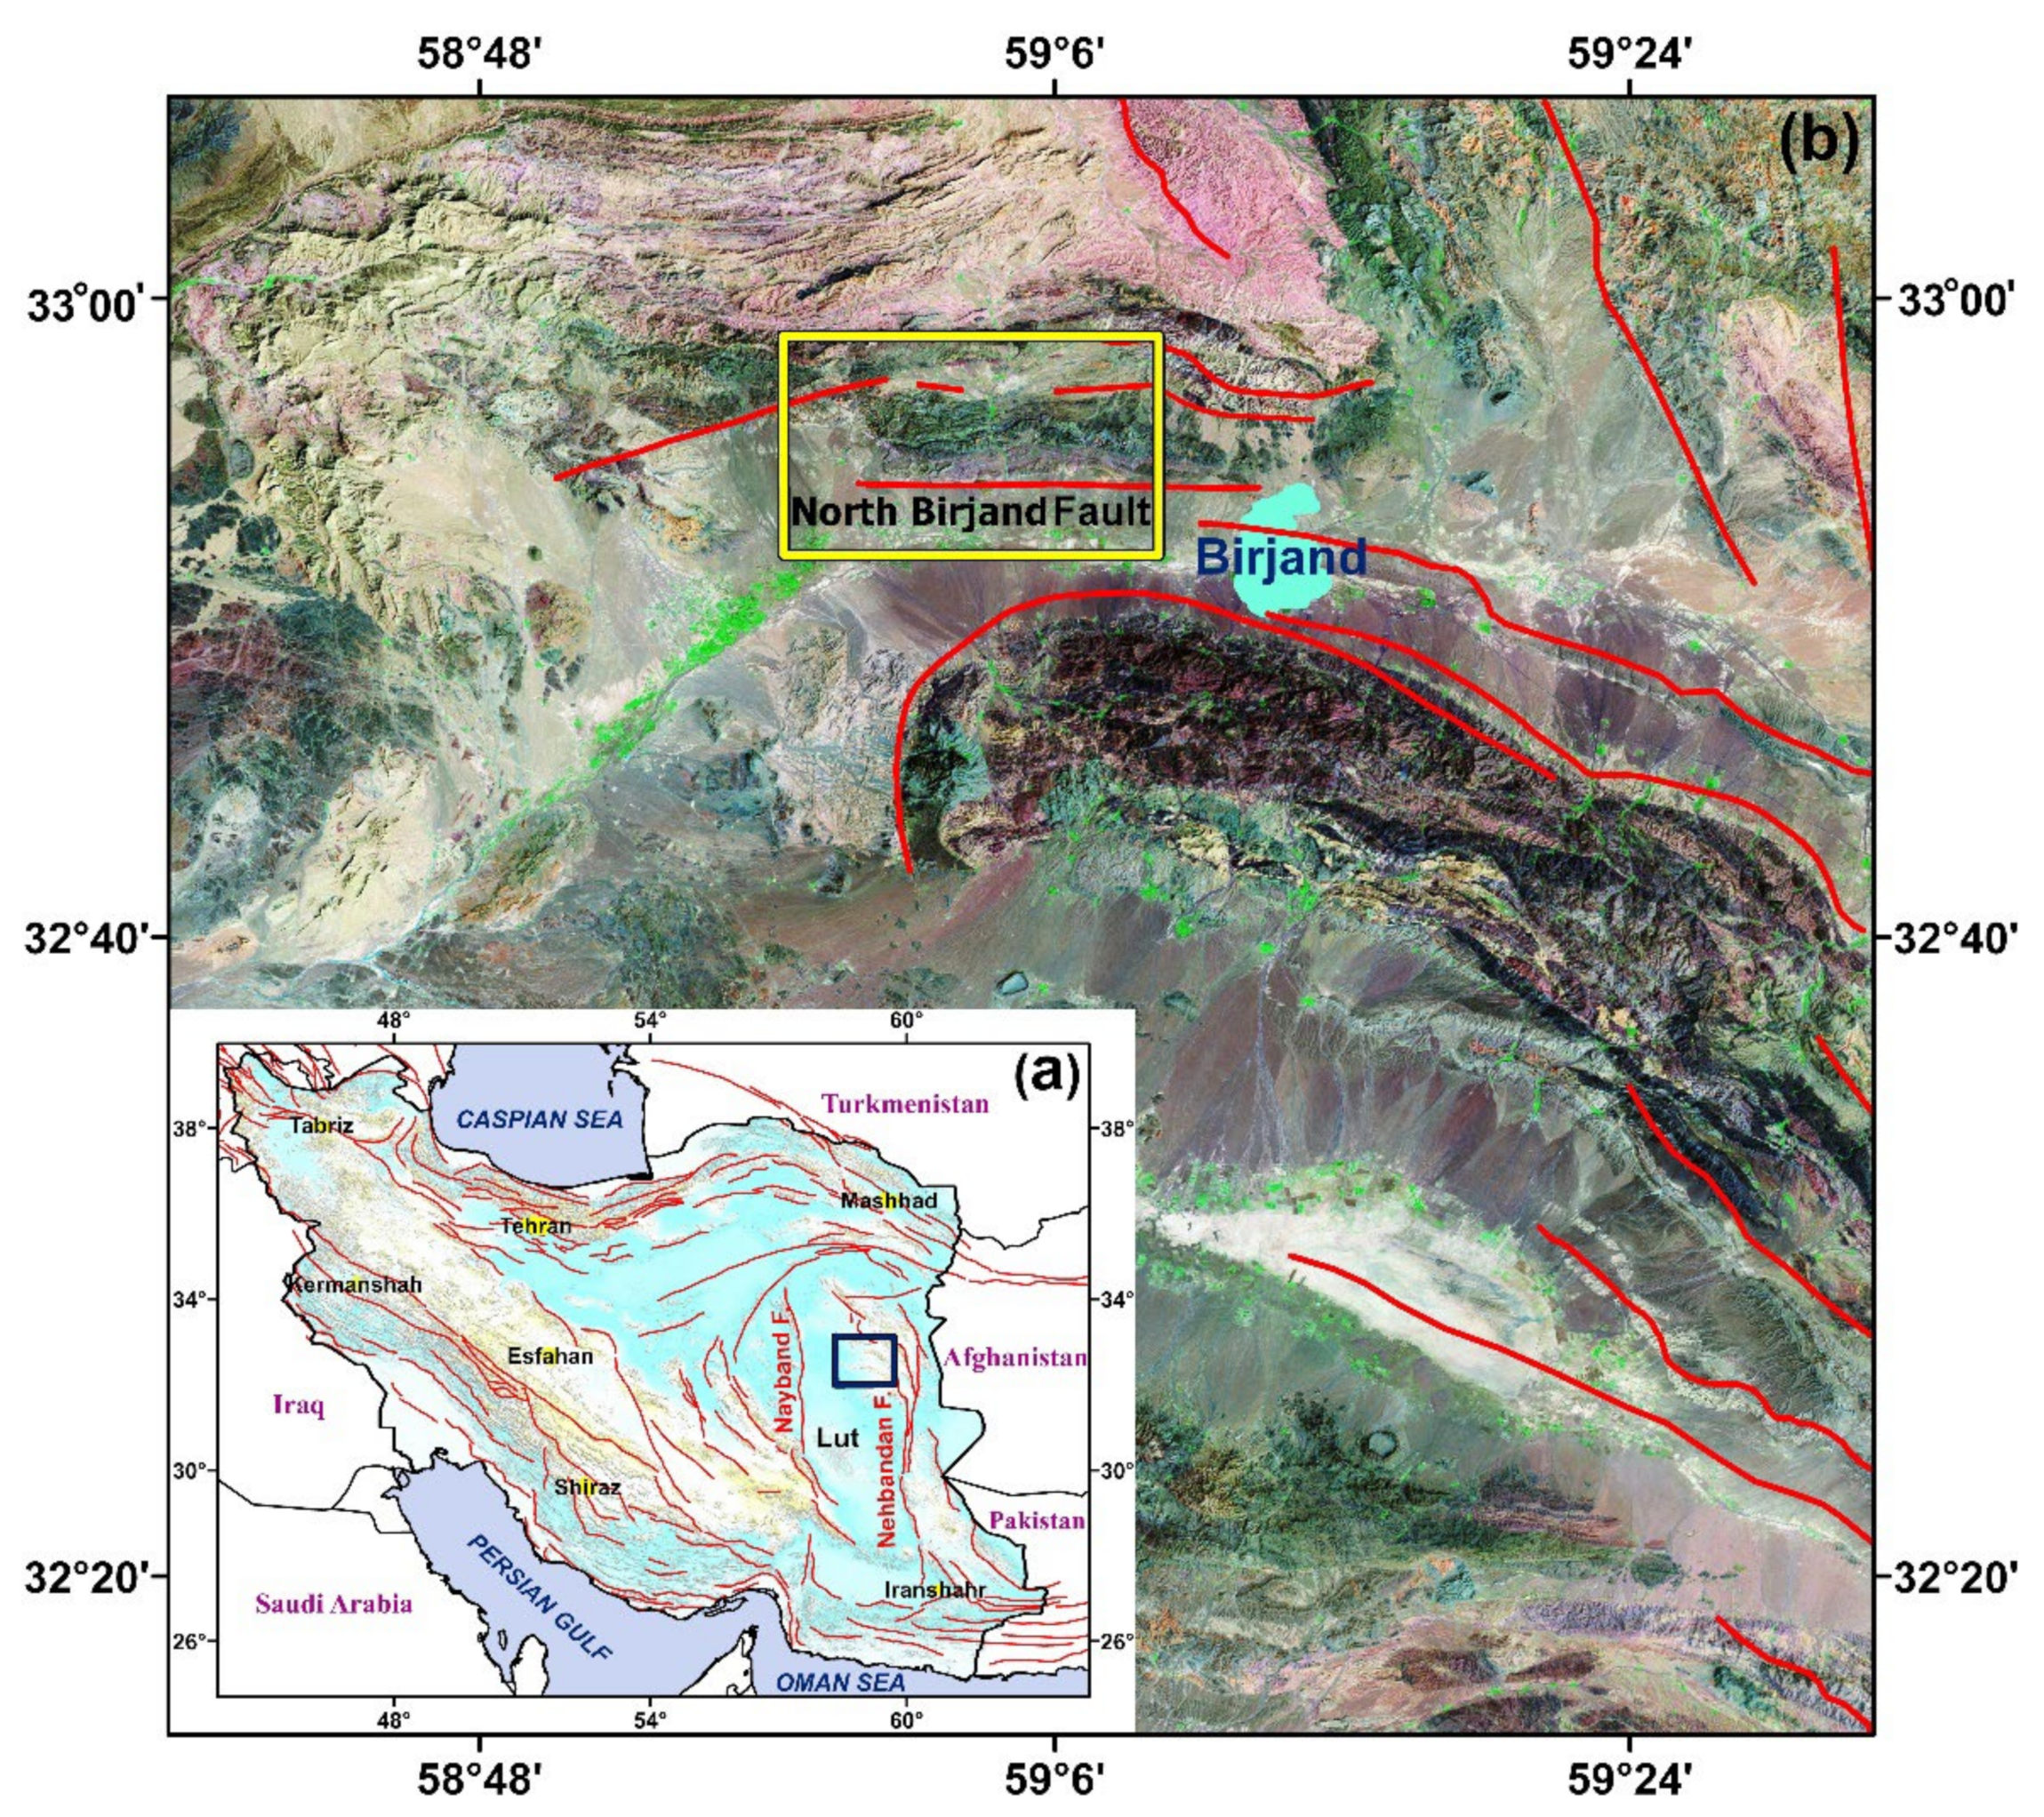
26]. Tectonic activities are relatively high in the Birjand area (
Figure 1), which contains a series of NW–SE and EW linear mountain ranges. The ranges are separated by narrow basins with young terraces and gravel fans [
27]. According to the geological map [
27], alluvial units are Quaternary in age, whereas folded gravel bed sediments and all older alluvial units are Neogene [
28]. The sediments’ Neogene age indicates that the geological structures in which they are exposed are late Tertiary relics. In the Sistan suture zone, the ranges represent ophiolitic rocks from the Late Cretaceous to the Eocene epochs. The trend of the shear zones and lithological units in the Sistan structural zone runs parallel to the topography [
28]. In particular, the trend of the geological structure (North Birjand fault) is EW along the northeastern margin of the Lut in the north and northwest of Birjand (
Figure 1). Numerous extension structures (fissure swarms, mostly NS trending) have developed in this area along the North Birjand mountains.
We initially thought they were formed as a result of subsidence or water erosion; however, field studies revealed that they were formed as a result of tectonic activity. We identified their characteristics, origin, process, and mechanism of formation in this study. The North Birjand fault is the main fault in the study area, which can be assumed as a segment of the splays at the north termination of the Nehbandan fault zone as a dominant structural trend in the east of Iran [
28,
29] (
Figure 1). Previous studies in the Birjand area [
8,
28,
29,
30,
31,
32], have revealed the importance of right-lateral strike-slip and reverse faults in the area’s deformation, as well as the observation of various stress distributions related to the regions’ plasticity and fracture intensity [
28]. The presence of extension structures (fissures) in the center of a compressional zone is an unanswered question addressed in this paper (
Figure 2).
3. Methods and Results
Structural characteristics of the faults, fault-propagation folds, and fissures in terms of density, length, number, and position related to the fault plains were determined using merging topography terrain interpretation, satellite image analysis, and field surveys. We produced a digital elevation model (DEM) (accurately 0.03 m) using the real-time kinematic (RTK) technique in order to prepare the detailed topographic cross-sections of the area. We used the Mohr circle method for the cross-sections and applied two-dimensional strain types along with them (volume strain on planes XY and YZ). Based on the volume strain on planes XY, YZ, and XZ, we calculated the 3-D volume strain within the fault zone.
3.1. Observation and Interpretation of a Fissure Structure
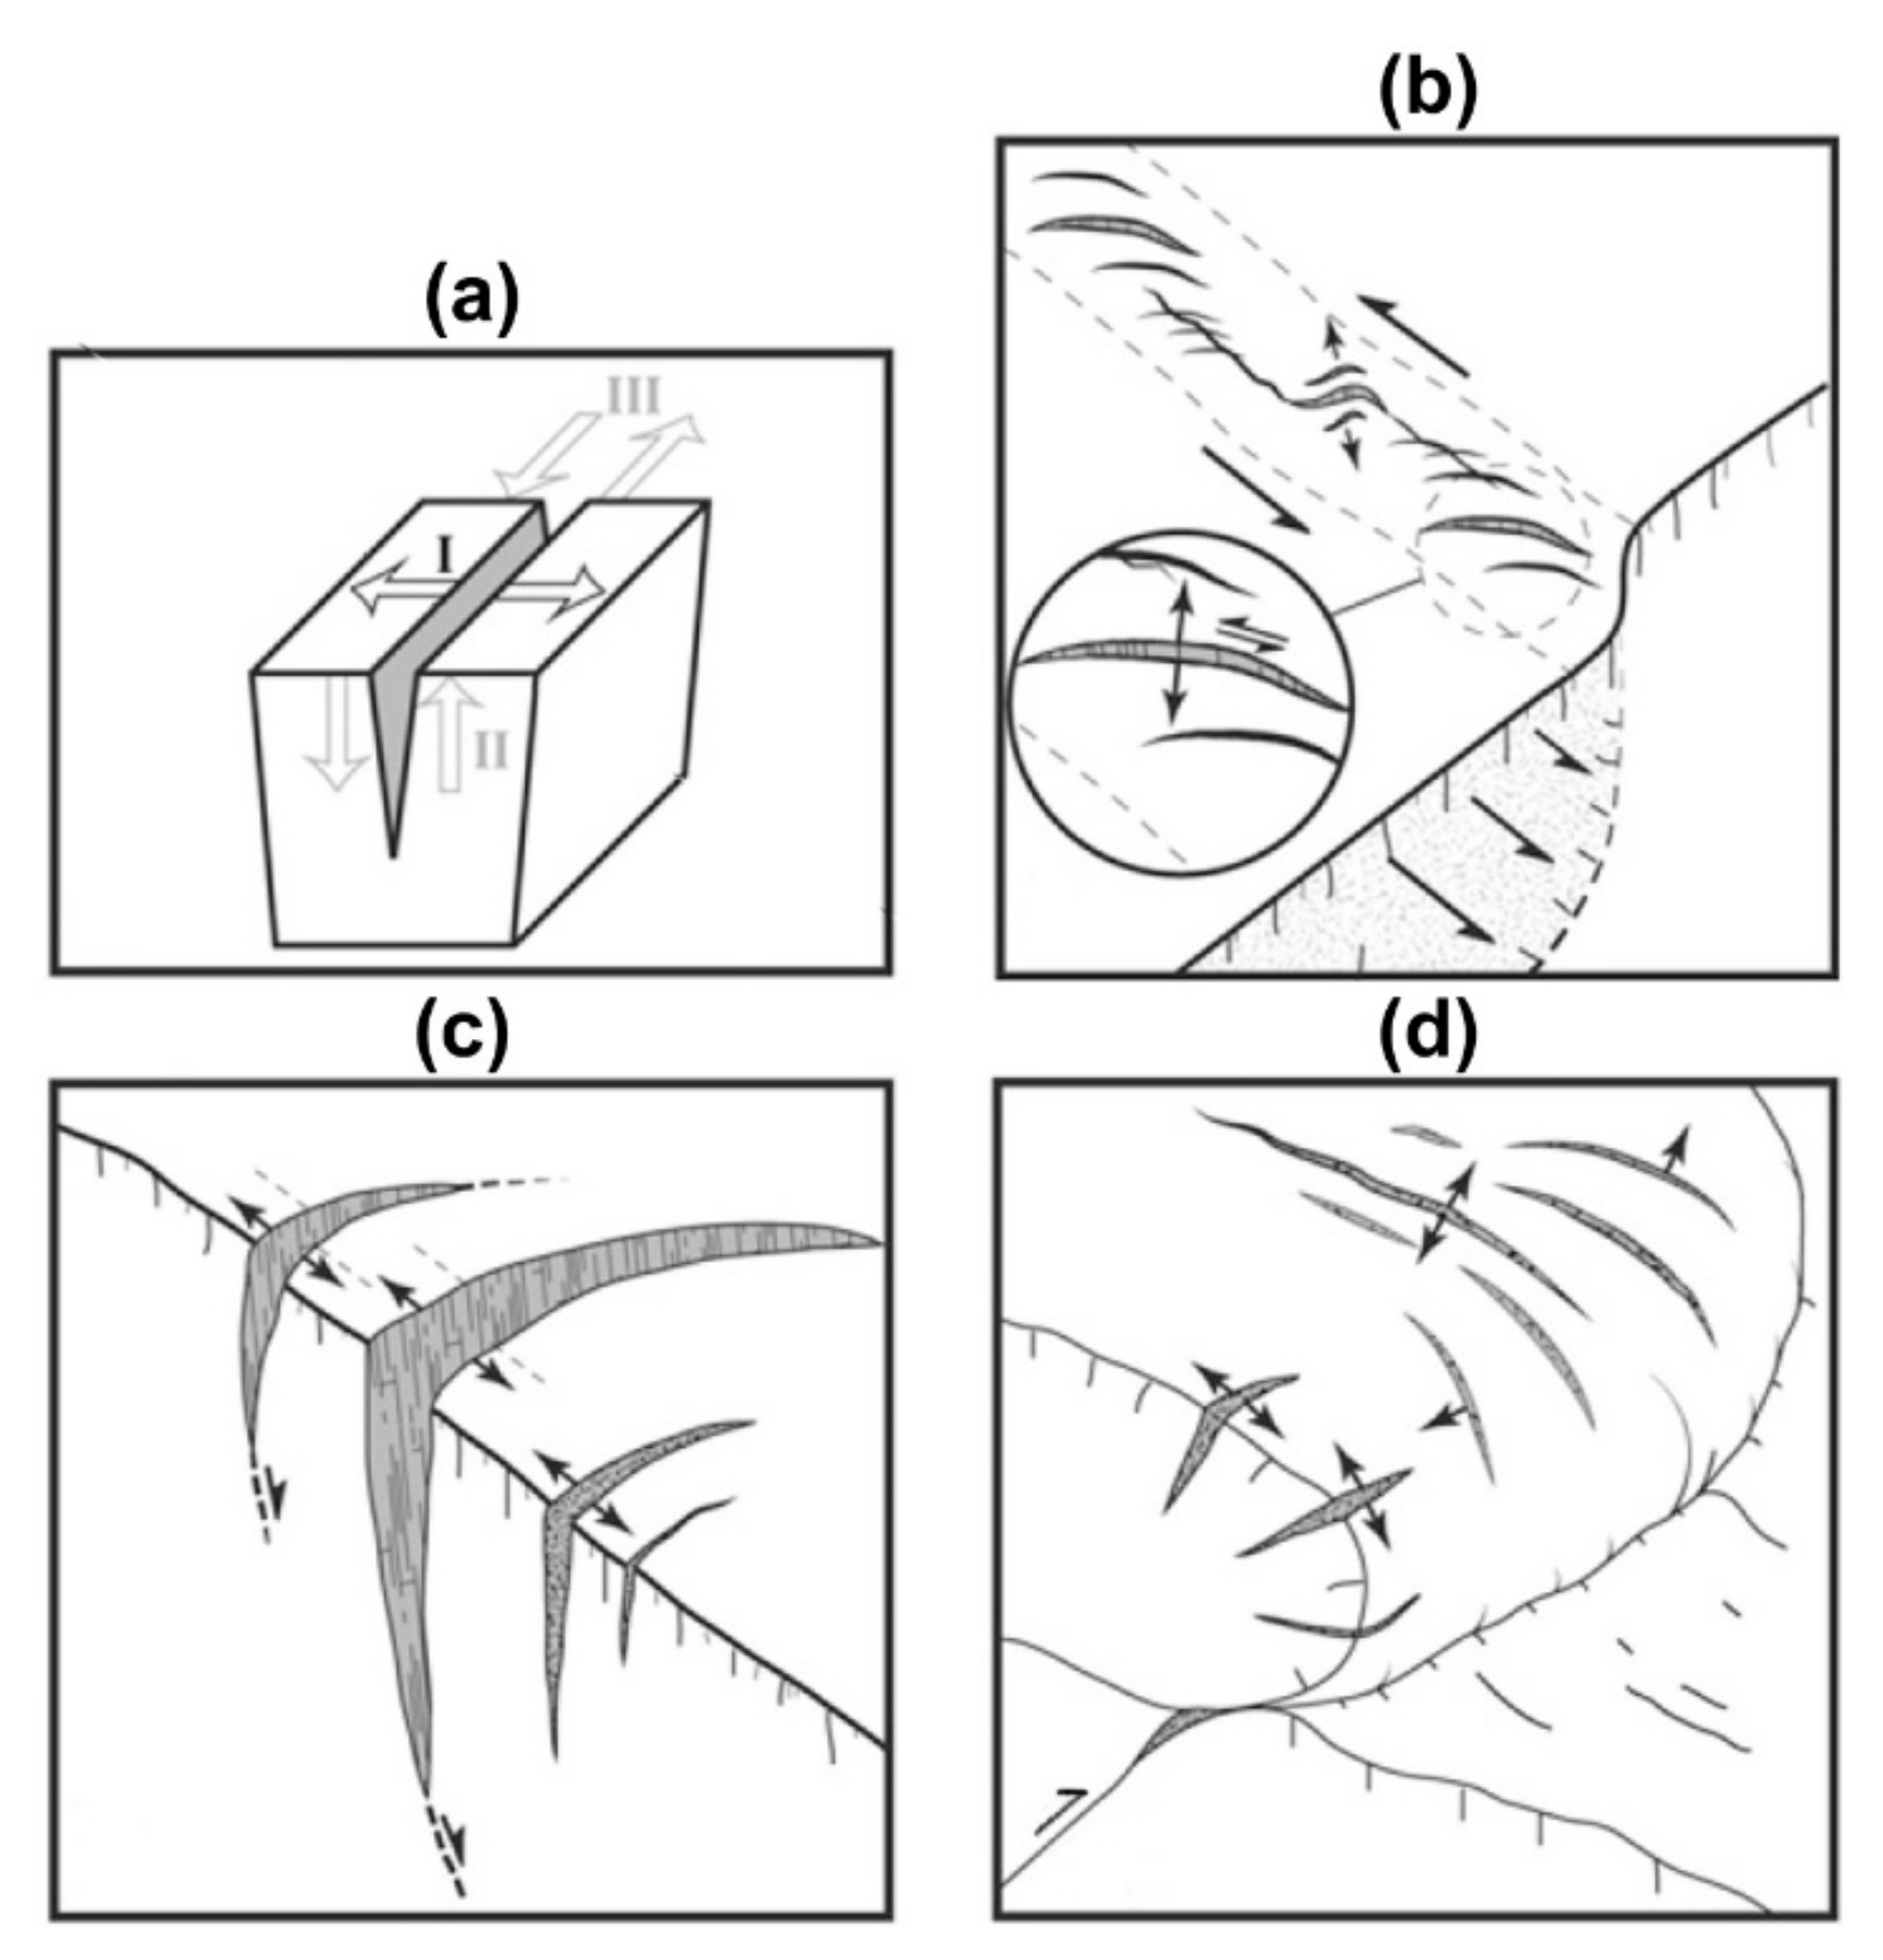
Figure 3b–d depicts the most commonly used fissure patterns, which are known as “geo indicators” of specific deformation processes in some studies [
5,
33,
34]. The formation of en-echelon fissure arrays (
Figure 3b), also known as Riedel shears, is one of the more consistent pieces of evidence for such a pattern. Shearing in the margins of the blocks with different or similar displacements typically causes tensile and shear stress. Transversal fissure arrays (
Figure 3c) are commonly associated with tension in the steeper upper slopes, whereas fissures generated by lateral extension and compression (
Figure 3d) are typically associated with the gentler slopes in the accumulation and transit zones along a fault. The location of fissure patterns corresponding to fault zones with complex geometry may deviate significantly from this simple scheme [
33] (
Figure 3).
3.2. D Volume Strain
Strains deal with the shortening and stretching of nearly linear (straight) objects or lines in a one-dimensional state. One could argue that one-dimensional strain makes no sense because stretching straight lines only changes their length. In other words, a change in form, such as from a circle to an ellipse, can be explained by a change in the length of the lines in different directions. As a result, changing the length of the lines in the sense of strain is appropriate.
Elongation, stretching, extension, shortening, and contraction are all examples of specific characters that can be used to describe strain values, and they are dimensionless. Line elongation is calculated as e = (L − L0)/L0, where L and L0 are the line lengths after and before deformation, respectively. Elongation in the natural or logarithmic form ē = Ln € is also used. In general, positive elongation (e) is used to describe the extensional area, whereas negative extension is referred to as contraction (the concepts of tension and compression are reserved for stress). Line stretching is determined by s = 1 + e, where s is the stretch. As a result, s = L/L0 stretching factors are commonly associated with the structural analysis of extensional basins and rifts. These are sometimes referred to as b-factors, but they are identical to s.
Quadratic elongation, λ = S2, is equal to the Eigenvalues of the matrix (D). Quadratic stretch is a more accurate concept, as it considers the square of the stretch, rather than its length.
Strain is affected by changes in an element’s shape and dimensions. When the deformation is along a single axis, strain concepts can be defined as follows:
where α, B, and γ are the angles formed by the normal of the plane and each of the principal stress axes (x, y, z). The normal strains are generally parallel to three perpendicular axes. Typically, the stress function modifies the element’s volume. For this reason, volumetric s€in (e) is calculated as a function of normal stresses:
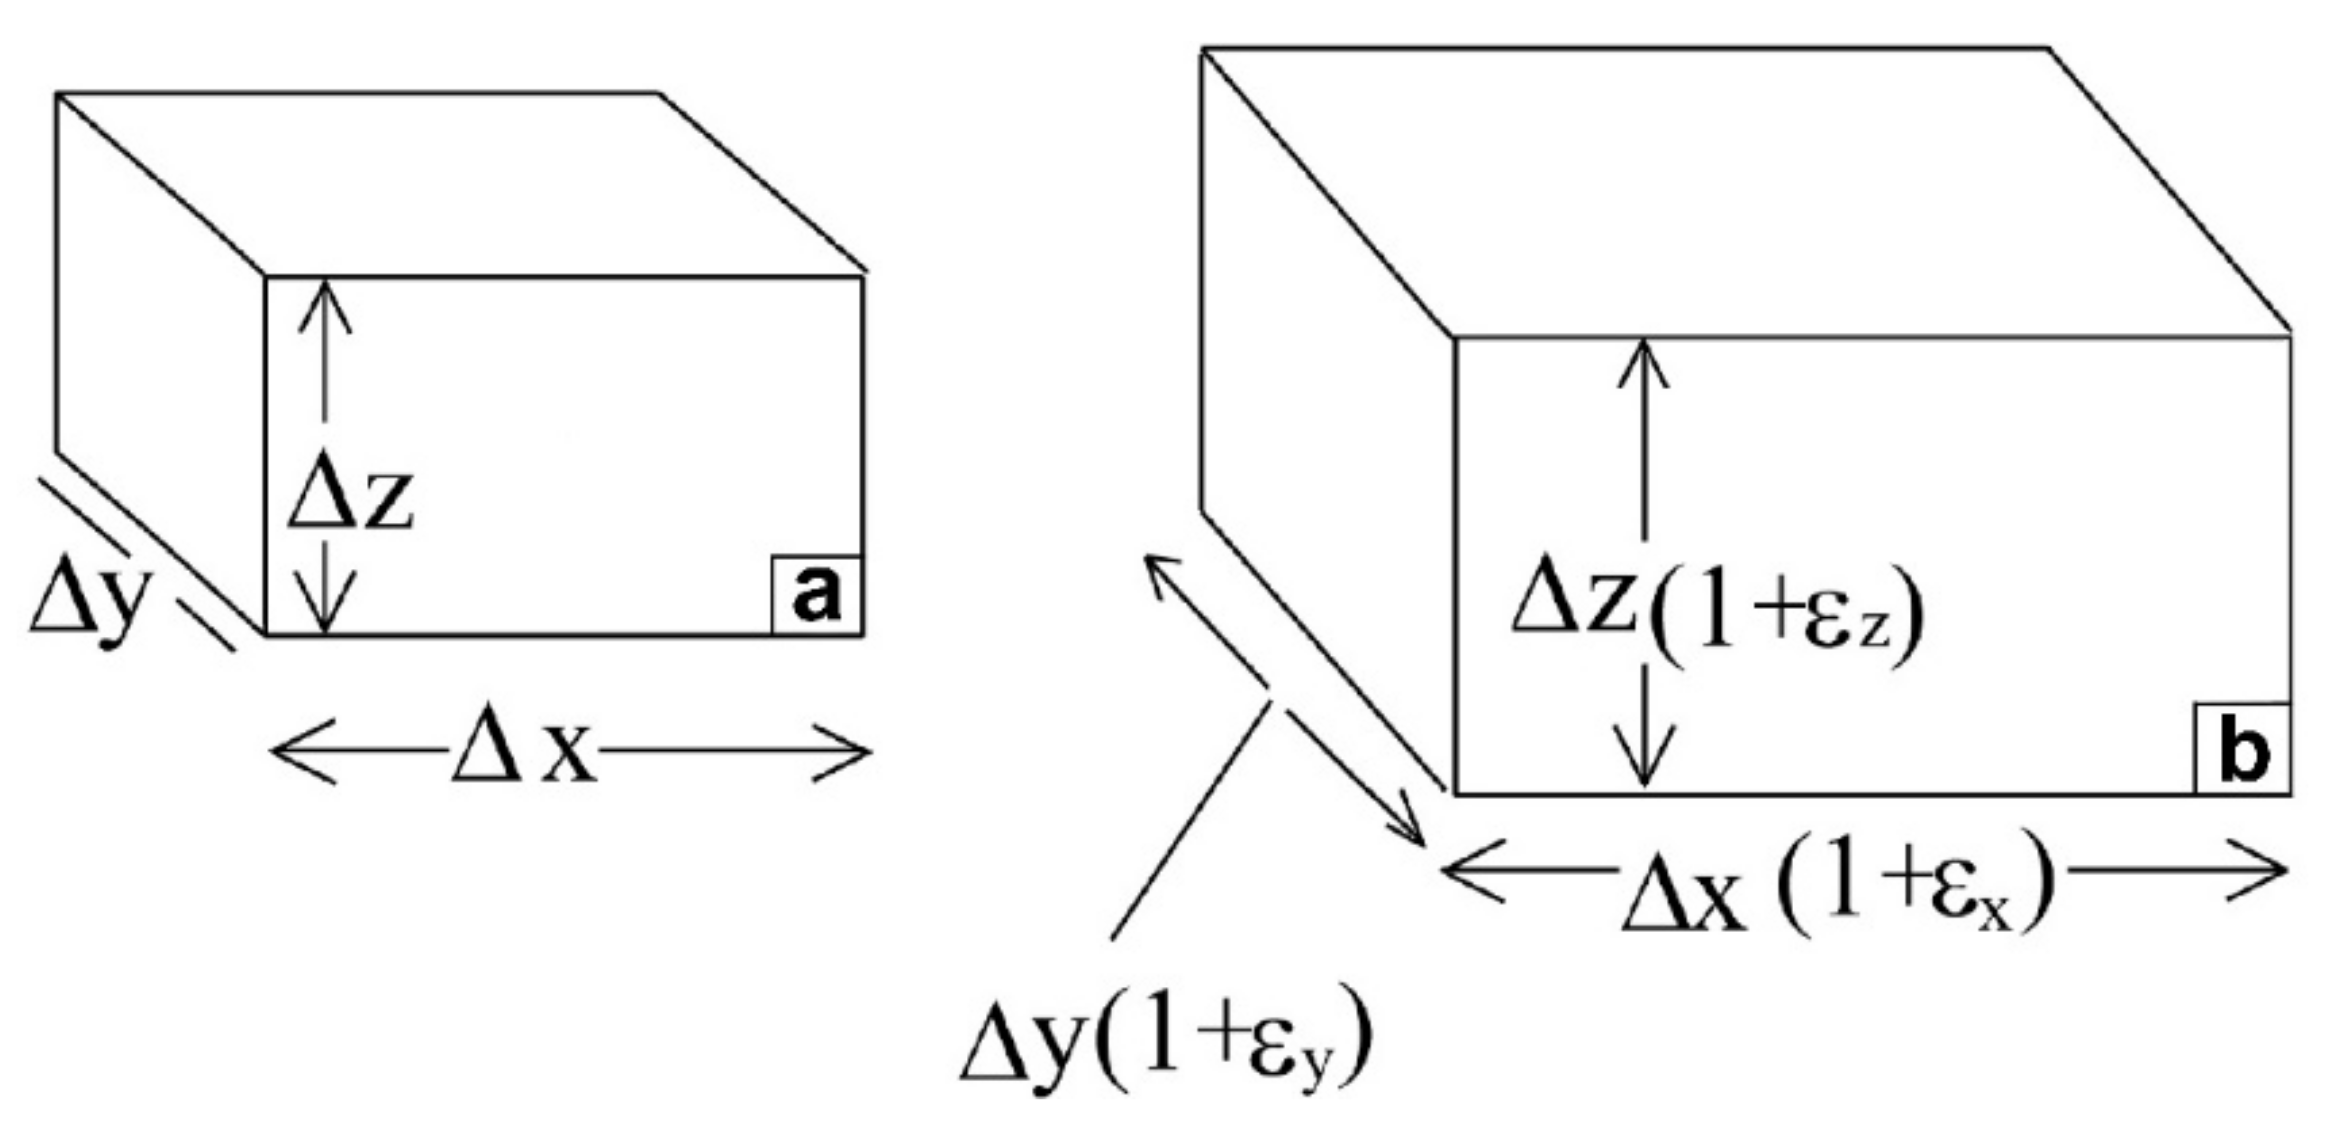
The normal strains similarly affect the volume strains. The original volume of the rectangular solid was calculated using the formula V
0 = Δx. Δy.Δz. (
Figure 4), whereas for a deformed body, it would be calculated as:
Figure 4.
(a) Coordinate axes in a block diagram; (b) coordinate strain axes of the block for the obtained volume strain.
Figure 4.
(a) Coordinate axes in a block diagram; (b) coordinate strain axes of the block for the obtained volume strain.
Since the strains are small, the high order terms are ignored, where
Finally, volume strain can be defined as:
3.2.1. Volume Strain on Planes XY, YZ
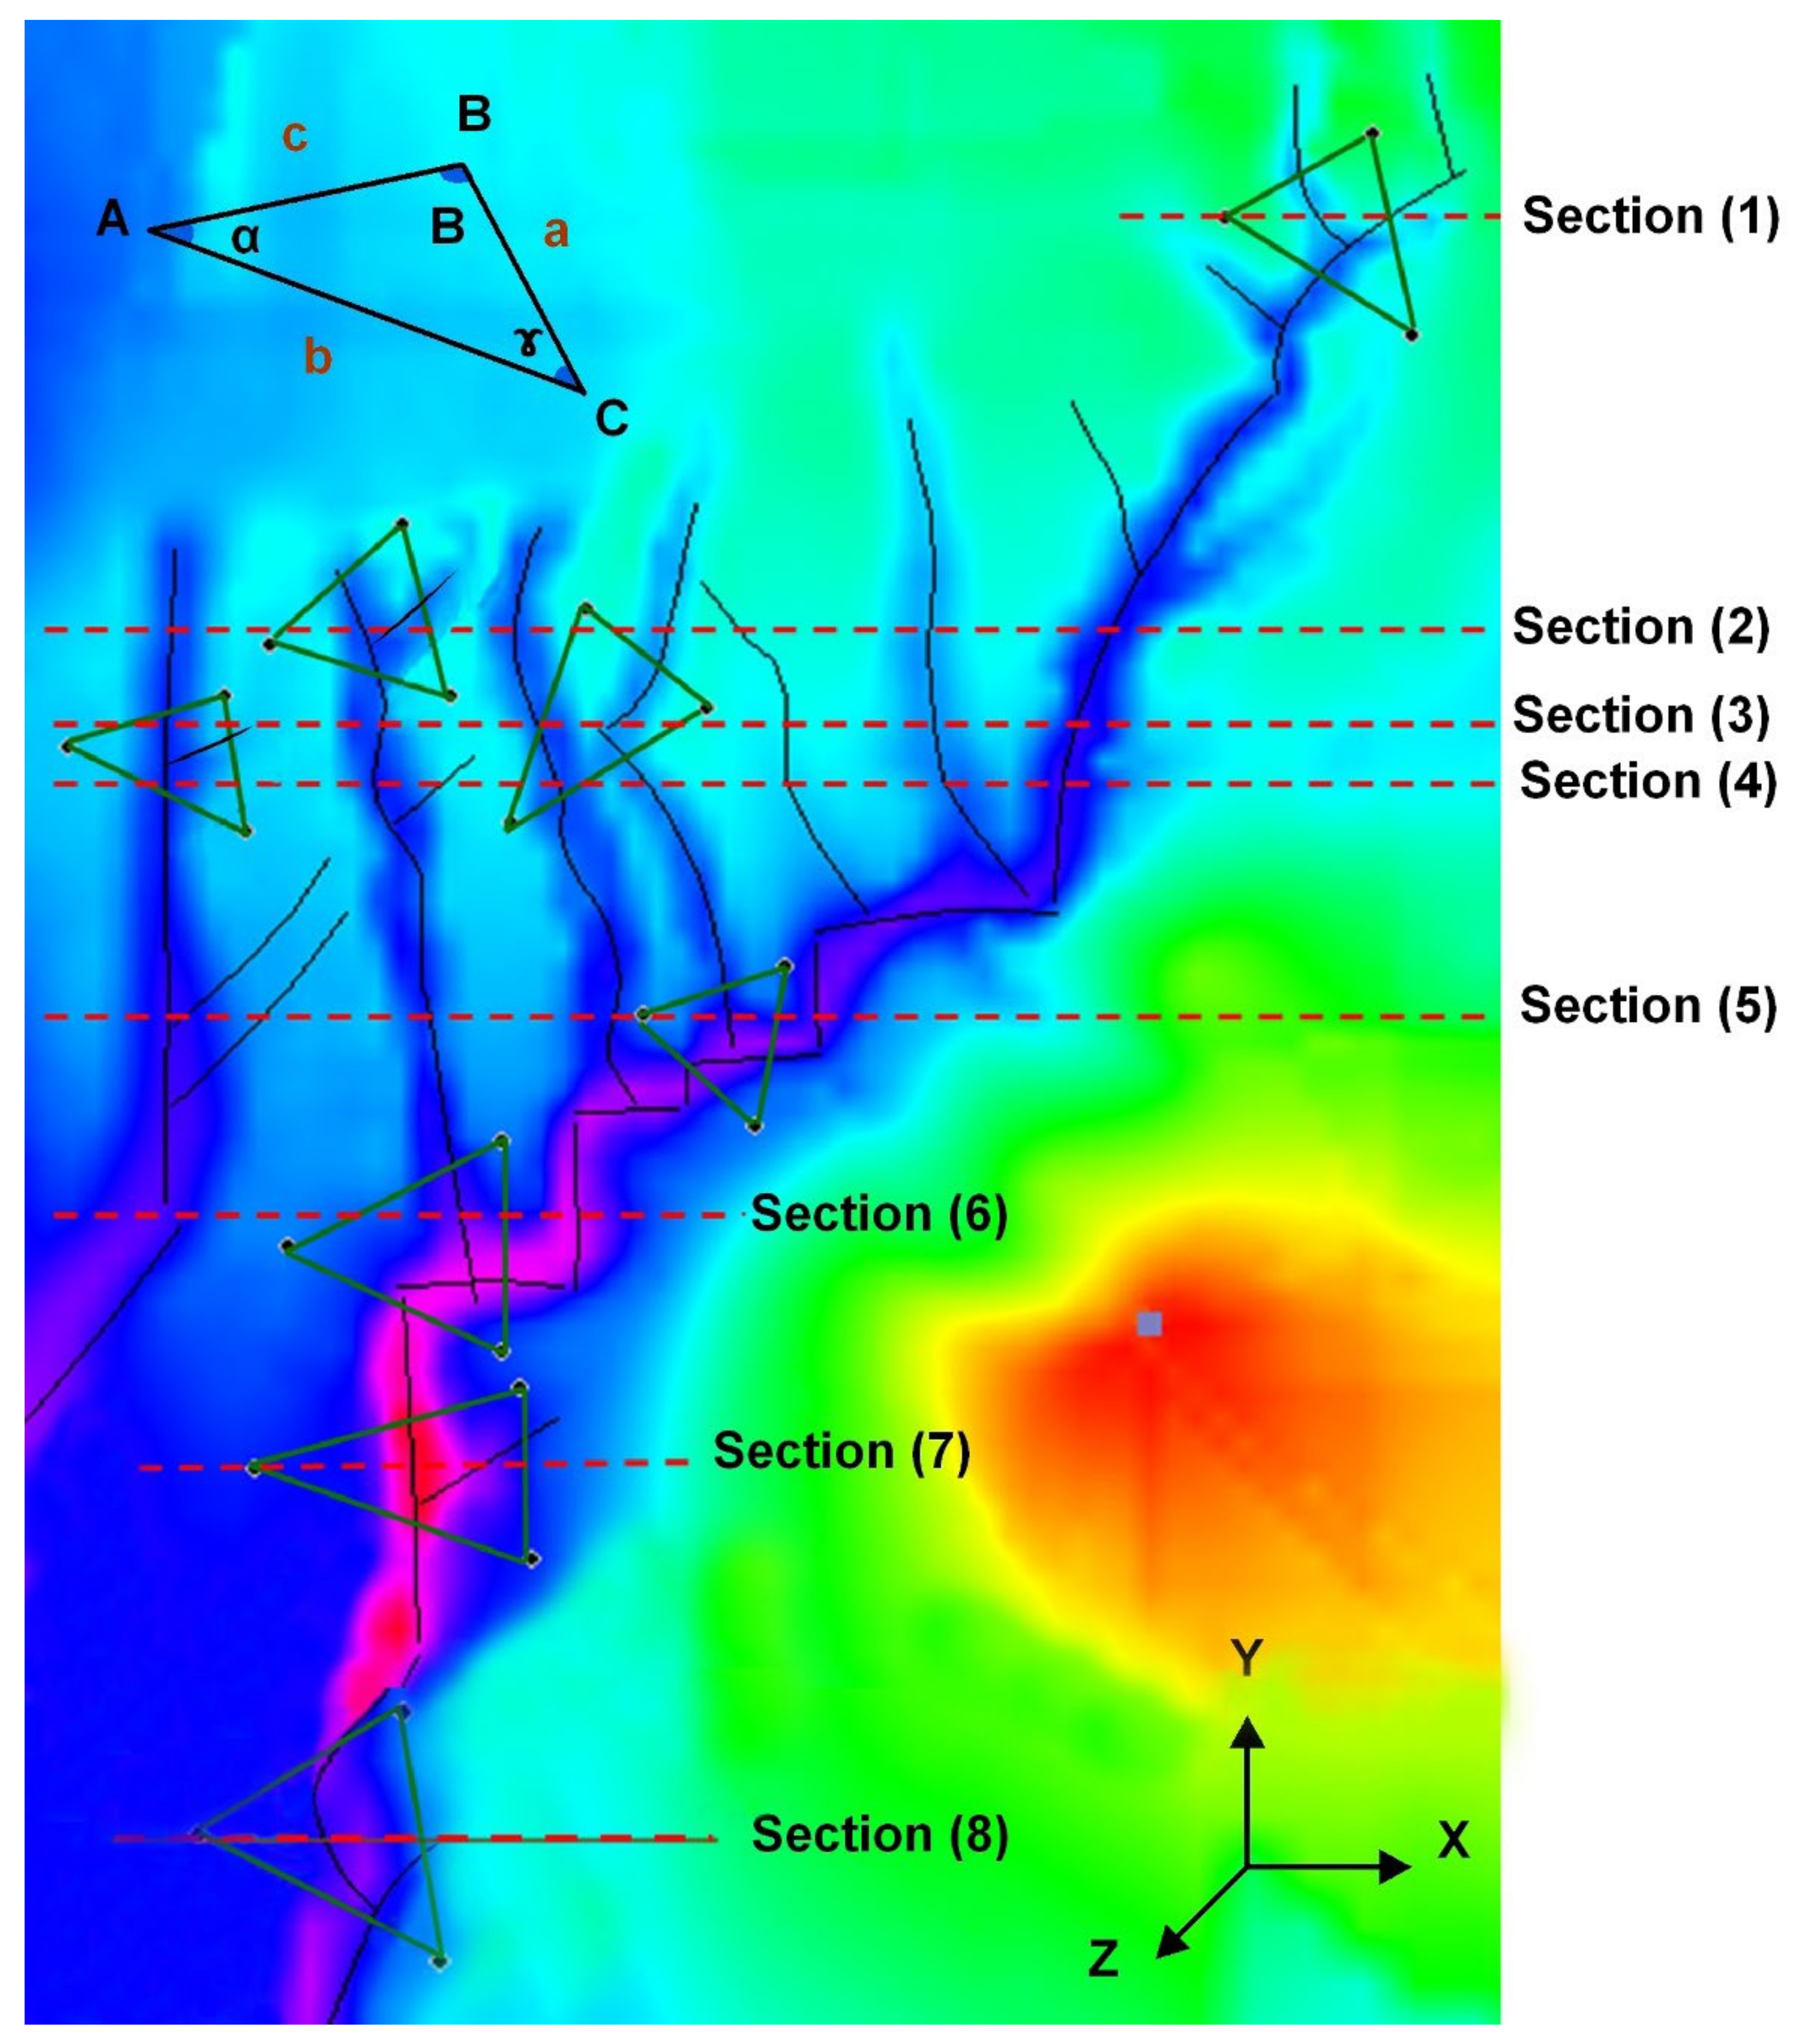
On XY and YZ planes, we used the Mohr circle method for two-dimensional strain analysis. There are fissures among the three trends in this method (
Figure 5).
Figure 5 shows a digital elevation model (DEM) of a case study of fissures in a part of the area that we obtained to assist Kinematic GPS. We calculated the strain ellipsoid using Mohr’s method: (
).
We used the Mohr circle method for eight cross-sections of the DEM image (
Figure 5) and applied two-dimensional strain types along the cross-sections (
Figure 6 and
Table 1) to assist in Equations (2), (3) and (5). Finally, R
XY, R
YZ, and D are calculated on planes XY and YZ (
Table 2).
3.2.2. Volume Strain on Plane XZ
To achieve a three-dimensional volumetric strain, we must include the strain in the calculations along with the XZ plane. The volumetric strain ratio is applied to the planes XY and YZ in Equation (5). Therefore, along with this plane, in the desired directions (
Figure 5), cross-sections (
Figure 7) and the volume strain ratio on the plane (XZ) were prepared to assist the cross-sections (
Table 3).
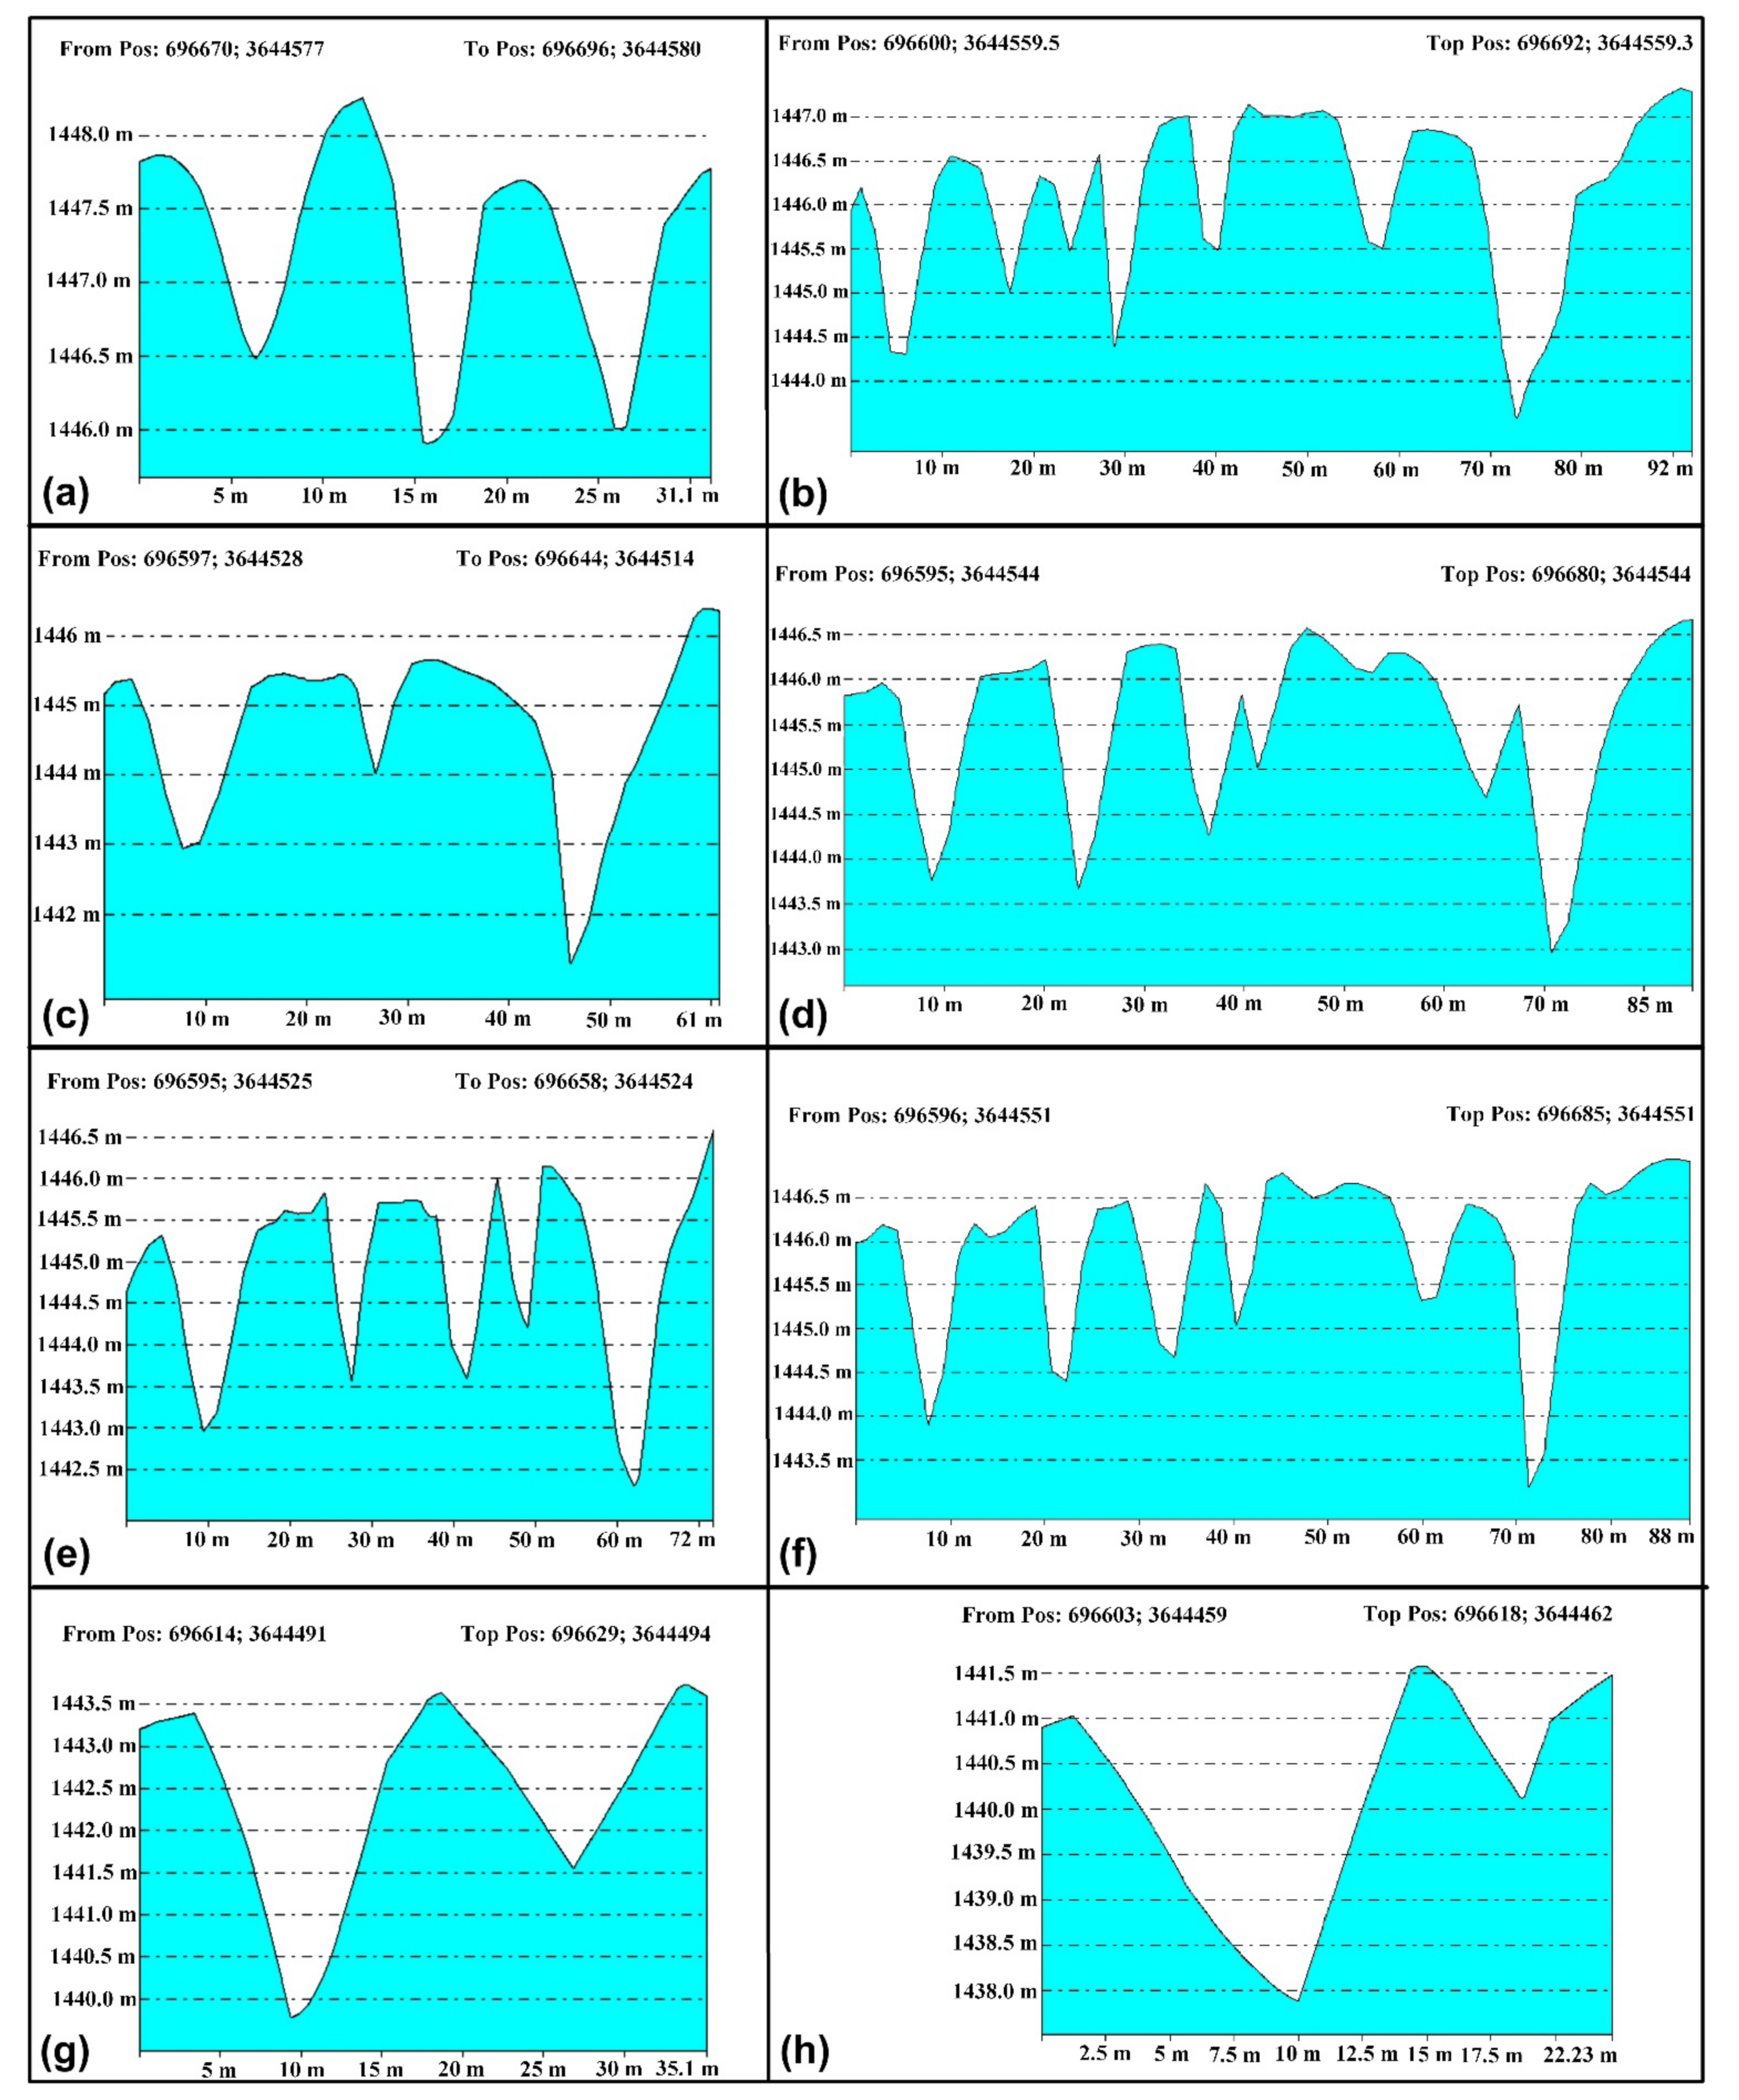
The eight cross-strike profiles were performed throughout the case study’s fissure swarm. The findings suggest that the majority of fissures are open fractures with minimal vertical displacement (
Figure 5 and
Figure 7). Each main fissure is composed of a densely packed group of gashes ranging in depth from a few centimeters to 9 m, with individual gashes ranging in width from a few centimeters to 2 m. The fissures are nearly V-shaped and appear to be opening I-type fractures.
3.2.3. Results of 3D Volume Strain in the Study Area
The 3D volume strain permits the simultaneous assessment of strain and volumetric changes resulting from the creation of fissure structures. The purpose of this section is to investigate and describe the 3D volume strain changes with distance from the fault in a specific part of the study area.
Generally, a complete strain analysis is performed in three dimensions. These values can be found in the Flinn diagram or similar diagrams that illustrate the strain’s elliptical shape, also referred to as the strain geometry. Furthermore, stereographic net tools can be used to visualize the direction of principal strains.
Field investigations of 3D strain are frequently based on combining the two-dimensional values of several oriented sections. It will be simple to calculate the 3D strain if each section contains two axes of the principal strain. Using the two-dimensional strain values calculated in the previous sections and according to Equation (7), the three-dimensional strain was obtained in the study area (
Table 4).
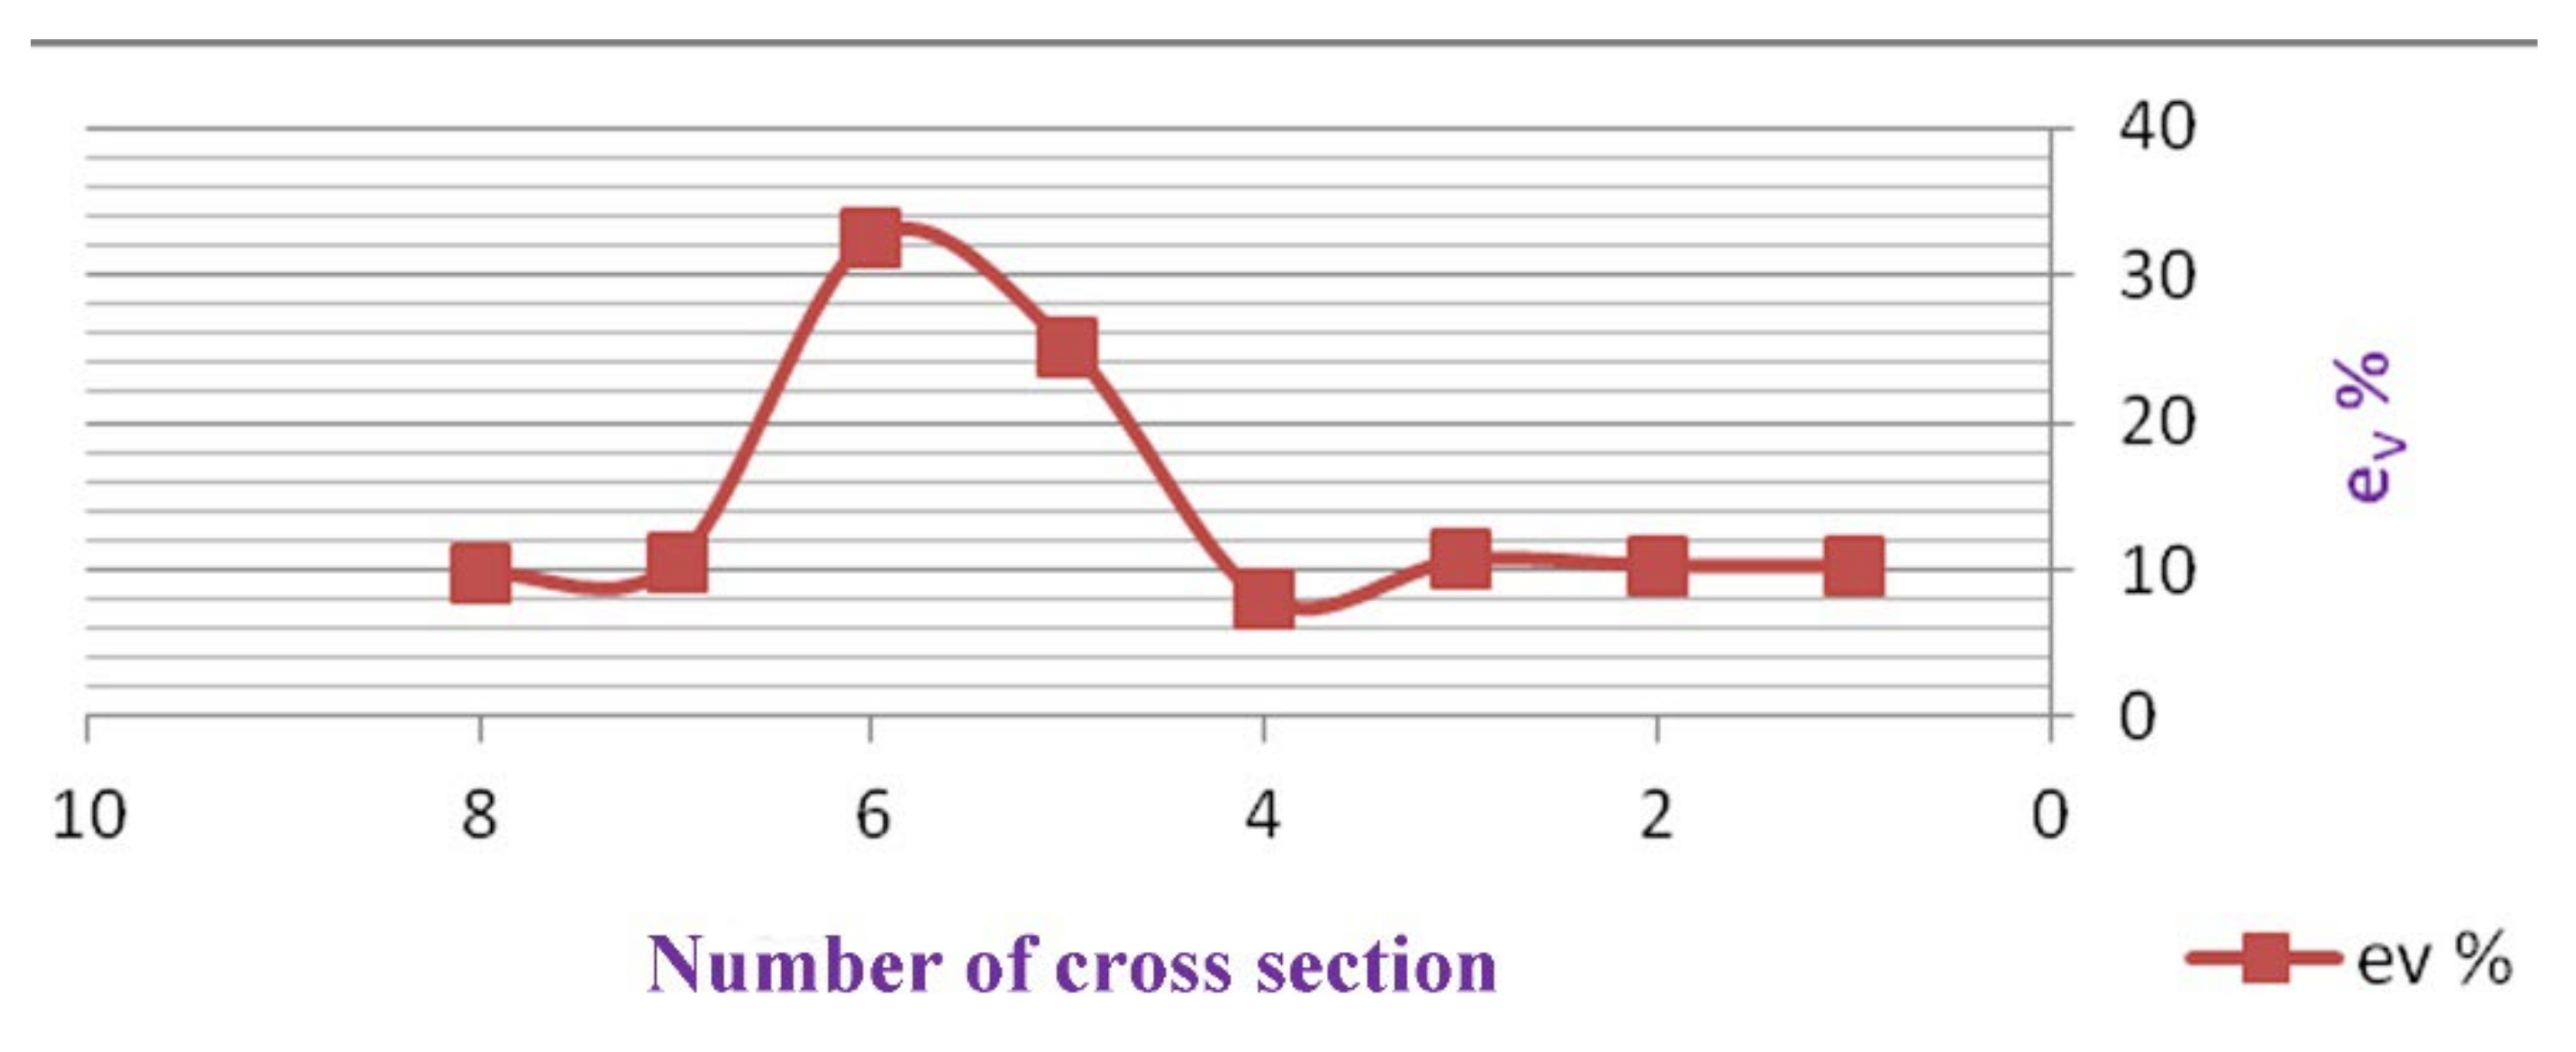
The average volumetric strain in the study area is 14.68 percent.
Figure 8 illustrates the volume strain changes in various sections of the study area, indicating that the greatest volumetric strain occurs along Sections 5 and 6, which contain the North Birjand fault’s youngest splay.
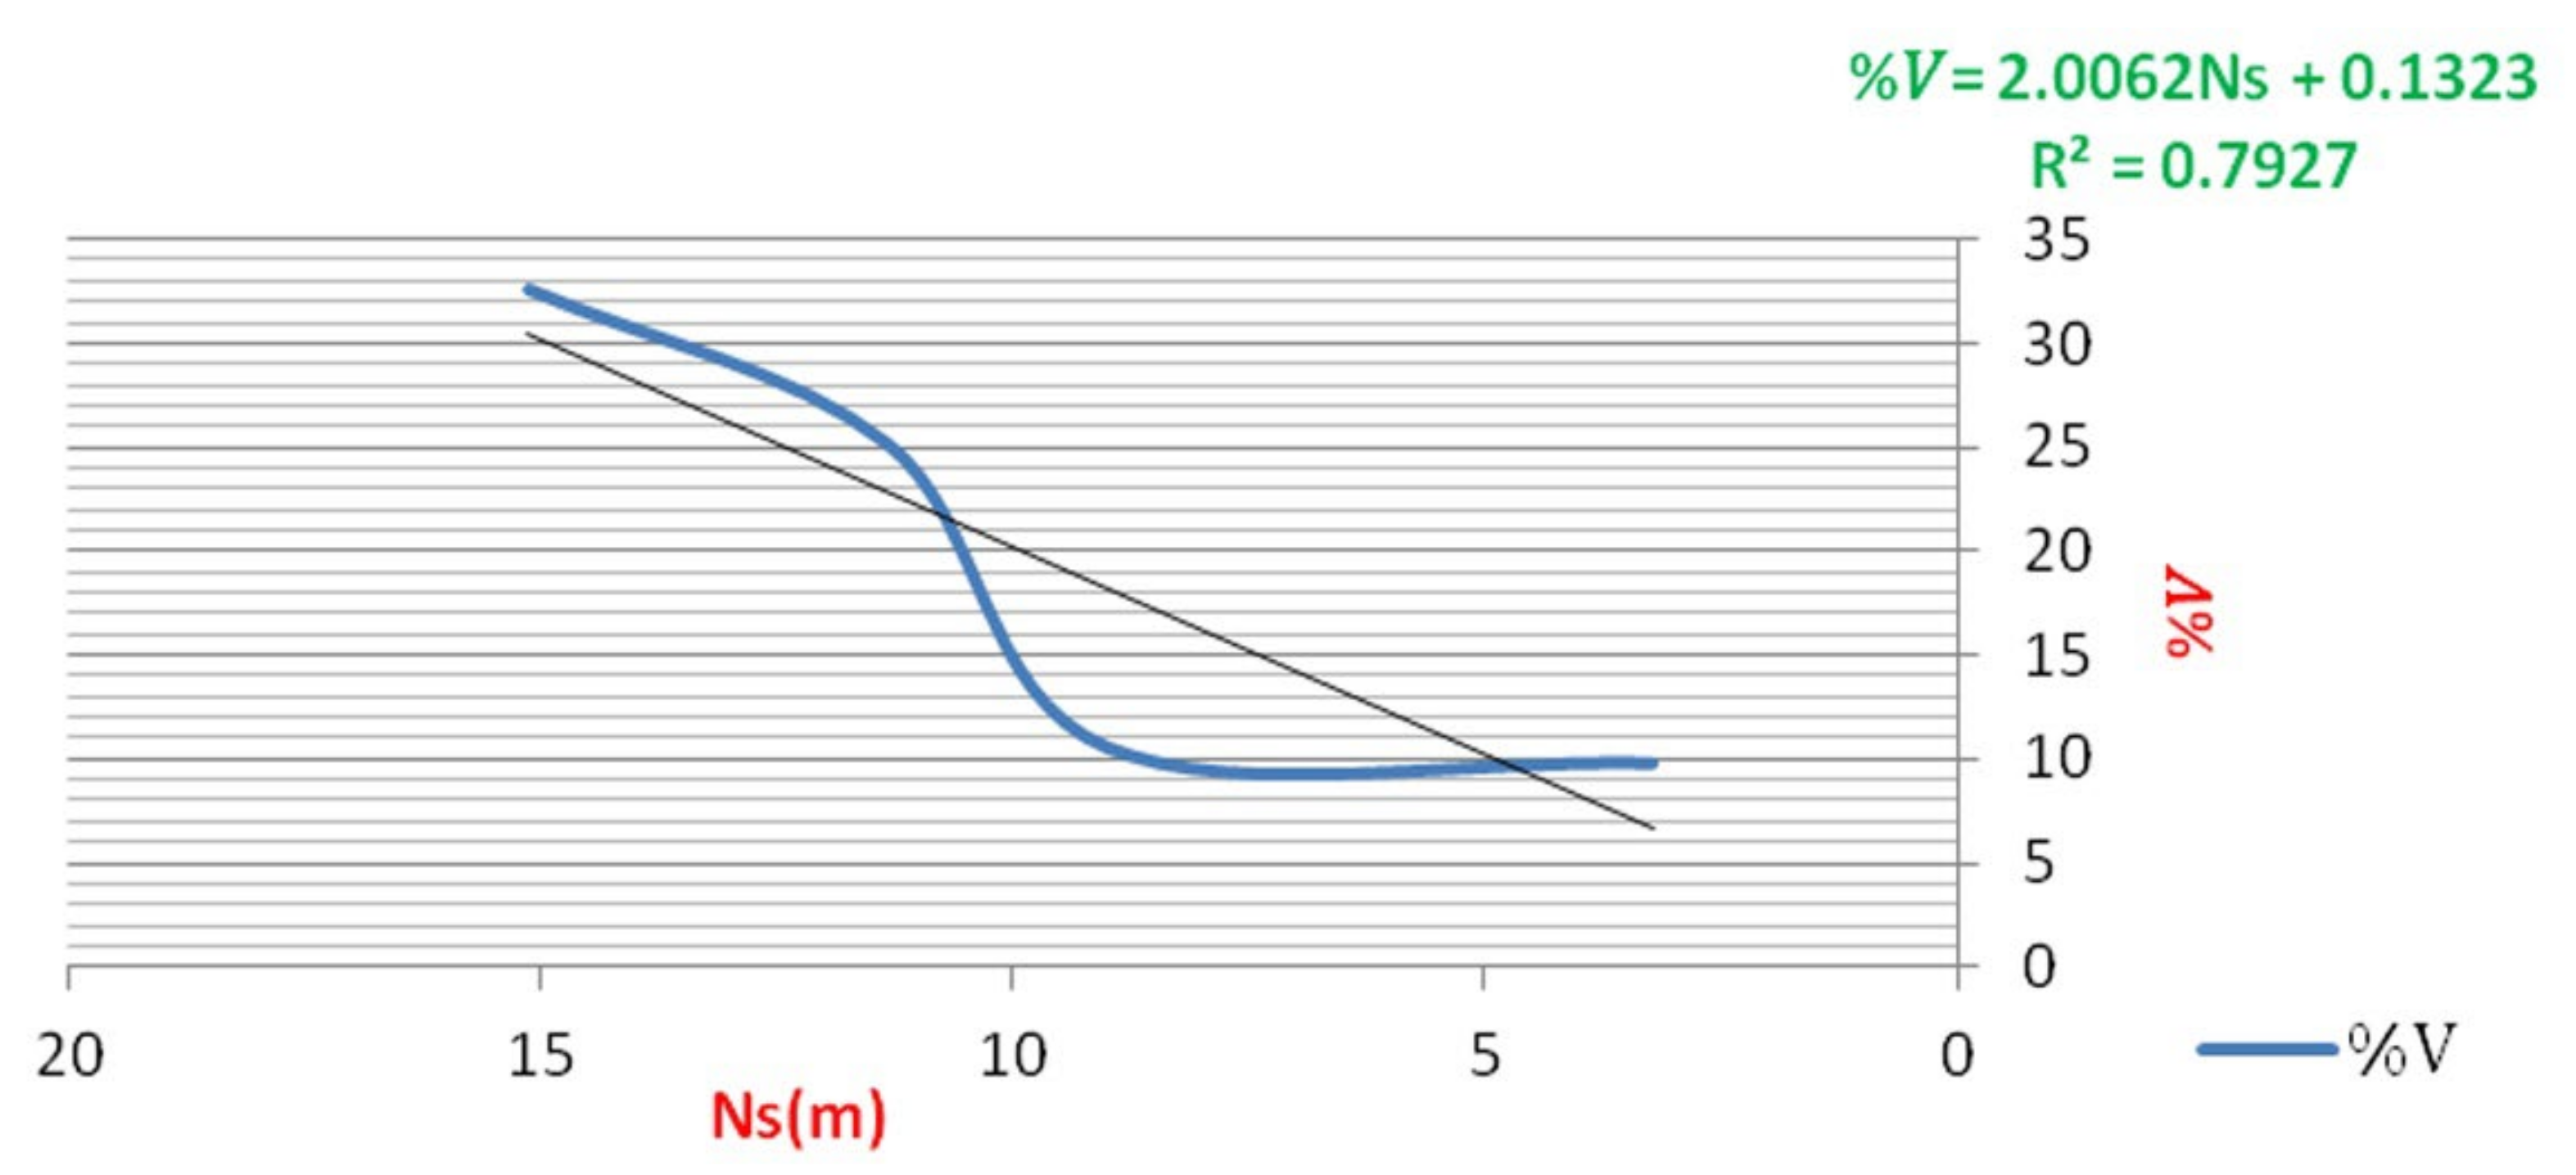
3.3. Relationship between Net Slip and 3D Volume Strain
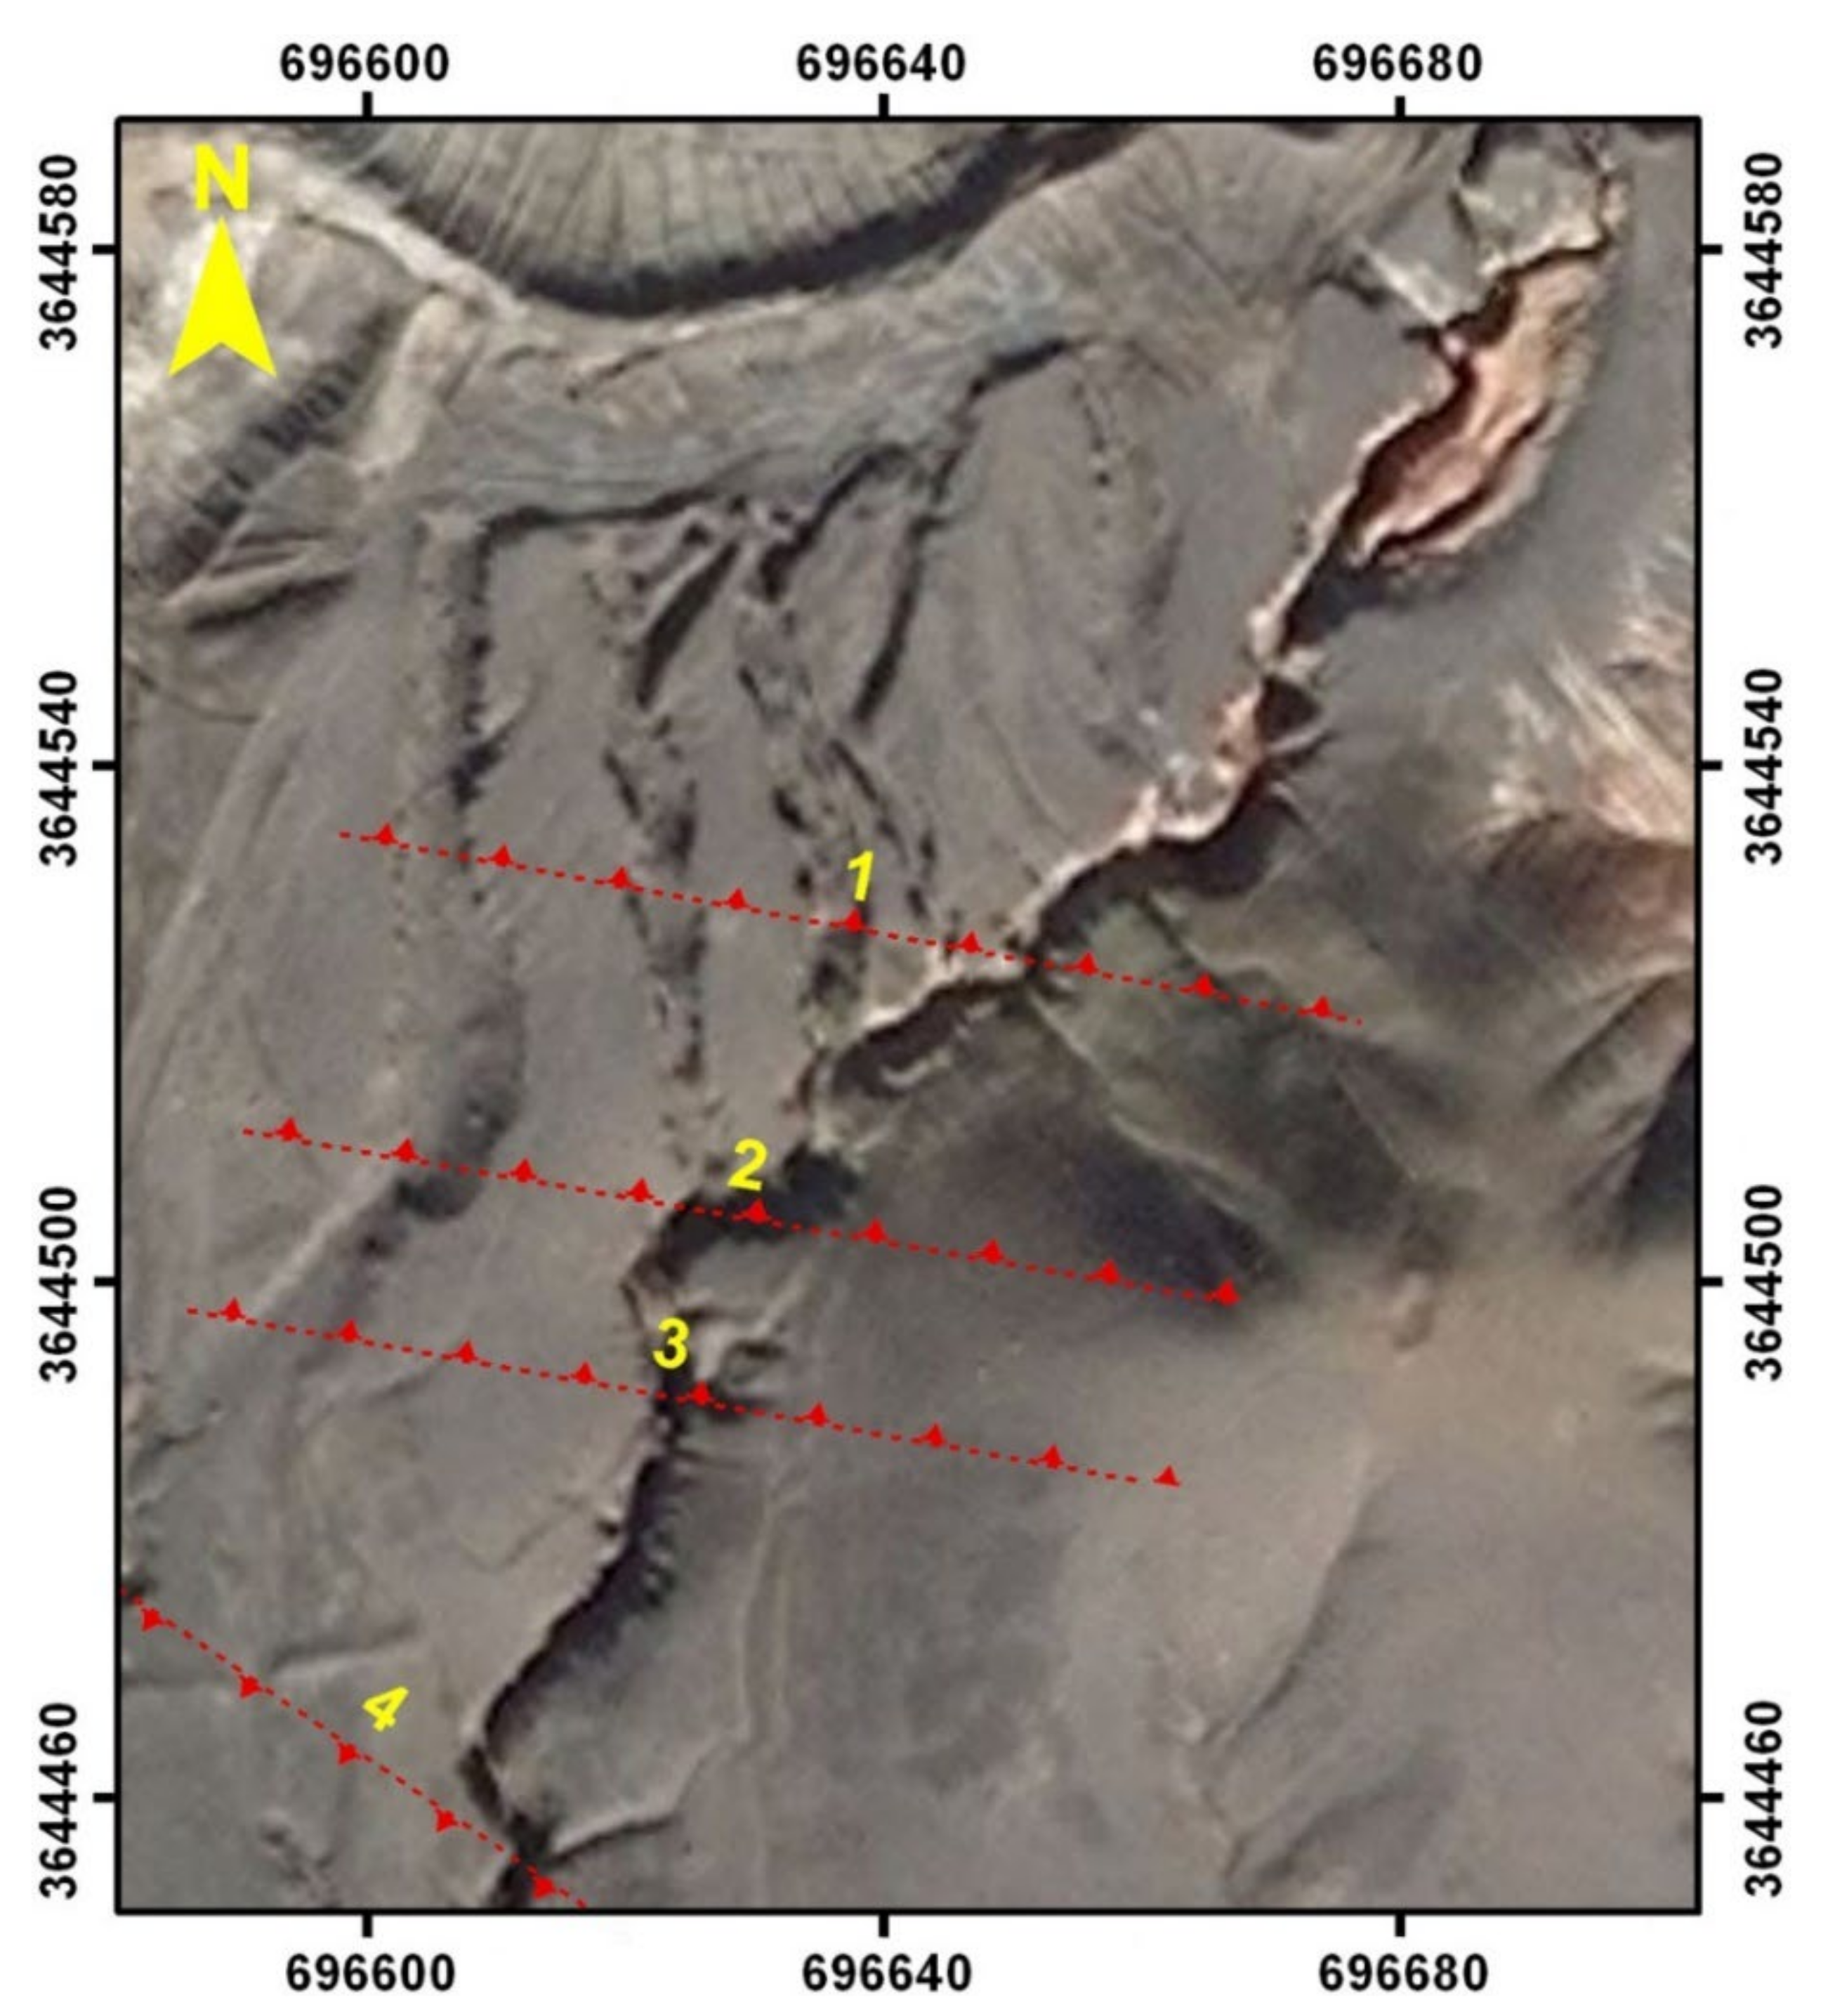
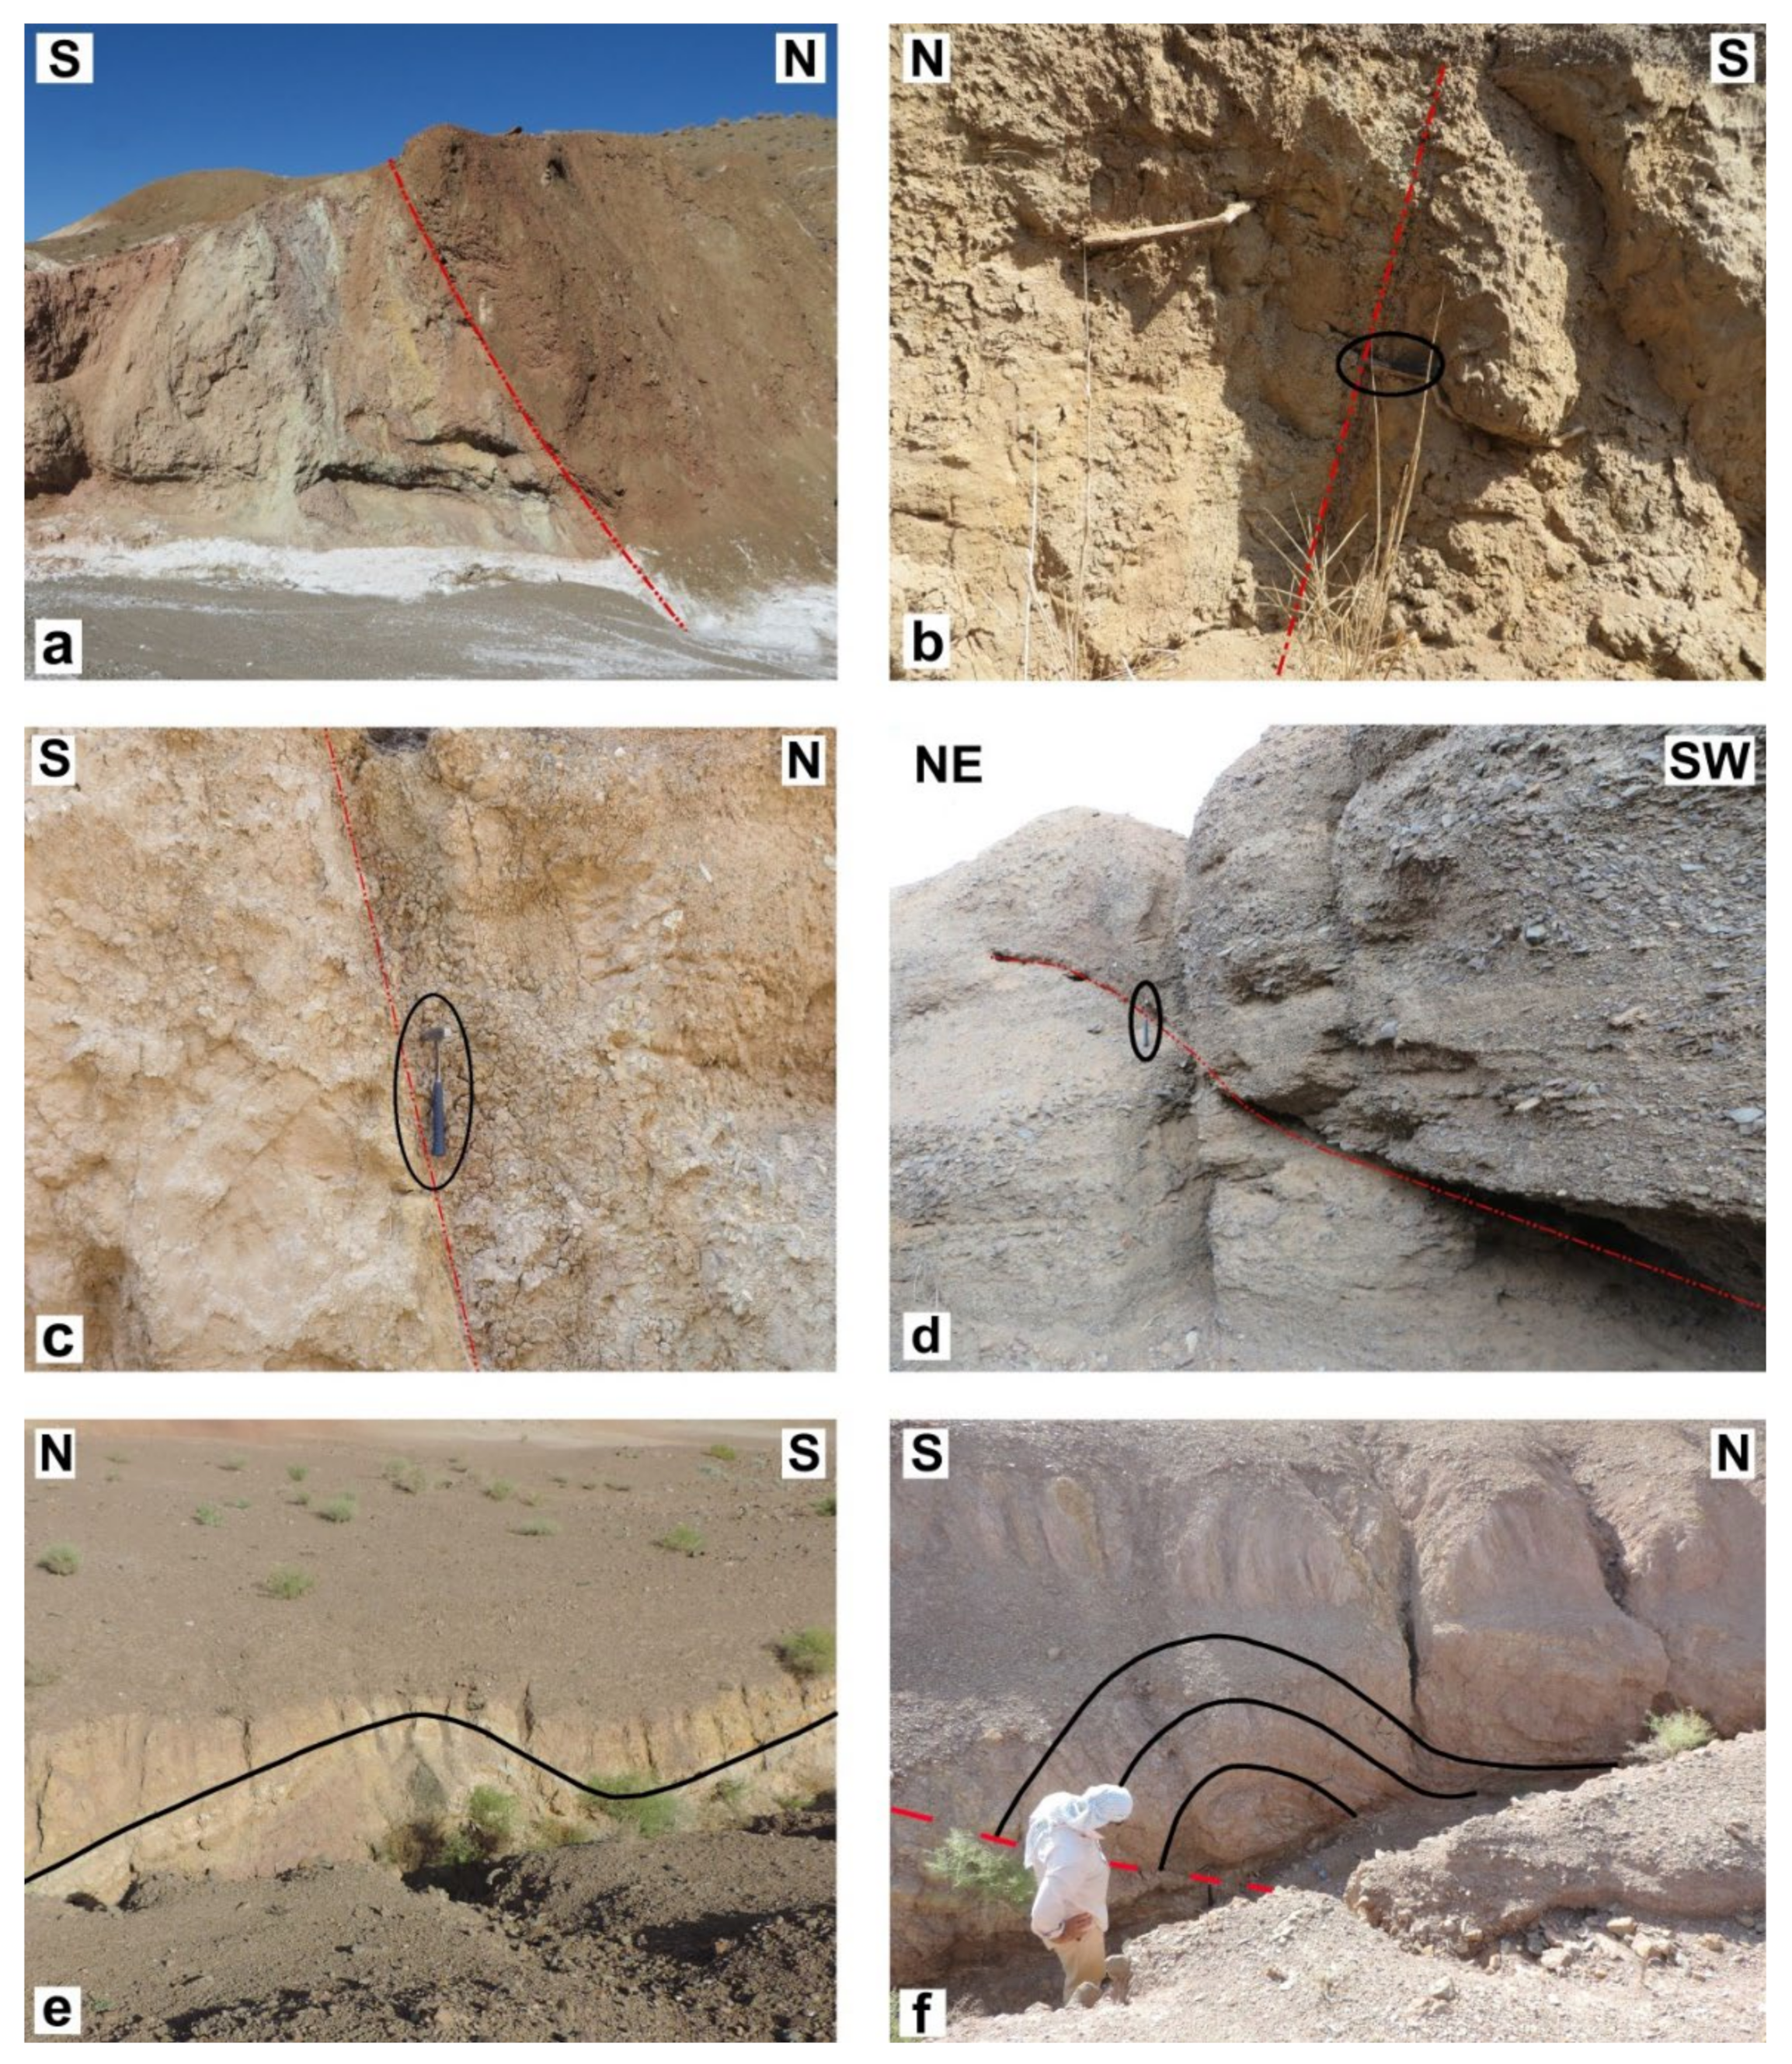
The volume strain generated by a fault can be geometrically related to the net slip of the fault, which is a vector with direction, magnitude, and sense of movement. So, we can find a relationship between the maximum volume strain and fissure structures across the fault zone (or fault-propagation folding). Four faults were observed in the fissure structure canals along Sections 5, 6, 7, and 8 (
Figure 9 and
Figure 10a–d). The net slip was calculated using the measured horizontal and vertical displacements on these faults (
Table 5).
Figure 11 depicts the obtained relationship between net slip and volume strain as a suitable linear equation.
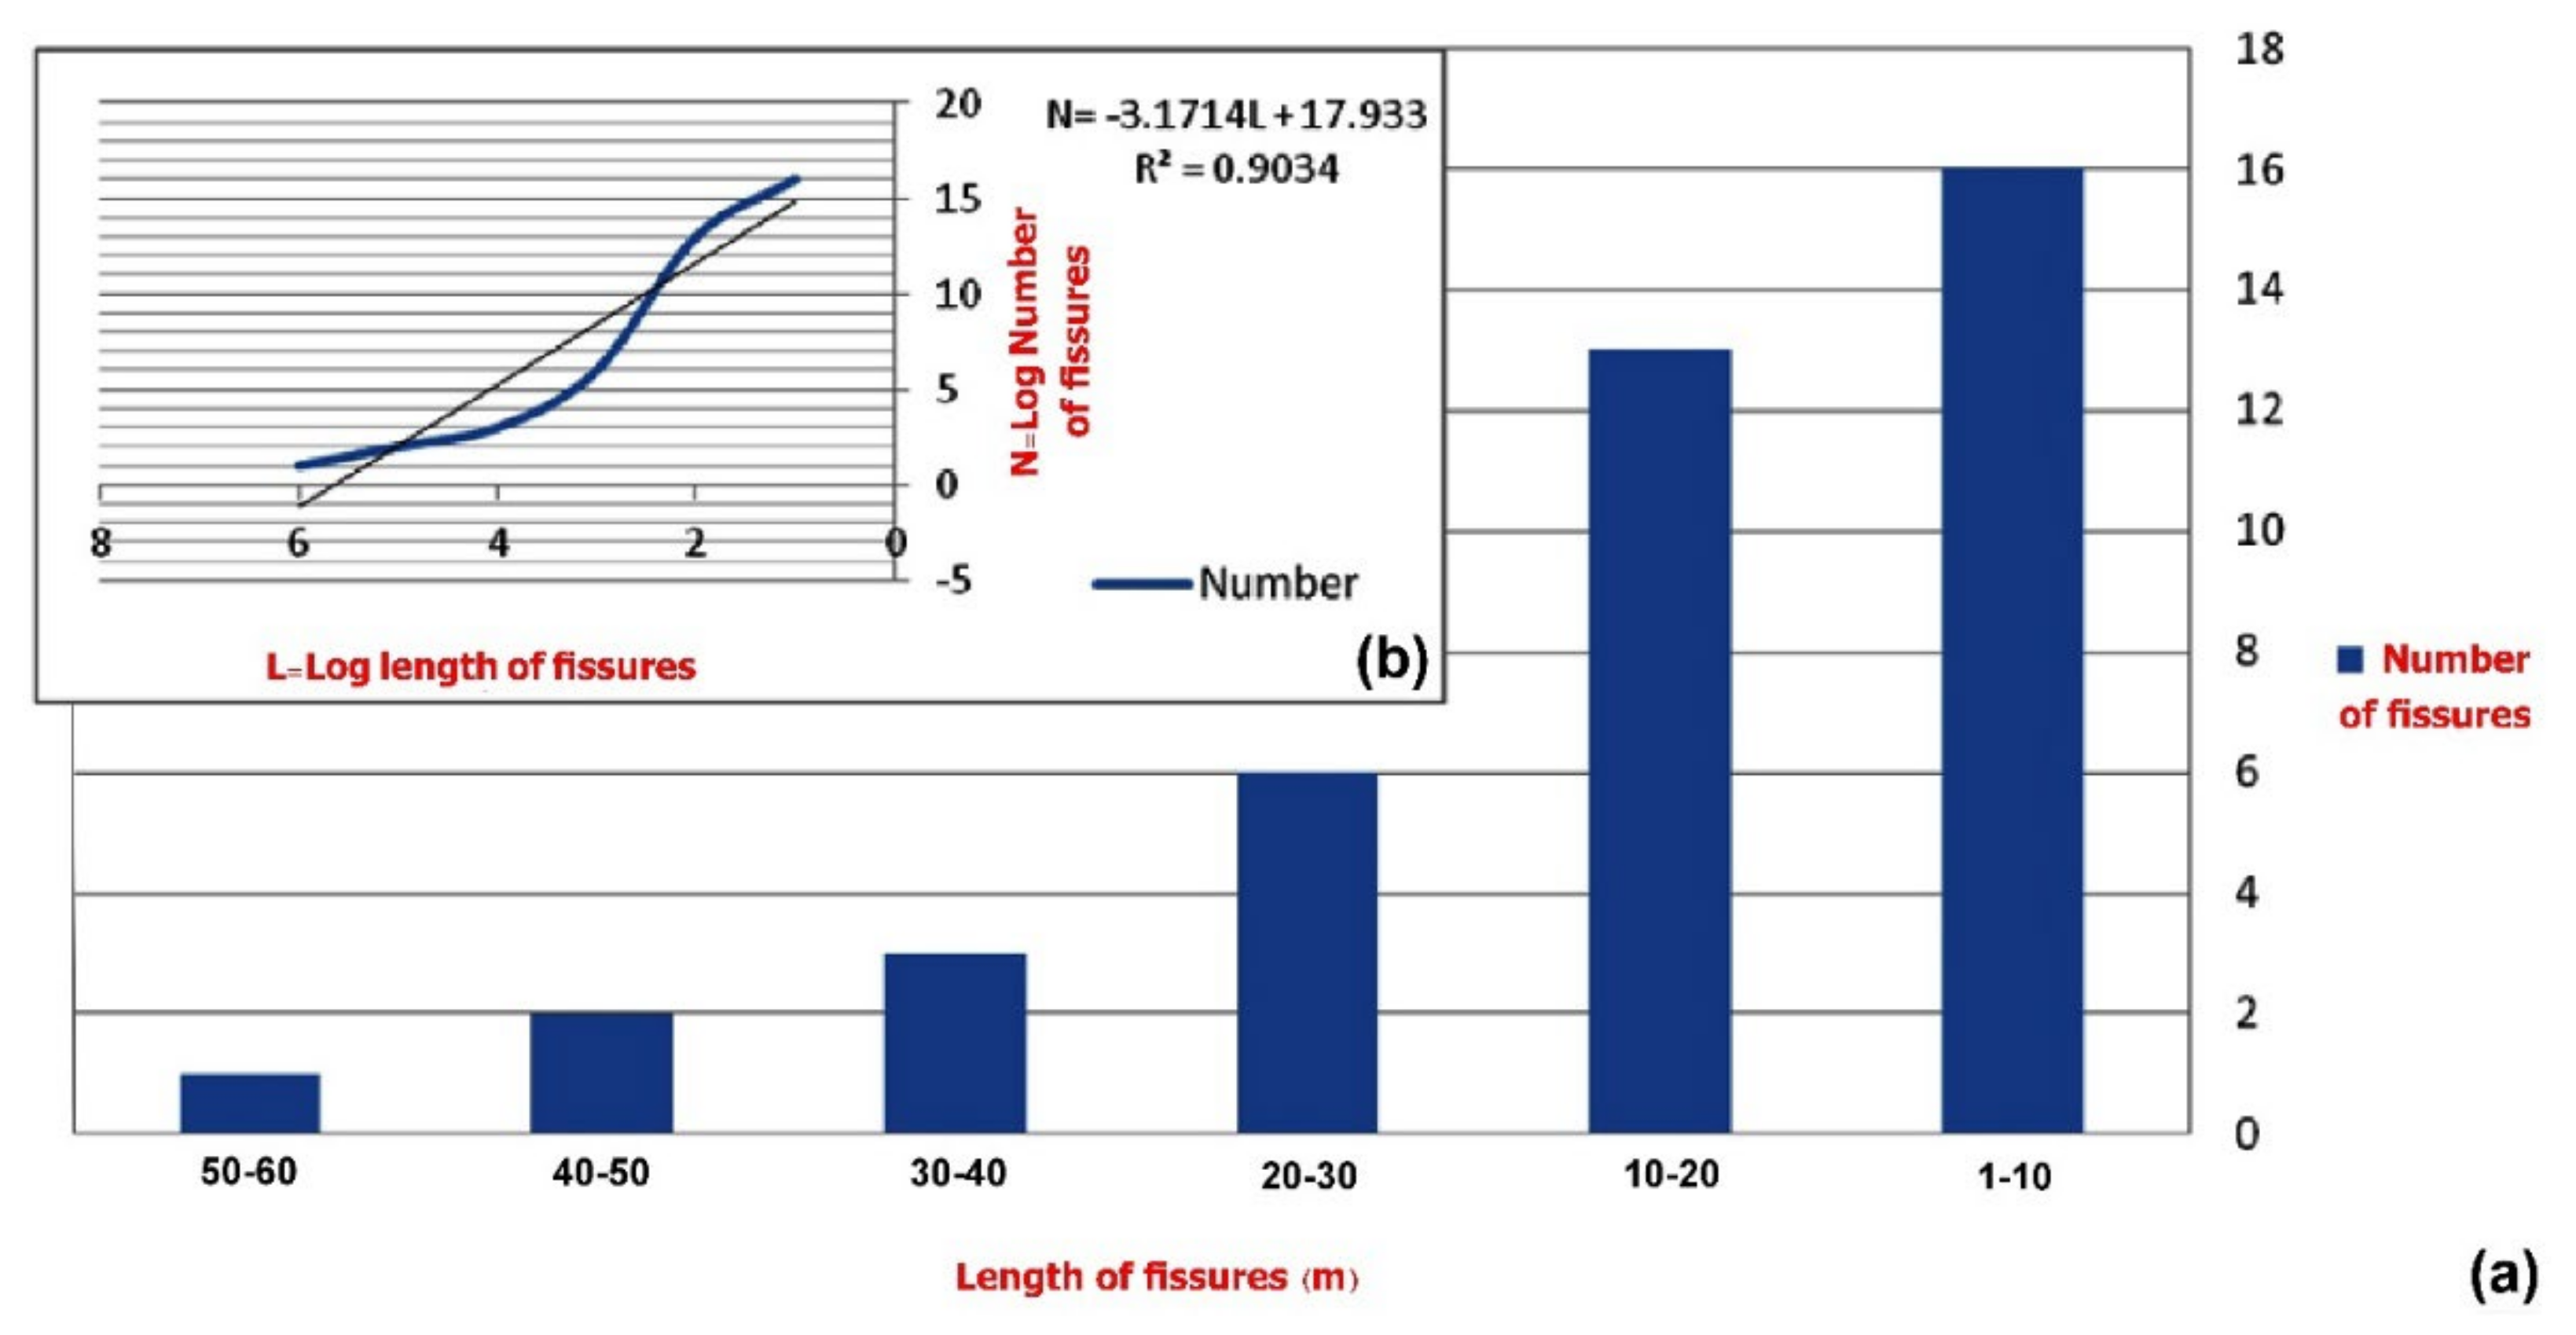
3.4. Relationship between Fissure Length Distribution and Number of Fissures
Satellite images, aerial photographs, and GPS mapping (GPS kinematics in an area of approximately 1 km2) were combined to analyze the density, length, number, and position of fissures associated with the North Birjand fault.
The GPS data had an average error of 3 cm. All fissure structures that are mostly distributed as arrays along the fault have been mapped. Their strikes are in the azimuthal range of NS, N30E, and N90E (
Figure 5).
Three types of fractures were identified as a result of three-dimensional structural analysis:
- -
Fissures without a significant vertical throw (i.e., less than 1.1 m);
- -
Faults, particularly with scarp inside fissure channels;
- -
Faults with the various displacements at their tips;
A power function with a correlation coefficient of 0.9 is used to fit the length distribution (
Figure 12). The lengths of the main composite fractures (for this case study) are more than 9 m long (
Table 6).
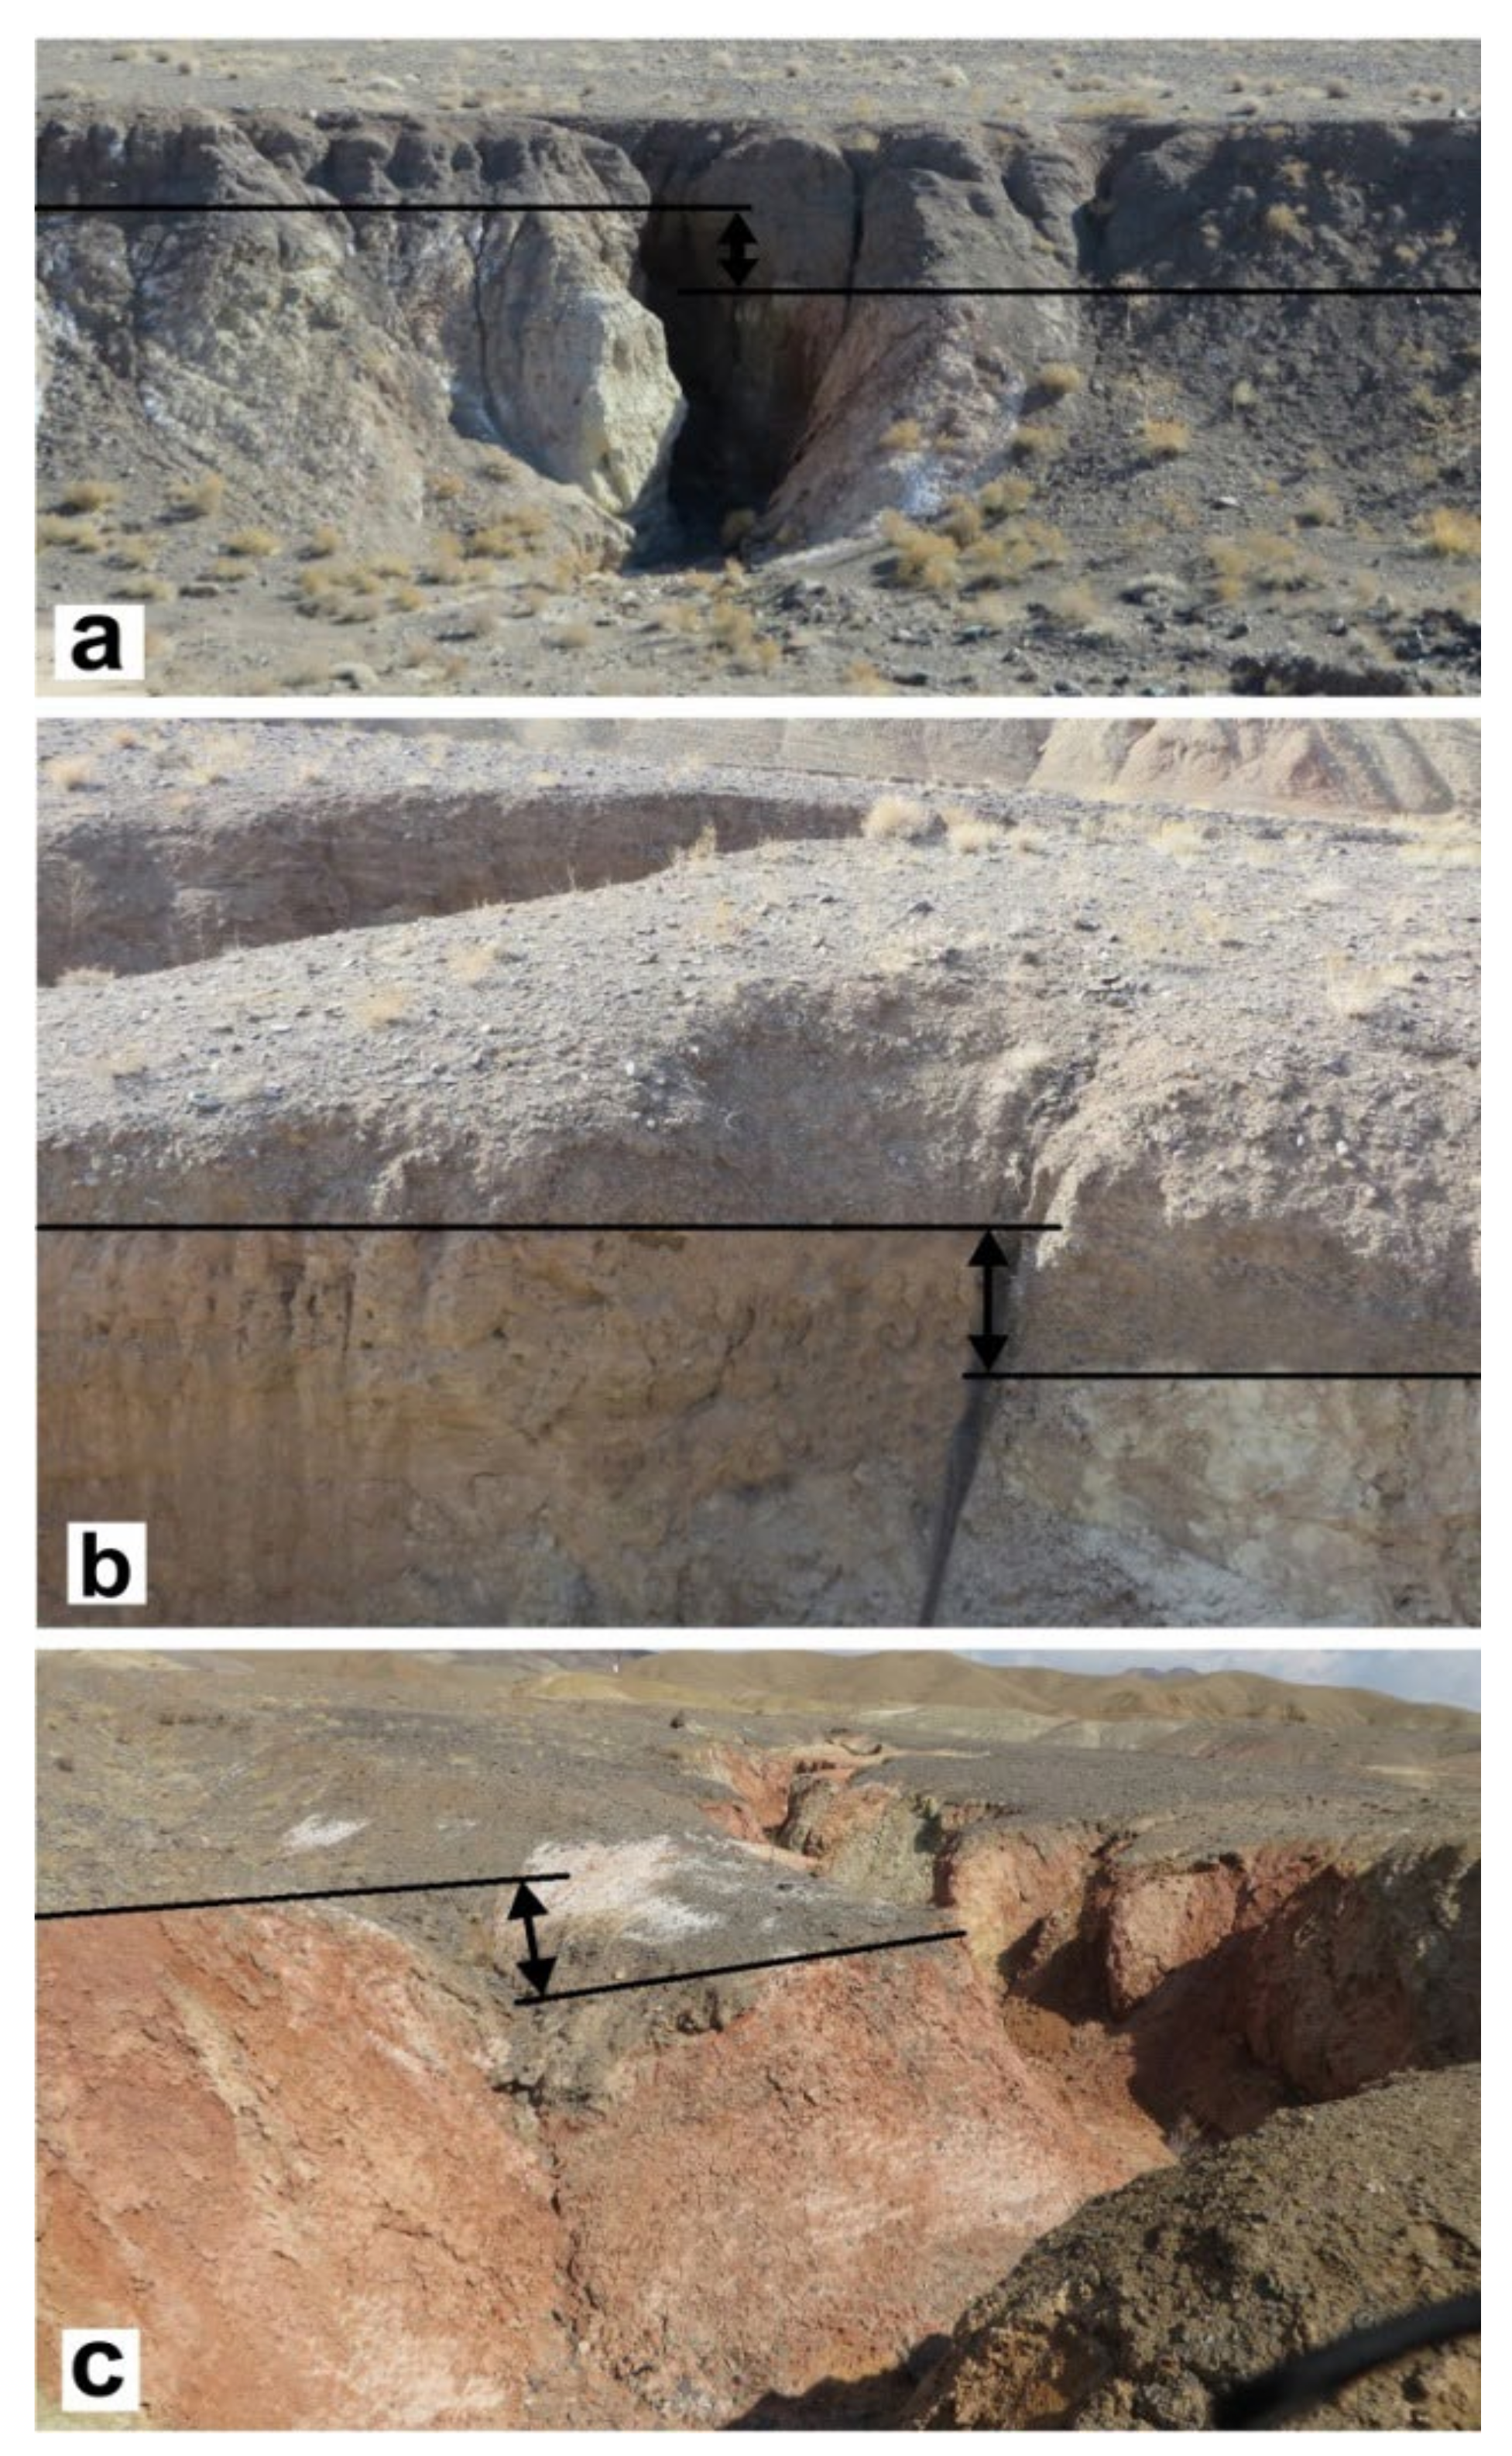
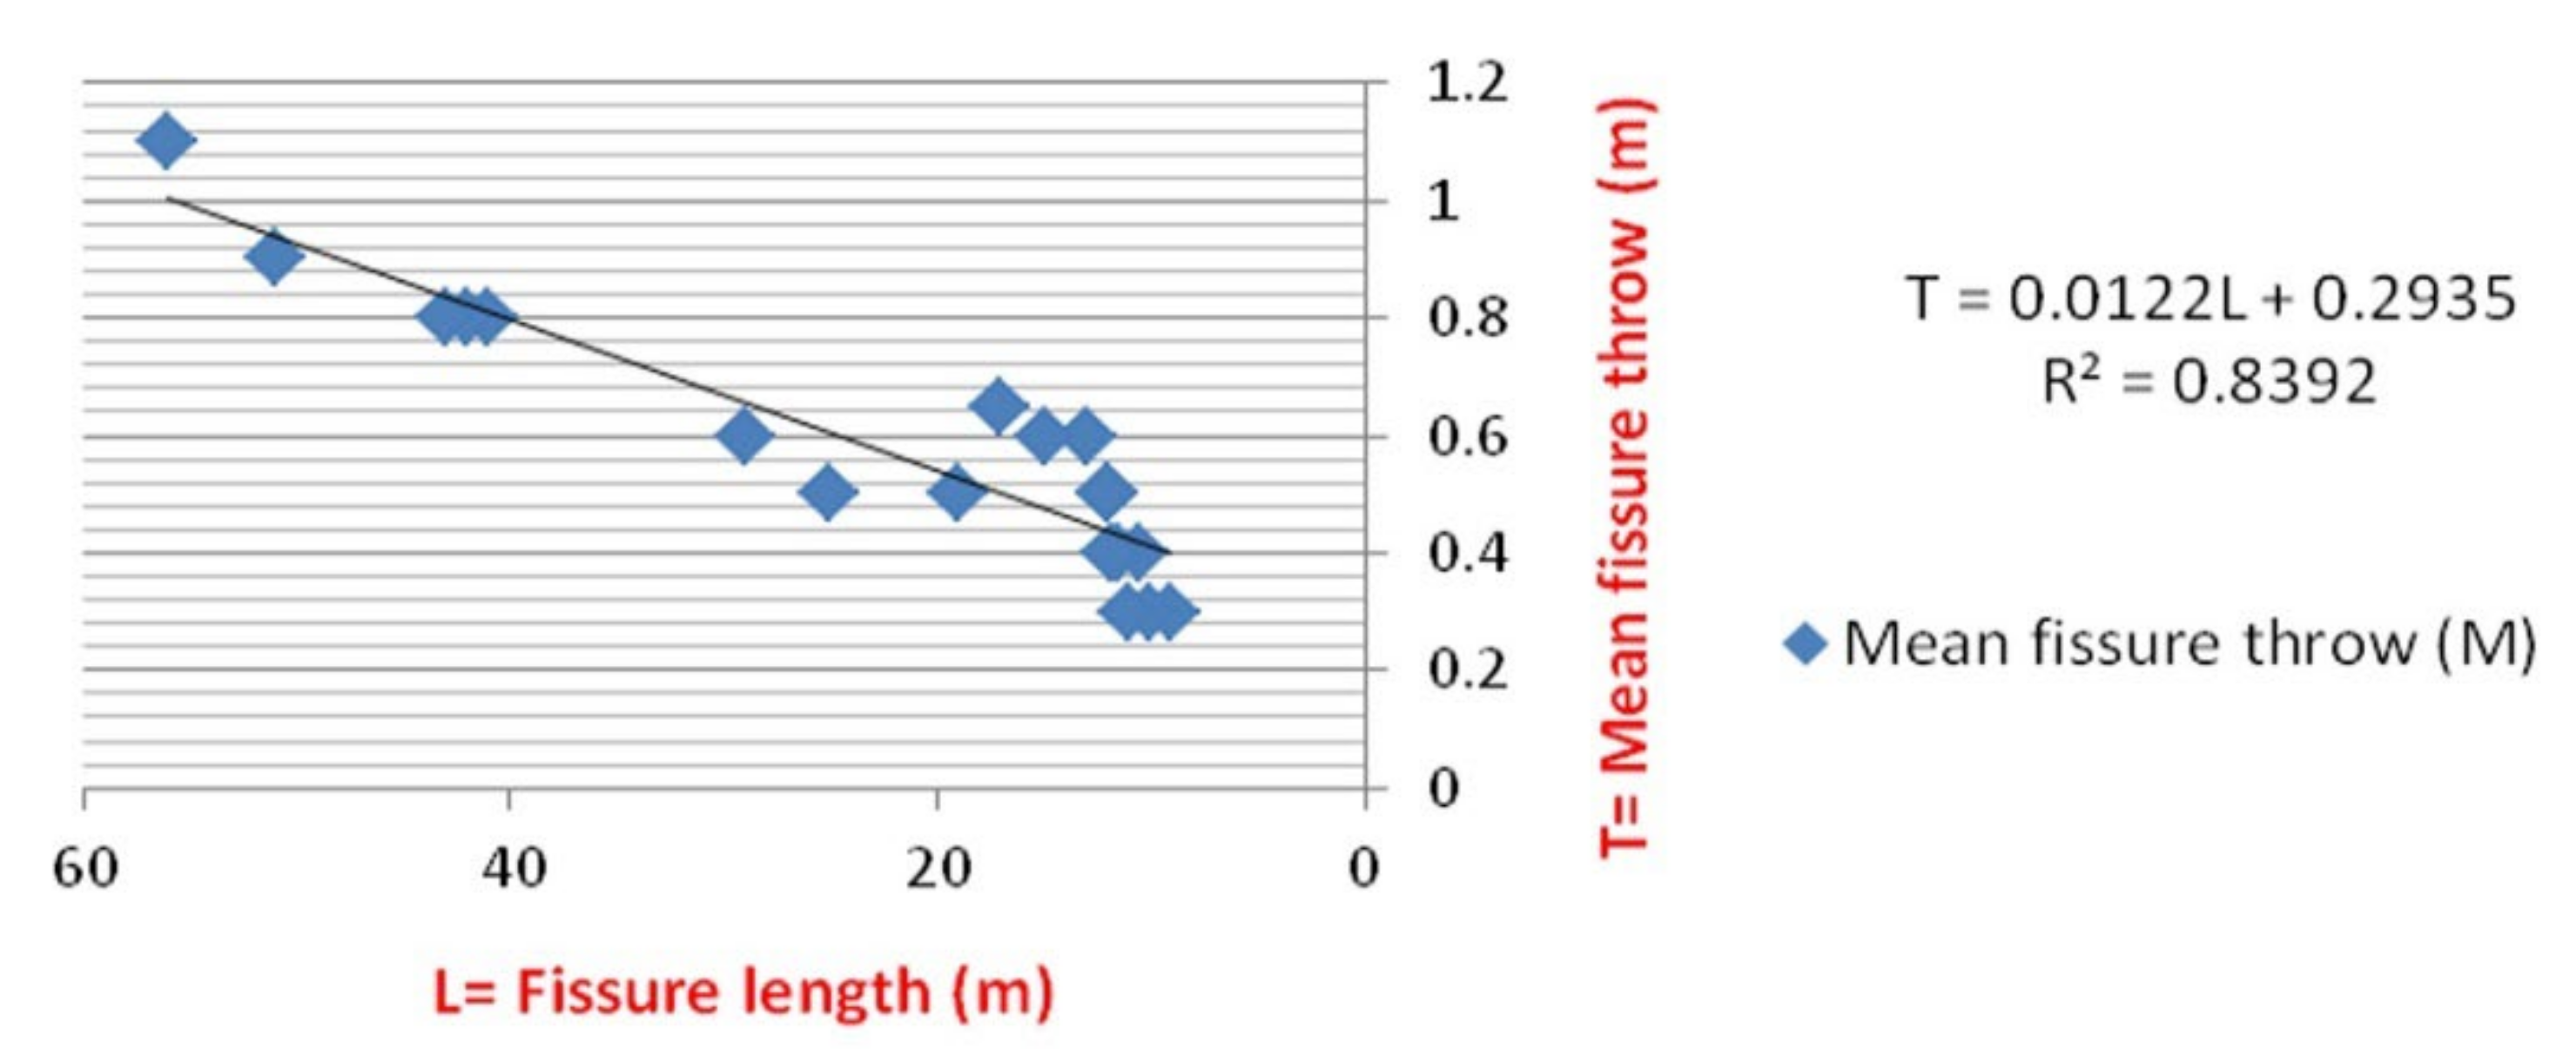
3.5. Relationship between Vertical Fissure Throws and Fissure Lengths
To determine the rate of uplift in the study area, alluvial fans with known levels were compared (the youngest being the Shur River alluvial fan at 32°54′32.78″ N, 59°4′7.79″ E). As a result, the uplift was about 45 m.
However, interpreting the study area’s differences in uplift values as a transpressional zone [
28] in terms of fissure numbers and lengths should be done with caution. Because the fissuring concentrate in the study area is on the fault’s hanging wall, compressional activity can result in greater apparent growth. A high uplift in this area, on the other hand, could indicate an extensional activity. As a result, dilation should be considered when assessing the evolution of the faulting and fissuring intensity.
The accuracy of the obtained model (
Figure 5) enables us to determine the 3D coordinates of each point of the stereo pair with an accuracy of approximately 0.03 m in both horizontal and vertical directions (
Table 6). We calculated the difference in elevation between each fissure’s two edges (
Figure 13).
By measuring the amount of offset in the fissure, which ranged from 0.3 m to 1.1 m, it was discovered that the longest fissure has the most offset (
Table 6). The fissure number, length, and throw of the 20 identified fissures for a part of the study area (
Figure 5) were compared (
Figure 14). Despite the dispersion, a straight-line fitting of a log-log graph’s distribution of points suggests a power-law for the fissure. Although it is difficult to draw definitive conclusions about the variation in fissure activity from these diagrams, it appears that the maximum offset (throw) is perpendicular to the faults. This indicates that the fault is growing upward, forming fissures in the transpressional zone.
It is a common procedure to analyze the swarm of fissures and faults in terms of the size of the frequency distribution. In wide tectonic regions where faults span a wide range of dimensions, a power-law distribution is used to define the size–frequency distribution. The exponent value decreases with increasing strain. Our analysis of fracture patterns in the NW Birjand reveals similar trends in terms of physical properties, as the fracture distribution closely follows a power-law (
Figure 12). This behavior suggests that the evolution of the fissure swarm was controlled by fracture nucleation and linkage [
35,
36].
4. Discussion
Investigations into the spatial distribution of faults and fissures are crucial for understanding the mechanisms of the underlying fault growth, and, more commonly, brittle failure behaviors [
37,
38]. Linkage and forward propagation models can be used for the interpretation of field observations. The process by which fault segments coalesce and how this coalescence results in changes to the fault architecture has been well documented in a variety of tectonic settings. Additionally, numerous studies and measurements have been carried out to verify the remote data.
Earth fissures are often connected by deep faulting, and their structural and active characteristics are compatible with the underlying active faults [
39]. Some of the surface observed fissures can be directly formed by strong seismic vibrations [
40]. Furthermore, coseismic earth fissures caused by historical earthquakes may release deformation energy in the form of fault creep or new seismic vibrations and re-emerge at the surface [
41]. Some research indicates that earth fissures can appear on the hanging wall of normal faults. Because of these earth fissures, the thickness of sediment differs on both sides of the fissures [
39]. In particular, there is evidence to show the occurrence of the synsedimentary fissures in the Fenwei Graben System [
42,
43]. In some studies, the tectonic development of monoclines has been investigated in terms of the hanging-wall growth of faults according to field observation and numerical modeling [
44].
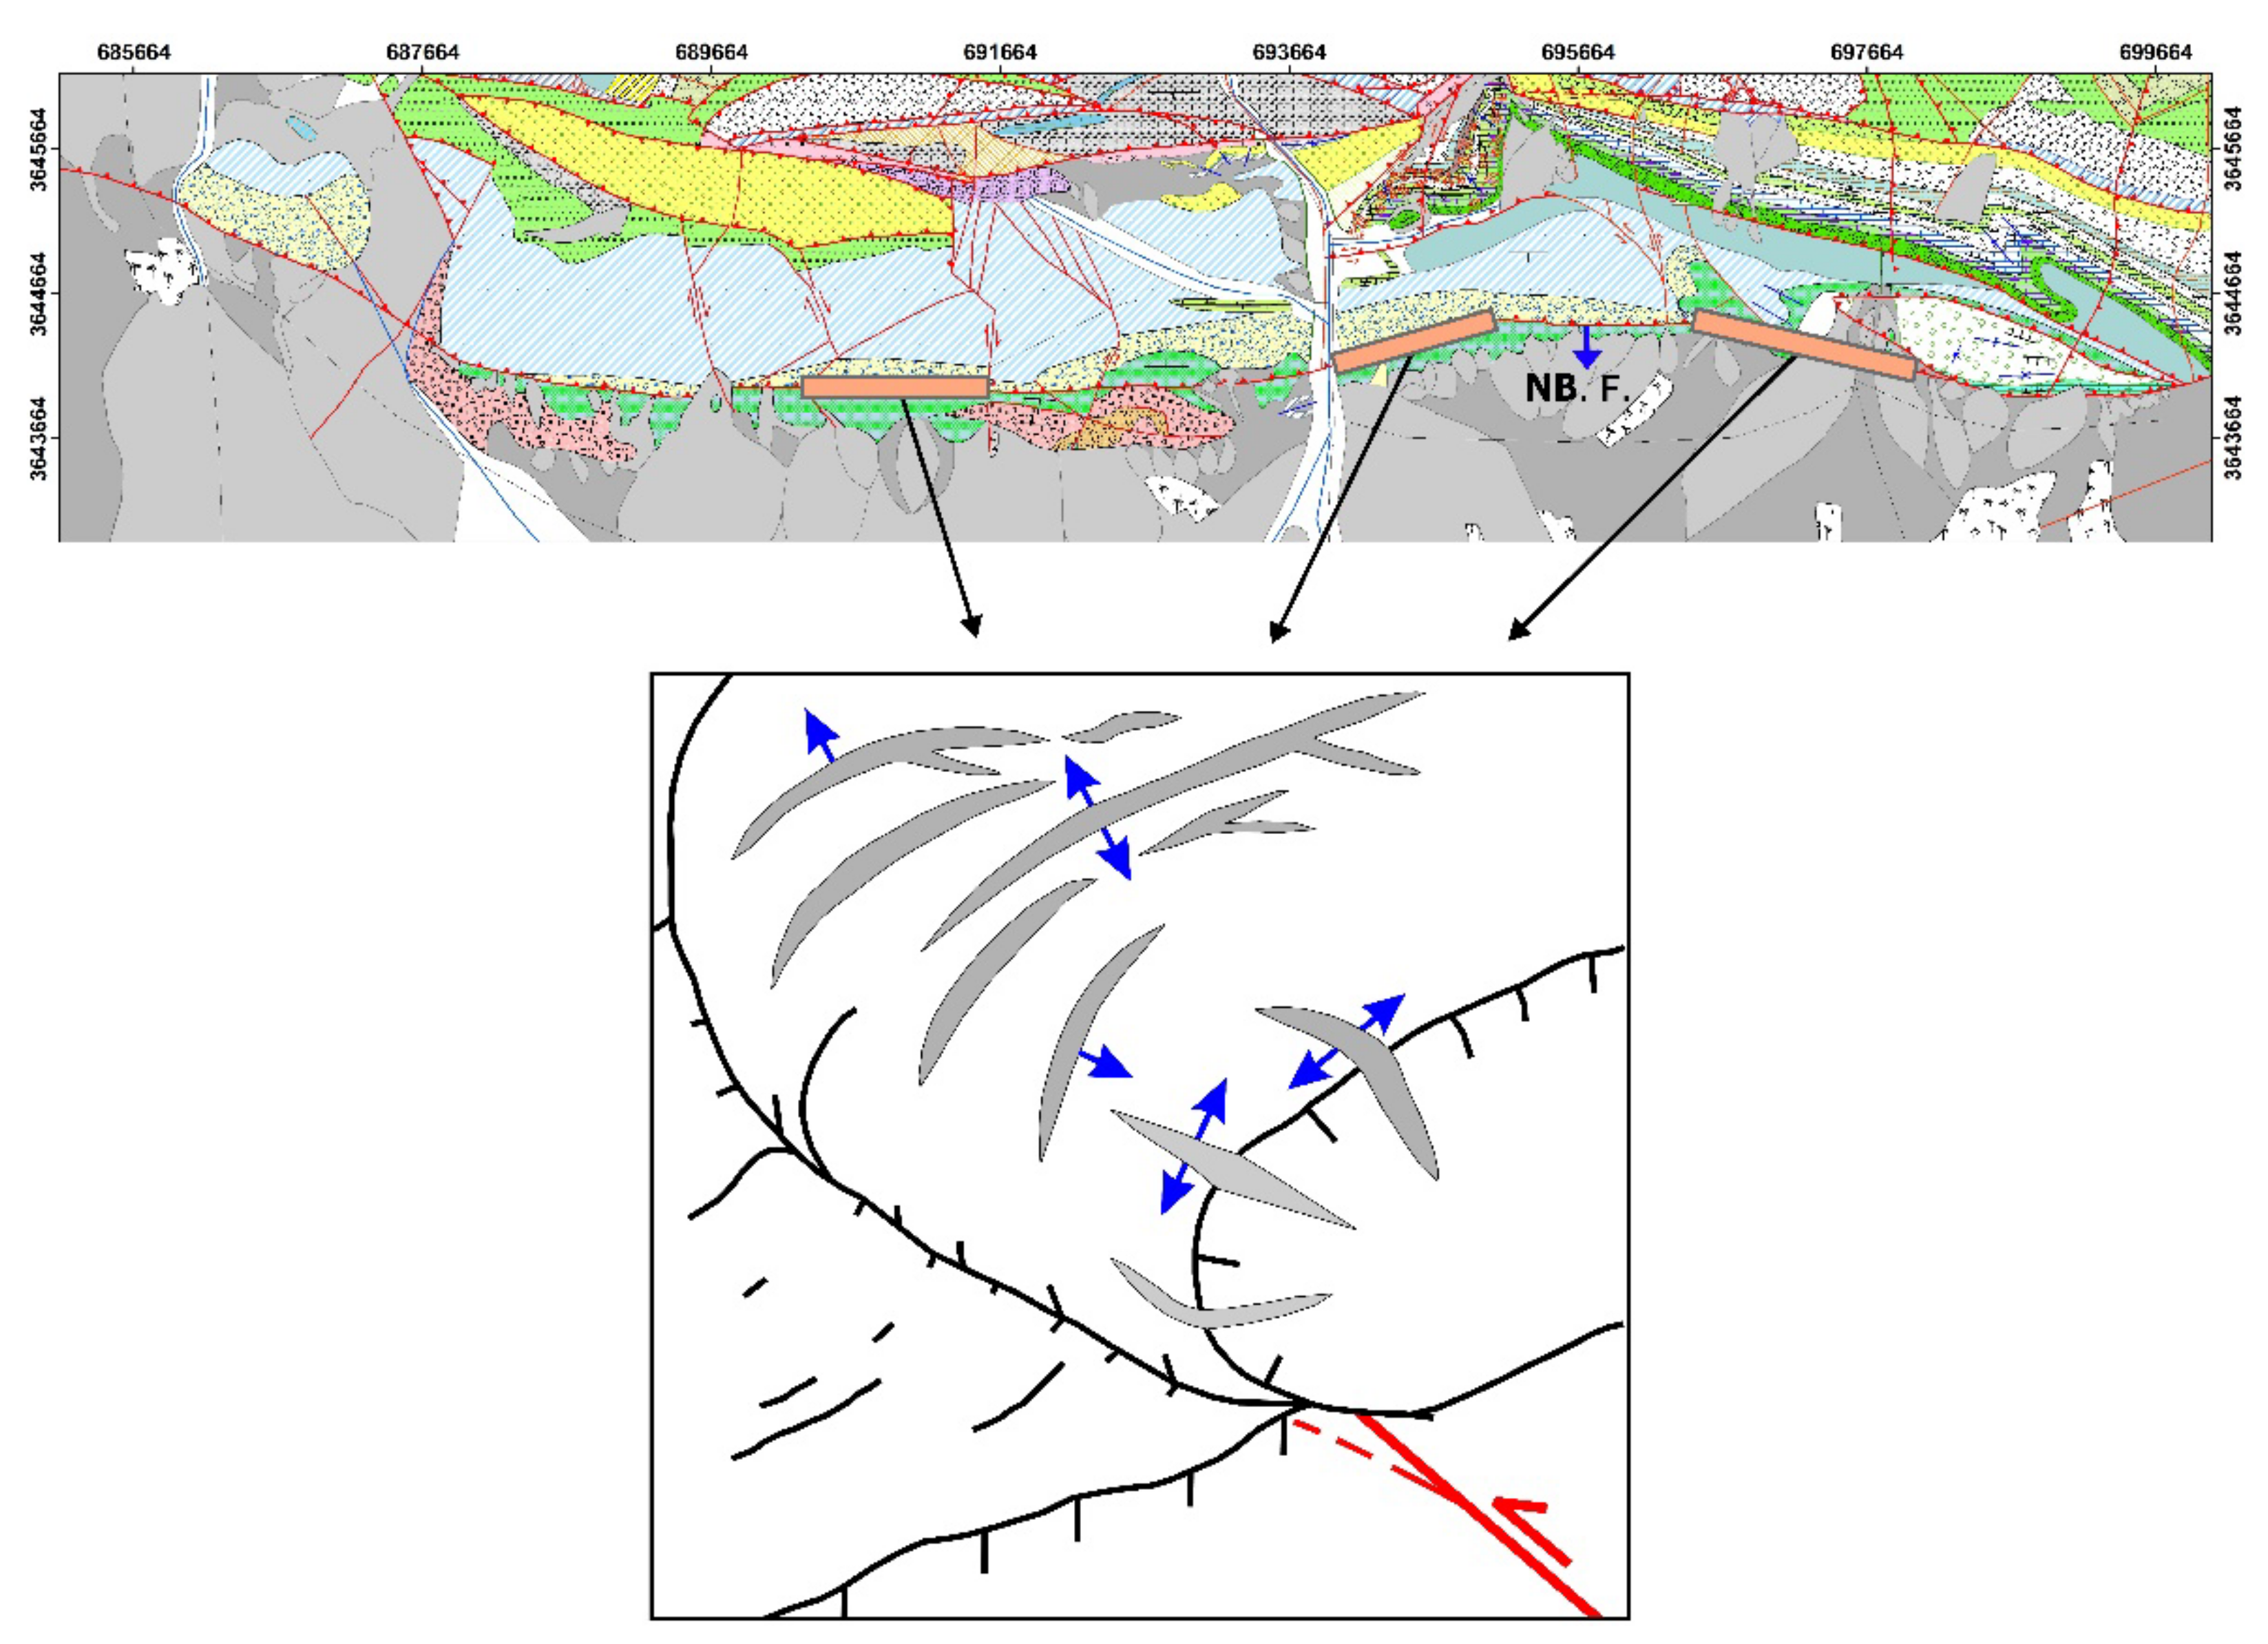
Our model of Birjand fissures agrees with their propagation fault model. As a result, the oblique displacement was used to explain the presence of folds in the cover sequence where fissures exist (
Figure 10). The findings of this study indicate that fissures are related to the fault-propagation folds in the NW of Birjand (
Figure 15), where North Birjand, a fault system with an EW trend, is located (
Figure 15). This fault, with reverse and left-lateral strike-slip movements, is considered one of the terminal segments of the Nehbandan fault with a similar sigmoidal trend.
The spatial distribution of faults and fissures, as well as changes in fault throws, makes it possible to study linkage and forward propagation models in both vertical and horizontal directions in the NW of Birjand. These observations feature the process of the fault segments’ coalescence and changes in the fault architecture. As mentioned, one of the models of fissure structures resulting from compression and lateral extension (
Figure 3d) is more in line with the gentler slopes in the transit and transpressional zones [
45].
This geohazard feature (the fissures), which has the potential to impact the environment by causing significant damage to civil foundations such as roads, dams, buildings, and underground pipes, needs to be monitored by interferometric synthetic aperture radar (InSAR) and global positioning system (GPS). Civil foundations must be constructed at a farther distance from the fissure area.
5. Conclusions
The formation of fissures is a key indicator for understanding and predicting slope movements in the NW of Birjand. The correlation between vertical throw and fissure lengths in the formations shows a power-law. The fissure population shows the power-law of length distribution of fracture and linkage phenomena in the evolution of the NW Birjand fissure swarm.
According to field evidence, the majority of Birjand fissure structures have a long axis perpendicular to the strike of the main fault (North Birjand fault zone). The maximum offset (throw) of the fissures is perpendicular to the fault plains, indicating that the fault zone grew as a result of uplift.
The ~45 m uplift is related to the young splays of the North Birjand fault. The average volume strain in the study area is 14.68%, with the maximum volume strain occurring along Sections 5 and 6 of the North Birjand fault, which is the fault’s youngest splay.
The tectonic evolution of fissures has been investigated in terms of the hanging-wall growth of faults, based on field observations. The results show that the fissures are related to fault-propagation folds. Structures associated with the main fault are the result of the interactions between branches of the North Birjand fault. The surface analysis of the fault and fissure systems reveals brittle–ductile tectonic processes associated with progressive compression.
Author Contributions
Conceptualization, A.R. and M.M.K.; methodology, A.R.; software, A.R.; validation, M.M.K.; formal analysis, R.D.; investigation, A.R.; resources, R.D.; data curation, M.M.K.; writing—original draft preparation, R.D. and A.R.; writing—review and editing, R.D. and A.R. All authors have read and agreed to the published version of the manuscript.
Funding
This research received no external funding.
Institutional Review Board Statement
Not applicable.
Informed Consent Statement
Not applicable.
Data Availability Statement
Data are contained within the article.
Acknowledgments
The authors would like to express their gratitude to the International Institute of Earthquake Engineering and Seismology (IIEES) for supporting this work, as well as Seyed Morteza Mousavi, Mohamad Amir Alimi, and Zahra Kamali for their assistance and support during the fieldwork conducted for this study.
Conflicts of Interest
The authors declare no conflict of interest.
References
- Geng, D.; Li, Z. Ground fissure hazards in USA and China. Acta Seismol. Sin. 2000, 13, 466–476. [Google Scholar] [CrossRef]
- Peng, J.; Chen, L.; Huang, Q.; Men, Y.; Fan, W.; Yan, J. Physical simulation of ground fissures triggered by underground fault activity. Eng. Geol. 2013, 155, 19–30. [Google Scholar] [CrossRef]
- Xu, J.; Meng, L.; An, H.; Wang, L. The bending mechanism of Anping ground fissure in the Hebei Plain, North China. Environ. Earth Sci. 2015, 74, 6859–6870. [Google Scholar] [CrossRef]
- Yang, C.; Lu, Z.; Zhang, Q.; Zhao, C.; Peng, J.; Ji, L. Deformation at longyao ground fissure and its surroundings, north China plain, revealed by ALOS PALSAR PS-InSAR. Int. J. Appl. Earth Obs. Geoinf. 2018, 67, 1–9. [Google Scholar] [CrossRef]
- Fleming, R.W.; Johnson, A.M. Structures associated with strike-slip faults that bound landslide elements. Eng. Geol. 1989, 27, 39–114. [Google Scholar] [CrossRef]
- Glenn, N.F.; Streutker, D.R.; Chadwick, D.J.; Thackray, G.D.; Dorsch, S.J. Analysis of LiDAR-derived topographic information for characterizing and differentiating landslide morphology and activity. Geomorphology 2006, 73, 131–148. [Google Scholar] [CrossRef]
- Günther, A.; Carstensen, A.; Pohl, W. Automated sliding susceptibility mapping of rock slopes. Nat. Hazards Earth Syst. Sci. 2004, 4, 95–102. [Google Scholar] [CrossRef]
- Priest, S.D. Discontinuity Analysis for Rock Engineering; Springer: Dordrecht, The Netherlands, 1993. [Google Scholar] [CrossRef]
- Rashidi, A. Geometric and kinematic characteristics of the Khazar and North Alborz Faults: Links to the structural evolution of the North Alborz-South Caspian boundary, Northern Iran. J. Asian Earth Sci. 2021, 213, 104755. [Google Scholar] [CrossRef]
- Savidge, E.; Nissen, E.; Nemati, M.; Karasözen, E.; Hollingsworth, J.; Talebian, M.; Bergman, E.; Ghods, A.; Ghorashi, M.; Kosari, E.; et al. The December 2017 Hojedk (Iran) earthquake triplet—Sequential rupture of shallow reverse faults in a strike-slip restraining bend. Geophys. J. Int. 2019, 217, 909–925. [Google Scholar] [CrossRef]
- Khattak, G.A.; Owen, L.A.; Kamp, U.; Harp, E.L. Evolution of earthquake-triggered landslides in the Kashmir Himalaya, northern Pakistan. Geomorphology 2010, 115, 102–108. [Google Scholar] [CrossRef]
- Youssef, A.M.; Maerz, N.H.; Hassan, A.M. Remote sensing applications to geological problems in Egypt: Case study, slope instability investigation, Sharm El-Sheikh/Ras-Nasrani Area, Southern Sinai. Landslides 2009, 6, 353. [Google Scholar] [CrossRef]
- Dehghani, G.; Makris, J. The gravity field and crustal structure of Iran. Neues Jahrb. Geol. Paläontologie-Abh. 1984, 168, 215–229. [Google Scholar] [CrossRef]
- Rashidi, A.; Abbassi, M.-R.; Nilfouroushan, F.; Shafiei, S.; Derakhshani, R.; Nemati, M. Morphotectonic and earthquake data analysis of interactional faults in Sabzevaran Area, SE Iran. J. Struct. Geol. 2020, 139, 104147. [Google Scholar] [CrossRef]
- Hashemi, F.; Derakhshani, R.; Bafti, S.S.; Raoof, A. Morphometric dataset of the alluvial fans at the southern part of Nayband fault, Iran. Data Brief 2018, 21, 1756–1763. [Google Scholar] [CrossRef]
- Kermani, A.F.; Derakhshani, R.; Bafti, S.S. Data on morphotectonic indices of Dashtekhak district, Iran. Data Brief 2017, 14, 782–788. [Google Scholar] [CrossRef]
- Rahbar, R.; Shafiei Bafti, S.; Derakhshani, R. Investigation of the tectonic activity of Bazargan Mountain in Iran. Sustain. Dev. Mt. Territ. 2017, 9, 380–386. [Google Scholar] [CrossRef]
- Chanteloube, C.; Barrier, L.; Derakhshani, R.; Gadal, C.; Braucher, R.; Payet, V.; Léanni, L.; Narteau, C. Source-To-Sink Aeolian Fluxes From Arid Landscape Dynamics in the Lut Desert. Geophys. Res. Lett. 2022, 49, e2021GL097342. [Google Scholar] [CrossRef]
- Mehrabi, A.; Pirasteh, S.; Rashidi, A.; Pourkhosravani, M.; Derakhshani, R.; Liu, G.; Mao, W.; Xiang, W. Incorporating Persistent Scatterer Interferometry and Radon Anomaly to Understand the Anar Fault Mechanism and Observing New Evidence of Intensified Activity. Remote Sens. 2021, 13, 2072. [Google Scholar] [CrossRef]
- Rashidi, A.; Kianimehr, H.; Shafieibafti, S.; Mehrabi, A.; Derakhshani, R. Active faults in the west of the Lut block (Central Iran). Geophys. Res. 2021, 22, 70–84. [Google Scholar] [CrossRef]
- Nemati, M.; Derakhshani, R. Short-term seismicity patterns along the most active faults in Iran. J. Iber. Geol. 2021, 47, 441–459. [Google Scholar] [CrossRef]
- Rashidi Boshrabadi, A.; Khatib, M.M.; Raeesi, M.; Mousavi, S.M.; Djamour, Y. Geometric-kinematic characteristics of the main faults in the W-SW of the Lut Block (SE Iran). J. Afr. Earth Sci. 2018, 139, 440–462. [Google Scholar] [CrossRef]
- Rashidi, A.; Khatib, M.M.; Nilfouroushan, F.; Derakhshani, R.; Mousavi, S.M.; Kianimehr, H.; Djamour, Y. Strain rate and stress fields in the West and South Lut block, Iran: Insights from the inversion of focal mechanism and geodetic data. Tectonophysics 2019, 766, 94–114. [Google Scholar] [CrossRef]
- Walpersdorf, A.; Manighetti, I.; Mousavi, Z.; Tavakoli, F.; Vergnolle, M.; Jadidi, A.; Hatzfeld, D.; Aghamohammadi, A.; Bigot, A.; Djamour, Y. Present-day kinematics and fault slip rates in eastern Iran, derived from 11 years of GPS data. J. Geophys. Res. Solid Earth 2014, 119, 1359–1383. [Google Scholar] [CrossRef]
- Zarifi, Z.; Nilfouroushan, F.; Raeesi, M. Crustal stress map of Iran: Insight from seismic and geodetic computations. Pure Appl. Geophys. 2014, 171, 1219–1236. [Google Scholar] [CrossRef]
- Ghanbarian, M.A.; Yassaghi, A.; Derakhshani, R. Detecting a sinistral transpressional deformation belt in the Zagros. Geosciences 2021, 11, 226. [Google Scholar] [CrossRef]
- Eftekharnejad, J.; Ohanian, T.; Tatevosian, S. Geological Map of the Birjand Quadrangle; Geological Survey of Iran: Tehran, Iran, 1978. [Google Scholar]
- Walker, R.; Khatib, M. Active faulting in the Birjand region of NE Iran. Tectonics 2006, 25, TC4016. [Google Scholar] [CrossRef]
- Rashidi, A.; Khatib, M.; Heyhat, M.; Moussavi, S. Analysis of structural elements in Kamar Haji mountain, NW Birjand. Geosciences 2015, 24, 273–288. [Google Scholar] [CrossRef]
- Allen, M.B.; Blanc, E.; Walker, R.; Jackson, J.; Talebian, M.; Ghassemi, M.R. Contrasting Styles of Convergence in the Arabia-Eurasia Collision: Why Escape Tectonics Does Not Occur in Iran; Special Papers of the Geological Society of America: Boulder, CO, USA, 2006; Volume 409, pp. 579–589. [Google Scholar] [CrossRef]
- Ambraseys, N.; Tchalenko, J. The Dasht-e Bayāz (Iran) earthquake of August 31, 1968: A field report. Bull. Seismol. Soc. Am. 1969, 59, 1751–1792. [Google Scholar] [CrossRef]
- Berberian, M.; Yeats, R.S. Patterns of historical earthquake rupture in the Iranian Plateau. Bull. Seismol. Soc. Am. 1999, 89, 120–139. [Google Scholar]
- Stumpf, A.; Malet, J.-P.; Kerle, N.; Niethammer, U.; Rothmund, S. Image-based mapping of surface fissures for the investigation of landslide dynamics. Geomorphology 2013, 186, 12–27. [Google Scholar] [CrossRef] [Green Version]
- Krauskopf, K.; Feitler, S.; Griggs, A. Structural features of a landslide near Gilroy, California. J. Geol. 1939, 47, 630–648. [Google Scholar] [CrossRef]
- Mansfield, C.; Cartwright, J. Fault growth by linkage: Observations and implications from analogue models. J. Struct. Geol. 2001, 23, 745–763. [Google Scholar] [CrossRef]
- Cladouhos, T.T.; Marrett, R. Are fault growth and linkage models consistent with power-law distributions of fault lengths? J. Struct. Geol. 1996, 18, 281–293. [Google Scholar] [CrossRef]
- Knipe, R.J.; Main, I. Special issue: Scaling laws for fault and fracture populations—Analyses and applications—Introduction. J. Struct. Geol. 1996, 18, R5–R11. [Google Scholar]
- Torabi, A.; Berg, S.S. Scaling of fault attributes: A review. Mar. Pet. Geol. 2011, 28, 1444–1460. [Google Scholar] [CrossRef]
- Jia, Z.; Qiao, J.; Peng, J.; Lu, Q.; Xia, Y.; Zang, M.; Wang, F.; Zhao, J. Formation of ground fissures with synsedimentary characteristics: A case study in the Linfen Basin, northern China. J. Asian Earth Sci. 2021, 214, 104790. [Google Scholar] [CrossRef]
- Sarkar, I. The role of the 1999 Chamoli earthquake in the formation of ground cracks. J. Asian Earth Sci. 2004, 22, 529–538. [Google Scholar] [CrossRef]
- Leonard, R. An earth fissure in southern Arizona. J. Geol. 1929, 37, 765–774. [Google Scholar] [CrossRef]
- Qiao, J.; Peng, J.; Deng, Y.; Leng, Y.; Meng, Z. Earth fissures in Qinglong Graben in Yuncheng Basin, China. J. Earth Syst. Sci. 2018, 127, 10. [Google Scholar] [CrossRef] [Green Version]
- Jia, Z.; Lu, Q.; Peng, J.; Qiao, J.; Wang, F.; Wang, S.; Zhao, J. Analysis and comparison of two types of ground fissures in Dali County in the Weihe Basin, China. Environ. Earth Sci. 2020, 79, 38. [Google Scholar] [CrossRef]
- Grant, J.V.; Kattenhorn, S.A. Evolution of vertical faults at an extensional plate boundary, southwest Iceland. J. Struct. Geol. 2004, 26, 537–557. [Google Scholar] [CrossRef]
- Sowers, G.F.; Royster, D.L. Field investigation. In Transportation Research Board Special Report; Transportation Research Board: Washington, DC, USA, 1978; Volume 176, pp. 81–111. [Google Scholar]
Figure 1.
(a) Location of the Birjand area (blue cadre) in Iran, and (b) Close-up view of the study area (yellow cadre) in the NW of the Birjand city.
Figure 1.
(a) Location of the Birjand area (blue cadre) in Iran, and (b) Close-up view of the study area (yellow cadre) in the NW of the Birjand city.
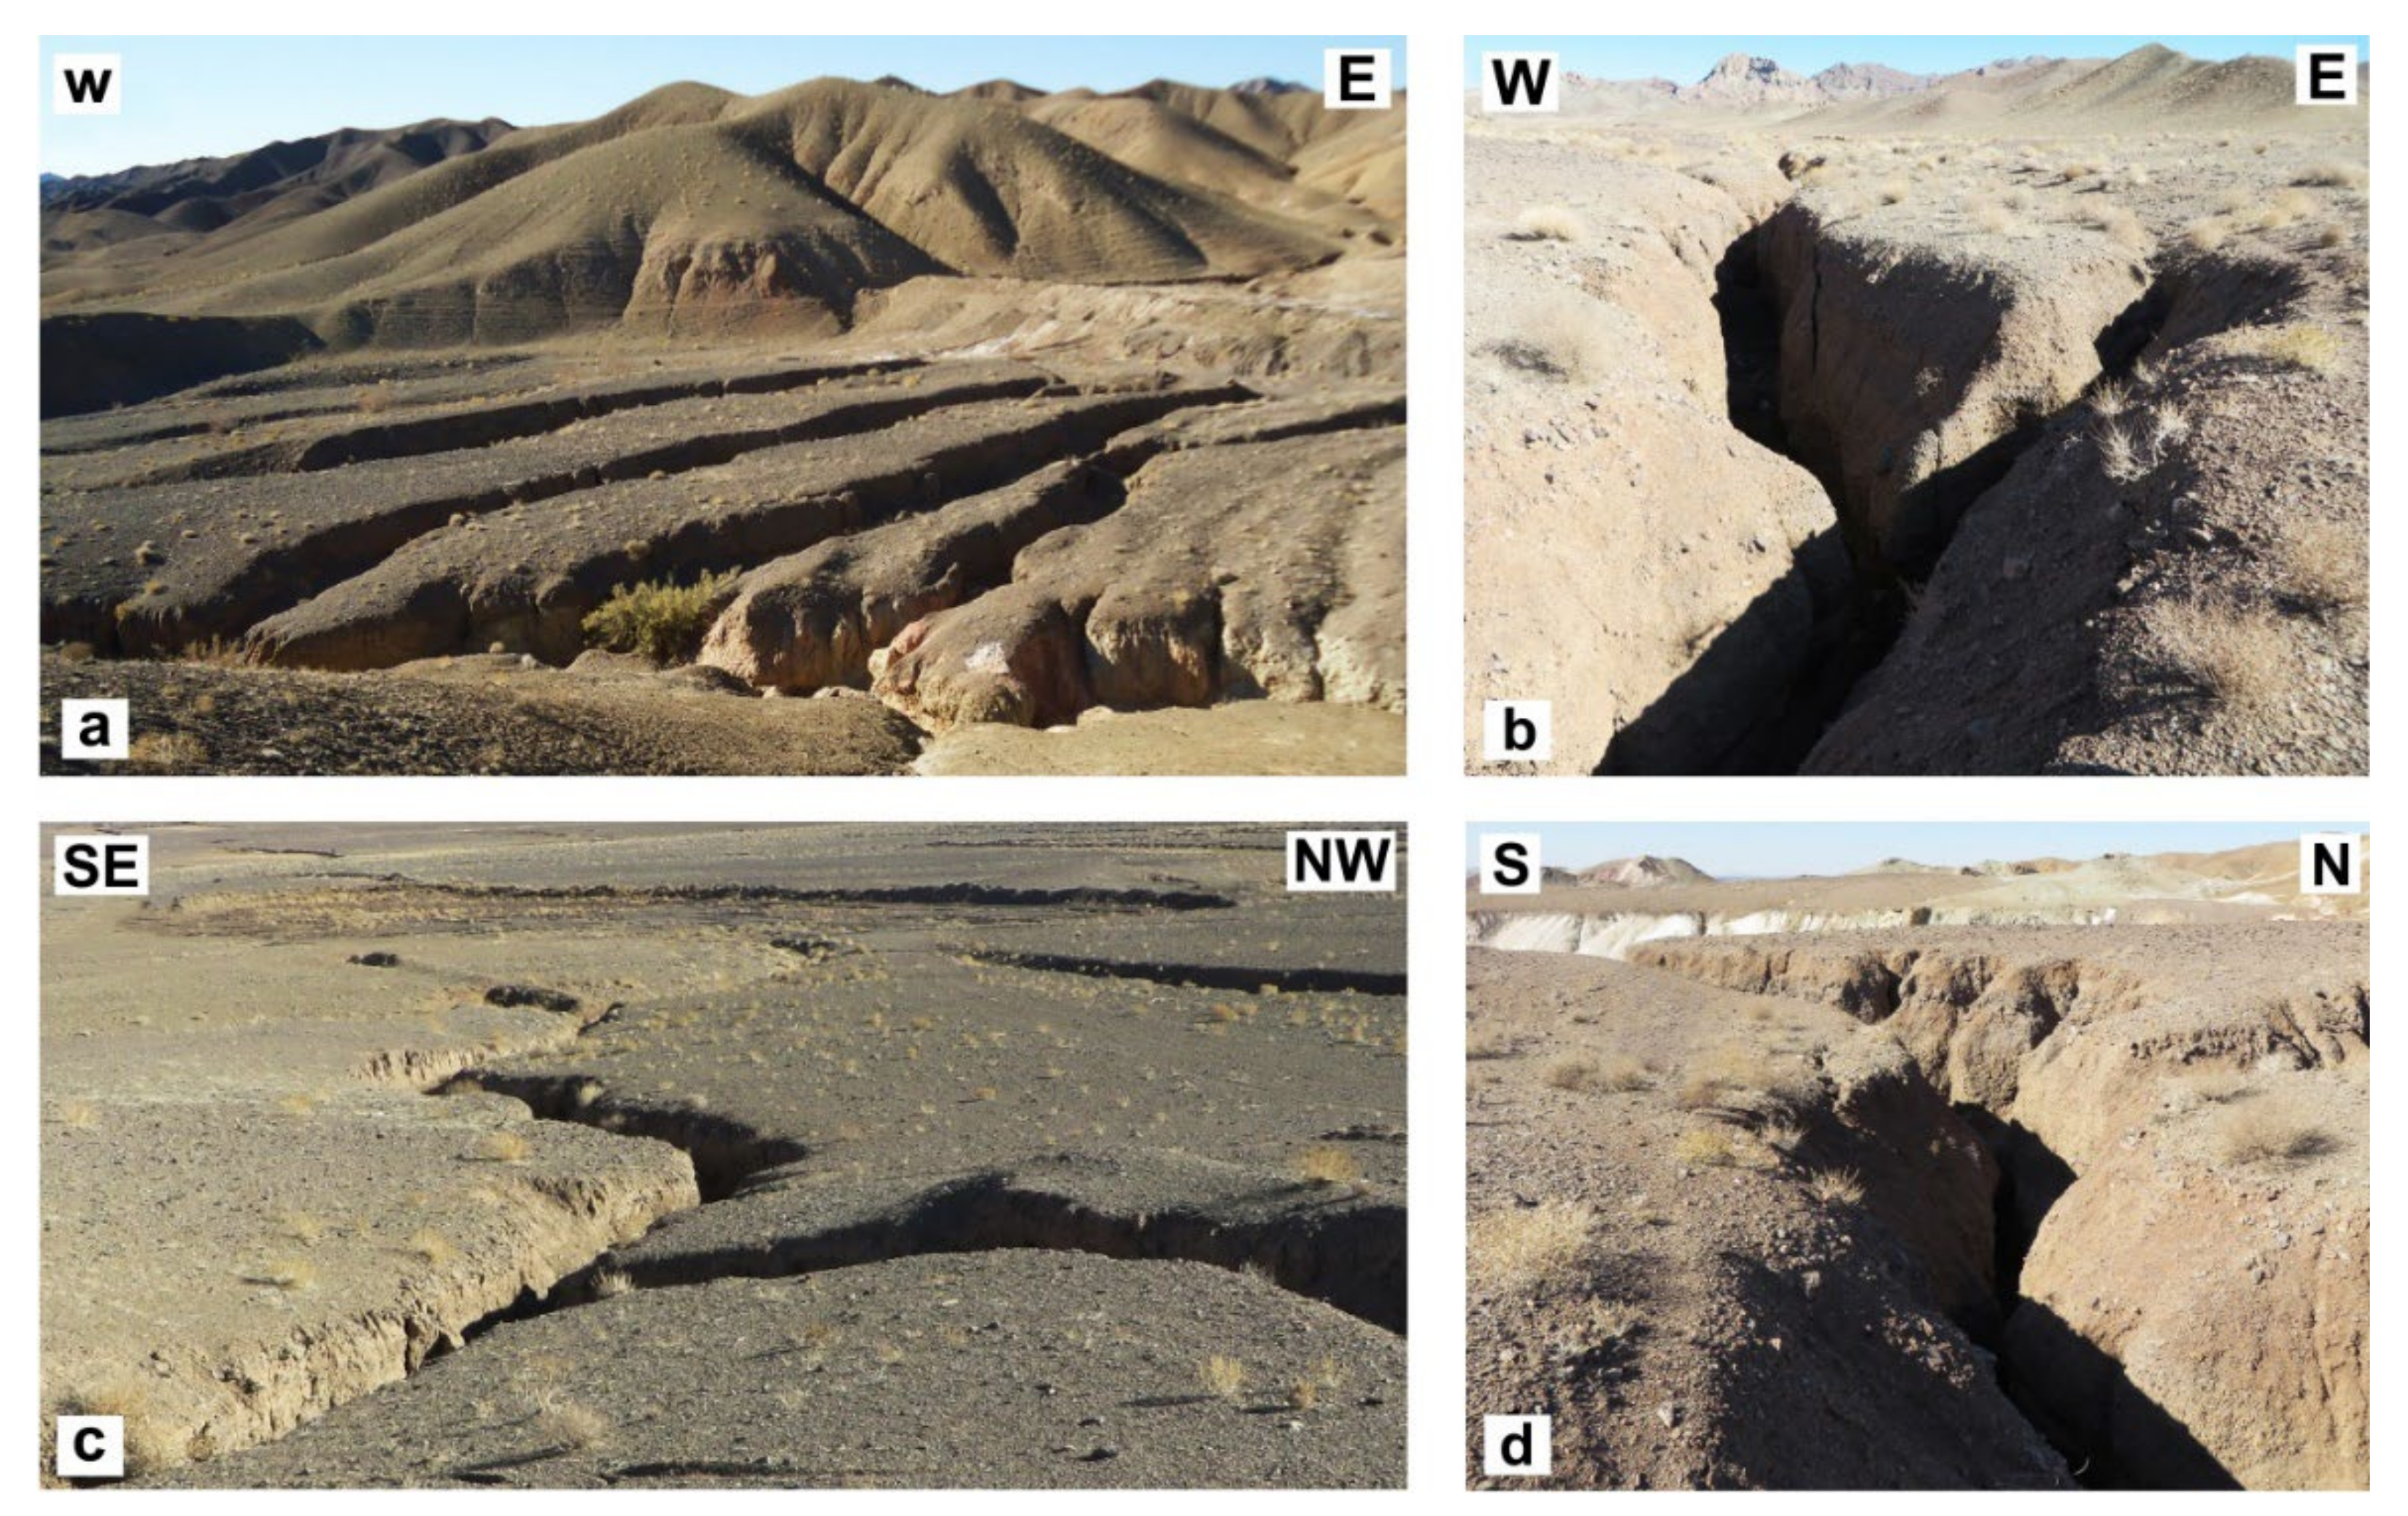
Figure 2.
Field examples of the fissures in the study area. Fissures have an average depth of 4 m. (a) Parallel fissures; (b) fissures with NS, NE–SW trends; (c) fissures with zigzag edges; (d) fissures with EW trend.
Figure 2.
Field examples of the fissures in the study area. Fissures have an average depth of 4 m. (a) Parallel fissures; (b) fissures with NS, NE–SW trends; (c) fissures with zigzag edges; (d) fissures with EW trend.
Figure 3.
Types of fissures. (a) Styles of fracture deployment: Style I (opening), Style II (sliding), and Style III (tearing); (b) fissures expanding in Mode I and effecting from tensile stress; (c) fissures expanding in Mode I and effecting from shear stress; (d) fissures expanding in Mode I, effecting from compressive stress and lateral expansion.
Figure 5.
Dem image of the study area, obtained by the Kinematic GPS. Volumetric strain was assessed along the sections.
Figure 5.
Dem image of the study area, obtained by the Kinematic GPS. Volumetric strain was assessed along the sections.
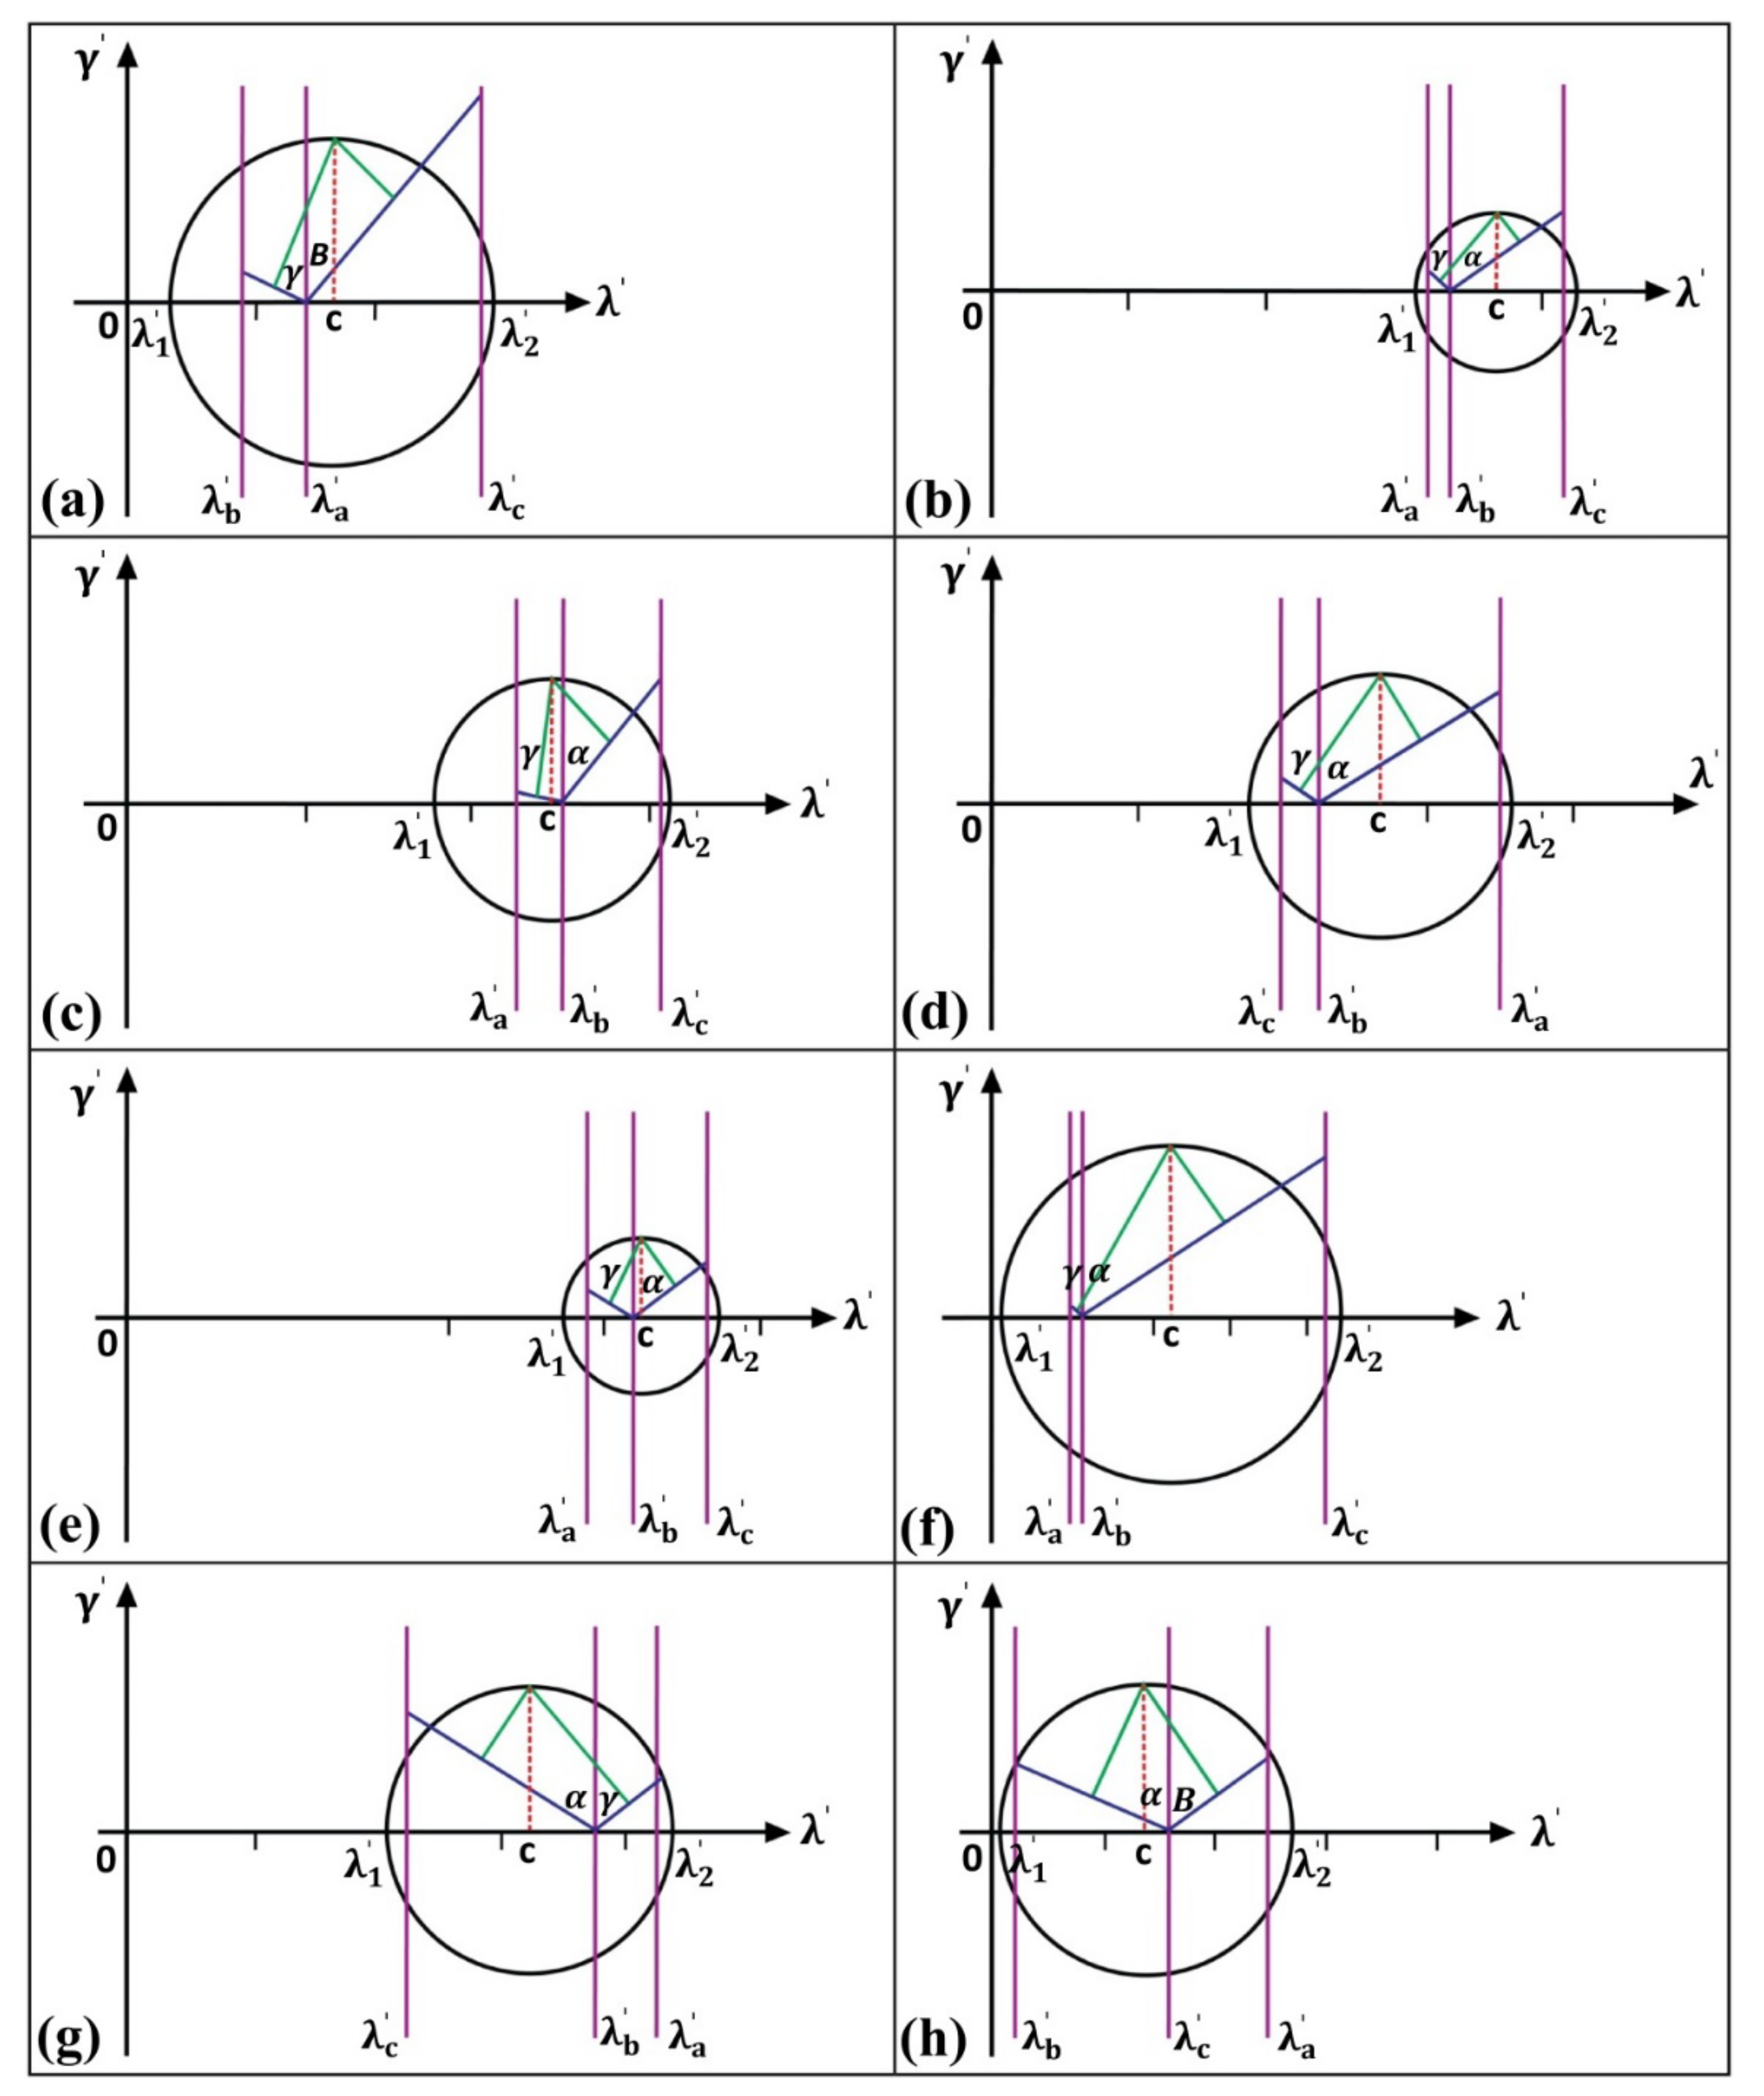
Figure 6.
Mohr circles for eight sections which are shown in
Figure 5. Part (
a) is related to section 1, part (
b) is related to section 2, and so on. Using these circles, the ratio strain ellipsoid was obtained for each section. Abbreviations: α, B, and γ = angles formed by the normal of the plane and each of the principal stress axes (x, y, z) (see
Figure 5); λ′ = 1/(quadratic elongation) along (
a–
c) as the triangular grid sides (see
Figure 5).
Figure 7.
Topography cross-sections obtained along the desired directions on the XZ plane for eight sections which are shown in
Figure 5. Part (
a) is related to section 1, part (
b) is related to section 2, and so on. Using integration methods, we obtained the surface strain values on the XZ plane. The vertical and horizontal axes are the elevation data and the length of the cross-sections, respectively.
Figure 8.
Diagram of the volume strain changes (ev) along the topographic cross-sections.
Figure 8.
Diagram of the volume strain changes (ev) along the topographic cross-sections.
Figure 9.
The Bing maps aerial imagery of faults intersecting fisher structures. Four faults were observed in the fissure structure canals along sections 5, 6, 7, and 8 (see the location of the sections on the
Figure 5).
Figure 9.
The Bing maps aerial imagery of faults intersecting fisher structures. Four faults were observed in the fissure structure canals along sections 5, 6, 7, and 8 (see the location of the sections on the
Figure 5).
Figure 10.
(a–d) Faults in the fissure structures canals; (e,f) folds formed on the hanging-wall of the youngest splay of the North Birjand fault. These folds are visible within the fissure canals.
Figure 10.
(a–d) Faults in the fissure structures canals; (e,f) folds formed on the hanging-wall of the youngest splay of the North Birjand fault. These folds are visible within the fissure canals.
Figure 11.
Schematic representation of the relationship between the net slip (Ns) and the volume strain (V).
Figure 11.
Schematic representation of the relationship between the net slip (Ns) and the volume strain (V).
Figure 12.
(a) Graph depicting the number and length of fissures (classes of 10 m); (b) the log-log diagram of the number (N) and length of fissures (L), illustrating the explicit linear distribution.
Figure 12.
(a) Graph depicting the number and length of fissures (classes of 10 m); (b) the log-log diagram of the number (N) and length of fissures (L), illustrating the explicit linear distribution.
Figure 13.
Three field examples of the fissures with the vertical throw in the study area (a–c).
Figure 13.
Three field examples of the fissures with the vertical throw in the study area (a–c).
Figure 14.
Correlative diagram between vertical fissure throws and fissure lengths. The horizontal and vertical axes are plotted on a logarithmic scale (L, T), and the equation and correlation coefficients are displayed.
Figure 14.
Correlative diagram between vertical fissure throws and fissure lengths. The horizontal and vertical axes are plotted on a logarithmic scale (L, T), and the equation and correlation coefficients are displayed.
Figure 15.
Geological map and model of fissure structure in the study area. The model is related to the fault-propagation folds. NB. F. stands for North Birjand Fault.
Figure 15.
Geological map and model of fissure structure in the study area. The model is related to the fault-propagation folds. NB. F. stands for North Birjand Fault.
Table 1.
Statistical values of longitudinal and shear strains along the triangular grid sides (a,b,c) for the desired sections. Abbreviations: e = line elongation; S = line stretching; λ′ = 1/quadratic elongation; R = strain ratio.
Table 1.
Statistical values of longitudinal and shear strains along the triangular grid sides (a,b,c) for the desired sections. Abbreviations: e = line elongation; S = line stretching; λ′ = 1/quadratic elongation; R = strain ratio.
| Section | ea% | eb% | ec% | Sa | Sb | Sc | λ′a | λ′b | λ′c | R |
|---|
| 1 | 1.62 | 0.12 | 0.84 | 2.62 | 0.87 | 1.84 | 0.144 | 0.13 | 0.29 | 2.5 |
| 2 | 1.19 | 1.1 | 0.95 | 2.19 | 2.1 | 1.95 | 0.207 | 0.225 | 0.267 | 2.05 |
| 3 | 1.08 | 0.96 | 0.8 | 2.08 | 1.96 | 1.08 | 0.229 | 0.25 | 0.307 | 1.75 |
| 4 | 1.15 | 1.42 | 1.5 | 2.15 | 2.42 | 2.5 | 0.216 | 0.17 | 0.16 | 1.35 |
| 5 | 1.61 | 1.46 | 1.41 | 2.61 | 2.46 | 2.41 | 0.146 | 0.16 | 0.17 | 1.8 |
| 6 | 1.95 | 1.9 | 0.43 | 2.95 | 2.9 | 1.43 | 0.114 | 0.118 | 0.48 | 2.24 |
| 7 | 0.52 | 0.62 | 1.26 | 1.52 | 1.62 | 2.26 | 0.42 | 0.37 | 0.195 | 2 |
| 8 | 0.62 | 0.79 | 0.69 | 1.62 | 1.79 | 1.69 | 0.38 | 0.31 | 0.35 | 1.35 |
Table 2.
Statistical values of volume strain for the desired sections. Abbreviations: α, B, and γ = angles formed by the normal of the plane and each of the principal stress axes (x, y, z); RXY, RYZ = strain ratio on planes XY and YZ; D = Eigenvalues of the matrix.
Table 2.
Statistical values of volume strain for the desired sections. Abbreviations: α, B, and γ = angles formed by the normal of the plane and each of the principal stress axes (x, y, z); RXY, RYZ = strain ratio on planes XY and YZ; D = Eigenvalues of the matrix.
| Section | α | γ | B | RXY | RYZ | D |
|---|
| 1 | 60 | 80 | 40 | 1.32 | 2.04 | 0.32 |
| 2 | 60 | 80 | 40 | 1.08 | 1.67 | 0.45 |
| 3 | 60 | 80 | 40 | 0.92 | 1.43 | 0.43 |
| 4 | 60 | 80 | 40 | 1.105 | 0.714 | 0.3 |
| 5 | 60 | 80 | 40 | 0.95 | 1.47 | 0.68 |
| 6 | 60 | 80 | 40 | 1.18 | 1.83 | 0.84 |
| 7 | 30 | 75 | 75 | 1.05 | 1.63 | 0.39 |
| 8 | 60 | 80 | 40 | 0.71 | 1.1 | 0.3 |
Table 3.
Values of the surface volume strain on the plane XZ.
Table 3.
Values of the surface volume strain on the plane XZ.
| Section | The Initial Area of the Rock Mass, Along Section (A0) | Changes in Rock Mass Area (Area of Fissure Structures), Along Section (ΔA) | Volumetric Strain
|
|---|
| 1 | 74.7 | 24 | 0.321 |
| 2 | 344 | 79 | 0.229 |
| 3 | 325 | 81 | 0.249 |
| 4 | 358 | 96.5 | 0.269 |
| 5 | 249.4 | 92.4 | 0.37 |
| 6 | 220 | 85.5 | 0.388 |
| 7 | 256 | 69.5 | 0.271 |
| 8 | 91 | 30 | 0.329 |
Table 4.
Values of the three-dimensional volume strain (3D strain) along Sections 1 to 8. D = Eigenvalues of the matrix.
Table 4.
Values of the three-dimensional volume strain (3D strain) along Sections 1 to 8. D = Eigenvalues of the matrix.
| Section | Strain on Planes XY,YZ (or D) | Strain on Plane XZ | 3D Strain |
|---|
| 1 | 0.32 | 0.321 | 10.27 |
| 2 | 0.45 | 0.229 | 10.3 |
| 3 | 0.43 | 0.249 | 10.7 |
| 4 | 0.3 | 0.269 | 8.07 |
| 5 | 0.68 | 0.37 | 25.16 |
| 6 | 0.84 | 0.388 | 32.59 |
| 7 | 0.39 | 0.271 | 10.56 |
| 8 | 0.3 | 0.3292 | 9.8 |
Table 5.
Values of the net slip (Ns), and volume strain (V) along the desired section in the study area.
Table 5.
Values of the net slip (Ns), and volume strain (V) along the desired section in the study area.
| Fault Name | Fault along Section | Fault Attitude | Ns—Meter | %V |
|---|
| 1 | 5 | N80W, 60NE | 11.32 | 25.16 |
| 2 | 6 | N80W, 70NE | 15.12 | 32.59 |
| 3 | 7 | N80W, 50NE | 9 | 10.56 |
| 4 | 8 | N55W, 25SW | 3.231 | 9.8 |
Table 6.
Lengths, and mean throws of the fissures in the study area.
Table 6.
Lengths, and mean throws of the fissures in the study area.
| Fissure | Fissure Length (m) | Mean Fissure Throw (m) |
|---|
| 1 | 9 | 0.3 |
| 2 | 10 | 0.3 |
| 3 | 10.5 | 0.4 |
| 4 | 11 | 0.3 |
| 5 | 11.5 | 0.4 |
| 6 | 11.8 | 0.4 |
| 7 | 12 | 0.5 |
| 8 | 12 | 0.5 |
| 9 | 12 | 0.5 |
| 10 | 13 | 0.6 |
| 11 | 15 | 0.6 |
| 12 | 17 | 0.65 |
| 13 | 19 | 0.5 |
| 14 | 25 | 0.5 |
| 15 | 29 | 0.6 |
| 16 | 41 | 0.8 |
| 17 | 42 | 0.8 |
| 18 | 43 | 0.8 |
| 19 | 51 | 0.9 |
| 20 | 56 | 1.1 |
| Publisher’s Note: MDPI stays neutral with regard to jurisdictional claims in published maps and institutional affiliations. |
© 2022 by the authors. Licensee MDPI, Basel, Switzerland. This article is an open access article distributed under the terms and conditions of the Creative Commons Attribution (CC BY) license (https://creativecommons.org/licenses/by/4.0/).


