Article

Risk Assessment in Supplier Selection for Intelligent Manufacturing Systems Based on PLS-SEM

1
School of Management, Hefei University of Technology, Hefei 230000, China
2
School of Computer Science and Technology, Huaibei Normal University, Huaibei 235000, China
3
College of Economic and Management, Huaibei Normal University, Huaibei 235000, China
4
Engineering Research Center of Cognitive Behavioral Intelligent Computing and Application, Huaibei 235000, China
*
Authors to whom correspondence should be addressed.
Appl. Sci. 2022, 12(8), 3998; https://doi.org/10.3390/app12083998
Submission received: 7 March 2022 / Revised: 9 April 2022 / Accepted: 11 April 2022 / Published: 15 April 2022

Abstract

:
With the in-depth reform of intelligent manufacturing, selecting high-quality intelligent manufacturing system solution suppliers has become a key force to promote the intelligent transformation of manufacturing enterprises. However, manufacturing enterprises have hidden risks in the selection process of many intelligent manufacturing system solution suppliers, so it is urgent to carry out the research on the risk evaluation of intelligent manufacturing system solution suppliers. Based on the current situation in China’s intelligent manufacturing industry, this paper constructs the evaluation index system of intelligent manufacturing system solution suppliers, uses the PLS-SEM method to establish the risk evaluation model of intelligent manufacturing system solution suppliers, collects data through a questionnaire survey, uses a PLS algorithm to fit the index and test the model, and uses power BI software to visualize the risky impact. The conclusions are as follows: (1) The primary indicators have hidden risks for the system solution suppliers. (2) The higher the achievement of secondary indicators, the lower the implied risk, and the more conducive to the intelligent upgrading of manufacturing enterprises. According to the visualization results, management suggestions are given to provide useful reference for manufacturing enterprises to select high-quality intelligent manufacturing system solution suppliers and promote the transformation and upgrading of manufacturing enterprises, from digitization and networking to intelligent stage.

1. Introduction

With the vigorous rise of a new round of industrial reform, the manufacturing industry has become the focus of global economic development. Major developed countries in the world have taken a series of significant measures to promote the transformation and upgrading of the intelligent manufacturing industry. In 2009, the framework of the “Reindustrialization” plan of the United States changed from revitalizing the manufacturing industry to vigorously developing the advanced manufacturing industry, actively seizing the strategic springboard of the world’s high-end manufacturing industry and promoting the development of the intelligent manufacturing industry [1]. In 2013, the German government officially launched the implementation proposal of the German industry 4.0 strategic plan, put forward the concept of industry 4.0, and analyzed the vision, strategy, demand, limited action and other intelligent manufacturing fields of industry 4.0 [2]. France, Japan, South Korea, and other countries have also launched manufacturing revitalization plans. With the digital transformation, networked collaboration and intelligent transformation of manufacturing enterprises, intelligent manufacturing system solutions (IMSS for short) suppliers have become an innovative subject, with the deep integration of manufacturing technology and information and communication technology, and IMSS suppliers are the key force to promote the development of intelligent manufacturing. Since the Chinese government officially issued the made in “China 2025” document in 2015, China’s intelligent manufacturing plan has been continuously implemented and achieved remarkable results, driving the vigorous development of intelligent manufacturing system solution suppliers. Traditional industrial system solution suppliers are actively transforming into IMSS suppliers. More than 12,000 suppliers of intelligent manufacturing equipment, industrial automation and industrial software have participated in various intelligent manufacturing projects [3]. However, the supplier quality and service level are uneven, which cannot effectively solve the pain points in the insufficient overall planning of intelligent factories and low integration of digital production line in the intelligent transformation of manufacturing enterprises, especially the insufficient substantive supply capacity of intelligent manufacturing system solutions, such as quality, cost, efficiency and delivery time [3], which poses hidden risks to the development of intelligent manufacturing formats. Therefore, the scientific prediction and evaluation of IMSS suppliers risks and helping manufacturing enterprises select appropriate IMSS suppliers have become important research issues in the field of intelligent manufacturing enterprises’ selection and evaluation.

2. Literature Overview

The research objects of supplier selection and evaluation are usually divided into traditional suppliers and intelligent manufacturing suppliers. For the selection and evaluation of traditional suppliers, Bo V., Verma R., and Plaschka G. proposed a framework based on an economic selection model in the research, which balances cost, delivery, flexibility and service characteristics in the process of commodity raw material supplier selection [4]. Prahinski C and Benton W C discussed how suppliers view the supplier evaluation communication process of purchasing companies and its impact on supplier performance [5]. Kara M.E. and Firat S.U. proposed a supplier risk profile grouping method based on clustering to evaluate suppliers [6]. The work of Pitchipoo P., Venkumar P., and Rajakaruna S. aimed to evaluate and select suppliers by integrating an analytic hierarchy process and grey relationship analysis, so as to develop an appropriate hybrid model [7].
With the development of intelligent manufacturing, more and more scholars have begun to pay attention to the influence of intelligent manufacturing system software in the process of enterprise intelligent development, and study the selection and evaluation of intelligent manufacturing software in different industries. Scholars Broy M., Kruger I.H., and Pretschner A. clearly described the essence of automotive software, and discussed the selection and rating of Automotive Software Engineering [8]. Aduamoah M. carried out research on how small and medium-sized enterprises in developing countries choose computer accounting software suppliers [9]. Fabbrini F., Fusani M., and Lami G. took the results of software process (ISO/IEC15504) evaluation as one of the requirements for software companies to obtain software orders [10]. Khan S.U., Niazi M., and Ahmad R. discussed various obstacles that have a negative impact on software outsourcing customers in the selection process of offshore software development outsourcing suppliers [11]. Lehmann S. and Buxmann P. summarized the pricing model of software, analyzed the characteristics of software as a product and the general conditions for evaluating software suppliers [12]. Ajami S., Rajabzadeh A. and Ketabi S. believed that effective IT service provider selection criteria can enable managers to make the most appropriate decisions [13]. Scholars, such as Huang Yajiang, Liu Yingyin, and Liu erlie, took the BIM software supplier evaluation index system as the research starting point, constructed the evaluation index system through literature statistics, and calculated the corresponding weight of the index based on a fuzzy analytic hierarchy process, so as to provide a scientific basis for enterprises in selecting BIM software suppliers [14]. Zhao Hui studied a total of 10 evaluation problems of embedded software suppliers, based on a VDA6.3 evaluation structure of an embedded software supplier evaluation method, designed to evaluate the quality assurance ability of embedded software suppliers [15].
The above literature mainly involves two aspects: traditional supplier selection and evaluation and intelligent manufacturing software supplier evaluation, and has formed some achievements in the field of supplier selection and evaluation. However, in the process of selecting IMSS suppliers, manufacturing enterprises have some potential risks, such as insufficient supplier qualification, imperfect system, core technology “neck”, low service ability, insufficient project experience and imperfect information system solutions; the existing literature research lacks the consideration of supplier risk, and ignores the implicit impact of supplier risk in supplier selection and evaluation. Risk assessment can help intelligent manufacturing enterprises find hidden problems in time and select high-quality IMSS suppliers, so as to accelerate the transformation and upgrading of intelligent manufacturing enterprises and promote the popularization and implementation of intelligent manufacturing. Therefore, from the perspective of IMSS supplier risk prediction, this paper carries out the research on the risk evaluation of intelligent manufacturing system solution suppliers, so as to provide reference for intelligent manufacturing enterprises to select high-quality IMSS suppliers.
PLS-SEM (Least squares structural equation model) is a model that can estimate a large number of potential variables and indicators in a small sample size (Chin/Peterson and Brown 2008) [16]. For complex models, PLS-SEM identifies factors by introducing a flexible residual covariance structure, and makes robust prediction under the background of small sample size, asymmetric distribution and interdependent observation (Chin 1998a, 1998b) [17,18].
PLS-SEM mainly has the following advantages: ① PLS-SEM does not require the index data to obey the normal distribution. The sample size is smaller and the analysis is accurate. The sample size of PLS-SEM is only 30 to 100. ② PLS-SEM infiltrates statistical scientific methods, such as multiple linear regression, principal component analysis and correlation analysis, and can reasonably and effectively analyze and predict the impact of various factors on the IMSS suppliers evaluation model. ③ PLS-SEM can better deal with the problem of multicollinearity, explain the correlation between variables [19], and ensure that different factors have different interpretation connotations. Wetzels M., Odekerken-Schroder G., Van Oppen C., and VanOppen [20] found that the characteristics of PLS-SEM make it an alternative to the CB-SEM method for complex modeling (Henseler, Jorg, Ringle, et al., 2009; HAIR, 2012) [21,22]. Chin, Peterson and Brown [17] validated the large-level model by providing robust solutions.
Many scholars use the PLS-SEM method to solve the evaluation problem. In order to improve the environmental performance of environmental suppliers, Li Dexian and Wei Xingang established the PLS-SEM model to measure the performance of environmental suppliers and test the reliability and validity of the structural model [23]. Hair, Joe F. Howard, and Matt C used PLS-SEM to analyze the importance of accounting standards to the future research and development of management accounting [24]. Hair, J.F., Hult, J.T.M., and Ringle, C.M. established a PLS-SEM model for customer satisfaction evaluation regarding mobile travel, based on the American customer satisfaction index system [25]. It can be seen that PLS-SEM is more suitable for complex model evaluation.
Focusing on the needs of IMSS supplier risk evaluation in manufacturing enterprises, this paper uses the PLS-SEM theoretical model in statistics to carry out research. The main contributions are as follows: On the one hand, it selects a new research perspective to carry out IMSS suppliers risk evaluation of intelligent manufacturing enterprises, from the perspective of IMSS suppliers risk prediction. On the other hand, it expands the application of PLS-SEM in the field of intelligent manufacturing supplier risk evaluation. The contents are arranged as follows: Taking the observable risk influencing factors as the intermediary, this paper constructs the IMSS suppliers risk evaluation model through the PLS-SEM method, quantifies the implied risk of IMSS suppliers, uses power BI software to visualize the risk index inspection process and results, helps decision makers intuitively understand the implied risk of candidate IMSS suppliers, and provides decision-making reference for intelligent manufacturing enterprises to select high-quality IMSS suppliers.

3. Constructing IMSS Suppliers Risk Evaluation Model Based on PLS-SEM

3.1. Index Identification

The specification conditions for intelligent manufacturing system solution suppliers (hereinafter referred to as the “Specification Conditions”) clearly point out the need to strengthen IMSS suppliers management [26,27], standardize supplier service processes and ensure service quality, and meet the needs of transformation and the upgrading of manufacturing enterprises. According to this specification, the basic information of IMSS suppliers and the information system can be divided into six risk dimensions, mainly including supplier qualification, system, core technology, service capability, project and information system solutions. The details are as follows:
1. Supplier qualification (SQ). SQ requires the supplier to have good credit and public image, operate legally and in good faith, meet the safety production conditions specified in the relevant laws and regulations, national standards or industrial standards, and establish a perfect quality management system, environmental management system and information security management system, and the supplier shall operate effectively and pass the third-party certification. SQ is the most basic requirement for IMSS suppliers.
2. Supplier system (SS). The “Specification Conditions” emphasize that IMSS suppliers should establish a perfect project document management system, which should cover demand documents, project plans, design documents, implementation schemes, etc.; at the same time, the document management system should have a perfect after-sales service system and strict system equipment management information system, equipped with special maintenance departments and professionals, provide users with corresponding technical consultation, technical training and maintenance services.
3. Supplier core technology (SCT). In the process of use, the value of core technology can be increased, with the characteristics of continuous growth and increasing returns. IMSS suppliers shall have core technology in key technical equipment, software, intelligent manufacturing complete equipment, the process and integration optimization of key parts. The core technology requires authorized patents related to intelligent manufacturing system integration technology or software copyright related to intelligent manufacturing.
4. Supplier service capability (SSC). The “Specification Conditions” points out that IMSS suppliers should have a professional consulting and planning team, be familiar with users’ industry knowledge and technology, have project consulting and planning experience and personalized customization ability. The professional consulting and planning team needs to confirm the function, cycle and cost of user needs, carry out system integration and secondary development and implementation, have certain platform construction ability, and be able to provide corresponding services in collaborative design, big data analysis and other aspects, according to user needs.
5. Supplier project (SP). The project is the carrier to realize the enterprise development strategy. The mission, vision and strategic objectives of the enterprise need to be realized through successful projects. SP includes the number of docking projects, project investment amount, project satisfaction and project success rate.
6. Supplier information system solutions (SISS). The “Specification Conditions” point out that IMSS suppliers should have modular and standardized solutions so that the system solutions have the ability of replication and promotion. At the same time, according to the characteristics of the project, IMSS suppliers should have the ability of system customization for intelligent manufacturing equipment, such as intelligent sensing and control equipment and intelligent process equipment, and provide system safety emergency plans to ensure system safety.
We stablished the IMSS suppliers risk evaluation system, according to the above six dimensions, including 6 primary indicators and 23 secondary indicators. When selecting IMSS suppliers, manufacturing enterprises should focus on the secondary indicators of 23 observable variables, as shown in Figure 1.

3.2. Index Identification

Traditional SEM can only construct reflective structures. PLS-SEM is suitable for risk prediction as a hybrid model that can both build reflective structures and form structures [25]. This paper constructs the IMSS suppliers risk evaluation model based on PLS-SEM, as shown in Figure 2 The two column graphs in area A are formative structures and the two column graphs in area B are reflective structures. The indicators in area A determine the significance of IMSS suppliers risk evaluation, and area B reflects the secondary indicators of IMSS suppliers risk evaluation.
The specific steps of IMSS suppliers risk assessment are as follows (the flow chart is shown in Figure 3):
  • Step 1. Data collection and analysis through questionnaire survey.
  • Step 2. Software risk evaluation index is formed in the Smart-PLS theory.
  • Step 3. Create new projects, import data and preprocess data.
  • Step 4. Import data according to the theoretical model to form a reflective model and a formative model.
  • Step 5. Test the fitting, validity and reliability according to the calculation results.
In step 5, each process of index inspection uses power BI software to make an index inspection chart. First, factor load analysis is used to verify whether each index supports IMSS suppliers risk assessment, and then each index is inspected, including the following four items:
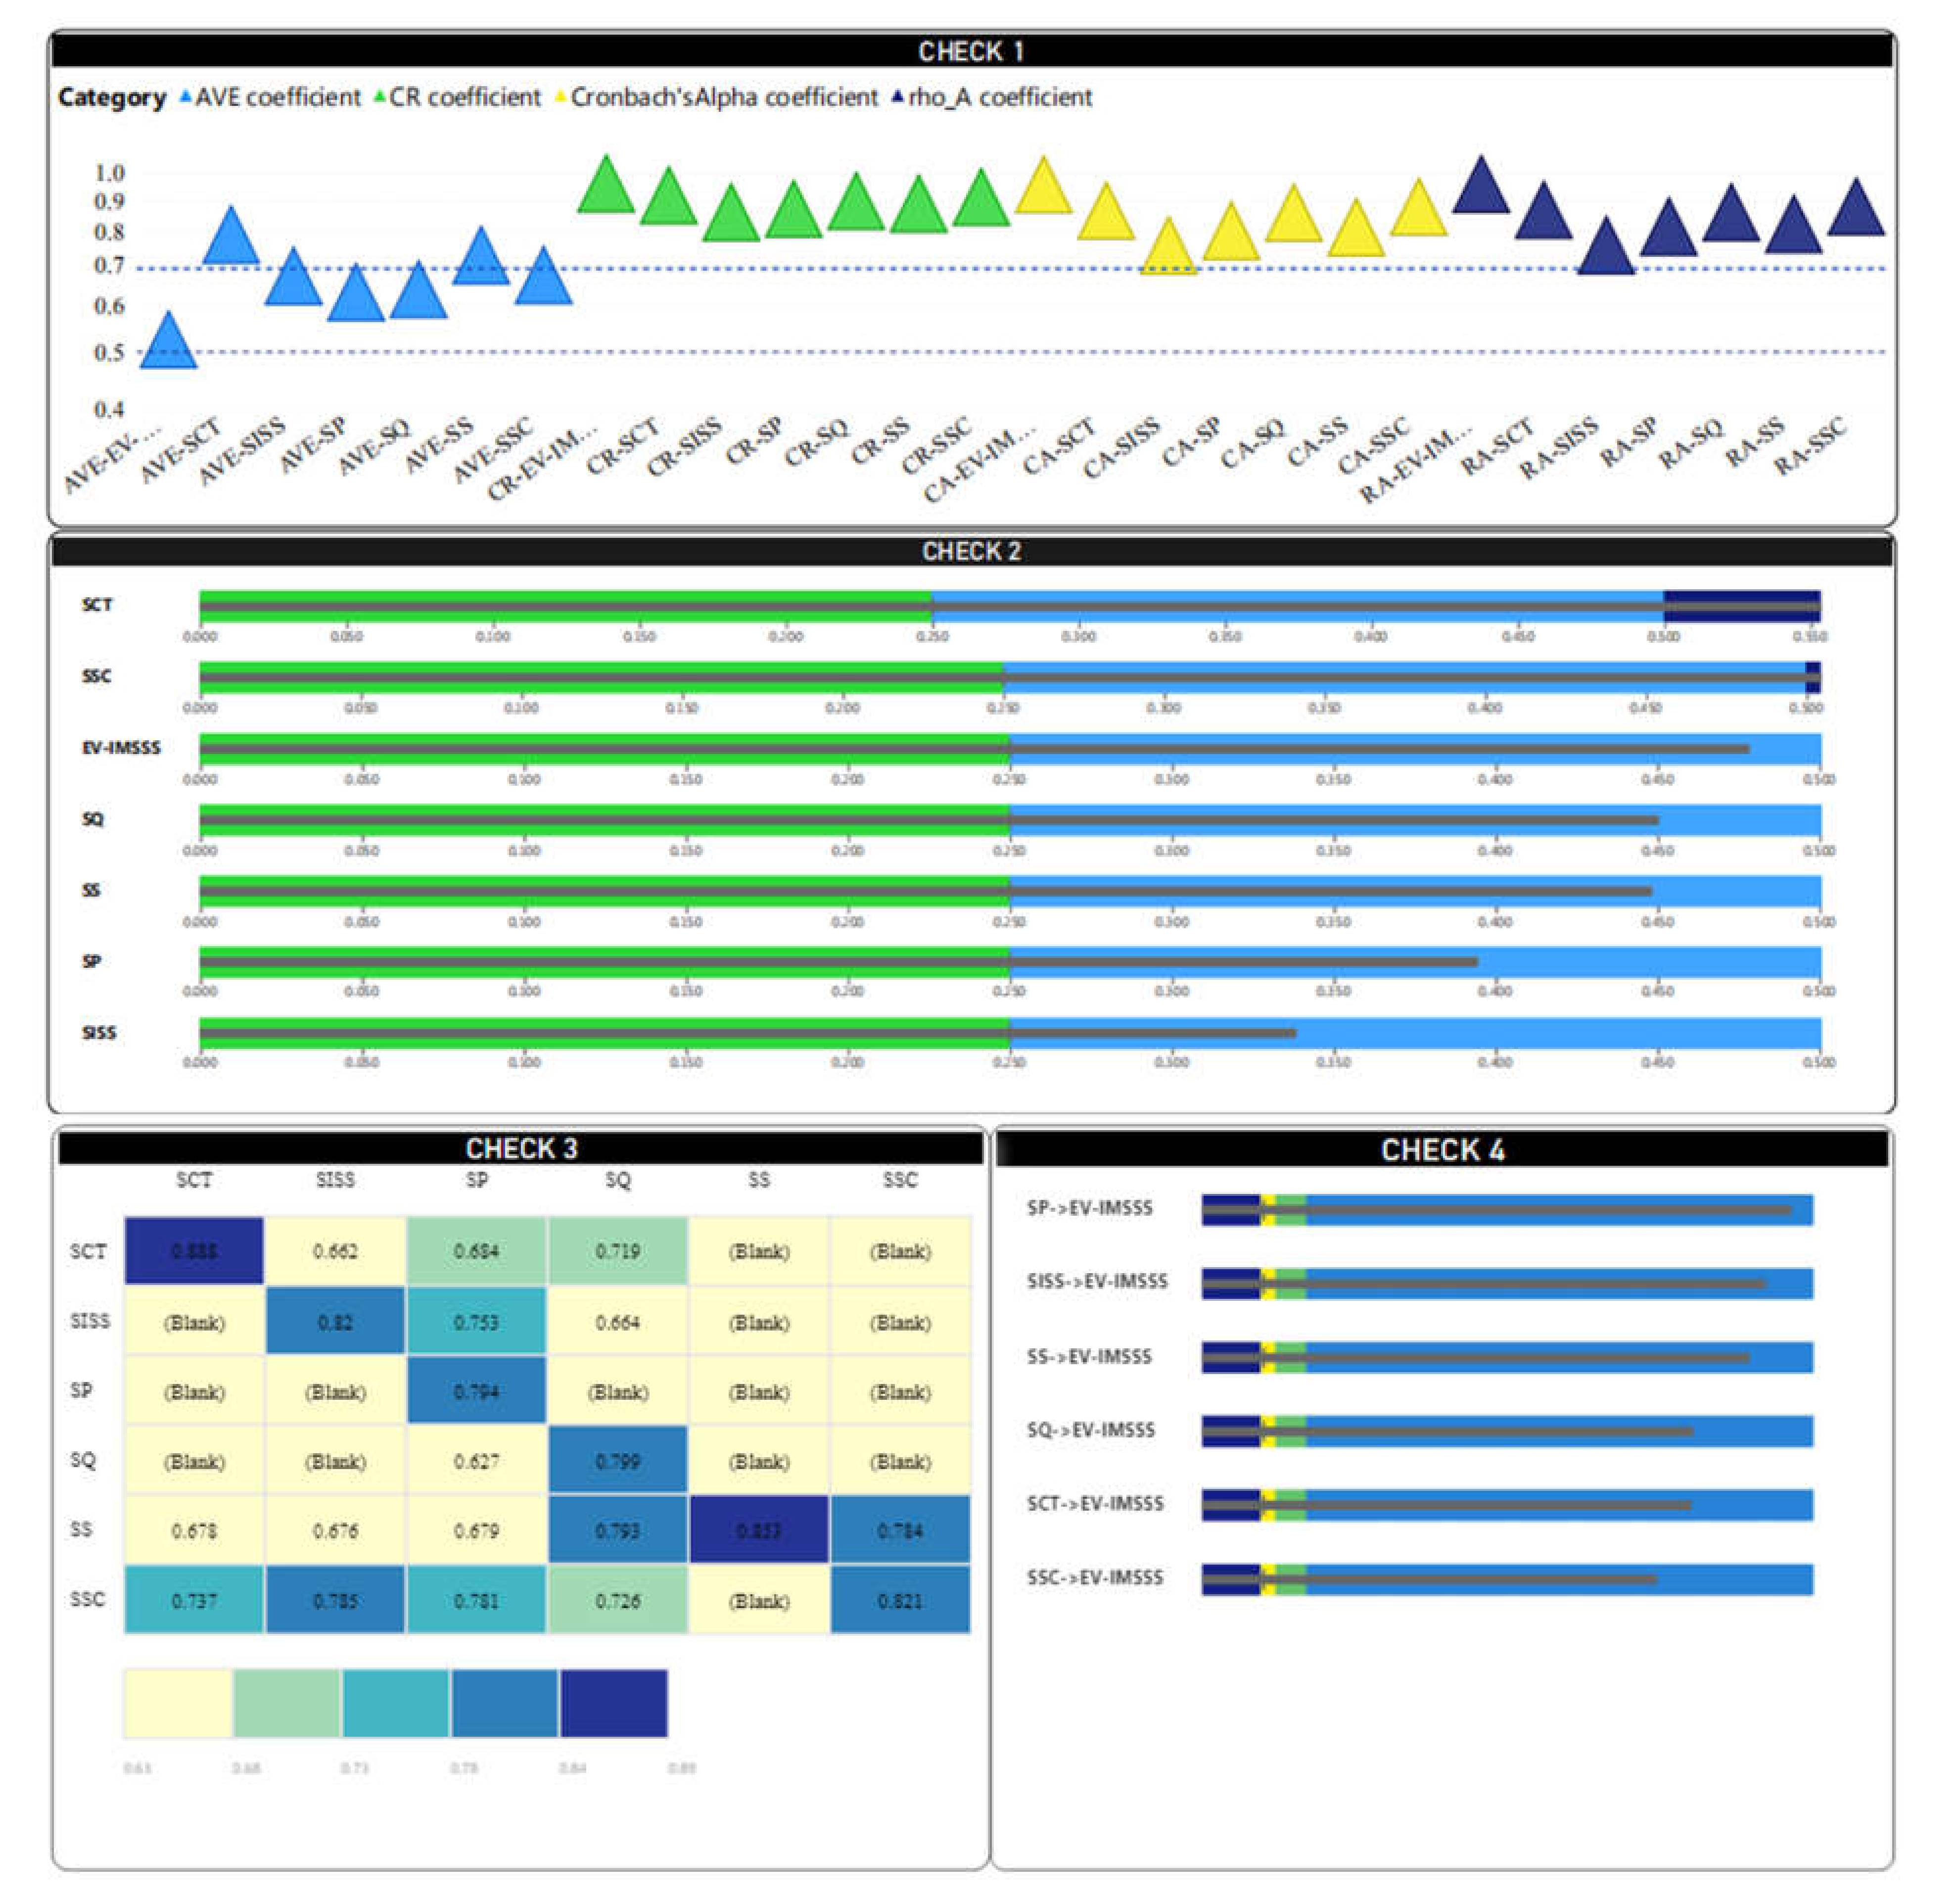
  • CHECK 1. Reliability and validity test to verify the reliability and validity of the questionnaire.
  • CHECK 2. Prediction test to verify the predictability of each index to IMSS suppliers risk assessment.
  • CHECK 3. Discriminant validity test to verify the representative activeness of primary indicators with different dimensions.
  • CHECK 4. Through bootstrapping, test the significance of level I indicators on IMSS suppliers risk assessment.

4. Empirical Analysis

4.1. Data Collection and Analysis

In this study, data were collected by means of a questionnaire survey. The subjects of the survey were experts, scholars, graduate students and experienced employees of intelligent manufacturing enterprises, in the field of intelligent manufacturing supplier risk. Most of the respondents to this questionnaire received higher education, and a small number of scientific researchers had no practical experience, but they had more than one year of research experience in this field. Therefore, the information fed back by the respondents through the questionnaire is of high quality and can be used in this study. In addition to the general questions, the questionnaire adopts the form of a Likert five-level scale. The respondents choose and score each question item; “very unimportant” represents 1 point and “very important” represents 5 points. A total of 98 questionnaires were collected and 90 valid questionnaires met the requirements of statistical PLS-SEM small sample analysis.
In this paper, Smart-PLS 3.0 is used to build the PLS-SEM model, and a PLS algorithm is used for a single dimension test to fit various index data (as shown in Figure 4). In this model, the evaluation item IMSS suppliers risk evaluation is represented by “EV-IMSS suppliers”, and the six primary indicators are represented by V1–V6; V1.0 is used for 23 secondary indicators 1-v6. As such, 3 indicates that the data input before running the model comes from the actual data. When using the PLS algorithm, Smart-PLS 3.0 software standardizes the original data by default. The results output by the software are standardized results. The following are analyzed with standardized results. As can be seen from Figure 4, the path coefficients of each level I index are sq (0.229), SS (0.158), SCT (0.165), SSC (0.257), SP (0.181), and SISS (0.145). The square value (R2) of the coefficient determined by the multiple regression equation of EV-IMSS suppliers for the six primary indicators is 1.000, which reflects that the risk assessment of IMSS suppliers summarizes the six primary indicators quite well, indicating that the primary indicators have strong interpretation ability for the risk assessment of IMSS suppliers, and the interpretation proportion has reached 100%. Run the PLS algorithm to obtain the factor loads (see Table 1 for details). The factor loads are positive and greater than 0.6, indicating that each index supports IMSS suppliers risk assessment. The greater the load coefficient, the greater the impact.

4.2. Effect Test of IMSS Suppliers Risk Evaluation Model

4.2.1. Reliability and Validity Test of Questionnaire

Fit the indicators with the help of the Smart-PLS software algorithm and test the reliability and validity of the questionnaire (the specific fitting data are shown in Table 2). Among them, the value of Cronbach’s alpha coefficient represents the strength of internal consistency. The Cronbach’s alpha coefficient of indicators at all levels of this model meets the requirements of greater than 0.7, indicating that the validity of the questionnaire is high. CR represents the combined reliability of indicators at all levels, which meets the recommended requirements higher than the critical value of 0.7, proving that the reliability of the questionnaire is high [22]. AVE represents the average extraction variation of indicators at all levels, rho_A is the new consistent reliability coefficient proposed by PLS. According to the data in Table 2, both are higher than the critical value of 0.5, indicating that the questionnaire meets the relevant statistical standards [23] and has high introverted validity.

4.2.2. Blindfolding Prediction Ability Test

The blindfolding prediction ability is tested by Smart-PLS software, and the Q2 value of the model is obtained (see Table 3 for details). Q2 is a statistic to evaluate the influence of exogenous variables on endogenous variables. Q2 values in the range of 0–0.25, 0.25–0.50 and greater than 0.50 represent the small, medium and large prediction correlation of the PLS path model, respectively. According to the Q2 values in Table 3, which are greater than 0.25, it shows that the primary indicators have a good influence on IMSS suppliers risk assessment and the prediction correlation of the model is at the upper-middle level.

4.2.3. Correlation Coefficient Test

Through the correlation coefficient test of the Smart-PLS software, the index values in Table 4 can be obtained. Where the diagonal is the square root of AVE ( AVE = λ 2 / n , λ is the factor load coefficient and n is the index number). All correlation coefficients in Table 4 are less than the square root of AVE, indicating good discriminant validity among indicators at all levels.

4.2.4. Bootstrapping Test

Table 5 can be obtained by calculating the T statistics of path coefficients of indicators at all levels by using the bootstrapping method of Smart-PLS software. The T-test path coefficient represents the estimated significance level of indicators at all levels. When T > 1.96, the path coefficient is estimated to be significant at the level of 0.05; T > 2.58, the path coefficient estimation is significant at the level of 0.01; T > 3.29, the path coefficient is significant at the level of 0.001. The data in Table 5 show that T > 3.29 and the path coefficient is significant at the level of 0.001, indicating that the indicators at all levels have strong significance for the IMSS suppliers risk evaluation model.

4.2.5. Visualization of Inspection Results

The visual index inspection with power BI software (as shown in Figure 5) is as follows:
CHECK 1: There are two dashed lines in the figure, representing the values of 0.5 and 0.7, respectively. It can be seen from Figure 5 that the CR and AVE indexes of the model are above the dotted line of 0.5, Cronbach’s alpha and rho_A Index a is above the dotted line of 0.7, with good fitting effect, strong interpretation effect of internal relations, acceptable estimation effect and good reliability of the questionnaire.
CHECK 2: The light blue area indicates that the prediction ability value is greater than 0.25, the dark blue area indicates that the prediction ability value is greater than 0.5, and the gray horizontal line represents the Q2 value. The Q2 bullet diagram is in the blue area, indicating that the overall prediction ability of the model belongs to the upper-middle level.
CHECK 3: As shown in the thermodynamic diagram, the diagonal color is darker than the color block of the correlation coefficient (the values are greater than all the values of the correlation coefficient), indicating that the indicators at all levels have different connotations in theory, and they have good differential validity.
CHECK 4: In the bootstrapping test, the yellow area is T > 1.96, the gray green area is T > 2.58, and the blue area is T > 3.29. The gray horizontal line represents the size of the T value, which is in the blue area, and the p value is at the level of 0.001, indicating that the index is highly significant, meaning that the stability of the model structure is very good.
Using the visual inspection results of power BI software can more intuitively display the data, correlation and trend between data, so as to help enterprise decision makers quickly understand the information, master the dynamic risk of IMSS suppliers, and provide decision-making reference for manufacturing enterprises to select high-quality IMSS suppliers.

4.3. Evaluation Results and Suggestions

We used power BI software to draw the tree diagram of the index path coefficient in Figure 6. Different color block sizes represent the value of the primary index path coefficient, respectively, and different grid block sizes within the same color block represent the value of secondary index load factor. From this, the following conclusions and management suggestions can be obtained:

4.3.1. Level I Indicators

As can be seen from the above Figure 1 and Figure 6, the path coefficient (PC for short) of indicators at all levels is PC_SQ (0.229), PC_SS (0.158), PC_SCT (0.165), PC_SSC (0.257), PC_SP (0.181), and PC_SISS (0.145). The first level indicators have an impact on IMSS suppliers risk, in order of service capability, supplier qualification, project, core technology, system and information system solutions. All values are positive, indicating that different indicators of IMSS suppliers risk assessment are interrelated, and they are positively correlated with IMSS suppliers risk assessment. Therefore, manufacturing enterprises should pay attention to the comprehensive development ability of IMSS suppliers and pay attention to the risk problems in the selection process of IMSS suppliers, such as insufficient qualification, incomplete system, core technology “neck”, low service ability, insufficient project experience and imperfect information system solutions.

4.3.2. Secondary Index Level

(1) Supplier qualification (SQ). SQ includes secondary indicators, such as quality management system, environmental management system, information security management system, national and industrial standards and good public image. Its standard factor loads are 0.780, 0.822, 0.765, 0.814, and 0.813, respectively, and all loads are higher than the critical value of 0.6. It can be seen that the five secondary indicators involved in SQ have a great impact on its primary indicators. The higher the achievement degree of each index, the lower the implied risk of IMSS suppliers. In addition, considering that the value of SQ path coefficient ranks second among all primary indicators (0.229), it suggests that manufacturing enterprises should give priority to IMSS suppliers with good performance in environmental management system, national and industrial standards and good public image, and avoid cooperation with IMSS suppliers with insufficient qualifications.
(2) Supplier system (SS). SS includes secondary indicators, such as document management system, system equipment management informatization and after-sales service management system. Its standard factor loads are 0.812, 0.940 and 0.840, and all loads are higher than the critical value of 0.6. It can be seen that the three secondary indicators involved in SS have a greater impact on its primary indicators. The higher the achievement degree of each indicator, the lower the implied risk of IMSS suppliers. As a mode of code of conduct, SS should be taken into consideration by manufacturing enterprises in the process of IMSS supplier selection, so as to avoid selecting IMSS suppliers with imperfect systems and reduce the risk of cooperation.
(3) Supplier core technology (SCT). SCT includes secondary indicators, such as the number of patents, the number of relevant software copyrights and the level of technical equipment. Its standard factor loads are 0.901, 0.919 and 0.842, respectively, and all loads are higher than the critical value of 0.6. It can be seen that the three secondary indicators involved in SCT have a greater impact on their primary indicators. The higher the achievement degree of each indicator, the lower the implied risk of IMSS suppliers. In view of the different application departments of information systems in intelligent manufacturing enterprises, it suggests that different attitudes should be adopted in the selection process of IMSS suppliers. For the intelligent information systems that affect the core production links of enterprises, the core technical capabilities of relevant suppliers should be mainly considered.
(4) Supplier service capability (SSC). SSC includes secondary indicators, such as consulting planning ability, personalized customization ability, system integration and secondary development ability, system implementation ability, platform construction, and promotion ability. Its standard factor loads are 0.808, 0.899, 0.829, 0.817, and 0.745, respectively, and all loads are higher than the critical value of 0.6. Therefore, the five secondary indicators involved in SSC have a great impact on its primary indicators; the higher the achievement degree of each index, the lower the implied risk of IMSS suppliers. Combined with the value of SSC primary index path coefficient, in the process of IMSS suppliers selection, it is suggested that intelligent manufacturing enterprises focus on the five secondary indexes of SSC to avoid the problem of low service capacity.
(5) Supplier project (SP). SP intablescludes secondary indicators, such as the number of docking projects, project investment amount, project satisfaction, and project success rate. Its standard factor loads are 0.644, 0.802, 0.887, and 0.808, respectively, and all loads are higher than the critical value of 0.6. It can be seen that the four secondary indicators involved in SP have a greater impact on its primary indicators. The higher the achievement of each indicator, the lower the implied risk of IMSS suppliers. Considering that SP ranks third (0.181) in the six primary indicators, it is suggested that intelligent manufacturing enterprises comprehensively consider the number of IMSS suppliers’ projects, project investment amount, project satisfaction, project success rate, and other conditions to improve the success rate of IMSS suppliers’ projects of intelligent manufacturing enterprises.
(6) Supplier information system solutions (SISS). SISS includes secondary indicators, such as system standardization degree, system customization degree and system safety degree. The standard factor loads are 0.838, 0.795 and 0.826, respectively, and all loads are higher than the critical value of 0.6. It can be seen that the three secondary indicators involved in SISS have a greater impact on their primary indicators. The higher the achievement degree of each indicator, the lower the implied risk of IMSS suppliers. Therefore, when selecting IMSS suppliers, manufacturing enterprises should consider the three secondary indicators of SISS to avoid the risk of imperfect information system solutions.

5. Conclusions

With the continuous development of global intelligent manufacturing, intelligent manufacturing system solution suppliers have become the key force to promote the development of intelligent manufacturing. Intelligent manufacturing enterprises have hidden risks in the selection process of many IMSS suppliers. Therefore, it is of great significance to carry out the research on IMSS suppliers risk evaluation. Based on the development status of intelligent manufacturing in China, this paper refines the observable risk influencing factors to form secondary indicators, constructs the IMSS suppliers evaluation index system, establishes the IMSS suppliers risk evaluation model by using the PLS-SEM method, collects data through a questionnaire survey, uses a PLS algorithm to fit the indicators and test the model, and uses power BI software to visualize the risk impact. The following conclusions are drawn: (1) The six primary indicators have hidden risks for IMSS suppliers, and the degree of impact is service capability, supplier qualification, project, core technology, system, and information system solutions. (2) The achievement degree of 23 secondary indicators also has hidden risks for IMSS suppliers. The higher the achievement degree, the lower the hidden risk, which is more conducive to the intelligent upgrading of manufacturing enterprises. (3) Therefore, 23 secondary indicators are observable variables. When selecting IMSS suppliers, manufacturing enterprises should focus on them according to the actual application department.
This study has certain guiding significance for manufacturing enterprises to select and evaluate IMSS suppliers, the system can effectively provide feedback for the hidden problems of IMSS suppliers, provide useful reference for intelligent manufacturing enterprises to select high-quality IMSS suppliers, and promote the transformation and upgrading of manufacturing enterprises, from digitization and networking to the intelligent stage. However, this paper has limitations and deficiencies in the construction of the index system. In the follow up, we should consider more universal industry standards to establish the index system to better serve the research field of IMSS suppliers.

Author Contributions

Methodology, L.S.; formal analysis, K.H.; writing—review and editing, Y.L.; Software, F.G.; Visualization, S.L. All authors have read and agreed to the published version of the manuscript.

Funding

This research was funded by the National Natural Science Foundation of China (71801108; 62006091; 62006092), Overseas Visit Program for outstanding young backbone teachers in colleges and universities (gxgwfx2020038).

Informed Consent Statement

Informed consent was obtained from all subjects involved in the study.

Data Availability Statement

Not applicable.

Conflicts of Interest

The authors declare no conflict of interest.

References

  1. Tang, Z.L.; Liu, J.J. Similarities and differences between American Reindustrialization and made in China 2025. Prod. Res. 2017, 2, 76–85. [Google Scholar]
  2. Zhong, R.Y.; Xu, X.; Klotz, E.; Newman, S.T. Review of Intelligent Manufacturing in the context of industry 4.0. Engineering 2017, 3, 616–630. [Google Scholar] [CrossRef]
  3. China Intelligent Manufacturing System Solution Market Research Report (2018 Edition).China Intelligent Manufacturing System Solution Supplier Alliance. Available online: http://www.3mbang.com/hybg.html (accessed on 28 February 2019).
  4. Bo, V.; Verma, R.; Plaschka, G. Understanding trade-offs in the supplier selection process: The role of flexibility, delivery, and value-added services/support. Int. J. Prod. Econ. 2009, 120, 30–41. [Google Scholar]
  5. Prahinski, C.; Benton, W.C. Supplier evaluations: Communication strategies to improve supplier performance. J. Oper. Manag. 2004, 22, 39–62. [Google Scholar] [CrossRef]
  6. Kara, M.E.; Firat, S.U. Supplier Risk Assessment Based on Best-Worst Method and K-Means Clustering: A Case Study. Sustainability 2018, 10, 1066. [Google Scholar] [CrossRef] [Green Version]
  7. Pitchipoo, P.; Venkumar, P.; Rajakarunakaran, S. A distinct decision model for the evaluation and selection of a supplier for a chemical processing industry. Int. J. Prod. Res. 2012, 50, 4635–4648. [Google Scholar] [CrossRef]
  8. Broy, M.; Kruger, I.H.; Pretschner, A.; Salzmann, C. Engineering Automotive Software. Proc. IEEE 2007, 95, 356–373. [Google Scholar] [CrossRef]
  9. Aduamoah, M. Riding the waves of technology: A study into how SMEs select computerized accounting software (CAS) supplier in developing countries. Arch. Bus. Res. 2017, 5, 19–20. [Google Scholar] [CrossRef] [Green Version]
  10. Fabbrini, F.; Fusani, M.; Lami, G.; Sivera, E.; Sivera, E. A SPICE-based software supplier qualification mechanism in automotive industry. Softw. Process Improv. Pract. 2007, 12, 523–528. [Google Scholar] [CrossRef]
  11. Khan, S.U.; Niazi, M.; Ahmad, R. Barriers in the selection of offshore software development outsourcing vendors: An exploratory study using a systematic literature review. Inf. Softw. Technol. 2011, 53, 693–706. [Google Scholar] [CrossRef]
  12. Lehmann, S.; Buxmann, P. Pricing strategies of software vendors. Bus. Inf. Syst. Eng. 2009, 1, 452–462. [Google Scholar] [CrossRef]
  13. Ajami, S.; Rajabzadeh, A.; Ketabi, S. A Review on influencing criteria for selecting supplier of information technology services in the hospital. Int. J. Health Promot. Educ. 2014, 3, 108. [Google Scholar] [CrossRef] [PubMed]
  14. Huang, Y.J.; Liu, Y.G.; Liu, E.L.; Kang, F. A Study of the Evaluation of the BIM Software Supplier Selection Based on FAHP. Math. Pract. Theory 2018, 48, 51–58. [Google Scholar]
  15. Zhao, H. Evaluation Method of Embedded Software Vendor Based on VDA6.3 Evaluation Architecture. Auto Electr. Parts 2019, 56–59. [Google Scholar]
  16. Chin, W.W.; Brown, P. Structural Equation Modeling || Structural Equation Modeling in Marketing: Some Practical Reminders. J. Mark. Theory Pract. 2008, 16, 287–298. [Google Scholar] [CrossRef]
  17. Wynne, C.W. Issues and Opinion on Structural Equation Modeling. Manag. Inf. Syst. Q. 1998, 22, 19–24. [Google Scholar]
  18. Chin, W.W.; Marcoulides, G. The Partial Least Squares Approach to Structural Equation Modeling. Adv. Hosp. Leis. 1998, 295, 295–336. [Google Scholar]
  19. Hair, J.F.; Risher, J.J.; Sarstedt, M.; Ringle, C.M. When to use and how to report the results of PLS-SEM. Eur. Bus. Rev. 2019, 31, 2–24. [Google Scholar] [CrossRef]
  20. Wetzels, M.; Odekerken-Schroder, G.; Van Oppen, C. Using PLS path modeling for assessing hierarchial construct models: Guidelines and impirical illustration. Manag. Inf. Syst. Q. 2009, 33, 177–195. [Google Scholar] [CrossRef]
  21. Henseler, J.; Ringle, C.M.; Sinkovics, R.R. The Use of Partial Least Squares Path Modeling in Internationfal Marketing. Adv. Int. Mark. 2009. [Google Scholar] [CrossRef] [Green Version]
  22. Hair, J.F.; Sarstedt, M.; Ringle, C.M.; Mena, J.A. An Assessment of the Use of Partial Least Squares Structural Equation Modeling in Marketing Research. J. Acad. Mark. Sci. 2012, 40, 414–433. [Google Scholar] [CrossRef]
  23. Li, D.X.; Wei, X.G. An evaluation of comprehensive development level and provincial differences of postgraduate education—Based on PLS structural equation mode. J. Liaoning Norm. Univ. 2018, 3, 83–91. [Google Scholar]
  24. Hair, J.F., Jr.; Howard, M.C.; Nitzl, C. Assessing measurement model quality in PLS-SEM using confirmatory composite analysis. J. Bus. Res. 2020, 109, 101–110. [Google Scholar] [CrossRef]
  25. Hair, J.F.; Hult, G.T.M.; Ringle, C.M.; Sarstedt, M. A Primer on Partial Least Squares Structural Equation Modeling (PLS-SEM); Sage: Thousand Oaks, CA, USA, 2013. [Google Scholar]
  26. Ministry of Industry and Information Technology. Notice of the Ministry of Industry and Information Technology and the Ministry of Finance on Printing and Distributing the Intelligent Manufacturing Development Plan (2016–2020). Available online: https://www.miit.gov.cn/jgsj/zbes/gzdt/art/2020/art_b0e0e9e759b84c97b04034f1d2ebbd1f.html (accessed on 8 December 2016).
  27. Ministry of Industry and Information Technology. Intelligent Manufacturing System Solution Supplier Specification Conditions. Available online: https://www.miit.gov.cn/jgsj/zbes/gzdt/art/2020/art_77c356960dda48c59827b47bdb884209.html (accessed on 19 July 2018).
Figure 1. IMSS suppliers risk evaluation model index diagram.
Applsci 12 03998 g001
Figure 2. IMSS suppliers risk assessment model.
Applsci 12 03998 g002
Figure 3. Inspection flow chart.
Applsci 12 03998 g003
Figure 4. Factor load diagram of IMSS suppliers risk assessment model.
Applsci 12 03998 g004
Figure 5. Visualization of index test results.
Applsci 12 03998 g005
Figure 6. Tree view of index path coefficient.
Applsci 12 03998 g006
Table 1. IMSS suppliers risk assessment model factor load.
Primary IndexSecondary IndexFactor Load
1. Supplier qualification (SQ)v1.1 Quality management system0.780
v1.2 Environmental management system0.822
v1.3 Information security management system0.765
v1.4 National and industrial standards0.814
v1.5 Good public image0.813
2. Supplier system (SS)v2.1 Document management system0.812
v2.2 After sales service management system0.840
v2.3 After sales service management system0.904
3. Supplier core technology (SCT)v3.1 Number of patents0.901
v3.2 Number of relevant software copyrights0.919
v3.3 Technical equipment level0.842
4. Supplier service capability (SSC)v4.1 Consulting planning capability0.808
v4.2 Personalized customization ability0.899
v4.3 System integration and secondary development capability0.829
v4.4 System implementation capability0.817
v4.5 Platform construction and promotion capacity implementation capability0.745
5. Supplier project (SP)v5.1 Number of docking projects0.664
v5.2 Project investment amount0.802
v5.3 Number of docking projects0.887
v5.4 Project success rate0.808
6. Supplier information system solutions (SISS)v6.1 System standardization degree0.838
v6.2 Degree of system customization0.795
v6.3 System safety degree0.826
Table 2. Reliability and validity test.
Cronbach’s Alpharho_ACRAVE
SS0.8120.8220.8890.728
SSC0.8780.8800.9120.674
SCT0.8650.8680.9180.789
SISS0.7560.7570.8600.672
SQ0.8580.8600.8980.638
SP0.8010.8140.8710.631
EV-IMSS suppliers0.9580.9600.9620.525
Table 3. Q2 value of IMSS suppliers risk evaluation model.
SSOSSEQ² (=1 − SSE/SSO)
SS270.000148.9200.448
SSC450.000223.2570.504
SCT270.000120.5970.553
SISS270.000178.6880.338
SQ450.000247.5560.450
SP360.000218.0990.394
EV-IMSS suppliers2070.0001081.1650.478
Table 4. Index discrimination validity of IMSS suppliers risk evaluation model.
SSSSCSCTSISSSQSP
SS0.853
SSC0.7840.821
SCT0.6780.7370.888
SISS0.6760.7850.6620.820
SQ0.7930.7260.7190.6640.799
SP0.6790.7810.6840.7530.6270.794
Table 5. Bootstrapping test of IMSS suppliers risk evaluation model.
Path Coefficient2.5%97.5%T Statisticp
SS->EV-IMSS suppliers0.1580.1420.17617.5280.000
SSC->EV-IMSS suppliers0.2580.2240.28914.5460.000
SCT->EV-IMSS suppliers0.1640.1450.18715.6640.000
SISS->EV-IMSS suppliers0.1450.1310.16018.0610.000
SQ->EV-IMSS suppliers0.2300.2000.25715.7180.000
SP->EV-IMSS suppliers0.1810.1640.20218.8620.000
Publisher’s Note: MDPI stays neutral with regard to jurisdictional claims in published maps and institutional affiliations.

