Article

Optical Response of Expired EBT3 Film for Absorbed Dose Measurement in X-ray and Electron Beam Range

by
Maisarah Musa
1,
Hamad Yahia Abu Mhanna
1,*,
Ahmad Fairuz Omar
1,*,
Yasmin Md Radzi
1,
Hanan Fawaz Akhdar
2,*,
Nor Hafizah Ishak
3 and
Haytham Al Ewaidat
4
1
School of Physics, Universiti Sains Malaysia, Penang 11800, Malaysia
2
Department of Physics, Faculty of Science, Imam Mohammad Ibn Saud Islamic University (IMSIU), Riyadh 13318, Saudi Arabia
3
Advanced Medical and Dental Institute (AMDI), Universiti Sains Malaysia (USM), Penang 11800, Malaysia
4
Department of Allied Medical Sciences-Radiologic Technology, Faculty of Applied Medical Sciences, Jordan University of Science and Technology, Irbid 22110, Jordan
*
Authors to whom correspondence should be addressed.
Appl. Sci. 2022, 12(8), 3974; https://doi.org/10.3390/app12083974
Submission received: 24 February 2022 / Revised: 7 April 2022 / Accepted: 12 April 2022 / Published: 14 April 2022

Abstract

:
The purpose of this study was to investigate the optical response of an expired External Beam Therapy (EBT3) film, which expired in 2018, using X-rays and electron beam doses. The film’s optical responses were evaluated for its usability in measuring different radiation sources, energy, and absorbed doses ranging up to 5 Gy. Pieces of the expired EBT3 film were irradiated with 90 kVp, 6 MV X-ray photons, and 6 MeV electron beam. The analysis was performed using the Jaz visible spectrometer and EPSON Perfection V370 Photo scanner to obtain the absorbance and the net relative optical density (ROD) of the film samples respectively. The results showed that spectroscopic measurements of the exposed expired EBT3 films under these radiation sources were able to produce primary secondary peaks at λ = 633.52 nm and λ = 582.3 nm respectively. The best wavelength subsets that presented the best MLR regression fitting for all experiments were 541.48 nm, 561.11 nm, and 600.28 nm. While, for the 6 MV photon and the 6 MeV electron beam they were 600.28 nm, 650.79 nm and 654.10 nm. In case of the irradiation with the 6 MV photon and the 6 MeV electron beam, expired EBT3 film showed no significant differences, which made it suitable for dosimetry in various sources of radiation. The individual calibration of radiation dose produces very high measurement accuracy with coefficient of determination, R2 above 0.99 and root mean square of error, RMSE of 0.038 Gy, 0.113 Gy, and 0.115 Gy for films irradiated with 90 kVp X-rays, 6 MV photon beam, and 6 MeV electron beam respectively. Hence, from the results, the expired EBT3 film used in this study showed promising usability of expired EBT3 films beyond their prescribed expiry dates.

1. Introduction

The Gafchromic EBT (External Beam Therapy) film model is the outcome of radiochromic film development [1], originally created to replace silver halide radiographic film in quality assurance (QA) processes for intensity modulated radiotherapy (IMRT) [2]. EBT films are commonly used for dosimetry in medical radiation physics, especially for quality assurance in IMRT and experimental standard of dose computation algorithms [3,4,5]. EBT3 films have sensitive layers with compositions and thicknesses similar to those of previous films but small silicon particles were integrated in the polyester layers to prevent the formation of Newton’s rings [6]. Furthermore, the symmetrical design of EBT3 eliminates side-orientation dependence [7,8]. EBT3 film irradiations are seen as straightforward and rapid techniques for dose profiling in a variety of irradiation scenarios. However, some characteristics should be addressed for more accurate findings, taking into consideration the sensitivity of such films to many factors, such as the radiation types and energies [9]. These films may be utilized not only to evaluate transverse beam profiles, but also to assess longitudinal (depth) dose distributions in both water and plastic phantoms [10,11]. Accurate and correct descriptions of therapeutic beams need thorough examinations of the films’ features, particularly those that are reliant on the films’ reactions to the beams qualities (electron and photon beams), dose rates, and dosage values [12].
EBT3 films are designed for the measurements of absorbed doses of ionizing radiation. They are particularly suited for high-energy photons. The responses of EBT3 films have been shown to be batch-dependent, but energy-independent for large-voltage photon beams, including filter-free (FFF) and electron beams [13,14,15]. After the exposure of the EBT3 films to radiation sources, the films colors will gradually change from light green to darker colors under incremental exposures by ionizing radiation. Therefore, the color change can be one of the dosimetric characteristics for ionizing radiation studies [16,17]. The purpose of this study was to look at the effectiveness of expired EBT3 films as well as the optical reactions of expired EBT3 films using visible spectroscopy analysis, and net reflective optical density (Net ROD); dose calculation algorithms can be invented as precise and accurate film-based dosimetry, and to check if they show any properties in response to a different source of radiation and energy value. Using visible spectroscopy analysis, dose calculation algorithms can be invented as precise and accurate film-based dosimetry. Therefore, the high-accuracy spectroscopy-based algorithms computed in measuring the color changes of expired EBT3 films in relation to the absorbed radiation dose may lead to the development of a single film-based dosimeter that can be calibrated for various types of ionizing radiation measurements. Optical responses using visible spectroscopy and net reflective optical density analysis performed on the films can be the methods and factors that are described for dosimetric characteristics for ionizing radiation. Expired EBT3 films can be developed as dosimetric characteristics for X-rays and electron beams through the color changes of the films using visible spectroscopy analysis and net ROD calculations for the dose calibration curve in radiotherapy protocols.

2. Materials and Methods

Expired Gafchromic™ EBT3 film from the manufacturer of Ashland was cut with dimensions of 2 cm × 2 cm. In this research, three types of dosimetry were used to measure the absorbed radiation dose to the film samples. For radiography X-rays, a PTW semiconductor radiation detector Type 60004 connected with the PTW DIADOS electrometer was used for 90 kVp X-rays to measure the intended absorbed dose in the School of Physics, Universiti Sains Malaysia (USM). A plane-parallel 0.02 cc Advanced Markus ionization chamber and cylindrical 0.6 cc Farmer Type ionization chamber were used for high energy X-rays and electron beams, respectively, connected with PTW UNIDOS E electrometer to measure the radiation dose.

2.1. Radiography X-rays Experiment Procedure

The X-ray machine was warmed up at 90 kVP, 100 mAs, with 10 cm × 10 cm field size and 40 cm SSD set up. Then, the PTW semiconductor radiation detector was placed side-by-side with one piece of the expired EBT3 film sample at the center of the field size. The irradiation process was performed on the film sample until the desired accumulative absorbed radiation dose with a range of (0.5 Gy–4.0 Gy) was achieved. After the completion of the process, the film sample was put inside a black envelope to avoid any contamination from ambient light. Next, the steps were repeated to four other film samples. The selected accumulative absorbed doses measured from the electrometer were 0.62 Gy, 1.12 Gy, 2.39 Gy, 2.90, and 3.72 Gy respectively.

2.2. High Energy LINAC Procedure

The solid water phantom and the ionization chamber was set up on the bed of the linear accelerator (LINAC) machine. Then, the machine was set with 6 MV photon energy set and a varied prescribed dose ranging from 100 MU to 500 MU. Next, using the same energy and potential difference in electrometer of IC, experiments were started by setting the prescribed doses of 100 MU, 200 MU, 300 MU, 400 MU, and 500 MU in five different irradiation processes respectively to acquire the absorbed radiation doses. Afterwards, the irradiation processes on the expired EBT3 films were performed where film samples were placed at their depth in a solid water phantom, which provides the maximum dose, d m a x . IC was removed from the solid water phantom and one piece of the film sample was placed at the exact position of the IC, which is inside the prepared hole within the water phantom. Post-irradiated films were put inside black envelopes to avoid contamination from ambient light. Next, the irradiation processes were performed by replacing new film samples and repeating the previous steps. For electron beam experiment, the same solid water phantom and ionization chamber was set up on bed of LINAC machine and an electron applicator was installed on the collimator. Then, the machine was warmed up using the prescribed dose of 200 MU, energy 6 MeV set in the system, and a potential difference of 300 V in the electrometer of IC. Next, the steps were repeated as for the X-ray experiment above.
After all the expired EBT3 film pieces had been irradiated to different radiation sources, absorbance measurements of every exposed expired EBT3 film were performed using an Ocean Optics Jaz spectrometer. The spectrometer covers the wavelengths from 200 to 1100 nm. The light source used in the spectroscopy setup was a tungsten halogen lamp (HL-2000) with spectral emission between 360 and 2500 nm and a color temperature of 2960 K. The Jaz spectrometer was connected to a tungsten halogen lamp via cuvette holder and attenuator by optical fiber. The expired EBT3 film was placed in the cuvette holder. The function of the attenuator is to reduce or increase the intensity of light from the halogen lamp in the unit counts. Before beginning with the measurements, the spectrometer was turned on, and the lamps were allowed to warm up for appropriate periods of time to be stabilized. The output was shown on a monitor screen using the SpectraSuite software. The system was calibrated using an unexposed film. An unexposed film sample was placed in the cuvette holder to be used as a reference and for calibration purposes, and then the important configurations were set. The integration time, scan to average, and boxcar width were set to 3 ms, 30, and 1 respectively. After setting the important configurations, a card was slit into tungsten halogen lamp to prevent light from passing through and directly eliminating the dark current in the software. The card was taken out from tungsten halogen lamp to let the light pass through again. The absorbance with the letter ‘A’ was selected in the software and the output showed 0 absorbance corresponding to the unexposed film. After the calibration process, the absorbance measurement of each exposed film sample was performed and saved. The best wavelength was observed based on the highest peak absorption spectrum.
Finally, fifteen exposed and one unexposed film sample were scanned together using an Epson scanner (manufacturer). The configuration for scan was set to 600 dpi for optical resolution and an image color of 48 bits. The scanned image was saved in TIFF format. The image scanned was analyzed using ImageJ software. Red channel filtering was selected. Measurement of the mean gray value for one piece of the film sample was set by taking into account their values of standard deviation of mean gray value. The result was recorded.

3. Results

Visible spectroscopic measurements of the exposed expired EBT3 films and measurements of net reflective optical density (ROD) of exposed expired EBT3 films were performed.

3.1. Measurement Absorbed Dose

Table 1 and Table 2 show the accumulated absorbed dose that was set and measured from the PTW semiconductor detector and ionization chamber for radiography X-rays and high-energy photon and electron beams respectively. After irradiation processes on the expired EBT3 films had been performed, the film samples were placed in a solid water phantom at depths which provided the maximum dose, d m a x .

3.2. Radiation Exposure Effect on Expired EBT3 Films

Figure 1 shows that the color changes of the exposed expired EBT3 films occurred corresponding to the level of the absorbed dose.
The dark blue color is caused by the properties of the monomer, which changes to blue when exposed to radiation during polymerization [18]. As the dosage of radiation rises, the concentration of polyPCDA in the film increases; as a result, the film absorbs more light and darkens. This is due to the radiation-induced polymerization of a lithium salt of pentacosa-10,12-diynoic acid (LiPCDA), which comprises of monomers organized in tiny crystals dispersed throughout the EBT3 film’s active layer [19,20,21].

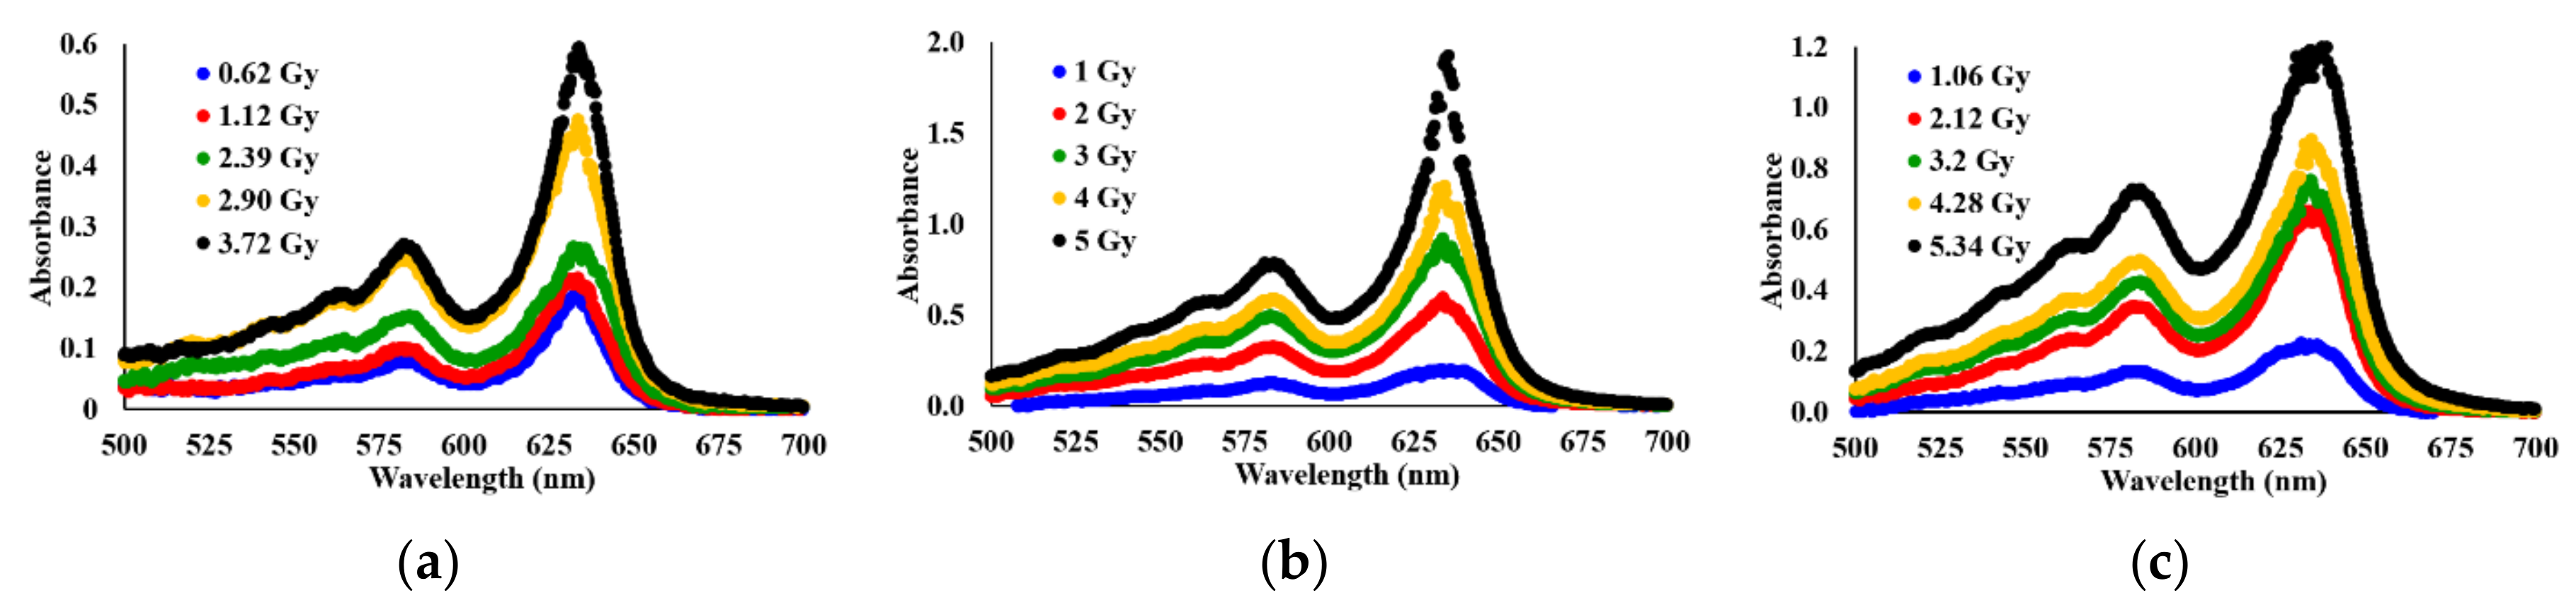
3.3. Visible Spectroscopy Analysis of Expired EBT3 Gafchromic Film

3.3.1. Spectrum of Absorbency of Expired EBT3 Film

As mentioned previously, higher doses of radiation will result in a decrease in optical transparencies or optical absorptions. Figure 2 shows the net visible light absorption spectrum in the region between 500 and 720 nm for the exposed expired EBT3 films post-irradiation of all three radiation sources. The highest absorption value (primary) centered around 633.52 nm, while the lower (secondary) centered around 582.3 nm. The peaks obtained are similar to the observation by Aydarous et al., where they located their EBT3 absorbance peaks at (582 ± 2) and (633 ± 2) nm [22]. According to León-Marroquín EY et al. [13], the net absorbance spectra showed two absorption bands centered around 634–636 nm (primary) and 583–585 nm (secondary) for clinical photon and electron beams with dose range of 1–50 Gy and they observed the highest absorbance peak at 636 nm and a less intense peak at around 585 nm. Therefore, from this study, the primary and the secondary peaks were slightly differing from previous studies with percentage differences of 0.39% and 0.46% respectively.
From the obtained results, different sources of radiation and energies showed the primary peak band at λ = 633.52 nm. All primary absorption bands were located around 633.52 nm wavelength at every absorbed dose. As the absorbed doses increased, the values of the absorbance peak increased as well. For the 90-kVp X-rays experiment, the spectra indicated 0.594 as the highest absorbance value at absorbed dose of 3.72 Gy. For the 6-MV photon beam experiment, the absorbed dose of 5 Gy showed 2.002 as the highest absorbance value. For the 6-MeV electron beam experiment, the spectra indicated 1.187 as the highest absorbance value at absorbed dose of 5 Gy. Therefore, expired EBT3 films showed the highest sensitivity for the 6-MV photon beam compared with the other irradiation sources.
According to León-Marroquín et al. [13], no significant change was observed in the absorption spectra of the EBT3 film from the same batch irradiated with the same amount of dose using different beam qualities and type. Additionally, no spectral change with dose rate was observed. The measured net absorbance per Gy was independent of beam quality in the 1–50 Gy dose range. The spectral shape absorption of the expired EBT3 radiochromic films irradiated with photons and electron beams is beam type (photon/electron) and dose rate independent. However, it varies with the dose level, the batch of the film sample, and the spectroscopy system used. From the results obtained, one can show that the beam quality and dose rate, due to all primary absorption bands located around λ = 633.52 nm, had a quite different value of absorbance at every absorbed dose for 90 kVp X-rays, 6 MV photon, and 6 MeV electron beams. With different setups and different radiation detectors used, the discrepancy of measured absorbed doses will probably be affected. The changes in the spectral response of irradiated films from different energies and types of radiation could be associated with the slight changes in the active layers of the films during the fabrication processes. These differences suggest that a per-batch film response characterization may still be required in order to achieve an accurate measure of the film response due to the dose-dependent behavior of the spectral response of the films for energy and type of radiation as shown in this study.

3.3.2. Linear Regression Analysis

The highest R2 (coefficient of determination, or the coefficient of multiple determination for multiple regression) indicates that the data are closer to the fitted regression line. As the value of R2 approaches a value of 1 or percentage of 100%, the closer the data are to the fitted regression line or the accuracy of the reading. The line slope indicates the response of expired EBT3 color toward radiation exposure. The higher slope indicates higher responsivity. This responsivity varies from one wavelength to the other depending on the transition range of expired EBT3 colors. The limits of detection (LOD) and quantitation (LOQ) were obtained by applying the following equations: LOD = 3.3 s/S, and LOQ = 10 s/S where “s” is the mean of standard deviation of intercept and “S” is the mean of the slope of the calibration curve.
As shown in Figure 3, from linear regression analysis of the results obtained, at λ = 582.98 nm, expired EBT3 film showed higher responsivity for 6 MV X-rays with value of slope m = 0.1568 and showed the best-fitted regression line with the highest value for R2 compared with the others, which obtained 98.9%; 90 kVp X-rays showed the lowest responsivity, with the value of slope m = 0.0649 and the lowest fitted regression line, which was R2 = 93.7%. The (LOD) and (LOQ) were derived using the earlier-stated equations, where 90 kVp generated 1.763 for (LOD) and 5.342 for (LOQ), 6 MV generated 6.589 for (LOD) and 19.968 for (LOQ), and lastly 6 MEV generated 4.495 for (LOD) and 13.621 for (LOQ).
In contrast, in the results obtained in the basic peak range at λ = 633.52 nm, expired EBT3 film showed higher responsivity for the 6-MV photon beam with a gradient m = 0.4206 and showed the best fitted regression line with the highest value for R2 (95.5%) as compared with the others; 90 kVp X-rays showed the lowest responsivity with gradient m = 0.1302 and the lowest fitted regression line, which was 86.5%. Using equations to derive (LOD) and quantitative (LOQ), 90 kVp achieved 2.522 for (LOD) and 7.644 for (LOQ), 6 MV achieved 0.452 for (LOD) and 1.369 for (LOQ), and finally 6 MEV achieved 1.207 for (LOD) and 3.657 for (LOQ).
Therefore, the expired EBT3 films showed the highest responsivity for 6-MV X-rays compared with the other experiment. On the other side, at λ = 582.98 nm, all experiments showed higher accuracy than at λ = 633.52 nm as they obtained higher values of R2.

3.3.3. Multiple Linear Regression (MLR) Analysis

Multiple linear regression (MLR) analysis was performed to determine the correlation between two or more predicted variables with one response variable and to make predictions for the response using the relation. The multiple linear analysis was performed by selected wavelengths in the range from 520 nm to 700 nm. This range showed highly correlated color changes of the expired EBT3 films, which indirectly indicate radiation-absorbed dose. The best selected wavelength subset is which has the lowest value of Root Mean Square error (RMSE) and the highest coefficient of determination, R2. Table 3 presents the best wavelength subsets using Minitab software version 19.
From Table 3, the best wavelength subsets that presented the best MLR regression fitting for 90 kVp X-rays were 632.52 nm, 641.84 nm, and 678.11 nm where RMSE = 0.004 Gy and R2 = 99.99% and were used to develop an algorithm as per Equation (1). Aλ is the absorbance, A at wavelength, λ.
90-kVp X-ray absorbed dose (Gy) = −0.06626−12.5940 (A632.52) + 30.584 (A641.84)−55.44 (A678.11)
For the 6-MV photon beam, the best wavelength subsets that presented the best MLR regression fitting were 600.28 nm, 624.50 nm, and 640.18 nm where RMSE = 0.021 Gy and R2 = 99.99% and were used to develop an algorithm as per Equation (2).
6-MV X-ray absorbed dose (Gy) = −0.9849−74.27 (A600.28) + 37.10 (A624.50) + 2.024 (A640.18)
The best wavelength subsets that presented the best MLR regression fitting for the 6-MeV electron beam were 650.79 nm, 654.10 nm, 660.37 nm where RMSE = 0.040 Gy and R2 = 99.99% and were used to develop an algorithm as per Equation (3).
6-MeV electron beam absorbed dose (Gy) = −0.799−94.35 (A650.79) + 300.4 (A654.10)−274.3 (A660.37)
To obtain the best set of wavelengths for this expired EBT3 film towards all radiation sources that provide high accuracy, all experimental data were combined and MLR was performed. The entire set of wavelengths is shown in Table 4 below.
From Table 4, the best wavelength subsets that presented the best MLR regression fitting for the 90-kVp X-rays, 6-MV photon beam, and 6-MeV electron beam were 541.48 nm, 561.11 nm, and 600.28 nm where RMSE = 0.596 Gy and R2 = 87.42% and were used to develop an algorithm as per Equation (4).
Radiation-absorbed dose (Gy) = 0.544 + 43.0 (A541.48 nm)−7.70 (A561.11 nm)−16.80 (A600.28 nm)
From Table 5, the best wavelength subsets that presented the best MLR regression fitting for the 6-MV photon beam and 6-MeV electron beam were 600.28 nm, 650.79 nm, 654.10 nm where RMSE = 0.354 Gy and R2 = 96.52% and were used to develop an algorithm as per Equation (5).
Radiation-absorbed dose (Gy) = 1.033 + 635(A600.28 nm)−49.0(A650.79 nm) + 78.5(A654.10 nm).

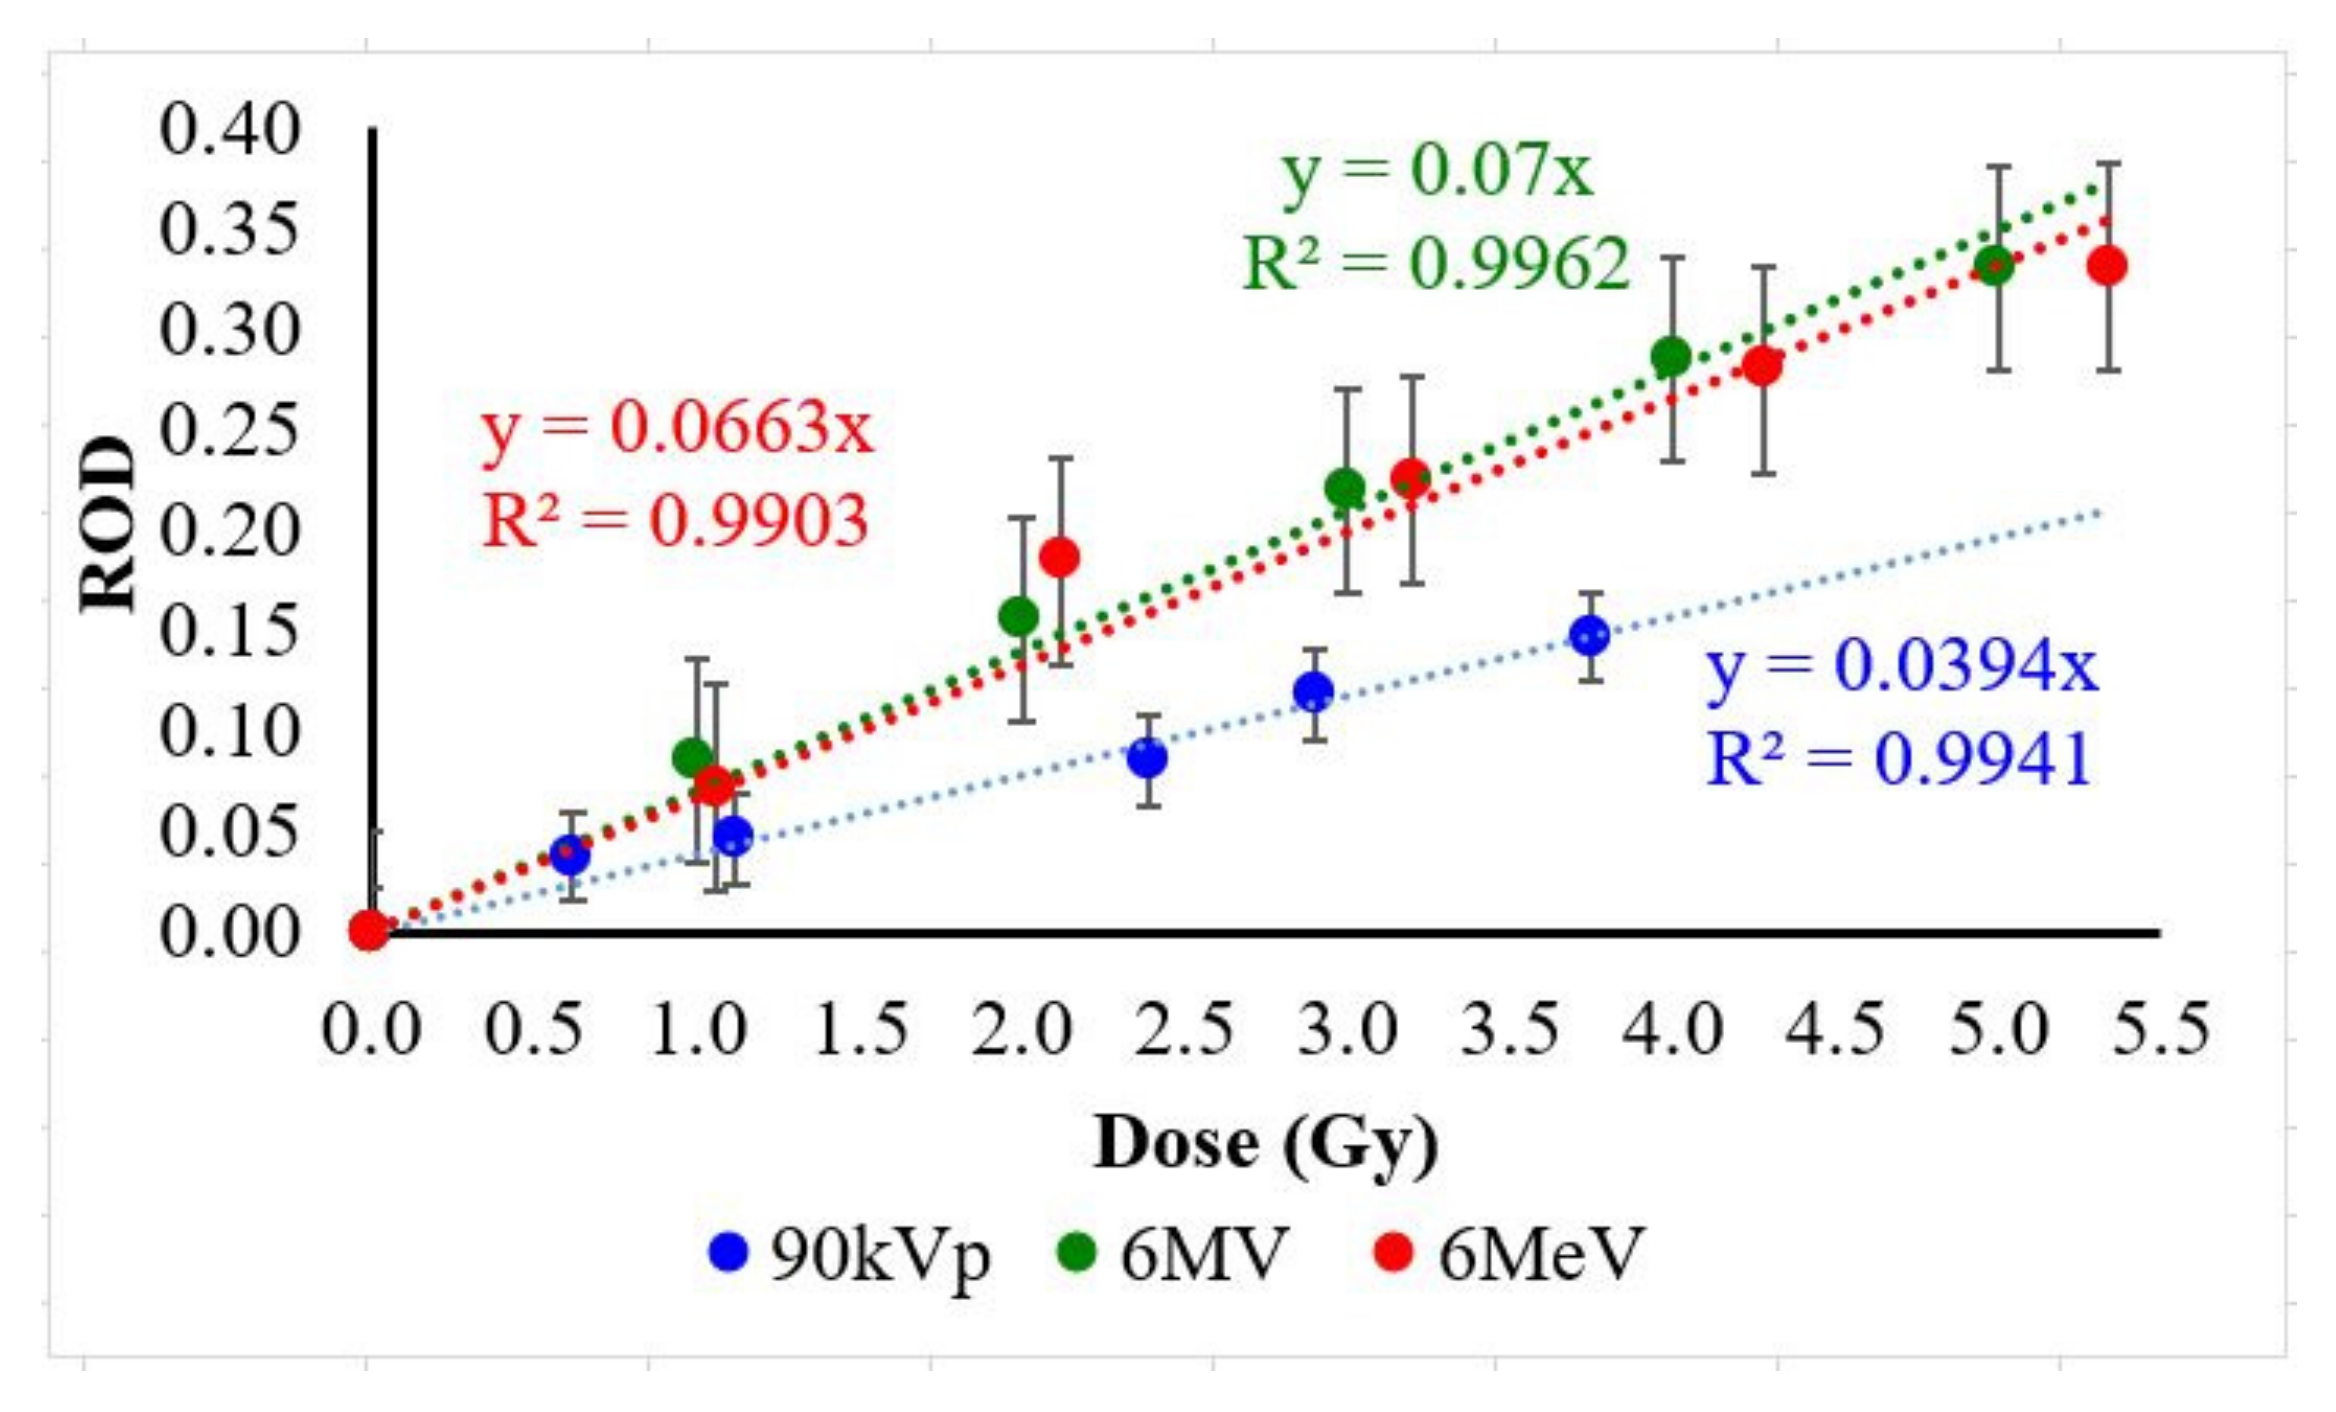
3.4. Net ROD Measurement

For this analysis method, all films samples were analyzed using ImageJ software to measure the mean gray value for every film sample after being scanned by the EPSON Perfection V370 Photo scanner. Next, net ROD were calculated using Equation (6) and the results are presented in Table 6.
Net ROD = log (Pu/Pt)
where Pu denotes the pixel value of the reflected intensity via an unexposed film at the orientation in which the maximum pixel value is obtained, and Pt denotes the pixel value of the reflected intensity at any other film orientation or irradiation level [23,24].
From the analysis using ImageJ software, the mean gray value using red channel filtering was measured for each expired EBT3 film and the net ROD was calculated using Equation (6). The results were recorded and are shown below. Table 6 represents the net ROD value for every absorbed dose of three different sources of radiation. Figure 4 illustrates the pattern of the obtained results of the respective ROD.
In terms of energy dependency, expired Gafchromic EBT3 film appeared to show the highest value for net ROD for high energy radiation. For instance, at absorbed dose of 1 Gy, the 6-MeV electron beam showed the highest value net ROD, which was 0.086, compared with radiography X-rays (90 kVp) obtained from linear analysis from Figure 4, which had a net ROD value of 0.043. The percentage difference of net ROD between these energies for the absorbed dose of 1–5 Gy was around 52% to 67%, which is very high as shown in Table 7. According to Chiu-Tsao et al. [25], the film’s response is weakly dependent on the energy of high-energy photon beams generally used in radiotherapy, regardless of color channel. Besides that, in another study from Casanova Borca et al. [26], the differences between films were negligible with values less than 1% for doses up to 4 Gy. Therefore, with the high value of percentage difference obtained from this experiment, the expired EBT3 film response appeared to be nearly dependent on radiation energy used and against previous results from the literature. This probably happened due to the different experimental set up and the type of radiation detector used. The discrepancies on the absorbed dose measurement might affect the analysis of net ROD on the sample for 90-kVp X-ray as shown in Figure 5.
Figure 5 shows a comparison of net ROD for electron and photon irradiations. The obtained results showed close results for both radiation types and for the same doses. A previous study by Farah N et al. [8] showed that discrepancies remain less than 0.07% for doses below 350 cGy and increase slightly up to 0.1% for doses around 500 cGy. However, from this study, the percentage difference of net ROD between the 6-MV photon beam and 6-MeV electron beam at 1 Gy, 2 Gy, 3 Gy, and 4 Gy obtained values of 8.5%, 10.2%, 8.1%, and 7.3% respectively as shown in Table 7. At 5 Gy absorbed dose, the percentage difference of net ROD was the lowest, which is 1.0%, and showed no significant difference. The low combined percentage difference observed for the type of radiation dependence makes expired EBT3 suitable for dosimetry in various sources of radiation. These findings are in agreement with previous results from the literature where the expired EBT3 film was used for IMRT energy range, e.g., 6 to 15 MV and the dependence on the particle type was also reported to be non-significant. Furthermore, the expired EBT3 film was utilized as a 2D dose map distribution verification in radiotherapy based on isodose lines. As a result, expired EBT3 film is a good 2D dosimeter for detecting electron or combined photon/electron dose distributions in a water phantom, and the expired EBT3 film may be used as a point dose measurement in addition to 2D verification.

4. Conclusions

Expired EBT3 films are suitable for use as dose-control methods in clinical fields for different radiation types, energies, and absorbed doses as they have shown high sensitivity and responsivity on visible spectroscopy analysis. The analyses in reflective modes are reliable as the characteristic of dosimetry and can be part of the dosimetry protocol during dose calibration procedures and quality assurances (QA) for radiography and radiotherapy machines. The comparison of interactions of photons and electron beams on expired EBT3 films were seen. Therefore, expired EBT3 films can be concluded to be suitable 2D dosimeters for measuring electron or mixed photon/electron dose distributions in water phantoms, and expired EBT3 films may still be used as point dose measurements in addition to 2D verifications. Throughout the experiment, the films provided adequate relative absorbed dose measurements for clinical radiotherapy assessments in the 1–5 Gy dose range which; further investigations may be useful for fractionated radiotherapy dose assessments. Therefore, this study can be used to implement the development of dosimetric characteristics for X-rays and electron beams through the color changes of the expired EBT3 films using visible spectroscopy analysis and net ROD calculations for the measurement of absorbed doses and dose calibration protocols in radiotherapy treatments. On the other hand, these precise and accurate film-based dosimetry methods can be one of the most time-consuming methods.

Author Contributions

Conceptualization, M.M., H.Y.A.M. and A.F.O.; Formal analysis, M.M., H.Y.A.M., A.F.O.; Funding acquisition, H.F.A.; Investigation, H.Y.A.M., A.F.O. and Y.M.R.; Methodology, H.Y.A.M., A.F.O., Y.M.R. and N.H.I.; Supervision, A.F.O.; Writing–Original draft, H.Y.A.M.; Writing–Review & editing; A.F.O., Y.M.R., H.F.A. and H.A.E. All authors have read and agreed to the published version of the manuscript.

Funding

Self Sponsor.

Institutional Review Board Statement

Not applicable.

Informed Consent Statement

Not applicable.

Data Availability Statement

Not applicable.

Conflicts of Interest

The authors declare no conflict of interest.

References

  1. Sankar, A.; Ayyangar, K.M.; Nehru, R.M.; Kurup, P.G.; Murali, V.; Enke, C.A.; Velmurugan, J. Comparison of Kodak EDR2 and Gafchromic EBT film for intensity-modulated radiation therapy dose distribution verification. Med. Dosim. 2006, 31, 273–282. [Google Scholar] [CrossRef] [PubMed]
  2. Devic, S.; Seuntjens, J.; Sham, E.; Podgorsak, E.B.; Schmidtlein, C.R.; Kirov, A.S.; Soares, C.G. Precise radiochromic film dosimetry using a flat-bed document scanner. Med. Phys. 2005, 32, 2245–2253. [Google Scholar] [CrossRef] [PubMed]
  3. Fotina, I.; Winkler, P.; Künzler, T.; Reiterer, J.; Simmat, I.; Georg, D. Advanced kernel methods vs. Monte Carlo-based dose calculation for high energy photon beams. Radiother. Oncol. 2009, 93, 645–653. [Google Scholar] [CrossRef] [PubMed]
  4. Polednik, M.; Wolff, D.; Steil, V.; Delana, A.; Wenz, F.; Menegotti, L.; Trento, F.S. Optimization of the Gafchromic TM EBT protocol for IMRT QA. Z. Med. Phys. 2009, 19, 29–37. [Google Scholar]
  5. Fiandra, C.; Ricardi, U.; Ragona, R.; Anglesio, S.M.; Giglioli, F.R.; Calamia, E.; Lucio, F. Clinical use of EBT model Gafchromic™ film in radiotherapy. Med. Phys. 2006, 33, 4314–4319. [Google Scholar] [CrossRef] [PubMed]
  6. Darafsheh, A.; Hao, Y.; Maraghechi, B.; Cammin, J.; Reynoso, F.J.; Khan, R. Influence of 0.35 T magnetic field on the response of EBT3 and EBT-XD radiochromic films. Med. Phys. 2020, 47, 4543–4552. [Google Scholar] [CrossRef]
  7. Dreindl, R.; Georg, D.; Stock, M. Radiochromic film dosimetry: Considerations on precision and accuracy for EBT2 and EBT3 type films. Z. Med. Phys. 2014, 24, 153–163. [Google Scholar] [CrossRef]
  8. Farah, N.; Francis, Z.; Abboud, M. Analysis of the EBT3 Gafchromic film irradiated with 6 MV photons and 6 MeV electrons using reflective mode scanners. Phys. Medica. 2014, 30, 708–712. [Google Scholar] [CrossRef]
  9. Butson, M.J.; Yu, P.K.N.; Metcalfe, P. Effects of read-out light sources and ambient light on radiochromic film. Phys. Med. Biol. 1998, 43, 2407–2412. [Google Scholar] [CrossRef]
  10. Devic, S.; Tomic, N.; Pang, Z.; Seuntjens, J.; Podgorsak, E.B.; Soares, C.G. Absorption spectroscopy of EBT model film. Med. Phys. 2007, 34, 112–118. [Google Scholar] [CrossRef]
  11. Almond, P.R.; Biggs, P.J.; Coursey, B.M.; Hanson, W.F.; Huq, M.S.; Nath, R.; Rogers, D.W. AAPM’s TG-51 protocol for clinical reference dosimetry of high-energy photon and electron beams. Med. Phys. 1999, 26, 1847–1870. [Google Scholar] [CrossRef] [PubMed] [Green Version]
  12. Sukhikh, E.; Sukhikh, L.; Malikov, E. Polimer Gafchromic EBT3 films in clinical dosimetry. Adv. Mater. Res. 2015, 1084, 572–576. [Google Scholar] [CrossRef]
  13. León-Marroquín, E.Y.; Mulrow, D.J.; Khan, R.; Darafsheh, A. Spectral analysis of the EBT3 radiochromic films for clinical photon and electron beams. Med. Phys. 2019, 46, 973–982. [Google Scholar] [CrossRef] [PubMed]
  14. León-Marroquín, E.Y.; Mulrow, D.; Darafsheh, A.; Khan, R. Response characterization of EBT-XD radiochromic films in megavoltage photon and electron beams. Med. Phys. 2019, 46, 4246–4256. [Google Scholar] [CrossRef]
  15. Darafsheh, A.; Zhao, T.; Khan, R. Spectroscopic analysis of EBT-XD radiochromic films irradiated with proton and photon therapy beams. Phys. Med. Biol. 2020, 65, 205002. [Google Scholar] [CrossRef]
  16. Ahmad Shah, W.I.S.; Omar, A.F. Spectroscopy and Light Emitting Diodes Based System in Characterizing External Beam Therapy 3 Films for Solar Ultraviolet Measurement. Photonic Sens. 2020, 10, 34–44. [Google Scholar] [CrossRef] [Green Version]
  17. Osman, U.S.; Omar, A.F. Visible Spectroscopy in EBT3 Solar Ultraviolet Dosimeter; Universiti Sains Malaysia (USM): Penang, Malaysia, 2021. [Google Scholar]
  18. Williams, M.; Metcalfe, P. Radiochromic film dosimetry and its applications in radiotherapy. AIP Conf. Proc. 2011, 1345, 75–99. [Google Scholar]
  19. Callens, M.B.; Crijns, W.; Depuydt, T.; Haustermans, K.; Maes, F.; D’Agostino, E.; Wevers, M.; Pfeiffer, H.; Abeele, K.V.D. Modeling the dose dependence of the vis-absorption spectrum of EBT3 GafChromic™ films. Med. Phys. 2017, 44, 2532–2543. [Google Scholar] [CrossRef] [Green Version]
  20. Mirza, J.A.; Park, H.; Ye, S.-J. Use of radiochromic film as a high-spatial resolution dosimeter by Raman spectroscopy. Med. Phys. 2016, 43, 4520–4528. [Google Scholar] [CrossRef]
  21. Lewis, D.; Micke, A.; Yu, X.; Chan, M.F. An efficient protocol for radiochromic film dosimetry combining calibration and measurement in a single scan. Med. Phys. 2012, 39, 6339–6350. [Google Scholar] [CrossRef]
  22. Aydarous, A.; Al-Omary, E.A.; El Ghazaly, M. Characterization of Gafchromic EBT3 films for ultraviolet radiation dosimetry. Radiat. Eff. Defects Solids 2014, 169, 249–255. [Google Scholar] [CrossRef]
  23. Butson, E.T.; Cheung, T.; Yu, P.K.; Butson, M.J. Measuring solar UV radiation with EBT radiochromic film. Phys. Med. Biol. 2010, 55, N487–N493. [Google Scholar] [CrossRef] [PubMed]
  24. Chan, P.M.; Ng, C.Y.P.; Beni, M.S.; Law, S.S.; Yu, K.N. Auto-development issue in quality assurance of biological X-ray irradiator using Gafchromic EBT3 film. Results Phys. 2017, 7, 444–445. [Google Scholar] [CrossRef]
  25. Chiu-Tsao, S.; Massillon-Jl, G.; Domingo-Muñoz, I.; Chan, M. SU-E-T-96: Energy Dependence of the New GafChromic-EBT3 Film’s Dose Response-Curve. Med. Phys. 2012, 39, 3724. [Google Scholar] [CrossRef] [PubMed]
  26. Casanova Borca, V.; Pasquino, M.; Russo, G.; Grosso, P.; Cante, D.; Sciacero, P.; Girelli, G.; la Porta, M.R.; Tofani, S. Dosimetric characterization and use of GAFCHROMIC EBT3 film for IMRT dose verification. J. Appl. Clin. Med. Phys. 2013, 14, 4111. [Google Scholar]
Figure 1. Incremental changes to the color changes of expired EBT3 film.
Applsci 12 03974 g001
Figure 2. Visible absorbance spectra for expired EBT3 films irradiated by (a) 90 kVp X-rays, (b) 6 MV photon beam, and (c) 6 MeV electron beam.
Applsci 12 03974 g002
Figure 3. Linear graph of absorbance at peak (a) λ = 582.98 nm and λ = 633.52 nm (b).
Applsci 12 03974 g003aApplsci 12 03974 g003b
Figure 4. Dose response of expired EBT3 films irradiated with 90-kVp X-rays, 6-MV photon beam, and 6-MeV electron beam.
Applsci 12 03974 g004
Figure 5. Energy dependence of the expired EBT3 film.
Applsci 12 03974 g005
Table 1. Absorbed dose at each film samples for 90 kVp X-ray energy.
Expired EBT3 SamplesAbsorbed Dose (Gy)
10.62
21.12
32.39
42.90
53.72
Table 2. Absorbed dose at each film sample for 6 MV photon and 6 MeV electron beam.
Radiation SourcePrescribed Dose (MU)Absorbed Dose (Gy)
X-rays:
Energy: 6 MV
dmax: 1.5 cm
Field size: 10 cm × 10 cm SSD calibration
1001.00
2002.00
3003.00
4004.00
5005.00
Electron beam:
Energy: 6 MeV
dmax 1.3 cm
Field size: 10 cm × 10 cm SSD calibration
1001.06
2002.12
3003.20
4004.28
5005.34
Table 3. Results of Multiple Linear Regression Technique using the selected wavelengths.
Energy and Source of Radiation90-kVp X-Rays6-MV Photon Beam6-MeV Electron Beam
Wavelength (nm)R2 (%)RMSE (Gy)R2 (%)RMSE (Gy)R2 (%)RMSE (Gy)
521.00, 532.13, 600.2895.20.49699.10.28098.40.406
541.48, 561.11, 600.2898.00.31899.60.19099.70.184
561.11, 600.28, 640.1896.50.42599.90.11399.90.087
600.28, 624.50, 640.1897.30.37199.70.16798.00.446
600.28, 654.10, 650.7999.60.14799.30.25198.80.350
632.52, 641.84, 678.11100.00.01899.40.23497.60.488
635.85, 646.82, 664.0099.40.17499.10.27797.30.521
650.79, 654.10, 660.3798.00.32499.00.28999.80.144
655.09, 675.81, 678.1199.80.10198.80.32497.70.477
Table 4. Results of multiple linear regression technique using selected wavelengths for all experiments.
Wavelength (nm)R2 (%)RMSE (Gy)
541.48, 561.11, 600.2889.30.585
650.79, 654.10, 660.3785.20.688
600.28, 650.79, 654.1085.40.682
Table 5. Results of multiple linear regression technique using selected wavelengths for the 6-MV photon beam and 6-MeV electron beam source.
Wavelength (nm)R2 (%)RMSE (Gy)
541.48, 561.11, 600.2897.20.350
650.79, 654.10, 660.3796.90.364
600.28, 650.79, 654.1096.40.395
Table 6. Net ROD value for radiography X-rays, LINAC photon beam, and electron beam.
Source of RadiationDose (Gy)Net RODRMSE (Gy)LODLOQ
90-kVp X-rays (Radiography)0.620.0380.0381.0443.163
1.120.047
2.390.086
2.900.118
3.750.147
6-MV photon beam (LINAC)1.000.0860.1131.0573.202
2.000.156
3.000.220
4.000.285
5.000.330
6-MeV electron beam (LINAC)1.060.0720.1152.0036.070
2.120.185
3.200.225
4.280.280
5.340.331
Table 7. Summary for the percentage difference of net ROD for 90-kVp and 6-MV photon beam.
Absorbed Dose (Gy)Percentage Difference of Net ROD (%)
90-kVp and 6-MV X-rays6-MV X-rays and 6-MeV Electron Beam
1.0067.18.5
2.0064.110.2
3.0060.58.1
4.0058.97.3
5.0052.51.0
Publisher’s Note: MDPI stays neutral with regard to jurisdictional claims in published maps and institutional affiliations.

