Article

Exploration and Assessment of Interaction in an Immersive Analytics Module: A Software-Based Comparison

1
Department of Industrial and Systems Engineering, Mississippi State University, Starkville, MS 39762, USA
2
Department of Industrial and Systems Engineering, North Carolina A&T State University, 1601 E. Market Street, 402 McNair Hall Room 405, Greensboro, NC 27411, USA
3
Institute for Systems Engineering Research (ISER), U.S. Army Engineer Research and Development Center (ERDC), Vicksburg, MS 39180, USA
*
Author to whom correspondence should be addressed.
Appl. Sci. 2022, 12(8), 3817; https://doi.org/10.3390/app12083817
Submission received: 3 October 2021 / Revised: 10 February 2022 / Accepted: 29 March 2022 / Published: 10 April 2022
(This article belongs to the Topic Extended Reality (XR): AR, VR, MR and Beyond)

Abstract

:
The focus of computer systems in the field of visual analytics is to make the results clear and understandable. However, enhancing human-computer interaction (HCI) in the field is less investigated. Data visualization and visual analytics (VA) are usually performed using traditional desktop settings and mouse interaction. These methods are based on the window, icon, menu, and pointer (WIMP) interface, which often results in information clutter and is difficult to analyze and understand, especially by novice users. Researchers believe that introducing adequate, natural interaction techniques to the field is necessary for building effective and enjoyable visual analytics systems. This work introduces a novel virtual reality (VR) module to perform basic visual analytics tasks and aims to explore new interaction techniques in the field. A pilot study was conducted to measure the time it takes students to perform basic tasks for analytics using the developed VR module and compares it to the time it takes them to perform the same tasks using a traditional desktop to assess the effectiveness of the VR module in enhancing student’s performance. The results show that novice users (Participants with less programming experience) took about 50% less time to complete tasks using the developed VR module as a comrade to a programming language, notably R. Experts (Participants with advanced programming experience) took about the same time to complete tasks under both conditions (R and VR).

1. Introduction

Initially, data visualization in scientific research areas focused on visualizing information that was inherently 3D [1]. This comprised a variety of geospatial information, such as directional movement of seawater driven by the Coriolis effect and information obtained from living organisms, fluid dynamics, and Magnetic Resonance Imaging (MRI), which convey aspects of anatomy and physiological processes of the human body. This type of information was represented as-is, naturally, using large format visual displays. Later, during the nineties, researchers eagerly started investigating immersive representation of abstract information [2]—i.e., utterly quantitative data—and, hence, had a certain liberty in the way it could be visualized using immersive spaces [3]. Specifically, researchers investigated how this type of information could be embedded, and its visual mapping became the main focus of a novel research stream—information visualization. The latter incorporates the fields of graphic design, human–computer interactions (HCI), and data analysis, developing a novel multidisciplinary research area that examines new methods of how computer science could be employed to represent abstract information and its interaction design [4,5,6]. In the mid-1990s, the first information visualization symposium was established in order to welcome new research propositions in this novel stream.
Although abstract information visualization using immersive environments initially gained attention in the mid-1990s [3], early 21st century researchers showed less interest in the field [2]. Since it became an independent branch of study, researchers have focused on developing methods for traditional desktop settings and WIMP interfaces. This shift in interest resulted from some research outcomes suggesting that 3D visualizations of abstract information on a desktop are not necessarily beneficial [7]. Until now, the question of whether using new immersive technologies for abstract information offers more benefits and how interaction for this type of information can be designed remains to be answered.

1.1. The Establishment of Visual Analytics (VA)

At the beginning of the 21st century, the increasing complexity of data and the widespread use of the internet triggered a demand for more efficacious methods to be developed for handling big, complex data. At the time, the information visualization field had already built new approaches and principles for how to construct effective visualizations of abstract information [7]. Nevertheless, researchers were urged to develop new, complete, and practical research plans for information visualization in order to face the great challenge of developing techniques that could handle tremendous amounts of data produced in that era [8]. The outcome of this was the establishment of visual analytics, an entirely new research field that was defined as “analytical reasoning facilitated by interactive visual interfaces [9].” A total of 19 powerful guidelines were crafted for this new field and, unlike the old information visualization techniques, these encouraged studies that would produce visualization methods that:
  • support large datasets ([9], p. 7);
  • allow for better, more advanced interactions between a user and a tool ([9], p. 7) instead of primarily concentrating on how to obtain accurate and precise inferences and predictions.
These established guidelines for the visual analytics field were unbiased towards the use of a specific technologies. However, the majority of visual analytics studies remained loyal to the desktop settings and continued developing methods for similar traditional environments.
On the other hand, the technological affordances of a used device greatly influence the experience of the individuals who use it, and thus they also influence both their involvement and performance levels. Despite the fact that the field of visual analytics greatly focuses on a user’s ability to engage in complex, goal-oriented tasks rather than on the technology being used, it is believed that making use of the embodied experiences provided by new immersive technologies significantly affects an analyst’s workflow and is worthy of more exploration [10].

1.2. The Establishement of Immersive Analytics (IA)

It is argued in the literature that the new immersive technologies and their interaction techniques offer new potential for reaching the objectives set for visual analytics (see “Establishing Visual Analytics” section). These technologies, notably VR, are usually defined based on their cognitive implications. Steve Bryson [11] defined VR as: “The use of computer technology to create the effect of an interactive three-dimensional world in which the objects have a sense of spatial presence.”
Over the past few years, visualization has greatly benefited multivariate/complex data [12,13]. Lately, the virtual reality display devices including, Oculus Rift/Rift S, Samsung Gear, and HP Reverb G2, and mixed/augmented reality devices such as HoloLens (Microsoft) and Google glass [14,15,16] offer a better platform for visual analytics [17]. These technologies employ stereoscopy (a method for generating a feeling of depth for images with a great emphasis on binocularity) to build an involving and immersive virtual space [18]. They intrinsically offer more freedom to analyze and manipulate complex data compared to traditional 2D data representation systems. Various studies exist that employ immersive display devices for immersive analytics like network representation, scientific representation, and geospatial representation [19,20,21].
Additionally, the novel affordances of these technologies can benefit the data analytics field by:
  • Allowing a wider range of users to have the ability to employ data analytics by developing new systems that involve more of the basic human senses;
  • Covering tasks that cannot be conducted using traditional desktop settings;
  • Staying current with new technology trends that shape the way people interact and perform;
  • Allowing users with different levels of expertise to perform data analytics easily.
The possibility of achieving the goals listed above has attracted the attention of numerous researchers from different areas, including data analysis, visual analytics, VR and AR, human–computer interaction, computer graphics, etc. As mentioned before, the idea of immersing data into a virtual ambiance is not new [22]. Nevertheless, accepting the idea that data representation and visual analytics should consider new immersive technologies for building new analytics tools with advanced interaction techniques was first presented in 2014 when the “Death of Desktop: Envisioning Visualization without Desktop Computing” workshop was held.
Over the next few years, the idea of implementing immersive technologies for visual analytics was given the name immersive analytics (IA) by researchers who were investigating different methods of information representation in these environments [23]. Consequently, various workshops have been held recently under the IA field umbrella in different parts of the worlds, attended by researchers and experts from areas like information visualization, human–computer interaction, and immersive AR and MR [24]. During these workshops, various ideas and techniques in the IA field were shared, perspectives were broadened, and the community of immersive analysts began expanding rapidly [25].
After the establishment of IA as an independent field, various immersive analytics tools have been introduced including DXR, an immersive analytics application that permits users to efficiently build visualizations through predefined mappings and graphs. IATK is a similar tool built to support large datasets (up to seven million points). These tools, although great examples IA system, do not take advantage of the real affordances of VR. Moreover, they don’t focus on bettering the interaction techniques joining users and machines. This study introduces a new tool to the IA field. This tool is called the Immersive Virtual Exploratory Engine (IVEE) and aims to enhance the interface that stands between users and computers by implementing interaction techniques like those performed on a daily basis by users when handling real objects. It distinguishes itself from existing IA tools by providing users with a natural user interface (NUI) that places significant focus on natural, intuitive interactions between users and data. The tool has numerous features for its users, providing them with:
  • Experience natural interaction using virtual hands only when handling interactive 3D visualizations;
  • Supports four visualization types that are fully interactive: scatterplots, boxplots, histograms, and line plots;
  • The lasso system to subset data using virtual hands only, in an intuitive manner;
  • The element merge system to merge visualizations together using virtual hands only, in an intuitive manner;
  • The possibility to build numerous visualizations simultaneously;
  • Remote collaboration.

2. Materials and Methods

2.1. The Development Environment

IVEE was built using Unity engine and R software and is intended to function using a regular desktop and an Oculus Rift S headset. It was developed from scratch for a little over a two-year period. 
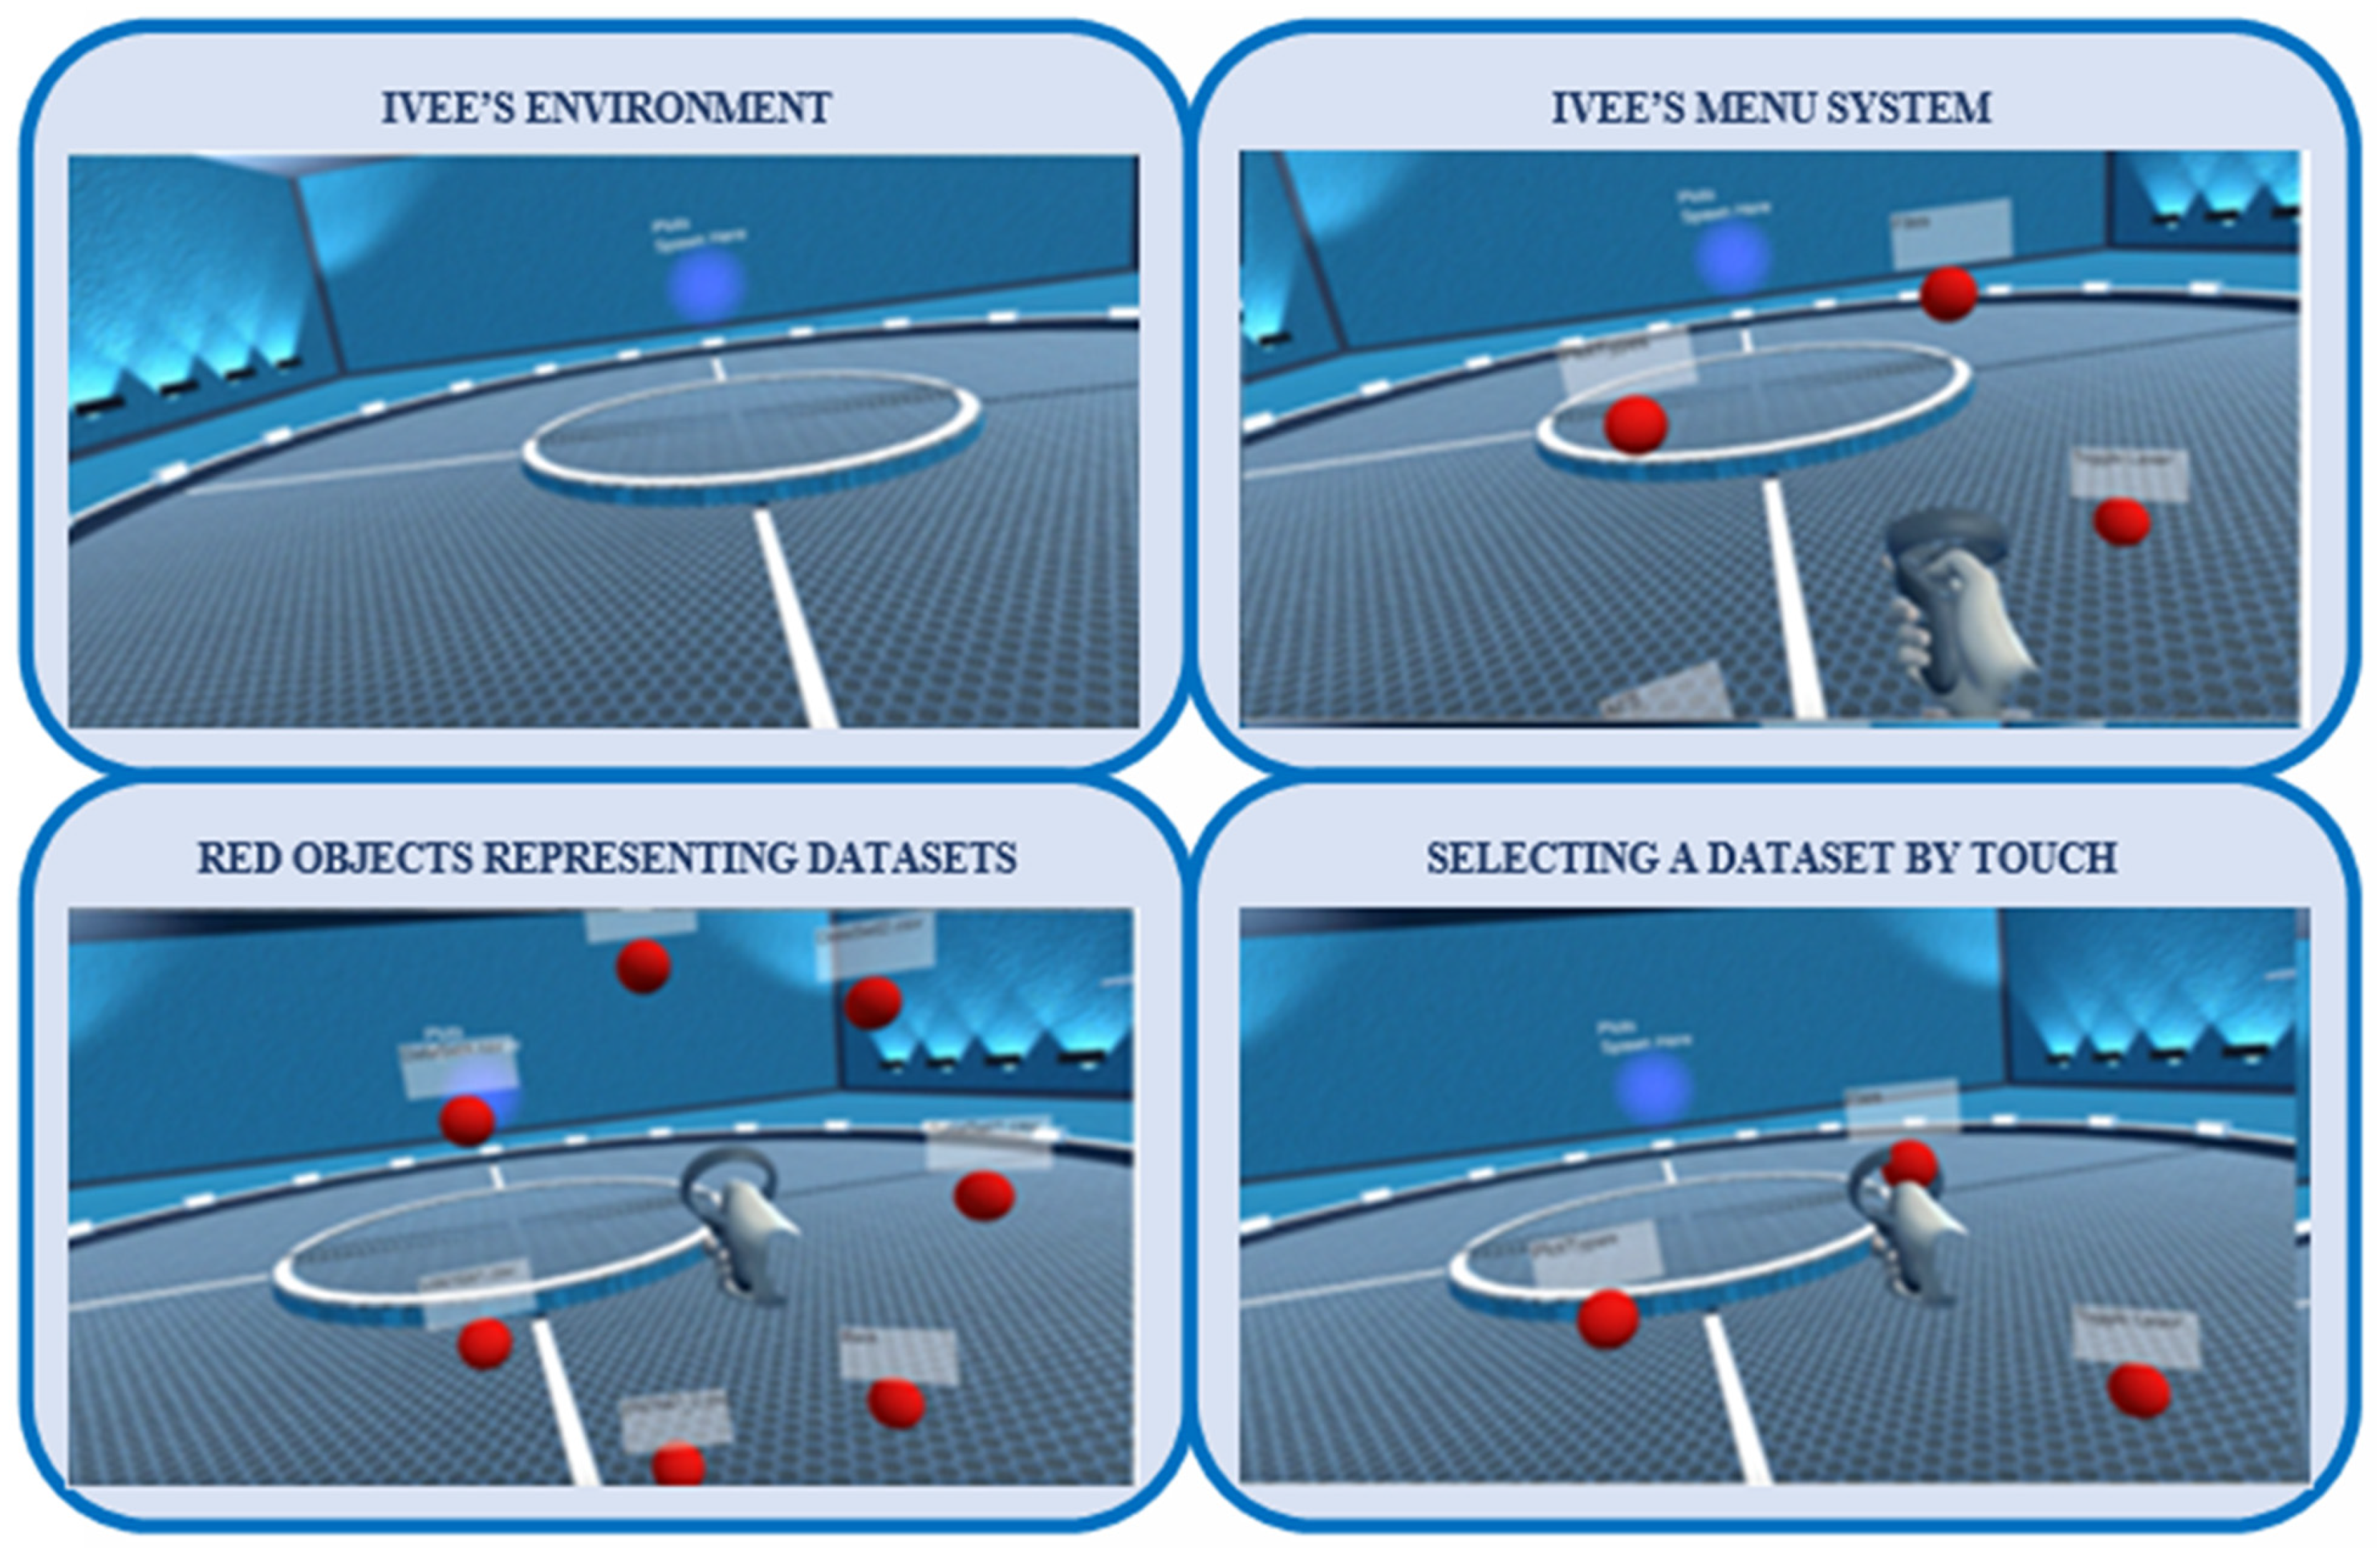
Figure 1 shows the first IVEE complete prototype.
The IVEE project consists of three parts: two backends and one frontend. While the first backend was written in R software, the second backend was developed using pure C# programming language. The frontend was established using the Unity Create Connections of the backends and frontend of the IVEE project.
R, the first backend, is both a programming language and software for statistical computing and graphics. It was developed based on the “S” systems created by Ihaka and Gentleman [26]. R provides many functions for statistical analysis, including effective data support, an integrated suite of tools for statistical analysis, computations on spreadsheets, graphical visualizations, programming language, and extra capabilities using libraries. The second backend, C#, is a Microsoft programming language that blends the capabilities of C++, an extension of the C language for general-purpose programming, and Visual Basic (VB), a Microsoft-environment programming language known for its ease of use and high productivity [27]. Finally, Unity 3D was employed as a frontend to build the immersive environment, thanks to its design flexibility [28]. Unity can handle 2D and 3D graphics and employs C# as its main scripting language.
This multi-use and separation of software aims to allow for the reimplementation of the backends with other frontends and future ease of development.
The R backend is responsible for generating the necessary metadata used in C# to create 3D visualizations. The C# backend is responsible for managing the overall project resources and features as well as for generating 3D distributions. It is also considered to be the link between different routes by processing requests using CPUs.
The frontend serves as the interface between users and the model. It supports operations, including creating objects, generating and manipulating distributions, and collaborating remotely with other users.

2.2. Virtual Reality (VR) Headset/Controllers

The Oculus Rift S VR headset is the headset chosen for this project to create an immersive feel for its users (Figure 2). It has a display with a maximum resolution of 1080 × 1200 for each eye, an estimated 90 Hz refresh rate, and a field of view of 110 degrees. In addition, the headset has a development kit with a plugin for Unity, which facilitates the development of our project [29].

2.3. Software Development Paradigm

The project scene was created using Blender digital modeling software. It is a free creation suite used for visual effects, game conception, animation, and building 2D/3D meticulous models [30]. The aim of developing the IVEE engine is to create a modern data command center in which numerous graphs and menus can be generated in a 3D environment that uses colors. The engine can handle comma-separated files (.csv) and the data format should be numerical. Users can grab, translate, rotate, and visually scale objects.

2.4. Visualizations and Analytics

The module can handle 2D visual objects, 3D visual objects, and line graphs. If the object to be generated has less than 1000 instances, it is created using sphere primitives or line renderers provided by Unity. If the object has up to 120,000 instances, the Unity 3D particle system is utilized to boost the graphic rendering latency. The 3D plots can support up to six dimensions, including spatial x, y, and z, size, color, and time. For all objects, data are scaled to fit within the cube, and legends are displayed for the spatial dimensions of 3D graphs and line plots.
The engine currently supports four exploratory analytics techniques: histograms, scatterplots, boxplots, and line plots. An objective for the immersive engine was to provide support to allow R analytics to be accessed within the virtual environment to generate the information necessary for data visualization. When analytics are being processed, the computation is conducted on a processor node separate from the immersive engine to ensure there is no performance degradation in graphical rendering. Lastly, the immersive engine supports two or more users within a work session to conduct data analytics investigations collaboratively. Users can see each other’s visual content and communicate through voice chat and visual feedback to indicate which user is interacting.

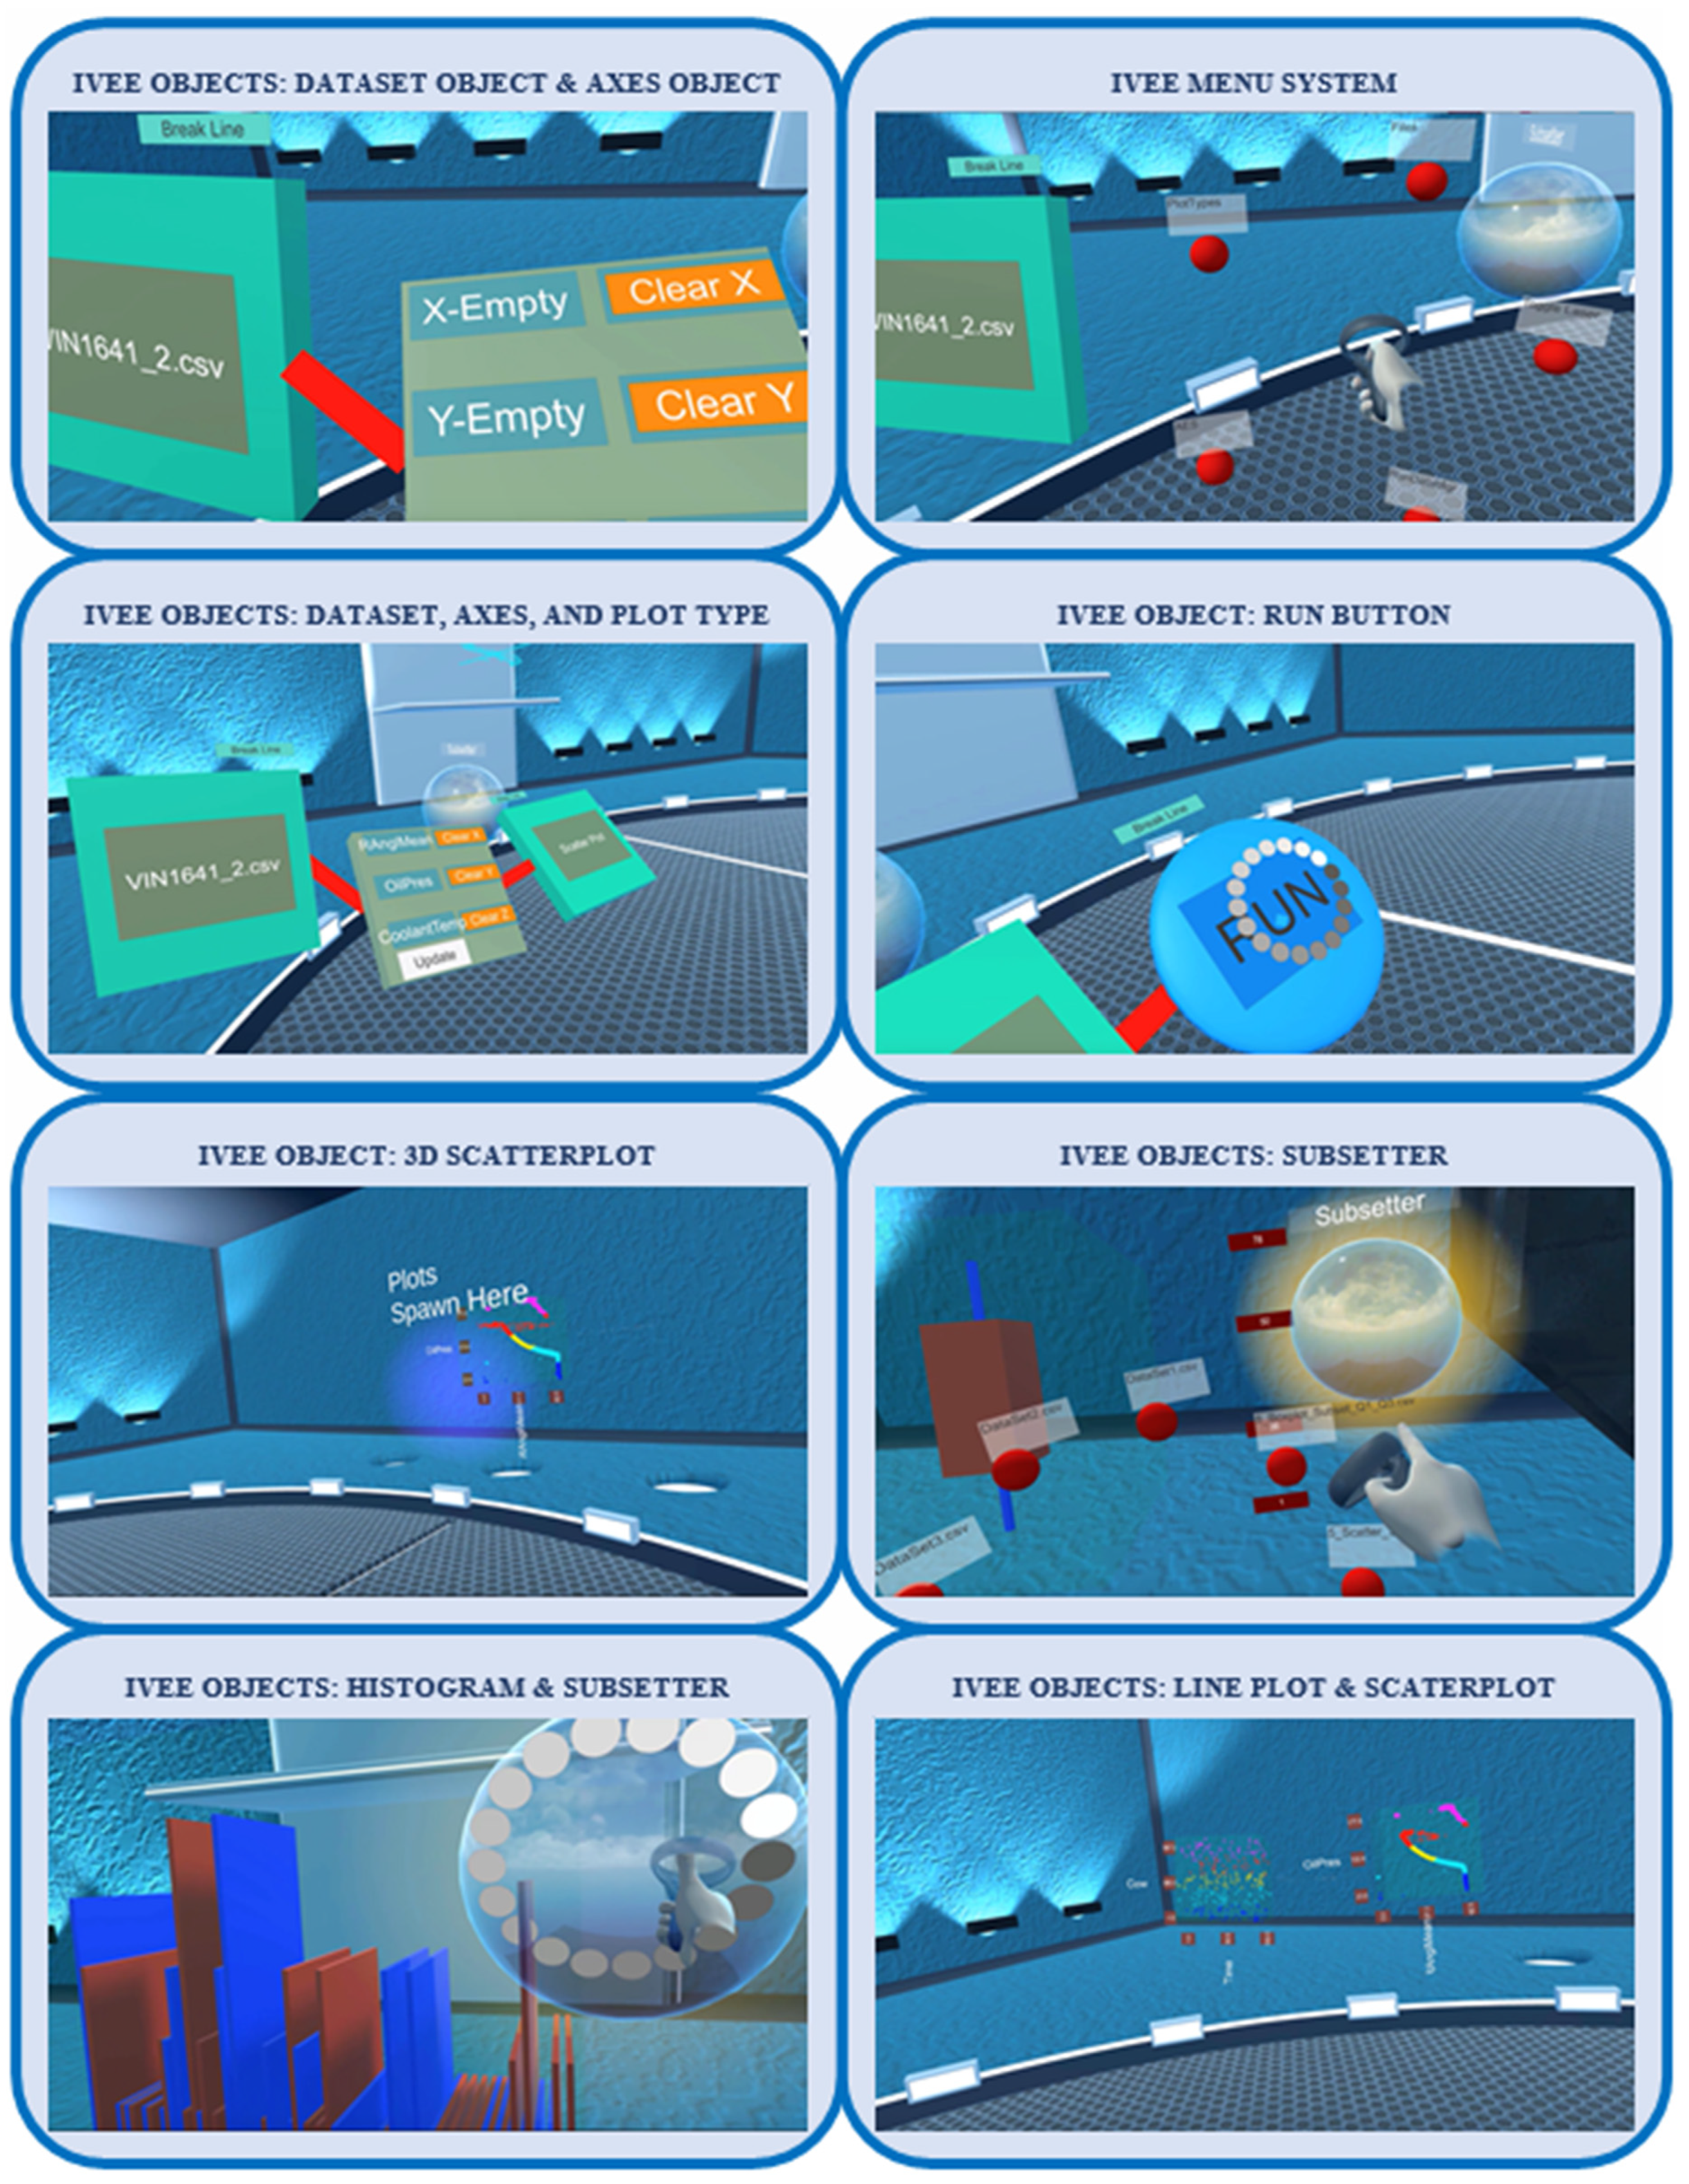
2.5. IVEE Functionality

This section demonstrates how IVEE can assist in the generation of interactive visualizations in the immersive space. We illustrate the use of IVEE through a pilot study to further investigate the feasibility of using this engine and to evaluate the system’s functionality and performance in relation to data retrieval, user interfacing, and graphical rendering performance.
Analyzing multidimensional/multivariate data on 2D interfaces requires a variety of summary visualizations and reports that must be brought together to inform decision-making. These techniques have their disadvantages; complex interrelationships are hard to spot, and analysts cannot discern a modern dataset relying on 2D interfaces without the possibility of eliminating important details. Additionally, 2D graphics only provide one part of a more complex structure, and it is arduous to find meaningful information when one cannot visualize datasets as they are. Clearly, the field of analytics requires the means to visualize multivariate datasets as they are. VR immersive mediums offer various advantages for multivariate/multidimensional data, including greater space and the third dimension. Hence, they provide a much better way of reviewing and examining modern datasets. IVEE can visualize multivariate datasets, and enables users to manipulate them inside the virtual space without programming. In the following sections, we show how the IVEE engine works and demonstrate how to use its data sub-setting and merging features currently available in this engine version.
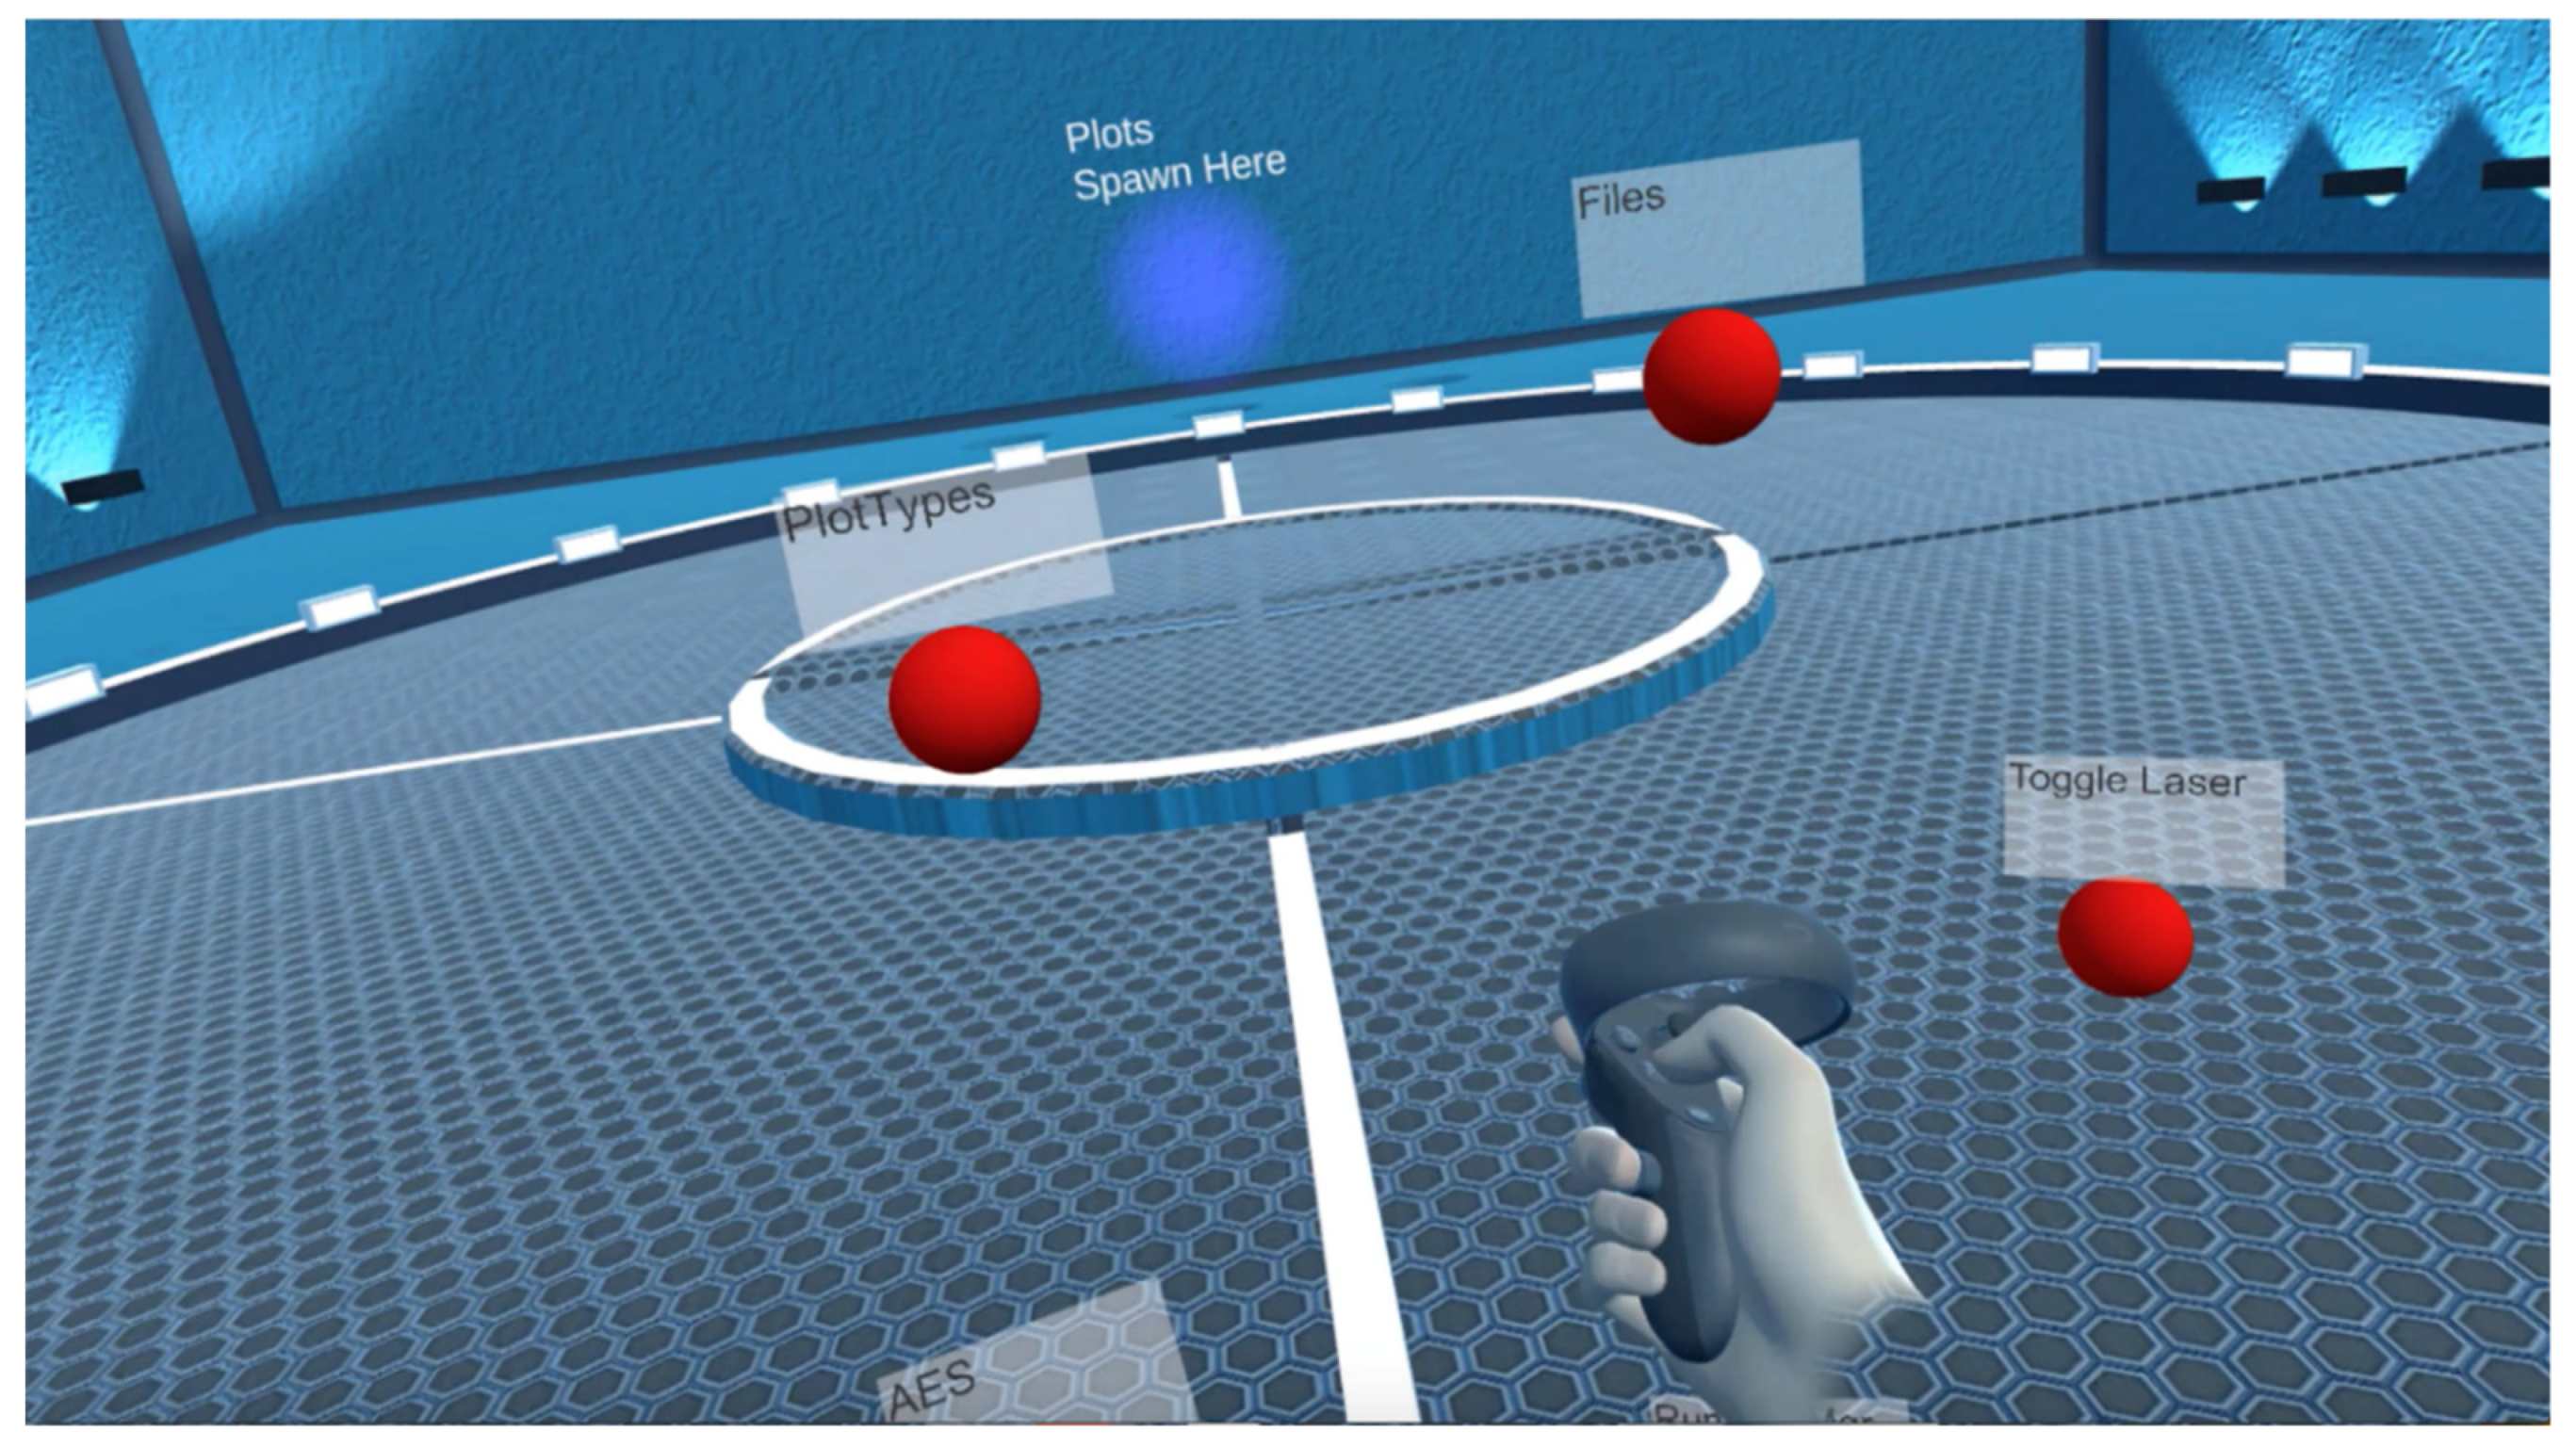
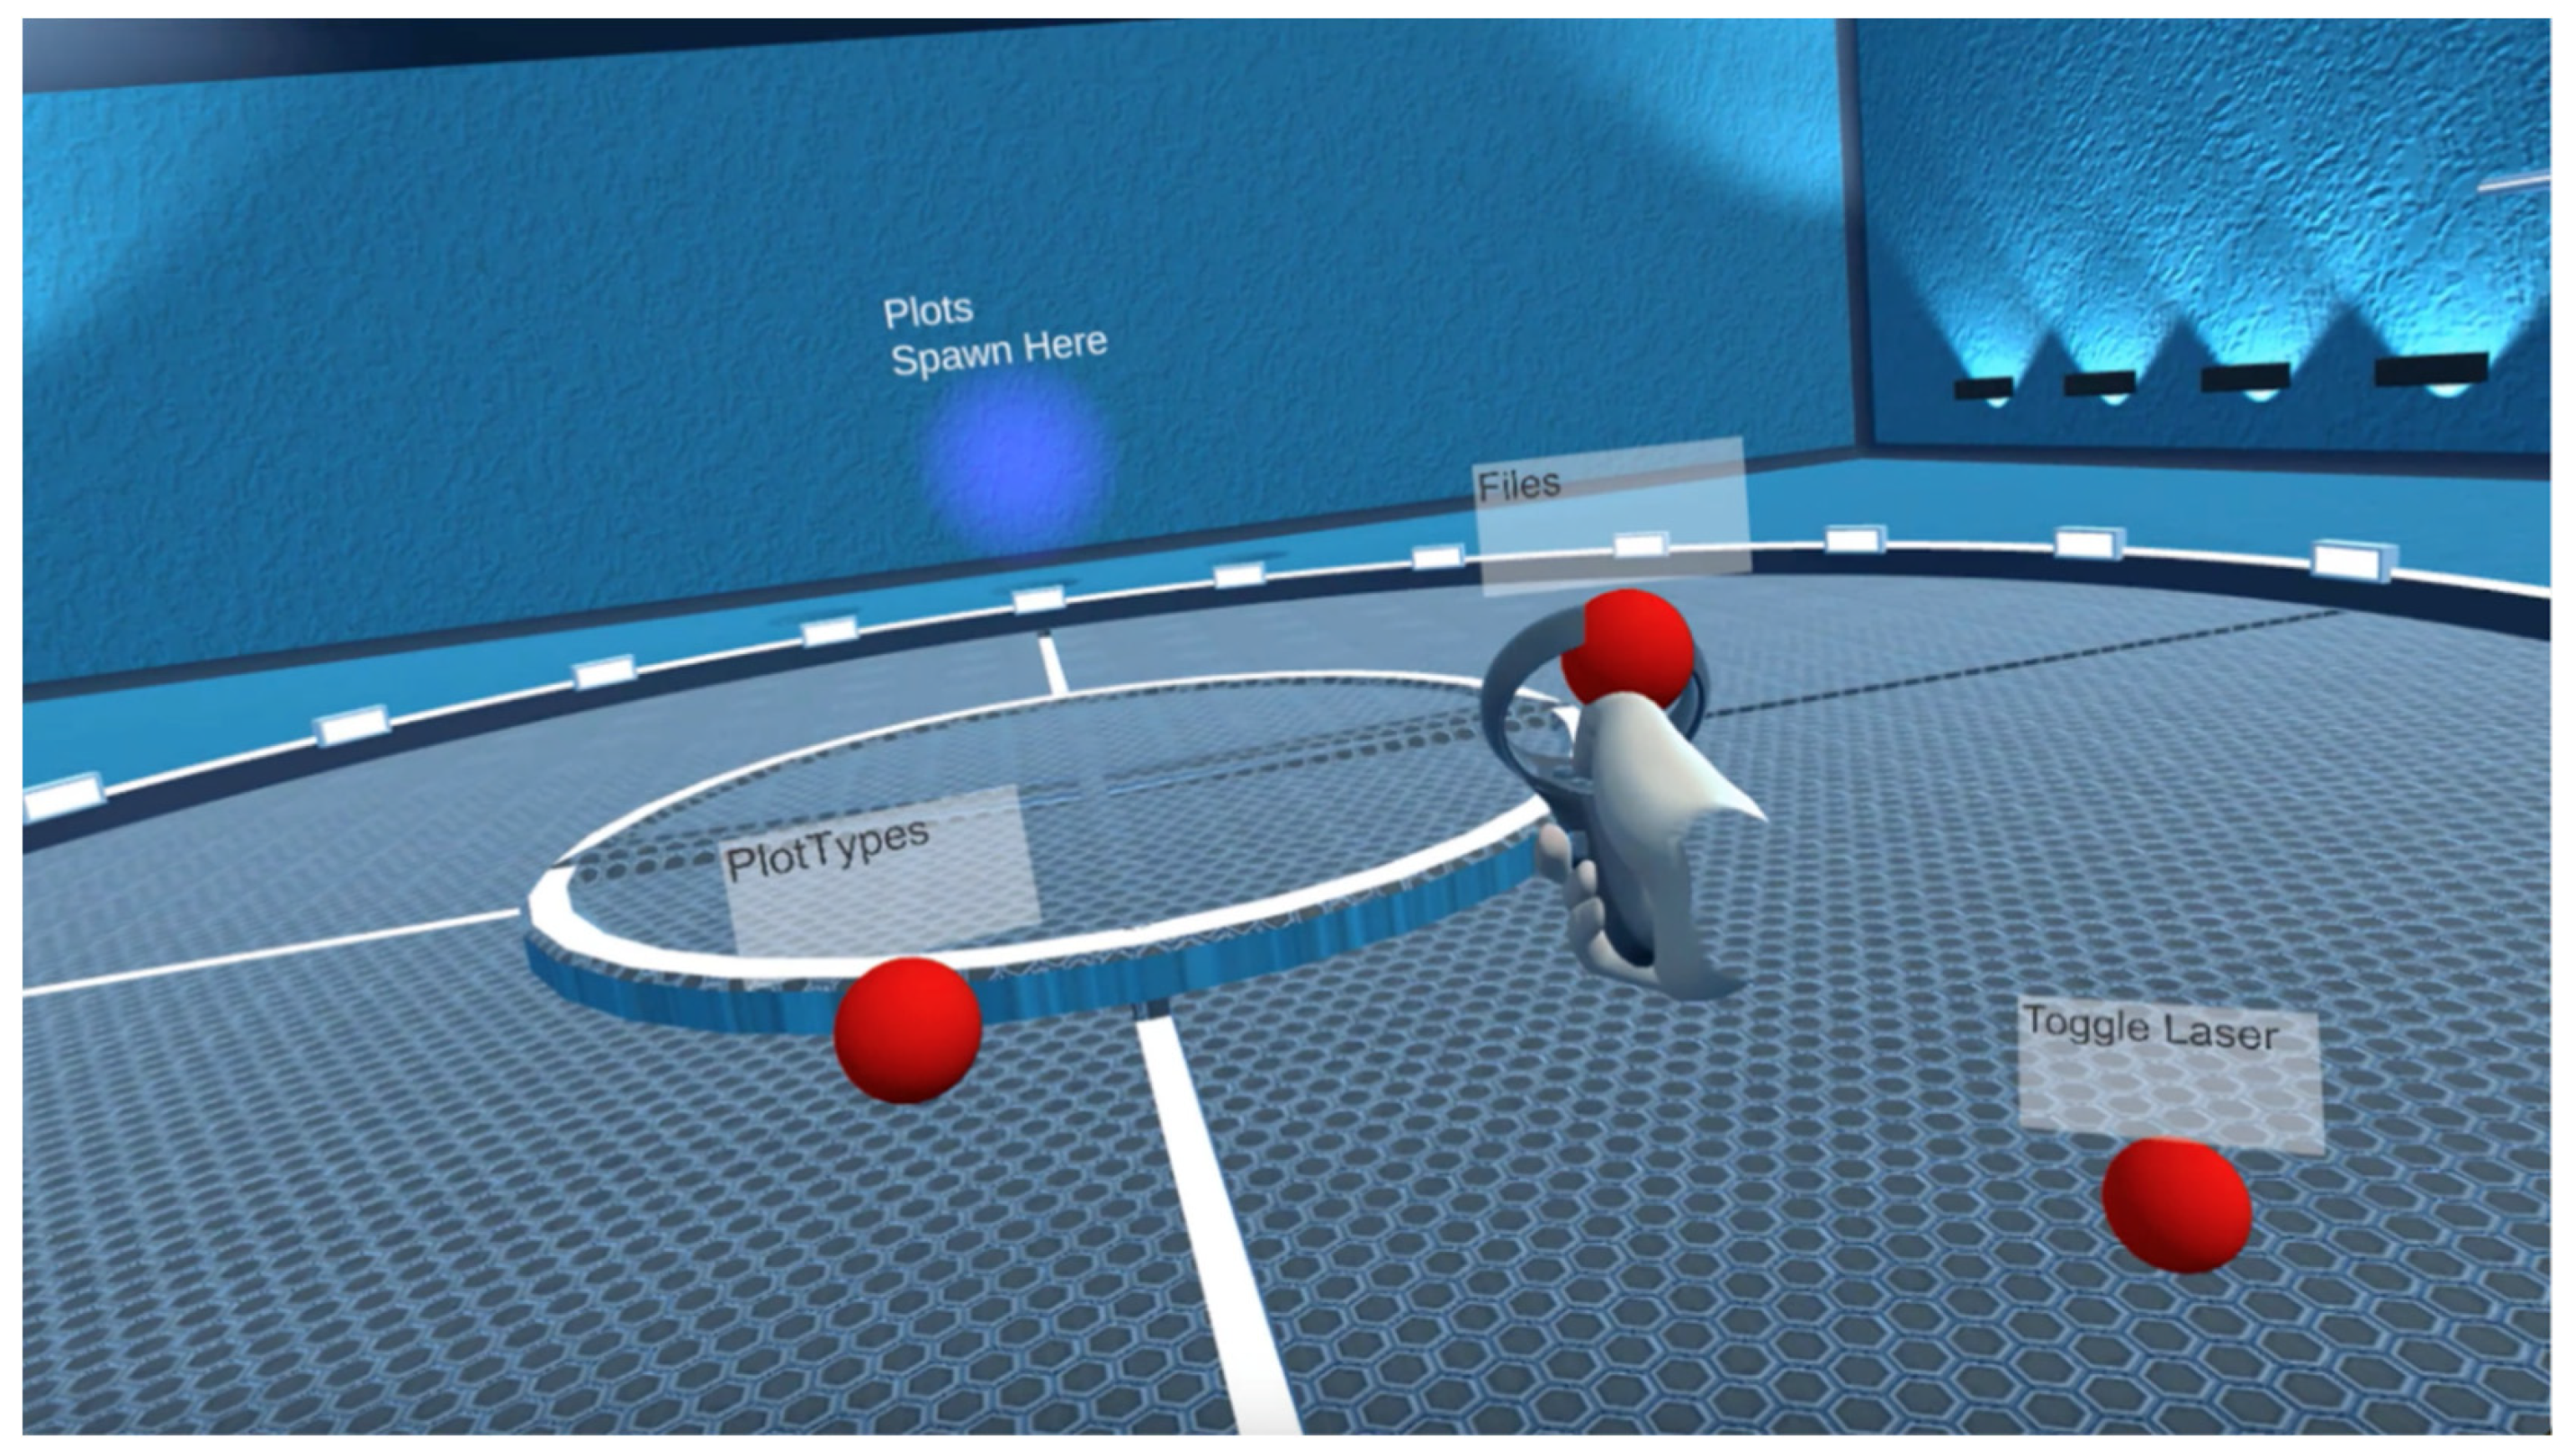
First, we demonstrate the gesture-based central menu system. The idea was to tie all the options to only two buttons on the right-hand Oculus Touch controller to reduce the users’ cognitive load (Figure 3). Consequently, users do not have to remember any complicated button combinations but only press the button and swipe to select (Figure 4). When a user is placed inside the virtual space of IVEE by wearing the Oculus headset and holding the touch controllers with both real hands, he/she can see his/her virtual hands holding virtual controllers as if they were real (
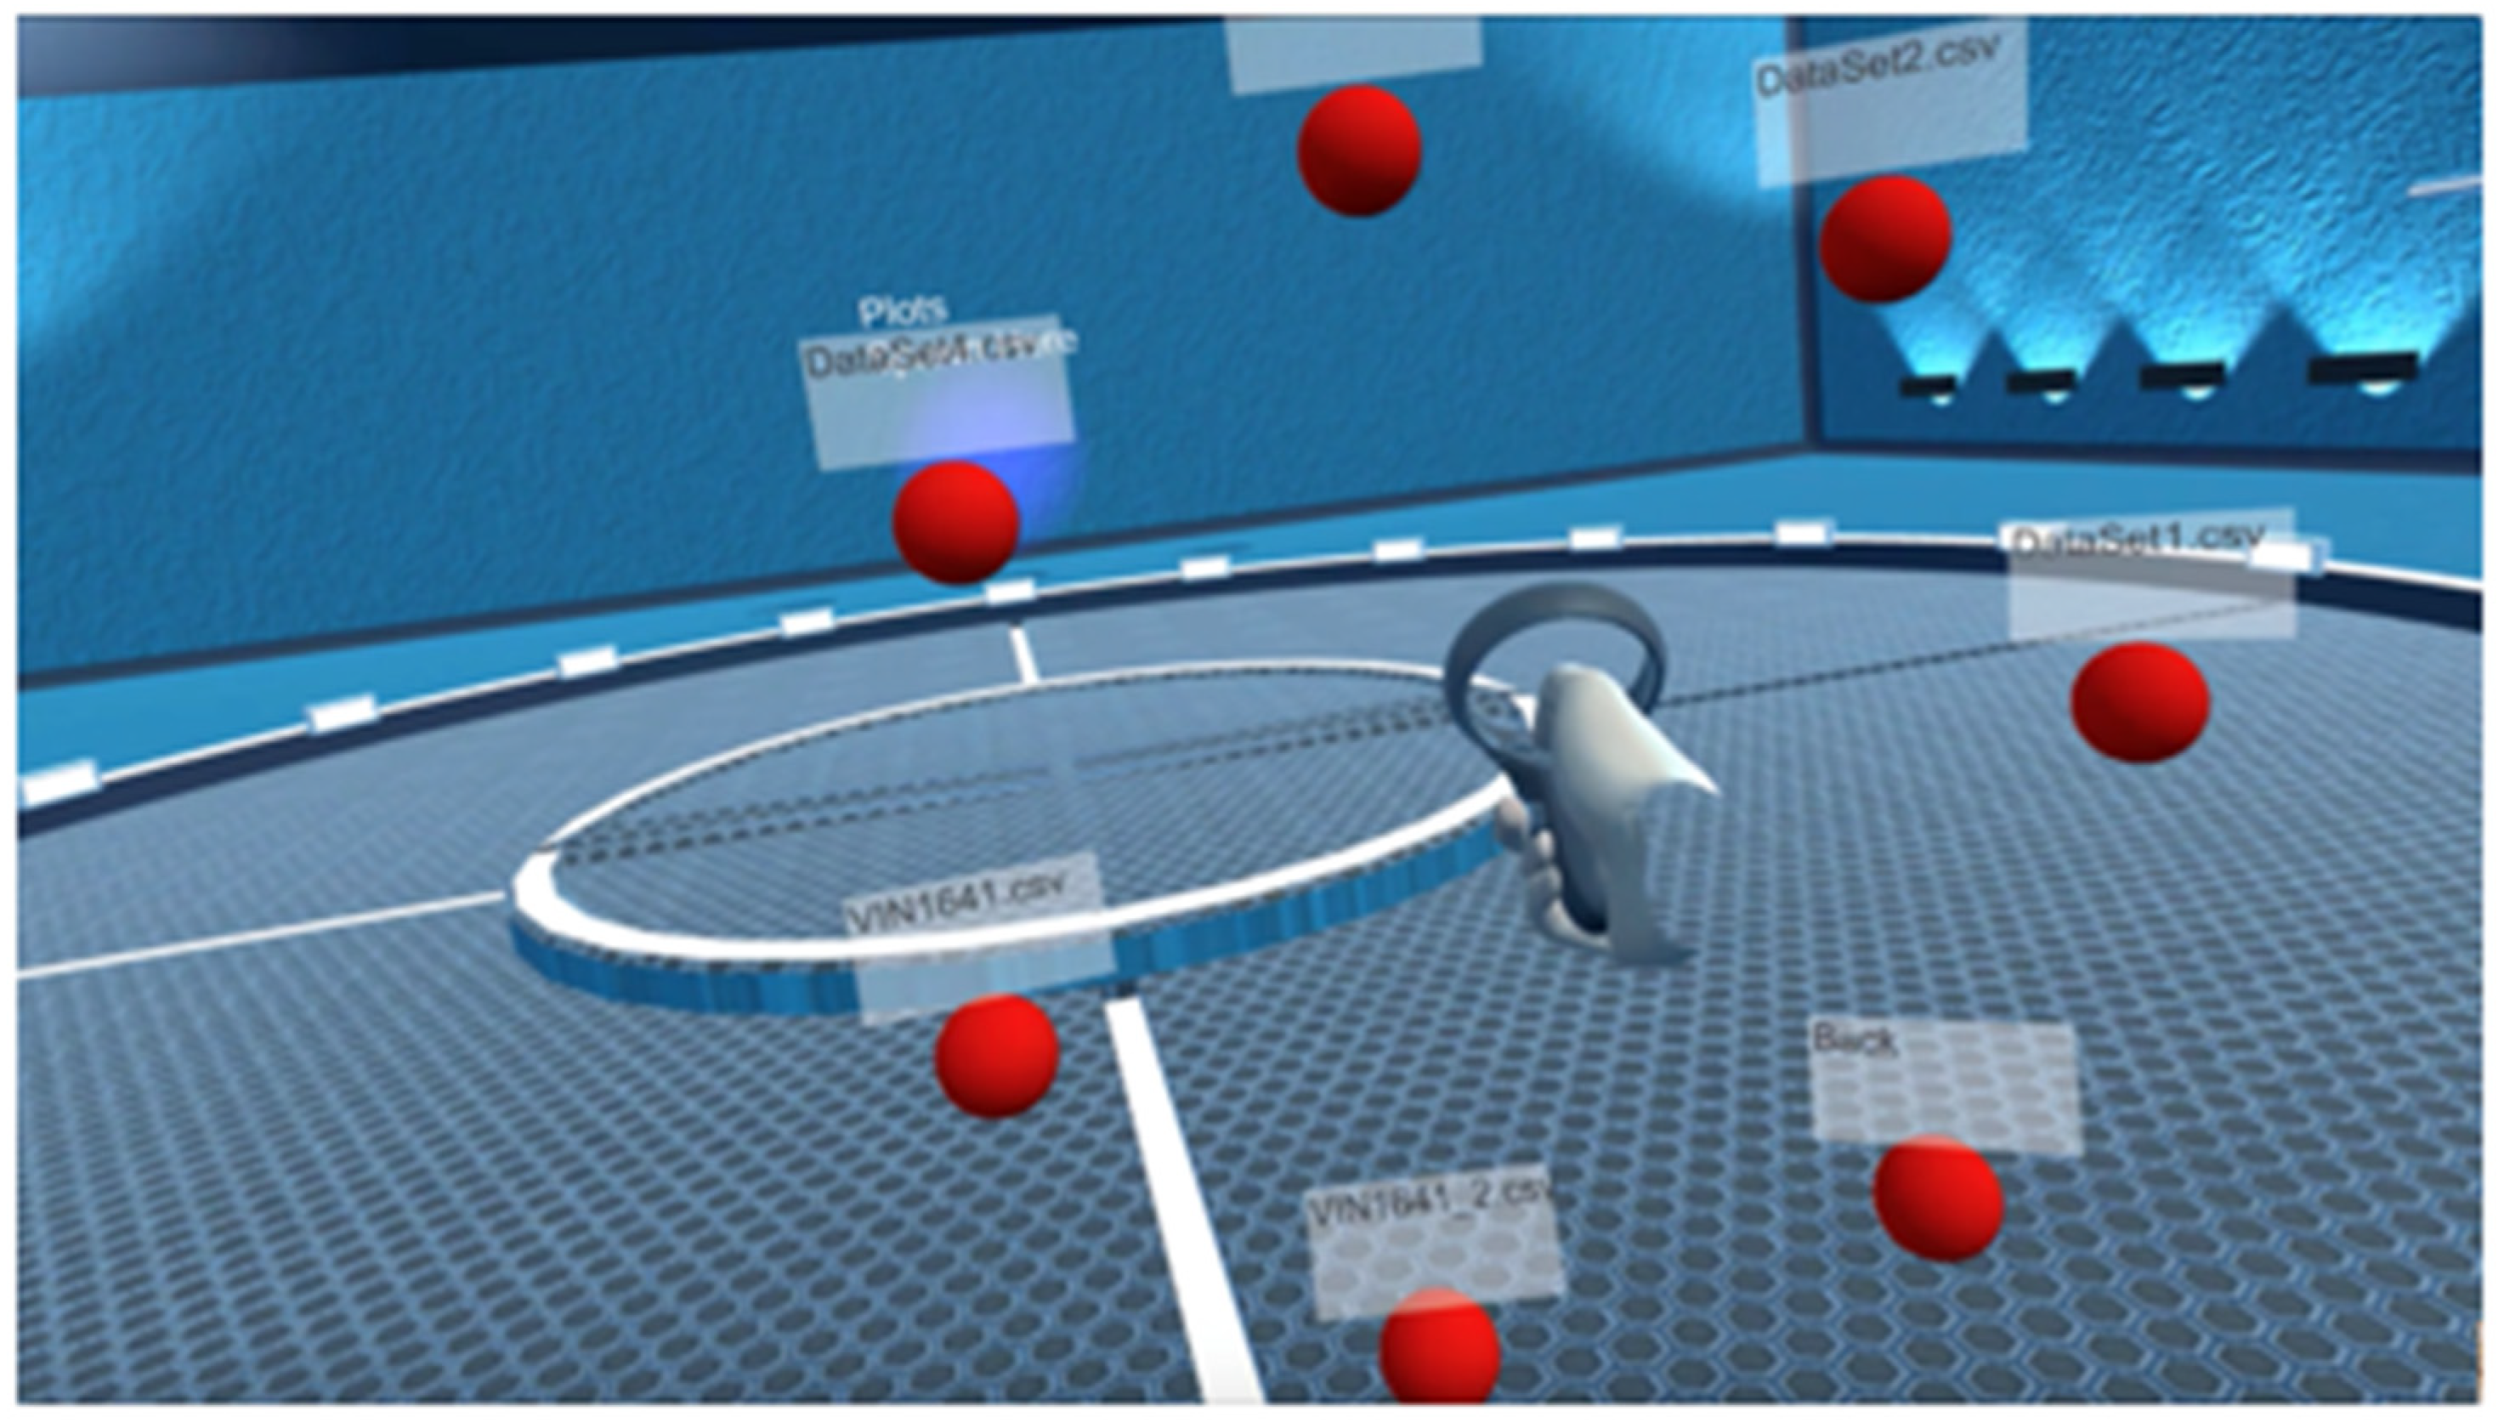
Figure 3). When the user moves his/her real hands that hold the real touch controllers, his/her virtual hands move accordingly in the virtual space. Moving the real/virtual hands in a sweeping motion and virtually touching one of the “red balls” automatically opens further menus (Figure 5).
Before this step, the data to be explored should be built as a .csv file and placed in the IVEE Unity folder. Users can place all the files they wish to explore to work with multiple datasets simultaneously without exiting the virtual scene and stopping the simulation (Figure 6).
After placing the file in the IVEE unity folder, users can press the A button to start the simulation and put their headsets on Figure 3. To generate a visualization, users press the A button on the right-hand touch controller and swipe to the “Files” element (Figure 4 and Figure 5). This brings up a nested menu that shows all the files available in the unity folder (
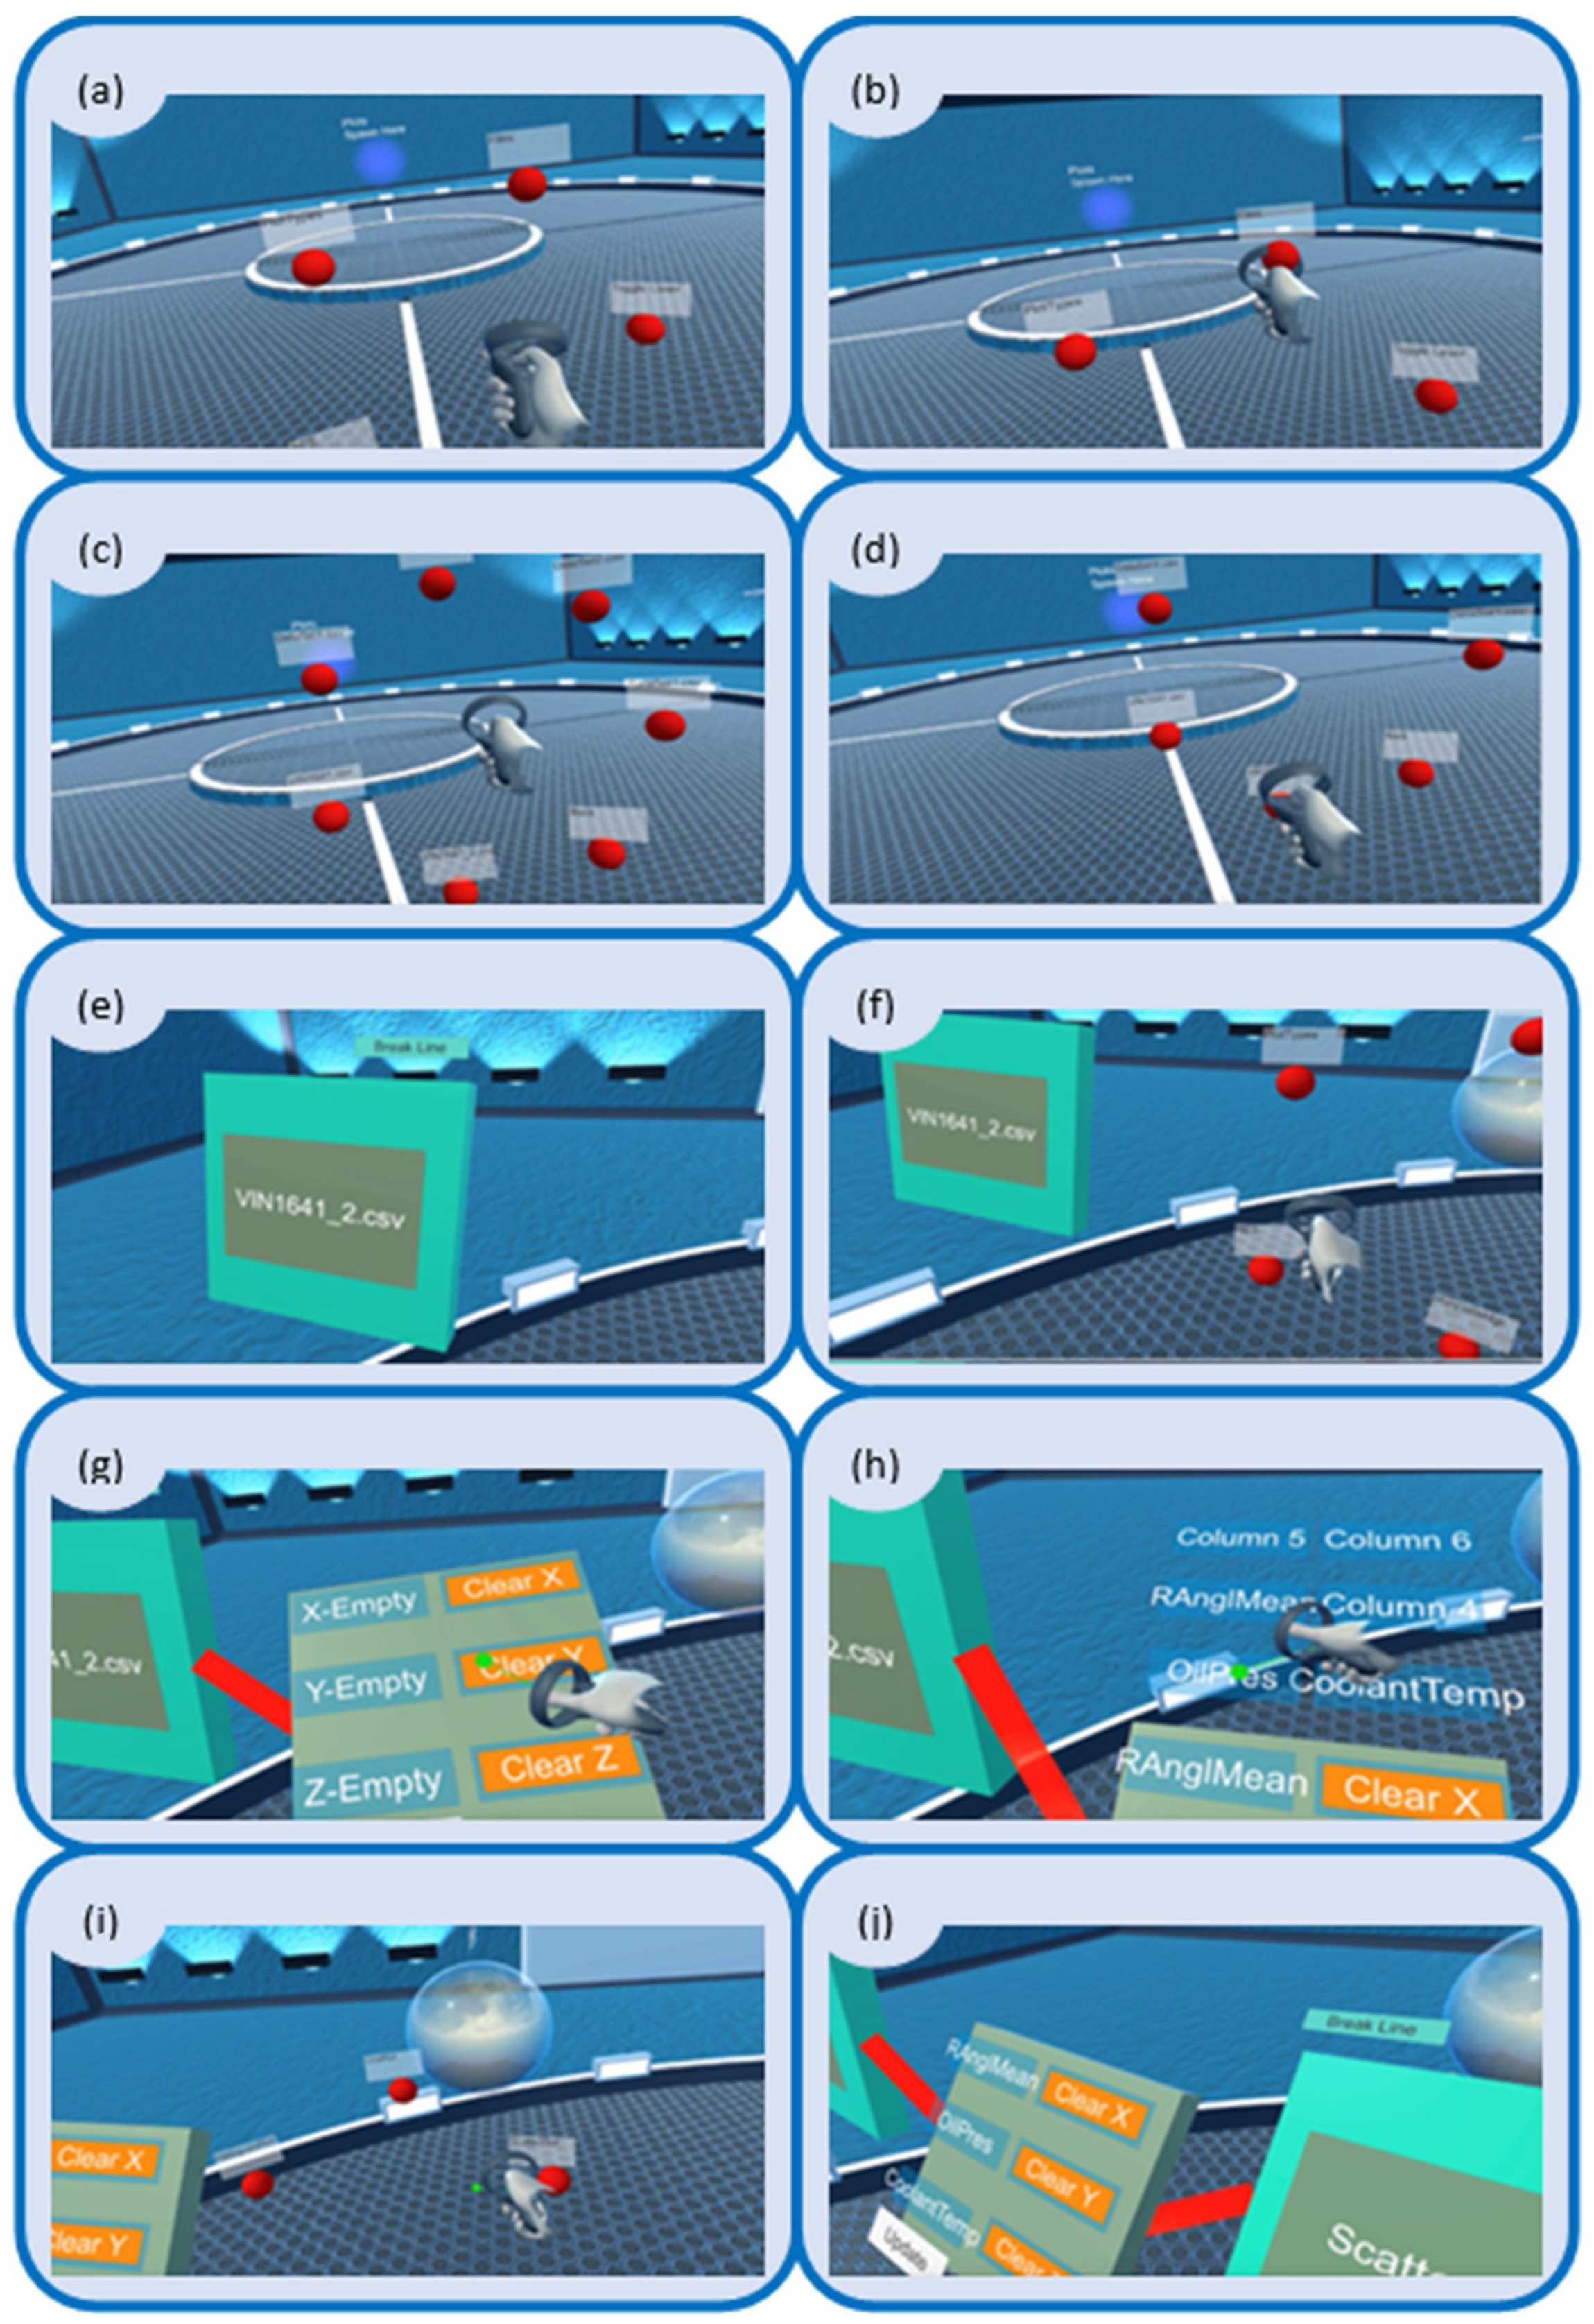
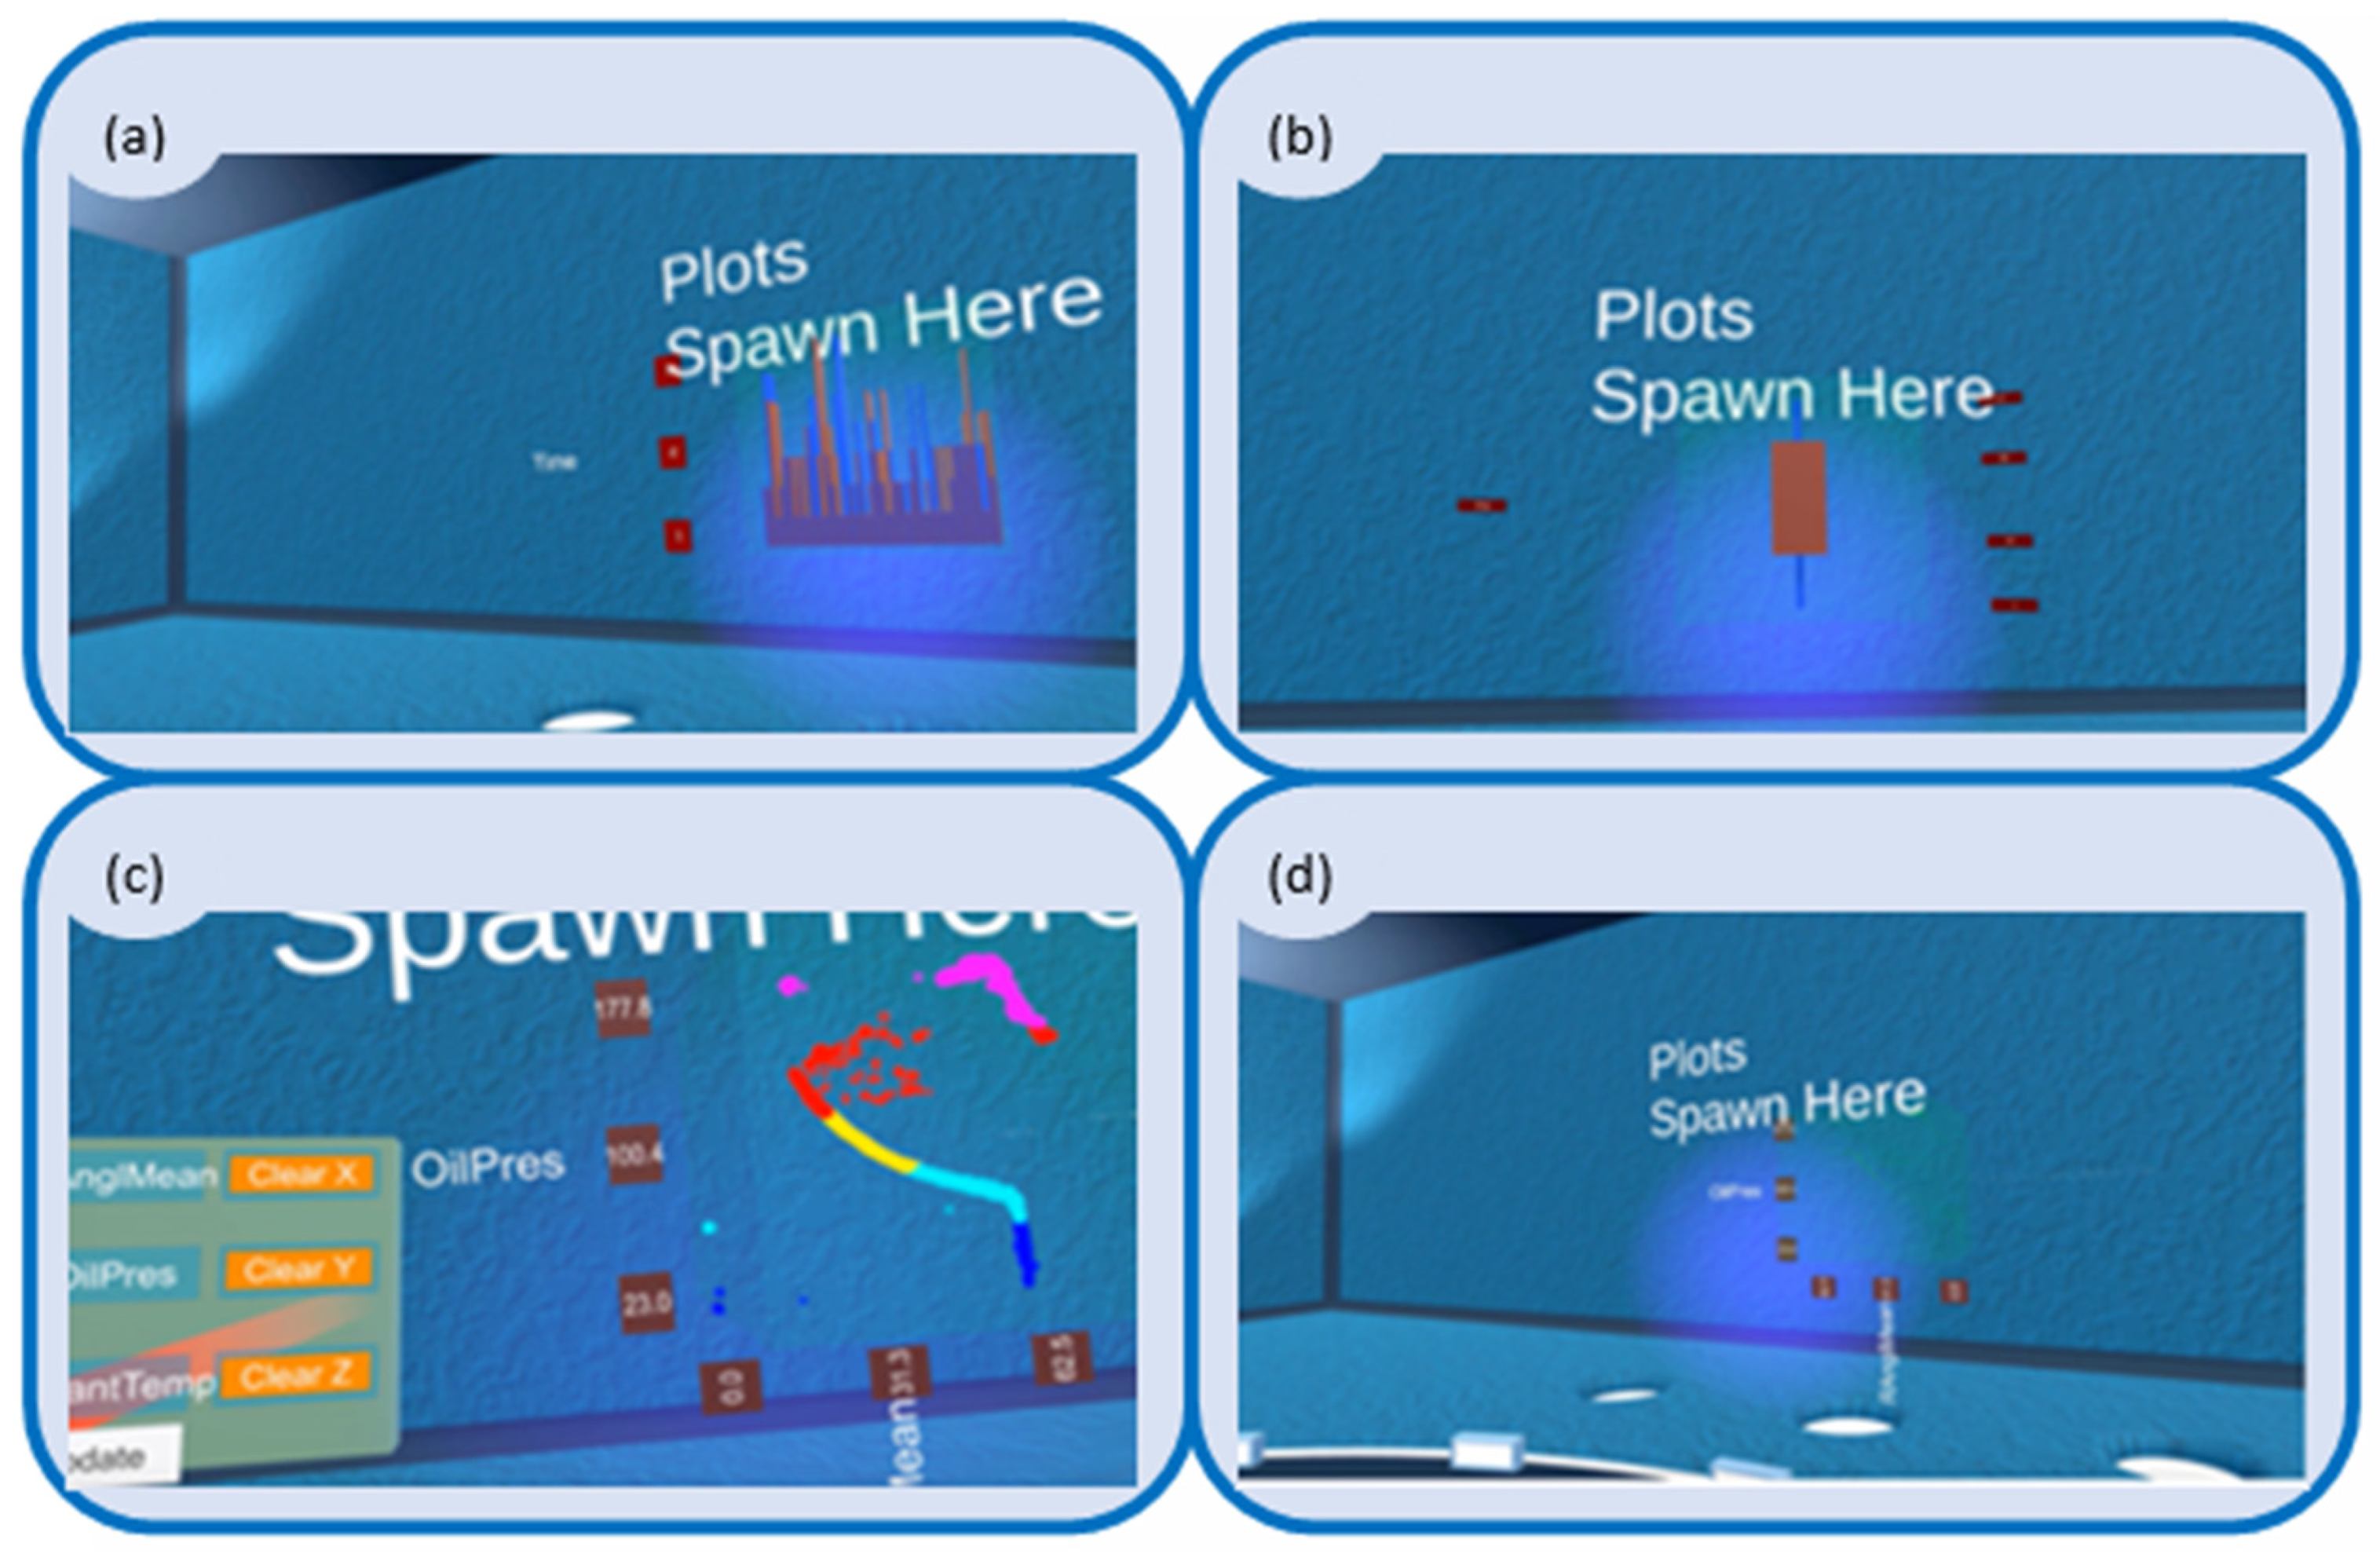
Figure 6). Swiping over to the desired file creates a virtual object with a set of arguments assigned to it. Mainly, the generated virtual object represents the selected file (Figure 7e). The user presses the A button again and swipes to select the “AES” element, which generates another virtual object in the scene (Figure 7g). AES stands for aesthetics and helps to assign different data attributes to desired axes (Figure 7h). Depending on the type and dimension of visualization, users can assign attributes accordingly. For instance, if users are interested in visualizing a 3D scatterplot of the data, they can assign the desired attributes to three axes. On the other hand, if they wish to generate a 2D line plot, they can assign two data attributes to the x and y axis, leaving the third axis empty. Before assigning any attributes, users should create a connection between the two generated virtual objects by holding them with virtual hands and bringing them into contact. The contact between the two objects is marked by a red band (
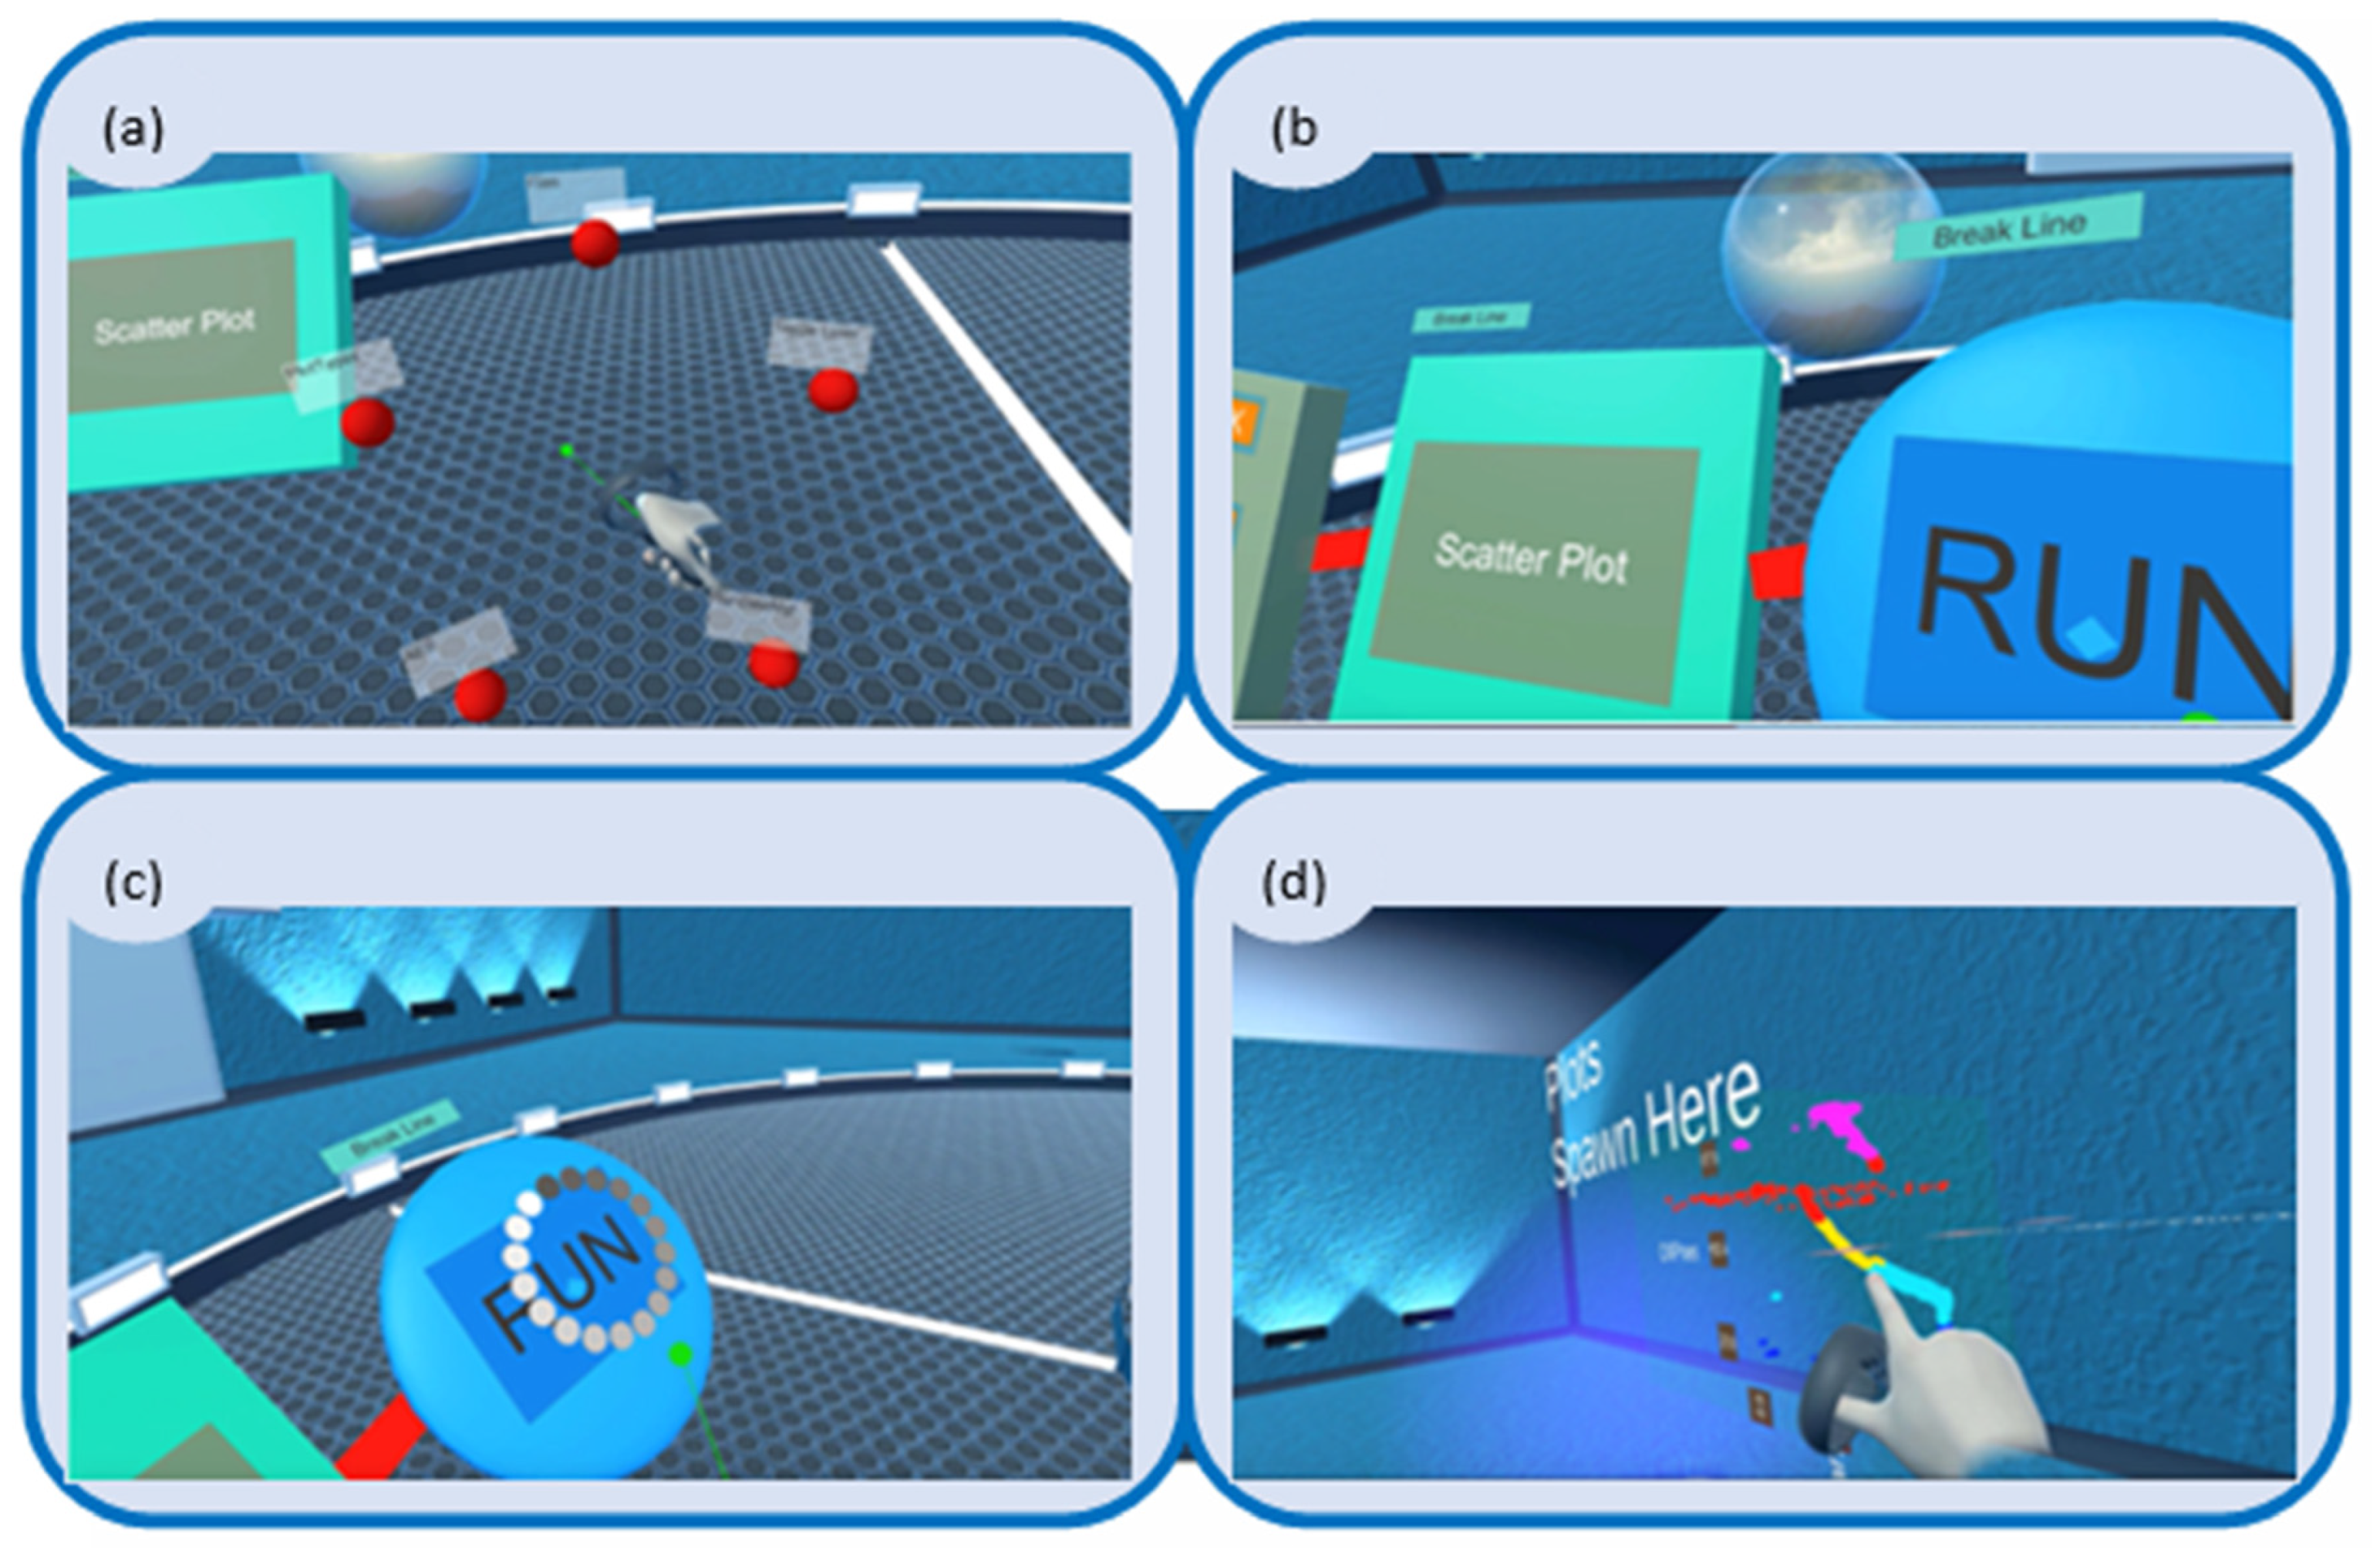
Figure 7j). Combining the two objects feeds the “AES”-generated virtual objects with chosen data attributes, allowing users to make their selection. Users then press the A button and swipe to the “Plot Type” element, bringing up another nested menu that holds the plot types (Figure 7j).
The combination of these virtual objects creates a set of arguments that are sent to R through a C# script. The data calculation is performed in R on a thread that is separate from the virtual environment, which allows users to move around when data crunching is happening, without any frame rate loss. To confirm this configuration and send the arguments to R, users create one final object by swiping over to the “RunDataManager” element and clicking “Run” to execute (Figure 8). On the “RunDataManager” object, the loading circle indicates that R is performing the calculations needed to generate the underlying structure of the chosen plot (
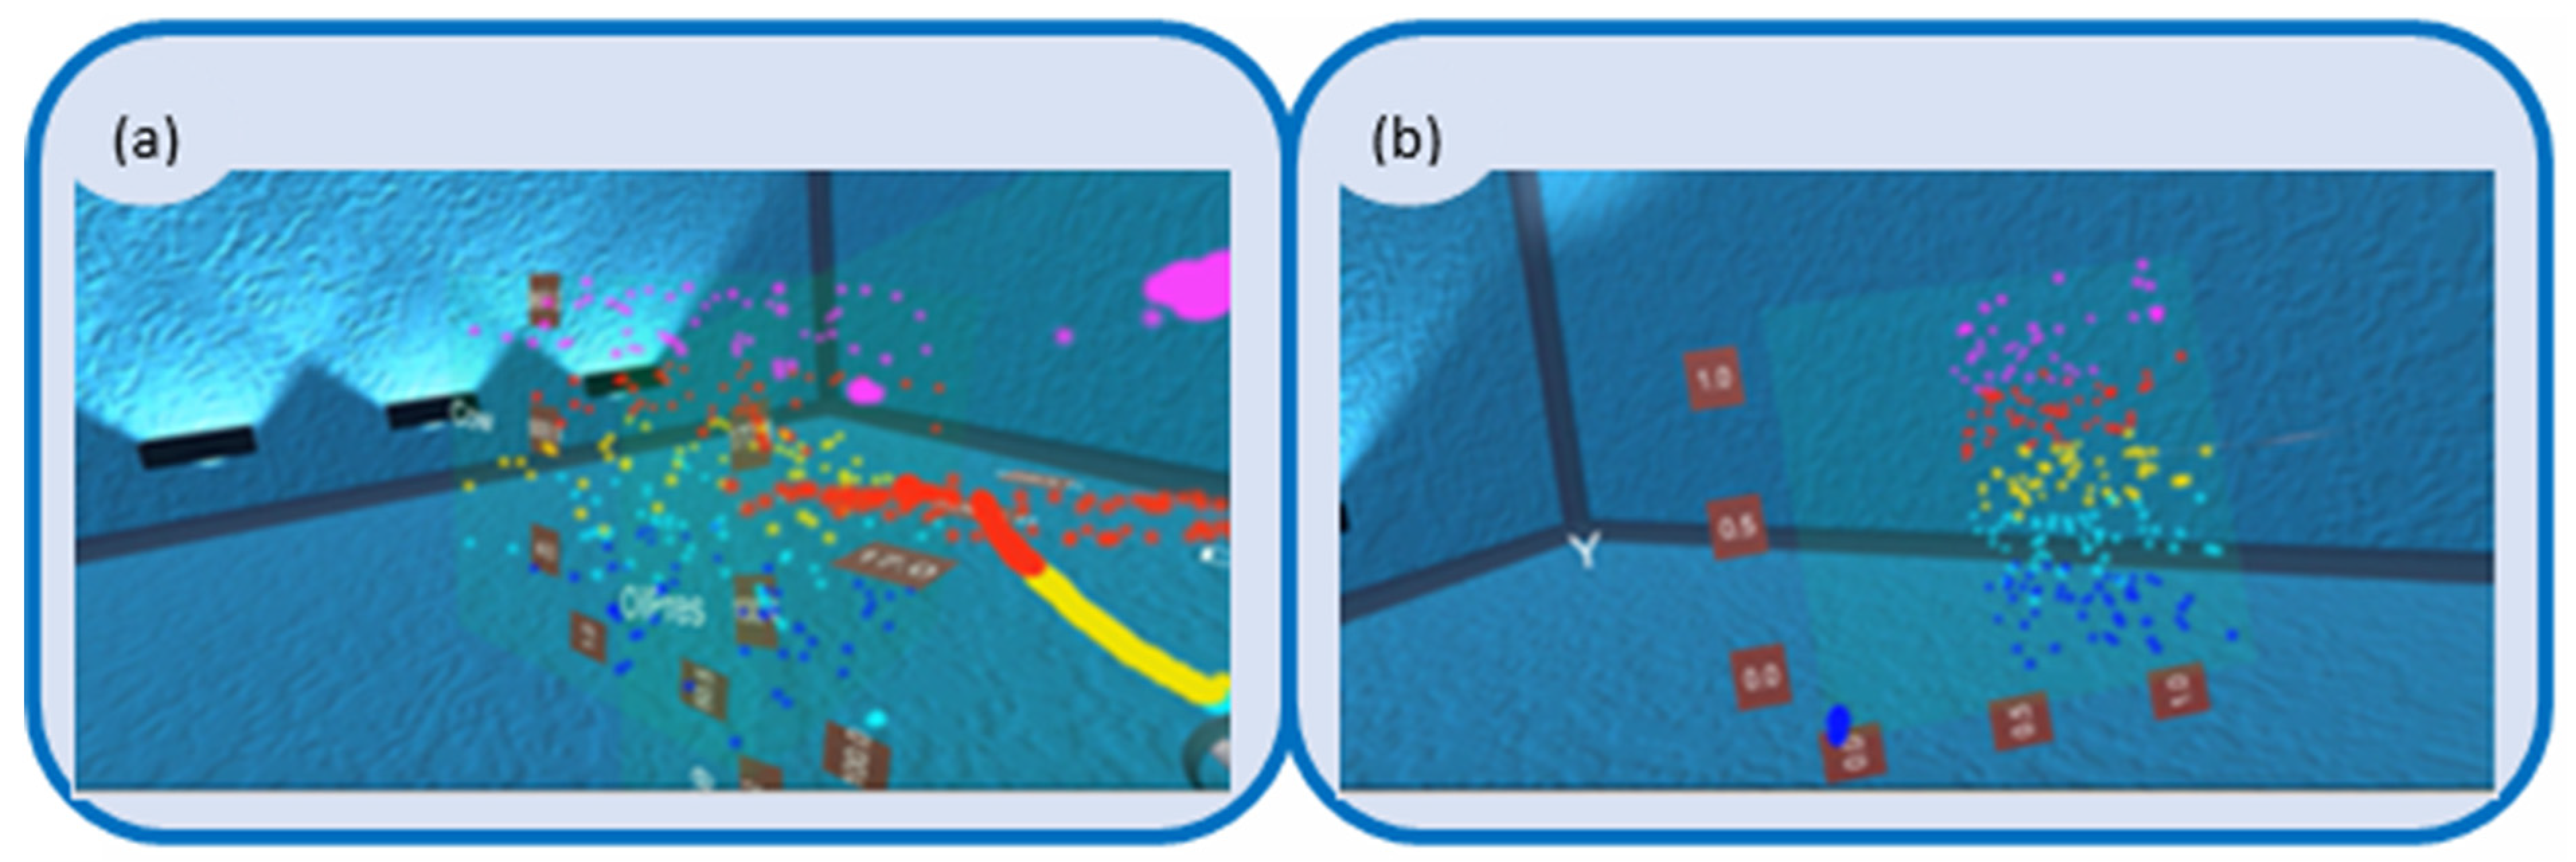
Figure 8). Once that file is generated by R, C# reads it in and creates a three-dimensional plot, as shown in Figure 8 and Figure 9.
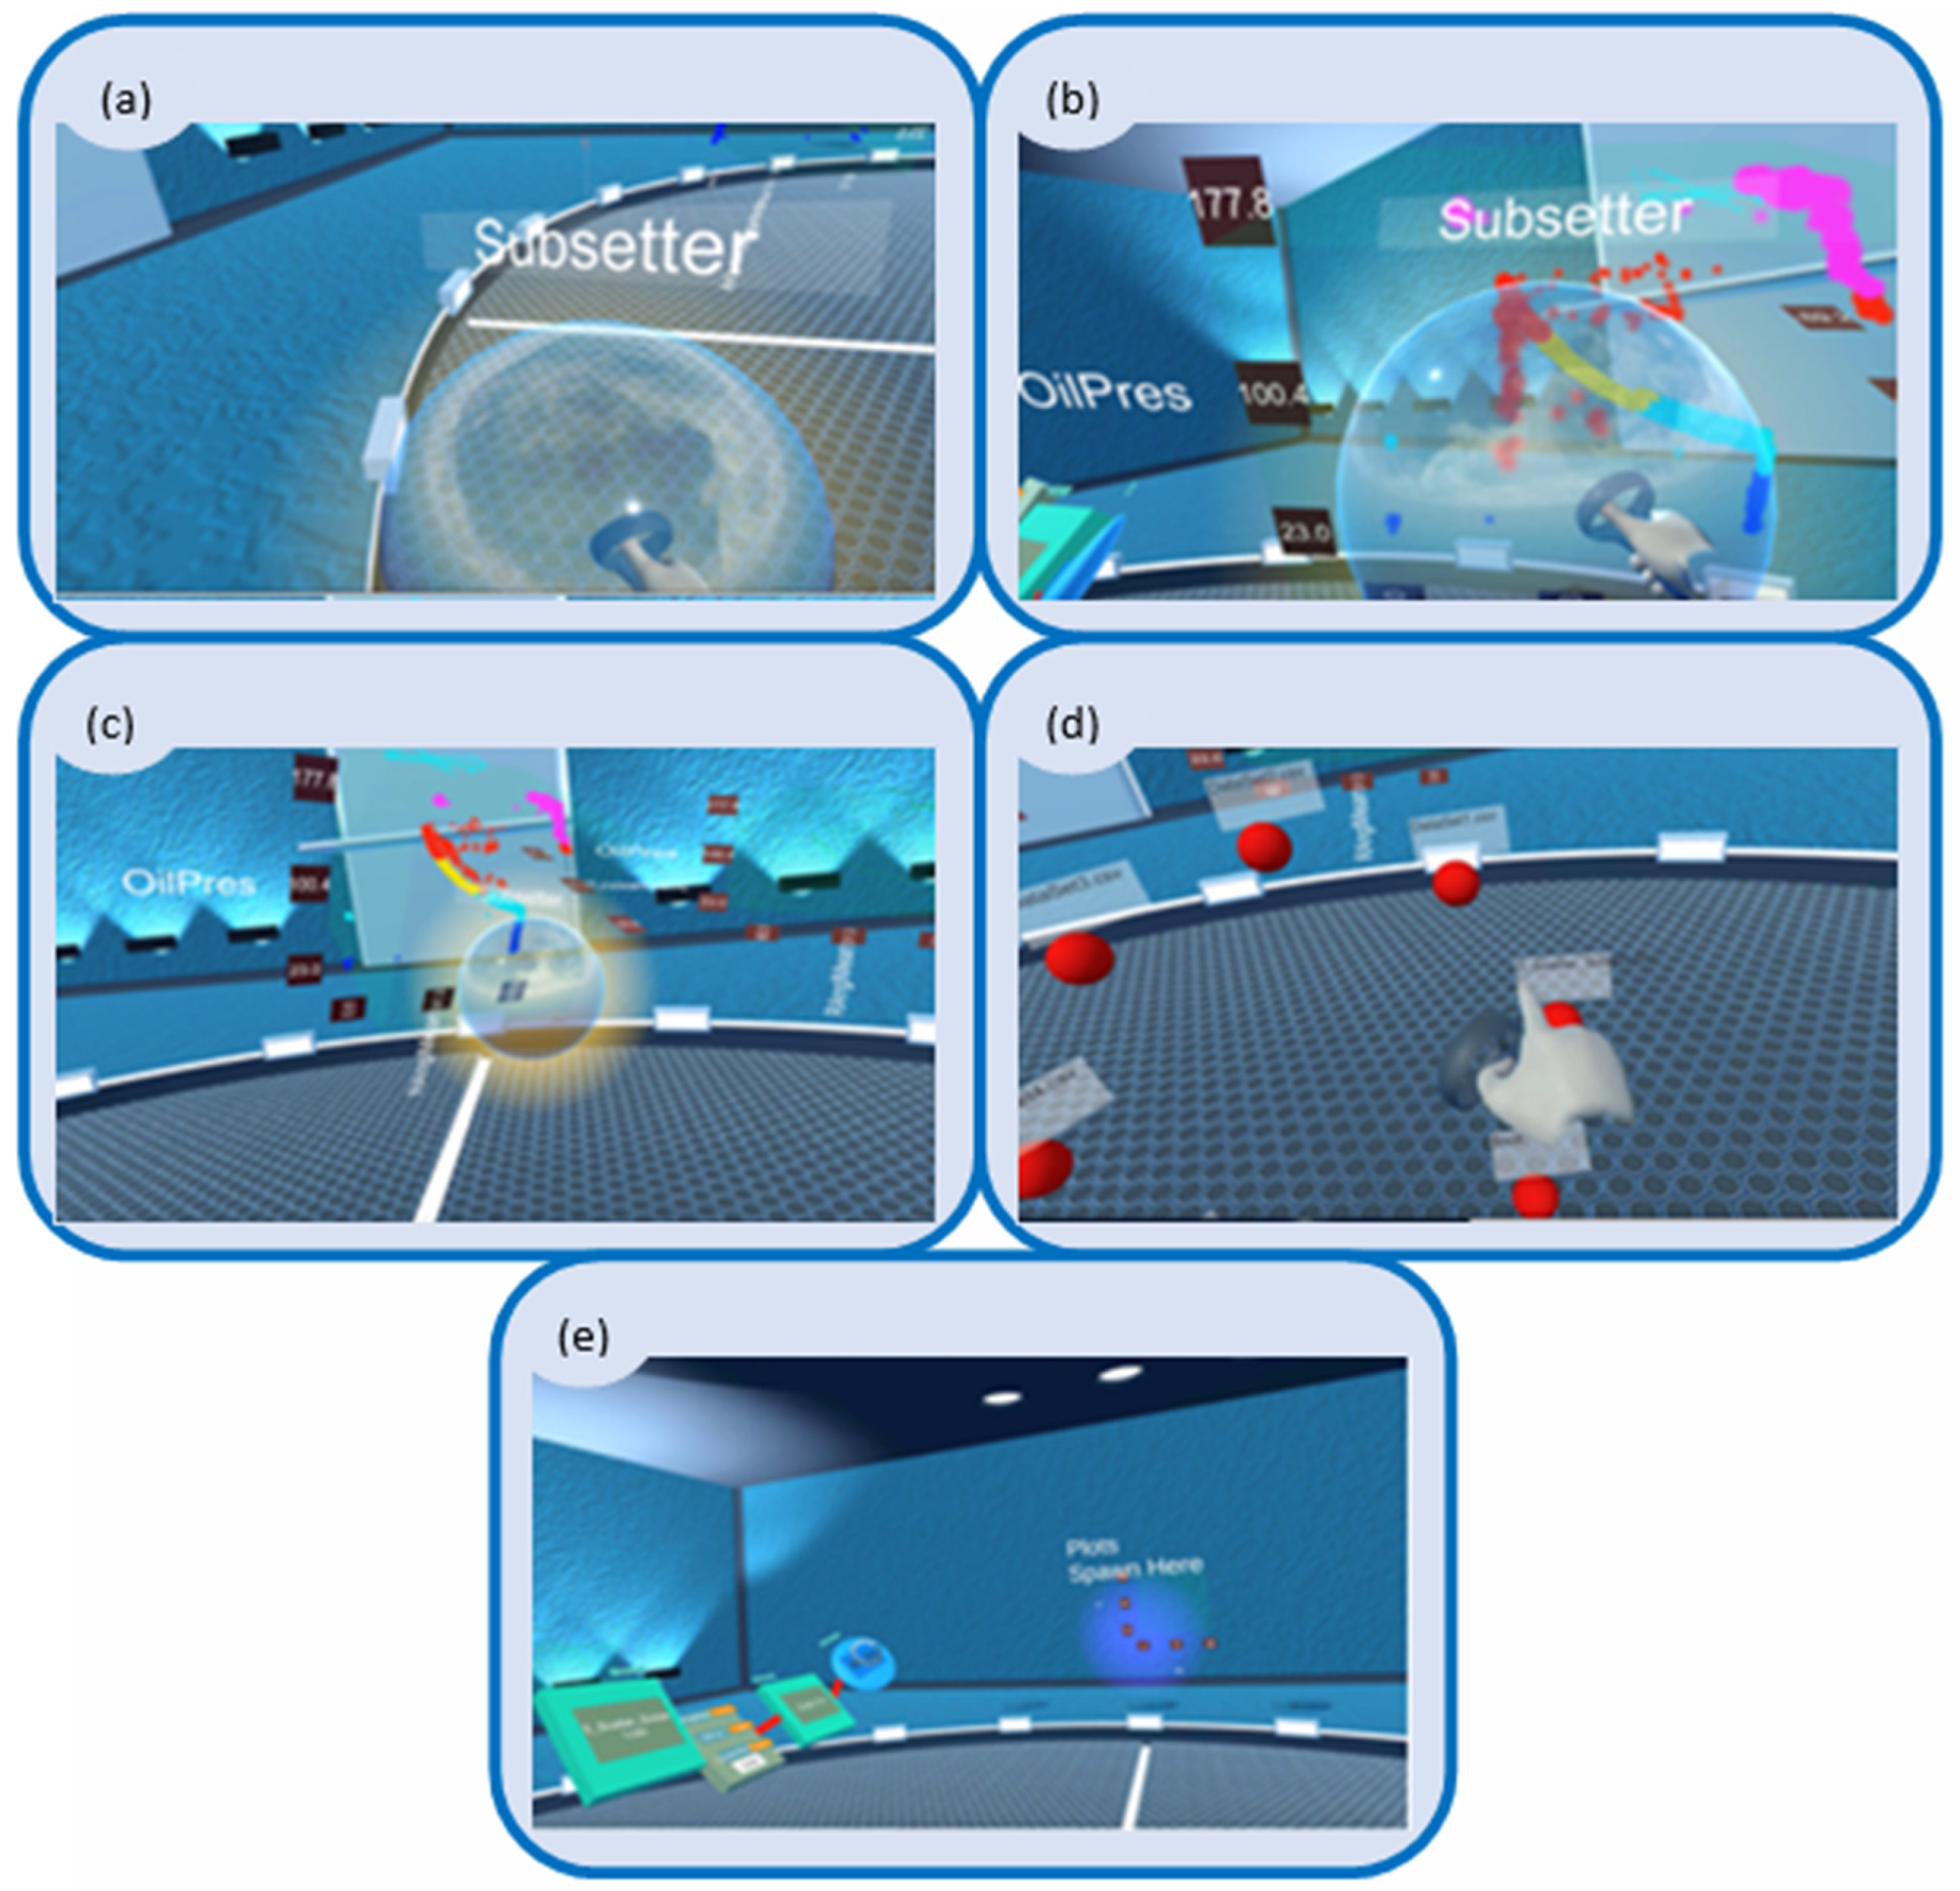
To subset data, users grab the “Lasso” sphere and bring it into contact with the visualization so that the points the users want to subset are inside the sphere (Figure 10). The sphere is a 3D scalable object that users can amplify or downsize to fit their desired points. The engine translates this information back to its backend to generate a file that contains the subset data only. The generated file is automatically stored in the IVEE Unity folder, and users can access it by simply pressing the A button and swiping over to the “Files” element. The nested folders in the “Files” element now have an additional folder that contains a portion of the original data that users selected. Users can now visualize the new dataset using other visualizations or create another subset. The action of simply grabbing the “Lasso” sphere and bringing it into close contact with the desired portion of data makes the sub-setting task much easier and more intuitive than in any other tool. Users do not have to worry about how they can subset data; instead, they subset intuitively within the virtual environment. Cleary, making analytics intuitive helps save time and effort when completing tasks.
The merge feature is as easy to perform as the subset feature. If users generate another visualization, they can merge it with the first visualization by grabbing both and bringing them closer to one another. This instantly results in the creation of a combined plot with the two selected graphs on it (Figure 11). We envision including more features in the future to make IVEE the first fully interactive immersive space in the field of analytics.
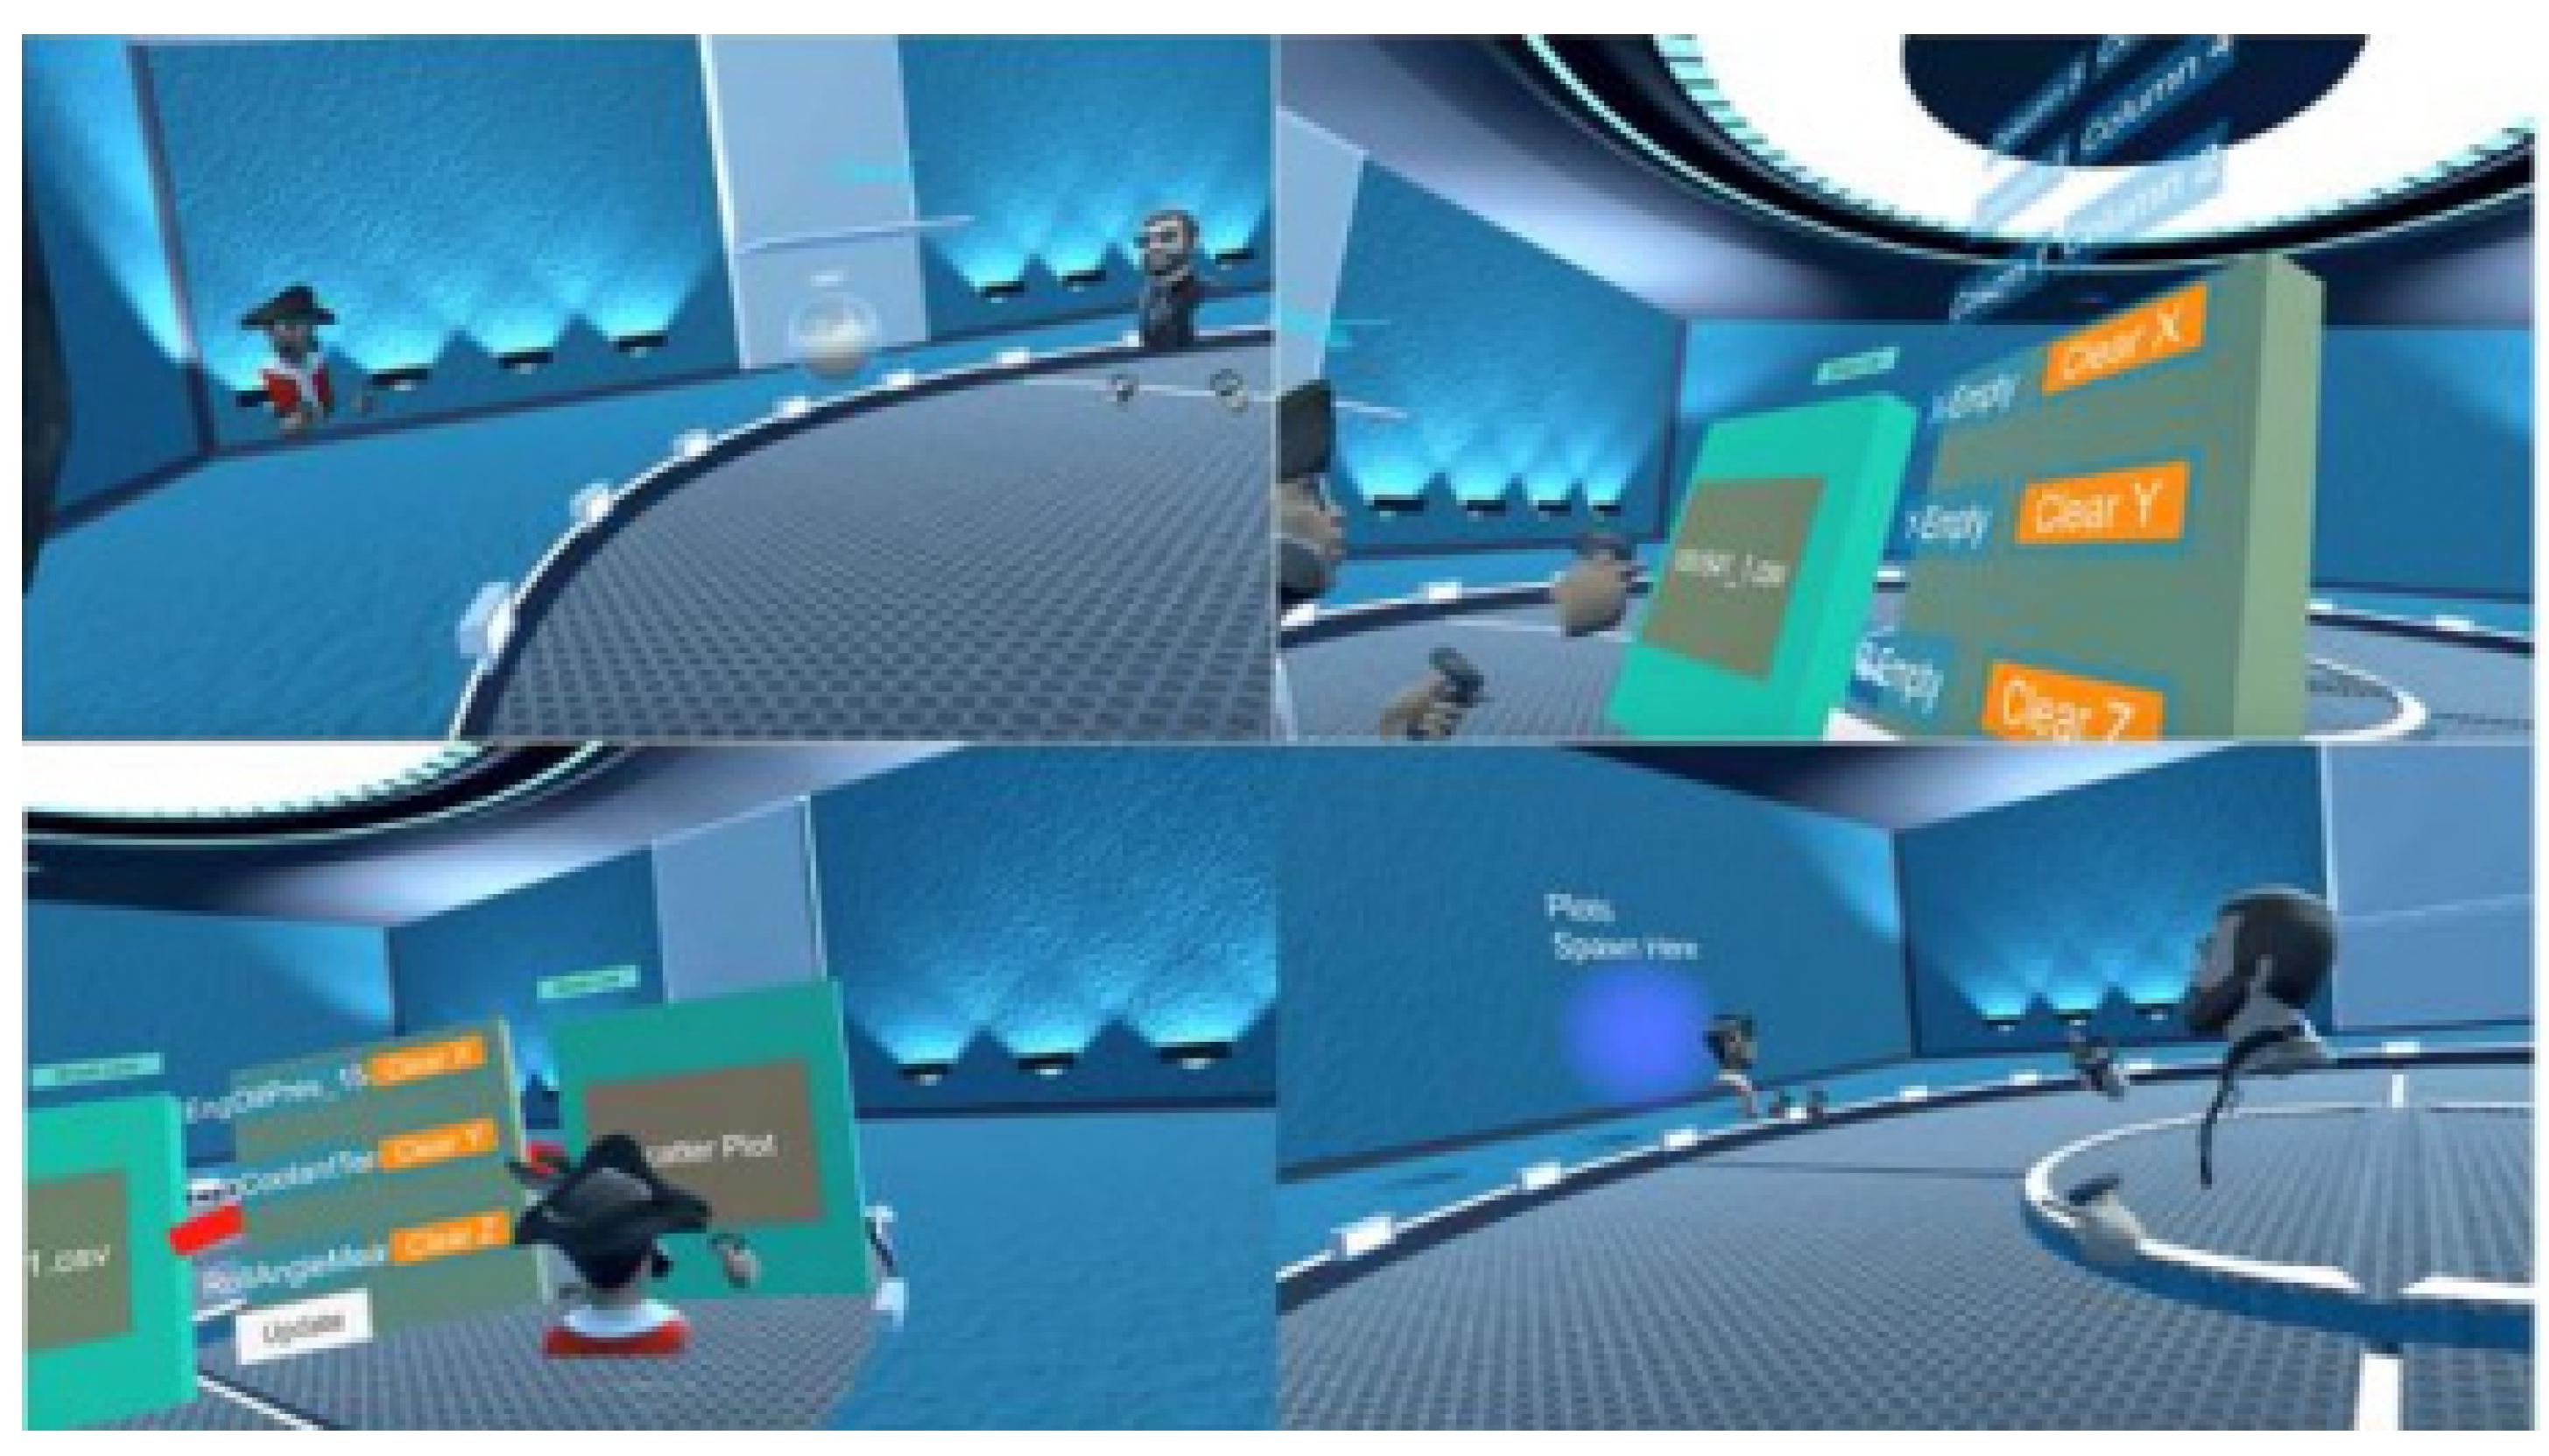
Figure 12 shows the collaboration between various individuals in the immersive space. This virtual collaboration can occur remotely (i.e., users do not have to be present in the same physical environment, and each user can use a separate computer, an Oculus set, and a separate network to connect with other users) or in the same physical space as long as each user has a computer and a headset. Once connected, each user impersonates an avatar (Figure 12) and can move freely around in the virtual space using the touch controllers. Users can talk to each other in the virtual space and interact with each other as if they were present physically in a real environment.
All individuals present in the scene can perform the tasks accommodated by this VR version, while others can witness the work instantly as if they were there. In addition, the individuals present in the virtual scene can interact with each other’s work and perform further analytics on it as if they are all present in a real-world setting. These individuals can communicate with each other through both gestures and audio.
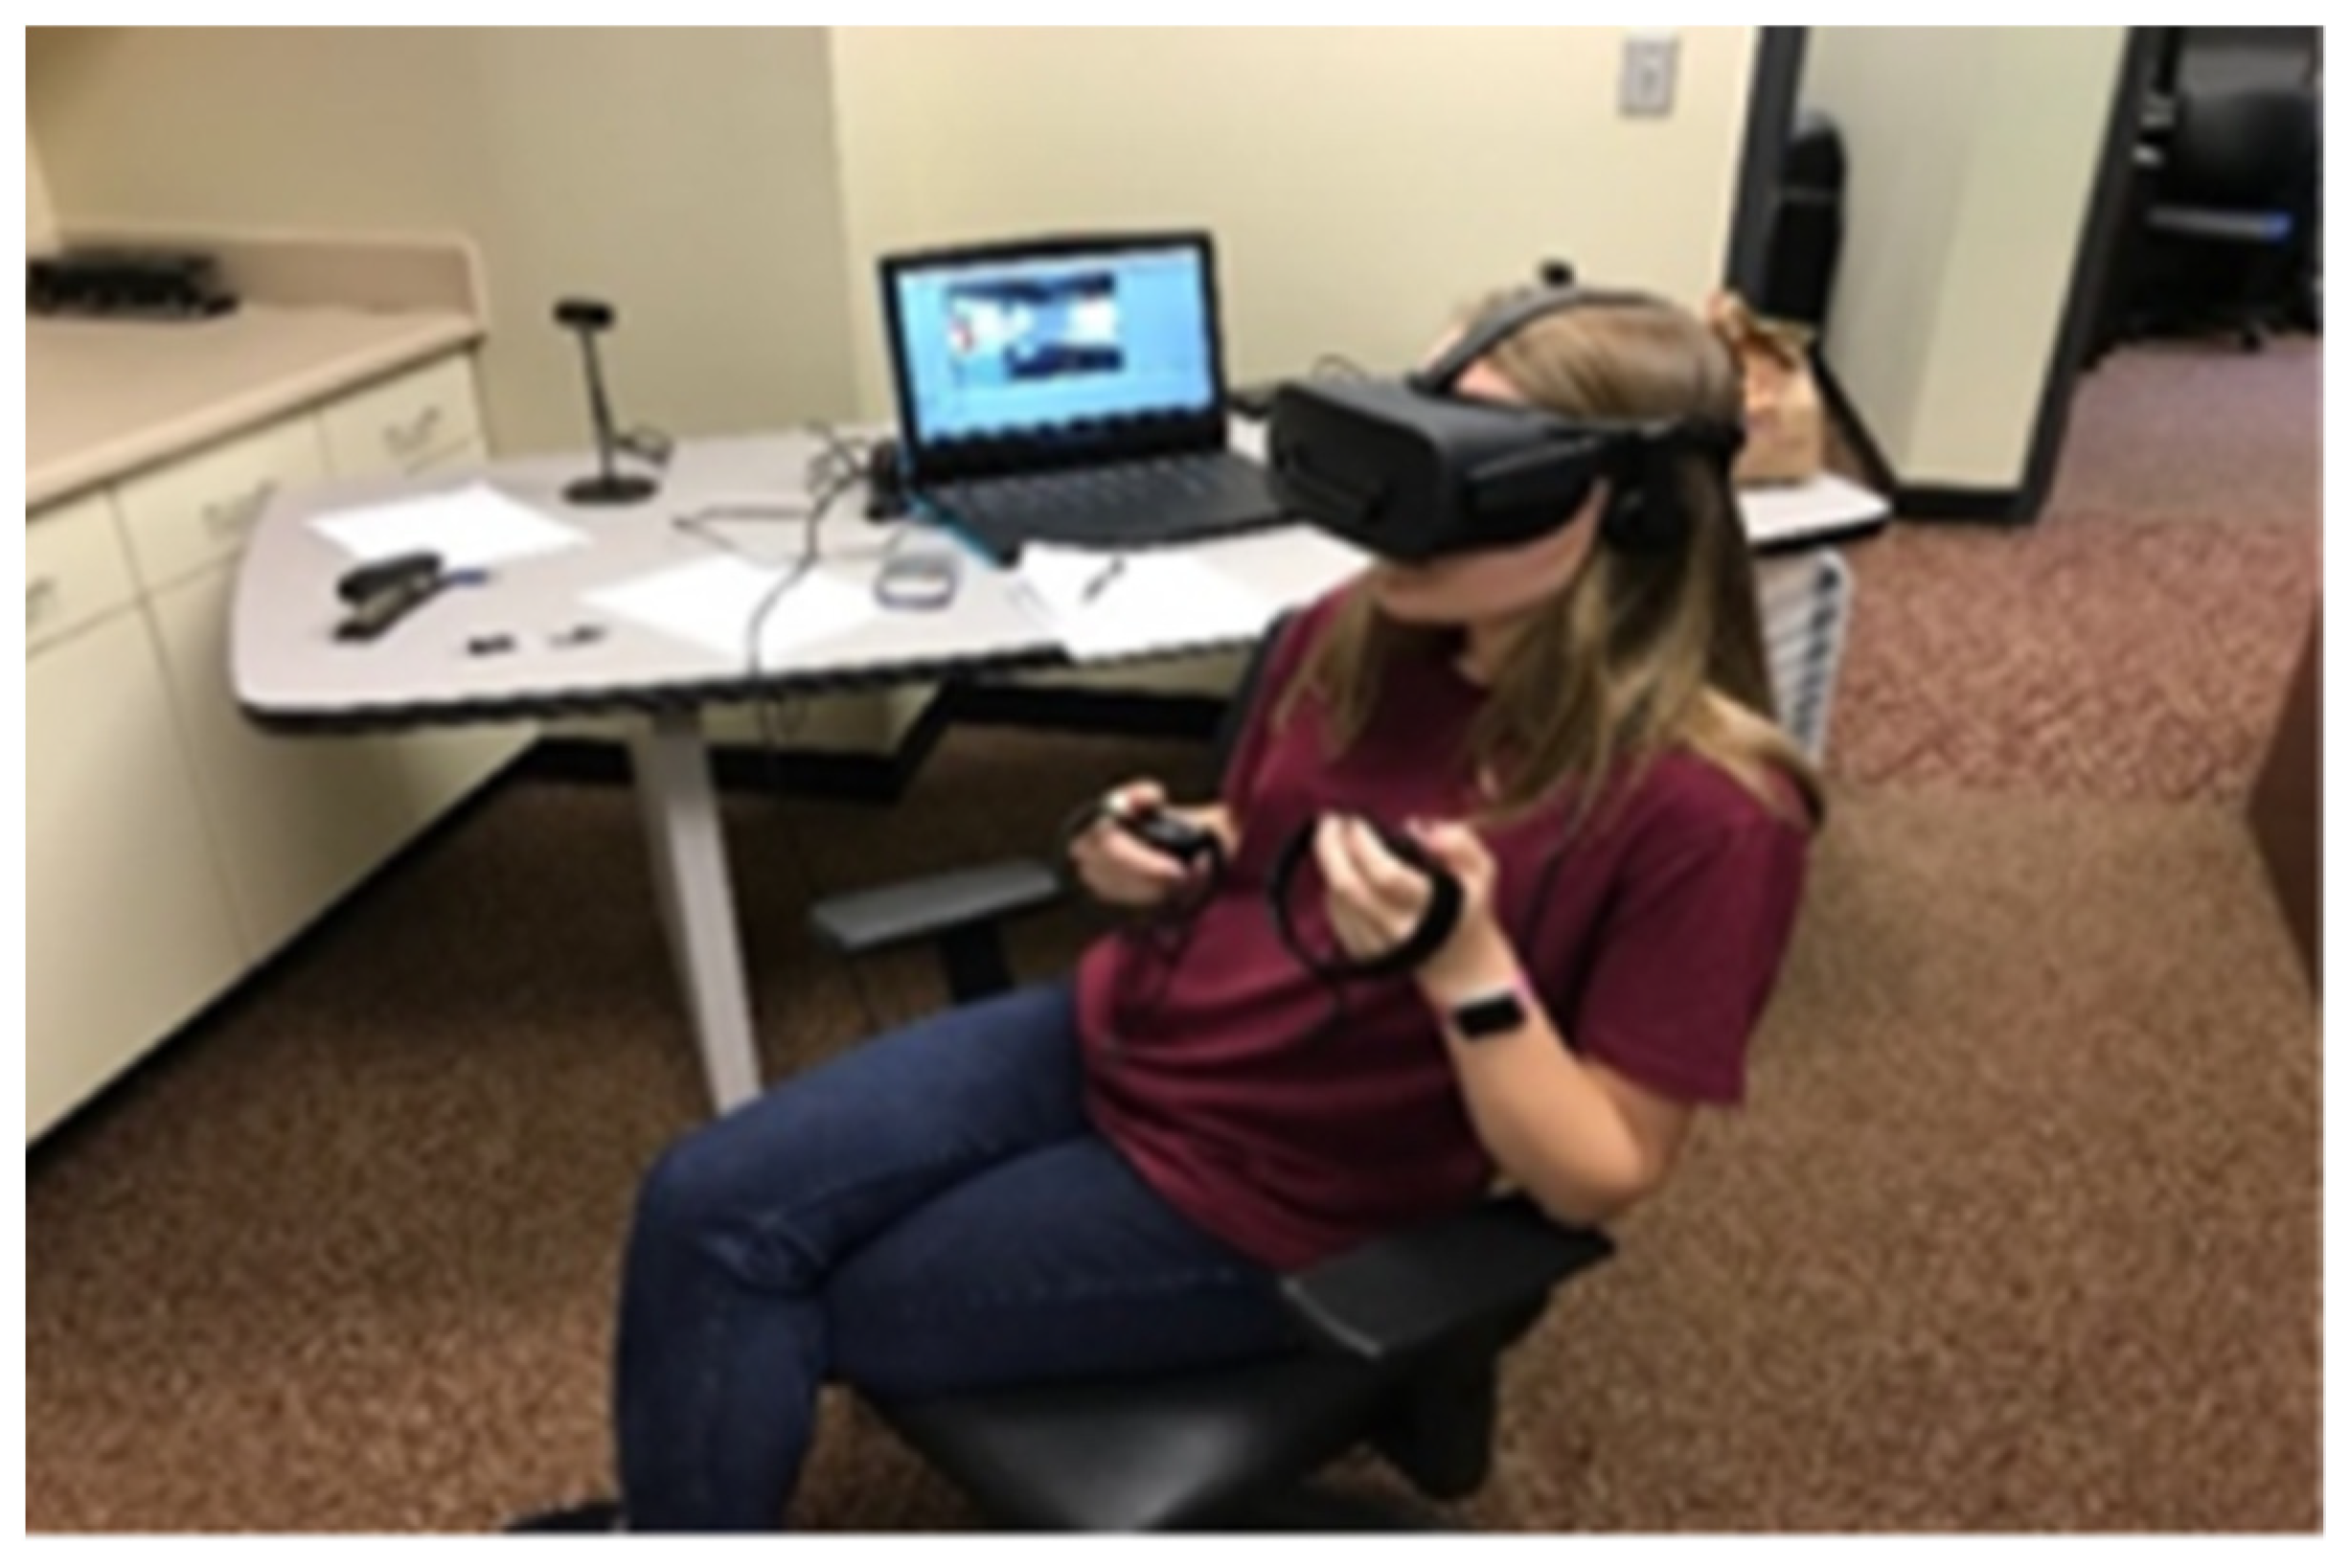
2.6. Study

This work intends to present a new tool to the IA field with features to facilitate the work of analysts. A pilot study was conducted, and a task-based questionnaire was developed and was given to participants to measure the time it takes them to perform these tasks to assess the performance of the developed VR engine. The task-based questionnaire was developed for assessing the tasks developed within IVEE, consisting of 21 questions. The goal was to measure the time it took participants to complete these tasks within IVEE and to compare it with non-immersive tools, notably R. These tasks fall under three main categories: (1) create a visualization, (2) subset data, and (3) merge data. The first category (create a visualization) comprises 16 questions divided between the four types of visualizations supported by IVEE. Hence, participants were asked to generate the same type of visualization four times. For the second category (subset data), participants were asked to subset the data three times and then merge it twice for the third category (merge data). Participants were first asked to complete tasks using R. Then, they were moved to a VR setting to complete the same tasks within IVEE. To avoid bias, researchers were not allowed to share the goal of the experiment with the participants. Furthermore, the way in which questions were to be answered completely differed in these settings (e.g., R and IVEE)—R relied greatly on mouse–keyboard interactions and IVEE on natural interactions. This should help to minimize bias and generate statistically sound results.
A researcher was always present next to the participants to collect relevant data. To record the time spent on performing each task, the researcher used a timer that began timing either when a participant pressed the first letter using a keyboard in R or the A button in IVEE to generate a visualization, perform a subset analysis, or merge data. The researcher stopped the timer once the results were displayed on the computer screen in R or appeared in the IVEE virtual environment. It should be noted that—since R is a programming language—a cheat sheet of instructions was given to participants to allow them to complete the R phase of the experiment successfully. The sheet contained code lines from the R manual to instruct participants on how to use the system, and participants needed to make minor changes to the provided instructions when answering the questions. Most participants would not have been able to perform the assigned tasks in R without a cheat sheet. Consequently, the team would not have had enough data from the R environment to compare with the data from the IVEE environment. On the other hand, when using IVEE, participants did not have to type/know any code lines. Instead, they were asked to use their intuition when completing the assigned tasks. Overall, participants were asked to complete four tasks at one time, then to take a small break because the question list was lengthy.

2.6.1. Effectiveness Research Question

Since the focus of the study is to measure the amount of time it takes students to complete tasks assessing the effectiveness of the developed VR module, the research question is as follows:
  • Would IVEE affect the time it takes students to complete their tasks?

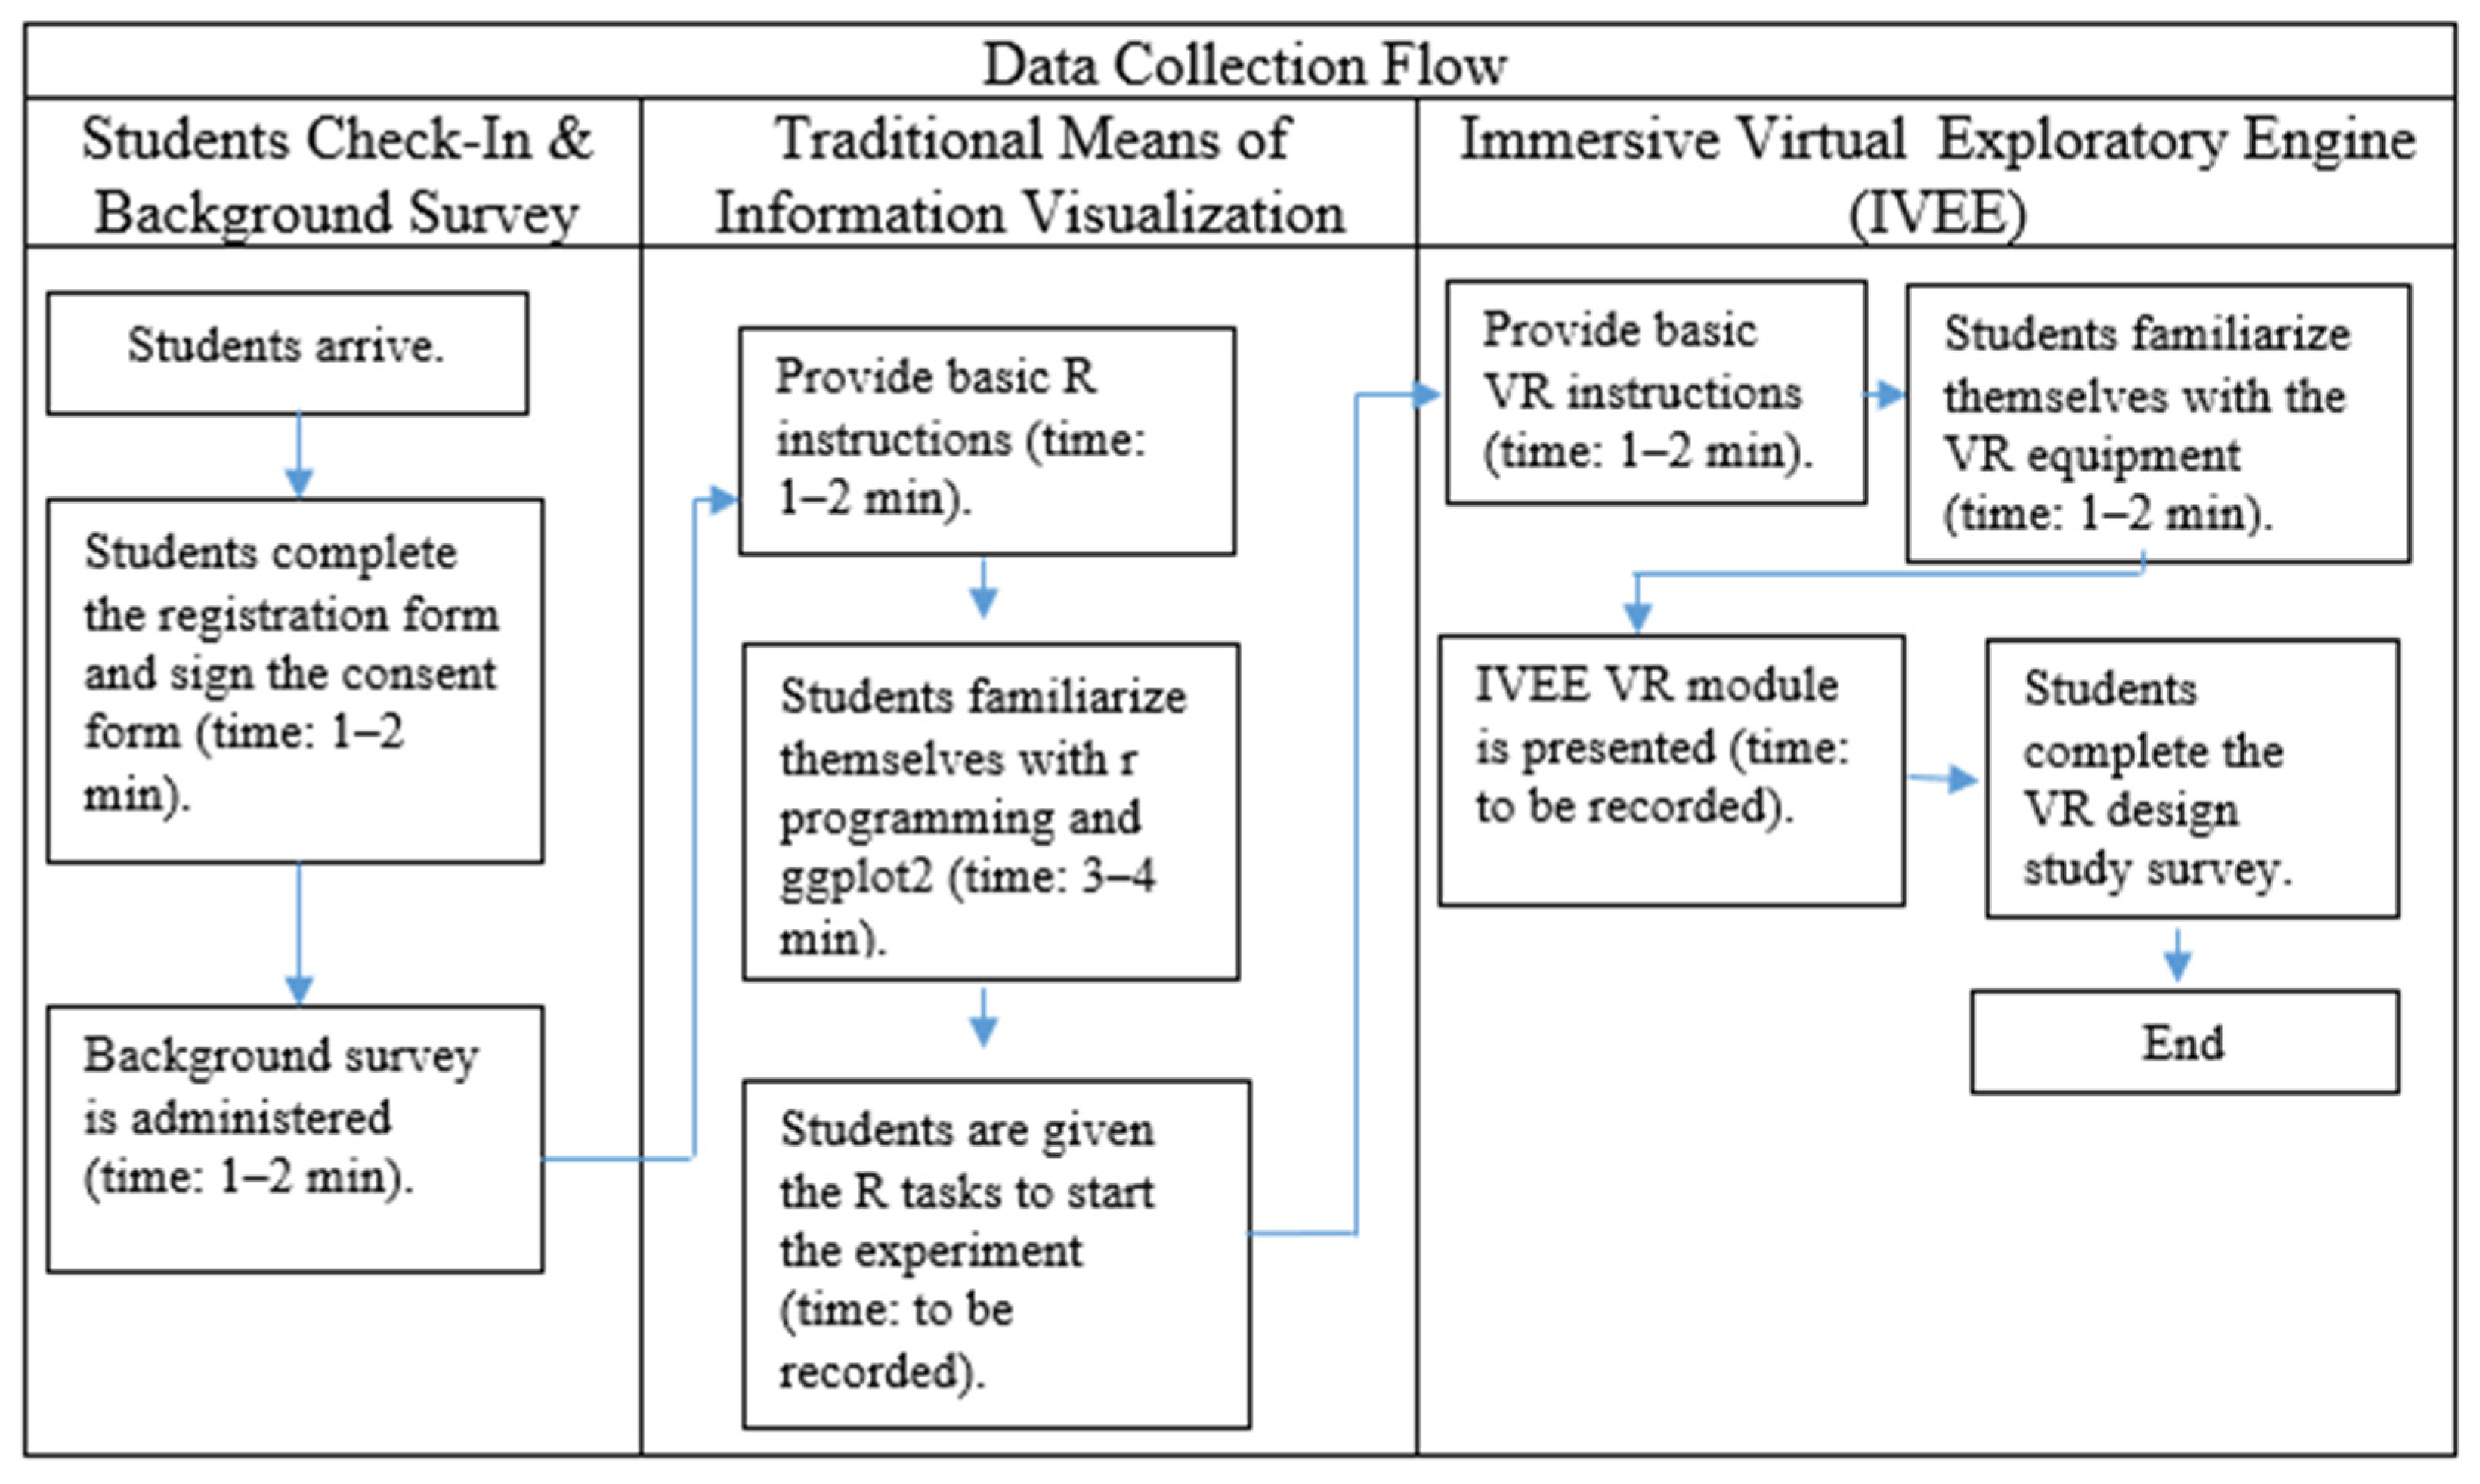
2.6.2. Data Collection

A pilot study was conducted with volunteers from Mississippi State University. The study involved 30 students to compare the performance of IVEE to existing traditional analytics tools—notably, R. The VR kit used in the experiment comprises the following parts: Oculus Rift S, touch controllers, and the Unity development platform. Before initiating the experiment, participating students were asked to wear the Oculus Rift S to familiarize themselves with the virtual environment. Figure 13 demonstrates the data collection process of the experiment.
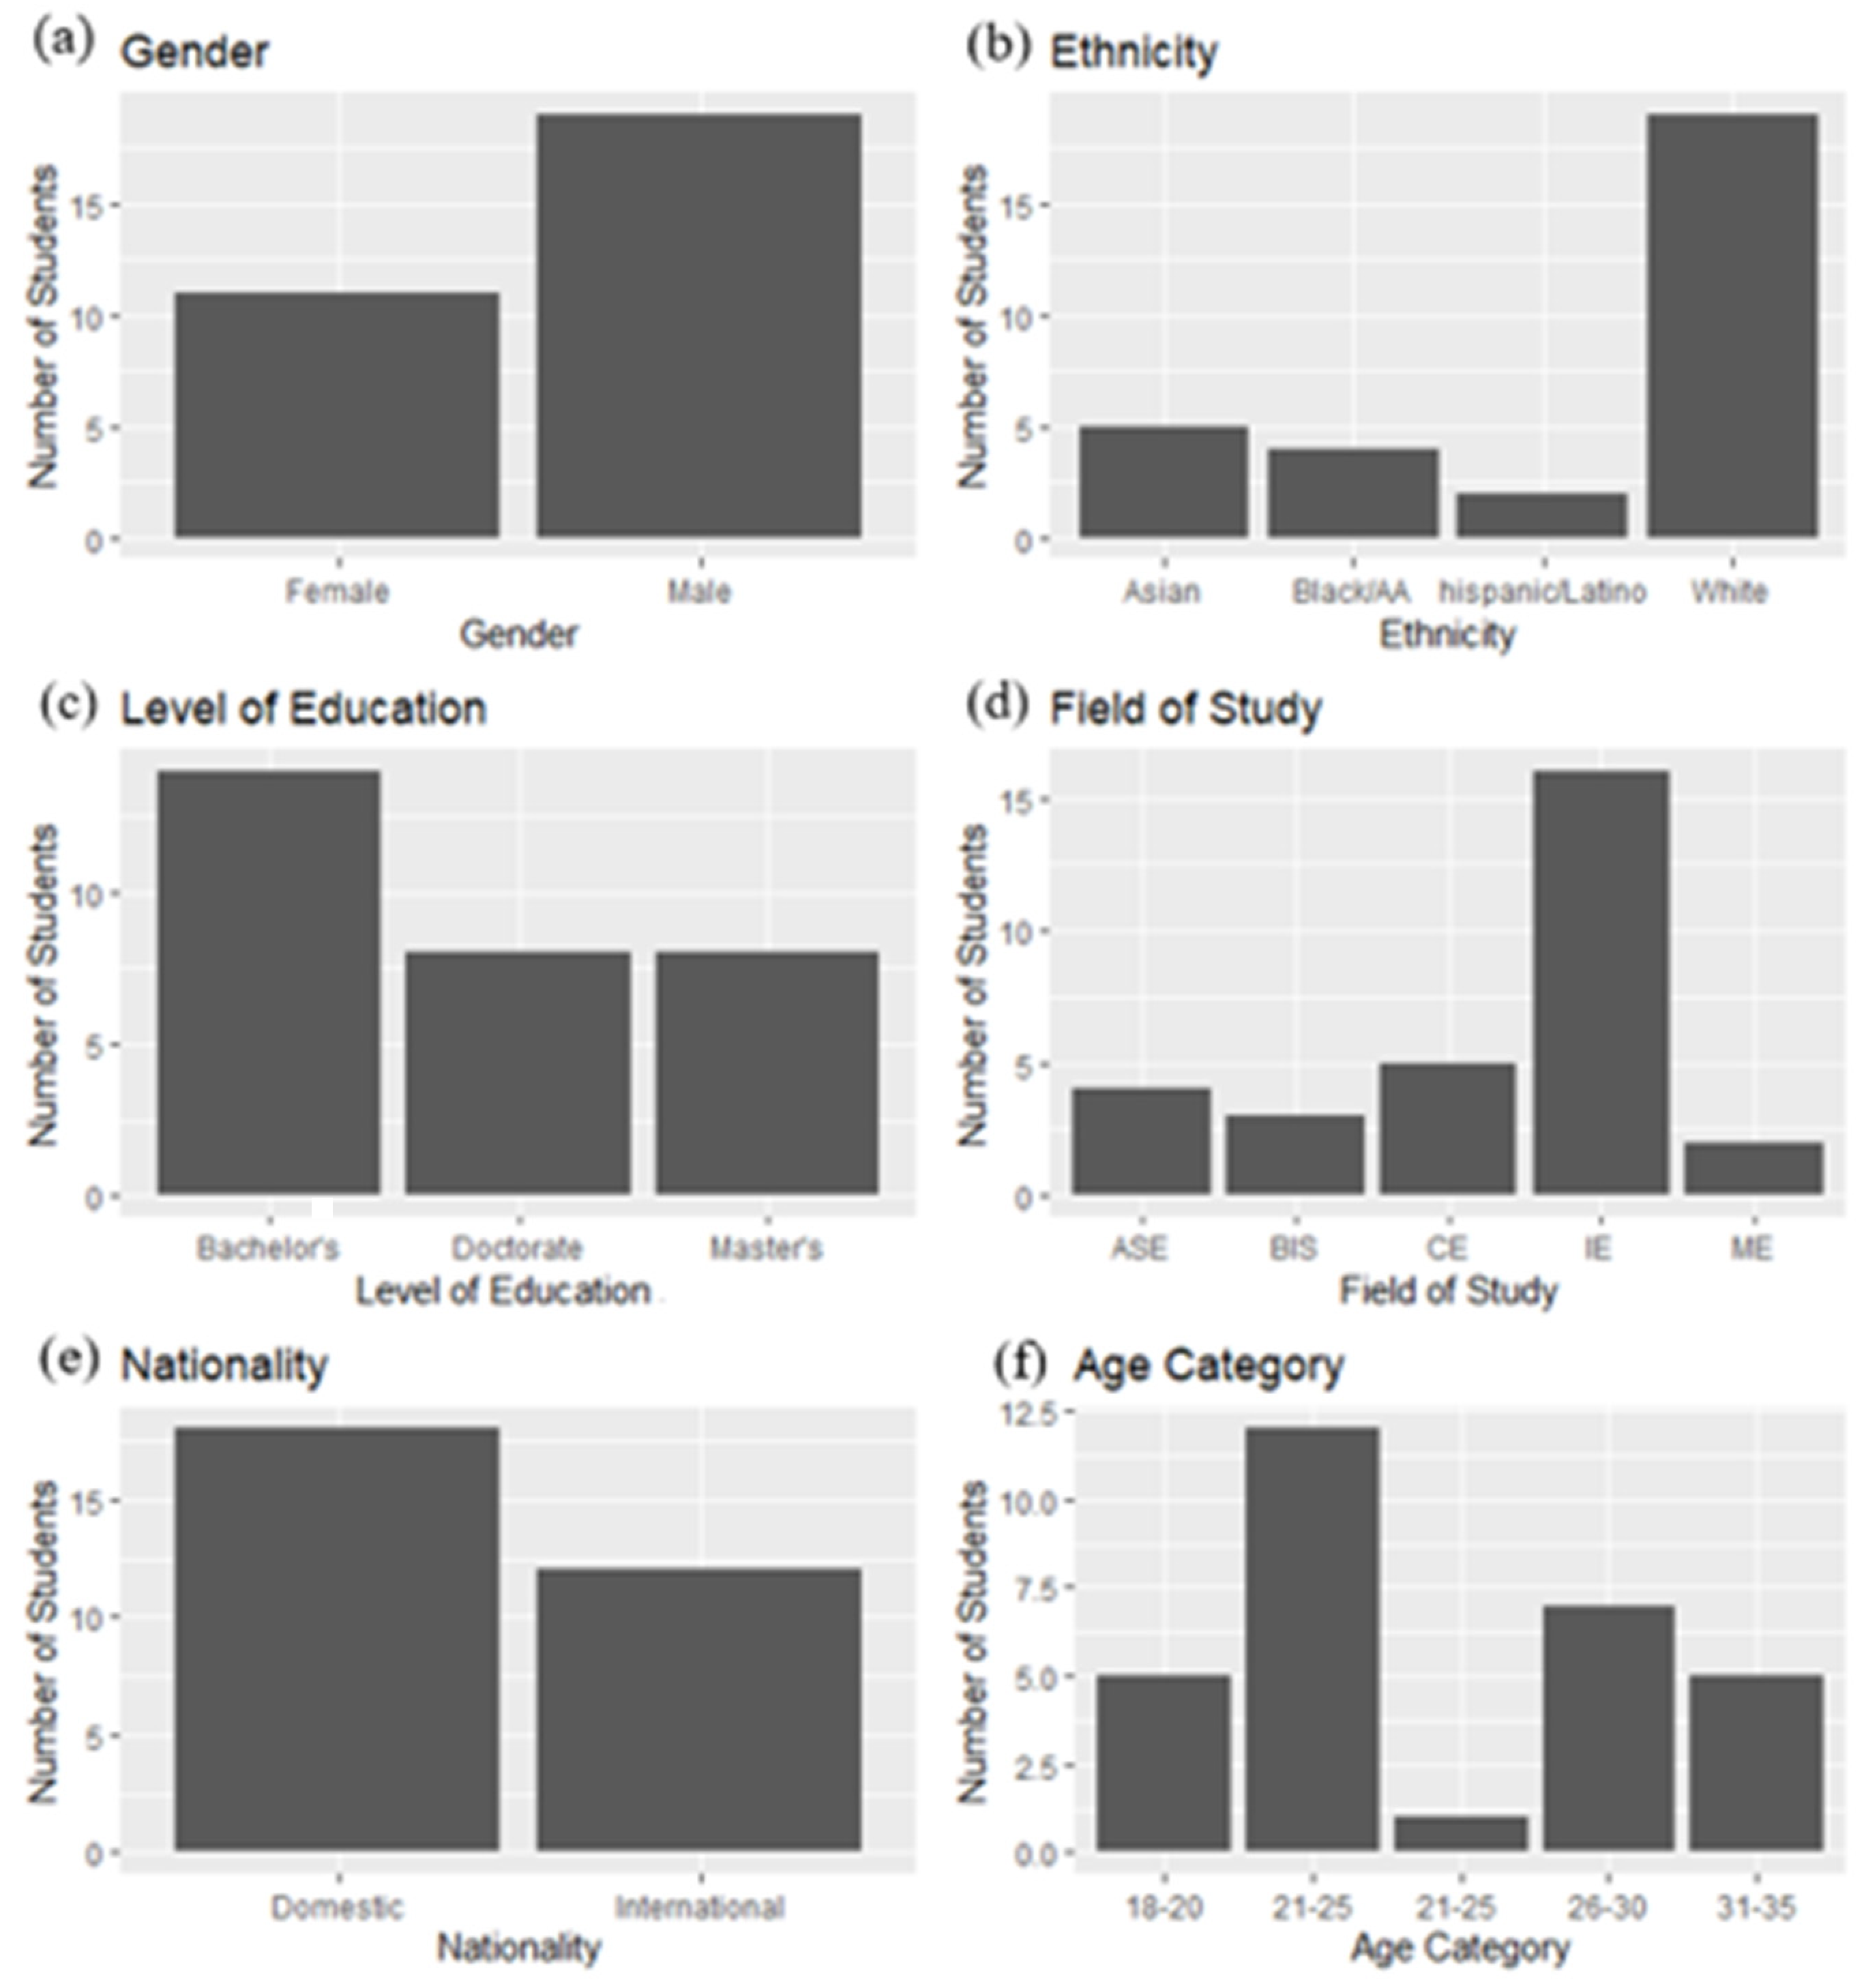
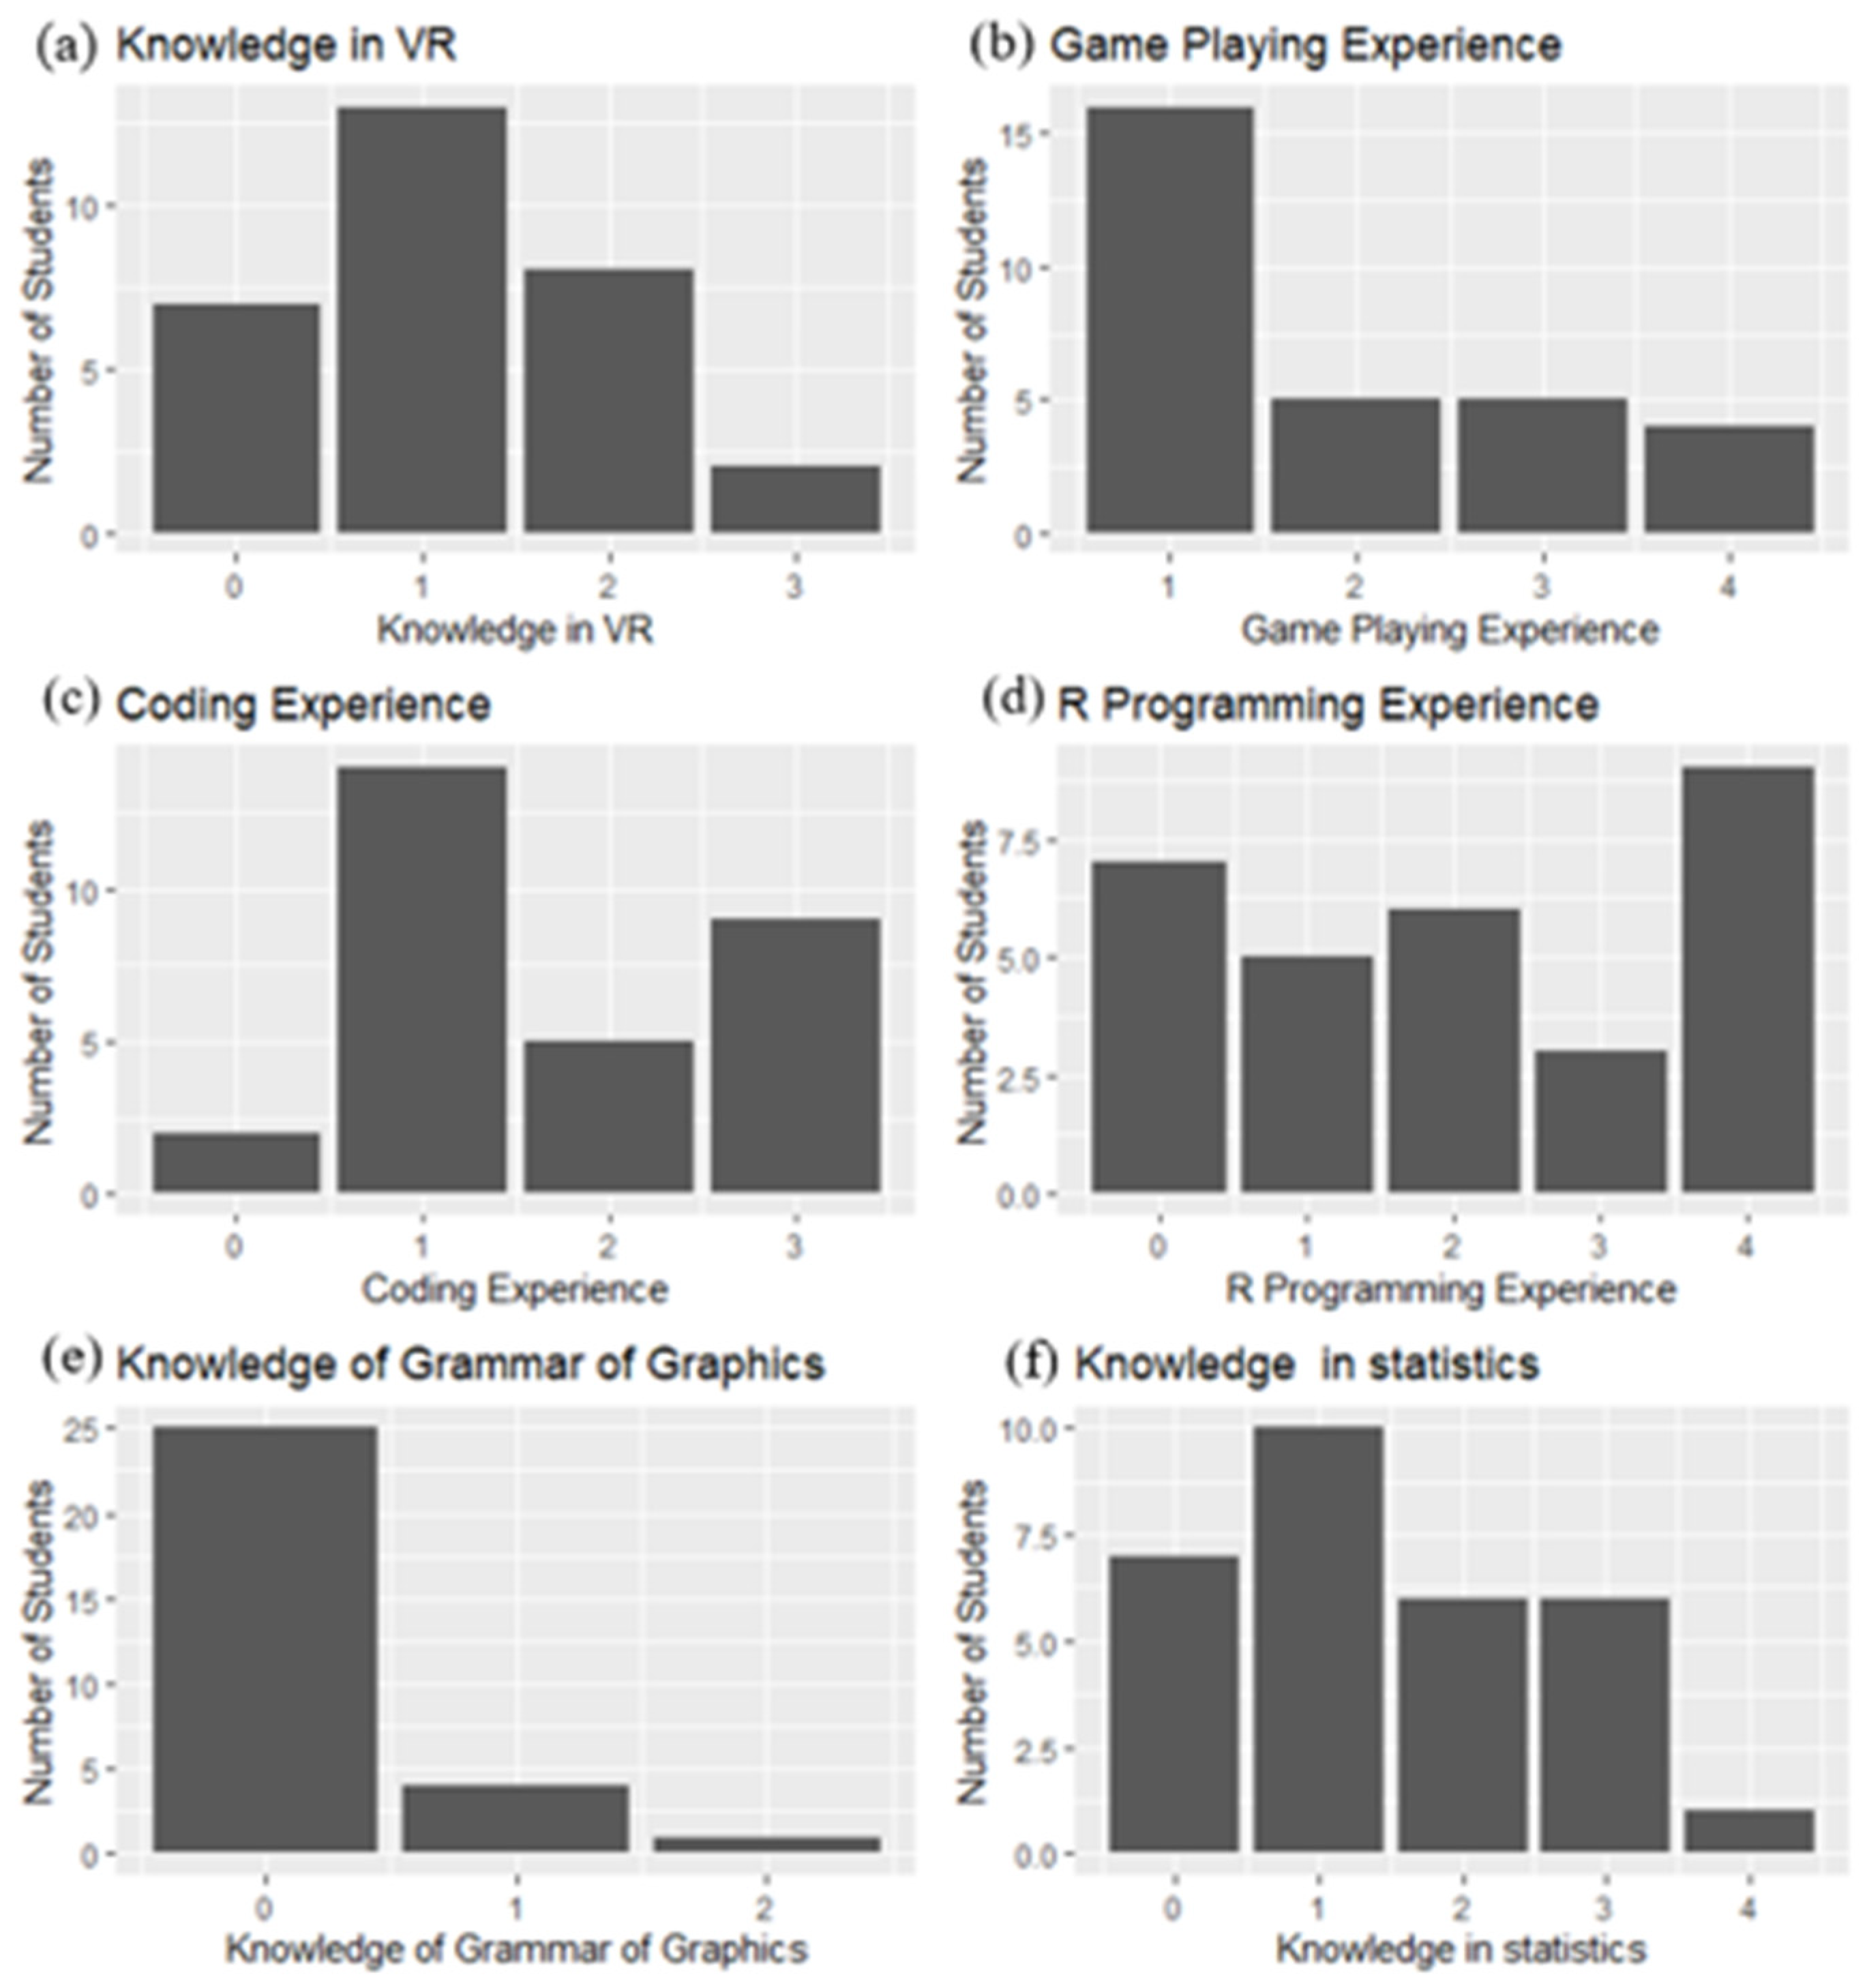
The gender demographics indicate that 63% of the participating students were male and 36% female. The majority of students were from engineering branches, while a few were from the business department. Data on demographic information, VR-related background, and coding experience were gathered. Overall, 93.3% of the participants had below-average knowledge of VR technologies, and 73.3% had below-average experience in gaming. The insufficient experience of the participants in these subjects decreased bias and contributed to the acquisition of a statically sound outcome. Of the total, 40% of the participants had above-average knowledge of R.

2.6.3. The Participant Role

Questionnaires were the primary data collection method used in this experiment. Student participants reported their responses by answering demographic questions and completing the tests presented to them in order to gather performance time-related data. Upon finishing the registration form, the participants were asked to complete a demographics survey, which consisted of questions regarding gender, ethnicity, education level, field of study, nationality, age category, VR knowledge, video game-playing experience, coding experience, R programming experience, and grammar of graphics theory knowledge.
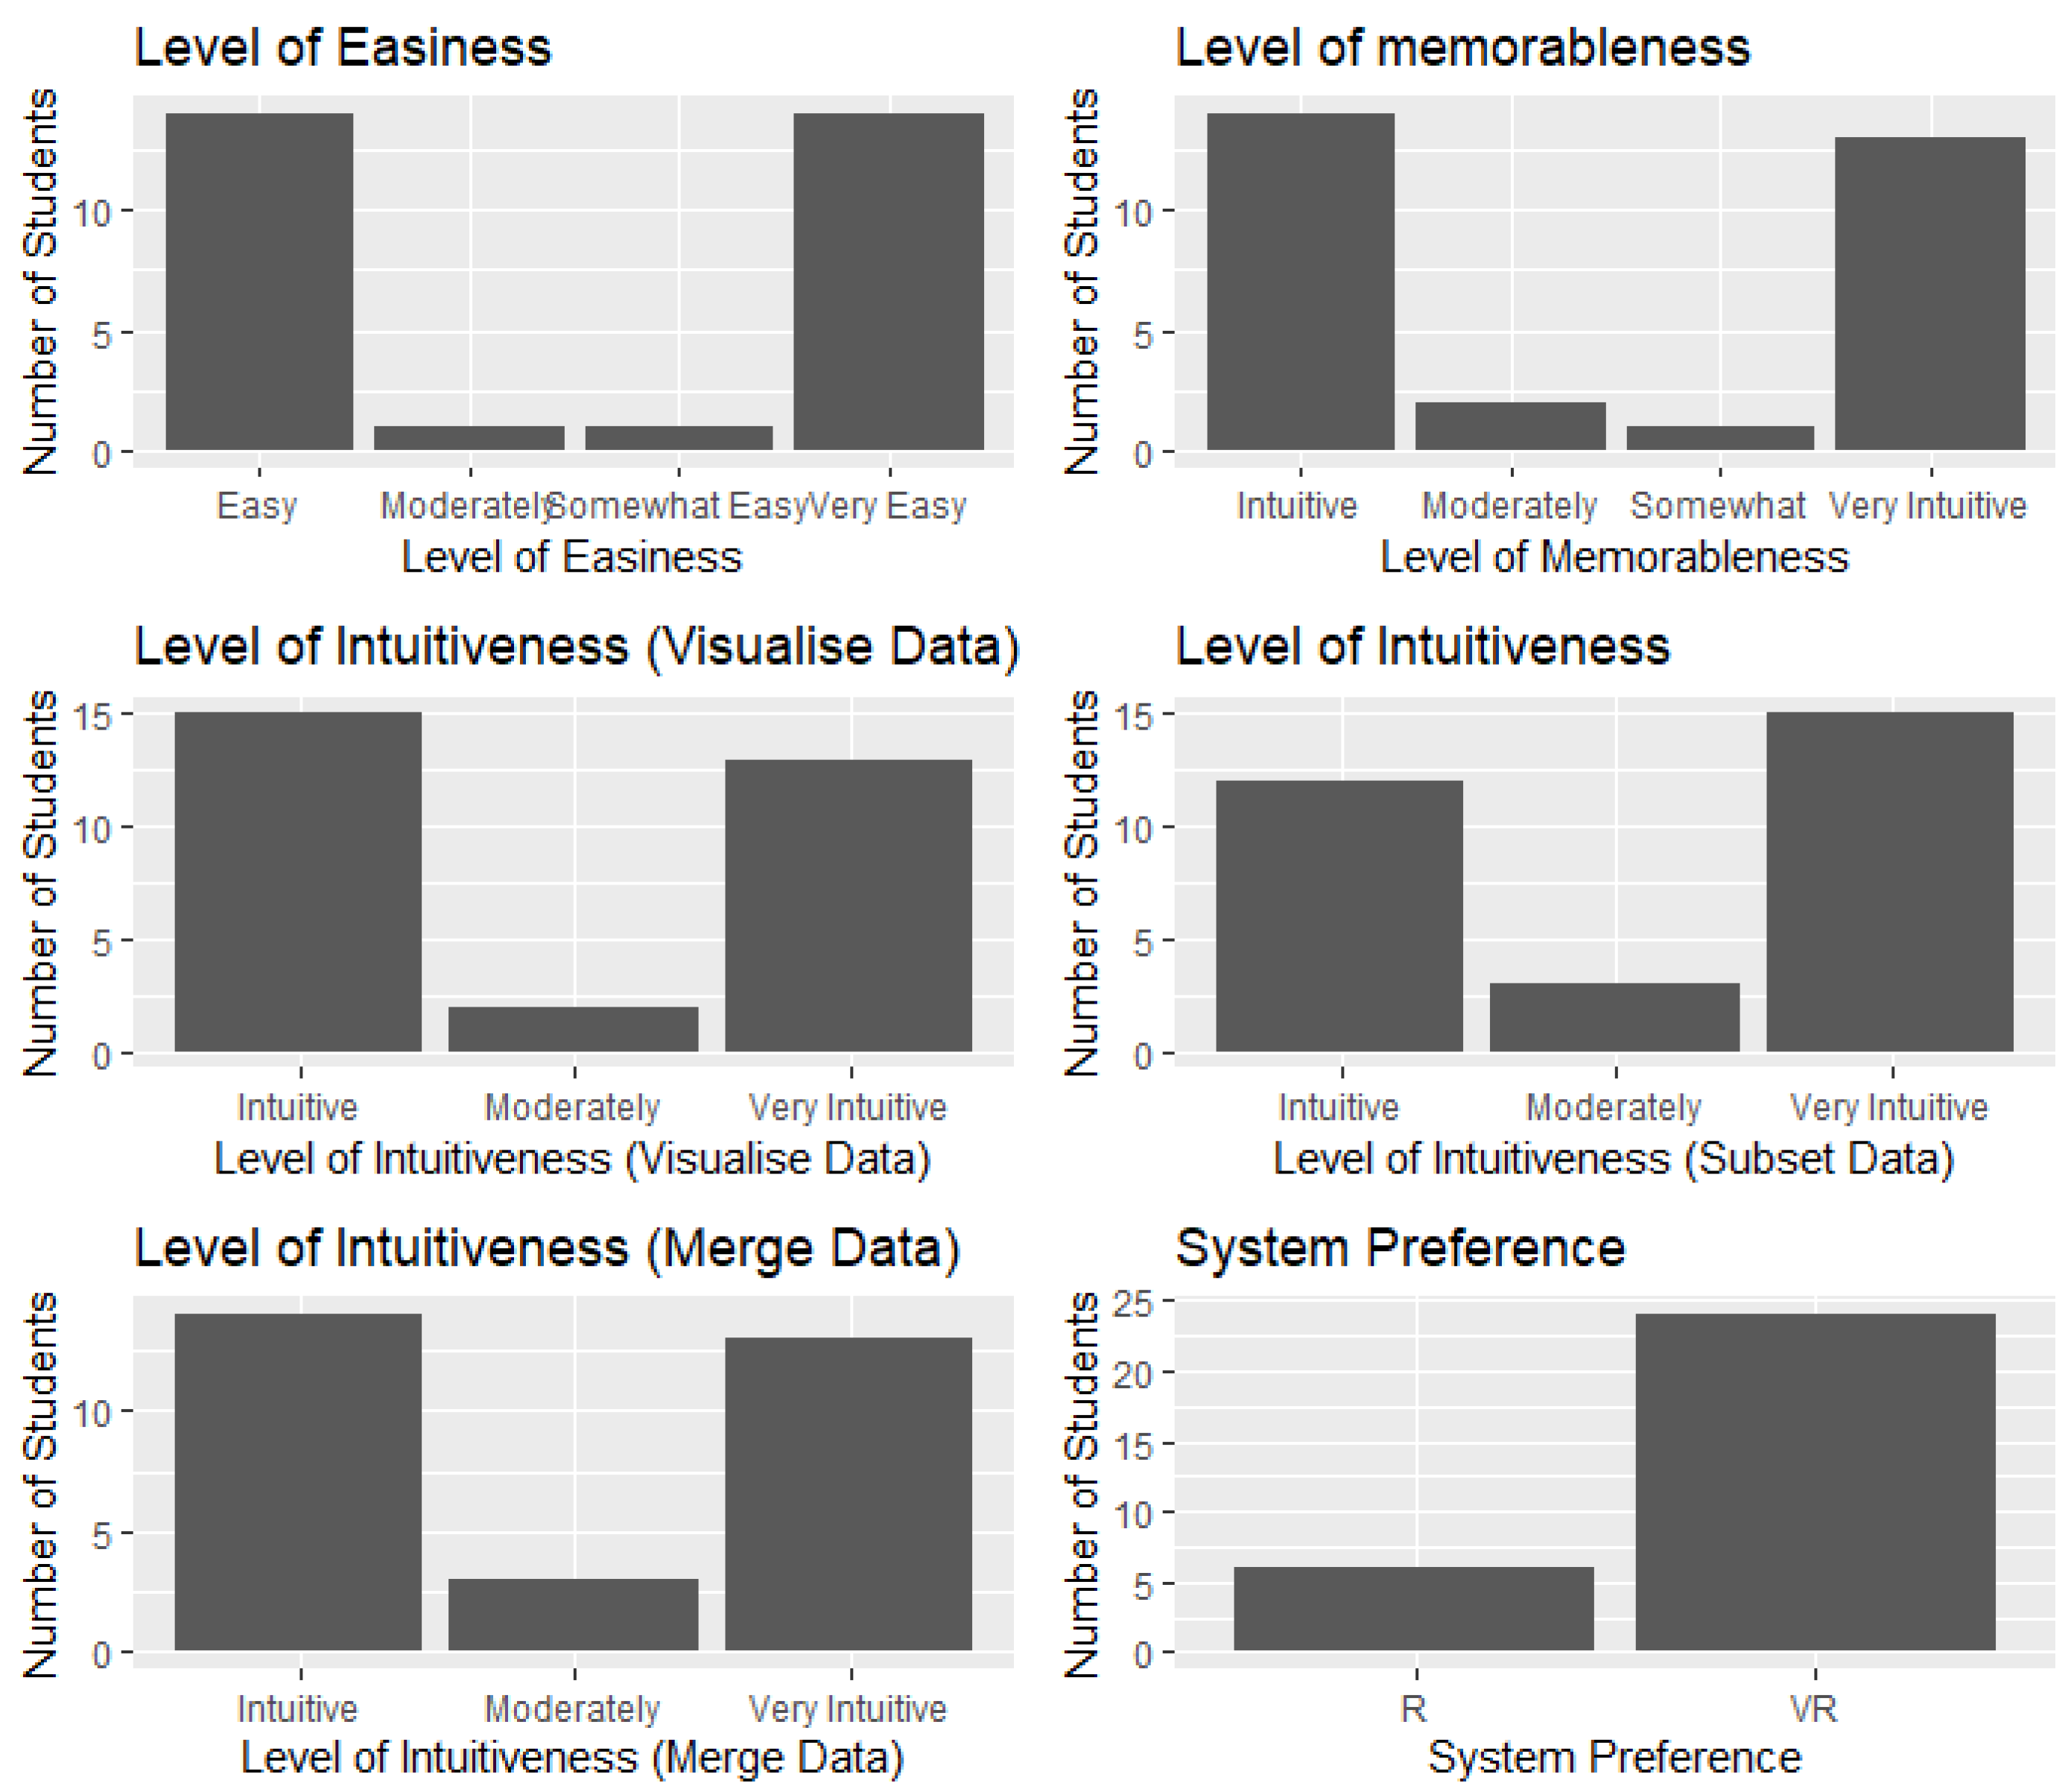
At this stage, the students were ready to participate in the experiment. They were given basic R instructions and a cheat sheet containing helpful lines of code to complete R tasks. During the VR stage of the study, the participants were given instructions on how to use the VR module, so it was only fair to show them how to use R to perform the assigned tasks and to provide a cheat sheet in order to create similarities between both study conditions (R and VR). The participants were assigned three types of tasks: (1) to generate four visualization types (histograms, scatterplots, boxplots, and line plots), (2) to merge charts, and (3) to subset data. In order to perform these tasks in R, the students used RStudio on a laptop. After completing the tasks in R, they were then given basic VR instructions and allowed to play around and become familiar with the new technology. The participants were then prepared to start the VR module, during which they were asked to perform the same tasks as they had already performed in R—but this time in VR. Note that the task sequence was switched between participants to avoid bias, meaning some participants performed the R tasks first while others performed the VR tasks first. The time it took each participant to complete the assigned tasks was recorded by the researcher for both conditions. Finally, students were given a VR design study survey to assess their experience with the developed module. The VR design study survey assessed the participants’ experience with the VR module. It consisted of five questions on a 5-point Likert scale and asked the participants to rate the VR module’s level of easiness and intuitiveness regarding visualizing data, sub-setting, data, and merging data. There was also an additional question asking the participants about their preference (R or VR) in the questionnaire.

3. Results and Discussion

3.1. Descriptive Statistics

After the necessary data are collected to test the performance of a newly developed tool/module, the first step is to analyze these data to investigate any patterns that can be found. Our survey instrument was comprised of six demographic questions and five background questions. The goal behind the use of descriptive statistics is to gain an insight into the sample distribution as well as general information about the various features of the sample structure.
Figure 14 presents the participants’ demographic information distributions, and Figure 15 shows their background information distributions. The background information involves six items that can be rated on a scale from zero (novice) to four (expert).
Figure 14a presents the participants’ gender distribution. The vertical axis scale depicts the number of participants according to both genders, male and female, and indicates that more males participated in the study (63%).
Figure 14b presents the participants’ ethnicity distribution. There are four main ethnicity categories: Asian, Black/AA, Hispanic/Latino, and White. As shown in the figure, the majority of the participants were white. In fact, around 63% participants were white.
Figure 14c presents the education level in which the participating students were enrolled at the time of the study. As illustrated, most students were working towards a bachelor’s degree. In fact, 46% of participants were pursuing a bachelor’s degree, 26% a master’s degree, and 26% a PhD degree.
Figure 14d presents the participants’ field of study distribution. All participants belonged to one of the following two major fields: Engineering and Business Information Systems (BIS). Engineering included four subfields: Aerospace Engineering (ASE), Chemical Engineering (CE), Industrial Engineering (IE), and Mechanical Engineering (ME). As illustrated in the figure, most participants were majoring in Industrial Engineering (53%).
Figure 14e presents the participants’ nationality distribution. A total of 60% were domestic students.
Figure 14f presents the participants’ age category distribution. Most participants were between 21 and 25 years old. In fact, 43% of the participants were between 21 and 25 years old.
Figure 15a shows the participants VR technology knowledge distribution. As illustrated, the majority of participants had basic VR system knowledge. Only 6% of the participants had above average VR knowledge, and none were recorded as experts in this area.
Figure 15b presents the participants’ video game-playing experience distribution. Most participants did not play video games often, and only 30% recorded their game-playing experience to be above-average/expert.
Figure 15c shows the participants’ coding experience distribution. Most participants had basic coding experience and only 30% reported having above average coding experience.
Figure 15d shows the participants’ R programming knowledge distribution. Most participants reported expert R programming software knowledge—40% reported having R programming language knowledge at the above-average and expert levels, while only 23% reported having no R programming knowledge.
Figure 15e shows the participants’ grammar of graphics theory knowledge distribution. The vast majority, 83%, of the participants had no grammar of graphics theory knowledge.
Finally, Figure 15f shows the participants’ analytics knowledge distribution—33% of the participants identified as having basic analytics knowledge, and 40% identified as having average to expert analytics knowledge.

3.2. Effectiveness Analysis

Two different tests were used to assess IVEE performance. Both were the same and instructed the participants to visualize data, subset data, merge data, and answer knowledge-related questions in R and VR environments. Knowledge-related questions instructed the participants to visually report certain data values. This section of the chapter focuses on various comparisons between study conditions (R and VR) using parametric and non-parametric tests. After completing the tests and the efficacy measures questionnaires, the final questionnaire asked participants to report their preferences regarding both tools.

3.2.1. Completion Time for Each Question

The test that was developed to assess IVEE performance comprised 26 questions. Sixteen out of the 26 questions asked the participants to generate a visualization, and the participant created each type of representation four times. Three out of the 26 questions asked the participants to subset the data, two questions asked the participants to merge visualizations, and five were knowledge questions that asked the participants to visually identify certain values.
The time it took the participants to complete each question on the test, as well as the entire test, using both experimental conditions—R and VR—was recorded. Since this study follows a within-subject experimental design, where participants undergo both treatment conditions, a total of 52 variables (26 × 2) were collected from each participant.
Shapiro-Wilk and Kolmogorov-Smirnov tests were conducted for all 52 variables [31,32]. The visual inspection of their histograms, normal Q-Q plots, and boxplots showed that percent difference values were not normally distributed. Hence, a non-parametric test was administered to determine whether a statistical significance exists in the time it took the participants to complete each question in both R and VR environments.
A Wilcoxon signed-rank test belongs to non-parametric tests and is an alternative non-parametric statistical hypothesis test to a dependent t-test. Since this test does not require that data points fall on a normal curve, it can be performed when parametric assumptions are not met and when parametric statistical methods are not suitable [33]. The Wilcoxon signed-rank test is employed to decide whether two treatments, given to the same group of participants (in a within-subject study), are statistically different in relation to a variable of interest. The latter must be continuous, and the sample must be randomly selected. As time is a continuous variable and the study sample was randomly selected, this test is appropriate for our analysis. It also tests the hypothesis that the medians from the two samples are the same. In this work, this test looks to find whether the use of the IVEE engine had enhanced participant performance in comparison to the use of R software. The null and alternative hypotheses for each tutorial question are as follows:
  • H0: Participants took the same amount of time to complete question i using R and VR environments; i = 1, 2,…, 26.
  • H1: Participants took less time to complete question i using the VR environment; i = 1, 2,…, 26.
To avoid confusion, R data-related questions are labeled R Q i , where i = 1, 2,…, 26, and VR data-related questions are labeled V R Q i , where i = 1, 2, …, 26. Table 1 shows the summary of hypothesis testing.
The summary of our hypothesis testing shows that for 21 out of 26 questions, the significance value (p-value) is less than 0.05, revealing a statistically significant change in the time it took the participants to complete the questions. A comparison of pair means (Appendix A) indicates that the participants took less time to complete 21 out of 26 questions when using VR in comparison to when they were using R. Furthermore, 17 out of these 21 questions (more than 80%) resulted in an r-value greater than the Cohen criteria of 0.5, indicating a significant effect size. This means that the VR environment can reduce the time it takes users to perform data analysis for most of the questions.

3.2.2. Total Test Time

A normality test was performed, where the total time to complete the tutorial is the variable of interest. Table 2 shows the results of the skewness and kurtosis values calculated using SPSS. Both variables (R Total Time and VR Total time) are within range.
The KS and Shapiro-Wilk tests were used to test the normality of both variables. A p-value of less than 0.05 implies that the data are significantly different from a normal distribution. Hence, the null hypothesis for both tests—stating that data are not significantly different from a normal distribution—were rejected. Table 3 shows the normality test results for total time.
Results from both tests (Kolmogorov-Smirnov and Shapiro-Wilk) show that there are no statistically significant differences, indicating that the data follow a normal curve. Since the total time values are normally distributed, the remaining parametric assumptions need to be met to proceed with a parametric test. These are:
  • Research design: As discussed earlier, since the entire sample is exposed to both conditions, R and VR, the research is considered to have a within-subject design and a paired t-test/ANOVA is used to infer information about total time;
  • Measurement level/Nature of variable: Time is a ratio variable;
  • Assumption violation and normal distribution;
  • Normality: R Total Time and VR Total Time are normally distributed;
  • Extreme outliers: a z-squared method was performed using SPSS and no extreme outliers were detected;
  • Homogeneity of variance: a Levene test (R Total Time: p = 0.605 > 0.05; VR Total Time = 0.60 > 0.05) was conducted to test for the homogeneity of variance, showing that there is a homogeneity of variances for both variables and that a parametric test can be conducted.
Consequently, a paired t-test was performed to test the following hypothesis at the 0.05 significance level:
H 0 : μ VR   μ R   = 0   versus   H a   : μ VR   μ R       0
As Table 4 shows, the paired t-test is associated with a statistically significant effect (t = 6.944, df = 29, p < 0.001). Comparing the means from both conditions ensures that the proposed VR module outperforms R in terms of the time it takes for participants to complete the tutorial. The participants took in average 7 min less to complete the entire tutorial in the VR module in comparison to the R module.

3.2.3. R and VR: A Comparison and Validation of the Modules

All students managed to answer the tutorial tasks to visualize data, merge data, subset data, and answer the remaining knowledge questions correctly in both R and VR modules. Hence, no statistical analysis was required to compare the answers to the questions in both conditions. This also means that the IVEE engine is a tool that does what it is supposed to do in relation to the tasks it currently accommodates.
The time to complete tasks in R and VR modules was also compared between the student participants who had good to expert R knowledge (experts) and those who had no to average R knowledge (novice) for all tasks (refer to the tables below). Table 5 presents the average total completion time in both R and VR environments for both categories (novice and expert student participants). The results show that it took experts 7 min and 51 s to complete the entire tutorial in R and 8 min 12 s to complete it in VR. The 21 differences between both study conditions were not significant, and experts managed to spend less time performing tasks in R because they were familiar with the software. However, it took them relatively more time to complete the tutorial tasks using IVEE because this was their first time using this VR module. This relatively insignificant difference in how long it took for experts to complete the tasks in R and IVEE indicates that even during their first time using this tool, they achieved good performance results in relation to timing. On the other hand, novice students took more time to complete the entire tutorial in R (29 min and 9 s). When total time was compared, novice participants managed to complete the tutorial in VR in approximately half the time it took them to complete it in R (the average VR completion time for novice students was 15 min and 9 s). These results are promising and show the promise of these new technologies for facilitating the work of analysts and reducing the time it takes them to perform analytics tasks. When comparing the average total time, it took novice students 15 min and 9s and expert students 8 min 12 s to complete the tasks in VR. The difference was only around 7 min—in contrast to R, where the difference between the average total completion time of novice (29 min and 9 s) and expert (7 min and 51 s) students was 22 min. This indicates that the VR environment managed to reduce the total time difference between both categories by approximately 15 min. These results are encouraging for the IA field and show that building new immersive, intuitive tools for analysts can reduce the time it takes them to complete these tasks even without any prior software knowledge. The decision to reduce the cognitive load on users by facilitating the use of IVEE through direct manipulation of the elements helped reduce the time it took for participants with no/basic/average knowledge in R to perform basic analytics tasks.
Table 6 presents the average time it took students to generate visualizations in R and VR environments. The results show that novice and expert students took relatively less time to generate visualizations in VR (a 2 s difference between R and VR for experts and a 23 s difference between R and VR for novice students).
Table 7 presents the average time it took participants to subset data using R and VR environments. The results show that experts took relatively more time to perform the subset task in VR (4 s difference) as opposed to novices who took less time to subset data using VR (1 min difference).
Table 8 illustrates the average time it took students to merge data using R and VR environments. The results show that novice and expert students took relatively less time to merge data in VR compared to R (a 16 s difference between R and VR for experts and a 73 s difference between R and VR for novice students).
In summary, IVEE was successful in reducing the time it took student participants to preform basic visual analytics tasks, especially novice students. An inspection of the results shows that, on average, novice students took less time to complete all types of tasks in the VR environment and managed to cut their total time spent on performing tasks in half.

3.3. Final Questions: VR Design Study

After completing the experiment and the efficacy questionnaire, the participants were asked to complete a post-experiment survey to gauge the VR design. The survey contained the following questions:
  • How easy was it to use this system?
  • How memorable did you find using this system?
  • How intuitive/easy was it to visualize data using this system?
  • How intuitive/easy was it to subset data using this system?
  • How intuitive/easy was it to merge data using this system?
  • Which system would you prefer to use?
The questions were ranked on a 5-point Likert scale. Figure 16 presents the distributions for these final survey questions. The results show that most participants found IVEE easy or very easy to use (93.3%). Only one participant reported finding IVEE somewhat easy to use, and one participant found it moderately easy to use. The results also show that most of the participants found IVEE easy to remember (90%). This is because IVEE relies on easy interaction techniques, which makes it more memorable than its equivalent traditional data analytics software. Two participants found IVEE to be moderately memorable, and only one participant found it to be somewhat memorable. In addition, regarding intuitiveness, most participants found IVEE to be intuitive or very intuitive to use (more than 90%) and all participants completed the assigned tasks within IVEE correctly. The final question asked the participants to select their preferred interface. Out of 30 participants, 26 preferred IVEE’s interface over R’s. These results are encouraging and serve as the basis for further developing additional NUIs for handling various analytics problems. An ANOVA test was also conducted to observe the effect of the final questions on the time it took the participants to complete the tutorial tasks in R.
Table 9 shows the results of this ANOVA test, which indicate that only the perceived level of data visualization intuitiveness had an impact on the time it took student participants to complete their tasks in VR.

3.4. Discussion

The VR and R settings primarily differed in one aspect only—interaction. We expected that users would perform better in the VR setting than in R when generating visualizations, filtering data, and merging data because IVEE does not require its users to have any prior experience with either or any other statistical software. We further predicted that users would prefer interacting with IVEE because it supports intuitive, natural interactions with the software. The results obtained from instant IVEE ratings and through direct comparison with R support our expectations for most participants.
The results indicate that, on average, the participants took less time to complete 21 out of 26 assigned questions. There was a major difference in the time it took to complete 17 of these 21 questions—in favor of IVEE. Norman et al. [34] emphasized the importance of natural, smooth interaction when handling data and making data analytics an enjoyable experience for users by simplifying the interface that stands between users and their data. This is achieved here by introducing an NUI that is supported by immersion—i.e., IVEE—where users primarily rely on their intuition for handling data, thus reducing the users’ cognitive load and skipping the hurdle of having to learn a new language/software in order to perform analytics. Furthermore, this new VR interface allows for the generation of full 3D objects, offering a spatial value that is not provided by a computer interface.
The results also show that the participants with expert R knowledge took more time to complete the tasks in the VR environment. Nevertheless, this time difference was marginal, especially when taking into consideration the fact that these experts managed to complete the tasks faster in R because they were already extremely familiar with the software, its interface, and its interaction methods. The marginal time difference between both conditions indicates that IVEE, although used for the first time, allowed experts to complete their tasks in almost the same amount of time as they took to do so in an environment with which they were very familiar. This outcome is favorable because it shows that first-time users benefit from the new VR interface in terms of enhancing their time performance. On the other hand, novice users took less time to complete the tasks in VR. In fact, novice users took approximately half the time to complete the tasks in the VR environment than in the R environment. It should also be noted that novice participants relied on using a cheat sheet, which contained code lines and instructions on how to use R, to complete the tasks in R. Without this cheat sheet, most of the novice participants would have quit, failing to finish the R portion of the experiment—and there would be no data to which we would be able to compare IVEE results. This is also promising because it shows how important advanced interaction is for enhancing the performance time of novice users.
A closer examination of the distinct techniques that the participants used to interact with their data suggests that those interfaces that join users and machines greatly influence their performance time. The VR design survey results indicate that most participants found IVEE’s interface to be easy to use, easy to remember, and intuitive when visualizing, sub-setting, and merging data. Handling multidimensional data on traditional 2D interfaces necessitates a variety of summary representations that need to be combined to inform about the data. These methods have disadvantages—complicated relationships between data points are not easily distinguishable, and complex datasets are hard to analyze using traditional methods. In addition, 2D representations only offer partial information about the data, and it is hard for users to make sense of the data when it is not visualized as-is. The newly developed VR environment provides additional features, including an infinite virtual space and 3D representations. It offers better methods for manipulating and examining data. Hence, IVEE allows for the as-is visualization of multivariate data and their manipulation via the use of virtual hands—while impersonating an avatar—without the need to program it. All menu options within IVEE are tied to no more than two buttons. This greatly reduces clutter and helps users avoid complicated software editors. This also reduces the users’ cognitive load because they do not have to recall complex menu systems and button combinations. To select an option, all users must do is press the A button on the right-hand touch controller and swipe to select. In summary, most of the participants (80%) preferred the IVEE to the R environment for completing the assigned tasks because they managed to complete them almost effortlessly, without having to type complicated lines of code. Even with a cheat sheet, the participants encountered various compiler errors, usually because of a character missing in their program that they could not spot, which resulted in a significant loss of time. IVEE eliminates these frustrating compiler errors by eliminating any input other than users’ gestural interactions. Furthermore, IVEE allows for the generation of clear, sizable visualization in the form of virtual 3D objects, which users can easily navigate for precise examination.

4. Conclusions

This study introduces a new tool to the IA field. This tool is called the Immersive Virtual Exploratory Engine (IVEE) and aims to enhance the interface that stands between users and computers by implementing interaction techniques similar to those performed on a daily basis by users when handling real objects. It distinguishes itself from existing IA tools by providing users with an NUI that places significant focus on natural, intuitive interactions between users and data. The tool has numerous features for its users, providing them with:
  • The experience of full interactions using virtual hands with generalized visualizations;
  • The support for four types of interactive visualizations: scatterplots, boxplots, histograms, and line plots;
  • The Lasso system for filtering data;
  • The element merge system for merging generalized visualizations,
  • The ability to simultaneously generate multiple visualizations;
  • The telepresence for remote collaboration.
The goal of this work was to compare the experience of using a 2D interface to the experience of using an immersive NUI for purposes of data visualization and basic data analytics tasks, including subset and merge data tasks. Researchers have previously indicated that for immersive applications to outperform traditional and non-immersive instruments, they need to perform better in terms of efficacy and effectiveness [35]. In relation to effectiveness, in general, it took less time for novice users to complete analytics tasks in IVEE. In fact, in comparison to the traditional interface—notably, R—the participants managed to complete the set tasks in half the time during their very first time of using IVEE. These results are encouraging and show the power of new immersive technologies and their affordances in facilitating data analytics tasks. Most of the participants found IVEE to be easy to use (93%), easy to remember (90%), and intuitive in handling data (90%). Finally, the participants provided more accurate answers on the knowledge portion of the tutorial in IVEE. This is because IVEE permits the generation of clear, sizable, and interactive visualizations that allow for better examination of the data.

5. Limitations and Future Work

5.1. Limitations of the Study

  • Although the results indicate a favorable outcome, the sample size was relatively small. Due to COVID-19 restrictions and safety procedures, only a small number of students were able to participate in the experiment. A good sample size for this type of study should have more than 200 participants, and future experiments intending to test future versions of IVEE should include a larger sample size.
  • All participants were university students. Future experiments should take place in a more general setting and include participants from various backgrounds and varying levels of expertise.
  • This engine relies on task taxonomies in designing its interactions. Currently, the system covers only part of the view specification and manipulation taxonomy. The engine is not complete and only covers three task types. Future versions of the engine should include different view manipulation, process, and improvement taxonomies.
  • Future tools should support additional features through natural interactions to make the immersive space more adequate for collaboration. For instance, the engine could include an interactive board on which analysts can write equations, outlines, conclusions, and general ideas—exactly as they would in real life. This would make the interaction in the immersive space feel more real and would support normal daily interactions.
  • The design of the workplace should be enhanced to imitate the workplaces of expert analysts and should include the tools that they find useful for data analytics.
    Future versions of the engine should also include different workplace designs for users to choose from. For instance, users could choose to work in an office that has a mountain view or a beach view. They could also design their workplace/office by choosing from various design and virtual furniture options.

5.2. Future Work

This work forms the foundation for an emerging IA focus—the development of advanced, immersive NUIs that support natural interactions when handling abstract information [34]. Future research venues include:
  • Introducing more IA tools to advance the gulf of execution aspect of data visualization [34]. Most visual analytics tools focus on the meaningfulness of visualizations and try to figure out ways to extract more information from data. The outcome of this research shows that enhancing interaction can also greatly enhance performance and make data analytics an enjoyable experience.
  • Since IA is an independent field, grammar of graphics theories that are specific to the IA field should be developed and should consider the new affordances of virtual, immersive systems. This research, for the first time in the IA field, attempts to introduce a new IA-specific grammar through an NUI.

Author Contributions

Conceptualization, S.K., R.J. and M.A.H.; methodology, S.K., R.J., M.A.H. and V.L.D.; software, S.K., M.A.H., V.L.D. and P.J.; validation, S.K., R.J., M.A.H., V.L.D., P.J. and R.K.B.; formal analysis, S.K., R.J., M.A.H., V.L.D. and R.K.B.; investigation, S.K., R.J., M.A.H., V.L.D. and P.J.; resources, R.J., M.A.H. and R.K.B.; data curation, S.K., R.J., V.L.D. and P.J.; writing—original draft preparation, S.K., R.J., M.A.H. and V.L.D.; writing—review and editing, R.J., V.L.D. and R.K.B.; visualization, S.K., M.A.H. and P.J.; supervision, R.J., M.A.H. and R.K.B.; project administration, R.J., M.A.H. and R.K.B. All authors have read and agreed to the published version of the manuscript.

Funding

This research received no external funding.

Institutional Review Board Statement

The study was conducted in accordance with the Declaration of Helsinki, and approved by the Institutional Review Board of Mississippi State University (protocol code: IRB-IRB-18-379 and date of approval: 1 January 2020).

Informed Consent Statement

Informed consent was obtained from all subjects involved in the study.

Data Availability Statement

No new data were created or analyzed in this study. Data sharing is not applicable to this article.

Conflicts of Interest

The authors declare no conflict of interest.

Appendix A

Table A1. Descriptive Statistics for time to complete the questions using R and VR.
R TimeVR Time
NMeanSDMinMaxNMeanSDMinMax
RQ13002:0401:2600:2105:55VRQ13000:0200:4900:2900:07
RQ23000:0200:0100:0100:07VRQ23000:0400:0100:0101:03
RQ33000:0300:0200:0100:12VRQ33001:0600:1100:0002:36
RQ43001:2801:1500:1804:32VRQ43000:5000:3400:2002:04
RQ53001:0200:4500:1403:00VRQ53000:4400:2600:0101:52
RQ63000:4800:2100:1902:00VRQ63000:3800:1900:1901:31
RQ73000:4800:1900:1801:55VRQ73000:0200:1700:0400:06
RQ83000:0200:0000:0100:05VRQ83000:3300:0100:0102:07
RQ93001:0000:4100:0103:00VRQ93000:0200:2000:1701:00
RQ103000:4700:2900:1602:50VRQ103000:1400:1100:1700:46
RQ113000:1300:1700:0501:46VRQ113000:0100:1600:1401:20
RQ123000:0300:0200:0100:16VRQ123000:0900:0200:0100:13
RQ133000:4300:1700:1301:20VRQ133000:1000:1400:0201:00
RQ143000:3600:1900:0101:14VRQ143000:1000:1300:0100:53
RQ153000:0700:1400:0200:59VRQ153000:2800:0900:0200:38
RQ163000:3700:1500:0901:09VRQ163000:2700:1000:0400:52
RQ173000:4000:1900:0401:30VRQ173000:2400:1000:0200:53
RQ183001:4101:0000:0903:00VRQ183000:4000:2800:0700:52
RQ193000:4200:1700:0901:20VRQ193000:2100:1000:0300:51
RQ203000:5700:3200:0701:50VRQ203000:1300:1000:0300:40
RQ213000:3300:3200:0501:07VRQ213000:1300:0700:0300:49
RQ223000:3200:1400:0701:06VRQ223000:2000:1000:0300:42
RQ233000:3300:1300:0501:07VRQ233000:1600:0900:0200:43
RQ243000:3100:1300:0701:02VRQ243000:1600:0800:0300:40
RQ253000:3000:1300:0601:03VRQ253000:1600:0800:0400:36
RQ263001:4200:1300:0604:00VRQ263000:1400:0800:0300:36

References

  1. Butscher, S.; Hubenschmid, S.; Müller, J.; Fuchs, J.; Reiterer, H. Clusters, trends, and outliers: How immersive technologies can facilitate the collaborative analysis of multidimensional data. In Proceedings of the 2018 CHI Conference on Human Factors in Computing Systems, Montreal, QC, Canada, 21–26 April 2018; pp. 1–12. [Google Scholar]
  2. Marriott, K.; Chen, J.; Hlawatsch, M.; Itoh, T.; Nacenta, M.A.; Reina, G.; Stuerzlinger, W. Immersive analytics: Time to reconsider the value of 3d for information visualisation. In InImmersive Analytics; Springer: Cham, Switzerland, 2018; pp. 25–55. [Google Scholar]
  3. Kiyokawa, K.; Steinicke, F.; Thomas, B.; Welch, G. 25th IEEE Conference on Virtual Reality and 3D User Interfaces [Title page]. In Proceedings of the 2018 IEEE Conference on Virtual Reality and 3D User Interfaces (VR), Tuebingen/Reutlingen, Germany, 18–22 March 2018; p. 1. [Google Scholar]
  4. Bertin, J. Semiology of Graphics: Diagrams Networks Maps; No. 04; QA90, B7; University of Wisconsin Press: Madison, WI, USA, 1983. [Google Scholar]
  5. Tukey, J.W. Exploratory Data Analysis; Reading Ma; Addison-Wesley: Boston, MA, USA, 1977. [Google Scholar]
  6. Tufte, E.R.; Goeler, N.H.; Benson, R. Envisioning Information; Graphics Press: Cheshire, CT, USA, 1990; Volume 2. [Google Scholar]
  7. El Beheiry, M.; Doutreligne, S.; Caporal, C.; Ostertag, C.; Dahan, M.; Masson, J.B. Virtual reality: Beyond visualization. J. Mol. Biol. 2019, 431, 1315–1321. [Google Scholar] [CrossRef] [PubMed]
  8. Sicat, R.; Li, J.; Choi, J.; Cordeil, M.; Jeong, W.K.; Bach, B.; Pfister, H. Dxr: A toolkit for building immersive data visualizations. IEEE Trans. Vis. Comput. Graph. 2018, 25, 715–725. [Google Scholar] [CrossRef] [PubMed] [Green Version]
  9. Cook, K.A.; Thomas, J.J. Illuminating the Path: The Research and Development Agenda for Visual Analytics; No. PNNL-SA-45230; Pacific Northwest National Lab.(PNNL): Richland, WA, USA, 2005.
  10. Cordeil, M.; Cunningham, A.; Bach, B.; Hurter, C.; Thomas, B.H.; Marriott, K.; Dwyer, T. IATK: An immersive analytics toolkit. In Proceedings of the 2019 IEEE Conference on Virtual Reality and 3D User Interfaces (VR), Osaka, Japan, 23–27 March 2019; pp. 200–209. [Google Scholar]
  11. Bryson, S. Virtual reality: A definition history-a personal essay. arXiv 2013, preprint. arXiv:1312.4322. [Google Scholar]
  12. Keim, D.; Andrienko, G.; Fekete, J.D.; Görg, C.; Kohlhammer, J.; Melançon, G. Visual analytics: Definition, process, and challenges. In Information Visualization; Springer: Berlin/Heidelberg, Germany, 2008; pp. 154–175. [Google Scholar]
  13. Liu, S.; Maljovec, D.; Wang, B.; Bremer, P.T.; Pascucci, V. Visualizing high-dimensional data: Advances in the past decade. IEEE Trans. Vis. Comput. Graph. 2016, 23, 1249–1268. [Google Scholar] [CrossRef] [PubMed]
  14. Pratt, P.; Ives, M.; Lawton, G.; Simmons, J.; Radev, N.; Spyropoulou, L.; Amiras, D. Through the HoloLens™ looking glass: Augmented reality for extremity reconstruction surgery using 3D vascular models with perforating vessels. Eur. Radiol. Exp. 2018, 2, 2. [Google Scholar] [CrossRef] [PubMed]
  15. Wei, N.J.; Dougherty, B.; Myers, A.; Badawy, S.M. Using Google Glass in surgical settings: Systematic review. JMIR mHealth uHealth 2018, 6, e9409. [Google Scholar] [CrossRef] [PubMed]
  16. Sacks, G.D.; Lawson, E.H.; Tillou, A.; Hines, O.J. Morbidity and mortality conference 2.0. Ann. Surg. 2015, 262, 228–229. [Google Scholar] [CrossRef]
  17. Sun, B.; Fritz, A.; Xu, W. An Immersive Visual Analytics Platform for Multidimensional Dataset. In Proceedings of the 2019 IEEE/ACIS 18th International Conference on Computer and Information Science (ICIS), Beijing, China, 17–19 June 2019; pp. 24–29. [Google Scholar]
  18. Bach, B.; Dachselt, R.; Carpendale, S.; Dwyer, T.; Collins, C.; Lee, B. Immersive analytics: Exploring future interaction and visualization technologies for data analytics. In Proceedings of the 2016 ACM International Conference on Interactive Surfaces and Spaces, Niagara Falls, ON, Canada, 6–9 November 2016; pp. 529–533. [Google Scholar]
  19. Kwon, O.H.; Muelder, C.; Lee, K.; Ma, K.L. A study of layout, rendering, and interaction methods for immersive graph visualization. IEEE Trans. Vis. Comput. Graph. 2016, 22, 1802–1815. [Google Scholar] [CrossRef]
  20. Chen, Z.; Qu, H.; Wu, Y. Immersive urban analytics through exploded views. In Proceedings of the IEEE VIS Workshop on Immersive Analytics: Exploring Future Visualization and Interaction Technologies for Data Analytics; Phoenix, AZ, USA, 2017. Available online: http://groups.inf.ed.ac.uk/vishub/immersiveanalytics/papers/IA_1052-paper.pdf (accessed on 25 August 2021).
  21. Terrain Texture. Available online: https://assetstore.unity.com/packages/2d/texturesmaterials/floors/terrain-textures-snow-free-samples-54630 (accessed on 15 January 2018).
  22. Card, S.K.; Robertson, G.G.; Mackinlay, J.D. The information visualizer, an information workspace. In Proceedings of the SIGCHI Conference on Human Factors in Computing Systems, New Orleans, LA, USA, 27 April–2 May 1991; pp. 181–186. [Google Scholar]
  23. Goncu, C.; Chandler, T.; Czauderna, T.; Dwyer, T.; Glowacki, J.; Cordeil, M.; Wilson, E. Immersive Analytics. In Proceedings of the 2015 Big Data Visual Analytics (BDVA), Hobart, Australia, 22–25 September 2015; pp. 1–8. [Google Scholar]
  24. Itoh, T.; Marriott, K.; Schreiber, F.; Wössner, U. Immersive Analytics: A new multidisciplinary initiative to explore future interaction technologies for data analytics. In Shonan Reports; National Institute of Informatics: Tokyo, Japan, 2016. [Google Scholar]
  25. Dwyer, T.; Henry Riche, N.; Klein, K.; Stuerzlinger, W.; Thomas, B. Immersive analytics (Dagstuhl seminar 16231). In Dagstuhl Reports; Schloss Dagstuhl-Leibniz-Zentrum fuer Informatik: Wadden, Germany, 2016; Volume 6, No. 6. [Google Scholar]
  26. Verzani, J. Getting Started with RStudio; O’Reilly Media, Inc.: Newton, MA, USA, 2011. [Google Scholar]
  27. Hejlsberg, A.; Wiltamuth, S.; Golde, P. C# Language Specification; Addison-Wesley Longman Publishing Co., Inc.: Boston, MA, USA, 2003. [Google Scholar]
  28. Okita, A. Learning C# Programming with Unity 3D; AK Peters/CRC Press: Natick, MA, USA, 2019. [Google Scholar]
  29. Desai, P.R.; Desai, P.N.; Ajmera, K.D.; Mehta, K. A review paper on oculus rift—A virtual reality headset. Int. J. Eng. Trends Technol. 2014, 13, 175–179. [Google Scholar] [CrossRef] [Green Version]
  30. Mullen, T. Mastering Blender; John Wiley & Sons: Hoboken, NJ, USA, 2011. [Google Scholar]
  31. Shapiro, S.S.; Wilk, M.B. An analysis of variance test for normality (complete samples). Biometrika 1965, 52, 591–611. [Google Scholar] [CrossRef]
  32. Razali, N.M.; Wah, Y.B. Power comparisons of shapiro-wilk, kolmogorov-smirnov, lilliefors and anderson-darling tests. J. Stat. Model. Anal. 2011, 2, 21–33. [Google Scholar]
  33. Woolson, R.F. Wilcoxon Signed-Rank Test. In Wiley Encyclopedia of Clinical Trials; Wiley: Hoboken, NJ, USA, 2007; pp. 1–3. [Google Scholar]
  34. Norman, D.A. Natural user interfaces are not natural. Interactions 2010, 17, 6–10. [Google Scholar] [CrossRef]
  35. Barfield, W.; Rosenberg, C.; Furness, T.A., III. Situation awareness as a function of frame of reference, computer-graphics eyepoint elevation, and geometric field of view. Int. J. Aviat. Psychol. 1995, 5, 233–256. [Google Scholar] [CrossRef]
Figure 1. Latest version of IVEE prototype.
Applsci 12 03817 g001
Figure 2. Oculus rift headset and data collection.
Applsci 12 03817 g002
Figure 3. IVEE’s gesture-based central menu system.
Applsci 12 03817 g003
Figure 4. User swiping the right hand to select the “Files” object.
Applsci 12 03817 g004
Figure 5. IVEE’s initial steps to building a visualization.
Applsci 12 03817 g005
Figure 6. IVEE’s file object holding multiple datasets at the same time.
Applsci 12 03817 g006
Figure 7. The successive steps leading to the generation of a visualization in IVEE. (a) IVEE’s menu system. (b) Selecting a database by touch. (c) Showing all files in the database. (d) Selecting a file by touch. (e) Virtual object represents the selected file. (f) IVEE’s sub menu system. (g) AES element. (h) Assigning different data attributes to desired axes. (i) Selecting the desired plot type. (j) Virtual object represents the plot type.
Applsci 12 03817 g007
Figure 8. 3D scatterplot generated using IVEE. (a) IVEE’s sub menu system to draw a plot. (b) Virtual object to run the plot. (c) Indication of the progress. (d) Three-dimensional scatterplot.
Applsci 12 03817 g008
Figure 9. Visualizations supported by IVEE. (a) Histogram. (b) Box-plot. (c) Scatterplot. (d) Line plot.
Applsci 12 03817 g009
Figure 10. Lasso system. (a) 3D Lasso sphere. (b) Moving the sphere towards the graph. (c) Position the sphere into the desired data points. (d) Access the new subsetted data using the menu system. (e) Visualize the subsetted data.
Applsci 12 03817 g010
Figure 11. The merge element system (a) A side view. (b) A front view of the graph.
Applsci 12 03817 g011
Figure 12. Collaboration in IVEE.
Applsci 12 03817 g012
Figure 13. Data Collection process.
Applsci 12 03817 g013
Figure 14. Demographics information (a) Participants’ gender distribution. (b) Participants’ ethnicity distribution. (c) Participants’ current education level. (d) Participants’ field of study distribution. (e) Participants’ nationality distribution. (f) Participants’ age category distribution.
Applsci 12 03817 g014
Figure 15. Background information (a) Participants’ VR technology knowledge distribution. (b) Participants’ video game-playing experience distribution. (c) Participants’ coding experience distribution. (d) Participants’ R programming knowledge distribution. (e) Participants’ grammar of graphics theory knowledge distribution. (f) Participants’ analytics knowledge distribution.
Applsci 12 03817 g015
Figure 16. Distributions of final survey questions.
Applsci 12 03817 g016
Table 1. Summary of hypothesis testing: Wilcoxon Signed-Rank test.
Sample Sizez-Valuep-Valuer-Value
Pair 1 R Q 1 V R Q 1 30−2.3680.0180.43
Pair 2 R Q 2 V R Q 2 30−0.2700.7870.05
Pair 3 R Q 3 V R Q 3 30−1.8470.650.34
Pair 4 R Q 4 V R Q 4 30−1.6460.10.30
Pair 5 R Q 5 V R Q 5 30−2.0920.0360.38
Pair 6 R Q 6 V R Q 6 30−2.5180.0120.46
Pair 7 R Q 7 V R Q 7 30−3.2740.0010.60
Pair 8 R Q 8 V R Q 8 30−1.7290.0840.32
Pair 9 R Q 9 V R Q 9 30−3.0740.0020.56
Pair 10 R Q 10 V R Q 10 30−3.0270.0020.55
Pair 11 R Q 11 V R Q 11 30−3.606<0.0000.66
Pair 12 R Q 12 V R Q 12 30−0.1420.8870.03
Pair 13 R Q 13 V R Q 13 30−3.823<0.0010.70
Pair 14 R Q 14 V R Q 14 30−3.4620.0010.63
Pair 15 R Q 15 V R Q 15 30−2.2110.0270.40
Pair 16 R Q 16 V R Q 16 30−3.994<0.0010.73
Pair 17 R Q 17 V R Q 17 30−4.502<0.0010.82
Pair 18 R Q 18 V R Q 18 30−4.731<0.0010.86
Pair 19 R Q 19 V R Q 19 30−4.774<0.0010.87
Pair 20 R Q 20 V R Q 20 30−4.705<0.0010.86
Pair 21 R Q 21 V R Q 21 30−4.763<0.0010.87
Pair 22 R Q 22 V R Q 22 30−4.599<0.0010.84
Pair 23 R Q 23 V R Q 23 30−4.794<0.0010.88
Pair 24 R Q 24 V R Q 24 30−4.773<0.0010.87
Pair 25 R Q 25 V R Q 25 30−4.575<0.0010.84
Pair 26 R Q 26 V R Q 26 30−4.712<0.0010.86
Table 2. Skewness and Kurtosis of total time.
Dependent VariableSkewness ValueKurtosis Value
R Total Time0.13−1.30
VR Total Time0.7490.639
Table 3. Normality assumption test: Total time.
Kolmogorov-SmirnovShapiro-Wilk
StatisticdfSig.StatisticdfSig.
R Total Time0.108300.2000.959300.292
VR Total Time0.078300.2000.974300.665
Table 4. Summary of hypothesis testing: Paired t-test.
Dependent VariableSample SizeMean (min)Standard Deviation (min)dft-Valuep-Value
R Total Time3018:2608:02296.9440.000
VR Total Time3012:0704:03
Table 5. Tutorial average completion time in R and VR: A comparison.
Above Average/Expert Knowledge in R Programming (Expert)
Average Time to Complete Tasks in RAverage time to complete tasks in VR
7 min 51 s8 min 12 s
No Knowledge/Basic/Average Knowledge in R Programming (Novice)
Average time to complete tasks in RAverage time to complete tasks in VR
29 min 9 s15 min 9 s
Table 6. Average time to generate a visualization in R and VR: A comparison.
Above Average/Expert Knowledge in R Programming
Average time to make a visualization in RAverage time to make a visualization in VR
22 s20 s
No Knowledge/Basic/Average Knowledge in R Programming
Average time to make a visualization in RAverage time to make a visualization in VR
1 min 12 s49 s
Table 7. Average time to subset data in R and VR: A comparison.
Above Average/Expert Knowledge in R Programming
Average time to subset data using RAverage time to subset data using VR
30 s34 s
No Knowledge/Basic/Average Knowledge in R Programming
Average time to subset data using RAverage time to subset data using VR
2 min 1 s1 min 2 s
Table 8. Average time to merge data in R and VR: A comparison.
Above Average/Expert Knowledge in R Programming
Average time to merge data using RAverage time to merge data using VR
27 s11 s
No Knowledge/Basic/Average Knowledge in R Programming
Average time to merge data using RAverage time to merge data using VR
1 min 46 s33 s
Table 9. Impact of final questions on total completion time in VR.
VR Designp-ValueImpact
Level of ease0.068No significant impact.
Level of memorability0.365No significant impact.
Level of intuitiveness (visualize data)0.048There is an impact.
Level of intuitiveness (subset data)0.330No significant impact.
Level of intuitiveness (merge data)490No significant impact.
System preference0.053No significant impact.
Publisher’s Note: MDPI stays neutral with regard to jurisdictional claims in published maps and institutional affiliations.

