Article

Research on Identification Technology of Field Pests with Protective Color Characteristics

College of Mechanical and Electrical Engineering, Hunan Agricultural University, Changsha 410128, China
*
Author to whom correspondence should be addressed.
Appl. Sci. 2022, 12(8), 3810; https://doi.org/10.3390/app12083810
Submission received: 28 February 2022 / Revised: 6 April 2022 / Accepted: 8 April 2022 / Published: 10 April 2022
(This article belongs to the Topic Machine and Deep Learning)

Abstract

:
Accurate identification of field pests has crucial decision-making significance for integrated pest control. Most current research focuses on the identification of pests on the sticky card or the case of great differences between the target and the background. There is little research on field pest identification with protective color characteristics. Aiming at the problem that it is difficult to identify pests with protective color characteristics in the complex field environment, a field pest identification method based on near-infrared imaging technology and YOLOv5 is proposed in this paper. Firstly, an appropriate infrared filter and ring light source have been selected to build an image acquisition system according to the wavelength with the largest spectral reflectance difference between the spectral curves of the pest (Pieris rapae) and its host plants (cabbage), which are formed by specific spectral characteristics. Then, field pest images have been collected to construct a data set, which has been trained and tested through YOLOv5. Experimental results demonstrate that the average time required to detect one pest image is 0.56 s, and the mAP reaches 99.7%.

1. Introduction

Accurate identification of field pests can provide basic data for scientific pest control. It is an essential prerequisite for effective pest investigation, pest prediction, and accurate pest killing [1,2,3], as well as a critical foundation for appropriate pesticide application, contributing to decision-making significance for integrated pest control [4,5,6].
In recent years, the automatic pest identification method based on digital image processing technology has become a research hotspot for experts and scholars [7,8,9]. The traditional machine learning technology mainly includes three steps: image preprocessing, feature extraction, and pest identification [10,11]. Ebrahimi M.A. et al. [12] proposed a method to identify thrips using the SVM (Support Vector Machines) method with region index and intensify as the color index. The average error of the classification was less than 2.25%. Yao et al. [13] developed a rice light-trap insect imaging system to automate rice pest identification. The experimental results revealed that the average accuracy of the identification of the four species of Lepidoptera rice pests was 97.5%. Wen et al. [14] designed an invariant local feature-based insect classification method to automatically classify certain common insects in orchards.
Although the traditional machine learning technology has made great progress in pest identification, its identification effect depends on the effect of feature extraction and the performance of the selected classifier, resulting in weak generalization ability and poor robustness of its identification model [15]. Agriculture field pests are a kind of visual target with small sizes and diverse posture changes. Additionally, its identification environment is complex. Since most field pests have the characteristics of protective color (such as Pieris rapae), the identification model of deep learning with strong generalization ability is more suitable for field pest identification. This method adopts a convolutional layer, activation layer, normalization layer, and pooling layer to continuously superimpose, automatically extracts the characteristics of pest, and recognizes pests through the fully connected layer [16,17]. Lu et al. [18] proposed a classification algorithm based on feature optimization to identify rice planthoppers and reached the identification accuracy of 96.19%. Zhang et al. [19] improved the Faster R-CNN (Convolutional Neural Networks) model by replacing the VGG16 (Visual Geometry Group) with the depth residual network (ResNet50) to identify aphids and leaf miners on sticky cards. The results suggested that the precision of the improved Faster R-CNN model reached 90.7%. Patel D. J. and Bhatt N. [20] compared three widely used deep learning meta-architectures (Faster R-CNN, SSD (Single Shot MultiBox Detector) Inception, and SSD Mobilenet) as object detection for selected flying insects, and Faster R-CNN meta-architecture presented the most outstanding performance with an accuracy of 95.33%. Thenmozhi K. and Reddy U.S. [21] proposed an efficient deep CNN model to classify insect species on three publicly available insect datasets. Rustia et al. [22] designed a multi-class insect identification method for yellow sticky paper and obtained it from wireless cameras using cascaded convolutional neural networks. The multi-class insect classifier had an accuracy of 86–92%. Although the identification accuracy of the above methods is high, most of them are for the identification of pests on the sticky card, or for the identification of pests with large differences between target and background. At present, there are few studies on field pest identification with protective color characteristics.
Pieris rapae and its host plant (cabbage) with a similar color to Pieris rapae were selected as experimental objects in this paper (Figure 1). As an extension of computer vision technology, near infrared imaging technology, especially the conventional imaging in the first NIR (NIR-I) window of 700 to 900 nm [23], can distinguish the target objects similar to the background in appearance characteristics [24]. It is widely used in insect species identification [25,26] and plant disease monitoring [27], but there is little research on pest identification. Thus, near-infrared imaging technology and YOLOv5 have been used to the identification of pests with protective color. Firstly, the average spectral characteristic curves of Pieris rapae and cabbage were obtained by hyperspectral experiment. By analyzing and comparing these two curves, the wavelength with the largest difference in spectral reflectance is obtained. According to this wavelength, the appropriate infrared filter, ring light source and other image acquisition equipment are selected to build an image acquisition platform. Collect a large number of pest images, and construct pest image data set by optimizing and expanding pest images. Finally, the appropriate deep learning model (YOLOv5) is selected to achieve the identification of field pests with protective color characteristics.

2. Materials and Methods

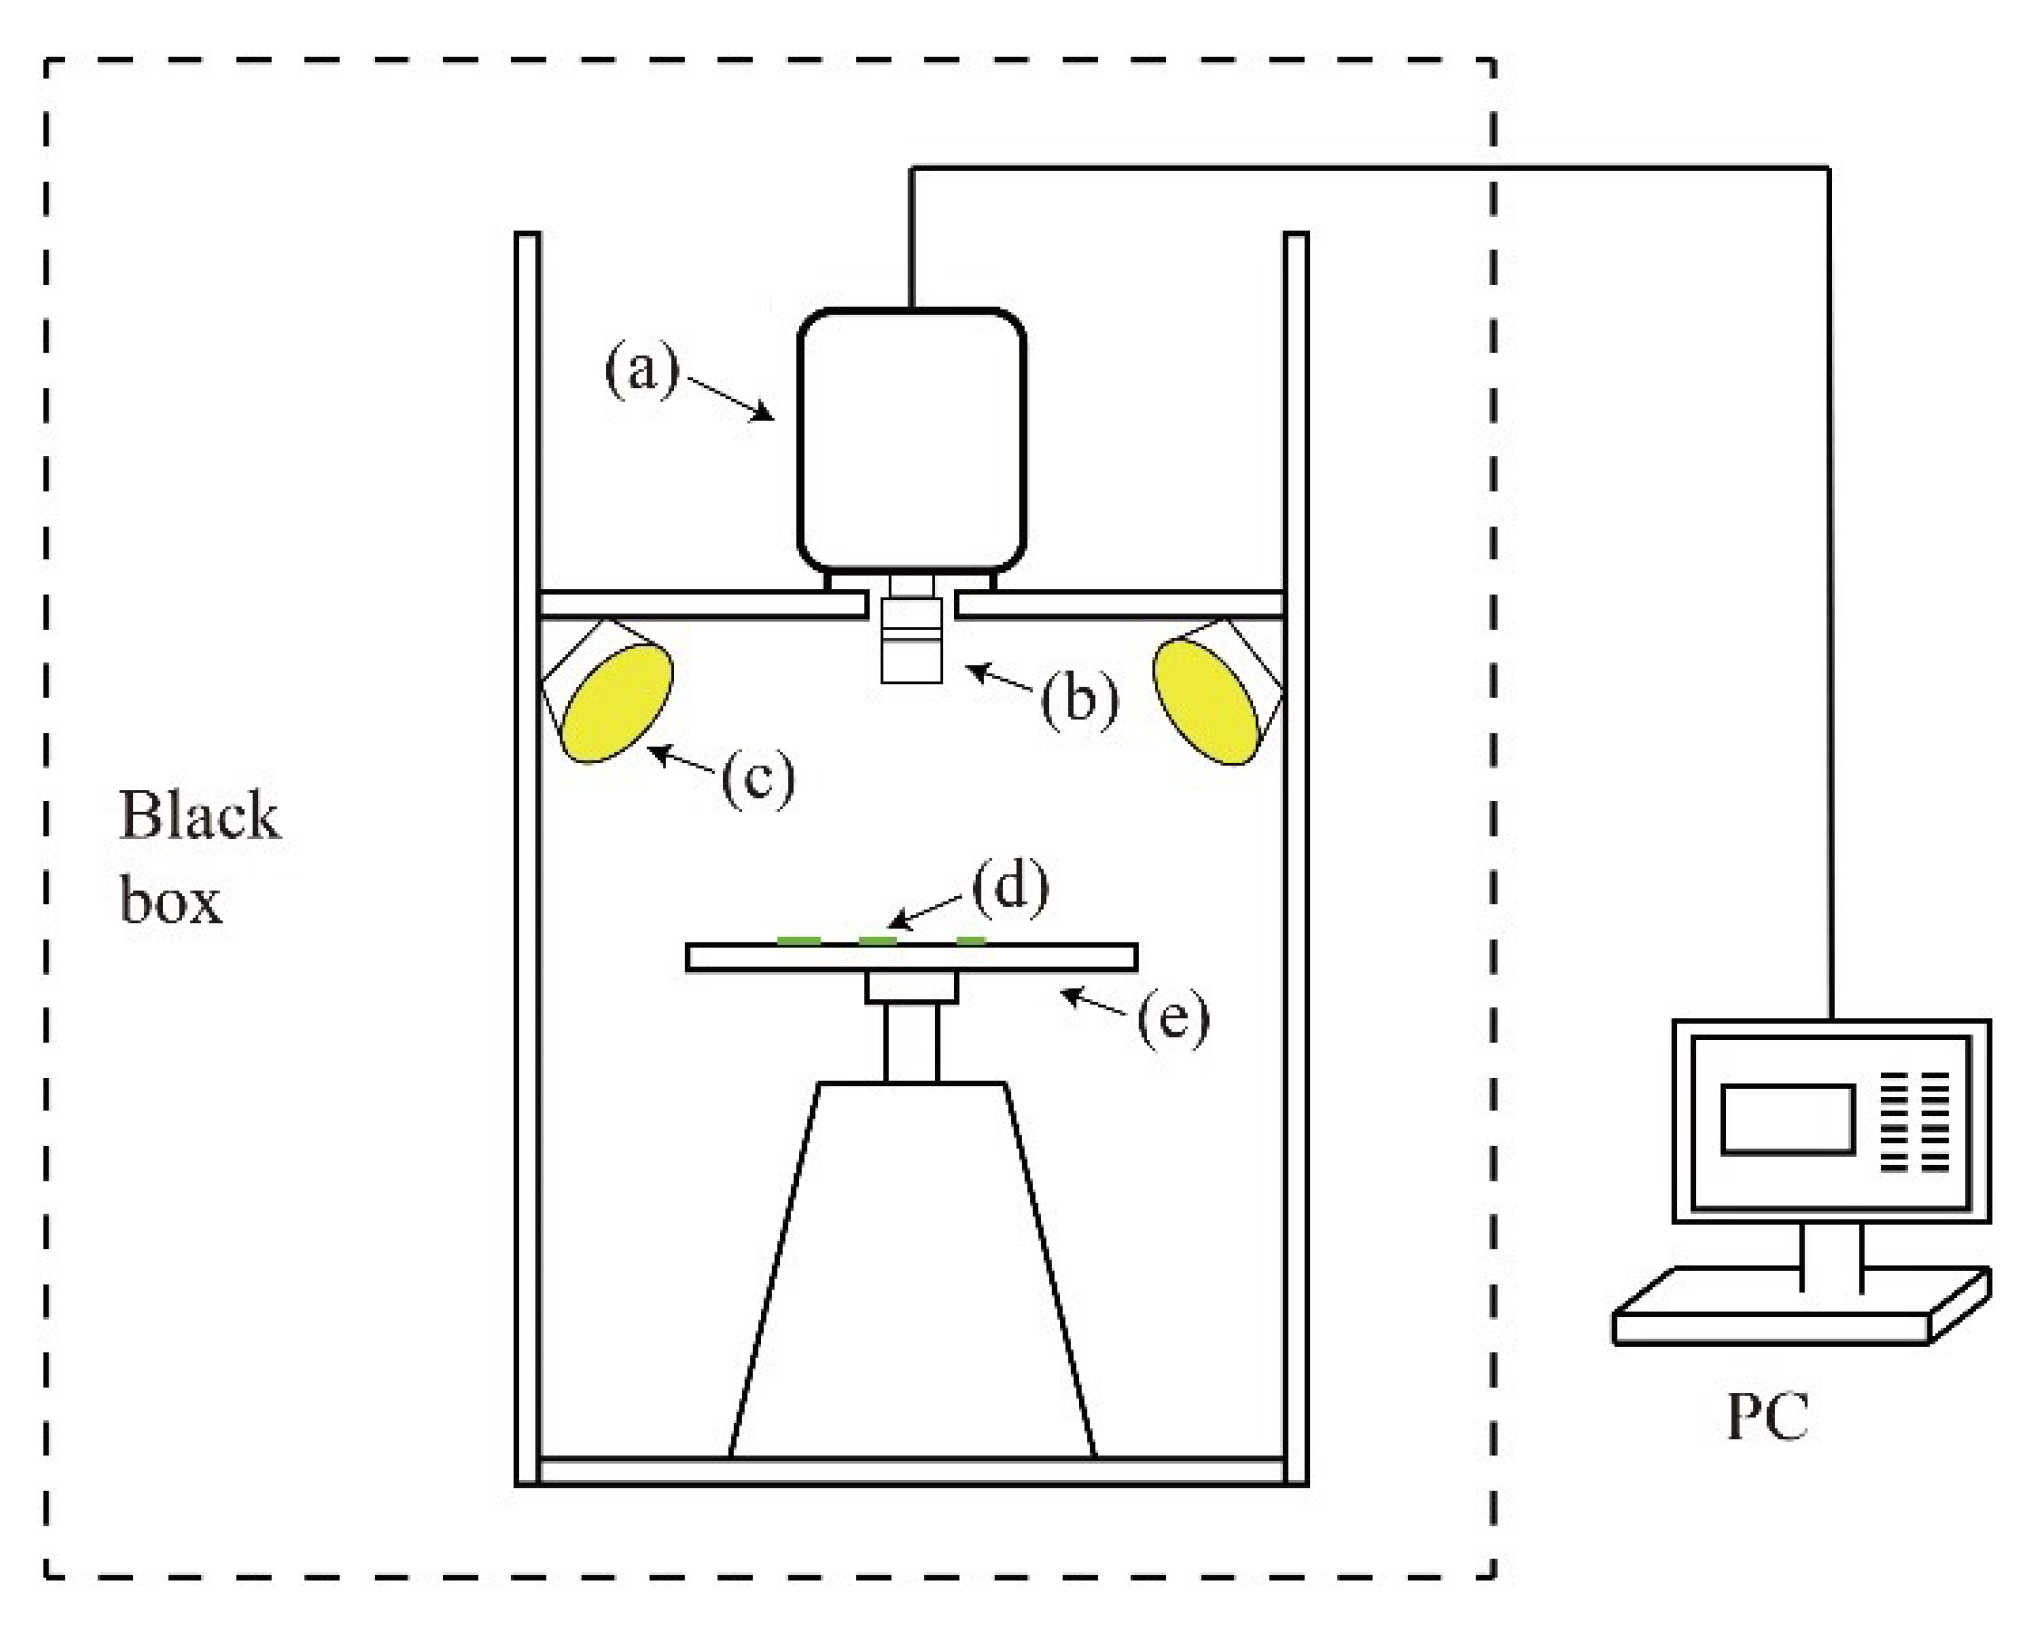
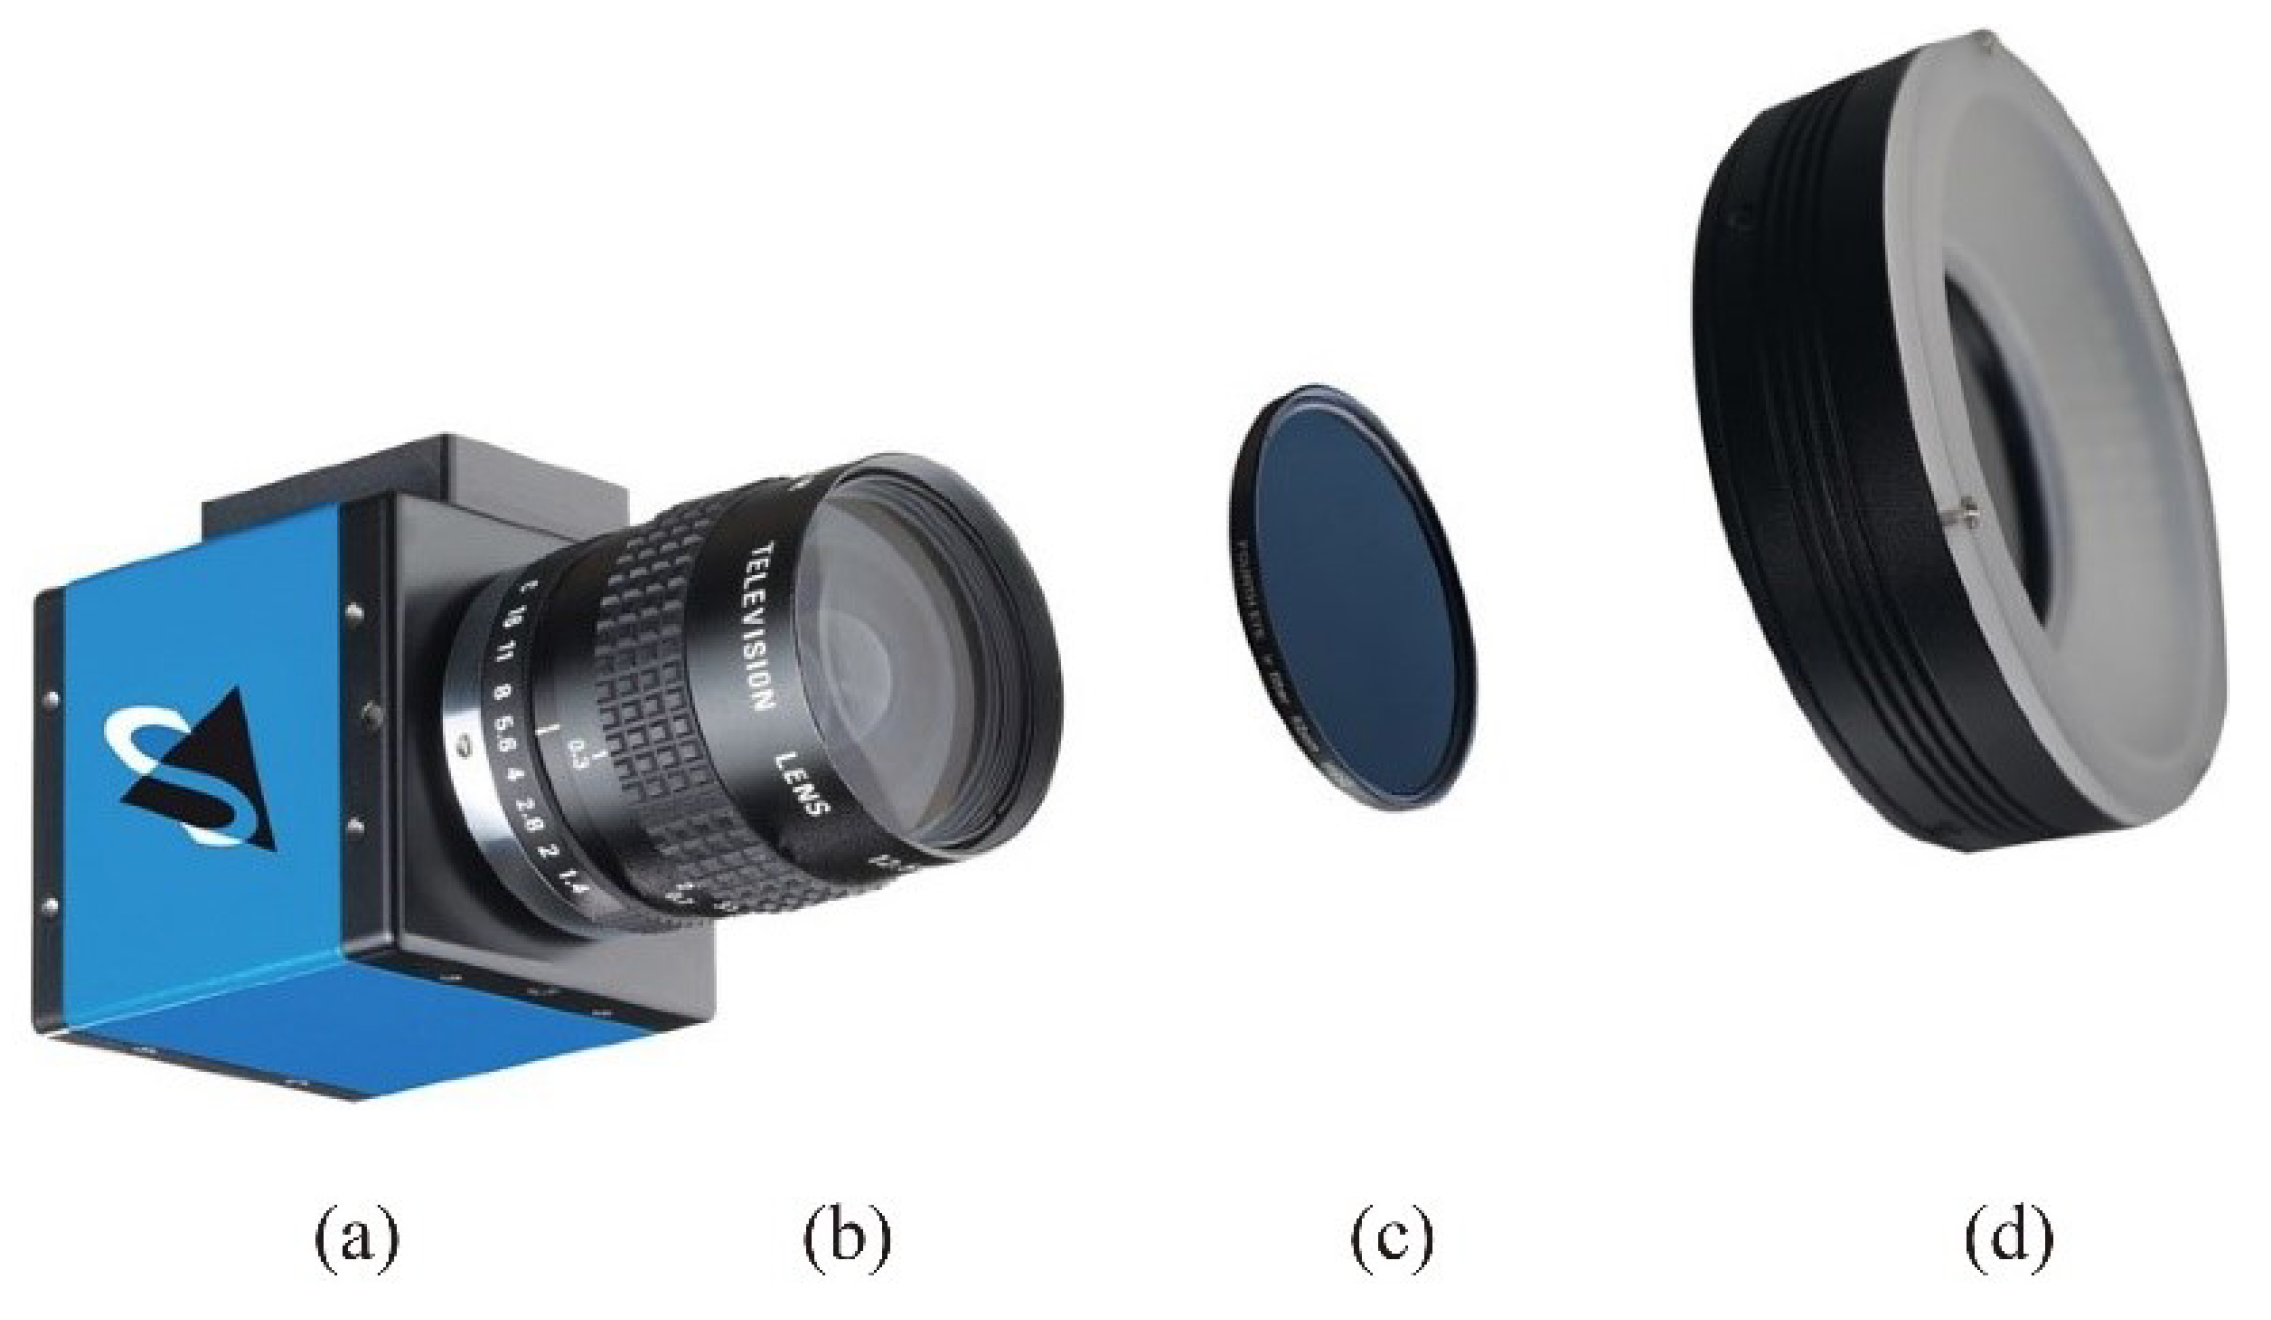
2.1. Hyperspectral Test

The hyperspectral test platform is illustrated in Figure 2. The platform uses SOC 710 portable hyperspectral spectrometer produced in the United States to collect spectral data of cabbage and Pieris rapae in a good life state. The spectrometer is composed of a built-in push-broom mode, a total of 128 wavelengths, a spectral range of 400–1000 nm, and a spectral resolution of 4.6875 nm. The platform can collect images by setting the acquisition wavelength. The imaging speed is 30 lines per second, and the image resolution is 696 pixel × 510 pixel. The light source adopts a controllable halogen lamp powered by a precision-regulated power supply. The height of the objective table is adjustable.
Pieris rapae was collected from the experimental field in Yunyuan of Hunan Agricultural University. To effectively reduce measurement errors, 20 Pieris rapae of fifth larval instars were randomly divided into 4 groups, and then the imaging spectral data were measured. Before measurement, Pieris rapae and the reflection reference plate were placed on the objective table. Additionally, the height of the objective table and the light intensity were adjusted to make the image in the clearest state. The spectrogram was corrected with the reflection reference plate. In the process of measurement, the angle of the viewing field of the spectrometer was adjusted to 15°, and the distance between the lens and the sample was set to 28 cm [28]. The surveyors in the dark-colored clothes without strong reflection operated the instrument at the backlight to collect spectral images. Then, the spectral image was imported into SRAnal710e software to calibrate black field and space, spectrum, and spectral radiation. On this basis, the reflectivity was converted. Finally, the spectral reflectance data of Pieris rapae is extracted by ENVI5.3 software. The hyperspectral data of the 7th to 9th abdominal segments of Pieris rapae were used as the hyperspectral data of this Pieris rapae [29]. In each group, the mean reflectance at the 7th to 9th abdominal segments of 5 Pieris rapae was taken as the spectral reflectance of this group [30]. The 5-point weighted smoothing of spectral data obtained by MATLAB software can effectively eliminate the influence of interference factors of original spectral data [31].
The leaf head, inner leaves (1–6 leaves outside the leaf head), and outer leaves (leaves outside the seventh leaf) of cabbage are the main edible parts of Pieris rapae. The areas damaged by insects of inner leaves account for 62.6–72.6% of the total damaged area by insects [32]. Therefore, the inner leaves of cabbage were selected as the main experimental object. The hyperspectral experimental scheme of cabbage was consistent with that of Pieris rapae. In this study, 5 points are measured for each cabbage leaf, and each point is repeated three times to take the mean value. The mean value was smoothed by 5-point weighted smoothing as the hyperspectral characteristic curve of the leaf.

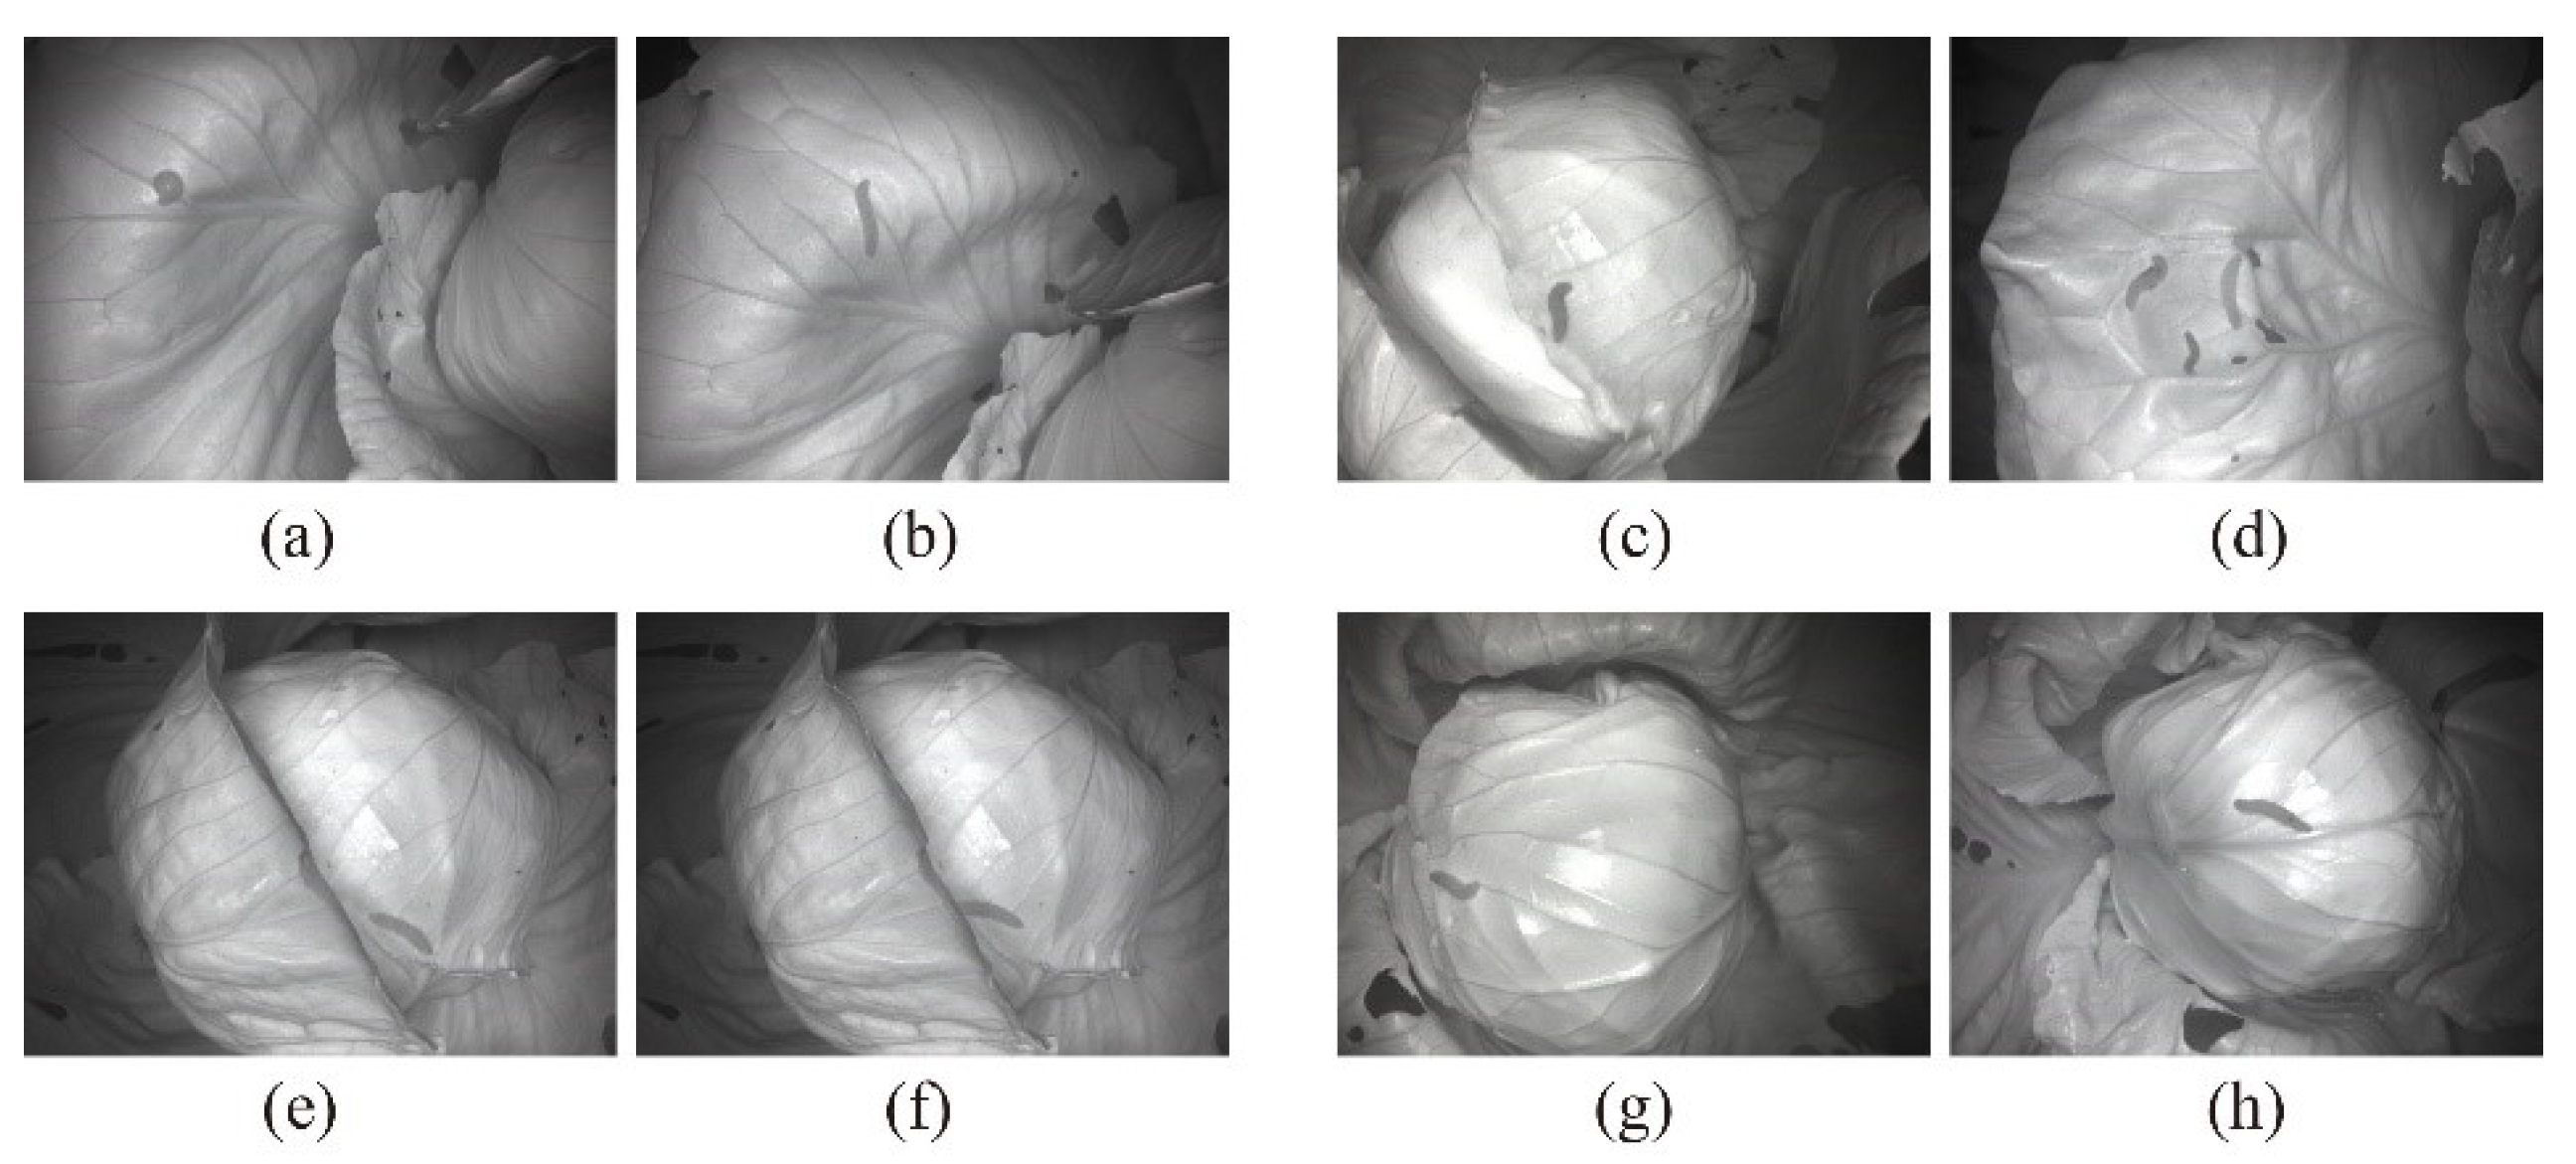
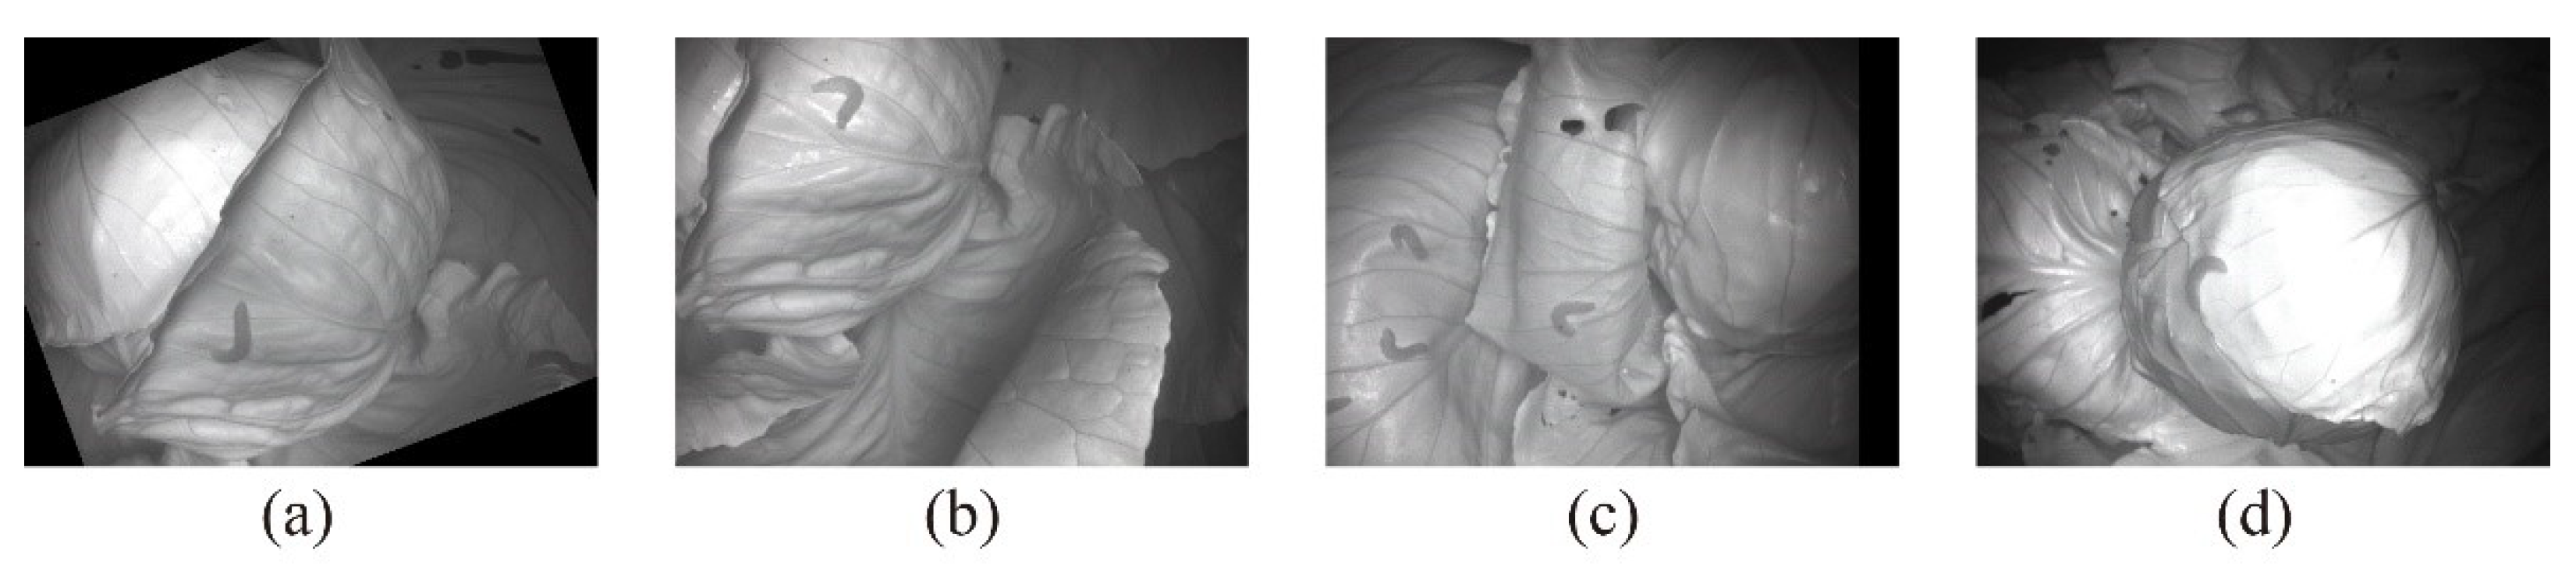
2.2. Pest Image Data Set

Using the Pieris rapae and cabbage spectral information obtained by hyperspectral technology, specific spectral characteristics of Pieris rapae and cabbage can be formed on the spectral curves, and comparing these two curves to get the wavelength with the largest reflectivity difference [33,34]. According to this wavelength, the appropriate camera, light source, filter, and other key components are selected to build the image acquisition system. As exhibited in Figure 3, the system mainly consists of the color camera of The Imaging Source with model DFK 41BU02, industrial lens of Computar with a focal length of 8.5 mm, 850 nm infrared filter, and 850 nm ring light source.
With the image acquisition system, pest images were collected in the cabbage plantation of Yunyuan, Hunan Agricultural University. With the purpose of improving the robustness of the identification algorithm, the original data set covers Pieris rapae under different camera angles, different postures, and other conditions, as well as images with occlusion and overlap, such as Pieris rapae in curled state and Pieris rapae in an extended state (Figure 4a,b), a Pieris rapae and multiple Pieris rapae (Figure 4c,d), unobstructed Pieris rapae and covered Pieris rapae (Figure 4e,f), and Pieris rapae on the left side of the image and Pieris rapae in the middle of the image (Figure 4g,h). After image acquisition, 500 pest images with high image quality are obtained by manually screening pest images to eliminate the blurred images and distorted images.
The original image data set was expanded through data enhancement to enhance the diversity of the data set, avoid overfitting, and boost the generalization ability and robustness of the identification algorithm [35,36,37]. Common data enhancement methods include rotation, flip, clipping, adding noise, jitter, blur, translation, and staggered transformation [38,39,40]. In this paper, the original image data set was expanded from 500 images to 1500 images through rotation, flip, translation, and changing brightness considering the factors such as the influence of camera angle and light intensity (including the lighting conditions simulating sunny or cloudy days and exposure or insufficient light) on the identification algorithm (Figure 5).
The pest images were labeled one by one by labelimg software. The images of Pieris rapae were labeled with a rectangular box and then named. The annotation information was saved in the format of the Pascal (Pattern Analysis, Statical Modeling and Computational Learning) VOC (Visual Object Classes) dataset, which contained the coordinates, labels, and serial numbers of each box. Pest images, labeled files, and other files are built into the dataset following the directory structure of the Pascal VOC dataset. Then, the pest images and annotation files are divided into training set, verification set and test set according to the proportion of 6:2:2, respectively. The training set was employed to fit the detection network. The validation set was adopted to adjust the super parameters of the detection network and preliminarily evaluate the network performance. The test set is used to evaluate the generalization ability of the final model.

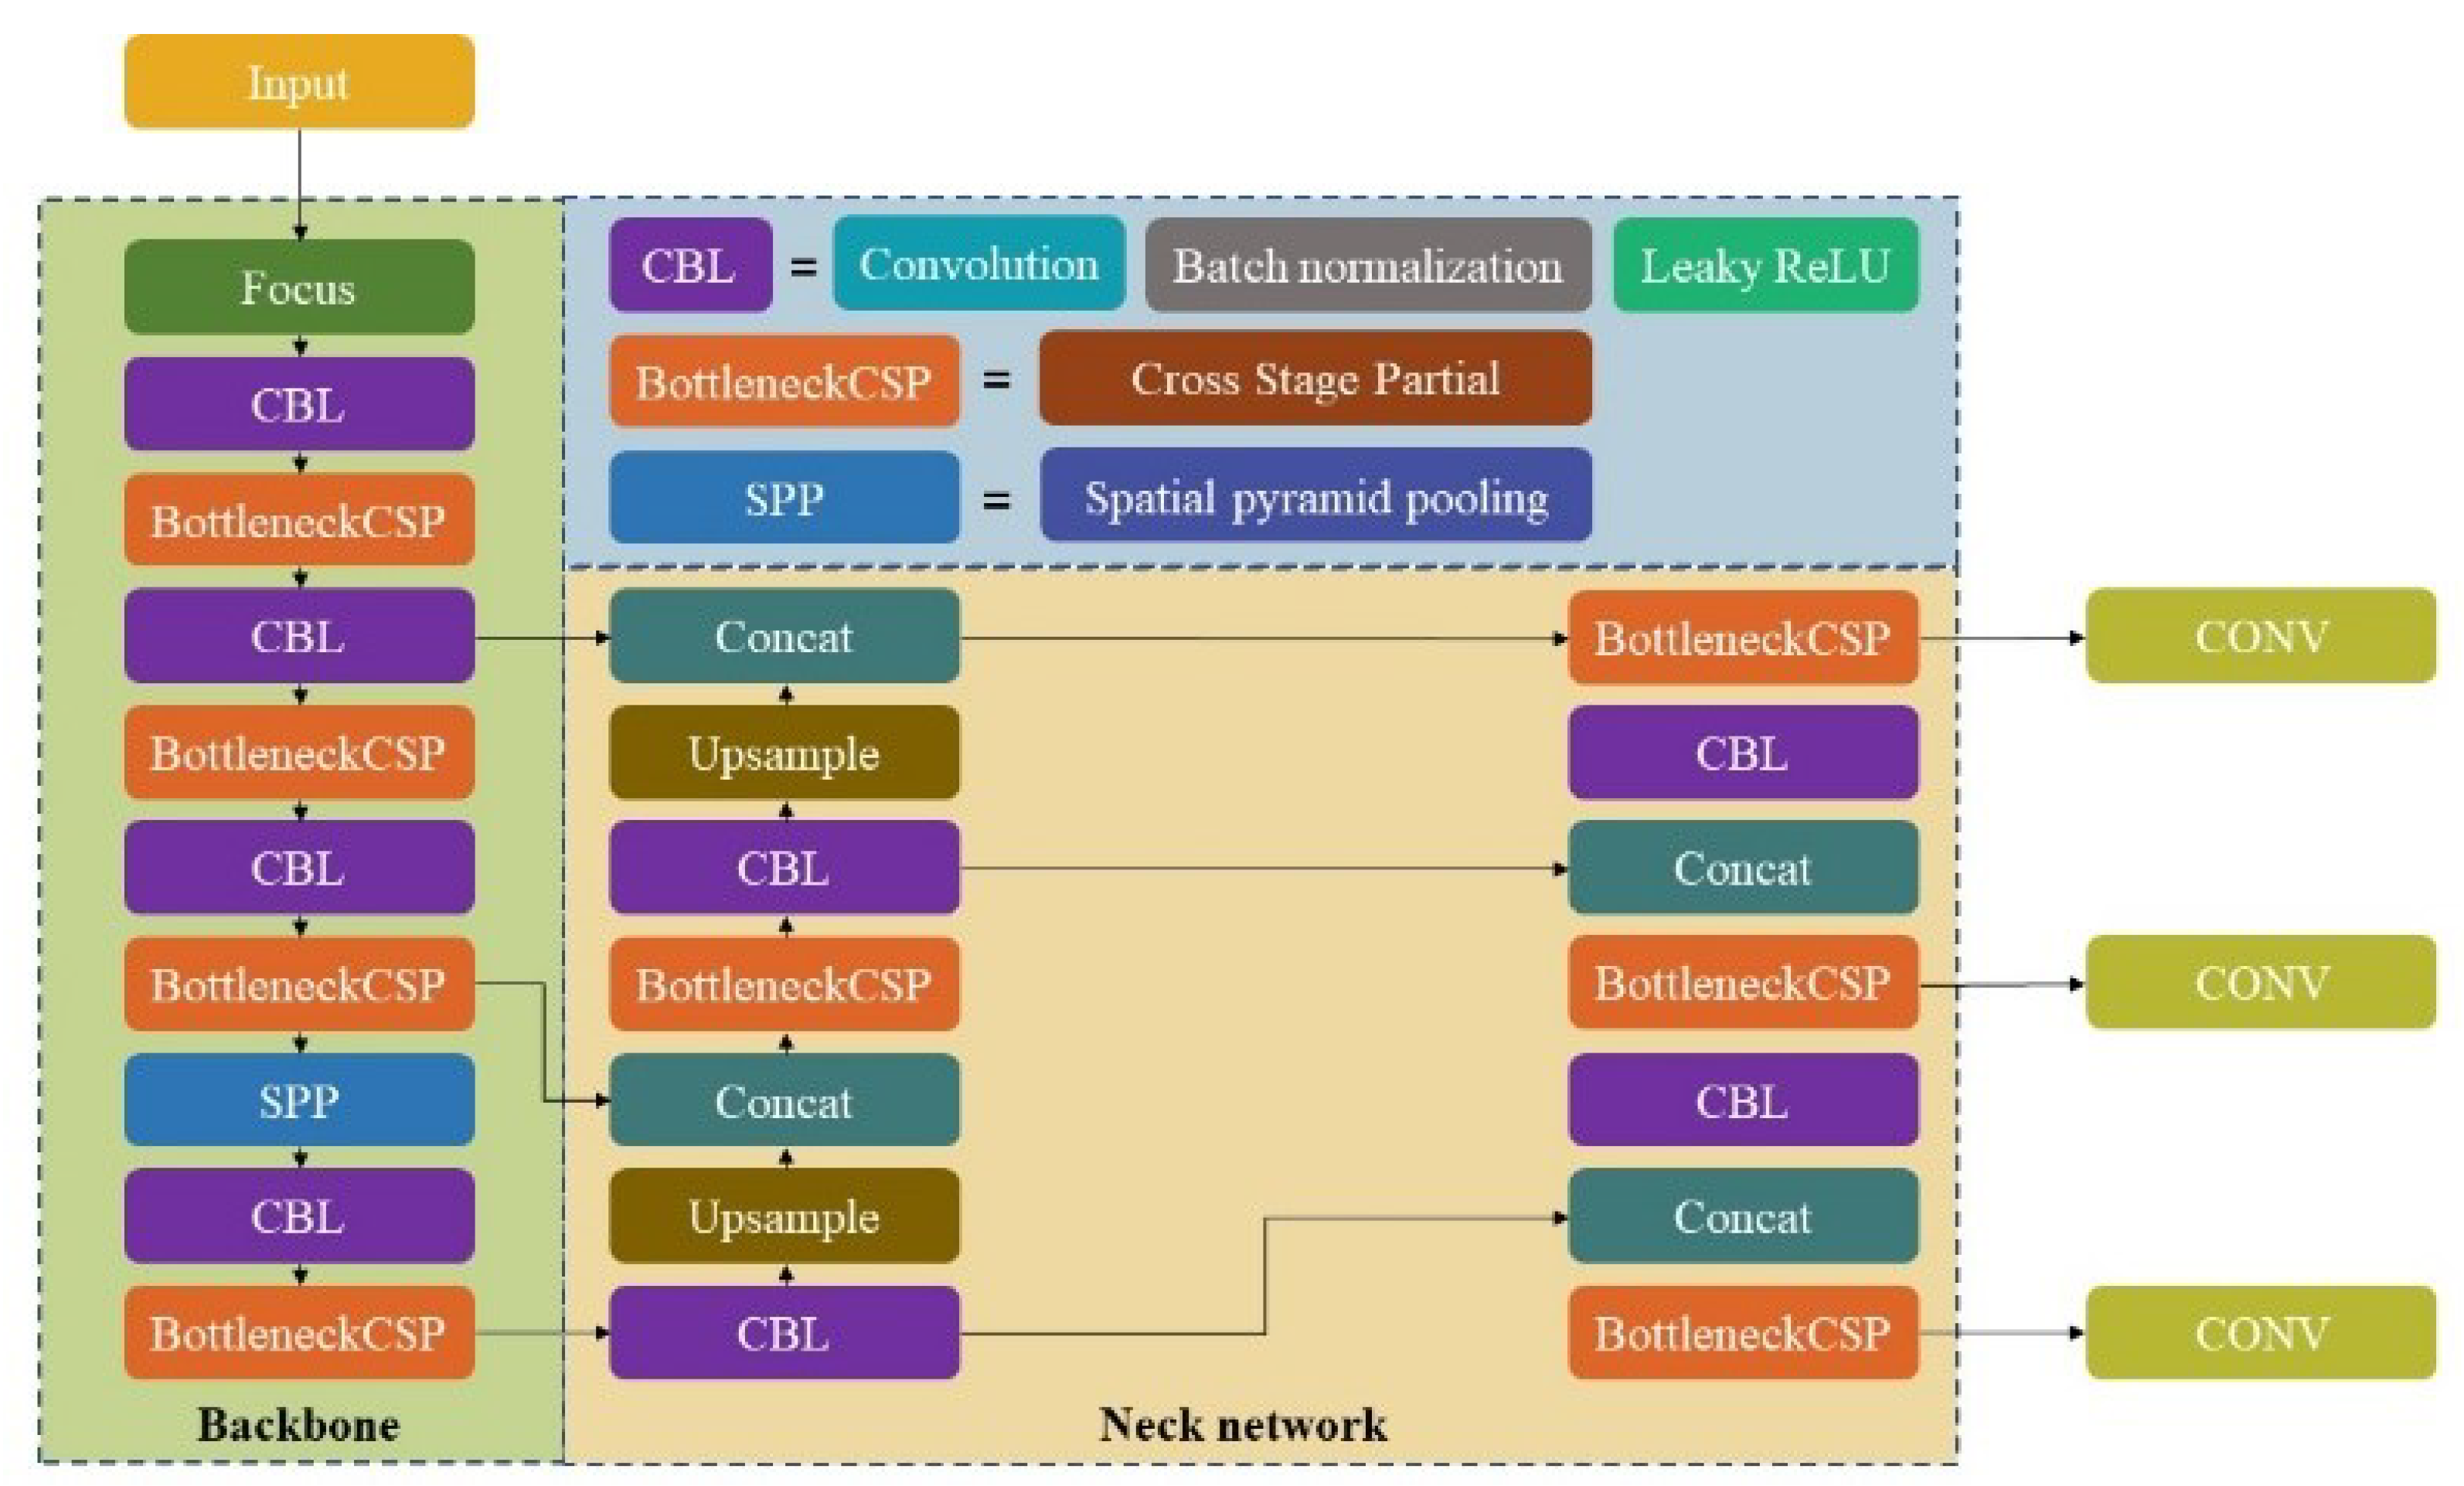
2.3. Pest Identification Model

There are many kinds of target detection algorithms based on deep learning, and YOLO (You Only Look Once) is one of the most advanced target detection methods [41]. Different from the target detection algorithm based on region prediction, YOLO directly extracts features from the network to predict object classification and location. In this study, the prediction size of a fixed format was obtained to make the convolutional neural network traverse the whole image. Firstly, the image was adjusted to a fixed size of 416 × 416 and then divided into 13 × 13 nonoverlapping grid cells. Next, B possible bounding boxes and confidence were detected for each cell, including 5 prediction parameters: x, y, w, h, and confidence. Among them, (x, y) represents the coordinates of the target, (w, h) indicates the width and height of the outer rectangle of the target, and the confidence is used to trade off the prediction results through the threshold [42].
Compared with YOLOv1, YOLOv2 improves the performance of the model by referring to anchors [43]. In YOLOv3, multi-dimensional anchors and residual networks are used to further improve the performance of the model [44]. In YOLOv4, the Backbone network adopts CSPDarknet53 (Cross Stage Partial), while PANet (Path Aggregation Network) and SPP-Net (Spatial Pyramid Pooling Network) are introduced to adapt to the input of different sizes [45]. In YOLOv5, Mosaic data enhancement, adaptive anchor, and adaptive picture scaling are employed in the input. The Backbone network can quickly extract the features of the target adopts through Focus and CSPNet (Cross Stage Partial Network). In the Neck network, FPN (Feature Pyramid Network) and PANet are used for multi-scale fusion of the extracted features. Besides, GIoU_Loss (Generalized Intersection over Union) is used as the loss function of the target detection frame in the output. The NMS (Non-maximum suppression) is introduced to filter out the overlapping candidate frames and obtain the best prediction output. These improvements ensure the accuracy and speed of YOLOv5 on small targets. Additionally, YOLOv5 has advantages such as shallow structure, small weight file, and relatively low requirements for equipment configuration [46]. The structure of YOLOv5 is illustrated in Figure 6. The CBL module is composed of Convolution layer, BN (Batch Norm) layer and Leaky_relu activation function, and it is a basic convolution module. The BottleneckCSP module mainly performs feature extraction on the feature map and extracts rich information from the image [47].
YOLOv5 forms different models with different parameters by adjusting the depth and width of the BottleneckCSP module: YOLOv5s, YOLOv5m, YOLOv5l, and YOLOv5x. With the deepening and widening of the network, the ability of the network to feature extraction and feature fusion is enhanced by sacrificing speed. In YOLOv5, the detection speed of YOLOv5s is the fastest, and the precision of YOLOv5x is the highest. Comprehensively considering the complexity and variability of field pest identification and the needs of practical application scenarios, the requirements for the detection speed of YOLOv5 are relatively higher than the requirements for identification accuracy. Therefore, YOLOv5l guaranteeing both speed and identification accuracy is selected to achieve pest identification with protective color characteristics.

3. Results and Discussions

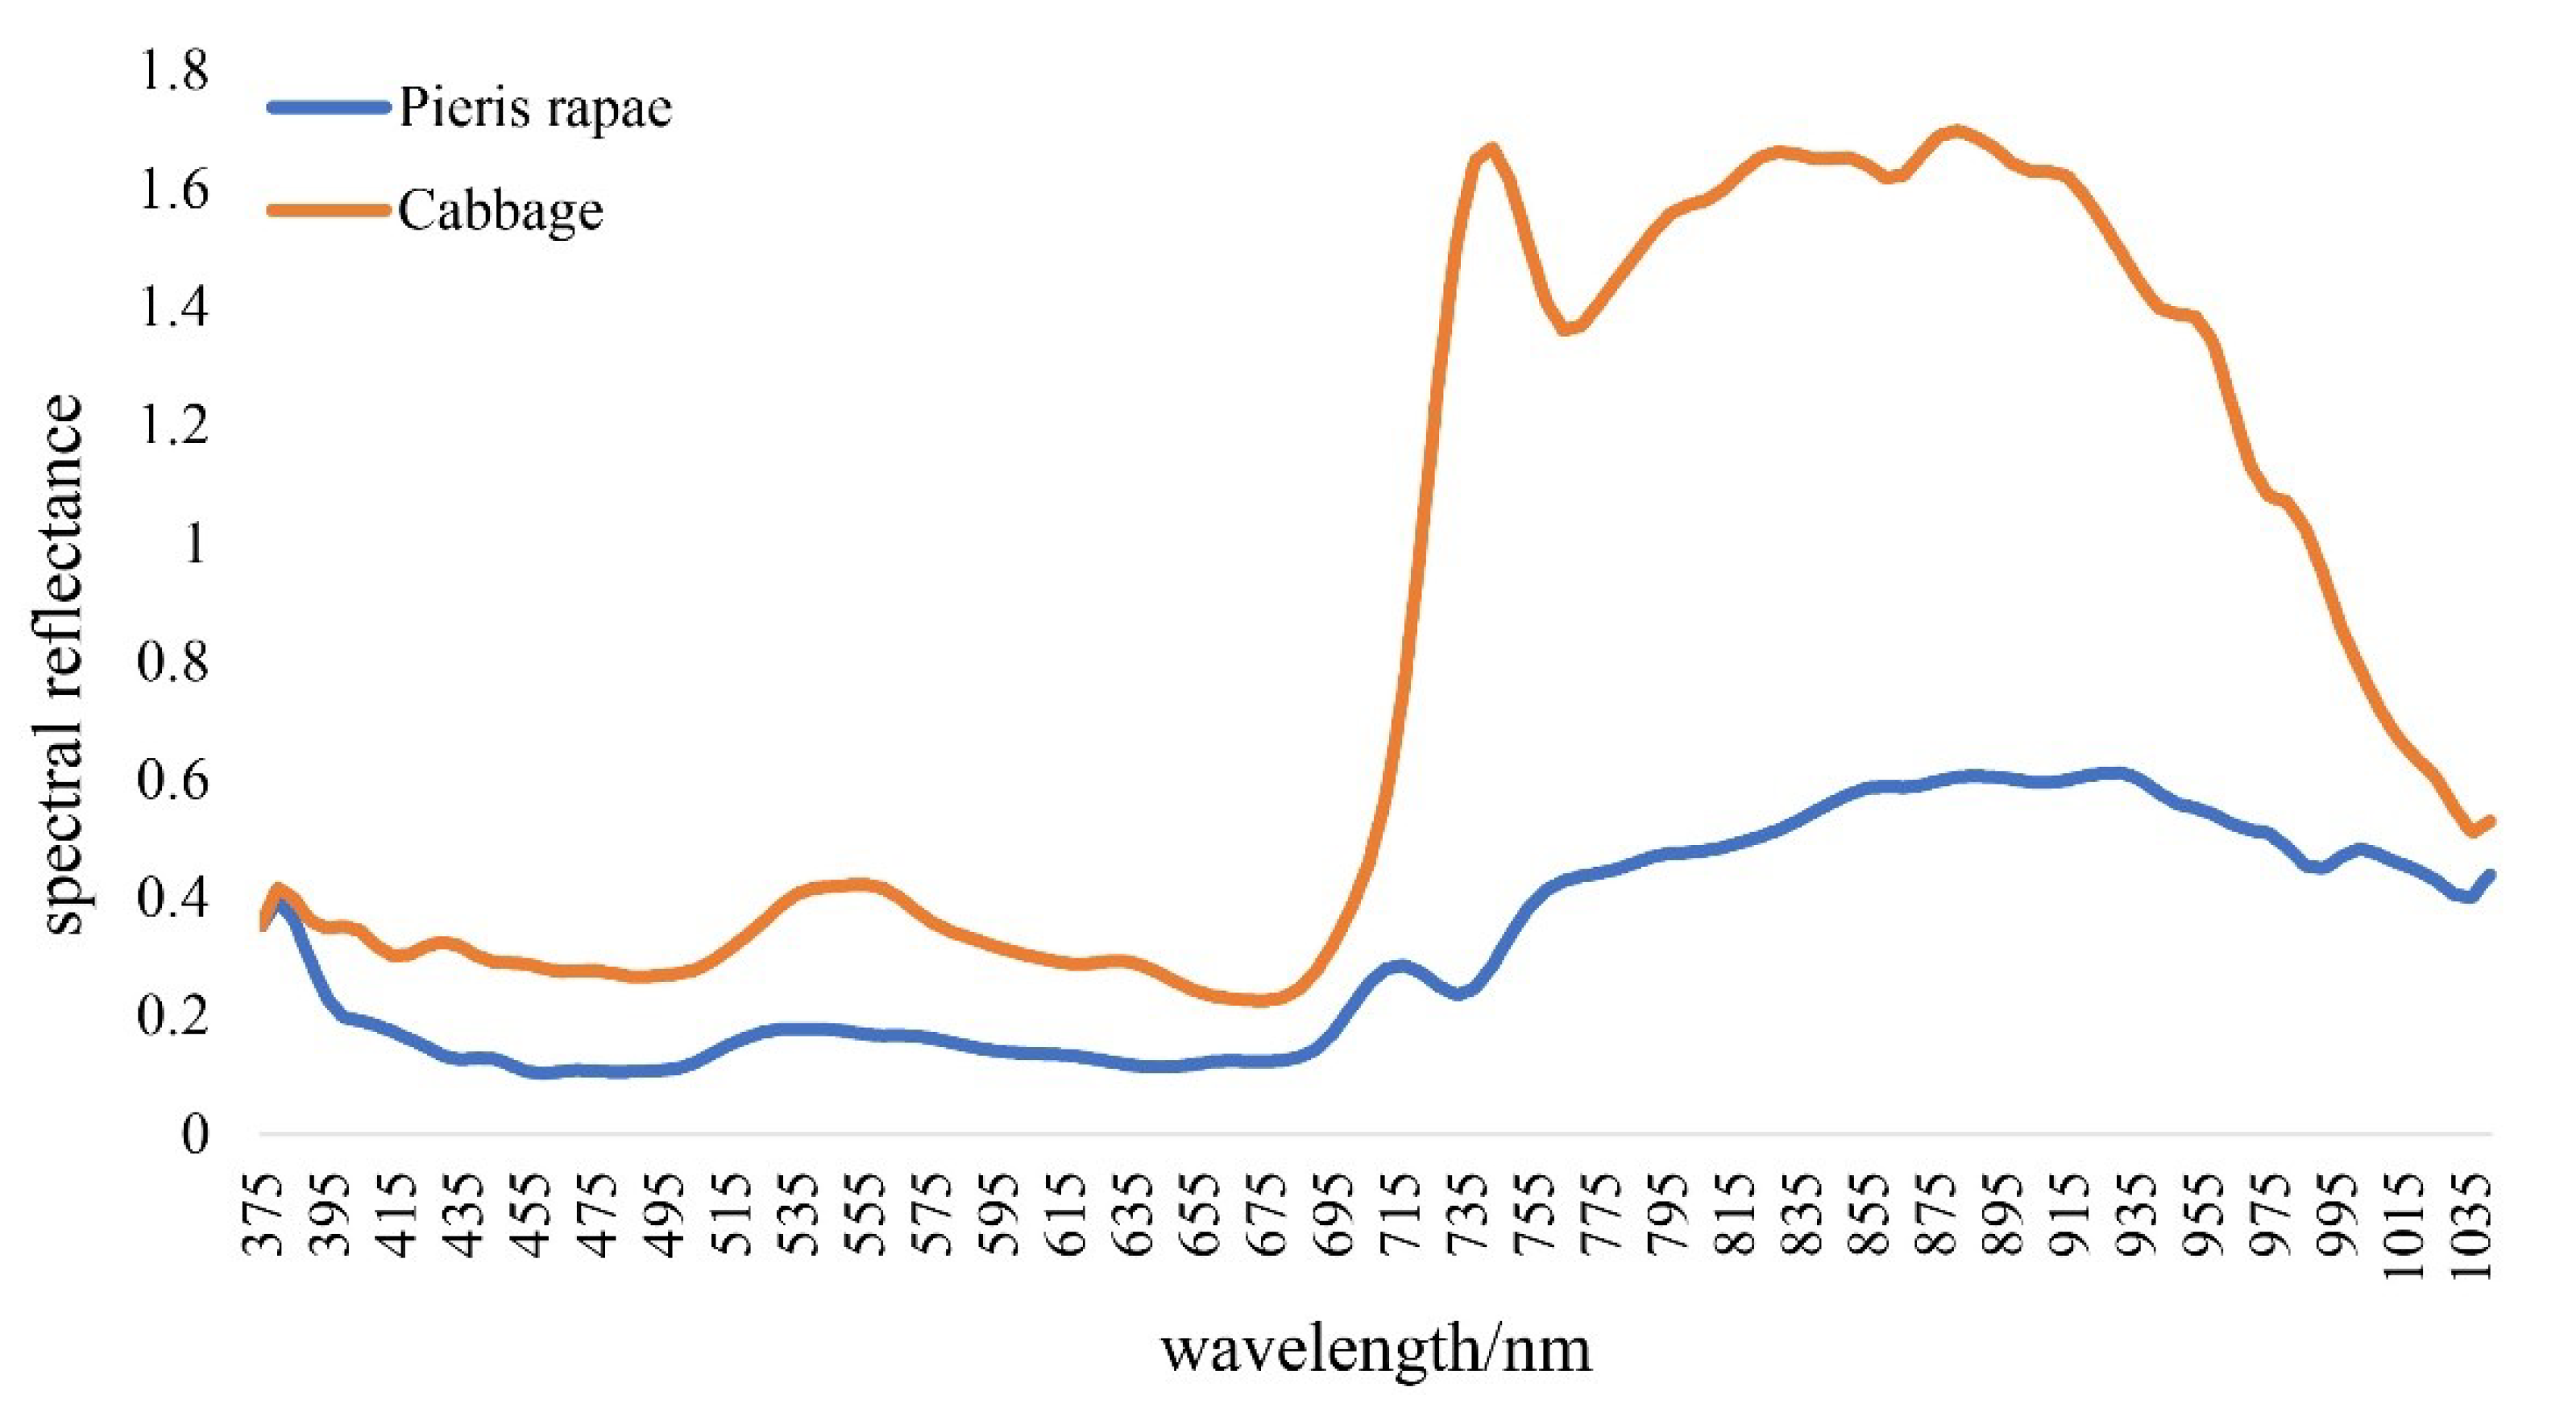
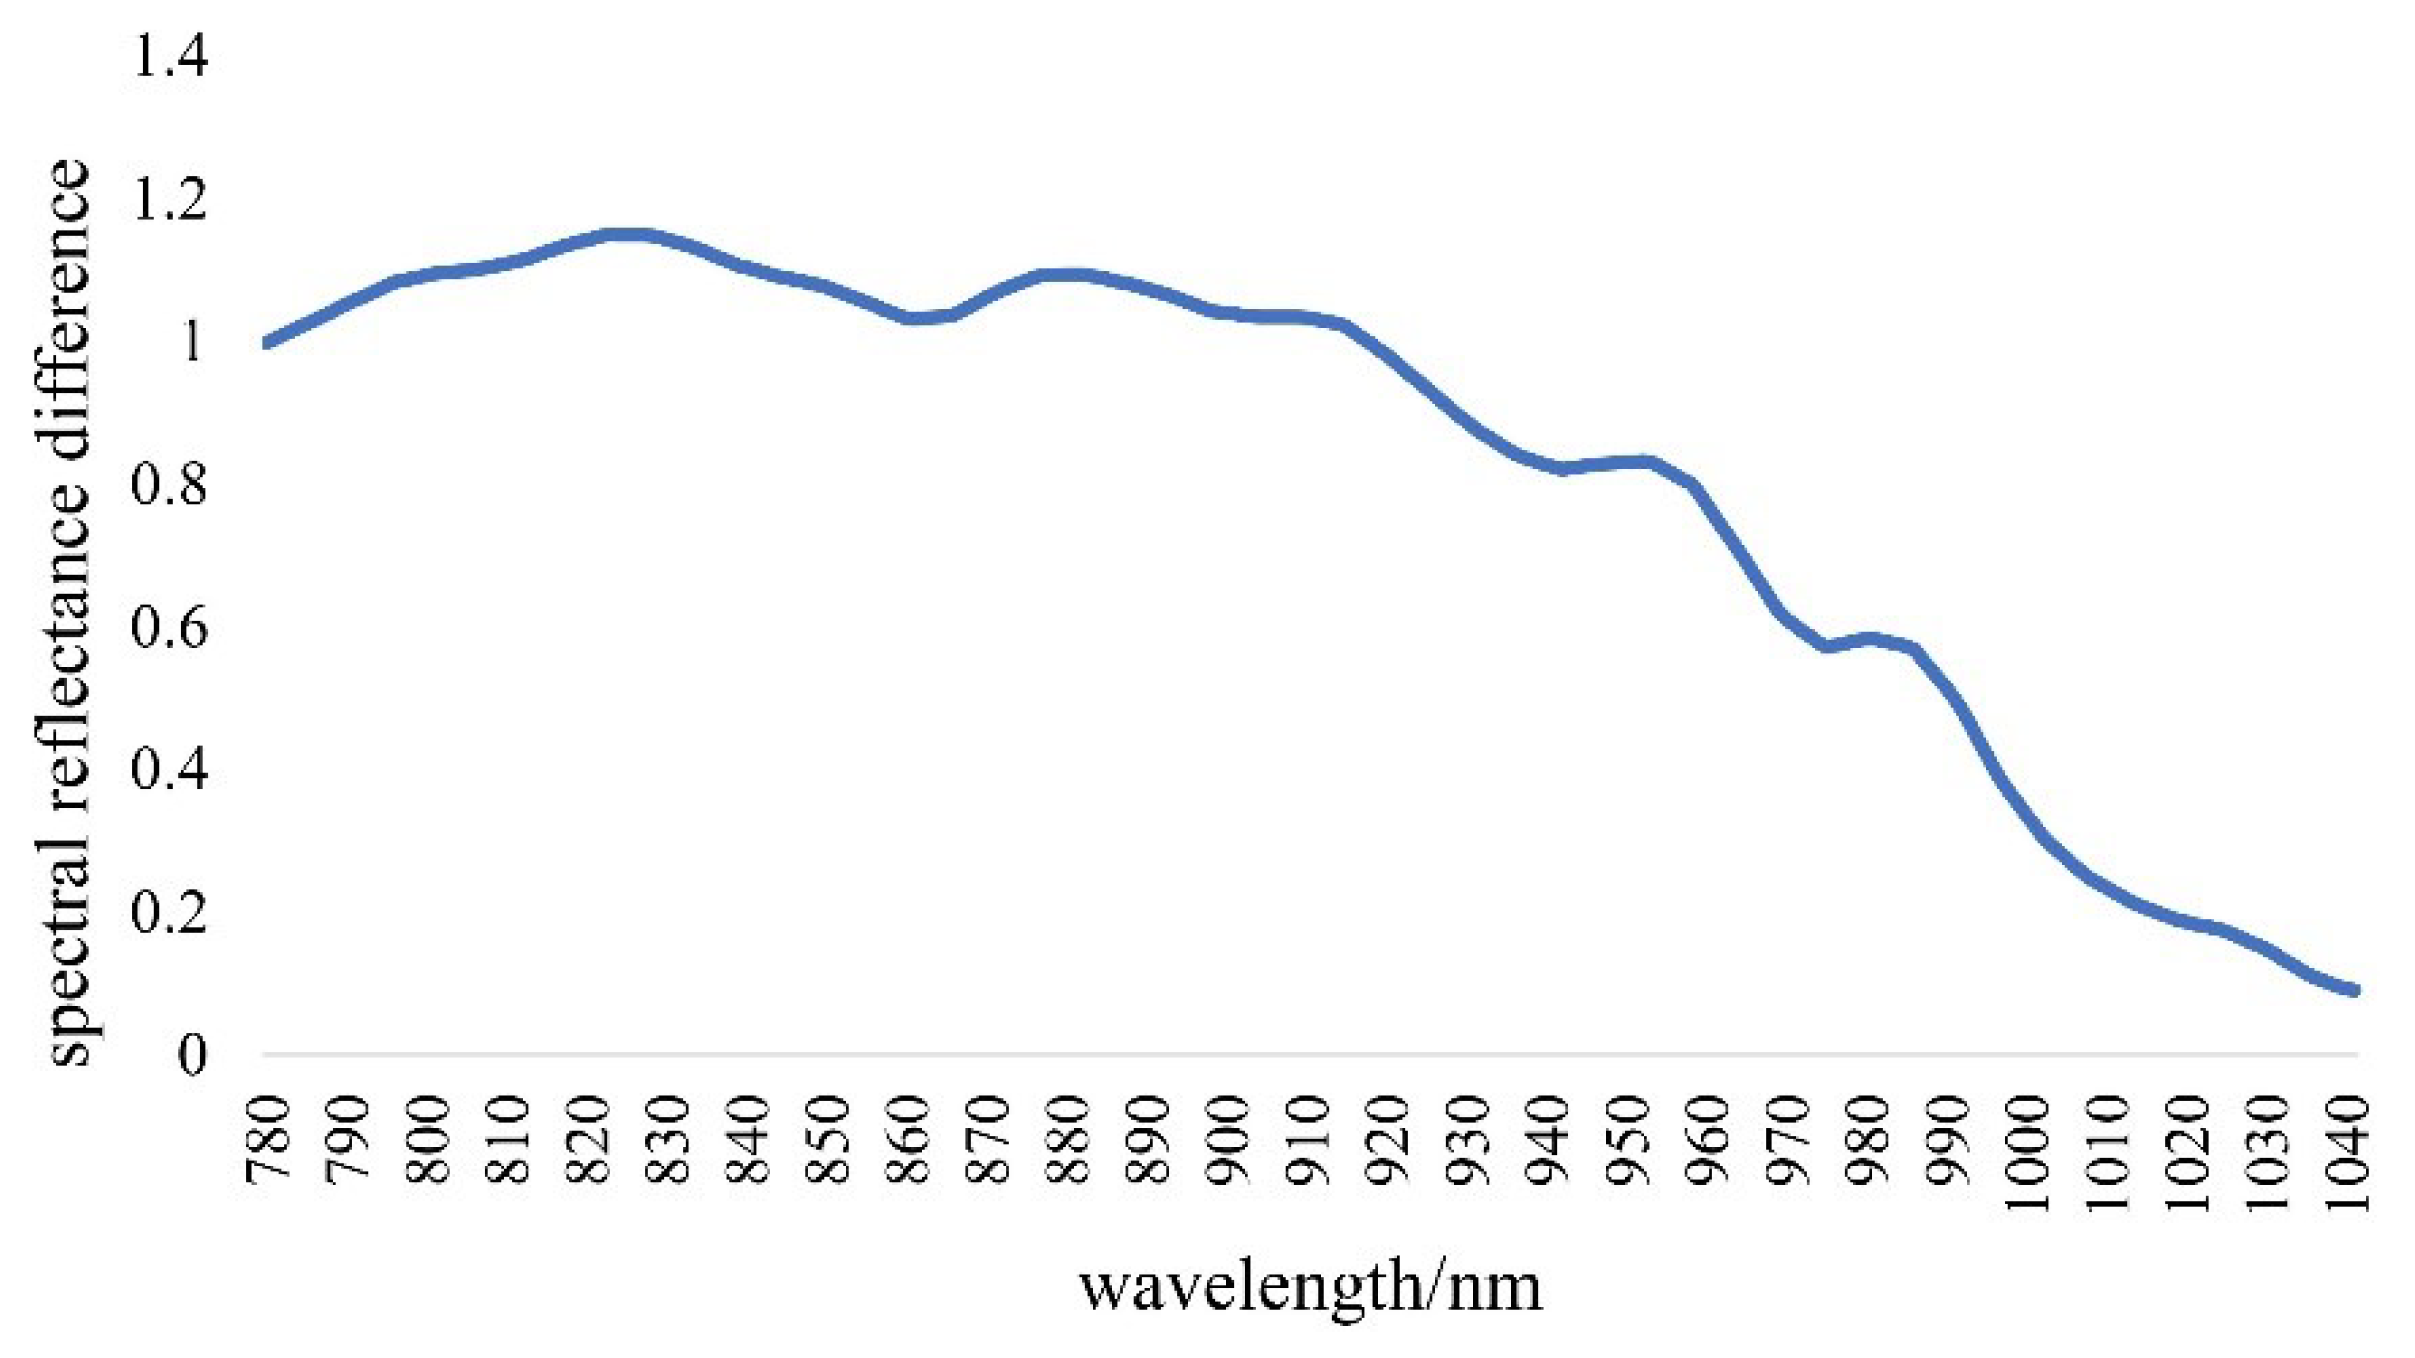
3.1. Comparison and Analysis of Spectral Characteristics

The comparison curve of spectral characteristics between cabbage and Pieris rapae is presented in Figure 7.
As observed from the figure, the spectral reflectance of cabbage was generally higher than that of Pieris rapae. In the visible band range of 375–690 nm, there was little difference in the spectral reflectance between cabbage and Pieris rapae. The spectral reflectance of cabbage was significantly different from that of Pieris rapae when the wavelength was greater than 690 nm. In the range of 780–1000 nm in the near-infrared band, there is a large difference in the spectral reflectance between cabbage and Pieris rapae. As shown in Figure 8, the spectral reflectance difference between cabbage and Pieris rapae is the largest at 823 nm wavelength. Based on the products of many filter production companies on the market, the optional filters in the near-infrared band range (780–1000 nm) are divided into 850 nm and 950 nm. Therefore, 850 nm infrared filter and 850 nm ring light source were selected to acquire pest images.
Cabbage is sensitive at 850 nm. Figure 4 and Figure 5 presents the pest image collected with an 850 nm infrared filter and 850 nm ring light source. It can be seen from the figures that the cabbage area is brighter in the pest image while the pest area is darker. Therefore, the application of an 850 nm infrared filter and 850 nm ring light source can clearly distinguish Pieris rapae from cabbage.

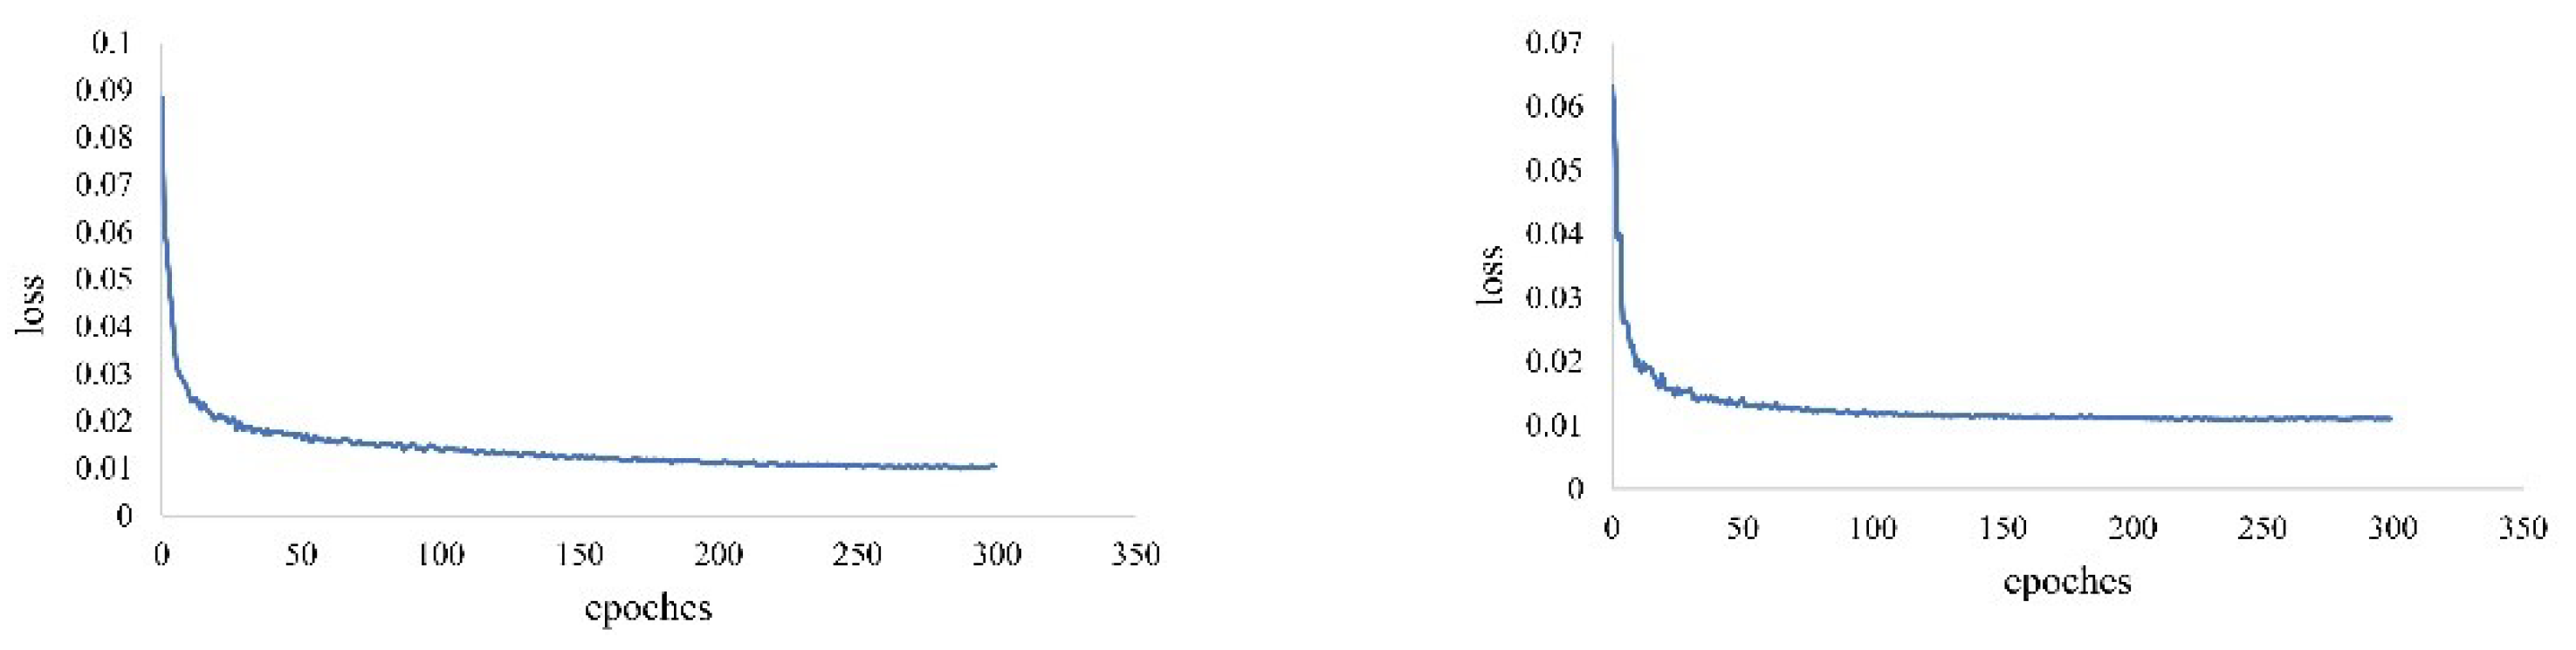
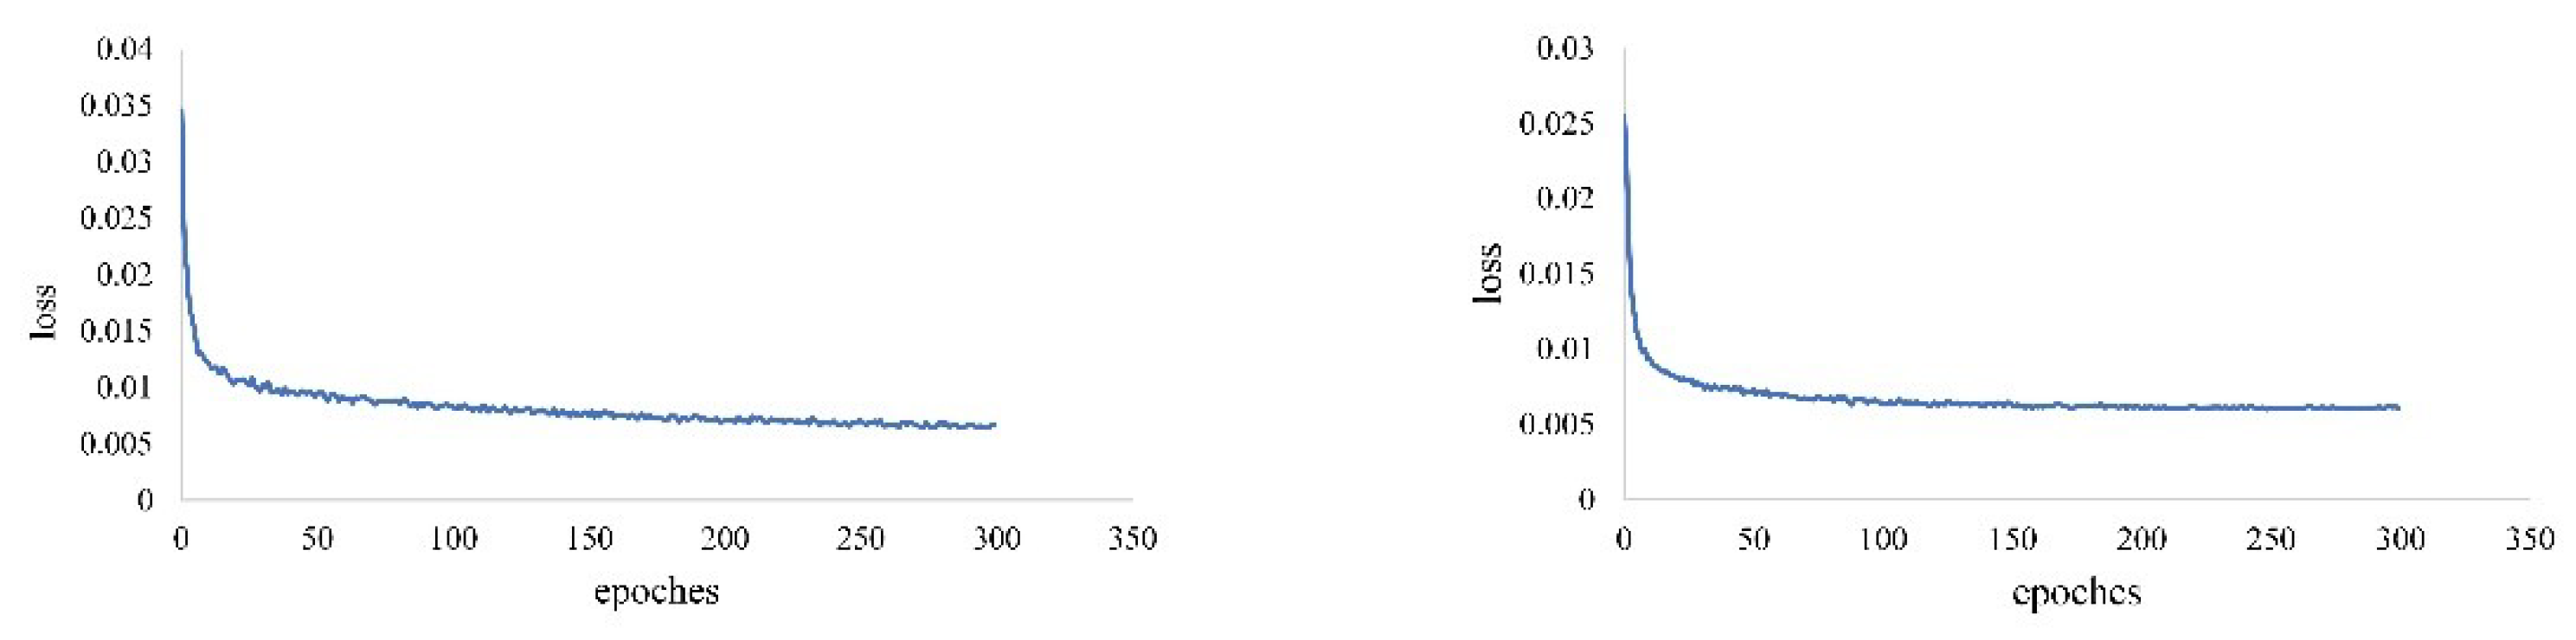
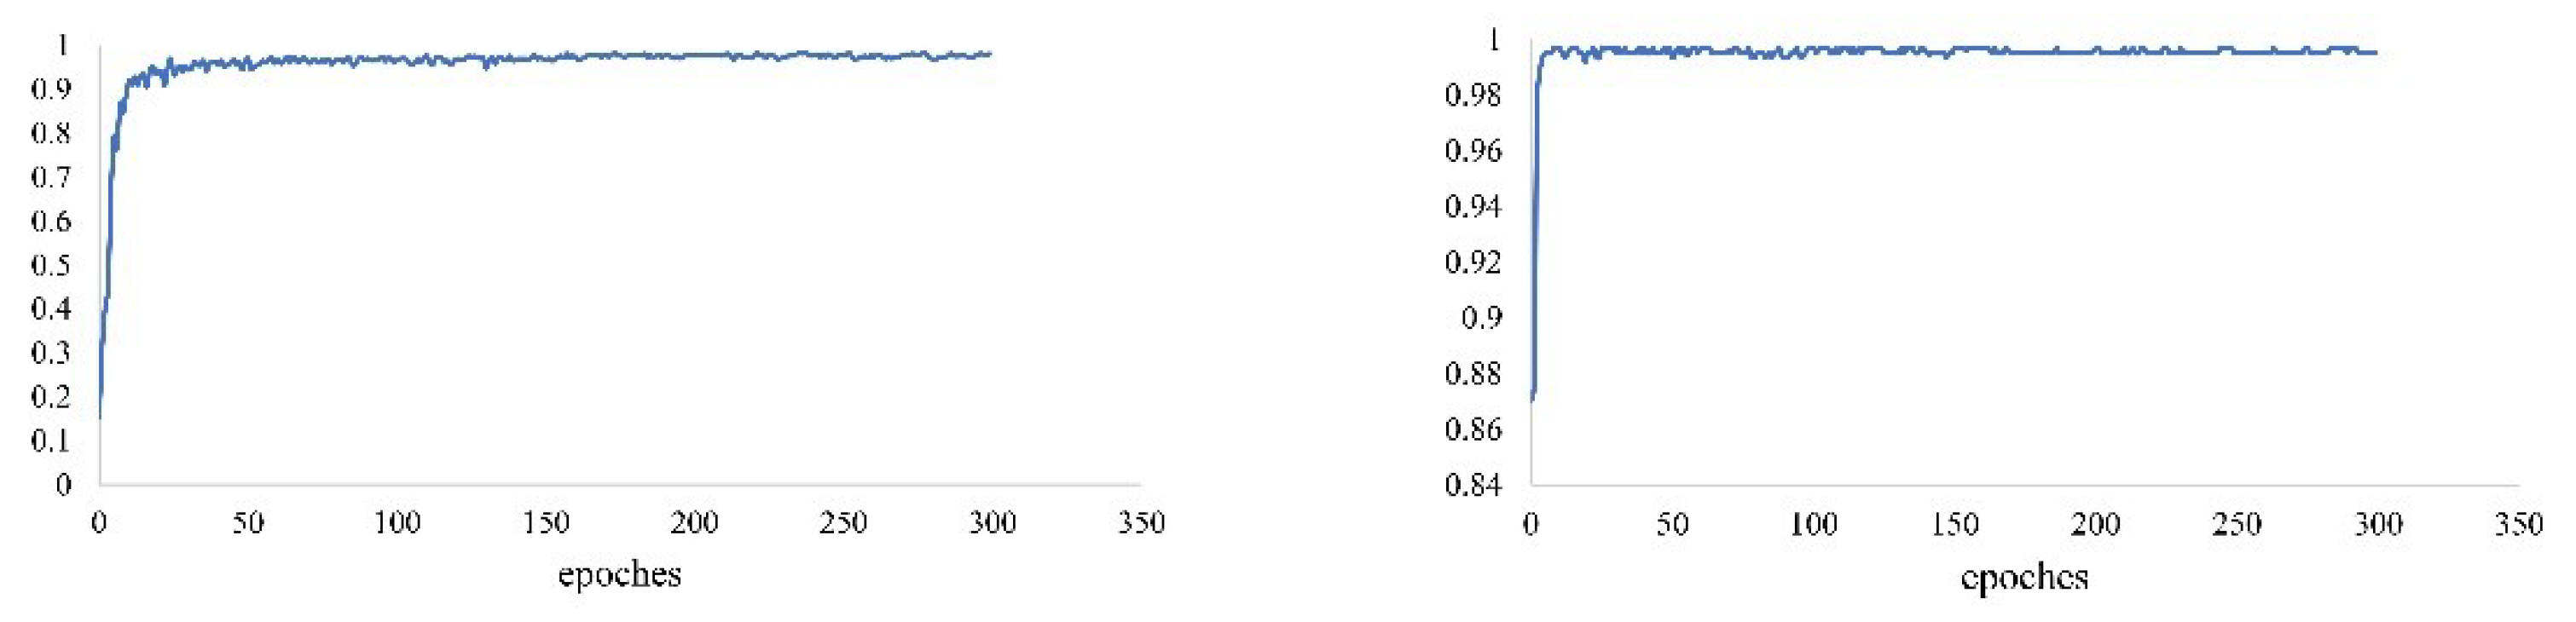
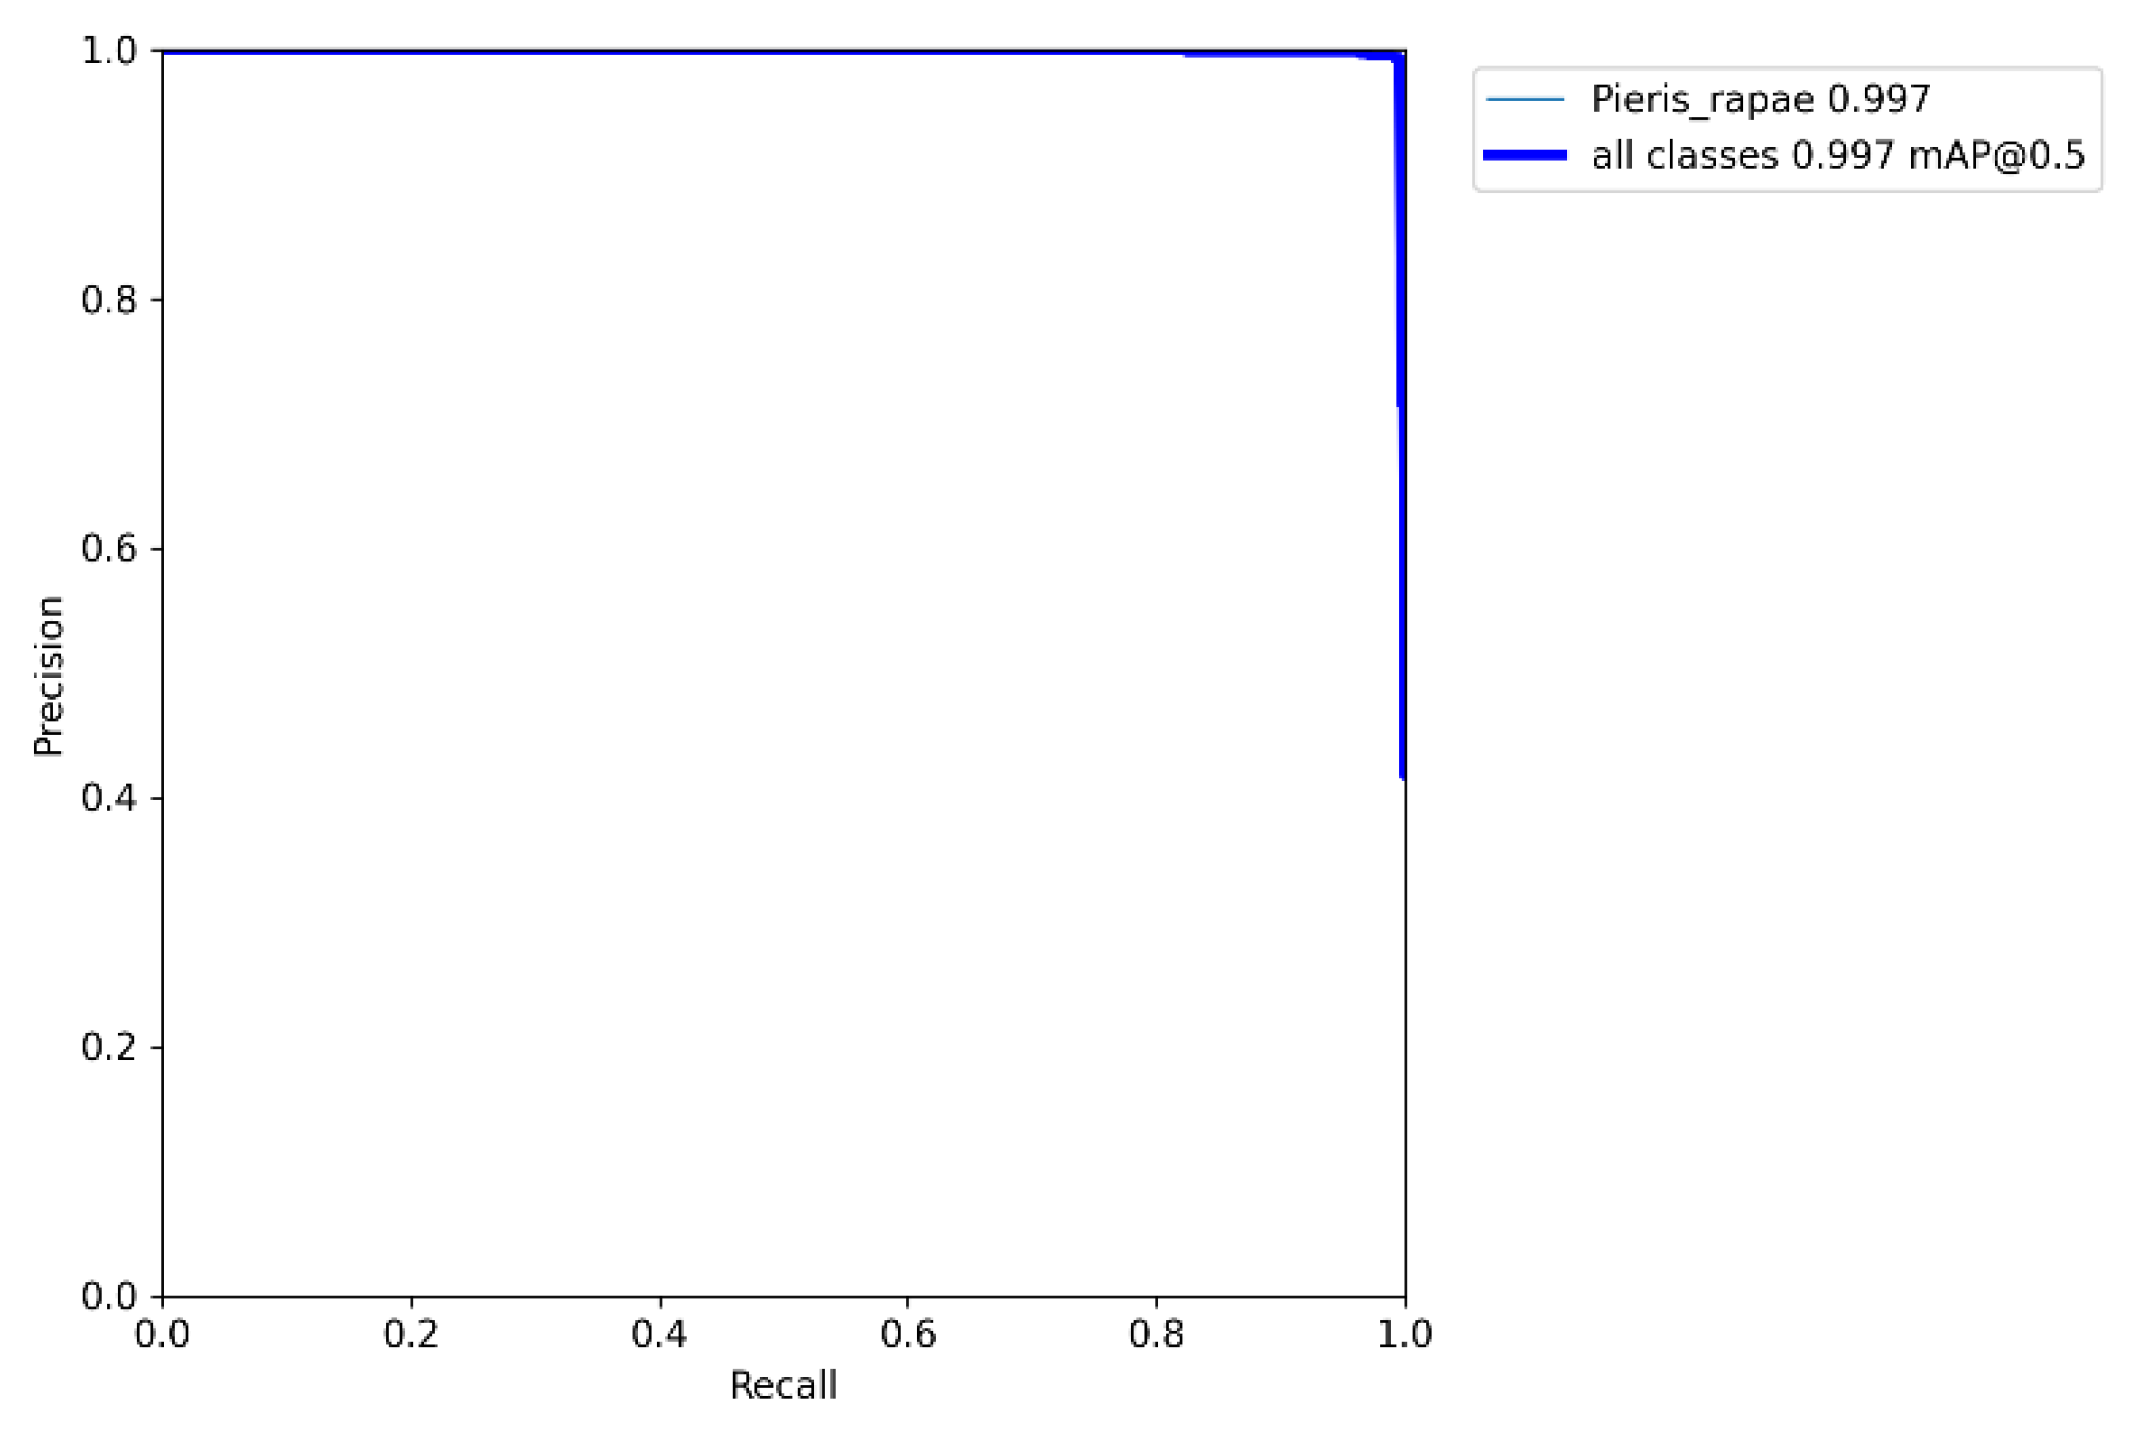
3.2. Model Training and Performance Evaluation

The operating system is Windows 10, the CPU (Center Processing Unit) is Intel (R) Xeon (R) CPU e5-2623 V3 × 2, the GPU (Graphic Process Unit) is NVIDIA geforce rtx2080 with 32 GB video memory, and the framework is pytoch.
After the training, we can get curves of loss value of bounding box, objectness and classification. Classification loss inspires how well the algorithm can predict the correct class of a given object [48]. Given only one identification target (Pieris rapae) in this paper and no classification of multiple objects, there is no curve of classification loss. As demonstrated in Figure 9, it represents curve of loss value of bounding box. The graph on the left shows the bounding box loss of the training set. The graph on the right shows the bounding box loss of the verification set. Box loss indicates the extent to which the algorithm can position the center of the target and the extent to which the predicted bounding box covers the target. The abscissa of the curve is the epoches of the algorithm, and the ordinate represents the value of box loss. The smaller the value of box loss, the more accurate the predicted bounding box is.
As demonstrated in Figure 10, it represents curve of the value of objectness loss. The graph on the left shows the objectness loss of the training set. The graph on the right shows the objectness loss of the verification set. Objectness loss measures the probability that an object exists in a proposed region of interest. If the objectivity is high, the bounding box is likely to contain an object. The abscissa of the curve is the epochs of the algorithm, and the ordinate represents the value of objectness loss. The smaller the value of objectness loss, the more accurate the target detection is.
The accuracy evaluation of the identification model mainly consists of visual comparison and performance evaluation index. The visual comparison is to obtain the missing detection and wrong detection of pests through comparison [49]. The performance evaluation index contains identification accuracy and identification speed. The speed index refers to the average time required to identify a pest image. The basic indicators of identification accuracy are precision (P) and recall (R). Precision indicates the proportion of the actual positive samples in the forecast samples to all positive samples. Recall indicates the proportion of actual positive samples in all predicted samples. The classification problem of Pieris rapae can be considered as a binary classification problem. In the classification problem, Pieris rapae is a positive sample and all types of background are negative samples. Assuming that the positive sample is expressed as T and the negative sample is expressed as P, the calculation formulas of precision and recall is as follows:
P = T P T P + F P
R = T P T P + F N
where TP represents the number of positive samples correctly predicted as positive samples, TN denotes the number of negative samples correctly predicted as negative samples, FP indicates the number of negative samples predicted as positive samples, and FN suggests the number of positive samples predicted as negative samples [50,51]. The curve of precision and recall are shown in Figure 11. The graph on the left shows the curve of precision. The graph on the right shows the curve of recall. The model improved swiftly in terms of precision and recall before plateauing after about 20 epochs.
P-R curve is a graph showing the relationship between precision and recall. The abscissa is recall and the ordinate is precision. The area enclosed by P-R curve and coordinate axis is the AP (Average Precision) of the model. The larger the area between the curve and the coordinate axis, the better its recognition effect. Figure 12 shows the P-R curve with a threshold of 0.5 generated in the training process. Since there is only one recognition target in this paper, the AP is equal to the mAP (mean Average Precision). The mAP is 99.7%. Additionally, the average time required to detect a pest image with a resolution of 480 × 460 is 0.56 s.

4. Conclusions

In this paper, a field pest identification method based on YOLOv5 and hyperspectral technology was proposed. The results have demonstrated that this method can effectively identify pests with protective color characteristics in the complex field environment.
In the process of collecting pest images, to realize the identification of pests with protective color characteristics, obtain the Pieris rapae and cabbage spectral information by hyperspectral technology before image acquisition, specific spectral characteristics of Pieris rapae and cabbage can be formed on the spectral curves. Comparing these two curves to get the wavelength with the largest reflectivity difference, and an appropriate infrared filter and ring light source are selected to build an image acquisition system. In order to improve the accuracy of pest identification, we collect pest images in different situations, expanded the original pest data set by data enhancement and select the appropriate target identification algorithm (YOLOv5). The detection results of the test set showed that compared with the existing research articles [37,38,52,53], the combination of YOLOv5 and hyperspectral technology can effectively identify field pests with protective color characteristics. This paper takes Pieris rapae and its host plant (cabbage) as the experimental object, its mAP was 99.7%, and the average time required to detect a pest image is 0.56 s.
Considering the future application scenario of pest identification, the current algorithm has some limitations in detection speed. In order to improve the detection speed of target detection algorithm, efficient models can be designed to accelerate the algorithms, such as decreasing the redundancy in weights by network pruning and knowledge distillation. While improving the detection speed, how to ensure the detection accuracy is also an aspect to be considered in the future. In addition, although only one pest with protective color characteristics (Pieris rapae) is considered in this paper, the relevant literature has proved that the near-infrared technology can distinguish the target objects with similar appearance characteristics and background [24], so this method can still be used to identify other pests with protective color characteristics and their host plants. For different pests, only the wavelength with the largest spectral reflectance difference between pests with protective color characteristics and their host plants needs to be obtained through hyperspectral test, so as to select the appropriate infrared filter. Replace the original infrared filter on the original image acquisition platform. That is, almost the same setting can be implemented in many different situations. In the future, other pests with protective color characteristics will be tested to further improve the universality of this method.

Author Contributions

Conceptualization, Z.H. and Y.X.; methodology, Z.H., Y.X. and Y.L.; software, Z.H. and Y.L.; validation, Z.H., Y.L. and A.L.; investigation, Z.H., Z.L., X.D. and X.L.; resources, Y.X.; data curation, Z.H., X.L. and Z.T.; writing—original draft preparation, Z.H., Y.L. and Y.X.; writing—review and editing, Y.X.; visualization, Z.H.; supervision, Y.X.; funding acquisition, Y.X. All authors have read and agreed to the published version of the manuscript.

Funding

This research was funded by the Natural Science Foundation of Hunan Province of China and grant number 2021JJ30363”, and the Scientific Research Fund of the Hunan Provincial Education Department of China and grant number 19A224.

Institutional Review Board Statement

Not applicable.

Informed Consent Statement

Not applicable.

Data Availability Statement

All data are presented in this article in the form of figures and tables.

Acknowledgments

We gratefully acknowledge the Yunyuan Scientific Research Base (Hunan Agricultural University, Changsha) for providing us with insects and cabbage leaves.

Conflicts of Interest

The authors declare no conflict of interest.

References

  1. Yao, Q.; Chen, G.T.; Wang, Z.; Zhang, C.; Yang, B.J.; Tang, J. Automated detection and identification of white-backed planthoppers in paddy fields using image processing. J. Integr. Agric. 2017, 16, 1547–1557. [Google Scholar] [CrossRef]
  2. Feng, H.Q.; Yao, Q. Automatic identification and monitoring technologies of agricultural pest insects. Plant Prot. 2018, 44, 127–133. [Google Scholar]
  3. Li, W.Y.; Li, M.; Chen, M.X.; Qian, J.P.; Sun, C.H.; Du, S.F. Feature extraction and classification method of multi-pose pests using machine vision. Trans. Chin. Soc. Agric. Eng. 2014, 30, 154–162. [Google Scholar]
  4. Chen, M.X.; Yang, X.T.; Shi, B.C.; Li, W.Y.; Du, X.W.; Li, M.; Sun, C.H. Research progress and prospect of technologies for automatic identifying and counting of pests. J. Environ. Entomol. 2015, 37, 176–183. [Google Scholar]
  5. Tian, R.; Chen, M.X.; Dong, D.M.; Li, W.Y.; Jiao, L.Z.; Wang, Y.Z.; Li, M.; Sun, C.H.; Yang, X.T. Identification and counting method of orchard pests based on fusion method of infrared sensor and machine vision. Trans. Chin. Soc. Agric. Eng. 2016, 32, 195–201. [Google Scholar]
  6. He, H.M.; Liu, L.N.; Munir, S.; Bashir, N.H.; Wang, Y.; Yang, J.; Li, C.Y. Crop diversity and pest management in sustainable agriculture. J. Integr. Agric. 2019, 18, 1945–1952. [Google Scholar] [CrossRef]
  7. Dong, W.; Qian, R.; Zhang, J.; Zhang, L.P.; Chen, H.B.; Zhang, M.; Zhu, J.B.; Bu, Y.Q. Vegetable lepidopteran pest auto recognition and detection counting based on deep learning. J. Agric. Sci. Technol. 2019, 21, 76–84. [Google Scholar]
  8. Lyu, Z.W.; Jin, H.F.; Zhen, T.; Sun, F.Y. Application development of image processing technologies in grain pests identification. J. Henan Univ. Technol. (Nat. Sci. Ed.) 2021, 42, 128–137. [Google Scholar]
  9. Lu, S.H.; Ye, S.J. Using an image segmentation and support vector machine method for identifying two locust species and instars. J. Integr. Agric. 2020, 19, 1301–1313. [Google Scholar] [CrossRef]
  10. Zhang, G.C.; Zhang, D.X.; Li, B.L.; Sun, Y.G. Present situation and prospects of storage pests based on vision inspection technology. J. Chin. Cereals Oils Assoc. 2014, 29, 124–128. [Google Scholar]
  11. Zhang, W.F.; Guo, M. Stored grain insect image segmentation method based on graph cuts. Sci. Technol. Eng. 2010, 10, 1661–1664. [Google Scholar]
  12. Ebrahimia, M.A.; Khoshtaghaza, M.H.; Minaei, S.; Jamshidi, B. Vision-based pest detection based on SVM classification method. Comput. Electron. Agric. 2017, 137, 52–58. [Google Scholar] [CrossRef]
  13. Yao, Q.; Lv, J.; Liu, Q.J.; Diao, G.Q.; Yang, B.J.; Chen, H.M.; Tang, J. An insect imaging system to automate rice light-trap pest identification. J. Integr. Agric. 2012, 11, 978–985. [Google Scholar] [CrossRef]
  14. Wen, C.L.; Guyer, D.E.; Li, W. Local feature-based identification and classification for orchard insects. Biosyst. Eng. 2009, 104, 299–307. [Google Scholar] [CrossRef]
  15. Zhang, S.W.; Shao, Y.; Qi, G.H.; Xu, X.H. Crop pest detection based on multi-scale convolutional network with attention. Jiangsu J. Agric. Sci. 2021, 37, 579–588. [Google Scholar]
  16. Luo, Q.; Huang, R.L.; Zhu, Y. Real-time monitoring and prewarning system for grain storehouse pests based on deep learning. J. Jiangsu Univ. (Nat. Sci. Ed.) 2019, 40, 203–208. [Google Scholar]
  17. Zhang, D.X.; Zhao, W.J. The classification of stored grain pests based on convolutional neural network. In Proceedings of the 2nd International Conference on Mechatronics and Information Technology (ICMIT), Dalian, China, 13–14 May 2017. [Google Scholar]
  18. Lu, J.; Wang, J.L.; Zhu, S.H.; He, R.Y. Classification of rice planthoppers image based on feature optimization. J. Nanjing Agric. Univ. 2019, 42, 767–774. [Google Scholar]
  19. Zhang, Y.S.; Zhao, Y.D.; Yuan, M.C. Insect identification and counting based on an improved Faster-RCNN model of the sticky board image. J. China Agric. Univ. 2019, 24, 115–122. [Google Scholar]
  20. Patel, D.J.; Bhatt, N. Insect identification among deep learning’s meta-architectures using TensorFlow. Int. J. Eng. Adv. Technol. 2019, 9, 1910–1914. [Google Scholar] [CrossRef]
  21. Thenmozhi, K.; Reddy, U.S. Crop pest classification based on deep convolutional neural network and transfer learning. Comput. Electron. Agric. 2019, 164, 104906. [Google Scholar] [CrossRef]
  22. Rustia, D.J.A.; Lin, C.E.; Chung, J.Y.; Lin, T.T. A real-time multi-class insect pest identification method using cascaded convolutional neural networks. In Proceedings of the 9th International Symposium on Machinery and Mechatronics for Agriculture and Biosystems Engineering (ISMAB), Jeju, Korea, 28 May 2018. [Google Scholar]
  23. Bastide, B.; Porter, G.; Renshaw, A. Detection of latent bloodstains at fire scenes using reflected infrared photography. Forensic Sci. Int. 2019, 302, 109874. [Google Scholar] [CrossRef] [PubMed]
  24. Wu, X. Study on Identification of Pests Based on Machine Vision. Ph.D. Thesis, Zhejiang University, Hangzhou, China, April 2016. [Google Scholar]
  25. Perez, M.J.; Throne, J.E.; Dowell, F.E.; Baker, J.E. Chronological age-grading of three species of stored-product beetles by using near-infrared spectroscopy. J. Econ. Entomol. 2004, 97, 1159–1167. [Google Scholar] [CrossRef]
  26. Zhang, Y.F.; Yu, G.Y.; Han, L.; Guo, T.T. Identification of four moth larvae based on near-infrared spectroscopy technology. Spectrosc. Lett. 2015, 48, 1–6. [Google Scholar] [CrossRef]
  27. Kaya, T.S.; Huck, C.W. A review of mid-infrared and near-infrared imaging: Principles, concepts and applications in plant tissue analysis. Molecules 2017, 22, 168. [Google Scholar] [CrossRef] [PubMed] [Green Version]
  28. Amir, A.; Ehsan, A.; Seyedeh, M.K.; Yu, H.; Seunghoon, H.; Andrei, F. Miniature optical planar camera based on a wide-angle metasurface doublet corrected for monochromatic aberrations. Nat. Commun. 2016, 7, 13682. [Google Scholar]
  29. Li, J.; Han, Z.; Wang, W.L.; Cui, Y.R. OverFeat model for vegetation classification in Nanhui tidal flat of the Yangtze Estuary. Ecol. Sci. 2019, 38, 135–141. [Google Scholar]
  30. Li, Y.J.; Xiang, Y.; Yang, Z.X.; Han, X.Z.; Lin, J.W.; Hu, Z.F. A laser irradiation method for controlling Pieris rapae larvae. Appl. Sci. 2021, 11, 9533. [Google Scholar] [CrossRef]
  31. Di, J.; Qu, J.H. A detection method for apple leaf diseases based on Tiny-YOLO. J. Shandong Norm. Univ. (Nat. Sci.) 2020, 35, 78–83. [Google Scholar]
  32. Pu, W.; Xiao, B.; Zhang, K.J.; Hou, T.P. The pilot studies on the screening and bioactivity of insecticidal plants against Pieris rapae (L). J. Sichuan Univ. (Nat. Sci. Ed.) 2004, 1, 184–188. [Google Scholar]
  33. Ren, D.; Yu, H.Y.; Fu, W.W.; Zhang, B.; Ji, Q. Crop diseases and pests monitoring based on remote sensing: A survey. In Proceedings of the 2010 Conference on Dependable Computing, Yichang, China, 20–22 November 2010. [Google Scholar]
  34. Shi, Y.; Huang, W.J.; Luo, J.H.; Huang, L.S.; Zhou, X.F. Detection and discrimination of pests and diseases in winter wheat based on spectral indices and kernel discriminant analysis. Comput. Electron. Agric. 2017, 141, 171–180. [Google Scholar] [CrossRef]
  35. Zhang, Y.J. Image recognition of agricultural pest based on improved support vector machine. J. Chin. Agric. Mech. 2021, 42, 146–152. [Google Scholar]
  36. Zhu, L.; Luo, J.; Xu, S.Y.; Yang, Y.; Zhao, H.T.; Li, W.H. Machine vision recognition of rapeseed pests based on color feature. J. Agric. Mech. Res. 2016, 38, 55–58. [Google Scholar]
  37. Zhong, C.Y.; Li, X.; Liang, C.B.; Xue, Y.Z. A cabbage caterpillar detection method based on computer vision. Shanxi Electron. Technol. 2020, 164, 84–86. [Google Scholar]
  38. Gao, X.; Tang, Y.; Chen, T.Y.; Cui, H.M.; Wang, H.B. Research on cabbage pest identification based on image processing. Jiangsu Agric. Sci. 2017, 45, 235–238. [Google Scholar]
  39. Song, G.L.; Yu, J.L.; Liu, F.; He, Y.; Chen, D.; Mo, W.C. Study on the live state of Pieris rapaes using near infrared hyperspectral imaging technology. Spectrosc. Spectral Anal. 2014, 34, 2225–2228. [Google Scholar]
  40. Qiao, X.J.; Jiang, J.B.; Li, H.; Qi, X.T.; Yuan, D.S. Spectral analysis and index models to identify moldy peanuts using hyperspectral images. Spectrosc. Spectr. Anal. 2018, 38, 535–539. [Google Scholar]
  41. Redmon, J.; Divvala, S.K.; Girshick, R.; Farhadi, A. You only look once: Unified, real-time object detection. In Proceedings of the IEEE Conference on Computer Vision and Pattern Recognition (CVPR), Las Vegas, NV, USA, 1 June 2016. [Google Scholar]
  42. Cui, T.J.; Wang, L.X. Research on application of YOLOv4 object detection algorithm in monitoring on masks wearing of coal miners. J. Saf. Sci. Technol. 2021, 17, 66–71. [Google Scholar]
  43. Redmon, J.; Farhadi, A. YOLO9000: Better, faster, stronger. In Proceedings of the IEEE Conference on Computer Vision and Pattern Recognition (CVPR), Honolulu, HI, USA, 21–26 July 2017. [Google Scholar]
  44. Zhao, D.A.; Wu, R.D.; Liu, X.Y.; Zhao, Y.Y. Apple positioning based on YOLO deep convolutional neural network for picking robot in complex background. Trans. Chin. Soc. Agric. Eng. 2019, 35, 164–173. [Google Scholar]
  45. Yang, L.; Chen, S.X.; Cui, G.H.; Zhu, X.H. Recognition and localization method of workpiece based on improved YOLOv4. Modul. Mach. Tool Autom. Manuf. Tech. 2021, 10, 28–32. [Google Scholar]
  46. Wu, Z.J.; Chen, H.; Peng, Y.; Song, W. Visual SLAM with lightweight YOLOv5s in dynamic environment. Comput. Eng. 2021, 47, 1–11. [Google Scholar]
  47. Zhou, F.B.; Zhao, H.L.; Nie, Z. Safety Helmet Detection Based on YOLOv5. In Proceedings of the IEEE International Conference on Power Electronics, Computer Applications (ICPECA), Shenyang, China, 22–24 January 2021. [Google Scholar]
  48. Kasper-Eulaers, M.; Hahn, N.; Berger, S.; Sebulonsen, T.; Myrland, Ø.; Kummervold, P.E. Detecting heavy goods vehicles in rest areas in winter conditions using YOLOv5. Algorithms 2021, 14, 114. [Google Scholar] [CrossRef]
  49. Jiang, Y.; Zhang, H.; Chen, L.; Tao, S.X. An image data augmentation algorithm based on convolutional neural networks. Comput. Eng. Sci. 2019, 41, 2007–2016. [Google Scholar]
  50. Yao, Q.; Feng, J.; Tang, J.; Xu, W.G.; Zhu, X.H.; Yang, B.J.; Lu, J.; Xie, Y.Z.; Yao, B.; Wu, S.Z.; et al. Development of an automatic monitoring system for rice light-trap pests based on machine vision. J. Integr. Agric. 2020, 19, 2500–2513. [Google Scholar] [CrossRef]
  51. Wu, W.; Yang, T.L.; Li, R.; Chen, C.; Liu, T.; Zhou, K.; Sun, C.M.; Li, C.Y.; Zhu, X.K.; Guo, W.S. Detection and enumeration of wheat grains based on a deep learning method under various scenarios and scales. J. Integr. Agric. 2020, 19, 1998–2008. [Google Scholar] [CrossRef]
  52. Wu, X.; Zhang, W.Z.; Qiu, Z.J.; Cen, H.Y.; He, Y. A novel method for detection of Pieris rapae larvae on cabbage leaves using NIR hyperspectral imaging. Appl. Eng. Agric. 2016, 32, 311–316. [Google Scholar]
  53. Gao, X.; Wang, H.C. Research on cabbage rapae pests automatic recognition system based on machine vision. J. Agric. Mech. Res. 2015, 37, 205–208. [Google Scholar]
Figure 1. Field pests with protective color characteristics.
Applsci 12 03810 g001
Figure 2. Schematic diagram of the hyperspectral test. (a) Spectrometer, (b) lens, (c) halogen lamp, (d) pest sample, and (e) objective table.
Applsci 12 03810 g002
Figure 3. Schematic diagram of the relative position of camera, filter, and ring light source. (a) The imaging source, (b) the industrial lens, (c) 850 nm infrared filter, and (d) 850 nm ring light source.
Applsci 12 03810 g003
Figure 4. Pest images in different states. (a) Crouching pests, (b) Extended pest, (c) A pest, (d) Multiple pests, (e) Unobstructed pests, (f) Sheltered pests, (g) Pest on the left side of the image, (h) Pest in the middle of the image.
Applsci 12 03810 g004
Figure 5. Data enhanced pest image. (a) Image rotation, (b) image flip, (c) image translation, and (d) change the brightness of the image.
Applsci 12 03810 g005
Figure 6. YOLOv5 structure.
Applsci 12 03810 g006
Figure 7. Comparison curve of average spectral characteristics between cabbage and Pieris rapae.
Applsci 12 03810 g007
Figure 8. Curve of spectral reflectance difference between cabbage and Pieris rapae.
Applsci 12 03810 g008
Figure 9. Curve of loss value of bounding box.
Applsci 12 03810 g009
Figure 10. Curve of objectness loss.
Applsci 12 03810 g010
Figure 11. Curve of precision and recall.
Applsci 12 03810 g011
Figure 12. P-R curve.
Applsci 12 03810 g012
Publisher’s Note: MDPI stays neutral with regard to jurisdictional claims in published maps and institutional affiliations.

