Article

Blade Shape Optimization and Analysis of a Propeller for VTOL Based on an Inverse Method

School of Aeronautic Science and Engineering, Beihang University, Beijing 100191, China
*
Author to whom correspondence should be addressed.
Appl. Sci. 2022, 12(7), 3694; https://doi.org/10.3390/app12073694
Submission received: 15 March 2022 / Revised: 1 April 2022 / Accepted: 5 April 2022 / Published: 6 April 2022
(This article belongs to the Section Aerospace Science and Engineering)

Abstract

:
With the rapid development of vertical takeoff and landing (VTOL) aircraft, the blade design of a propeller suitable for VTOL aircraft with a wide range of operating conditions has become a challenging and popular task. This paper proposes a multi-objective optimization framework for a VTOL propeller using an inverse design method at the cruising stage, which is developed from the Betz optimum theory and blade element momentum theory (BEMT). Different from passing studies, the maximum thrust-to-weight ratio at hover (MTWRH) is taken as one of the two objectives in this paper, which is closely related to the wind-resistance capability and maneuverability during takeoff and landing. The other objective is the energy consumption of the whole mission profile. A fixed pitch propeller (FPP) and a variable pitch propeller (VPP) are both optimized using the proposed framework for the Vahana A3 tilt-wing aircraft and validated by the computational fluid dynamics (CFD) method. The influences of the level flight energy ratio, hover disk loading and cruising speed toward the optimization result are analyzed, respectively. The results show that the MTWRH has a significant impact on the optimization result both for the FPP and VPP. A comparison between the two propeller forms validates the advantages of the VPP both in energy saving and takeoff maneuverability. The quantitative rules of this advantage with the level flight energy ratio are calculated to provide a reference for choosing the appropriate form. Overall, the methodology and general rules presented in this paper support the propeller optimization and form selection for VTOL aircraft.

1. Introduction

With the rapid development of flight control technology and electric propulsion systems, vertical takeoff and landing (VTOL) aircraft have attracted a wide range of studies. Tilt-rotor and tilt-wing aircraft are the two most widely used VTOL aircraft in cargo transportation and urban flight, for example [1,2,3,4,5,6]. The propellers applied to tilt-wing or tilt-rotor aircraft work in a wide range of operation conditions and may have two forms; a variable pitch propeller (VPP) or a fixed pitch propeller (FPP). Several VPPs participate in attitude control through a cyclic pitch mechanism, which are, in fact, helicopter rotors such as those used on the Osprey V-22 [7] and Bell Eagle Eye [8]. A few VPPs include only a collective pitch mechanism; attitude control is achieved through the difference between the collective pitch and/or the revolutionary speed of multiple propellers (greater than or equal to three) such as those used on the Boeing Vahana A3 [9] and Joby S4 [10]. FPPs are mostly used in micro VTOL UAVs or demonstrators to reduce the system complexity such as the GL-10 [11] and QTW-UAV [12]. The research of this paper does not involve cyclic pitch propellers; i.e., helicopter rotors.
The distinct difference between the vertical flight mode and the level flight mode increases the difficulty of blade shape optimization. On one hand, the required thrust during VTOL is roughly several times that of the level flight mode. On the other hand, the advance ratio during VTOL is much smaller than that of level flight [13]. Leishman summarized the technical challenges of a proprotor design and claimed that the higher the efficiency of level flight, the lower the figure of merit (FM) of the rotor during vertical flight [14]. There is a natural contradiction between the two flight modes as far as the energy efficiency is concerned. A few research works on propeller blade shape optimization have been conducted for VTOL aircraft. Duan et al. [4] optimized the VPP and FPP used in a micro VTOL UAV using the vortex theory and a modified parallel particle swarm optimization algorithm (PSOA). The result proved the advantages of VPP over FPP when applied to the VTOL UAV. Ng et al. [15] used polynomial equations to parameterize the distribution of the chord-length and twist angle. A multi-objective optimization framework for a proprotor based on the blade element momentum theory (BEMT) was constructed. A blade shape with a higher hovering efficiency was taken as the initial design and the optimization results showed a significant improvement to the propulsive performance. Hee et al. [16] carried out a multi-objective optimization design of the three-dimensional aerodynamic shape of a VPP with the help of the commercial software ModelCenter. The design variables in this paper included relevant parameters describing the blade sweep angle and the dihedral angle. Droandi [13] used the BEMT and genetic algorithm (GA) to optimize the chord, twist and section airfoil distribution of a VPP and then performed a second optimization on the tip shape of the VPP. In order to improve the aerodynamic efficiency of the JVX VPP, Chattopadhyay et al. [17] used CAMRAD II software developed from the free wake vortex lattice method (FWVLM) to perform the optimization design using a decoupling manner. The above works have enriched the research content of the blade shape optimization of VTOL propellers. However, none of the works above considered the maximum thrust-to-weight ratio at hover, which is closely related to the wind-resistance capability and maneuverability during takeoff and landing. One of the major factors affecting the takeoff and landing maneuverability is the maximum thrust-to-weight ratio at hover. The larger the maximum thrust-to-weight ratio of the propeller, the more thrust the propeller can provide for attitude and altitude control [18]. For multi-rotors, work has been conducted to improve the thrust-to-weight ratio [19,20,21]. However, there are few similar works on tilt-wing or tilt-rotor aircraft, which is of importance to the safety of VTOL aircraft [22]. In addition, VTOL aircraft designed for a fast response have corresponding requirements for the maximum climb rate of vertical flight, which should also be considered in the design framework [23]. Regarding general propeller design methods, Hepperle [24] proposed an inverse design method for a minimum energy loss propeller based on the Betz theory [25] and the work of Charles [26], which were suitable for the case with a prescribed chord distribution. Applying this inverse method to a VTOL propeller design toward the cruising stage provides a rapid approach to expedite the optimization procedure.
This article develops an optimization framework for the shape design of a VTOL propeller based on the inverse method. An FPP and a VPP were both optimized using this framework and then compared. The rest of this paper is organized as follows. The Section 2 introduces the BEMT, the inverse method for general propeller design and a low-order model of a brushless DC (BLDC) motor, which was used in the subsequent optimization framework. A three-blade NACA 5868-9 propeller with wind tunnel test data was used to validate the BEMT and the computational fluid dynamics (CFD) method. The Section 3 presents a new parameterization method for the chord distribution and the optimization framework for the VTOL propeller, including the design variables, constraints and objectives. The Section 4 focuses on the application of the proposed framework on the optimization of a propeller for the Vahana A3 tilt-wing aircraft. The optimization results of the VPP and FPP are given and discussed here. In the Section 5, the impacts of parameters such as hover disk loading, cruising flight speed and the level flight energy ratio on the optimization are studied. The general rules are given in this section. The results provide a universal reference to design a propeller for VTOL aircraft.

2. Modeling

2.1. VTOL Typical Mission Profile

The typical mission profile of a VTOL aircraft includes hovering (denoted as S1), vertical takeoff (S2), forward transition, climbing (S3), cruising (S4), descending, backward transition and vertical landing (S5), as shown in Figure 1. There is almost no energy consumption during the descending stage and the time is limited for the forward and backward transition flight. Thus, these three stages are ignored in this paper.

2.2. Blade Element Momentum Theory

2.2.1. Theory and Numerical Solution

The BEMT combines the blade element theory (BET) and momentum theory (MT) to solve the axial- and rotational-induced velocities at the propeller disk location. BEMT was first proposed by Glauert in 1926 [27]. A significant number of studies have validated the effectiveness of the BEMT for calculating the performance of a propeller. Figure 2. shows the velocity and force acting on the blade element. Here, d L and d D are the lift and drag for the blade element, d T and d τ are the axial thrust and tangential force of the blade and θ , α , β and ϕ are the twist angle, angle of attack, interference angle and inflow angle, respectively. V 0 is the far-field velocity, v a and v t are the axial- and tangential-induced velocities at the disk, W 1 is the resultant flow velocity and n s is the revolutionary speed in the units of rps.
The equations to calculate the axial thrust and tangential force combining the BET and MT considering the Prandtl modification are expressed as:
d T = 2 π ρ r d r V 0 + v a 2 v a F M T = 1 2 ρ N b V 0 + v a / sin φ 2 c d r C L θ φ cos φ - C D θ φ sin φ B E T d τ = 2 π ρ r d r V 0 + v a 2 v t F M T = 1 2 ρ N b V 0 + v a / sin φ 2 c d r C L θ φ sin φ + C D θ φ cos φ B E T φ = arctan V 0 + v a 2 π n s r v t
Here, the Prandtl modification factor F is calculated by:
F = 2 π arccos ( e f ) f = N b 2 R r r sin φ t
where ϕ t is the actual inflow angle at the blade tip. Equation (1) is a non-linear transcendental equation group; Liu [28] gave a general gradient-based iterative method using interference β as the unknown variable to solve. However, the initial guess of β has a significant influence on the solution. An inappropriate initial guess will cause an incorrect solution without a physical meaning and will result in the first-order discontinuity of the interference angle distribution along the radius, especially for low advance ratio conditions. A smoothing modification to the β distribution to ensure first-order continuity was added to the gradient-based iterative procedure to solve Equation group (1) and its effectiveness is shown in Figure 3.

2.2.2. 2D Airfoil Aerodynamics Surrogate Model

In this paper, the airfoils used for the sections of the propeller were obtained from the affine transformation of a Clark Y airfoil, as shown in Figure 4.
The accuracy of 2D airfoil aerodynamics has a direct impact on the BEMT. The Reynolds number, Mach number and angle of attack are the three main parameters influencing the 2D aerodynamics of a certain airfoil. In addition, different from the general design and optimization of a propeller, a VTOL propeller usually encounters a large angle of attack flow near the propeller root during low advance ratio flight conditions. For this reason, an accurate large angle of attack aerodynamic model is required. Traditional methods to capture large angle of attack aerodynamics are mostly empirical such as the Viterna Corrigan method [29] and the Montgomerie model [30]. Although they have the advantage of simplicity, they are most suitable for specific airfoils and flow conditions. A back-propagation artificial neural network (BP-ANN) trained using large amounts of samples obtained from 2D CFD simulations provides an approach to describe airfoil aerodynamics with a wide range of angle of attack.
The Latin hypercubic sampling (LHS) method was adopted to select the sample angle of attack ( α = 15 ~ 75 ° ), Reynolds number ( R e = 5 × 10 4 ~ 3 × 10 6 ), airfoil relative thickness ( t r e l = 0.03 ~ 0.4 ) and Mach number ( M a = 0.1 ~ 0.7 ). The 2D CFD simulations using structural grids (Figure 5) and Spalart-Allmaras (S–A) turbulence model were then conducted to generate the database; i.e., C L α , M a , R e , t r e l and C D α , M a , R e , t r e l . A BP-ANN with one input layer, one hidden layer and one output layer was trained using the Bayesian regulation method based on the airfoil aerodynamic database. The inputs of the BP-ANN were α , M a , R e , t r e l and the outputs were C L and C D . The number of neurons of the hidden layer was selected as 13 after several adjustments. The regression of the trained BP-ANN surrogate model is shown in Figure 6. The mean squared error of the training result was 2.87 × 10 4 , which validated the precision of the BP-ANN surrogate model.

2.2.3. Validation of the BEMT and CFD

We selected a 3-blade NACA 5868-9 propeller ( R = 1.5024   m and θ = 25 ° at 0.75 R) as the test model. Hartman et al. [31] gave the parameter distribution (Figure 7); its geometry was remodeled and is presented in Figure 8.
An experiment on the test propeller model was conducted in a NACA 6 m propeller wind tunnel, which had an open throat and was capable of producing air speeds up to 50 m/s. The dynamic pressure, thrust, torque and RPM were measured with an accuracy from 1 to 2% [32]. The thrust and the torque forces were measured on recording balances situated in the balance house on the test chamber floor, which is described in [31] in detail. In the wind tunnel experiment, the revolutionary speed of the propeller was held at 1000 r/min and the flow velocity was increased by steps up to 50.14 m/s. The revolutionary speed of the propeller was then decreased by steps whilst the flow velocity was held at 50.14 m/s to reach higher advance ratio conditions. A 3D CFD method was also used to validate the optimization result and will be discussed in Section 4.2.4. Before that, the CFD method was validated by a comparison with the wind tunnel test data. There were, in total, 7.84 million structural grids for the 3-blade NACA 5868-9 propeller (Figure 9). The frame motion method was adopted to simulate the revolution of the propeller and k-omega shear stress transportation (SST) turbulence model was used to solve the boundary layer flow. The flow velocity and the revolutionary speed of the propeller were consistent with the wind tunnel test settings.
The thrust coefficients of the propeller and its efficiency obtained by the BEMT, CFD and wind tunnel test are shown in Figure 10. It was concluded that both the BEMT and 3D CFD method were able to calculate the thrust and efficiency effectively with the experiments. The result of the CFD method based on the k-omega SST model was consistent with that of the wind tunnel test in a wide range of advance ratios. The BEMT had lower accuracy than the CFD method. Nevertheless, the BEMT was accurate enough and appropriate for the rapid optimization of the VTOL propeller blade shape, especially when the computational cost of the CFD method was considered.

2.3. Propeller Inverse Design Method for the Cruising Stage

The level flight mode, which includes climbing and cruising, is the main energy consumption mode for VTOL aircraft [23]. To rapidly achieve maximum energy efficiency in level flight, the inverse design method based on the Betz optimal theory was innovatively applied to the cruising stage.
To reach the optimal propellers with a minimum energy loss, the axial displacement velocity ratio V 0 + v / 2 π n s r = ξ must be constant along the radius, but the value is unknown [25]. When this optimal theory and BEMT are combined, an optimal propeller can be acquired by 3~4 numerical iterations, according to [26]. This procedure is named the regular design method. Usually, a lift coefficient distribution corresponding with the maximum lift–drag ratio along the radius is prescribed as the input for this regular method. In fact, as far as the aerodynamic coefficients, chord-length and twist angle distribution are concerned, once any one of them is prescribed, the rest of the two distribution rules are easily calculated by the numerical iterative method. Therefore, [24] proposed an inverse design method for a propeller with a prescribed chord-length distribution. The regular and inverse design methods are shown in Figure 11. Applying this inverse method to the VTOL propeller optimization framework on the cruising stage can eliminate the work of parameterizing the twist angle distribution and provide a minimum energy loss propeller for cruising flight rapidly and automatically. Parameterizing the chord-length distribution makes it intuitive to set the structural constraints by limiting the minimum chord-length, generating fewer infeasible designs at the beginning than parameterizing the lift coefficients.

2.4. Brushless Motor Modeling

Brushless DC (BLDC) motors are widely used in electric aviation for their efficiency and large torque [4,33,34]. A first-order energy model of a BLDC was adopted in this paper for the power and energy calculations. During the ith flight stage Si (i = 1~6), the revolutionary speed ω i   rpm , output torque Q i   Nm and efficiency η i B L D C of the BLDC motor have a relationship [35], which is expressed as:
I i = 2 π K v Q 60 + I 0 U i = 60 ω i 2 π K v + I i R η i B L D C = 2 π Q ω i 60 U i I i
The propeller-absorbed power at state Si is donated as P i p r o p and the input power of the BLDC is denoted as P i B L D C , which is calculated by:
P i B L D C = P i p r o p / η i B L D C
Here, the internal resistance R 0   Ω , no-load current I 0   A and speed constant K v   r / min are the three characteristic parameters of a BLDC motor. U i   V is the input voltage of the BLDC motor and I is the closed circuit current.

2.5. Non-Cruising Stage Trimming

The trimming revolutionary speed and/or collective pitch on non-cruising stages including hover and takeoff should be solved to obtain the energy consumption for the whole mission profile. For a VPP, the trimming procedure is to solve the minimum power optimization problem with the revolutionary speed ω i and the collective pitch d θ i as the design variables, which is expressed as:
d . v . y = d θ i , ω i min   P i B L D C y
The other objective is the maximum thrust-to-weight ratio κ at hover S1, which is expressed as:
κ = N p T 1 m a x / W t o g
where g is gravity acceleration, W t o is the takeoff weight and N p is the number of propellers. Meanwhile, to complete the maximum velocity vertical flight stage S6, the maximum thrust in S6 should satisfy the following relationship:
N p T 6 m a x W t o g
The maximum thrust at S1 and S6 are solved by the following optimization problem:
d . v . y = d θ i , ω i   i = 1 , 6 max   T i d θ i , ω i s . t .   P i B L D C P l i m i t e d B L D C                 Q i B L D C Q l i m i t e d B L D C
Here, P l i m i t e d B L D C and Q l i m i t e d B L D C are the limited input power and limited output torque of the BLDC motor, respectively.
Non-cruising state trimming problems for an FPP can be generated by eliminating the collective pitch d θ i and leaving the speed revolutionary ω i as the only design variable. All the optimization problems in this section could be rapidly solved by a gradient-based optimization method such as sequential quadratic programming (SQP) algorithm.

3. Optimization Problem

3.1. Chord-Length Distribution Parameterization

An appropriate parametric method for the chord-length distribution can decrease the number of infeasible designs during the generation of the design variables. General parametric methods for the chord-length distribution of a propeller include direct interpolation [36], polynomial curve fitting [15] and Bezier curve fitting [23]. A new parametric method using a piecewise quadratic polynomial was put forward, as shown in Figure 12. P was the tangency point of two quadratic polynomials AP and BP as well as one straight line CD. Meanwhile, the straight line CD was parallel to the straight line AB. The spanwise location of the P point was r m i d and the chord-length at the P point was calculated by c m i d = p + 1 c m i d l i n e a r with a given parameter p . The virtual linear chord-length c m i d l i n e a r was expressed as:
c m i d l i n e a r = c t i p c r o o t R R h u b r m i d R h u b + c r o o t
where R h u b is the radius of the hub and c r o o t and c t i p are the length of the chord at the root and tip of the propeller, respectively. A p > 0 ensured that the chord-length distribution had a non-convex form consistent with most practical propellers in reality and eliminated large numbers of infeasible designs. The revolutionary speed during the cruising stage ω 4 should be given to optimize the twist angle distribution using the inverse design method mentioned above. Thus, the design variables of the VTOL propeller optimization framework were denoted as x = c r o o t , c t i p , r m i d , p , ω 4 .

3.2. Optimization Framework for a VTOL Propeller

The flight time for each stage was denoted as t i   i = 1 ~ 5 and the energy consumption for the whole mission profile was expressed as:
E m i s s i o n = i = 1 5 P i B L D C t i
The optimization problem could be summarized as:
d . v .             x = c r o o t , c t i p , r m i d , p , ω 4 min   E m i s s i o n = i = 1 5 P i B L D C t i ,   max   κ = N p T i max W t o s . t .       N p T 6 max W t o g
The flow chart of the optimization framework is shown in Figure 13. The green block inside included all the sub-optimization problems mentioned in the non-cruising stage trimming section.

4. Case Study

4.1. Vahana A3 Tilt-Wing Introduction

The Vahana A3 tilt-wing aircraft uses eight VPPs with a diameter of 1.5 m as the propulsion power (Figure 14). The design parameters were estimated according to [1]. The transition height was set to 100 m and the vertical takeoff speed was 3 m/s. To avoid the occurrence of a vortex ring phenomenon, the vertical landing speed was set to 1.5 m/s. In an actual operation, a hover time of 30 s is reserved for self-inspection and warm-up. The parameters for different flight stages are shown in Table 1.
The Vahana A3 uses MagiDrive BLDC motors to drive the VPPs. The parameters of this type of BLDC motor are shown in Table 2. Three characteristic parameters were estimated based on the given materials from the MagiDrive official website [37].
The ranges of the design variables for the Vahana A3 propeller are listed in Table 3.

4.2. Optimization Result

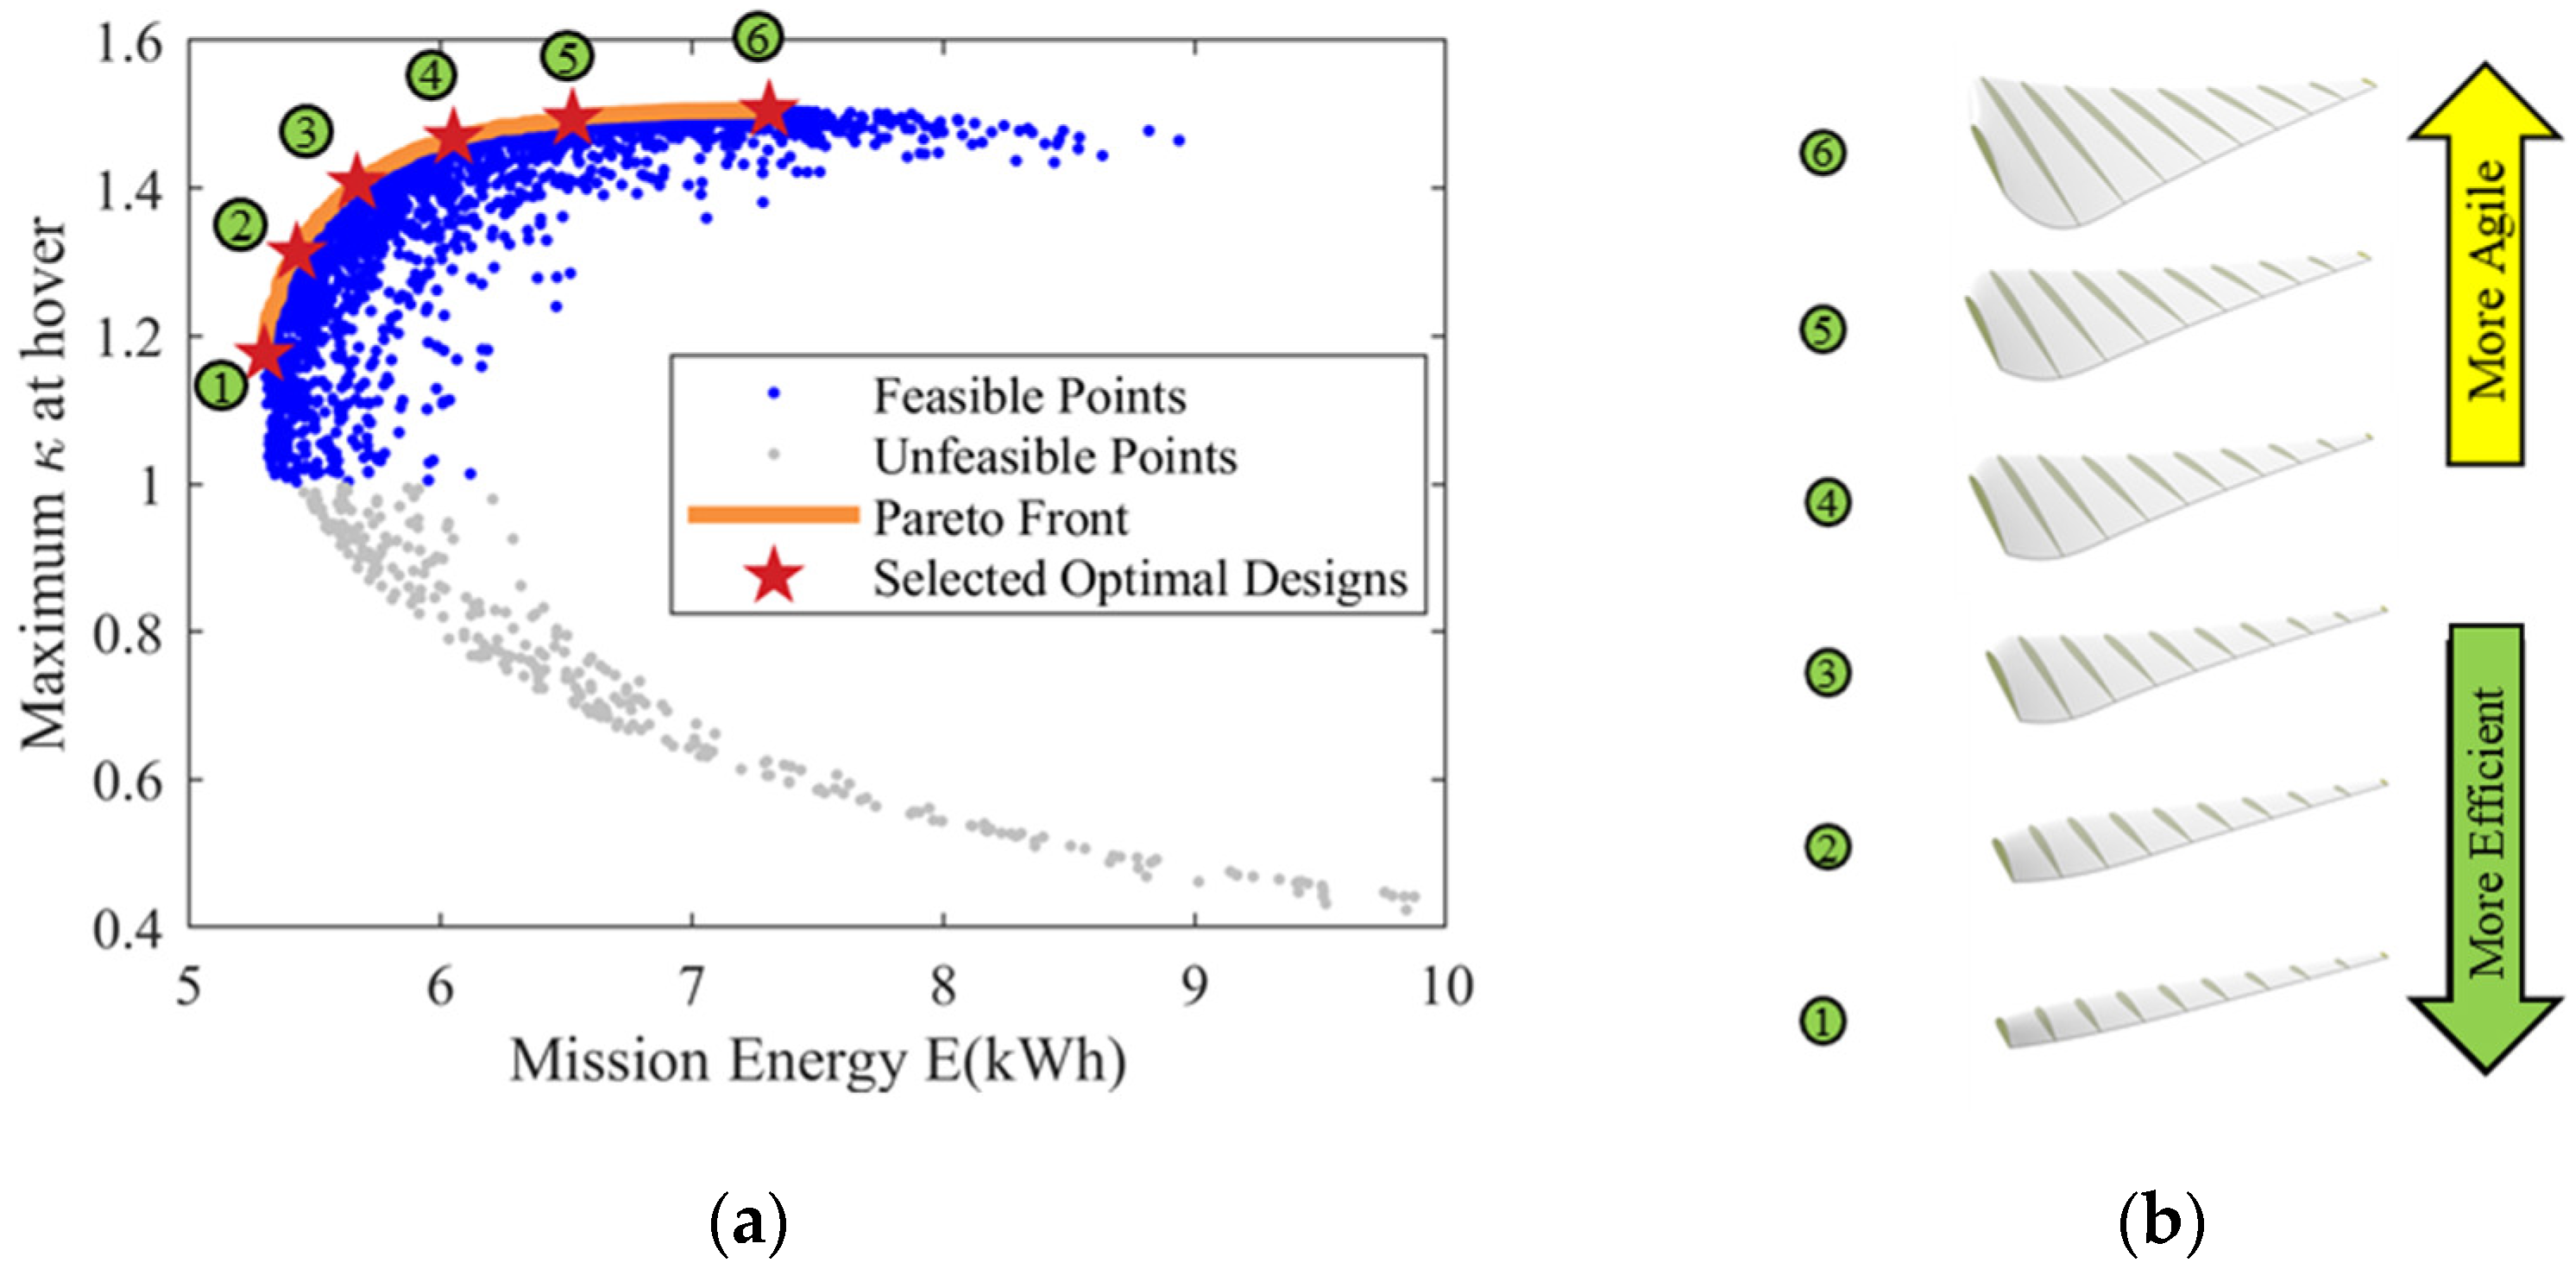
4.2.1. VPP Optimization Result

Figure 15a shows the Pareto-optimal front. It was obvious that there was a contradiction between the mission energy and the maximum thrust-to-weight ratio at hover, which means that the more maneuverable at hover the tilt-wing is, the lower energy efficiency it will have. We transformed the multi-objective optimization problem to a single objective one by defining a new objective as:
J = E m i s s i o n κ
where the original two objectives had the same weight factor. We then obtained a comprehensive optimal FPP with a minimum J , marked as green circle 3 in Figure 15a. The maximum thrust-to-weight ratio at hover for this FPP was 1.53 and the energy consumption was 4.49 kWh. The 3D geometry of this selected optimal VPP is shown in Figure 16. The chord-length and twist distribution of this selected optimal VPP, the most energy-saving VPP and the most maneuverable VPP are shown in Figure 17.
The performance of this selected optimal VPP with different collective pitch and advance ratios is shown in Figure 18. The collective pitch mechanism provided a wide range of high efficiency, as shown in Figure 18b. Figure 18d shows the hover efficiency of this optimal VPP with a different revolutionary speed and collective pitch angle.
To investigate the twist and chord-length distribution of the optimization objectives, we selected six optimal propellers from the Pareto front, as shown in Figure 15a. Figure 15b shows the 3D geometry of these propellers. To describe the average twist amplitude, we defined a parameter denoted as τ and its expression was:
τ = R h u b R d θ d r / R d r
The average relative blade width c ¯ was defined as:
c ¯ = R h u b R c d r
The values of c ¯ and τ of different optimal VPPs are shown in Figure 19. It was obvious that the wider the propeller blade was, the more maneuverable the tilt-wing was during takeoff. On the contrary, a higher energy efficiency requires an average blade to be narrow. Regarding the twist distribution, the less τ is, the more maneuverable the tilt-wing is.

4.2.2. FPP Optimization Result

Considering simplicity and reliability, we also conducted an optimization of the FPPs for the case of a tilt-wing. The Pareto-optimal front is shown in Figure 20a. Corresponding with the results of the VPPs, the energy efficiency and the maximum thrust-to-weight ratio had a contradictory relationship.
The geometry of the selected optimal FPP using the same objective to minimize as expressed as Equation (12) is shown in Figure 21. and three typical optimal twist angles and chord-length distributions of an FPP are shown in Figure 22. Its maximum thrust-to-weight ratio at hover was 1.25 and energy consumption was 5.34 kWh.
The performance of this selected FPP is shown in Figure 23. The range of high efficiency of the FPP was much narrower than that of the VPP.
Figure 24 shows the values of c ¯ and τ of the different optimal FPPs, which are shown in Figure 20 and marked by green circles. Different from the result for VPPs, there were smaller changes of τ among the different optimal VPPs and the values of τ had a concentrated range from 56.6 ° to 54.9 ° .
As shown in Table 4., the minimum energy of the VPP was 17.05% less than that of the FPP and the maximum thrust-to-weight ratio was 4.57% larger than that of the FPP, which validated the advantages of the VPP over the FPP.

4.2.3. Analysis of the Maximum Thrust-to-Weight Ratio

Previous research has usually used the hover figure of merit (FM)/power and cruising efficiency/power as the objectives for VTOL propeller optimization. However, the hover FM or power cannot characterize the maneuverability during takeoff. The relationship between the hover power and the maximum thrust-to-weight ratio at hover are shown in Figure 25. Pareto front 1 contained the optimal design using E m i s s i o n and κ as the two objectives. Pareto front 2 contained the optimal design using E m i s s i o n and the propeller hover power as the two objectives. It was clear that, with certain maximum power and torque constraints, the propeller with the lowest hover power was not always the one with the maximum thrust-to-weight ratio, especially for the VPP. This result validated the necessity of taking the maximum thrust-to-weight ratio at hover as the objective instead of the hover power to characterize the maneuverability during vertical takeoff and landing. From another perspective, the maximum thrust-to-weight ratio at hover was a more practical factor than the hover power for the design of a VTOL propeller.

4.2.4. CFD Validation

To validate the optimization result, the 3D CFD simulations verified in Section 2.2.3 were conducted on the comprehensive optimal VPP selected in Section 4.2.1. The differences of the thrust and power between the BEMT and CFD method are shown in Figure 26. The maximum difference of thrust was less than 6% and the power was less than 5%, which validated the effectiveness of the BEMT used in the optimization framework.

5. Analysis

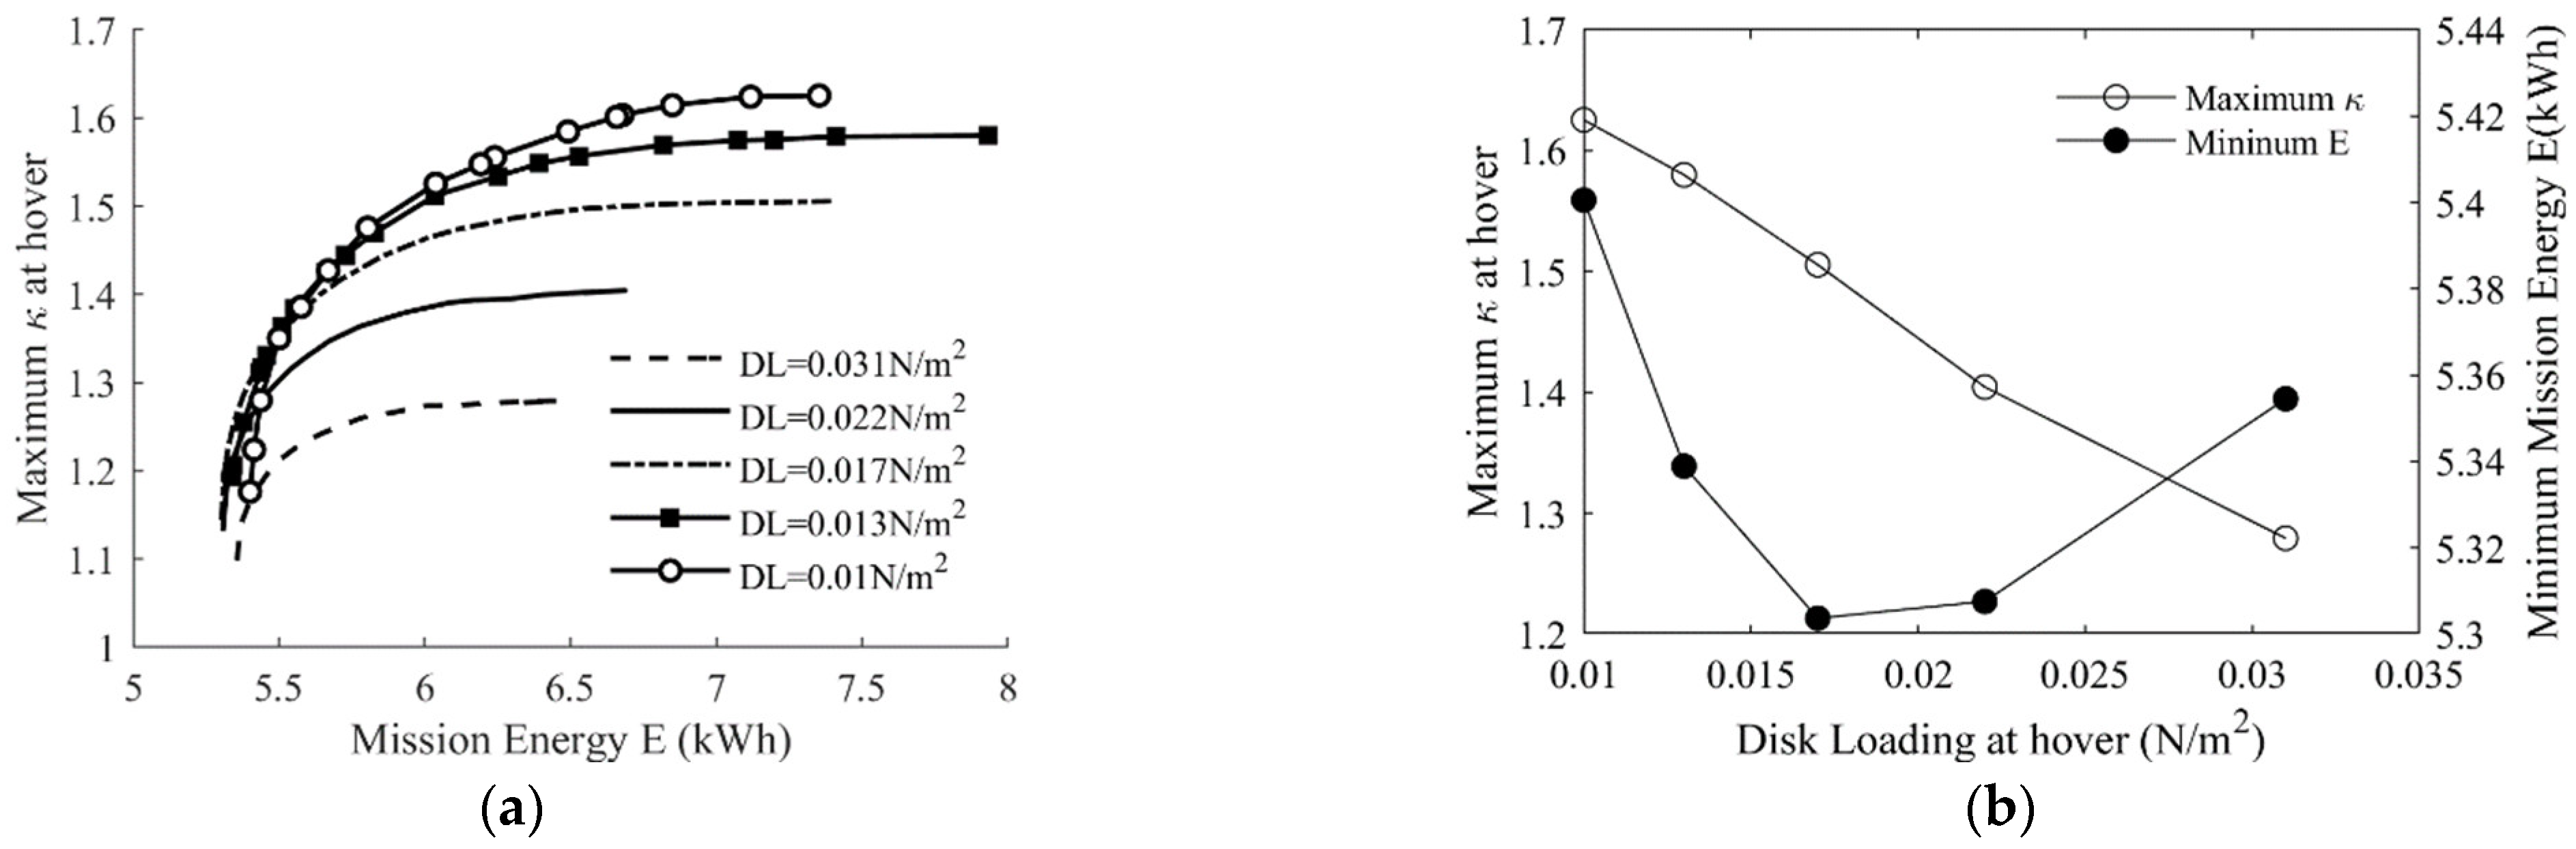
5.1. Analysis of Hover Disk Loading

The most significant parameter for the takeoff performance is the disk loading of the propeller. We changed the diameter of the propeller and reconducted the optimization procedure for the VPPs and FPPs. The results are shown in Figure 27 and Figure 28.
Figure 27 and Figure 28 show the Pareto-optimal front of the FPP and VPP with different hover disk loadings. For the FPP, when the hover disk loading increased from 0.01 N/m2 to 0.032 N/m2, the maximum thrust-to-weight ratio decreased from 1.625 to 1.279 by 21% whereas the mission energy decreased from 5.40 kWh to 5.31 kWh then increased to 5.36 kWh. The maximum relative variation of the mission energy was less than 1.7%. For the VPP, the maximum thrust-to-weight ratio was higher than that of the FPP and had the same decreasing trend from 1.78 to 1.31 by 26.4% along with an increase in hover disk loading. The minimum mission energy decreased from 4.43 kWh to 4.40 kWh then increased to 4.58 kWh. The maximum relative variation of the minimum mission energy was less than 4%. Overall, the variation of hover disk loading brought a distinct impact on the maximum thrust-to-weight ratio, but only a small impact on the mission energy. For the Vahana A3 tilt-wing aircraft, whose main application is manned flight in urban areas, the disk loading should be as low as possible to improve the takeoff maneuverability.

5.2. Analysis of the Cruising Speed

The cruising speed is one of the most important parameters affecting the flow conditions of level flight. We changed the cruising speed but kept the level flight distance unchanged and performed an optimization for the VPP and FPP again.
Figure 29 shows the impact of the cruising speed on the Pareto-optimal front of the VPP and FPP. It was obvious that the VPP had a stronger adaptability to the cruising speed than the FPP. An increase in the cruising speed brought a scarce variation for the maximum thrust-to-weight ratio and a small rise of the mission energy as far as the VPP was concerned. However, an increase in the cruising speed led to a significant decrease in the maximum thrust-to-weight ratio and a significant increase in the mission energy for the FPP. In conclusion, the VPP was less sensitive to the cruising speed than the FPP.

5.3. Analysis of the Level Flight Energy Ratio

The level flight mode and vertical flight mode have different, even contradictory, requirements for the optimization of a VTOL propeller. To investigate the weights of these two flight modes on the optimization result, we changed the ratio of energy of level flight to the profile energy of the whole mission ξ by changing the flight time of the different stages and reconducting the optimization. The relationship between the energy-saving advantage of the VPP over the FPP δ and ξ is explored and shown in Figure 30.
Given several fixed maximum thrust-to-weight ratios, the variations of δ along with ξ are shown in Figure 30b. For the researched tilt-wing aircraft, when the maximum thrust-to-weight ratio at hover κ was higher than 1.30, the energy-saving advantage of the VPP δ increased with an increase in the level flight energy ratio ξ . However, when κ was lower than 1.30, δ had a contradictory trend with ξ . Regardless, the energy-saving advantage of the VPP over the FPP was over 10.5%. This section quantitatively validated this advantage. Compared with the FPP, the application of the VPP meant a more complicated mechanism and a larger weight cost, which means less reliability and more operation power required. Combining these factors with the rules shown in Figure 30b, a practical reference to choose a VPP or an FPP for VTOL aircraft could be given.

6. Conclusions

The inverse propeller design method based on the Betz optimal theory was successfully integrated into the rapid optimization framework for a VTOL propeller, which worked in a wide range of operation conditions.
The proposed VTOL propeller optimization framework adopted the maximum thrust-to-weight ratio at hover and mission energy as the two objectives and strengthened the practicability of the optimization result. The maximum thrust-to-weight ratio at hover had a contradictory relationship with the mission energy efficiency. The maximum thrust-to-weight ratio optimal designs were not always those of the minimum hover power, which validated the necessity of taking the maximum thrust-to-weight ratio at hover as one of the objectives to capture maneuverability or agility in a vertical flight mode.
Under certain BLDC power and torque constraints, a comprehensive optimal VPP and FPP were obtained for a Vahana A3 tilt-wing aircraft and were verified by the CFD numerical method. Using a VPP could save 17.05% of energy and improve by 4.57% the maximum thrust-to-weight ratio at hover than using an FPP under the given conditions. The advantages of a VPP in both energy consumption and maneuverability during takeoff were validated for a VTOL aircraft.
Disk loading had a much larger impact on the maximum thrust-to-weight ratio than on the mission energy. Disk loading at hover should be as low as possible, especially for a manned VTOL aircraft, to ensure enough reliability and maneuverability during takeoff and landing. With an increase in the cruising speed, the minimum energy of the VPP had a slight increase whereas the maximum thrust-to-weight ratio at hover barely changed. However, the cruising speed had a heavier impact on the maximum thrust-to-weight ratio of the FPP at hover and minimum energy. This phenomenon validated the superior adaptability of the VPP.
The quantitative rules on the energy-saving advantage of the VPP over the FPP were calculated in this article. When the maximum thrust-to-weight ratio at hover was larger than about 1.30, the energy-saving advantage of the VPP over the FPP increased as the level flight energy ratio grew. On the contrary, the energy advantage of the VPP over the FPP decreased as the level flight energy ratio grew when the maximum thrust-to-weight ratio at hover was less than about 1.30. Combining other design factors such as reliability and weight cost with the rules shown in Figure 30, a practical reference to choose a VPP or an FPP for a VTOL aircraft could be given.

Author Contributions

Conceptualization, X.X. and D.M.; methodology, X.X. and L.Z.; validation, X.L. and K.C.; formal analysis, L.Z. and D.M.; investigation, X.X.; resources, D.M.; data curation, X.X.; writing—original draft preparation, X.X.; writing—review and editing, X.X., D.M. and L.Z.; visualization, K.C.; supervision, L.Z.; project administration, D.M. All authors have read and agreed to the published version of the manuscript.

Funding

This research received no external funding.

Institutional Review Board Statement

Not applicable.

Informed Consent Statement

Not applicable.

Data Availability Statement

The data presented in this study are available on request from the corresponding author.

Conflicts of Interest

The authors declare no conflict of interest.

References

  1. Pradeep, P.; Wei, P. Energy Optimal Speed Profile for Arrival of Tandem Tilt-Wing eVTOL Aircraft with RTA Constraint. In Proceedings of the 2018 IEEE CSAA Guidance, Navigation and Control Conference (CGNCC), Xiamen, China, 10–12 August 2018; pp. 1–6. [Google Scholar] [CrossRef]
  2. May, M.S.; Milz, D.; Looye, G. Dynamic Modeling and Analysis of Tilt-Wing Electric Vertical Take-Off and Landing Vehicles. In Proceedings of the AIAA SCITECH 2022 Forum, San Diego, CA, USA, 3–7 January 2022. [Google Scholar]
  3. Dickeson, J.J.; Miles, D.; Cifdaloz, O.; Wells, V.L.; Rodriguez, A.A. Robust LPV H∞ gain-scheduled hover-to-cruise conversion for a tilt-wing rotorcraft in the presence of CG variations. In Proceedings of the IEEE Conference on Decision and Control, New York, NY, USA, 9–13 July 2007; pp. 2773–2778. [Google Scholar] [CrossRef]
  4. Duan, D.; Wang, Z.; Wang, Q.; Li, J. Research on Integrated Optimization Design Method of High-Efficiency Motor Propeller System for UAVs with Multi-States. IEEE Access 2020, 8, 165432–165443. [Google Scholar] [CrossRef]
  5. Straubinger, A.; Rothfeld, R.; Shamiyeh, M.; Büchter, K.-D.; Kaiser, J.; Plötner, K.O. An overview of current research and developments in urban air mobility—Setting the scene for UAM introduction. J. Air Transp. Manag. 2020, 87, 101852. [Google Scholar] [CrossRef]
  6. Saeed, A.S.; Younes, A.B.; Cai, C.; Cai, G. A survey of hybrid Unmanned Aerial Vehicles. Prog. Aerosp. Sci. 2018, 98, 91–105. [Google Scholar] [CrossRef]
  7. Bell Helicopters. Bell Boeing V-22 Osprey—Bell Helicopter. 2016. Available online: http://www.bellhelicopter.com/military/bell-boeing-v-22#/?tab=features-tab (accessed on 15 February 2022).
  8. UAVGLOBAL. Bell Eagle Eye. 2015. Available online: http://www.uavglobal.com/bell-eagle-eye/ (accessed on 15 February 2022).
  9. Montagnani, D.; Tugnoli, M.; Zanotti, A.; Syal, M.; Droandi, G. Analysis of the interactional aerodynamics of the vahana evtol using a medium fidelity open source tool. In Proceedings of the VFS Aeromechanics for Advanced Vertical Flight Technical Meeting, San Jose, CA, USA, 21–23 January 2020; pp. 436–451. [Google Scholar]
  10. Electric VTOL News. Joby S4. eVTOL News. 2021. Available online: https://evtol.news/joby-s4/ (accessed on 15 February 2022).
  11. Fredericks, W.J.; Moore, M.D.; Busan, R.C. Benefits of Hybrid-Electric Propulsion to Achieve 4× Cruise Efficiency for a VTOL UAV. In Proceedings of the 2013 International Powered Lift Conference, Los Angeles, CA, USA, 12–14 August 2013. [Google Scholar]
  12. Muraoka, K.; Okada, N.; Kubo, D. Quad Tilt Wing VTOL UAV: Aerodynamic Characteristics and Prototype Flight. In Proceedings of the AIAA Infotech@Aerospace Conference, Seattle, WA, USA, 6–9 April 2009. [Google Scholar]
  13. Droandi, G.; Gibertini, G. Aerodynamic blade design with multi-objective optimization for a tiltrotor aircraft. Aircr. Eng. Aerosp. Technol. Int. J. 2015, 87, 19–29. [Google Scholar] [CrossRef]
  14. Leishman, J.; Rosen, K. Challenges in the Aerodynamic Optimization of High-Efficiency Proprotors. J. Am. Helicopter Soc. 2011, 56, 12001–12004. [Google Scholar] [CrossRef]
  15. Yincheang, N.; Haixin, C. Rapid Aerodynamic Design of Prop-rotor Blade with Optimization. Chin. J. Turbomach. 2019, 61, 19–27. [Google Scholar]
  16. Kang, H.J. Design Optimization of QTP-UAV Prop-Rotor Blade Using ModelCenter®. J. Aerosp. Syst. Eng. 2017, 11, 36–43. [Google Scholar]
  17. Chattopadhyay, A.; McCarthy, T.R.; Seeley, C.E. Multiple design point optimization of high-speed proprotors. J. Aircr. 1996, 33, 625–627. [Google Scholar] [CrossRef]
  18. Mehmood, H.; Nakamura, T.; Johnson, E.N. A maneuverability analysis of a novel hexarotor UAV concept. In Proceedings of the 2016 International Conference on Unmanned Aircraft Systems (ICUAS), Arlington, VA, USA, 7–10 June 2016; pp. 437–446. [Google Scholar] [CrossRef]
  19. Arellano-Quintana, V.M.; Portilla-Flores, E.A.; Merchan-Cruz, E.A.; Nino-Suarez, P.A. Multirotor design optimization using a genetic algorithm. In Proceedings of the 2016 International Conference on Unmanned Aircraft Systems (ICUAS), Arlington, VA, USA, 7–10 June 2016; pp. 1313–1318. [Google Scholar] [CrossRef]
  20. Mogorosi, T.O.; Jamisola, R.S.; Subaschandar, N.; Mohutsiwa, L.O. Thrust-to-Weight Ratio Optimization for Multi-Rotor Drones Using Neural Network with Six Input Parameters. In Proceedings of the 2021 International Conference on Unmanned Aircraft Systems (ICUAS), Athens, Greece, 15–18 June 2021; pp. 1194–1199. [Google Scholar] [CrossRef]
  21. Li, K.; Song, Z.; Cai, Z.; Wang, Y. Multi-rotor pseudo-inverse method research based on kernel space. In Proceedings of the 2016 IEEE Chinese Guidance, Navigation and Control Conference (CGNCC), Nanjing, China, 12–14 August 2016; IEEE: Piscataway, NJ, USA, 2017; pp. 1418–1422. [Google Scholar] [CrossRef]
  22. Wang, M.; Diepolder, J.; Zhang, S.; Söpper, M.; Holzapfel, F. Trajectory optimization-based maneuverability assessment of eVTOL aircraft. Aerosp. Sci. Technol. 2021, 117, 106903. [Google Scholar] [CrossRef]
  23. Chen, G.; Ma, D.; Jia, Y.; Xia, X.; He, C. Comprehensive Optimization of the Unmanned Tilt-Wing Cargo Aircraft with Distributed Propulsors. IEEE Access 2020, 8, 137867–137883. [Google Scholar] [CrossRef]
  24. Hepperle, M. Inverse Aerodynamic Design Procedure for Propellers Having a Prescribed Chord-Length Distribution. J. Aircr. 2010, 47, 1867–1872. [Google Scholar] [CrossRef]
  25. Betz, A. Screw Propellers with Minimum Energy Loss; NRC, Division of Mechanical Engineering: Cairo, Egypt, 1958. [Google Scholar]
  26. Adkins, C.N.; Liebeck, R.H. Design of optimum propellers. J. Propuls. Power 1994, 10, 676–682. [Google Scholar] [CrossRef]
  27. Glauert, H. The Elements of Aerofoil and Airscrew Theory; Cambridge University Press: Cambridge, UK, 1983. [Google Scholar]
  28. Liu, P. Aerodynamic Propeller Theory and Application; Beihang University Press: Beijing, China, 2006. [Google Scholar]
  29. Viterna, L.A.; Janetzke, D.C. Theoretical and Experimental Power from large Horizontal-Axis Wind Turbines; National Aeronautics and Space Administration, Lewis Research Center: Cleveland, OH, USA, 1982. [Google Scholar] [CrossRef] [Green Version]
  30. Montgomerie, B.; Forskningsinstitut, T. Methods for Root Effects, Tip Effects and Extending the Angle of Attack Range to ±180°, with Application to Aerodynamics for Blades on Wind Turbines and Propellers; Swedish Defence Research Agency: Stockholm, Sweden, 2004. [Google Scholar]
  31. Hartman, E.P.; Biermann, D. The Aerodynamic Characteristics of Full-Scale Propellers Having 2, 3, 4 Blades of Clark Y and R.A.F. 6 Airfoil Sections; NASA Technical Report 640; NASA: Washington, DC, USA, 1938; no. 640; p. 30. Available online: https://ntrs.nasa.gov/citations/19930091715 (accessed on 8 March 2022).
  32. Fred, D.H.W.; Weick, E. The Twenty-Foot Propeller Research Tunnel of the National Advisory Committee for Aeronautics; National Advisory Committee for Aeronautics: Washington, DC, USA, 1928. [Google Scholar]
  33. Gabriel, D.L.; Meyer, J.; Plessis, F.D. Brushless DC motor characterisation and selection for a fixed wing UAV. In Proceedings of the IEEE AFRICON Conference, Livingstone, Zambia, 13–15 September 2011; pp. 13–15. [Google Scholar] [CrossRef]
  34. Bogusz, P.; Korkosz, M.; Powrózek, A.; Prokop, J.; Wygonik, P. An analysis of properties of the BLDC motor for unmanned aerial vehicle hybrid drive. In Proceedings of the 2015 International Conference on Electrical Drives and Power Electronics (EDPE), Tatranska Lomnica, Slovakia, 21–23 September 2015; pp. 458–464. [Google Scholar] [CrossRef]
  35. Duan, D.; Pei, J.; Zu, R.; Li, J. Power optimization and control of motor variable-pitch propeller propulsion system. ACTA Aeronaut. Astronaut. Sin. 2021, 42, 623933. [Google Scholar] [CrossRef]
  36. Droandi, G.; Gibertini, G. Aerodynamic shape optimisation of a proprotor and its validation by means of CFD and experiments. Aeronaut. J. 2015, 119, 1223–1251. [Google Scholar] [CrossRef] [Green Version]
  37. MAGicALL. Power Your Aircraft to New Heights; MAGiDRIVE: Camarillo, CA, USA, 2018; pp. 211–220. Available online: http://www.magicall.biz/magidrive-datasheet/ (accessed on 10 March 2022).
Figure 1. Typical mission profile for VTOL aircraft.
Applsci 12 03694 g001
Figure 2. The velocity and force acting on the blade element.
Applsci 12 03694 g002
Figure 3. Smoothing modification to ensure first-order continuity.
Applsci 12 03694 g003
Figure 4. Affine transformation of Clark Y airfoil.
Applsci 12 03694 g004
Figure 5. The grid of airfoil for 2D CFD simulation.
Applsci 12 03694 g005
Figure 6. The regression of the trained BP-ANN surrogate model for 2D airfoil aerodynamics. (a) Cd regression; (b) CL regression.
Applsci 12 03694 g006
Figure 7. The distribution of chord-length, twist angle and relative thickness of a 3-blade NACA 5868-9 propeller.
Applsci 12 03694 g007
Figure 8. Geometry of 3-blade NACA 5868-9 propeller. (a) Top view; (b) axonometric view.
Applsci 12 03694 g008
Figure 9. Structural grid of the 3-blade NACA 5868-9 propeller for 3D CFD simulation.
Applsci 12 03694 g009
Figure 10. Thrust and efficiency comparisons between the BEMT, CFD and wind tunnel experiments for the 3-blade NACA 5868-9 propeller. (a) Thrust coefficients; (b) efficiency.
Applsci 12 03694 g010
Figure 11. Regular and inverse design methods based on Betz optimal theory.
Applsci 12 03694 g011
Figure 12. Piecewise quadratic polynomial parametric method for chord-length distribution.
Applsci 12 03694 g012
Figure 13. The flowchart of optimization framework for the VTOL propeller.
Applsci 12 03694 g013
Figure 14. Vahana A3 tilt-wing and the propeller used.
Applsci 12 03694 g014
Figure 15. Pareto front and optimal VPPs. (a) Sample points and Pareto front; (b) geometries of the propeller.
Applsci 12 03694 g015
Figure 16. Selected comprehensive optimal VPP.
Applsci 12 03694 g016
Figure 17. Twist angle and chord-length distribution of a comprehensive optimal VPP. (a) Twist angle distribution; (b) chord-length distribution.
Applsci 12 03694 g017
Figure 18. Performance of the selected optimal VPP. (a) C T ; (b) η ; (c) C P ; (d) η h o v e r .
Applsci 12 03694 g018
Figure 19. Average relative blade width and average twist amplitude of different optimal VPPs.
Applsci 12 03694 g019
Figure 20. Pareto front and selected optimal FPPs. (a) Sample points and Pareto front; (b) geometries of the propeller.
Applsci 12 03694 g020
Figure 21. Selected comprehensive optimal FPP.
Applsci 12 03694 g021
Figure 22. Twist angle and chord-length distribution of a comprehensive optimal FPP. (a) Twist angle distribution; (b) chord-length distribution.
Applsci 12 03694 g022
Figure 23. Performance of the selected optimal FPP. (a) C T ; (b) η ; (c) C P ; (d) η h o v e r .
Applsci 12 03694 g023
Figure 24. Average relative blade width and average twist amplitude of different optimal FPPs.
Applsci 12 03694 g024
Figure 25. Relationship between hover power and maximum thrust-to-weight ratio at hover. (a) VPP; (b) FPP.
Applsci 12 03694 g025
Figure 26. The differences of thrust (a) and power (b) between the BEMT and CFD method.
Applsci 12 03694 g026
Figure 27. Optimization results with different hover disk loading for an FPP. (a) Pareto fronts; (b) extreme values of two objectives.
Applsci 12 03694 g027
Figure 28. Optimization results with different hover disk loading for a VPP. (a) Pareto fronts; (b) extreme values of two objectives.
Applsci 12 03694 g028
Figure 29. Pareto-optimal front of VPP and FPP with different cruising speeds. (a) Pareto fronts for FPP; (b) Pareto fronts for VPP.
Applsci 12 03694 g029
Figure 30. Energy-saving advantage of VPP over FPP with different ξ and κ . (a) 3D surface diagram of δ , ξ and κ ; (b) δ ξ relation curves with different κ .
Applsci 12 03694 g030
Table 1. Mission profile parameters.
Flight StateMission Profile Parameters
NameSymbolVelocity (m/s)Thrust Required (N)Time(s)
CruisingS465.25155.8920
Non-Cruising StateHoverS10922.430
Vertical TakeoffS23922.434
ClimbingS337169.4124
Vertical LandingS5−1.5922.467
Vertical Climb
with Maximum Velocity
S610922.4-
Table 2. Parameters of BLDC motors used in Vahana A3.
Given ParametersEstimated Parameters
Maximum   input   power   P l i m i t e d B L D C   kW 40 Speed   constant   K V   rpm / V 8.0
Maximum   revolutionary   speed   Ω l i m i t e d   rpm 5500 Internal   resistance   R 0   Ω 0.25
Maximum   output   torque   Q l i m i t e d B L D C   Nm 200 No - load   current   I 0   A 2.0
Range   of   input   voltage   U   V 24~800
Table 3. Range of design variables.
Design VariablesRangeDesign VariablesRange
c r o o t   m 0.075 ~ 0.2 r m i d   m 0.2 R ~ 0.7 R
c t i p   m 0.04 ~ 0.12 ω 4   rpm 1000 ~ 3300
p 0 ~ 2
Table 4. Comparison between VPP and FPP.
VPPFPPAdvantage of VPP
E m i s s i o n   kWh 4.3995.303−17.05%
κ 1.5771.5054.57%
Publisher’s Note: MDPI stays neutral with regard to jurisdictional claims in published maps and institutional affiliations.

