Article

Study of Oxygen Vacancies in TiO2 Nanostructures and Their Relationship with Photocatalytic Activity

by
Alba Arenas-Hernandez
1,*,
Carlos Zuñiga Islas
1,
Mario Moreno
1,
Wilfrido Calleja Arriaga
1,
Julio César Mendoza-Cervantes
1,
Netzahualcoyotl Carlos
1,
Carlos Roberto Ascencio-Hurtado
1 and
Aurelio Heredia Jiménez
2
1
National Institute of Astrophysics, Optics and Electronics (INAOE), Electronics, Tonantzintla, Puebla 72840, Mexico
2
Electronics Department, Popular Autonomous University of the State of Puebla (UPAEP), Puebla 72410, Mexico
*
Author to whom correspondence should be addressed.
Appl. Sci. 2022, 12(7), 3690; https://doi.org/10.3390/app12073690
Submission received: 22 February 2022 / Revised: 26 March 2022 / Accepted: 27 March 2022 / Published: 6 April 2022
(This article belongs to the Special Issue Anatase Chemistry, Nanostructures and Functionalities‎)

Abstract

:
In this research work, we present the synthesis and characterization of four different TiO2 structures, such as nanotubes, nanocavities, nanosheets assembled on nanocavities and nanobowls assembled on nanocavities, prepared by electrochemical anodization using organic electrolytes. After synthesis, the structures were thermally annealed to pass from the amorphous phase to the anatase phase, which is one of the most important crystalline structures of TiO2 due to its high photocatalytic activity and stability. The unique morphology and topography were studied using scanning electron microscopy (SEM) and atomic force microscopy (AFM). The elemental composition was determined by energy-dispersive X-ray spectroscopy (EDS). The anatase phase was verified by Raman microscopy and X-ray diffraction (XRD), the band gap energy was calculated by the Kubelka–Munk function, and the main defect states that generate the emission, as well as their lifetime, were determined by photoluminescence spectroscopy and time response photoluminescence (TRPL), respectively. The TiO2 nanomaterials were tested as catalysts in the photodegradation of a solution of methylene blue using a UV lamp at room temperature. The results showed complex morphologies and different surface roughness areas of these nanomaterials. Furthermore, a relationship between defect states, band gap energy, and photocatalytic activity was established. We found that the catalytic activity was improved as an effect of geometric parameters and oxygen vacancies.

1. Introduction

TiO2 nanostructures have attracted attention in the scientific community for their high catalytic activity, UV absorption, stability, and biocompatibility, in addition to their catalytic, gas sensing, optical, electrical, chemical, and medical applications [1]. These nanostructures have been fabricated in different morphologies such as nanoparticles, nanotubes, nanosheets, nanobowls, and nanowires to improve all their properties. Among the crystallographic phases of titanium dioxide, such as anatase, rutile, and brookite, anatase has the highest photocatalytic activity due to the large surface area per unit mass and volume [2].
Particularly, nanosheets -nanostructures with shapes like sheets- have potential uses for Li-ion batteries, FETs, and catalytic applications [3,4,5]. According to N. Loubet et al., nanosheets have excellent electrostatics, high current driving capabilities, high-frequency operation, and short channel control for FETs applications [4]. Also, Meng Zhang et al. demonstrated that because of the nanometer size of TiO2 nanosheets, this material has a better contact with molecules for highly efficient catalysts [5].
In this same sense, nanobowls—nanostructures with shapes like cups—have been studied for catalytic applications, solar cells, and light trapping [6,7,8]. For instance, Wenhui Wang et al. reported that TiO2 nanobowls used in colored perovskite solar cells showed an improved efficiency owing to their special shape with preferential orientation, which improved crystallinity and decreased grain size [7]. Whereas Hongsheng Fan et al. demonstrated that these nanostructures considerably enhance the catalytic activity for direct methanol fuel cells due to the electronic effects of nanobowls [8].
In the last few years, TiO2 nanotubes have also been studied widely for diverse applications, such as catalysts, solar cells, femur prostheses, plasmonic effects; and chemical, biological, and gas sensors [1,9]. Several papers about nanotubes applications have been published recently due to their tubular shape and excellent electrical, chemical, mechanical and optical properties [1,9,10,11,12]. Besides, it is worth mentioning that electrochemical anodization is the most used technique for their fabrication [9,10,11,12,13]. For instance, Fengxia Liang et al. fabricated a field-effect transistor based on TiO2 nanotubes for humidity sensing and, at the same time, reported that a single nanotube had a high sensibility because it had a larger surface area than a TiO2 nanotubes film [10]. Also, the open channel TiO2 nanotubes were reported by Elham Montakhab et al. [11]. These had better photocatalytic activity than nanotubes with nanograss and other nanostructures.
Concerning the improvement of the catalytic activity, many scientists have studied the shape and size of nanostructures, likewise their defect states [12]. In this regard, S.T. Nishanthi et al. reported that the high crystallinity of the anatase phase of TiO2 increases the photocatalytic activity by decreasing defect states of TiO2 [14]. On the contrary, Biswajit Choudhury et al. showed that the enhancement in catalytic activity occurred once the oxygen vacancies in the TiO2 film increased, due to the narrowing of the band gap [15].
In this work, TiO2 nanotubes (TiO2-nt), TiO2 nanocavities (TiO2-nc), TiO2 nanosheets assembled on TiO2 nanocavities (TiO2-ns/TiO2-nc) and TiO2 nanobowls assembled on TiO2 nanocavities (TiO2-nb/TiO2-nc) were studied for catalytic applications. The nanostructures were prepared by two-step electrochemical anodization for TiO2-ns/TiO2-nc, TiO2-nb/TiO2-nc and TiO2-nc; and three-step for TiO2-nt. The relationships of the defect states, crystallinity, shape, size, and band gap of these complex nanostructures with catalytic activity are discussed. In addition, we found that the number of oxygen vacancies is related to the geometric parameters of TiO2 nanostructures, therefore, the morphology plays a very important role in the catalytic activity.

2. Materials and Methods

TiO2 nanostructures were synthesized by electrochemical anodization using platinum mesh as a counter electrode and titanium foil as the anode. Titanium foils with an area of 1.5 cm2 and a thickness of 100 µm (American Elements, 99.95% purity) were first cleaned with trichloroethylene, acetone, and deionized H2O before the electrochemical process.
The nanostructures were grown using a procedure described in our previous work [16]. The electrolyte solution was prepared with 0.255 wt% NH4F and 1 wt% of deionized water in ethylene glycol. A voltage of 30 V and Inter-Electrode Spacing of 1 cm were used for the anodization process. TiO2-nt were grown through a three-step anodization process of 1, 4 and 20 h. After the first and second anodization steps, a detachment process of the nanotubes was realized in order to obtain a template of dimples (Ti nanobowls) on Ti foil. For TiO2-nc, a two-step anodization process was done, the first one lasting 1 h and the second one 10 min. Whereas the self-assembled nanostructures were synthesized by a two-step anodization process, the first one lasting 1 h and the second one: 15 min for TiO2-ns/TiO2-nc and 40 min for TiO2-nb/TiO2-nc. Afterwards, a thermal treatment at 450 °C was carried out for 1.5 h to pass from the amorphous phase to the anatase phase for each nanostructure.
In order to understand the morphological, optical, chemical, structural and catalytic properties of these nanomaterials, several characterization techniques were used: the morphology was studied by SEM (FEI, model SCIOS) and the topography by AFM (Nanosurf Easy Scan 2.3). The elemental composition of TiO2 nanostructures was determined by EDS at 10 keV (EDAX, model APOLLO). The reflectance spectrum was determined by a Semiconsoft MProbe UVVis SR thin film measurement system. To validate the transformation from the amorphous phase to the anatase phase of our TiO2 nanostructures, the vibration modes related to anatase crystal structure were calculated by Raman Microscopy (Witec, model alpha 300 R, Ulm, Germany) with a green laser excitation of 532 nm. The phase identification of TiO2 nanomaterials was determined by XRD (D8 Discover Bruker diffractometer).
Also, to determine the main defect states that increase the emission and its relationship with the morphology, photoluminescence spectra were determined by fluorescence spectroscopy (Fluoromax-3, Jobin Yvon, Paris, France); and TRPL data were recorded in a nanosecond time-resolved photoluminescence spectrometer (NanoLog FR3, Horiba Jobin Yvon). The samples were excited with a 330 nm diode laser and the emissions were monitored at 418 nm, 448 nm, and 532 nm.
The photocatalytic activity was evaluated by the discoloration technique of the dye solution using a 254 nm UV lamp (model UVG54 from Mineralight brand, Houston, TX, USA). The dyed solution was prepared with 10 mg of methylene blue in 1 L of deionized water. The distance between the UV lamp and dyed solution was about 15 cm. A sample of each nanomaterial was immersed in 0.1 L of dyed solution with an effective area of 1 cm2 at room temperature. The concentration of the dye was monitored using the absorbance spectrum of each solution at certain time intervals by spectrophotometry (Perkin Elmer, model Lambda 3B, Waltham, MA, USA). To determine the active species, scavenging experiments were carried out using methanol, 2-propanol, and superoxide dismutase (SOD) to scavenge   h + ,   OH . ,   and   O 2 . , correspondingly.
The percentage of degradation was calculated using Equation (1) [11].
D e g r a d a t i o n % = A 0 A t A 0 × 100
where A 0 is the absorbance of methylene blue before irradiation, and A t is the absorbance after irradiation.

3. Results

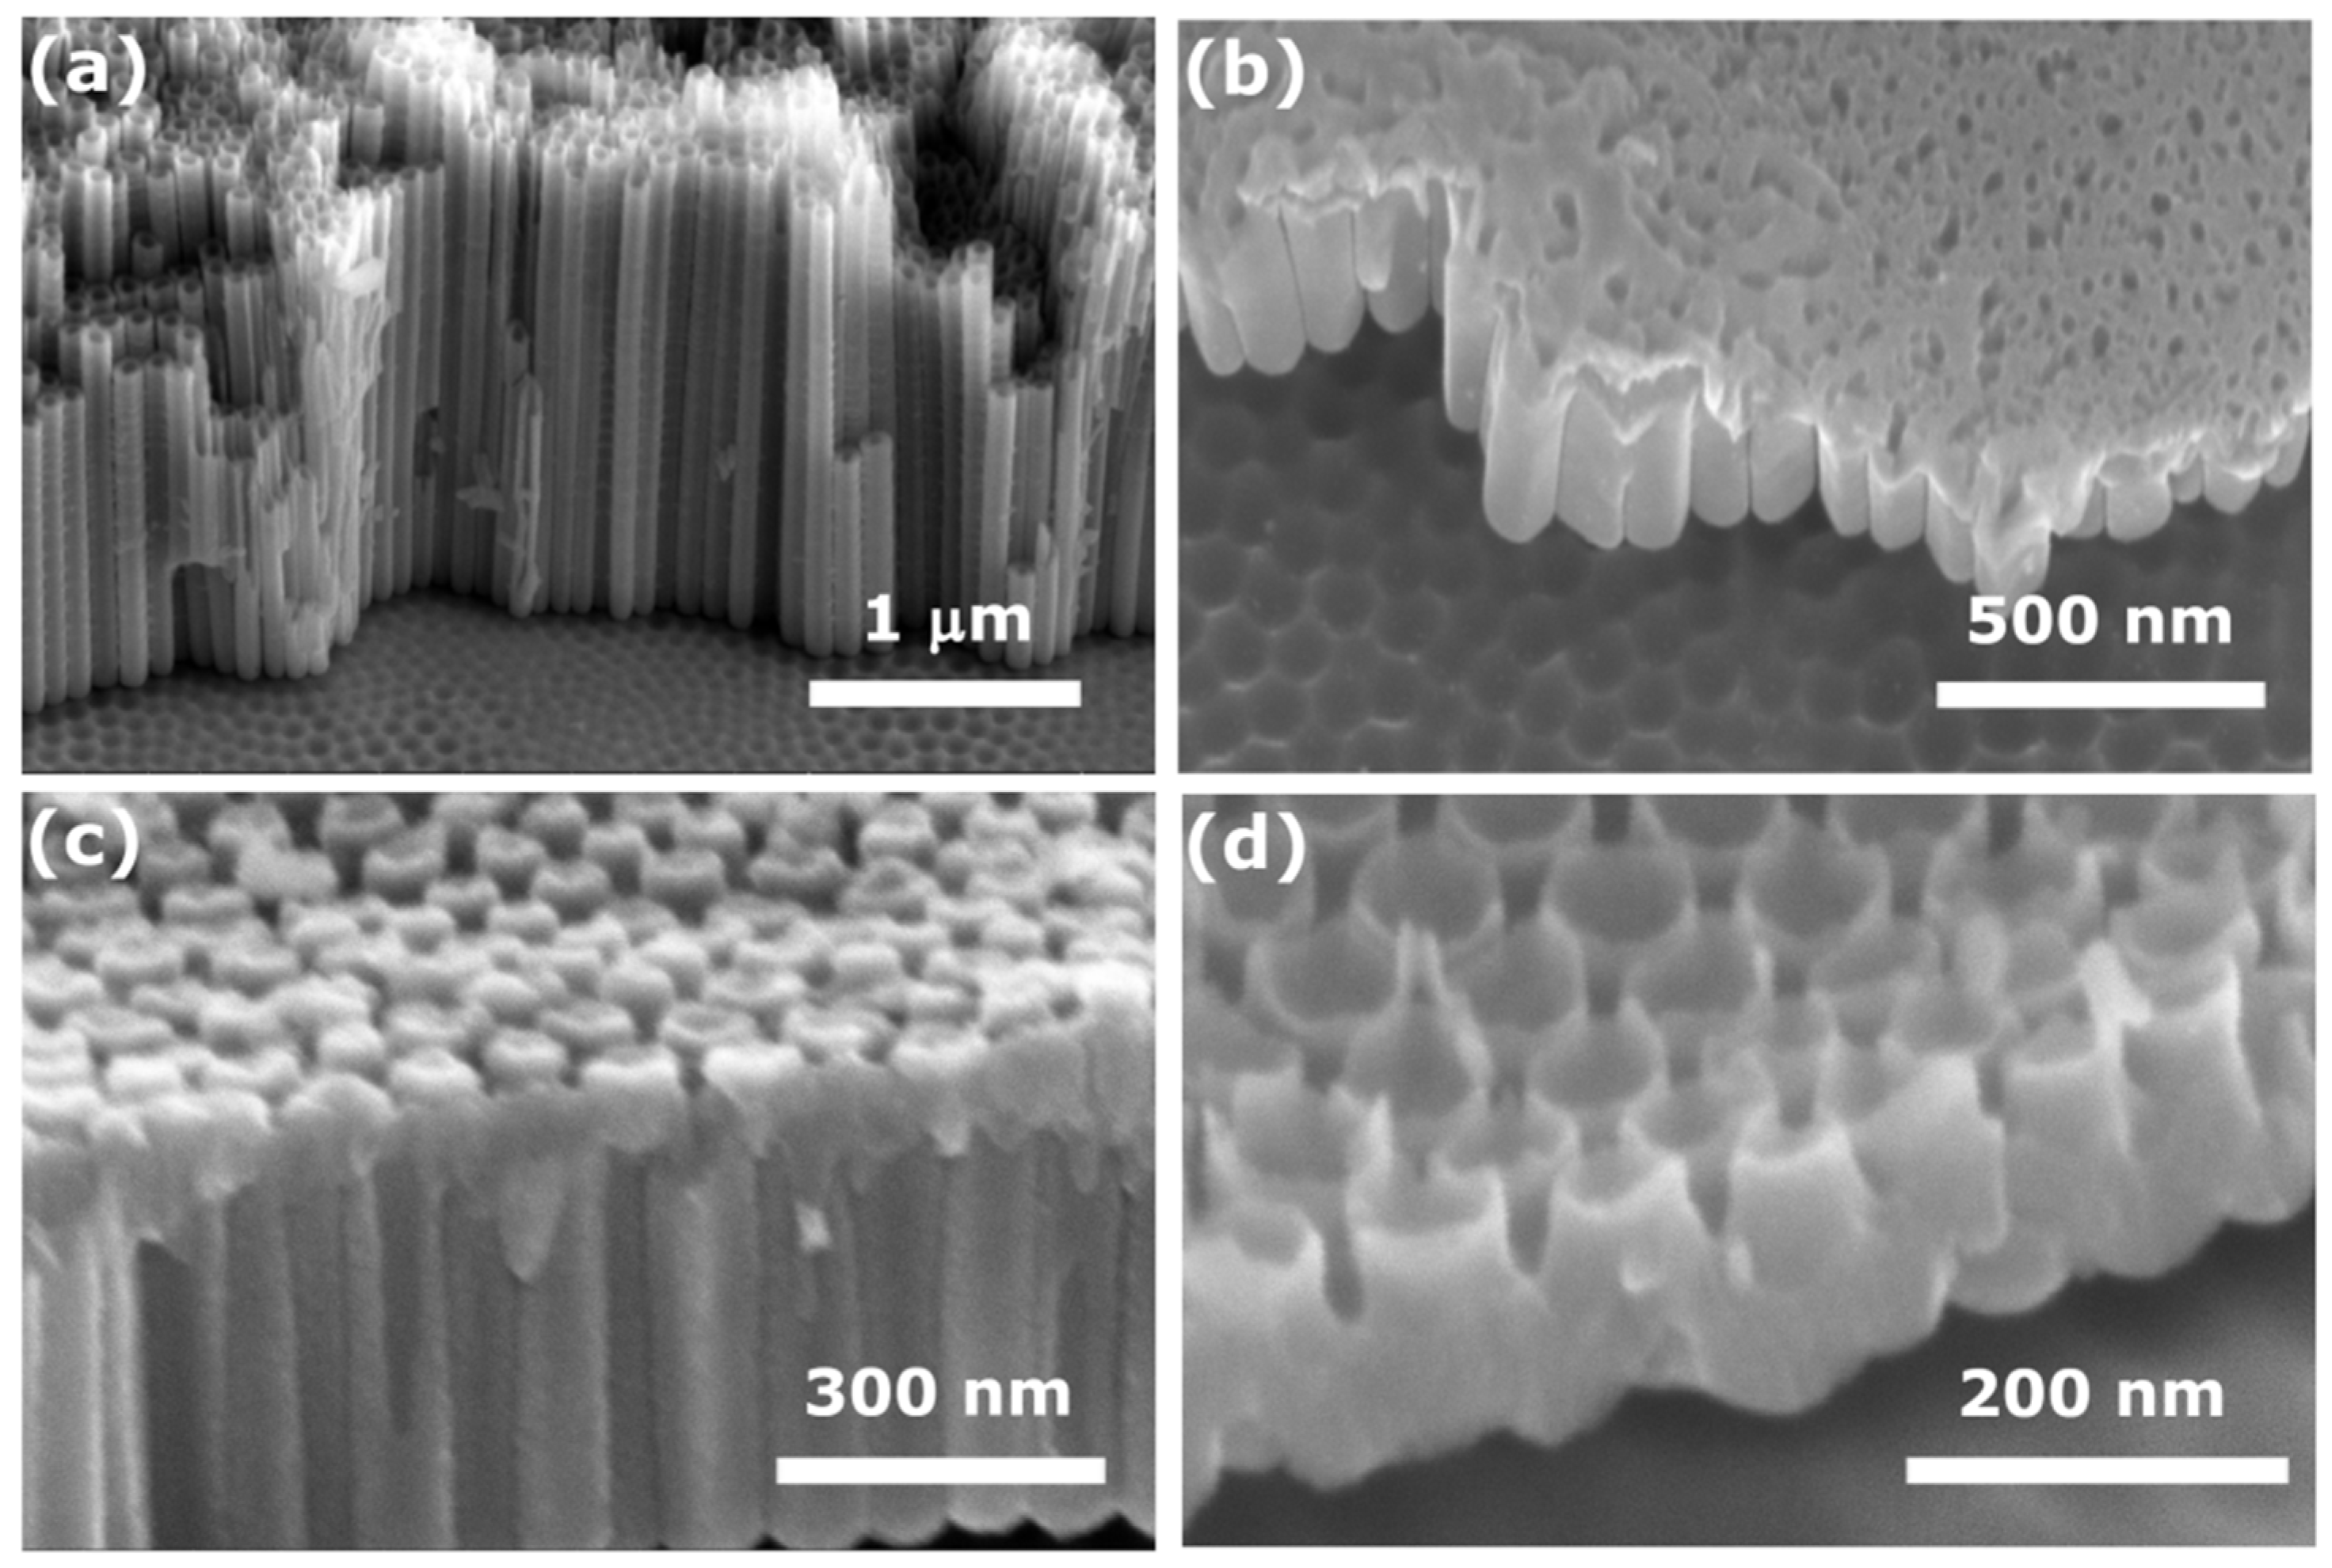
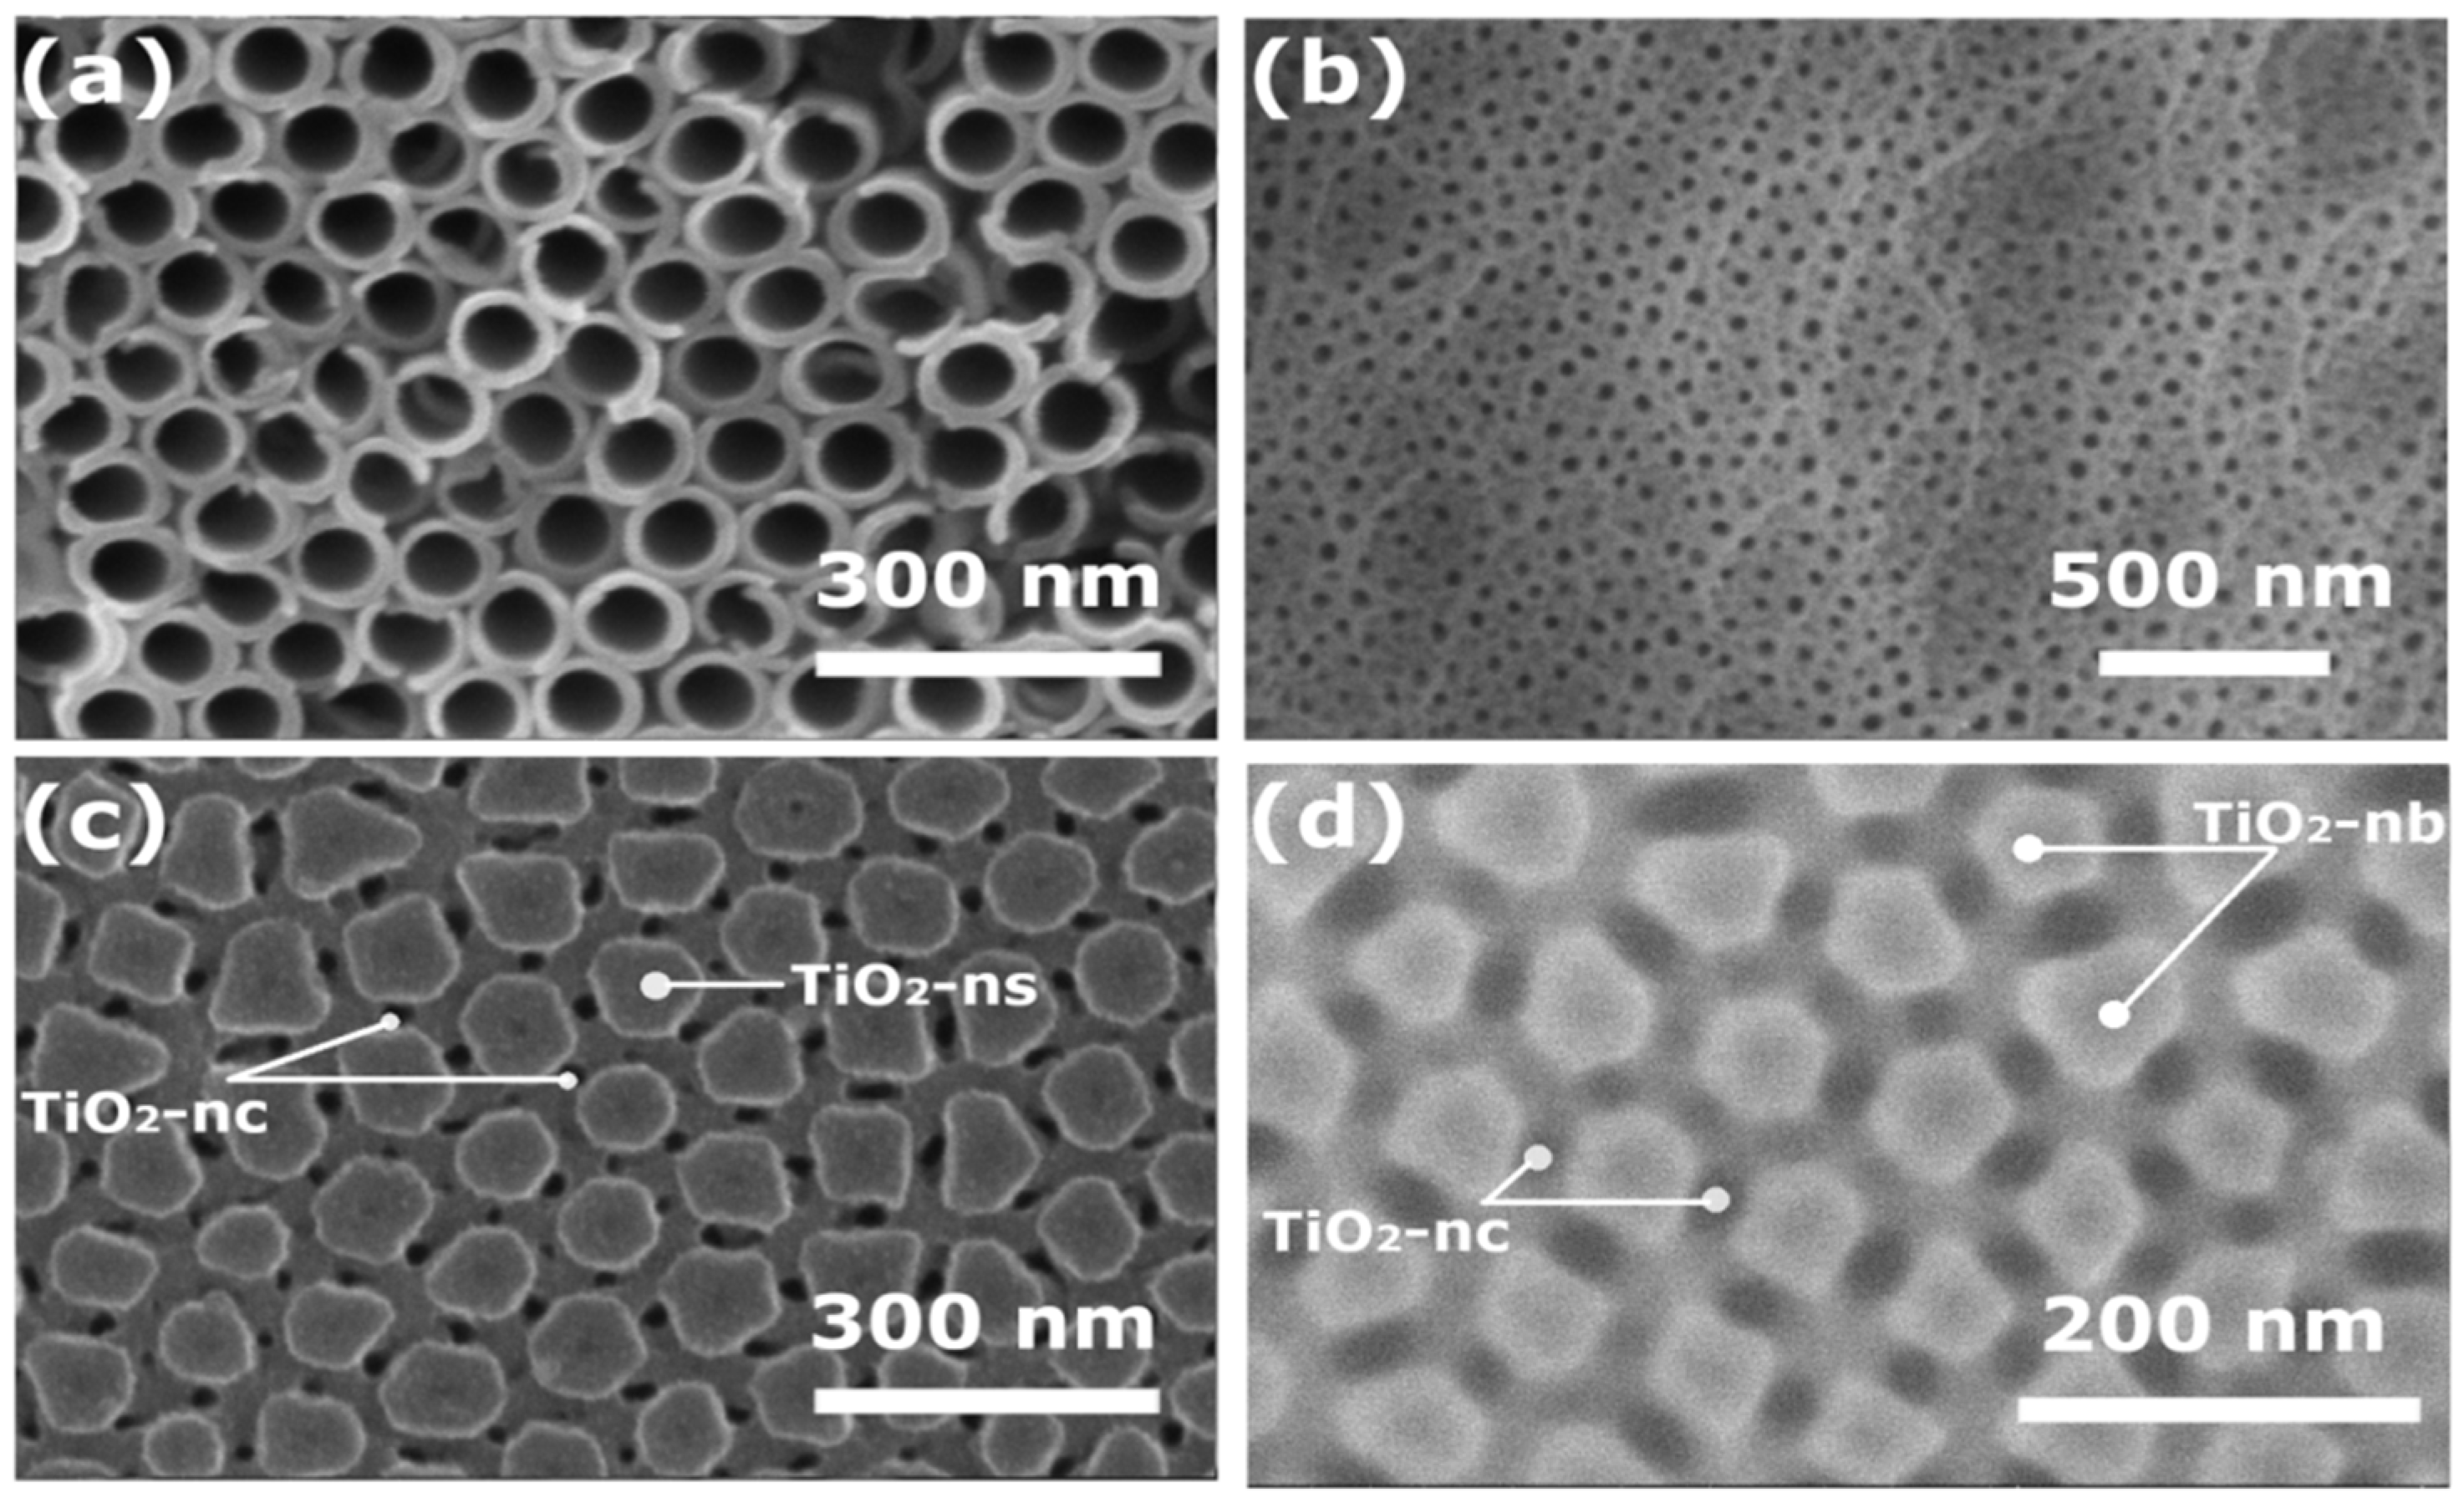
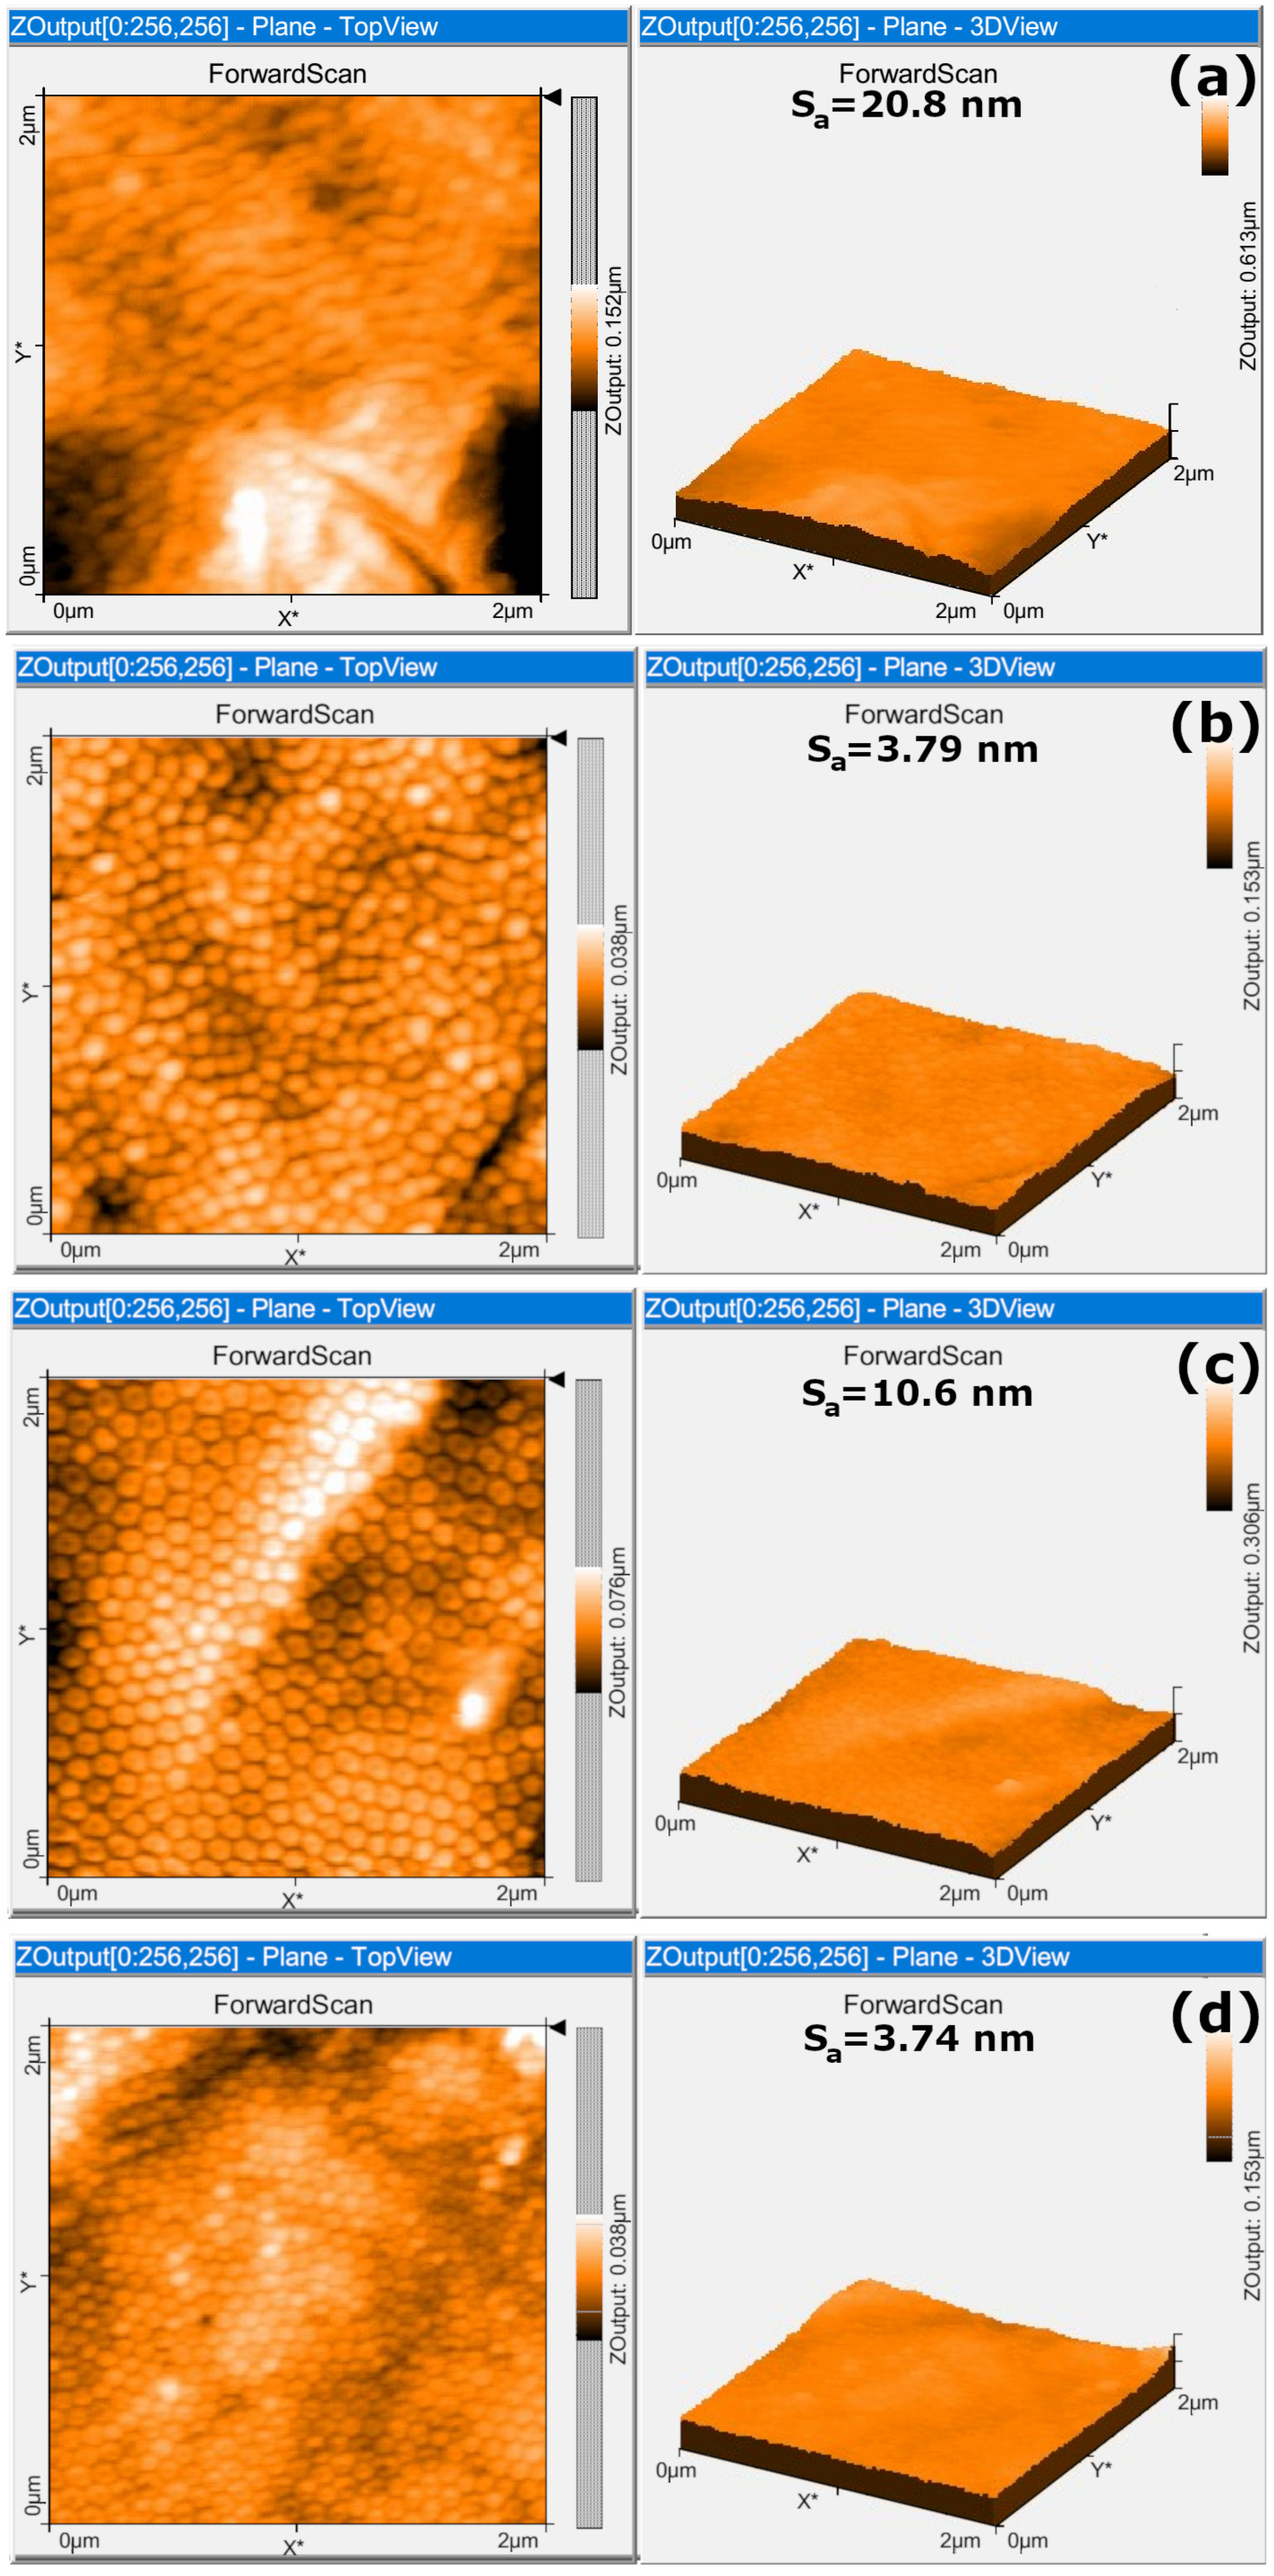
3.1. Morphological and Topography Characterization

Figure 1 shows the cross-section morphology of the four TiO2 nanostructures prepared by electrochemical anodization. TiO2-nt can be observed in Figure 1a; their good organization was achieved thanks to the three steps of anodization which resulted in a homogeneous wall thickness with an inner diameter of approximately 65 nm and a length of 1.67 µm. At the bottom of these nanotubes, Ti nanobowls (Ti-nb), known as “the dimples” can be seen, which help to enhance the organization of nanotubes as a template [17].
Meanwhile, Figure 1b shows the morphology of TiO2-nc, their length and inner diameter were 250 ± 50 nm and 29 ± 3 nm, respectively. The roughness caused by the organic electrolyte can be seen in the upper part of the nanocavities [18]. While in their template of Ti-nb, in the lower part, a hexagonal geometric mesh can be observed in contrast to the template of TiO2-nt (Figure 1a) whose arrangement is made of circular mesh.
Figure 1c displays the cross-section of TiO2-ns/TiO2-nc. In this case, the length of the nanocavities was 362 nm and their inner diameter 22 nm, whereas the thickness and outer diameter of nanosheets were 35 nm and 85 nm, respectively. The nanosheets were grown selectively between the upper ends of two or three nanocavities. This unique morphology was achieved by controlling the time of the second step anodization, resulting in a homogeneous length of nanocavities and a thickness of nanosheets [16]. Different structural forms were noticed in Figure 1d for TiO2-nb/TiO2-nc; in the upper part TiO2-nb; in the middle part TiO2-nc; and in the lower part Ti-nb. The shape of TiO2-nb was obtained due to the control over the anodization time, they were selectively grown among the tops of the nanocavities acquiring a hexagonal organization [16]. The length and inner diameter of nanocavities were 96 nm, and 30 nm, respectively, while the thickness and outer diameter of nanobowls were 40 nm and 75 nm, respectively. A summary of these geometric parameters is shown in Table 1.
Figure 2 shows the surface morphology of the four nanostructures. The surface morphology of TiO2-nt is displayed in Figure 2a, as mentioned above, nanotubes had a highly organized morphology because of the three-step anodization process. This organization clearly consists of six nanotubes surrounding a central nanotube because the template of the Ti-nb operates as a mask of “dimples” [17,19]. Here, the inner and outer diameters were about 65 nm and 98 nm, respectively. A different morphology for TiO2-nc is shown in Figure 2b. As can be seen, the morphology resembles a porous membrane whose surface is an oxide film that presents significant roughness caused by organic electrolyte solutions, this film is known as “the entire surface layer” [20]. The inner diameter of the nanocavities was about 29 nm.
A more complex morphology for TiO2-ns/TiO2-nc is noticed in Figure 2c. As can be seen, the nanosheets were selectively grown among the tops of the nanocavities acquiring a highly ordered morphology, such organization is a periodicity function of the template of the Ti foil. The outer diameter of nanosheets was about 85 nm, which is notably larger than the inner diameter of the nanocavities (22 nm), shown as black circles. Figure 2d shows the surface morphology of TiO2-nb/TiO2-nc. The nanobowls were assembled on top of a set of several nanocavities forming an arrangement similar to a six-petals flower. The diameter of the nanocavities, in gray color, was about 30 nm, and the outer diameter of nanobowls was 75 nm being more homogeneous than the outer diameter of the nanosheets of 85 nm. In our previous work, we reported that the shape of nanosheets and nanobowls depends on the time of the second anodization step, with a longer time, nanobowls can be obtained while nanosheets are obtained with a shorter anodization time [16].
Figure 3 shows the top view and 3D AFM images of the four TiO2 nanostructures. The topography of TiO2-nt is shown in Figure 3a, here, the different colors, such as black and cream, suggest a difference in the length of the tubes. According to AFM analysis, the outer diameter of these nanotubes was 105 ± 8 nm, while the average surface roughness, Sa, was about 20.8 nm [21].
Figure 3b shows the topography of TiO2-nc. As can be observed, the length of the nanocavities is more homogeneous than that of TiO2-nt. The AFM analysis showed an outer diameter of 84 nm ± 5 nm and a Sa of 3.79 nm, considerably less than that of TiO2-nt. This lower roughness can be associated with a homogeneous oxidation process on the Ti foil surface. A uniform distribution of TiO2-ns/TiO2-nc is displayed in Figure 3c where it is possible to visualize the organization of the nanostructure as a flower with six petals and verify its concave shape (on the right side of Figure 3c) as established in the previous SEM analysis. The surface roughness of TiO2-ns (10.6 nm) was greater than that of the TiO2-nc (3.79 nm) and the nanosheets diameter was 85 nm, both in agreement with the values obtained by SEM. The lowest average surface roughness was obtained on TiO2-nb/TiO2-nc (3.74 nm) because the nanobowls had better control on diameter size resulting in a significant periodicity as a short-range hexagonal controlled packed array, as shown in Figure 3d. The roughness values of the four structures are included in Table 1.

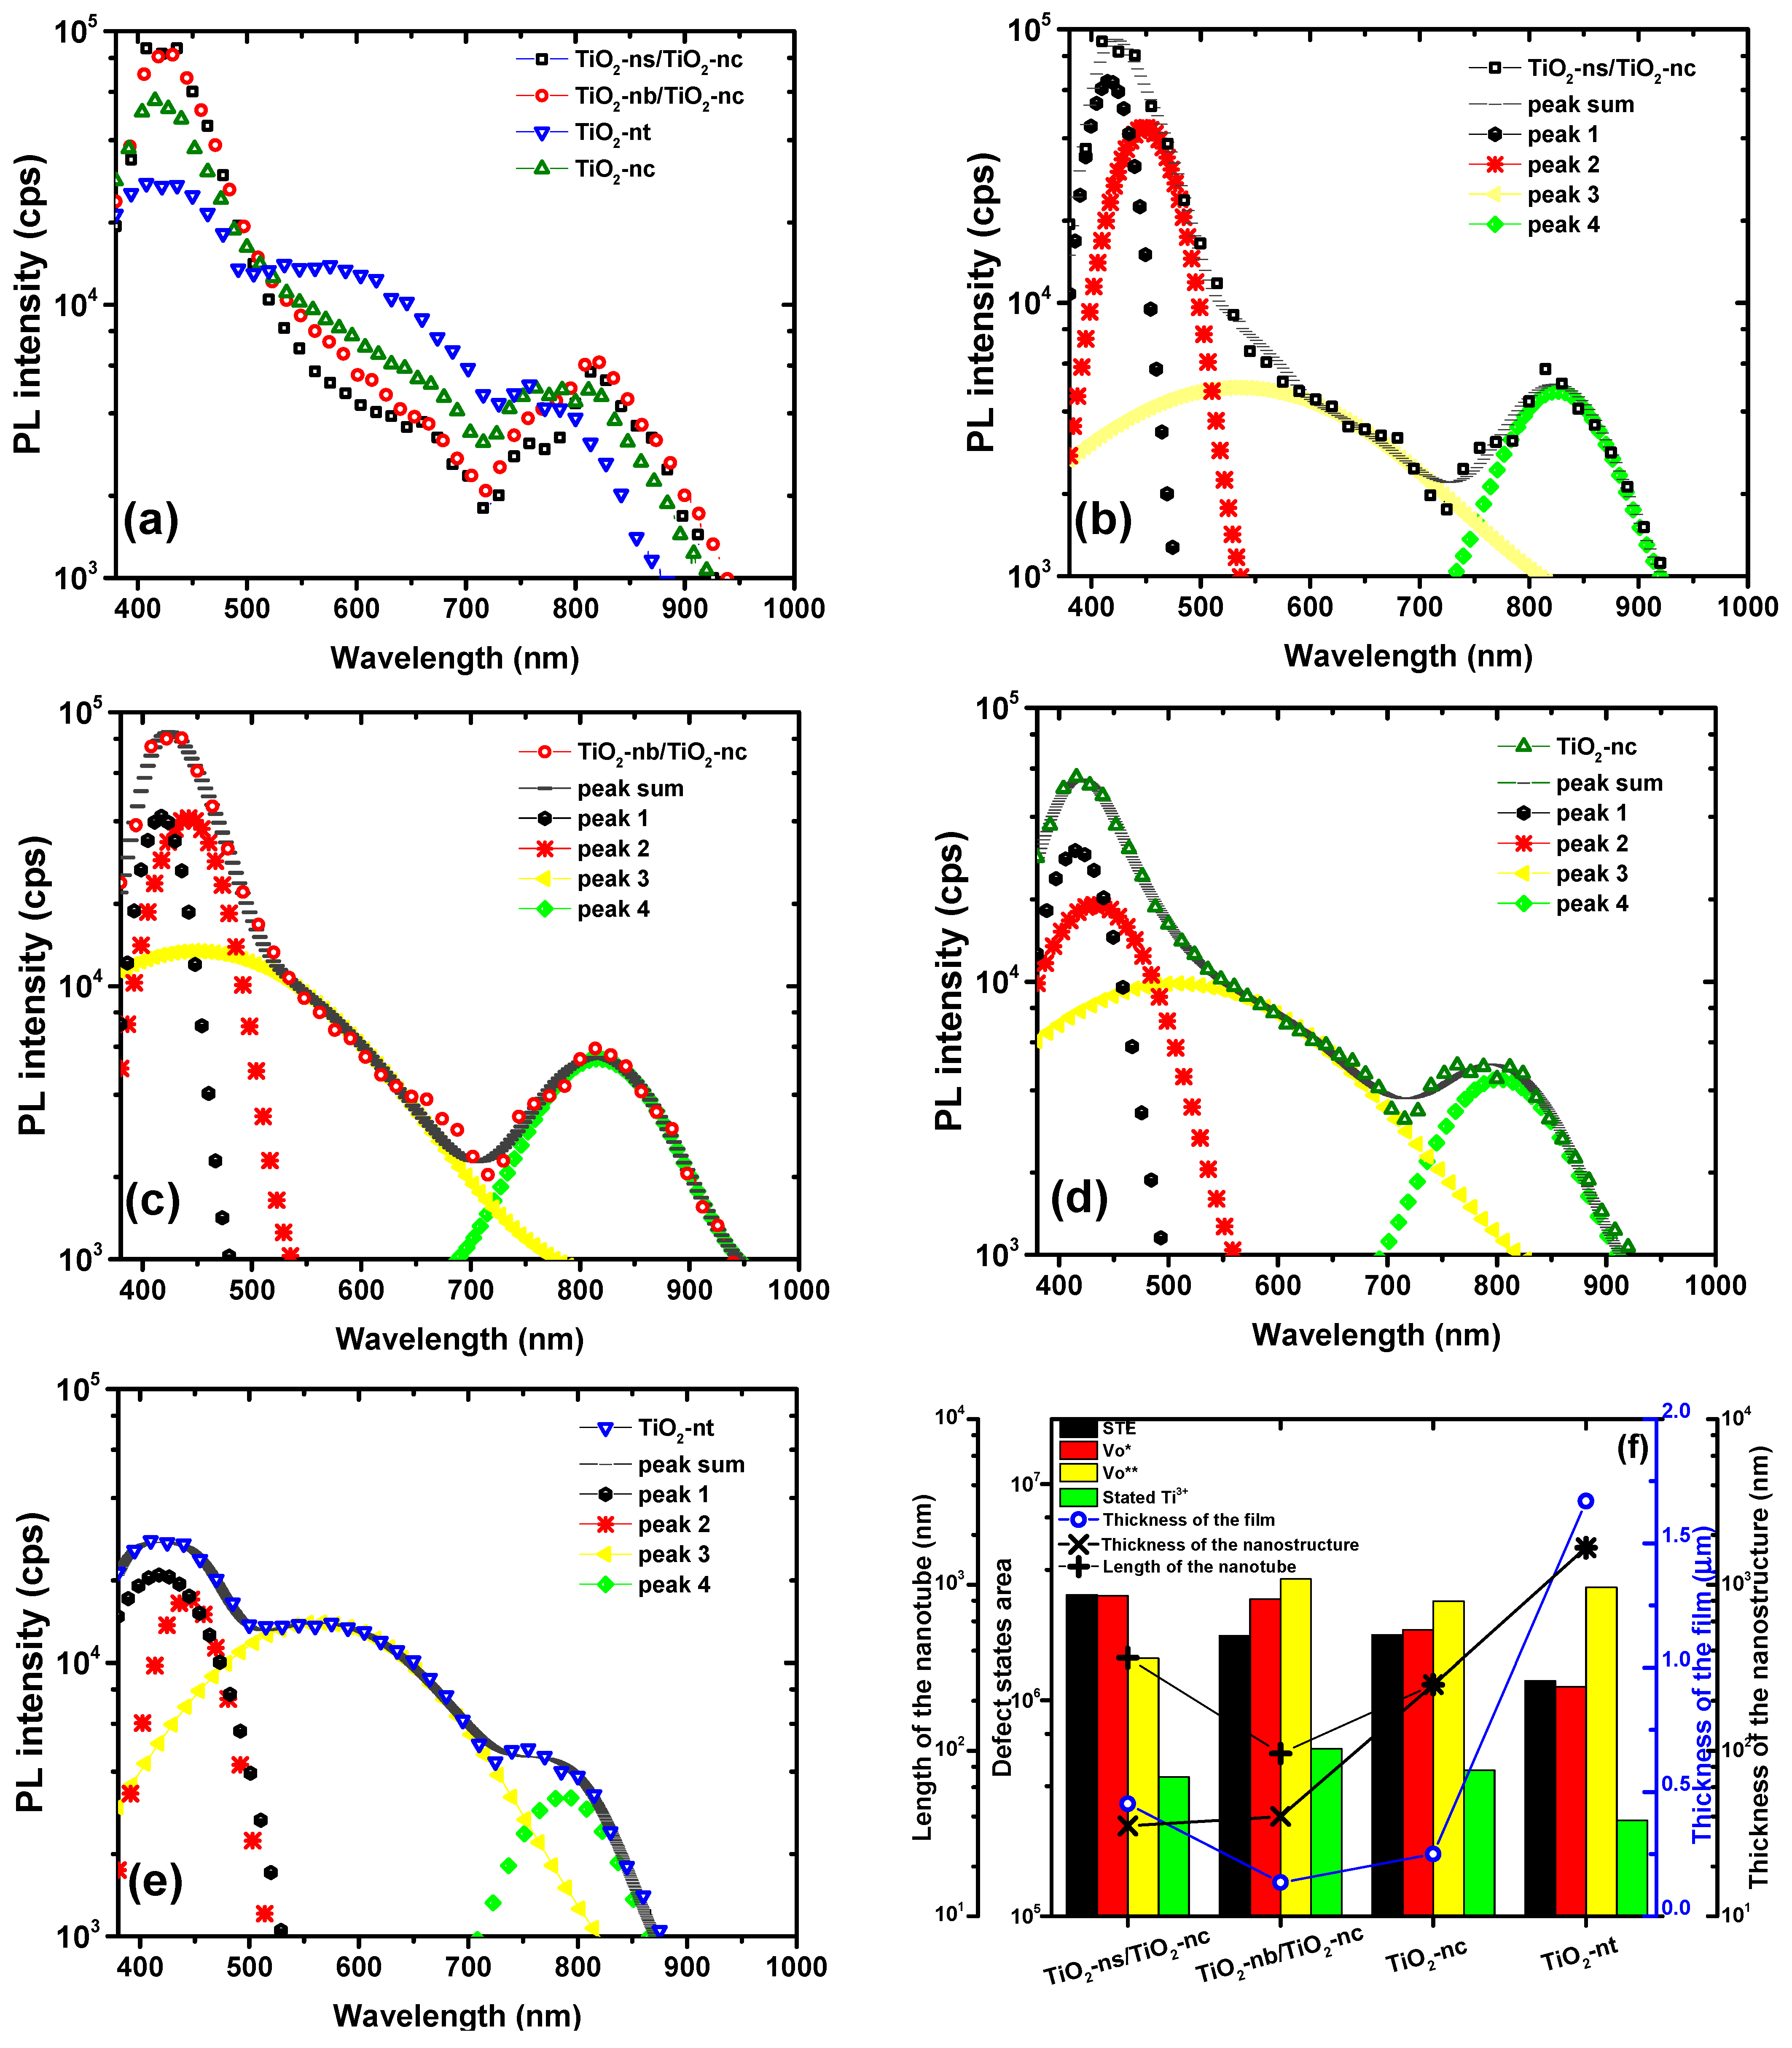
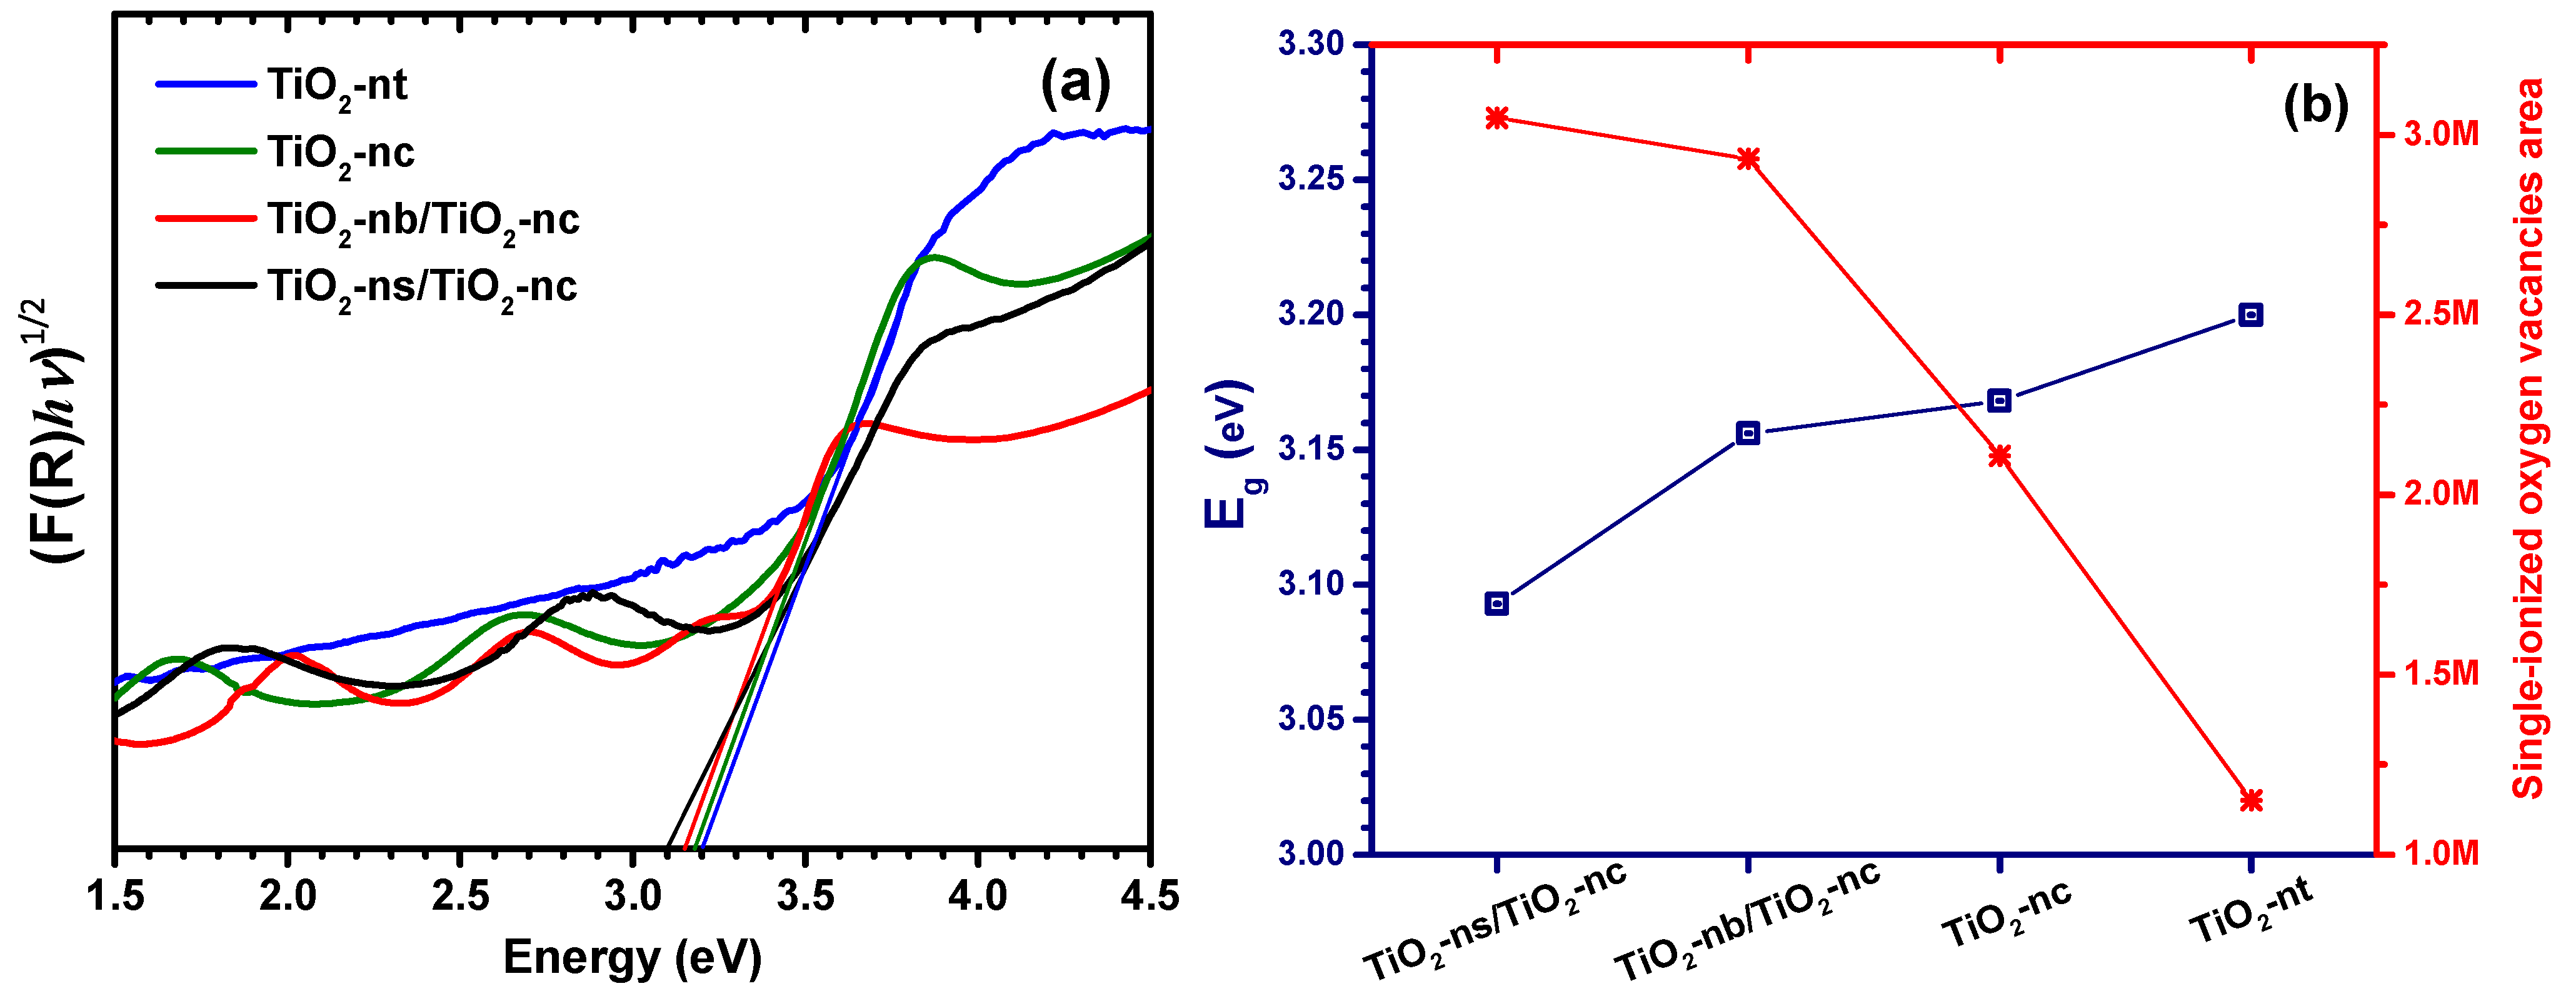
3.2. Optical Characterization

Figure 4a shows photoluminescence spectra of the four nanostructures. The highest emission in the blue band was observed in TiO2-ns/TiO2-nc, while the lowest was in TiO2-nt. In general, the emissions of nanostructures with anatase phase are higher than self-assembled nanostructures with amorphous phase, as reported in our previous work [16]. The main defect states of TiO2-based nanomaterials with this characteristic spectrum are self-trapped excitons (STE), single-ionized oxygen vacancies (Vo*), doubly-ionized oxygen vacancies (Vo**), and excited states of Ti3+ at 416 nm; 443 nm; 531 nm; and 802 nm, respectively [16,22,23,24,25,26].
Figure 4b–e shows deconvolutions calculated for each emission spectra correspondingly to TiO2-ns/TiO2-nc; TiO2-nb/TiO2-nc; TiO2-nc; and TiO2-nt, respectively. Basically, the four TiO2 films had the same defect states but in different areas [24,26,27]. The self-assembled nanostructures had the highest amount of defect states: TiO2-ns/TiO2-nc was the richest in STE and Vo* (the latter being comparable to TiO2-nb/TiO2-nc), while TiO2-nb/TiO2-nc had the highest number of Vo** and Ti3+, in contrast TiO2-nt was the poorest nanomaterial in the amount of STE, Vo*, and Ti3+. Figure 4f shows the relationship between defect states area and thickness of TiO2 films. Note that the area of Vo* is inversely proportional to the thickness of the film. Therefore, thinner films had a greater number of single-ionized oxygen vacancies. However, we did not find a relationship between STE, Vo** and Ti3+ with the thickness of the film.
The single-ionized oxygen vacancies area of TiO2-ns/TiO2-nc was 2.64, 1.6643, and 1.0386 times larger than TiO2-nt, TiO2-nc, and TiO2-nb/TiO2-nc, respectively. Therefore, we suggest that nanobowls and nanosheets have more defect states due to their geometric shape, added to this, the self-assembled nanostructures form a hybrid nanostructure with exceptional optical properties [28]. From the EDS results, it can be seen self-assembled nanostructures had lower oxygen content, which may be related to defect states, specifically oxygen vacancies due to deficiency of oxygen in the TiO2 film (see Table S1).
The fact that the thickness of the nanosheets is thinner than that of the nanobowls could be a crucial factor in enhancing the emission of self-assembled nanostructures. Another essential characteristic is the length of the tubular structures (nanocavities), the length of TiO2-nb/TiO2-nc was shorter than the length of the other three films; nevertheless, its emission was higher compared to TiO2-nc and TiO2-nt (Figure 4f). The exceptional properties of hybrid nanostructures could explain the enhancement in the emission of TiO2-nb/TiO2-nc and TiO2-ns/TiO2-nc, and the higher surface area in those nanostructures [16,28,29,30].
Figure 5a shows the band gap energy of all studied TiO2 nanostructures. The optical band gap was calculated by the Kubelka-Munk function (F(R)), as shown in Equation (2) [31]. According to Valeeva et al., F(R) is proportional to absorption coefficient and was determined from the reflectance using Equation (3) considering indirect transitions [31].
F R h v = A h v E g 2
F R = 1 R 2 2 R
where R is the reflectance, A is a constant, h is Planck constant, and v is the photon frequency.
In Figure 6a it can be observed that the band gap of TiO2-nt is close to 3.2 eV, this energy concurs with other reports that study materials with anatase phase [15,27,32]. An important reduction of the band gap for other nanostructures was noticed, the TiO2 film with the narrowest band gap (3.093 eV) is TiO2-ns/TiO2-nc. In contrast, the band gap of TiO2-nc (3.179 eV) is lower than TiO2-nt but larger than TiO2-nb/TiO2-nc (3.156 eV). The band gap narrowing can be related to amount of oxygen vacancies in the TiO2 films, as shown in Figure 5b, since oxygen vacancies create localized states within the band gap, which operate as electron donor states [15,22,27]. It is clear that the band gap energy reduces as the number of single-ionized oxygen vacancies increases.

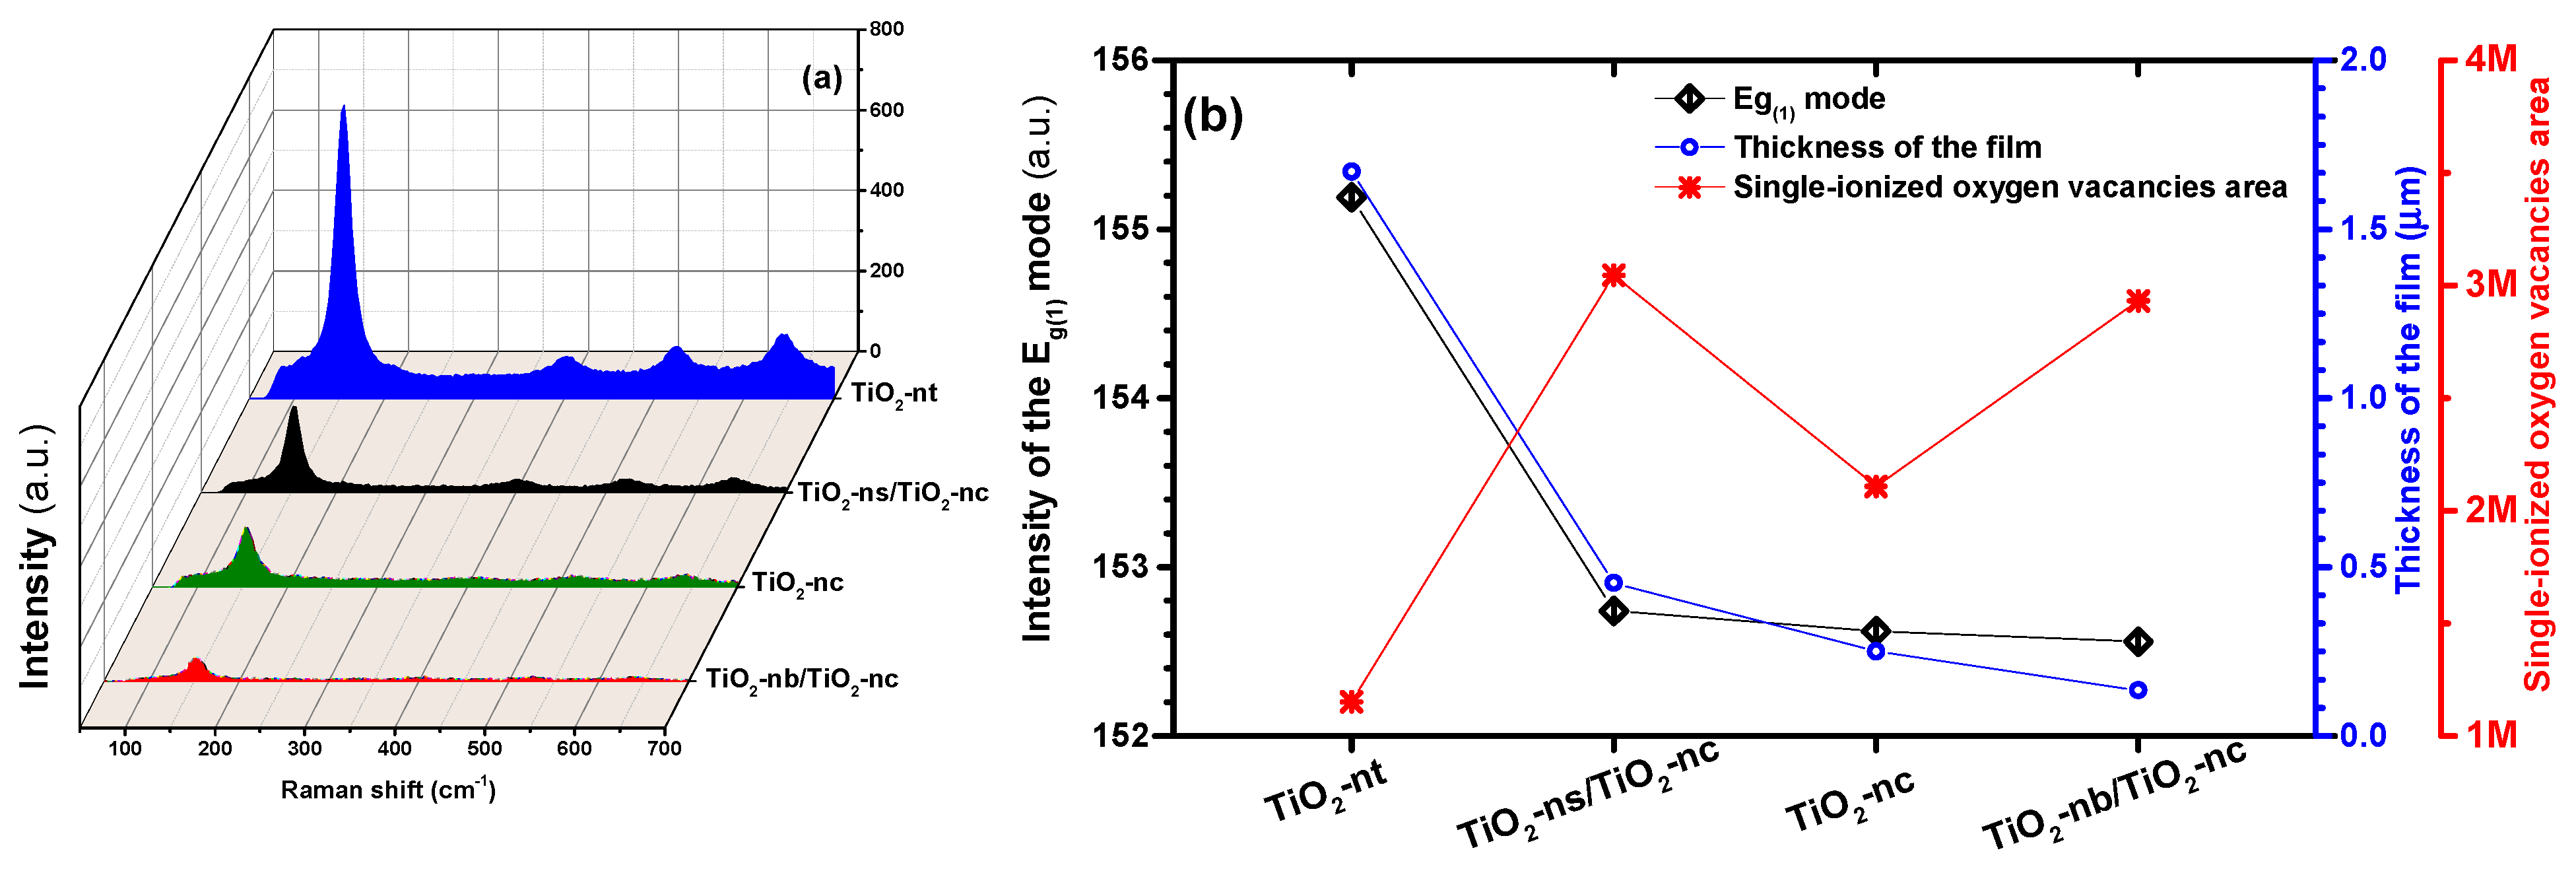
3.3. Structural Characterization

Figure 6a displays the Raman spectra of the four nanostructures, here we can see that the main vibration modes correspond to the tetragonal anatase phase because modes Eg(1), B1g, A1g + B1g, and Eg(3) were located at 154 cm−1, 391 cm−1, 509 cm−1, and 638 cm−1, respectively [16,27]. TiO2-nt had the mode Eg(1) with higher intensity compared to the other TiO2 films. The Eg(1) mode is originated from the O-Ti-O bending vibration, while its larger vibration intensity is mainly achieved by the high periodicity of tubular nanostructures [27,33]. An important cause can be the thickness of film because, as can be observed in Figure 6a, the intensity of Eg(1) mode increases with the thickness of the film [33,34]. These results are in agreement with XRD patterns of Figure S1. From the XRD pattern, it can be observed that (101) plane of the anatase phase had a higher intensity for the nanotubes compared to the other films. Another possible cause is the crystalline size because it has already been reported that the intensity of the Eg(1) mode peak increases when the crystalline size decreases [1,34]. Moreover, in Figure 6a we noticed that this mode was displaced because the peak must be localized at 146 cm−1 [1,33,34].
Figure 6b shows the relationship of the displacement of the Eg(1) mode with the thickness of the film and single–ionized oxygen vacancies. As can be seen, the displacement of this mode increases as the thickness of TiO2 film increases. This fact would demonstrate that the displacement of this vibration mode is a thickness effect. Moreover, we can observe that oxygen vacancies affect the intensity of the Eg(1) mode but in a smaller proportion than the thickness of the film. As already suggested, the different crystalline sizes and the confinement of acoustic phonons originate this displacement [27,34].

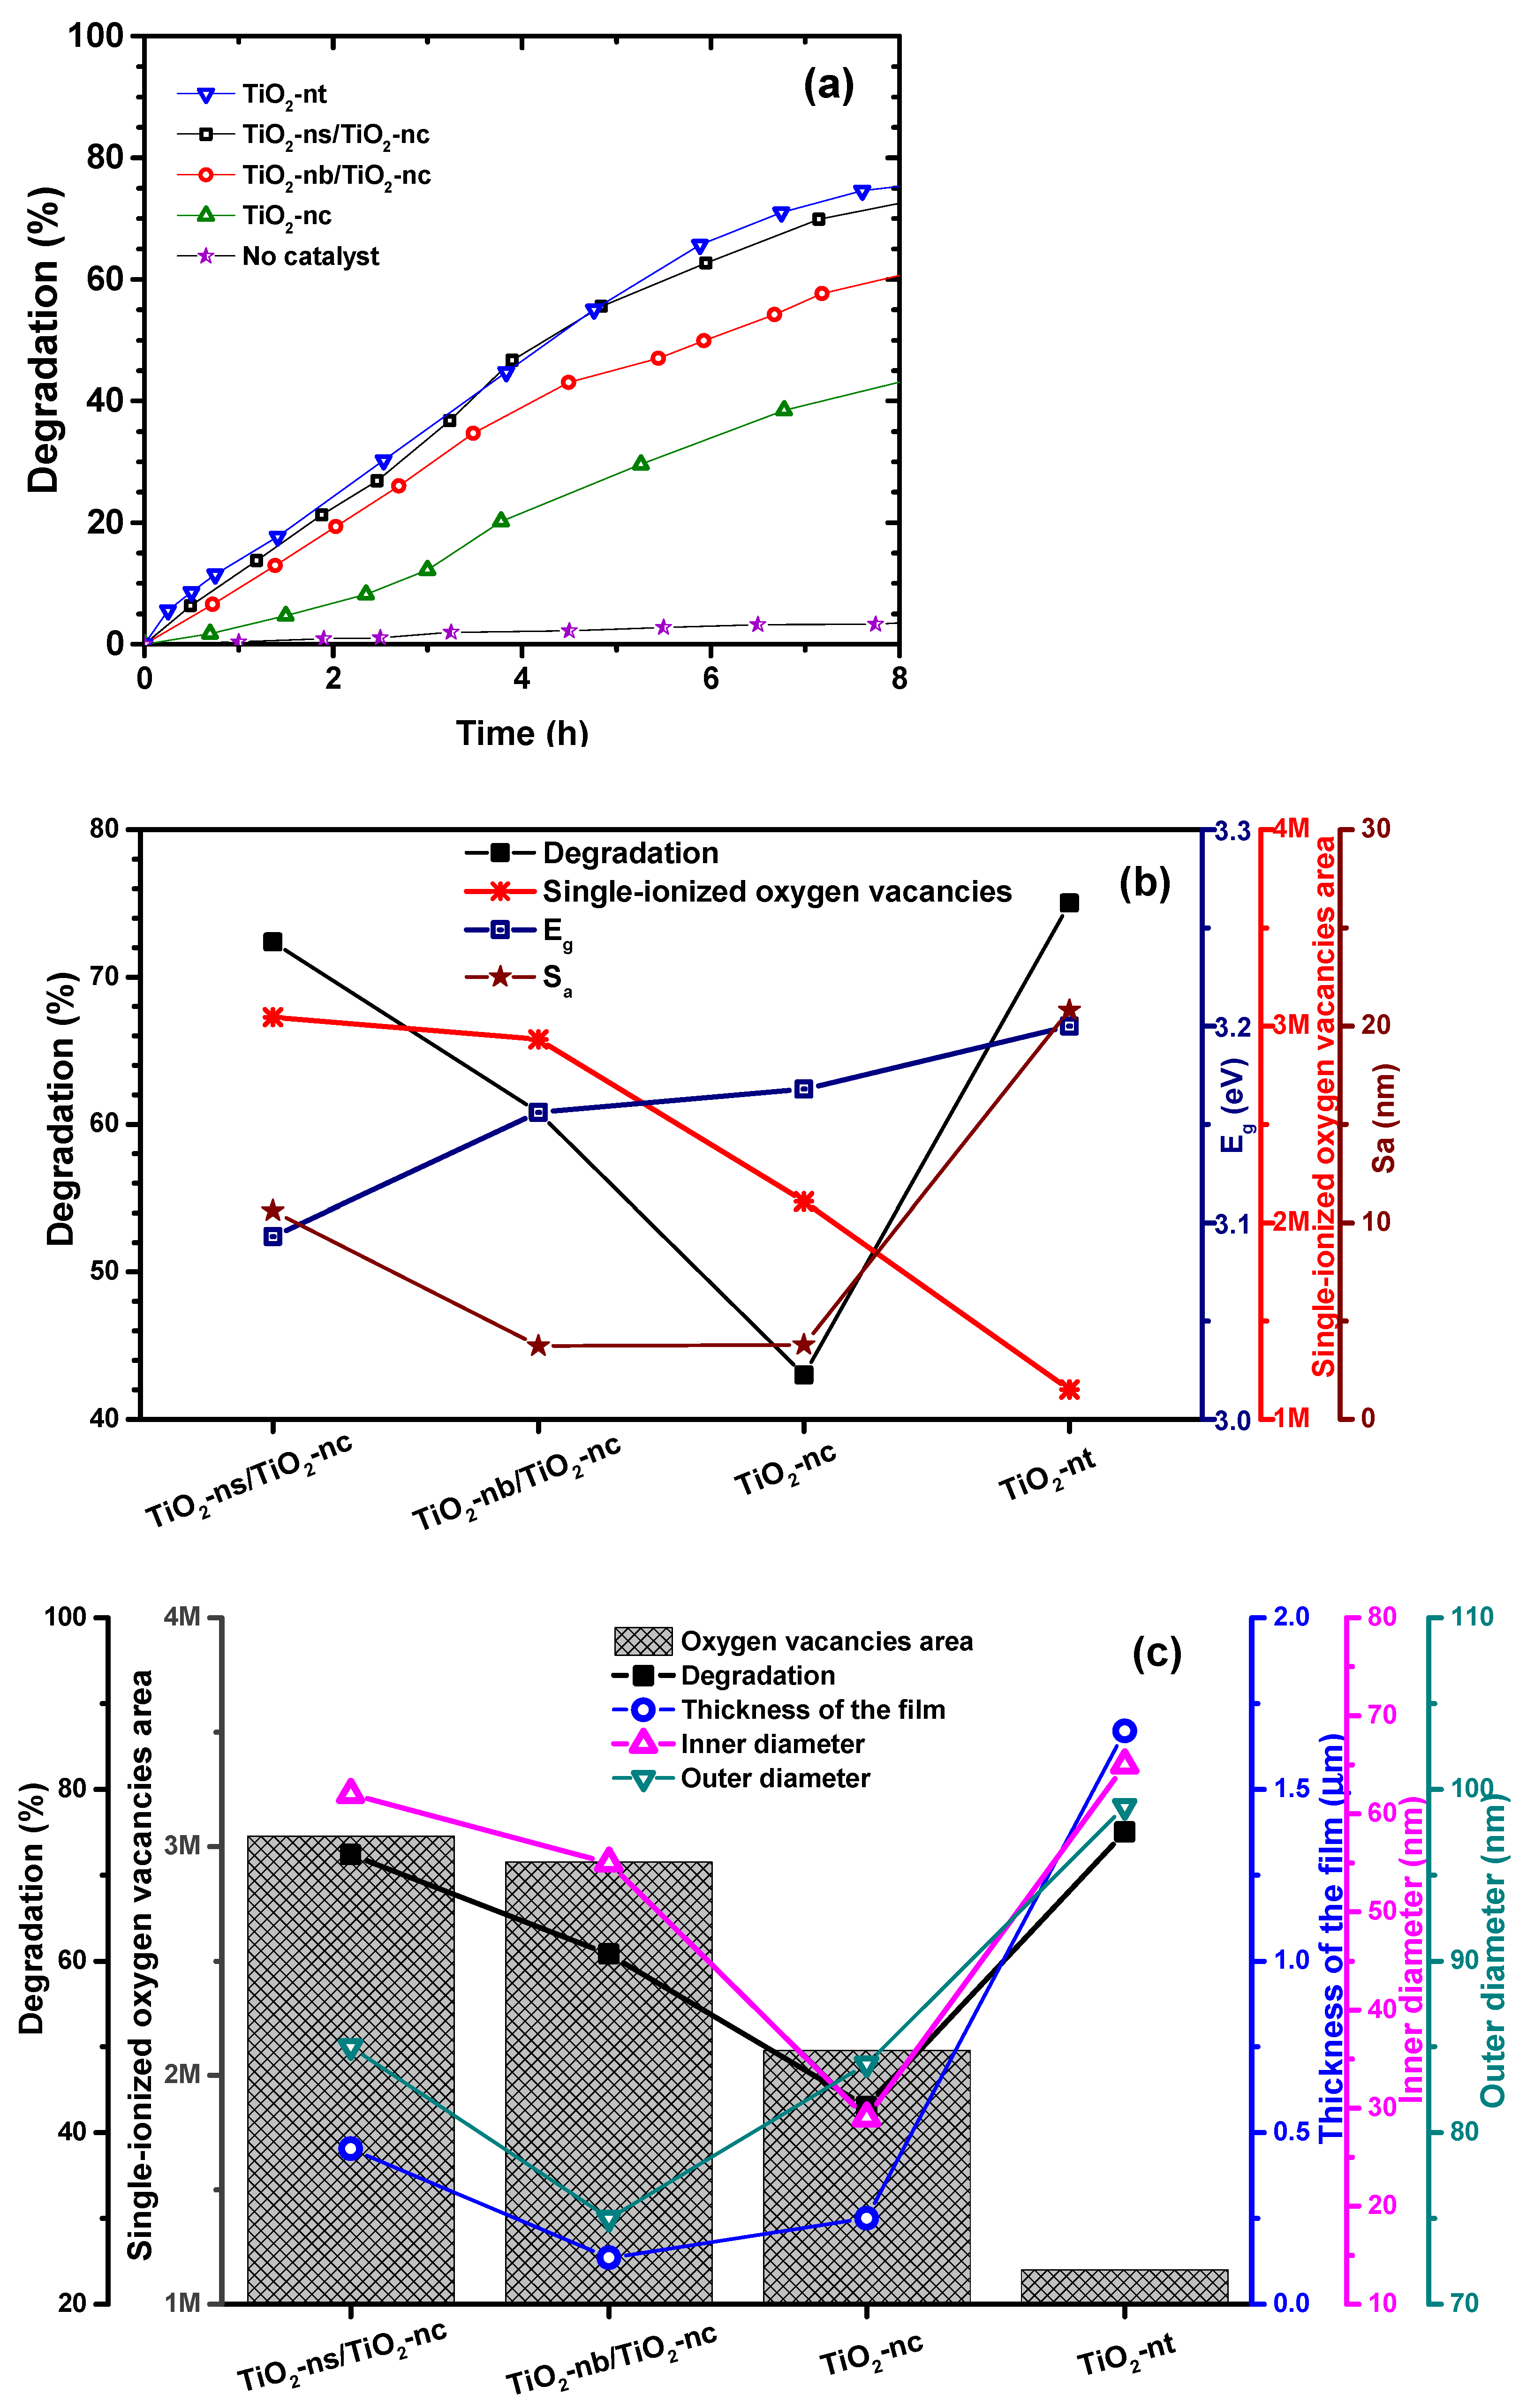
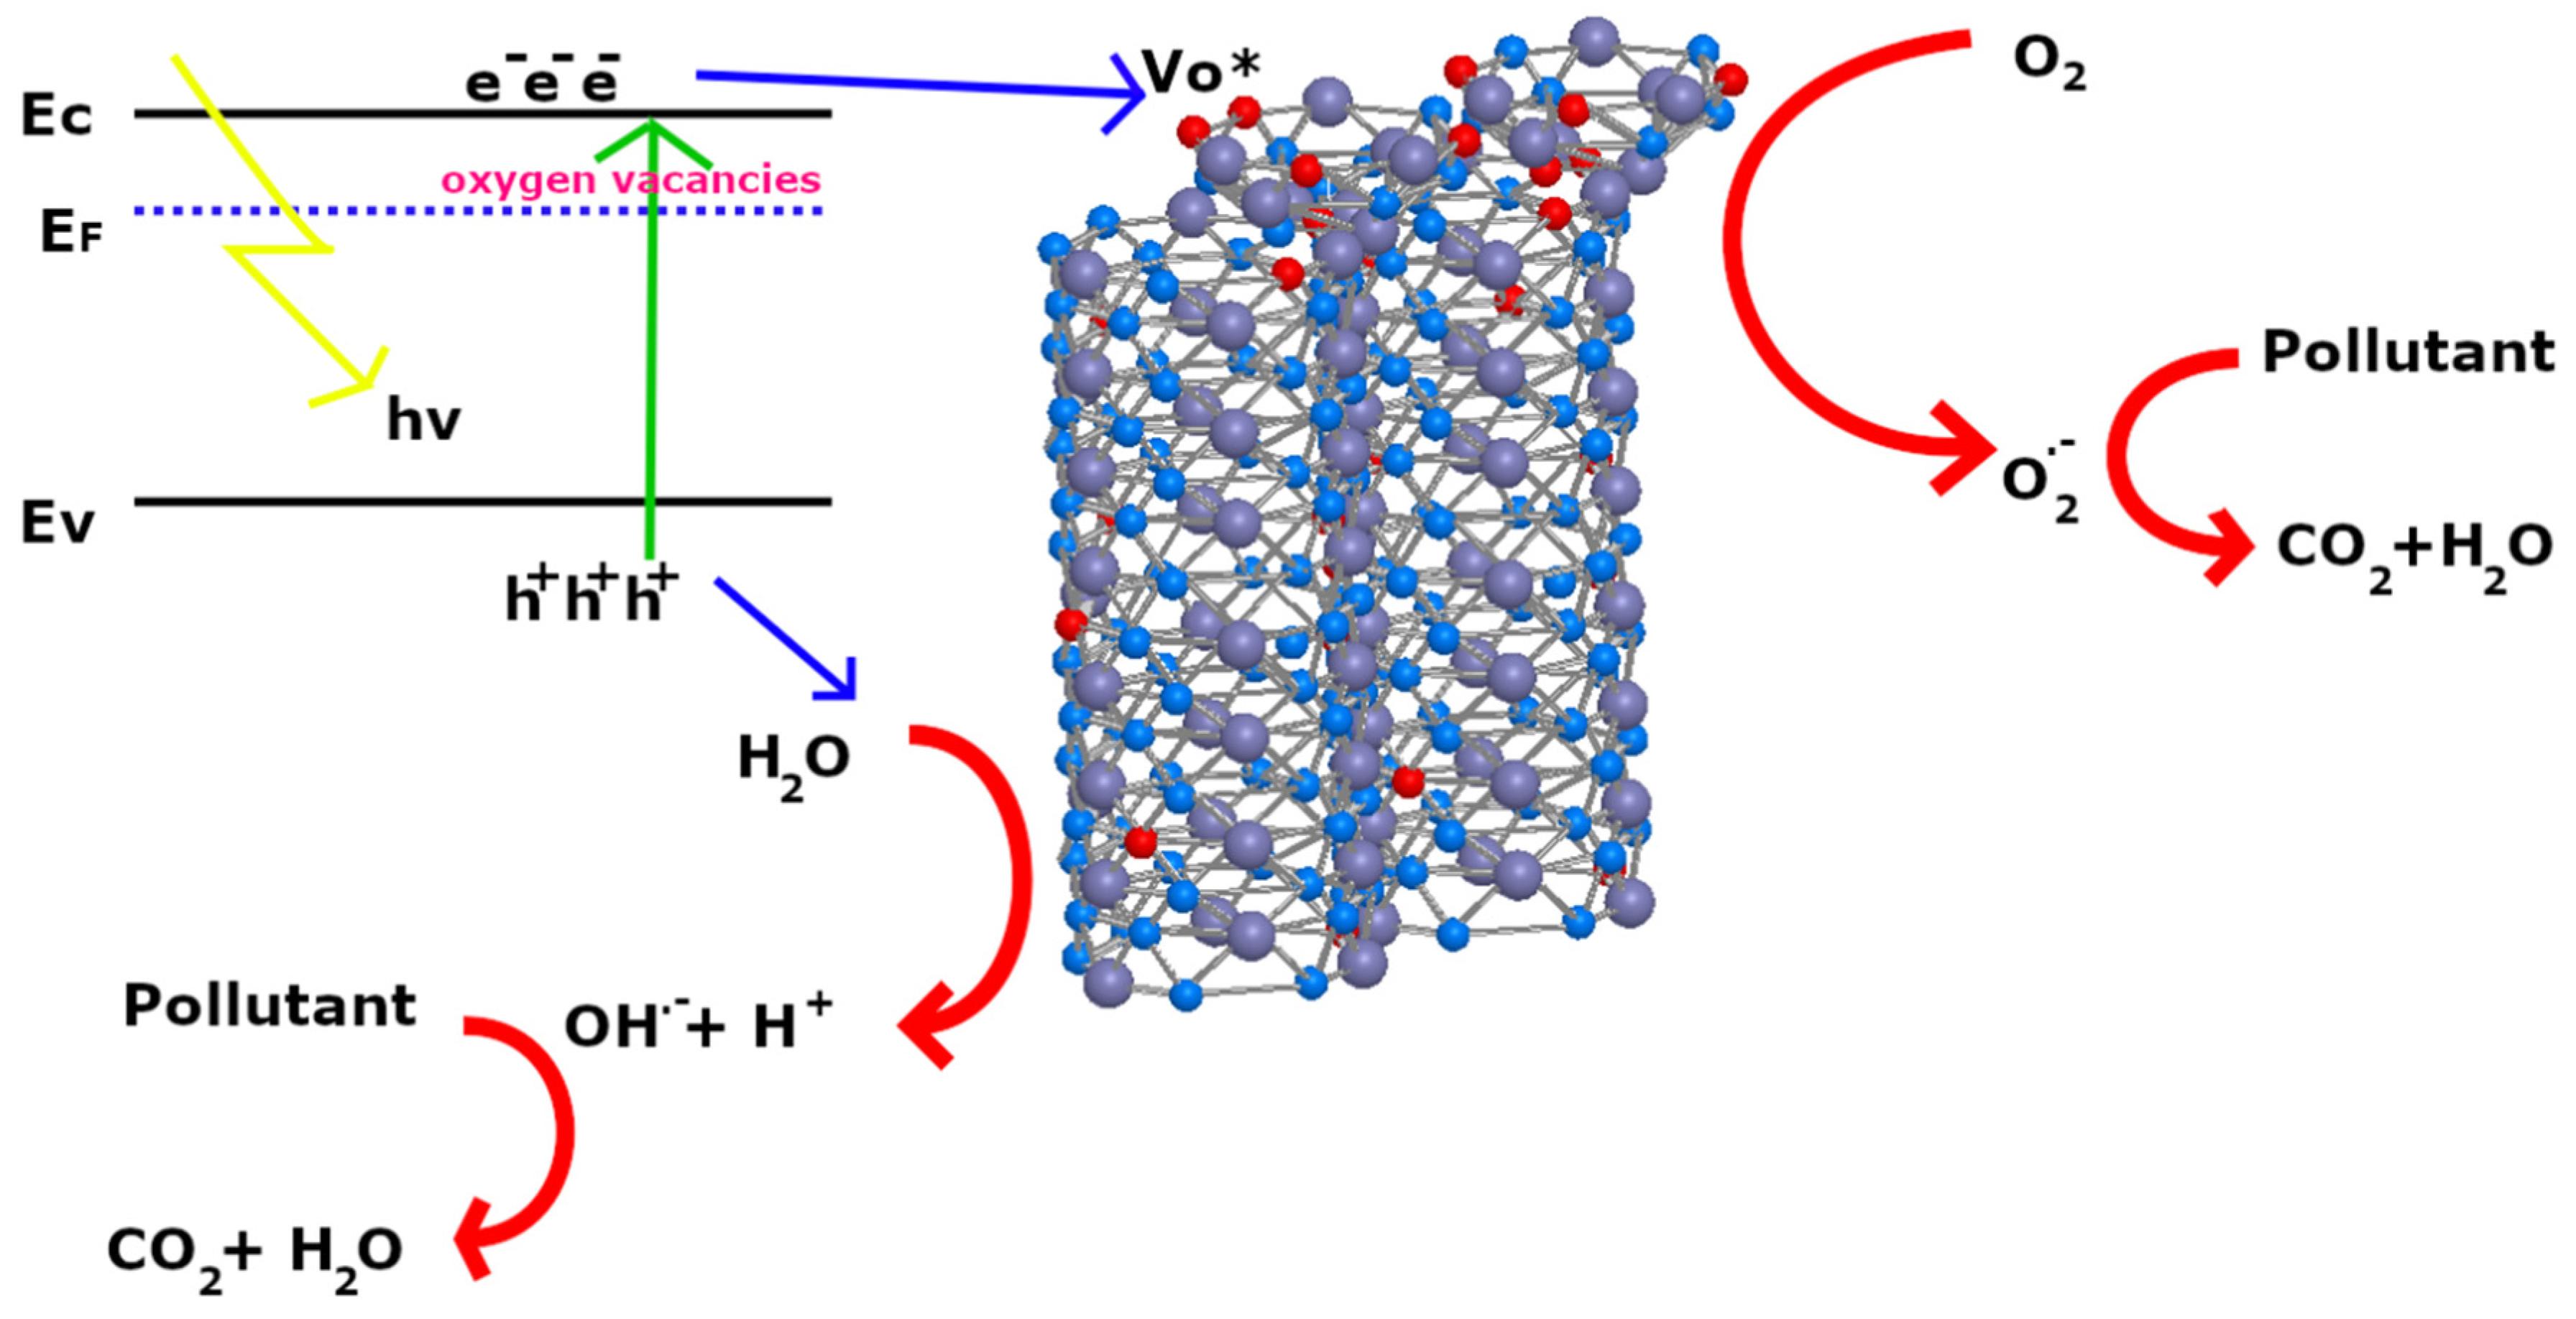
3.4. Catalysis Process Characterization

Figure 7a shows the percentage rate of degradation of methylene blue over a period of eight hours. After eight hours of reaction, TiO2-nt achieved the greatest degradation (75.01%), slightly higher than that of TiO2-ns/TiO2-nc (72.68%), we will call final degradation to the percentage of conversion achieved after 8 h of reaction. From 1 to 4.5 h, the percentage of catalytic degradation had a linear behavior, that is, a constant reaction rate. Then, the degradation rate decreased smoothly until the final concentration was reached. The lowest final degradation was achieved by TiO2-nc, with only 43.01% while TiO2-nb/TiO2-nc obtained 60.8%. In fact, a similar catalytic activity from 1 h to 4 h was observed for TiO2-nt and TiO2-ns/TiO2-nc, nevertheless, after 5 h their rate of degradation changes.
PL studies showed that TiO2-ns/TiO2-nc had a higher amount of single-ionized oxygen vacancies than the other three catalytic materials. Oxygen vacancies have been related in sensors as active sites that increase reactivity on the surface of oxides [26,35]. In catalysis, single-ionized oxygen vacancies have similar behavior. In this case, oxygen vacancies react with O2 and electrons producing superoxide radical anion ( O 2 . ) which help to degradation of pollutants [22,24,27,36,37]. A relationship between the number of single-ionized oxygen vacancies and degradation percentage for TiO2 films with thickness less than 500 nm is shown in Figure 7b. The degradation percentage increases as the number of single-ionized oxygen vacancies increases. As shown in Table 1, the thickness of TiO2-nt was 4.2 times higher than the thickness of TiO2-ns/TiO2-nc, however, the number of single-ionized oxygen vacancies in TiO2-nt was 2.64 times less than in TiO2-ns/TiO2-nc. Therefore, TiO2-ns/TiO2-nc dramatically increased the degradation considering that it is a smaller amount of catalyst [38]. So, the single-ionized oxygen vacancies help to enhance the catalytic activity because they increase the active sites for adsorption [23,39,40]. Our results show that the band gap was narrowed in TiO2 samples with thickness less than 0.5 µm and with a higher number of single-ionized oxygen vacancies. Therefore, a relationship between the band gap, single-ionized oxygen vacancies with catalytic activity is shown in Figure 7b. The band gap energy is reduced with increasing oxygen vacancies in TiO2 films because the oxygen vacancies create donor states under the conduction band. The band gap narrowing helps to generate a greater amount of photocharge carriers which causes an increase in the rate of the catalysis process [15,24,26,36,40]. In contrast, TiO2-nt was made with a longer synthesis process than hybrid nanostructures, which can increase the manufacturing costs of catalysts. Additionally, we found that Sa of TiO2-ns/TiO2-nc was higher compared to TiO2-nb/TiO2-nc, however, the highest Sa was for TiO2-nt. We suggest that Sa can affect the photocatalytic activity because the films with a thickness less to 500 nm show a significant roughness effect on the degradation, as shown in Figure 7b [41].
On the other hand, Figure 7c shows a comparison between the geometric parameters, final degradation, and oxygen vacancies of TiO2 nanomaterials. Note that the geometric parameters play an important role in the catalytic, crystal structure, and optical properties, this is because geometric parameters such as the thickness of the film, inner and outer diameters are associated with the surface area of nanomaterial [42,43]. As shown in this figure, the degradation depends strongly on the amount of oxygen vacancies and thickness of the films; however, the thickness is not a direct proportional parameter. In change, the inner diameter of the nanosheets or nanobowls has a direct relationship with degradation. This means that when the inner diameter of the nanosheets is larger, the degradation increases. This effect may be associated with the surface area of the nanomaterial because a larger surface area increases the adsorption of the molecules by bringing them closer to active sites on walls of the nanosheets [42]. In other words, a greater volume of dyed solution can be introduced into nanosheets. Therefore, the inner diameter is the main parameter to increase the oxidation and reduction processes to accelerate the catalysis process on the surface of TiO2 films. Hence, the inner and outer diameter determine the porosity, in this way, a larger inner diameter and a thinner wall thickness increase the porosity, thus increasing the percentage of degradation of chemical and biological compounds [24,42,43]. In addition, other reports show that the length of the nanotubes influences catalytic activity because higher length increases the surface area and that increases the degradation [29,37,42]. In our case, TiO2-nc had a lower percentage of degradation than TiO2-nt because the nanocavities had a wider wall thickness, and a shorter inner diameter as well as their length which was 6.68 times shorter than nanotubes. Therefore, the degradation of methylene blue depends on the number of oxygen vacancies and the inner diameter and of the nanostructure.
To understand the catalytic process occurring on TiO2 nanostructures, in Figure 8 we show the mechanism of dye degradation. The process starts when the electron-hole pairs are generated by an excitation energy ( hv ) higher or equal than the band gap energy of the catalyst. After, the electrons travel from valence band to conduction band, so, the photogenerated charge carriers are separated which helps to develop the catalysis process. Thus, oxygen vacancies absorb O 2 on the surface of catalytic material, and these react with electrons to form the superoxide radical anions [23,39,44]. Posteriorly, the methylene blue (pollutant) reacts with superoxides starting the reduction process. This chemical reaction breaks down the dye into H2O and CO2 and others chemicals [29,44].
At the same instance, the holes generated on the valence band react with H2O and OH . . This oxidation process leads to the formation of hydroxyl radicals ( OH . ). Consequently, the hydroxyl radicals react with organic and/or inorganic compounds, viruses, and bacteria leading to their decomposition. These chemical reactions are summarized in Equations (4)–(11) [29,39,44].
TiO 2 + hv h + + e
Vo * + e +   O 2 O 2 .
H 2 O + h + OH . +   H +
2 H 2 O 2 O 2 . 2 e 2 H 2 O 2 + O 2
H 2 O 2 + e OH . +   OH .
O 2 . + pollutant degradation +   CO 2 + H 2 O
OH . + pollutant degradation +   CO 2 + H 2 O
h + + pollutant degradation
The scavenging experiments showed that the degradation of methylene blue is in greater proportion due to O 2 . since without its contribution the final degradation was only 31.2% (see Figure S2). Also, h + and OH . have an important contribution to catalysis, nevertheless, less than that of O 2 .   (see Figure S2). According to these results, the degradation of organic material is achieved by the increase of active sites as oxygen vacancies that raise the rate of the reduction process; so, the combination of superoxide radicals, holes and hydroxyl radicals enhances the catalysis process of assembled TiO2 nanostructures [36,44]. This means that more reactive species ( O 2 . , OH . , h + ) are generated on the surface of nanosheets and tube walls. According to TRPL results, oxygen vacancies are key active sites because they increase the lifetime of photogenerated carriers (see Figure S3 and Table S2). The catalytic efficiency of these self-assembled nanostructures depends directly on the synergistic effect created by single-ionized oxygen vacancies in the catalyst and the geometric parameter of the nanostructure [24,40,44]. Thus, this effect significantly enhances the catalysis phenomenon in TiO2 films with thinner thickness.

4. Conclusions

In this research work, two tubular and two hybrid nanostructures were studied for catalytic applications. TiO2 nanosheets assembled on TiO2 nanocavities, TiO2 nanobowls assembled on TiO2 nanocavities, and TiO2 nanocavities were prepared by a two-step anodization process, while TiO2 nanotubes were prepared in a three-step process. SEM results showed that the length of the nanotubes was 6.68 times larger than nanocavities and their inner diameter was 2.24 times greater, however, the wall thickness of nanocavities was wider than nanotubes. Besides, TiO2 nanosheets had greater inner diameter and thinner thickness than TiO2 nanobowls. Concerning their nanocavities of self-assembled nanostructures, the nanocavities in TiO2-ns/TiO2-nc had a larger length than the nanocavities in TiO2-nb/TiO2-nc. Another important factor is average surface roughness: for tubular nanostructures, the highest roughness was obtained by nanotubes, while, for self-assembled nanostructures, TiO2-ns/TiO2-nc had a higher roughness. The results of the PL study showed that TiO2-ns/TiO2-nc had a higher emission than the other three TiO2 films. The defect states related to geometric parameters of these TiO2 films were single-ionized oxygen vacancies. Hence, an important relationship between these nanostructures and single-ionized oxygen vacancies was observed. The number of single-ionized oxygen vacancies increases as the length of tubular nanostructure decreases, and the thickness of the self-assembled nanostructures decreases. As a consequence of the higher number of single-ionized oxygen vacancies, the band gap of self-assembled nanostructures and nanocavities is narrowed because the localized states are overlapped into the conduction band. By the homogeneous organization of nanotubes and larger thickness of the film, the intensity of phase anatase of TiO2 nanotubes was higher than in other samples. Nevertheless, this film had more displacement of the Eg(1) mode. This work demonstrated that the hybrid structure of TiO2-ns/TiO2-nc had the highest number of single-ionized oxygen vacancies that help to increase the chemisorption of the oxygen molecular and photogenerated charge carriers which in turn increase the superoxide radical anions. The phenomenon of catalysis is efficient mainly because oxygen vacancies operate as active sites in the catalysts. Therefore, active sites increase the rate of redox reaction leading to the breakdown of methylene blue molecules. Due to the higher amount of single-ionized oxygen vacancies of TiO2-ns/TiO2-nc, the degradation of methylene blue was similar to that of nanotubes, however, nanotubes had a thickness about 4.7 times larger than TiO2-ns/TiO2-nc. In this way, single-ionized oxygen vacancies are a vital characteristic of the catalyst because they promote the generation of the reactive species. Additionally, the shape of the nanosheets is a key geometric parameter that helps to speed up the catalysis process because highly active sites carry out higher reduction processes if the nanostructure has a higher surface area. These novel materials could be used to inactivate bacteria and viruses, water splitting, and water decontamination.

Supplementary Materials

The following supporting information can be downloaded at: https://www.mdpi.com/article/10.3390/app12073690/s1, Table S1: Summary of elemental composition of TiO2 nanostructures, Table S2: Lifetime of photogenerated carriers of TiO2 materials, Figure S1: Summary of elemental composition of TiO2 nanostructures, Figure S2: Photodegradation of methylene blue using TiO2-ns/TiO2-nc, and scavenging experiments, Figure S3: TRPL spectra of TiO2 nanomaterial with higher number of oxygen vacancies. References [45,46,47,48,49,50,51,52,53,54,55,56,57,58] are cited in the supplementary materials.

Author Contributions

A.A.-H. and C.Z.I. designed and planned the synthesis and characterization of TiO2 nanostructures for catalysis applications. A.A.-H. prepared, synthesized, and characterized TiO2 nanostructures. A.A.-H., C.R.A.-H., M.M., A.H.J. and J.C.M.-C. analyzed the results of the morphological and topography study, PL study, TRPL study, elemental composition, reflectance spectra, structural study, and the degradation percentage of the TiO2 films. A.A.-H., J.C.M.-C., M.M., W.C.A. and C.R.A.-H. wrote the manuscript. A.A.-H., C.Z.I., M.M., W.C.A. and N.C., reviewed and evaluated the results of the characterization and the manuscript. All authors have read and agreed to the published version of the manuscript.

Funding

The APC was funded by the National Institute of Astrophysics, Optics and Electronics, INAOE.

Institutional Review Board Statement

Not applicable.

Informed Consent Statement

Not applicable.

Data Availability Statement

Not applicable.

Acknowledgments

A.A.-H. acknowledges the National Institute for Astrophysics, Optics and Electronics (INAOE) for its support for this work. Also, authors thank the Laboratory of Electro-Photonics (INAOE) and Laboratory of Electron Microscopy (INAOE).

Conflicts of Interest

The authors declare no conflict of interest.

References

  1. Chen, X.; Mao, S.S. Titanium Dioxide Nanomaterials: Synthesis, Properties, Modifications, and Applications. Chem. Rev. 2007, 107, 2891–2959. [Google Scholar] [CrossRef] [PubMed]
  2. Bagheri, S.; Shameli, K.; Hamid, S.B.A. Synthesis and Characterization of Anatase Titanium Dioxide Nanoparticles Using Egg White Solution via Sol-Gel Method. J. Chem. 2013, 2013, 848205. [Google Scholar] [CrossRef]
  3. Li, M.; Chen, Y.; Li, W.; Li, X.; Tian, H.; Wei, X.; Ren, Z.; Han, G. Ultrathin anatase TiO2 nanosheets for high-performance photocatalytic hydrogen production. Small 2017, 13, 1604115. [Google Scholar] [CrossRef] [PubMed]
  4. Loubet, N.; Hook, T.; Montanini, P.; Yeung, C.-W.; Kanakasabapathy, S. Stacked Nanosheet Gate-All-Around Transistor to Enable Scaling Beyond FinFET. In Proceedings of the 2017 Symposium on VLSI Technology, Kyoto, Japan, 5–8 June 2017; pp. T230–T231. [Google Scholar]
  5. Zhang, M.; Xiao, X.; Wang, X.; Chen, M.; Lu, Y.; Liu, M.; Chen, L. Excellent catalysis of TiO2 nanosheets with high-surface-energy {001} facets on hydrogen storage properties of MgH2. Nanoscale 2019, 11, 7465–7473. [Google Scholar] [CrossRef] [PubMed]
  6. Yang, L.; Kou, P.; He, N.; Dai, H.; He, S. Anomalous light trapping enhancement in a two-dimensional gold nanobowl array with an amorphous silicon coating. Opt. Express 2017, 25, 14115. [Google Scholar] [CrossRef]
  7. Wang, W.; He, Y.; Qi, L. High-efficiency colorful perovskite solar cells using TiO2 nanobowl arrays as a structured electron transport layer. Sci. China Mater. 2020, 63, 35–46. [Google Scholar] [CrossRef]
  8. Fan, H.; Cheng, M.; Wang, Z.; Wang, R. Layer-controlled Pt-Ni porous nanobowls with enhanced electrocatalytic performance. J. Colloid Interface Sci. 2019, 556, 140–146. [Google Scholar] [CrossRef]
  9. Shen, S.; Chen, J.; Wang, M.; Sheng, X.; Chen, X.; Feng, X.; Mao, S.S. Titanium dioxide nanostructures for photoelectrochemical applications. Prog. Mater. Sci. 2018, 98, 299. [Google Scholar] [CrossRef]
  10. Liang, F.; Luo, L.-B.; Tsang, C.-K.; Zheng, L.; Cheng, H.; Li, Y.Y. TiO2 nanotube-based field effect transistors and their application as humidity sensors. Mater. Res. Bull. 2012, 47, 54–58. [Google Scholar] [CrossRef]
  11. Montakhab, E.; Rashchi, F.; Sheibani, S. Modification and photocatalytic activity of open channel TiO2 nanotubes array synthesized by anodization process. Appl. Surf. Sci. 2020, 534, 147581. [Google Scholar] [CrossRef]
  12. Nie, X.; Yin, S.; Duan, W.; Zhao, Z.; Li, L.; Zhang, Z. Recent Progress in Anodic Oxidation of TiO2 Nanotubes and Enhanced Photocatalytic Performance: A Short Review. Nano 2021, 16, 2130002. [Google Scholar] [CrossRef]
  13. Fu, Y.; Mo, A. A Review on the Electrochemically Self-organized Titania Nanotube Arrays: Synthesis, Modifications, and Biomedical Applications. Nanoscale Res. Lett. 2018, 13, 187. [Google Scholar] [CrossRef]
  14. Nishanthi, S.T.; Iyyapushpam, S.; Sundarakannan, B.; Subramanian, E.; Padiyan, D.P. Inter-relationship between extent of anatase crystalline phase and photocatalytic activity of TiO2 nanotubes prepared by anodization and annealing method. Sep. Purif. Technol. 2014, 131, 102–107. [Google Scholar] [CrossRef]
  15. Choudhury, B.; Bayan, S.; Choudhury, A.; Chakraborty, P. Narrowing of band gap and effective charge carrier separation in oxygen deficient TiO2 nanotubes with improved visible light photocatalytic Activity. J. Colloid Interface Sci. 2016, 465, 1–10. [Google Scholar] [CrossRef] [PubMed]
  16. Arenas-Hernandez, A.; Zúñiga-Islas, C.; Torres-Jacome, A.; Mendoza-Cervantes, J.C. Self-organized and self-assembled TiO2 nanosheets and nanobowls on TiO2 nanocavities by electrochemical anodization and their properties. Nano Ex. 2020, 1, 010054. [Google Scholar] [CrossRef]
  17. Sopha, H.; Tesar, K.; Knotek, P.; Jäger, A.; Hromadko, L.; Macak, J.M. TiO2 nanotubes grown on Ti substrates with different microstructure. Mater. Res. Bull. 2018, 103, 197–204. [Google Scholar] [CrossRef]
  18. Yoo, J.E.; Schmuki, P. Critical factors in the anodic formation of extremely ordered titania nanocavities. J. Electrochem. Soc. 2019, 166, C3389–C3398. [Google Scholar] [CrossRef]
  19. Zhang, G.; Huang, H.; Zhang, Y.; Chan, H.L.W.; Zhou, L. Highly ordered nanoporous TiO2 and its photocatalytic properties. Electrochem. Commun. 2007, 9, 2854–2858. [Google Scholar] [CrossRef]
  20. Chong, B.; Yu, D.L.; Gao, M.Q.; Fan, H.W.; Yang, C.Y.; Ma, W.H.; Zhang, S.Y.; Zhu, X.F. Formation mechanism of gaps and ribs around anodic TiO2 nanotubes and method to avoid formation of ribs. J. Electrochem. Soc. 2015, 162, H244–H250. [Google Scholar] [CrossRef]
  21. Moreno, M.; Torres, A.; Ambrosio, R.; Zuniga, C.; Torres-Rios, A.; Monfil, K.; Rosales, P.; Itzmoyotl, A. Study of the effect of the deposition parameters on the structural, electric and optical characteristics of polymorphous silicon films prepared by low frequency PECVD. J. Mater. Sci. Eng. B 2011, 176, 1373–1377. [Google Scholar] [CrossRef]
  22. Xu, M.; Chen, Y.; Qin, J.; Feng, Y.; Li, W.; Chen, W.; Zhu, J.; Li, H.; Bian, Z. Unveiling the Role of Defects on Oxygen Activation and Photodegradation of Organic Pollutants. Environ. Sci. Technol. 2018, 52, 13879–13886. [Google Scholar] [CrossRef] [PubMed]
  23. Liu, F.; Lu, L.; Xiao, P.; He, H.; Qiao, L.; Zhang, Y. Effect of Oxygen Vacancies on Photocatalytic Efficiency of TiO2 Nanotubes Aggregation. Bull. Korean Chem. Soc. 2012, 33, 2255. [Google Scholar] [CrossRef]
  24. Rosales, M.; Zoltan, T.; Yadarola, C.; Mosquera, E.; Gracia, F.; García, A. The influence of the morphology of1D TiO2 nanostructures on photogeneration of reactive oxygen species and enhanced photocatalytic activity. J. Mol. Liq. 2019, 281, 59–69. [Google Scholar] [CrossRef]
  25. Pandiyan, R.; Bartali, R.; Micheli, V.; Gottardi, G.; Luciu, I.; Risticd, D.; Goget, G.A.; Ferrari, M.; Laidani, N. Influence of Nd3+ doping on the structural and near-IR photoluminescence properties of nanostructured TiO2 films. Energy Procedia 2011, 10, 167–171. [Google Scholar] [CrossRef]
  26. Arenas-Hernandez, A.; Zúñiga-Islas, C.; Mendoza-Cervantes, J.C. A study of the effect of morphology on the optical and electrical properties of TiO2 nanotubes for gas sensing applications. Eur. Phys. J. Appl. Phys. 2020, 90, 30102. [Google Scholar] [CrossRef]
  27. Amoresi, R.A.C.; Teodoro, V.; Teixeira, G.F.; Li, M.S.; Simões, A.Z.; Perazolli, L.A.; Longo, E.; Zaghete, M.A. Electrosteric colloidal stabilization for obtaining SrTiO3/TiO2 heterojunction: Microstructural evolution in the interface and photonics properties. J. Eur. Ceram. Soc. 2018, 38, 1621–1631. [Google Scholar] [CrossRef]
  28. Povolotskaya, A.V.; Povolotskiy, A.V.; Manshina, A.A. Hybrid nanostructures: Synthesis, morphology and functional properties. Russ. Chem. Rev. 2015, 84, 579–600. [Google Scholar] [CrossRef]
  29. Pasikhani, J.V.; Gilani, N.; Pirbazari, A.E. The effect of the anodization voltage on the geometrical characteristics and photocatalytic activity of TiO2 nanotube arrays. Nano-Struct. Nano-Objects. 2016, 8, 7–14. [Google Scholar] [CrossRef]
  30. Huang, W.; Wang, X.; Xue, Y.; Yang, Y.; Ao, X. Hybrid nanostructures of mixed-phase TiO2 for enhanced photoelectrochemical water splitting. RSC Adv. 2015, 5, 56098–56102. [Google Scholar] [CrossRef]
  31. Valeeva, A.A.; Kozlova, E.A.; Vokhmintsev, A.S.; Kamalov, R.V.; Dorosheva, I.B.; Saraev, A.A.; Weinstein, I.A.; Rempel, A.A. Nonstoichiometric titanium dioxide nanotubes with enhanced catalytical activity under visible light. Sci. Rep. 2018, 8, 9607. [Google Scholar] [CrossRef]
  32. Lamberti, A.; Chiodoni, A.; Shahzad, N.; Bianco, S.; Quaglio, M.; Pirri, C.F. Ultrafast room-temperature crystallization of TiO2 nanotubes exploiting water-vapor treatment. Sci. Rep. 2014, 5, 7808. [Google Scholar] [CrossRef] [PubMed]
  33. Ren, Y.; Shi, X.; Xia, P.; Li, S.; Lv, M.; Wang, Y.; Mao, Z. In Situ Raman Investigation of TiO2 Nanotube Array-Based Ultraviolet Photodetectors: Effects of Nanotube Length. Molecules 2020, 25, 1854. [Google Scholar] [CrossRef] [PubMed]
  34. Xue, X.; Ji, W.; Mao, Z.; Mao, H.; Wang, Y.; Wang, X.; Ruan, W.; Zhao, B.; Lombardi, J.R. Raman Investigation of Nanosized TiO2: Effect of Crystallite Size and Quantum Confinement. J. Phys. Chem. C. 2012, 116, 8792–8797. [Google Scholar] [CrossRef]
  35. Al-Hashem, M.; Akbar, S.; Morris, P. Role of Oxygen Vacancies in Nanostructured Metal-Oxide Gas Sensors: A Review. Sens. Actuators B Chem. 2019, 301, 126845. [Google Scholar] [CrossRef]
  36. Etacheri, V.; Valentin, C.D.; Schneider, J.; Bahnemann, D.; Pillai, S.C. Visible-Light Activation of TiO2 Photocatalysts: Advances in Theory and Experiments. J. Photochem. Photobiol. C Photochem. Rev. 2015, 25, 1–29. [Google Scholar] [CrossRef]
  37. Peighambardoust, N.S.; Asl, S.K.; Maghsoudi, M. The effect of doping concentration of TiO2 nanotubes on energy levels and its direct correlation with photocatalytic activity. Thin Solid Film. 2019, 690, 137558. [Google Scholar] [CrossRef]
  38. Dariani, R.S.; Esmaeili, A.; Mortezaali, A.; Dehghanpour, S. Photocatalytic reaction and degradation of methylene blue on TiO2 nano-sized particles. Optik 2016, 127, 7143–7154. [Google Scholar] [CrossRef]
  39. Trandafilovic, L.V.; Jovanovi, D.J.; Zhang, X.; Ptasinska, S.; Dramicanin, M.D. Enhanced photocatalytic degradation of methylene blue and methyl’ orange by ZnO:Eu nanoparticles. Appl. Catal. B Environ. 2017, 203, 740–752. [Google Scholar] [CrossRef]
  40. Li, J.; Zhang, M.; Guan, Z.; Li, Q.; He, C.; Yang, J. Synergistic effect of surface and bulk single-electron-trapped oxygen vacancy of TiO2 in the photocatalytic reduction of CO2. Appl. Catal. B Environ. 2017, 206, 300–307. [Google Scholar] [CrossRef]
  41. Da Silva Cardoso, R.; De Amorim Suelen, M.; Scaratti, G.; Moura-Nickel, C.D.; Muniz Moreira, R.P.; Li Puma, G.; Muniz Moreira, R.D.F.P. Structural, optical and photocatalytic properties of erbium (Er3+) and yttrium (Y3+) doped TiO2 thin films with remarkable self-cleaning superhydrophilic properties. RSC Adv. 2020, 10, 17247. [Google Scholar] [CrossRef]
  42. Noeiaghaei, T.; Yun, J.-H.; Nam, S.W.; Zoh, K.D.; Gomes, V.G.; Kim, J.O.; Chae, S.R. The influence of geometrical characteristics on the photocatalytic activity of TiO2 nanotube arrays for degradation of refractory organic pollutants in wastewater. Water Sci. Technol. 2015, 71, 9. [Google Scholar] [CrossRef] [PubMed]
  43. Löffler, F.; Altermann, F.; Bucharsky, E.; Schell, K.; Vera, M.L. Morphological characterization and photocatalytic efficiency measurements of pure silica transparent open-cell sponges coated with TiO2. Int. J. Appl. Ceram. Technol. 2020, 17, 31930–31939. [Google Scholar] [CrossRef]
  44. Schneider, J.; Matsuoka, M.; Takeuchi, M.; Zhang, J.; Horiuchi, Y.; Anpo, M.; Bahnemann, D.W. Understanding TiO2 Photocatalysis: Mechanisms and Materials. Chem. Rev. 2014, 114, 9919–9986. [Google Scholar] [CrossRef] [PubMed]
  45. Verma, R.; Samdarshi, S.K. Correlating oxygen vacancies and phase ratio/interface with efficient photocatalytic activity in mixed phase TiO2. J. Alloys Compd. 2015, 629, 105. [Google Scholar] [CrossRef]
  46. Acharyya, D.; Hazra, A.; Bhattacharyya, P. A journey towards reliability improvement of TiO2 based Resistive Random Access Memory: A review. Microelectron. Reliab. 2014, 54, 541–560. [Google Scholar] [CrossRef]
  47. Sarkar, A.; Gopa, K.G. The Formation and Detection Techniques of Oxygen Vacancies in Titanium Oxide-based Nano-structures. Nanoscale 2019, 11, 3414. [Google Scholar] [CrossRef]
  48. Niu, L.; Zhao, X.; Tang, Z.; Lv, H.; Wu, F.; Wang, X.; Zhao, T.; Wang, J.; Wu, A.; Giesy, J.P. Difference in performance and mechanism for methylene blue when TiO2 nanoparticles are converted to nanotube. J. Cleaner Prod. 2021, 297, 126498. [Google Scholar] [CrossRef]
  49. Li, H.; Tang, N.; Yang, H.; Leng, X.; Zou, J. Interface feature characterization and Schottky interfacial layer confirmation of TiO2 nanotube array film. Appl. Surf. Sci. 2015, 355, 849–860. [Google Scholar] [CrossRef]
  50. Liao, Y.; Yuan, B.; Zhang, D.; Wang, X.; Li, Y.; Wen, Q.; Zhang, H.; Zhong, Z. A Facile Method for Loading CeO2 Nanoparticles on Anodic TiO2 Nanotube Arrays. Nanoscale Res. Lett. 2018, 13, 89. [Google Scholar] [CrossRef] [PubMed]
  51. Shimizu, N.; Ogino, C.; Dadjour, M.F.; Murata, T. Sonocatalytic degradation of methylene blue with TiO2 pellets in water. Ultrason. Sonochem. 2007, 14, 184–190. [Google Scholar] [CrossRef] [PubMed]
  52. Hou, X.; Liu, X.; Han, J.; Liu, H.; Yao, J.; Li, D.; Wang, L.; Liao, B.; Li, J.; Zhang, R. Enhanced photoelectrocatalytic degradation of organic pollutants using TiO2 nanotubes implanted with nitrogen ions. J. Mater. Sci. 2020, 55, 5843–5860. [Google Scholar] [CrossRef]
  53. Chiu, Y.-H.; Chang, T.-F.M.; Chen, C.-Y.; Sone, M.; Hsu, Y.-J. Mechanistic Insights into Photodegradation of Organic Dyes Using Heterostructure Photocatalysts. Catalysts 2019, 9, 430. [Google Scholar] [CrossRef]
  54. Zheng, P.; Pan, Z.; Li, H.; Bai, B.; Guan, W. Effect of different type of scavengers on the photocatalytic removal of copper and cyanide in the presence of TiO2@yeast hybrids. J. Mater. Sci.-Mater. Electron. 2015, 26, 9. [Google Scholar] [CrossRef]
  55. Pu, Y.-C.; Chou, H.-Y.; Kuo, W.-S.; Wei, K.-H.; Hsu, Y.-J. Interfacial charge carrier dynamics of cuprous oxide-reduced graphene oxide (Cu2O-rGO) nanoheterostructures and their related visible-light-driven photocatalysis. Appl. Catal. B 2017, 204, 21–32. [Google Scholar] [CrossRef]
  56. Wang, Q.; Zhang, S.; He, H.; Xie, C.; Tang, Y.; He, C.; Shao, M.; Wang, H. Oxygen Vacancy Engineering in Titanium Dioxide for Sodium Storage. Chem. Asian J. 2021, 16, 3–19. [Google Scholar] [CrossRef] [PubMed]
  57. Lin, Y.-F.; Hsu, Y.-J. Interfacial charge carrier dynamics of type-II semiconductor nanoheterostructures. Appl. Catal. B. 2013, 130–131, 93–98. [Google Scholar] [CrossRef]
  58. Wu, S.; Tan, X.; Liu, K.; Lei, J.; Wang, L.; Zhang, J. TiO2 (B) nanotubes with ultrathin shell for highly efficient photocatalytic fixation of nitrogen. Catal. Today. 2018, 335, 214–220. [Google Scholar] [CrossRef]
Figure 1. FE-SEM image of the cross-section of: (a) TiO2-nt; (b) TiO2-nc; (c) TiO2-ns assembled on TiO2-nc; and (d) TiO2-nb assembled on TiO2-nc synthesized by electrochemical anodization.
Applsci 12 03690 g001
Figure 2. FE-SEM image of the surface of: (a) TiO2-nt; (b) TiO2-nc; (c) TiO2-ns assembled on TiO2-nc; and (d) TiO2-nb assembled on TiO2-nc synthesized by electrochemical anodization.
Applsci 12 03690 g002
Figure 3. AFM image of the cross-section of: (a) TiO2-nt; (b) TiO2-nc; (c) TiO2-ns assembled on TiO2-nc; and (d) TiO2-nb assembled on TiO2-nc synthesized by electrochemical anodization.
Applsci 12 03690 g003
Figure 4. (a) Photoluminescence spectra of the four TiO2 nanostructures. Deconvolution of the photoluminescence spectra for: (b) TiO2-ns/TiO2-nc; (c) TiO2-nb/TiO2-nc; (d) TiO2-nc; and (e) TiO2-nt. (f) Comparison of defect states, length of nanotube, thickness of the film and of the nanostructure between the four nanomaterials.
Applsci 12 03690 g004
Figure 5. (a) The band gap energy of TiO2-nt, TiO2-nc, TiO2-nb/TiO2-nc and TiO2-ns/TiO2-nc obtained by Kubelka-Munk function. (b) Band gap energy and oxygen vacancies area for each film.
Applsci 12 03690 g005
Figure 6. (a) Raman spectra of TiO2 nanostructures; and (b) Eg(1) mode displacement, thickness and oxygen vacancies for each nanostructure.
Applsci 12 03690 g006
Figure 7. (a) percentage of degradation of methylene blue as a function of time for the four nanostructures; (b) comparison of defect sates, band gap energy, Sa and final degradation percentage between the four films; and (c) comparison of geometric parameters, final degradation percentage and oxygen vacancies between the four nanomaterials.
Applsci 12 03690 g007
Figure 8. Schematic diagram of photocatalytic process in TiO2 nanomaterials. Here titanium, oxygen and single-ionized oxygen vacancies are represented by gray circles, blue circles and red circles, respectively.
Applsci 12 03690 g008
Table 1. Summary of some geometric parameters of the four TiO2 nanostructures.
NanostructureOuter Diameter (nm)Inner Diameter (nm)Length (nm)Sa (nm)
TiO2-nt9865167020.8
TiO2-nc84292503.79
TiO2-ns/TiO2-nc8562/2235 */36210.6
TiO2-nb/TiO2-nc7555/3040 */963.74
* Thickness.
Publisher’s Note: MDPI stays neutral with regard to jurisdictional claims in published maps and institutional affiliations.

