Article

Solving a Multi-Class Traffic Assignment Model with Mixed Modes

Korea Institute of Science and Technology Information, Daejeon 34141, Korea
*
Author to whom correspondence should be addressed.
Appl. Sci. 2022, 12(7), 3678; https://doi.org/10.3390/app12073678
Submission received: 9 February 2022 / Revised: 31 March 2022 / Accepted: 5 April 2022 / Published: 6 April 2022

Abstract

:
In comparison to conventional human-driven vehicles (HVs), connected and automated vehicles (CAVs) provide benefits (e.g., reducing travel time and improving safety). However, before the period of fully CAVs appears, there will be a situation in which both HVs and CAVs are present, and the traffic flow pattern may differ from that of a single class (e.g., HV or CAV). In this study, we developed a multi-class traffic assignment problem (TAP) for a transportation network that explicitly considered mixed modes (e.g., HV and CAV). As a link’s travel time is dependent on the degree of mixed flows, each mode required an asymmetric interaction cost function. For TAP, the multi-class user equilibrium (UE) model was used for the route choice model. A route-based variational inequality (VI) formulation was used to represent the multi-class TAP and solve it using the gradient projection (GP) algorithm. It has been demonstrated that the GP algorithm is an effective route-based solution for solving the single-class user equilibrium (UE) problem. However, it has rarely been applied to solving asymmetric UE problems. In this study, the single-class GP algorithm was extended to solve the multi-class TAP. The numerical results indicated the model’s efficacy in capturing the features of the proposed TAP utilizing a set of simple networks and real transportation networks. Additionally, it demonstrated the computational effectiveness of the GP algorithm in solving the multi-class TAP.

1. Introduction

In the transportation system of the future, connected and automated vehicles (CAVs) might replace human-driven vehicles (HVs) [1], and drivers’ travel behaviors will change dramatically in the future when CAVs become more common [2]. As CAVs will reduce human driving errors, travel safety could be significantly enhanced [3] and travel time will be improved due to an increased capacity by reducing headway. Tientrakool et al. [4] suggested that highway capacity might be doubled if 60% of traffic is CAVs and improved four to five times if all vehicles were changed to CAVs. Tran and Bae [5] demonstrated that CAVs can increase the average speed by 1.27 times. Besides these two primary benefits, there are countless more, such as improved trip quality and reduced fuel use. However, before the period of fully CAVs appears, it will encounter a situation in which both HVs and CAVs are present, and the traffic flow pattern of the mixed modes will be different when compared to that of only a single class (e.g., HV or CAV). In the literature, in terms of mixed flows, Gkartzonikas and Gkritza [6] focused on the value of time when people drive using CAVs, whereas Levin and Boyles [7] and Xie et al. [8] investigated the optimal control of the mixed traffic flows based on the road level. Chen et al. [9,10] studied the network design problem for allocating dedicated lanes and zones for CAVs. Recently, Li et al. [11] and Zhang and Nie [12] used mixed behavior equilibrium theories to simulate CAV flows. Levin and Boyles [7] demonstrated that even if a small part of a HV is replaced by a CAV, the network flows may significantly lower travel time.
To summarize, estimating network flows is critical for transportation planning during the period when both CAVs and HVs are present. As CAVs can follow the car in front of them more closely than HVs, link capacity should increase. As a result, the travel time is dependent on the proportion of mixed flows, and each mode necessitates an asymmetric interaction cost function.
This study proposed a variational inequality (VI) formulation and the route-based gradient projection (GP) algorithm to solve the multi-class traffic assignment problem (TAP) while explicitly considering mixed modes (e.g., HV and CAV). Due to the special structure of the TAP, GP only requires a simple projection on the non-negative orthant in each iteration; this is thanks to a clever method that makes use of the structure of the TAP. Hence, the necessary computational time is minimal. Furthermore, as a scaling matrix, GP employs the diagonal inverse Hessian approximation, and the “one-at-a-time” flow updating approach is used to equilibrate route flows. These characteristics make the GP approach more computationally efficient (see Chen et al. [13] for a detailed computational comparison). From the literature, the GP algorithm has been shown to be an effective algorithm for solving various TAPs:
  • User equilibrium model [13,14,15,16];
  • Nonadditive traffic equilibrium problem [17];
  • Stochastic user equilibrium problem [18,19];
  • Elastic demand traffic assignment problem [20].
However, in real networks, the use of GP to solve the multi-class TAP with asymmetric vehicle interactions is quite limited. In this paper, the GP technique was extended to solve a multi-class TAP that explicitly considered mixed modes (e.g., HV and CAV). The remainder of the paper is organized as follows. After the introduction, the next section provides the modeling issues, which were vehicle interactions between HVs and CAVs and the multi-class TAP. Section 3 describes a GP method intended specifically to solve the proposed multi-class TAP. Two numerical experiments were adopted to demonstrate the proposed solution algorithm and model formulation in Section 4. Section 5 presents concluding remarks.

2. Multi-Class Traffic Assignment

This section discusses the travel cost function for HVs and CAVs and the model formulation for the multiclass TAP with asymmetric vehicle interactions. A list of variables is provided first for convenience.

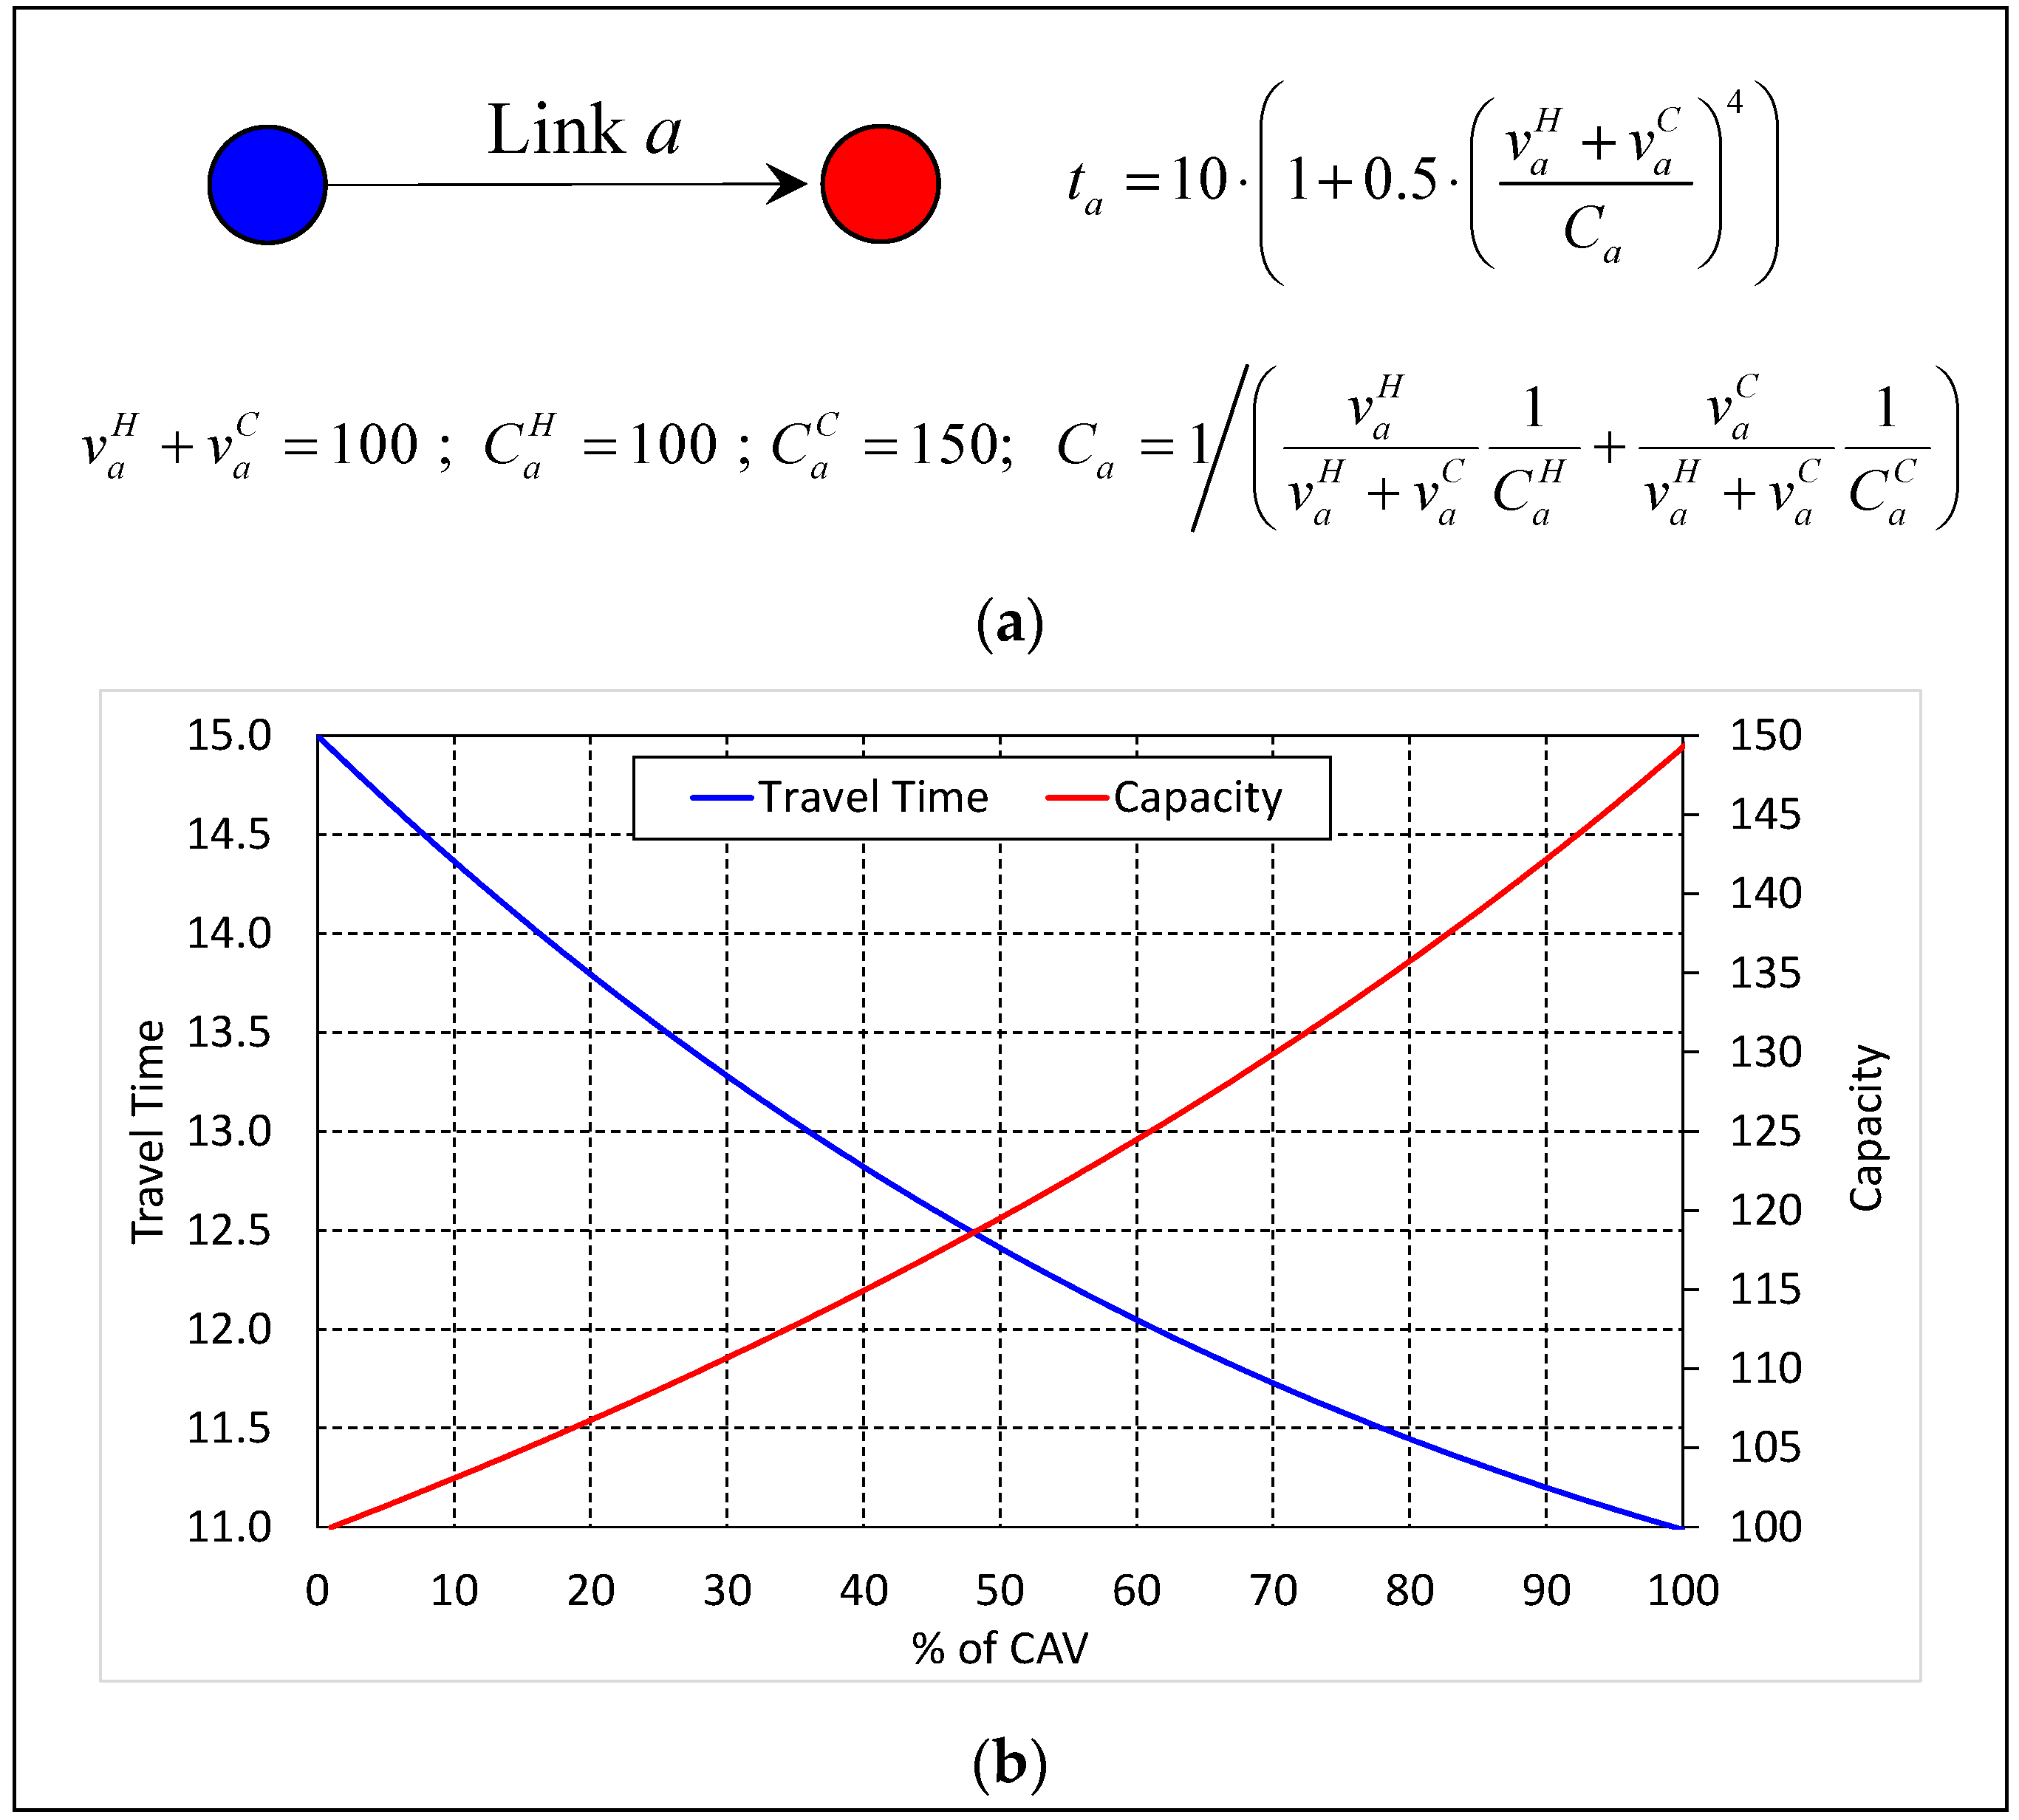
2.1. Travel Cost Function

C a capacity (veh/hour) of link a.
C a H and C a C capacity of HV and CAV on link a, respectively.
h a headway (hour unit) of link a.
h a H and h a C headway (hour unit) of HV and CAV, respectively on link a.
v a H and v a H link flows of HV and CAV, respectively on link a.
t a m ( ) travel time on link a of class m.
p m travel time weight parameter of class m.
t a 0 free-flow travel time of link a.
v a m flow on link a of class m.
C a m capacity on link a of class m.
α a and β a parameters of travel time function on link a.
c k m r s cost of route k between origin r and destination s (O-D pair rs) in class m.
c k ¯ m r s travel time on route k and shortest route k ¯ between O-D pair rs, respectively.
f k m r s route k flow between O-D pair rs.
δ k a m r s route-link indicator, 1 if link a is on route k between O-D pair rs and 0 otherwise.
niteration number.
α step size.u
s k m r s diagonal, positive definite scaling matrix on route k between O-D pair rs.
Vehicle interactions occur when multiple vehicle classes interact in the same roadway space. These interactions typically occur between vehicles with varied maneuvering and operational characteristics. Due to the lower reaction times described in the introduction, CAVs have a smaller headway than HVs. With this assumption, headway in mixed flows can be described as a function of the proportion of HVs and CAVs [7]. The function of headway based on the proportion of mixed flows is shown in Equation (1).
h ¯ a = v a H v a H + v a C h a H + v a C v a H + v a C h a C
The capacity of a road refers to its maximum traffic density, which can be expressed as follows in terms of headway.
C a = 1 h a
If only a single class (e.g., HV or CAV) is present, we can obtain Equation (3), and Equation (1) can be written as Equation (4) using Equation (3).
h a H = 1 C a H   and   h a C = 1 C a C
h ¯ a = v a H v a H + v a C 1 C a H + v a C v a H + v a C 1 C a C
With the derived headway in Equation (4), the capacity for mixed flows can be expressed as Figure 1 with Equation (2).
Figure 2 illustrates an example of travel time and capacity change based on the proportion of HVs and CAVs.
Figure 2a illustrates a typical link travel time function (i.e., a Bureau of Public Roads (BPR) function) for the TAP and the used capacity for HVs and CAVs. Using the input data in Figure 2a, Figure 2b illustrates travel time change and capacity change as a function of the proportion of CAVs. As CAVs have a smaller headway than HVs, the total capacity for mixed flows increased as the proportion of CAVs increased. However, the increasing rate was not a linear pattern. With increased capacity, travel time was intuitively decreased, and this was also not a linear trend. Hence, the travel time function was asymmetric with regard to HVs and CAVs because the travel time of each mode was affected by the other modes. The following link travel time function in Equation (5) was used to model the asymmetric interactions between various modes in a general situation involving a variety of vehicle types.
t a m ( ) = p m t a 0 [ 1 + α a ( m M v a m 1 / ( 1 m M v a m ( m M v a m C a m ) ) ) β a ]

2.2. Model Formulation

Let c and f be the vectors of route costs ( , c k m r s , ) T and route flows ( , f k m r s , ) T . Then, the multi-class TAP with asymmetric vehicle interactions can be formulated. A variational inequality (VI) problem is shown as follows:
Find a route flow solution f * Ω , such that
c ( f * ) T ( f f * ) 0 , f Ω
where Ω represents the feasible set defined by Equations (7)–(9):
k K r s m f k m r s = q m r s ,     r s RS ,   m M
x a m = r s RS k K r s m f k m r s δ k a m r s ,     a A , m M
f k m r s 0 , r s RS , m M , k K r s m
Equation (7) is the travel demand conservation constraint; Equation (8) is a definitional constraint that sums up all route flows that pass through a given link a; and Equation (9) is a non-negativity constraint on the route flows. The VI formulation meets Wardrop’s equilibrium conditions [21] based on the Karush–Kuhn–Tucker (KKT) conditions of the VI formulation [22].
c k m r s ( f * ) o m r s { = 0 i f   ( f k m r s ) * > 0 0 i f   ( f k m r s ) * = 0 ,    m M , k K r s m , r s RS
where o m r s is the minimum O-D cost of class m between O-D pair rs.

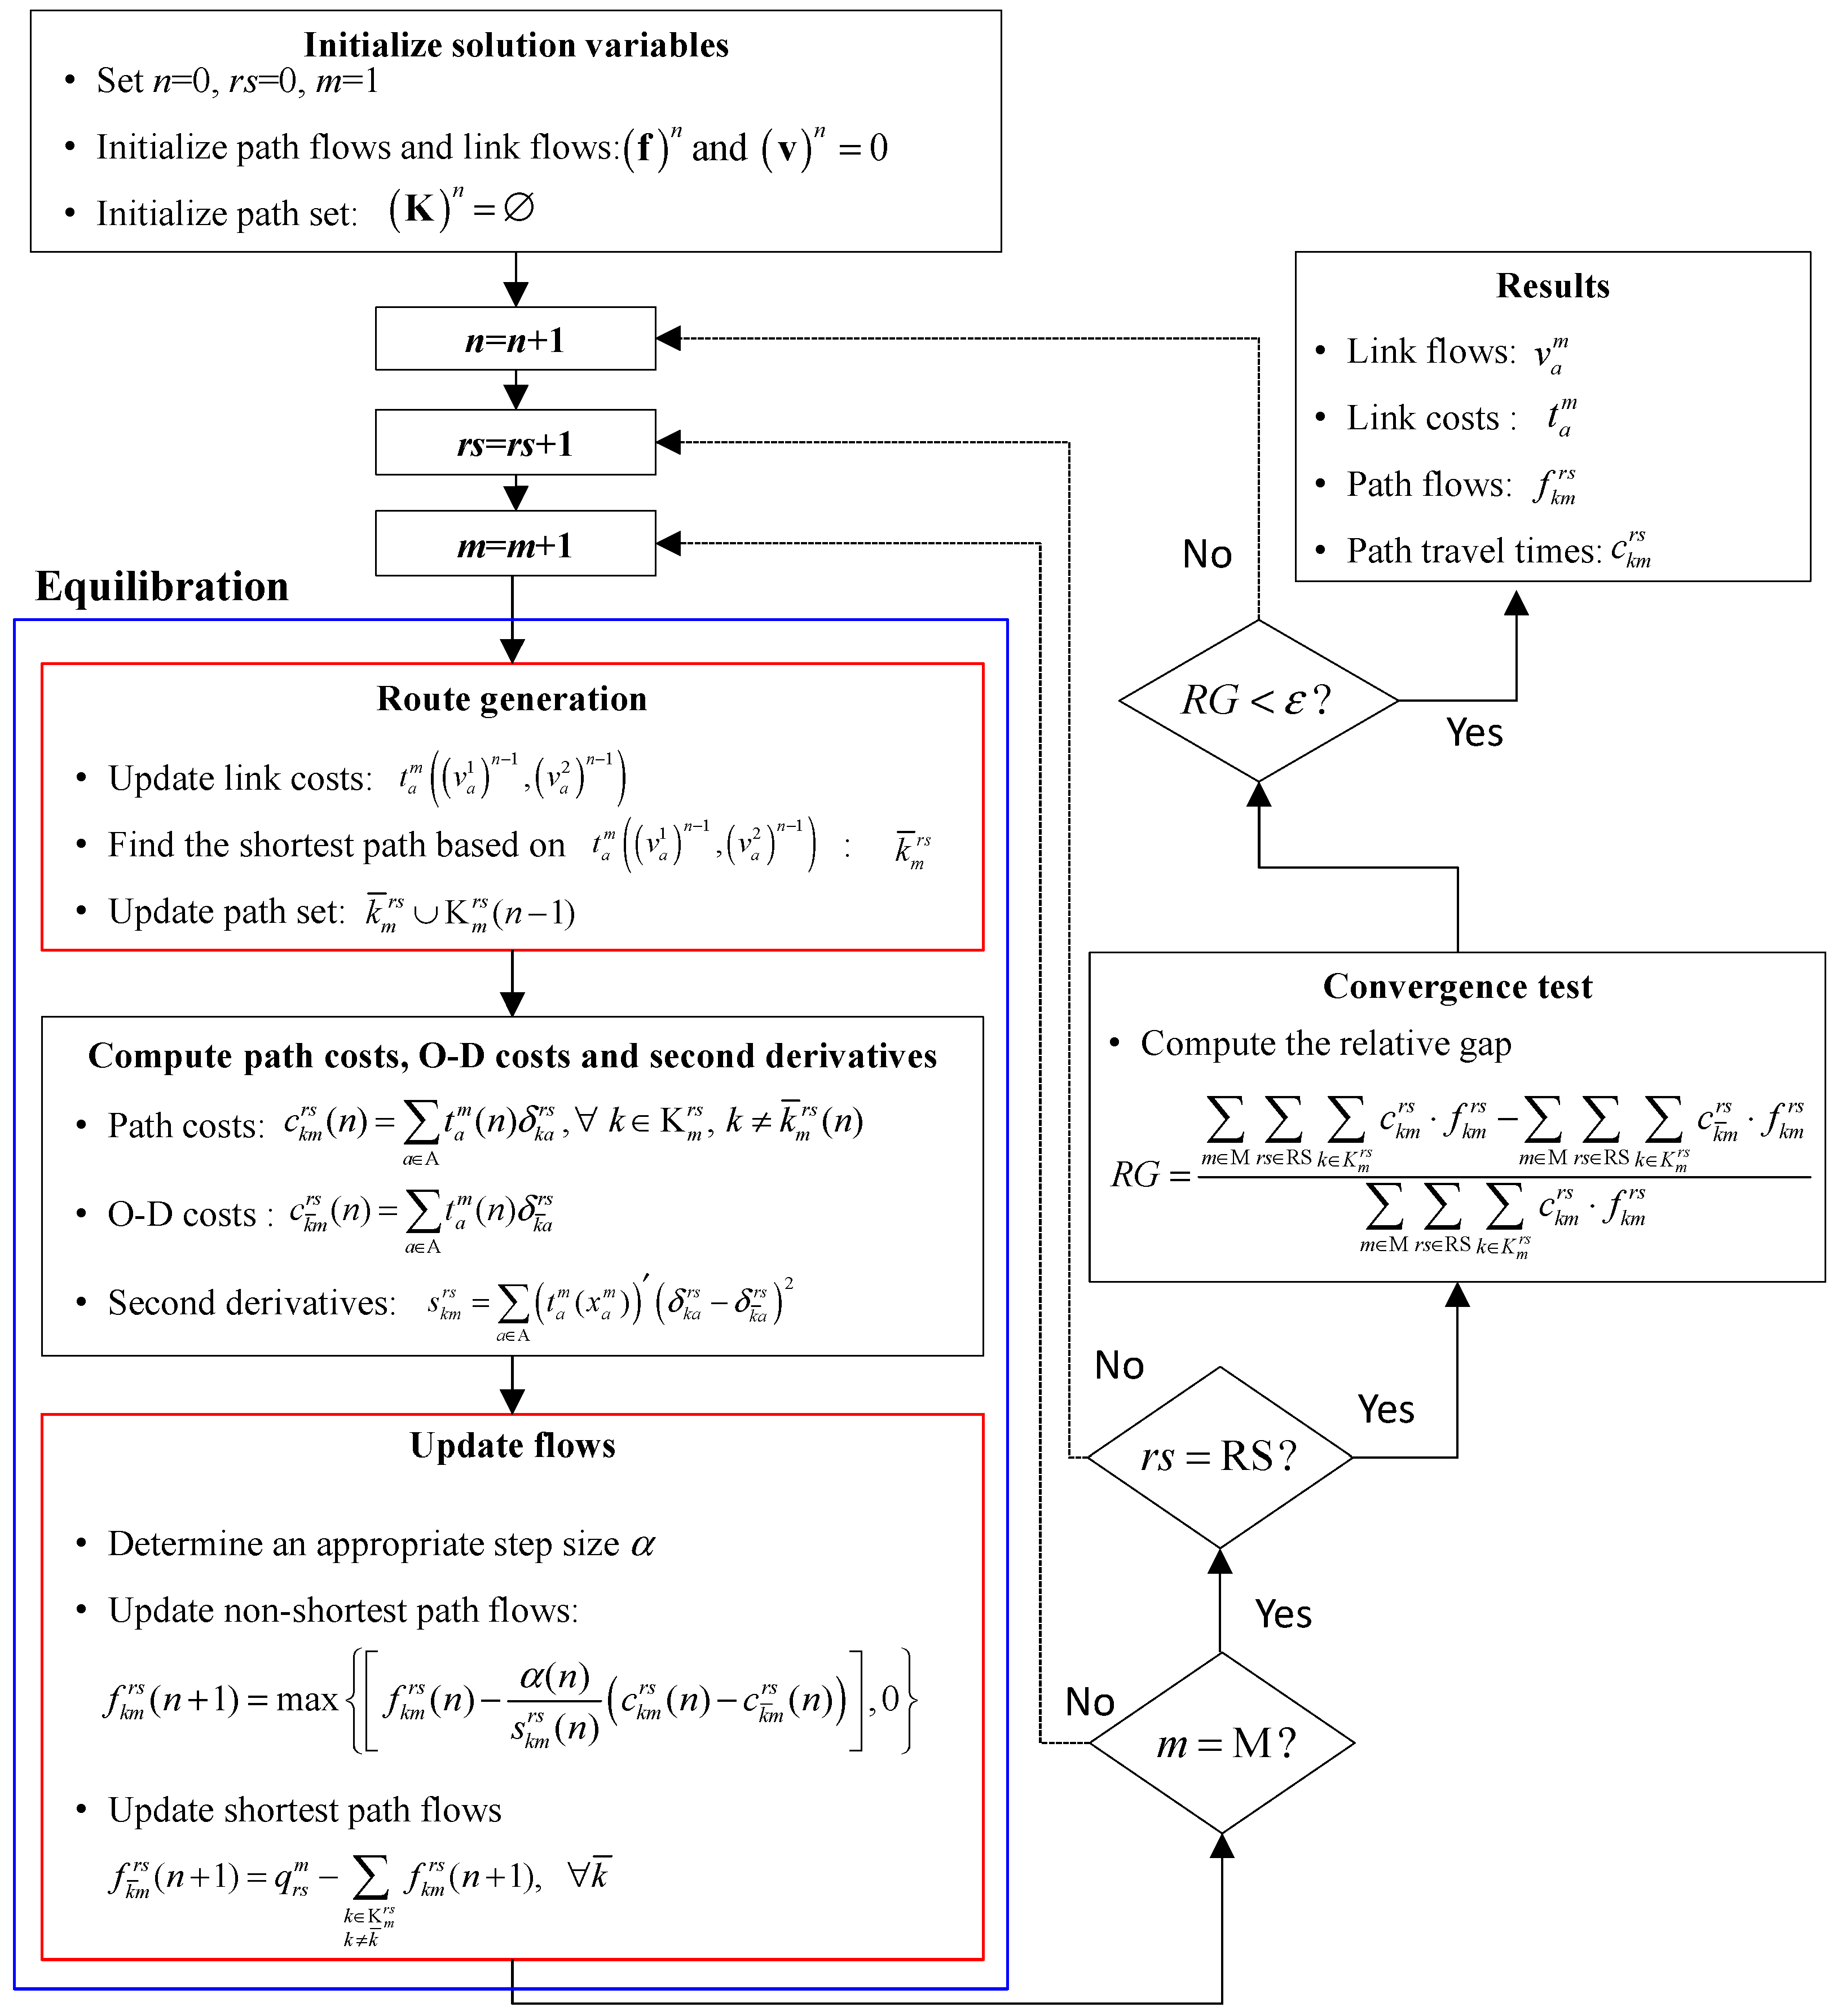
3. Solution Algorithms

The single-class traffic assignment using the GP algorithm was initially applied by Jayakrishnan et al. [14]. The GP algorithm is based on Bertsekas’s [23] GoldsteinLevitinPolyak (GLP) projection approach, which was designed to address the nonlinear multi-commodity problem in communication networks. In each iteration, the algorithm solves the shortest route problem to find a descending search direction, and then scales the result using the second derivative information. The following are the updated equations.
f k m r s ( n + 1 ) = max { [ f k m r s ( n ) α s k m r s ( c k m r s ( n ) c k ¯ m r s ( n ) ) ] , 0 }
f k ¯ m r s ( n + 1 ) = q m r s k K m r s k k ¯ f k m r s ( n + 1 )
Bertsekas et al. [20] recommended utilizing α ( n ) = 1 as the step size and using the second derivative information to avoid determining an appropriate step size. This approach significantly reduced the computational time required to determine the step size and has been demonstrated to be quite robust in previous experiments using the “one-at-a-time” flow updating strategy on networks of various sizes and topologies [13,14]. Furthermore, demand conservation constraints were incorporated. As could be seen in the formulation, the TAP has only two constraints, which are the travel demand conservation constraint in Equation (7) and a non-negativity constraint for the decision variable in Equation (9), while the route travel time consisted of the sum of the link travel time. From this special structure, it was possible that demand conservation constraints in Equation (7) were embedded into the objective function, as in Equation (12). As a result, the simple projection just needed to verify that the route flows were not negative, which was readily accomplished by making the route flow zero if it results were negative.
Figure 3 illustrates the solution procedure strategy for the multi-class TAP with asymmetric vehicle interactions.

4. Numerical Experiments

This section conducts numerical experiments on a small network and a real network to demonstrate the capabilities of the multi-class TAP in mixed modes and the efficiency of the route-based GP algorithm.

4.1. Small Network

The network’s structure and characteristics are presented in Figure 4. It consisted of seven links, five nodes, and two O-D pairs (O-D pairings (1-4) and (1-5)). To compute the travel time, the BPR link performance function ( α a = 0.15 and β a = 4.00) was used, and the travel time weight parameter ( p m ) was considered to be 1.0.
To begin, we assessed the network’s overall travel time as a result of multi-class TAP in Figure 5. As expected, when the percentage of CAVs increased, overall travel time decreased due to increased capacity. However, overall travel time was reduced nonlinearly, although the percentage of CAVs was raised linearly. Increases in the proportion of CAVs at an early stage (0 percent to 10% of CAVs) were more effective than increases at a later stage (90 percent to 100 percent of CAVs). Additionally, when the percentage of CAVs was 100%, capacity improved by 50%, as shown in Figure 2b, while overall travel time improved by 60%. As a result of the findings, we could infer that the network was highly congested when only HV demand was used.
Second, by increasing the percentage of CAVs, the trajectories of the link capacity were explored and presented in Figure 6. When the percentage of CAVs was increased from 0% to 60%, the capacities of links 2, 3, 6, and 7 increased, while the capacities of the other links (i.e., links 1, 4, and 5) increased above 60% of CAVs. This result indicated that more CAVs were allocated to routes 3 and 6 until 60% of CAVs was reached, while CAV flows were increased in routes 1 and 4 after 60% of CAVs was reached. This was because the links in routes 3 and 6 were approaching their maximum capacity, and the excess CAV flows were diverted to other underutilized links to increase capacity and decrease travel time accordingly. As could be seen, capacity expansion also did not follow a linear trend.

4.2. Korea Network

This section conducts numerical experiments on the South Korea network. These experiments were performed to investigate (a) the convergence characteristics of the route-based GP algorithm for solving the multi-class TAP and (b) the effect of flow allocation. Figure 7 depicts the Korea network, which consists of 247 zones, 45,434 nodes, 96,621 links, and 51,541 O-D pairs. The Korea Transportation Institution provided the network structure, O-D trip tables, and link travel time function. Four scenarios were created to investigate the effect of the multi-class TAP with mixed modes on different roadway classes. Scenario 1 assumed that CAVs were not permitted to drive on any roads, which meant they drove manually on all roadways like HVs. On the other hand, Scenario 2 assumed that CAV travel was permitted exclusively on freeways. It was assumed that CAVs were permitted on freeways and arterials in scenario 3. Finally, scenario 4 assumed that CAVs were capable of traveling on all available roadways. The aggregated demands were assumed to be disaggregated by 50% and 50% to obtain the O-D trips for HVs and CAVs, respectively. Maximum capacity was expected to be 1.5 times more when driving only CAVs than when driving only HVs. The GP algorithm was coded in Intel Visual FORTRAN XE 2021 and ran on a 3.60 GHz processor with 16.00 GB of RAM.

4.2.1. Convergence Characteristics

Figure 8 illustrates the convergence characteristics of the route-based GP method used to solve the multi-class TAP with mixed modes. As can be seen, the method was capable of achieving convergence with a relative gap (RG) of 1 × 10⁻⁶. The computational effort required to achieve a relative gap of 1 × 10⁻⁶ was around 3600 s. Based on the results, computational CPU times were reduced as the available roads for CAVs increased. This was expected since adding available roads for CAVs to the network resulted in a reduced congestion level with increased capacity and the algorithm required less computational efforts to equilibrate the path flows of all vehicle classes.

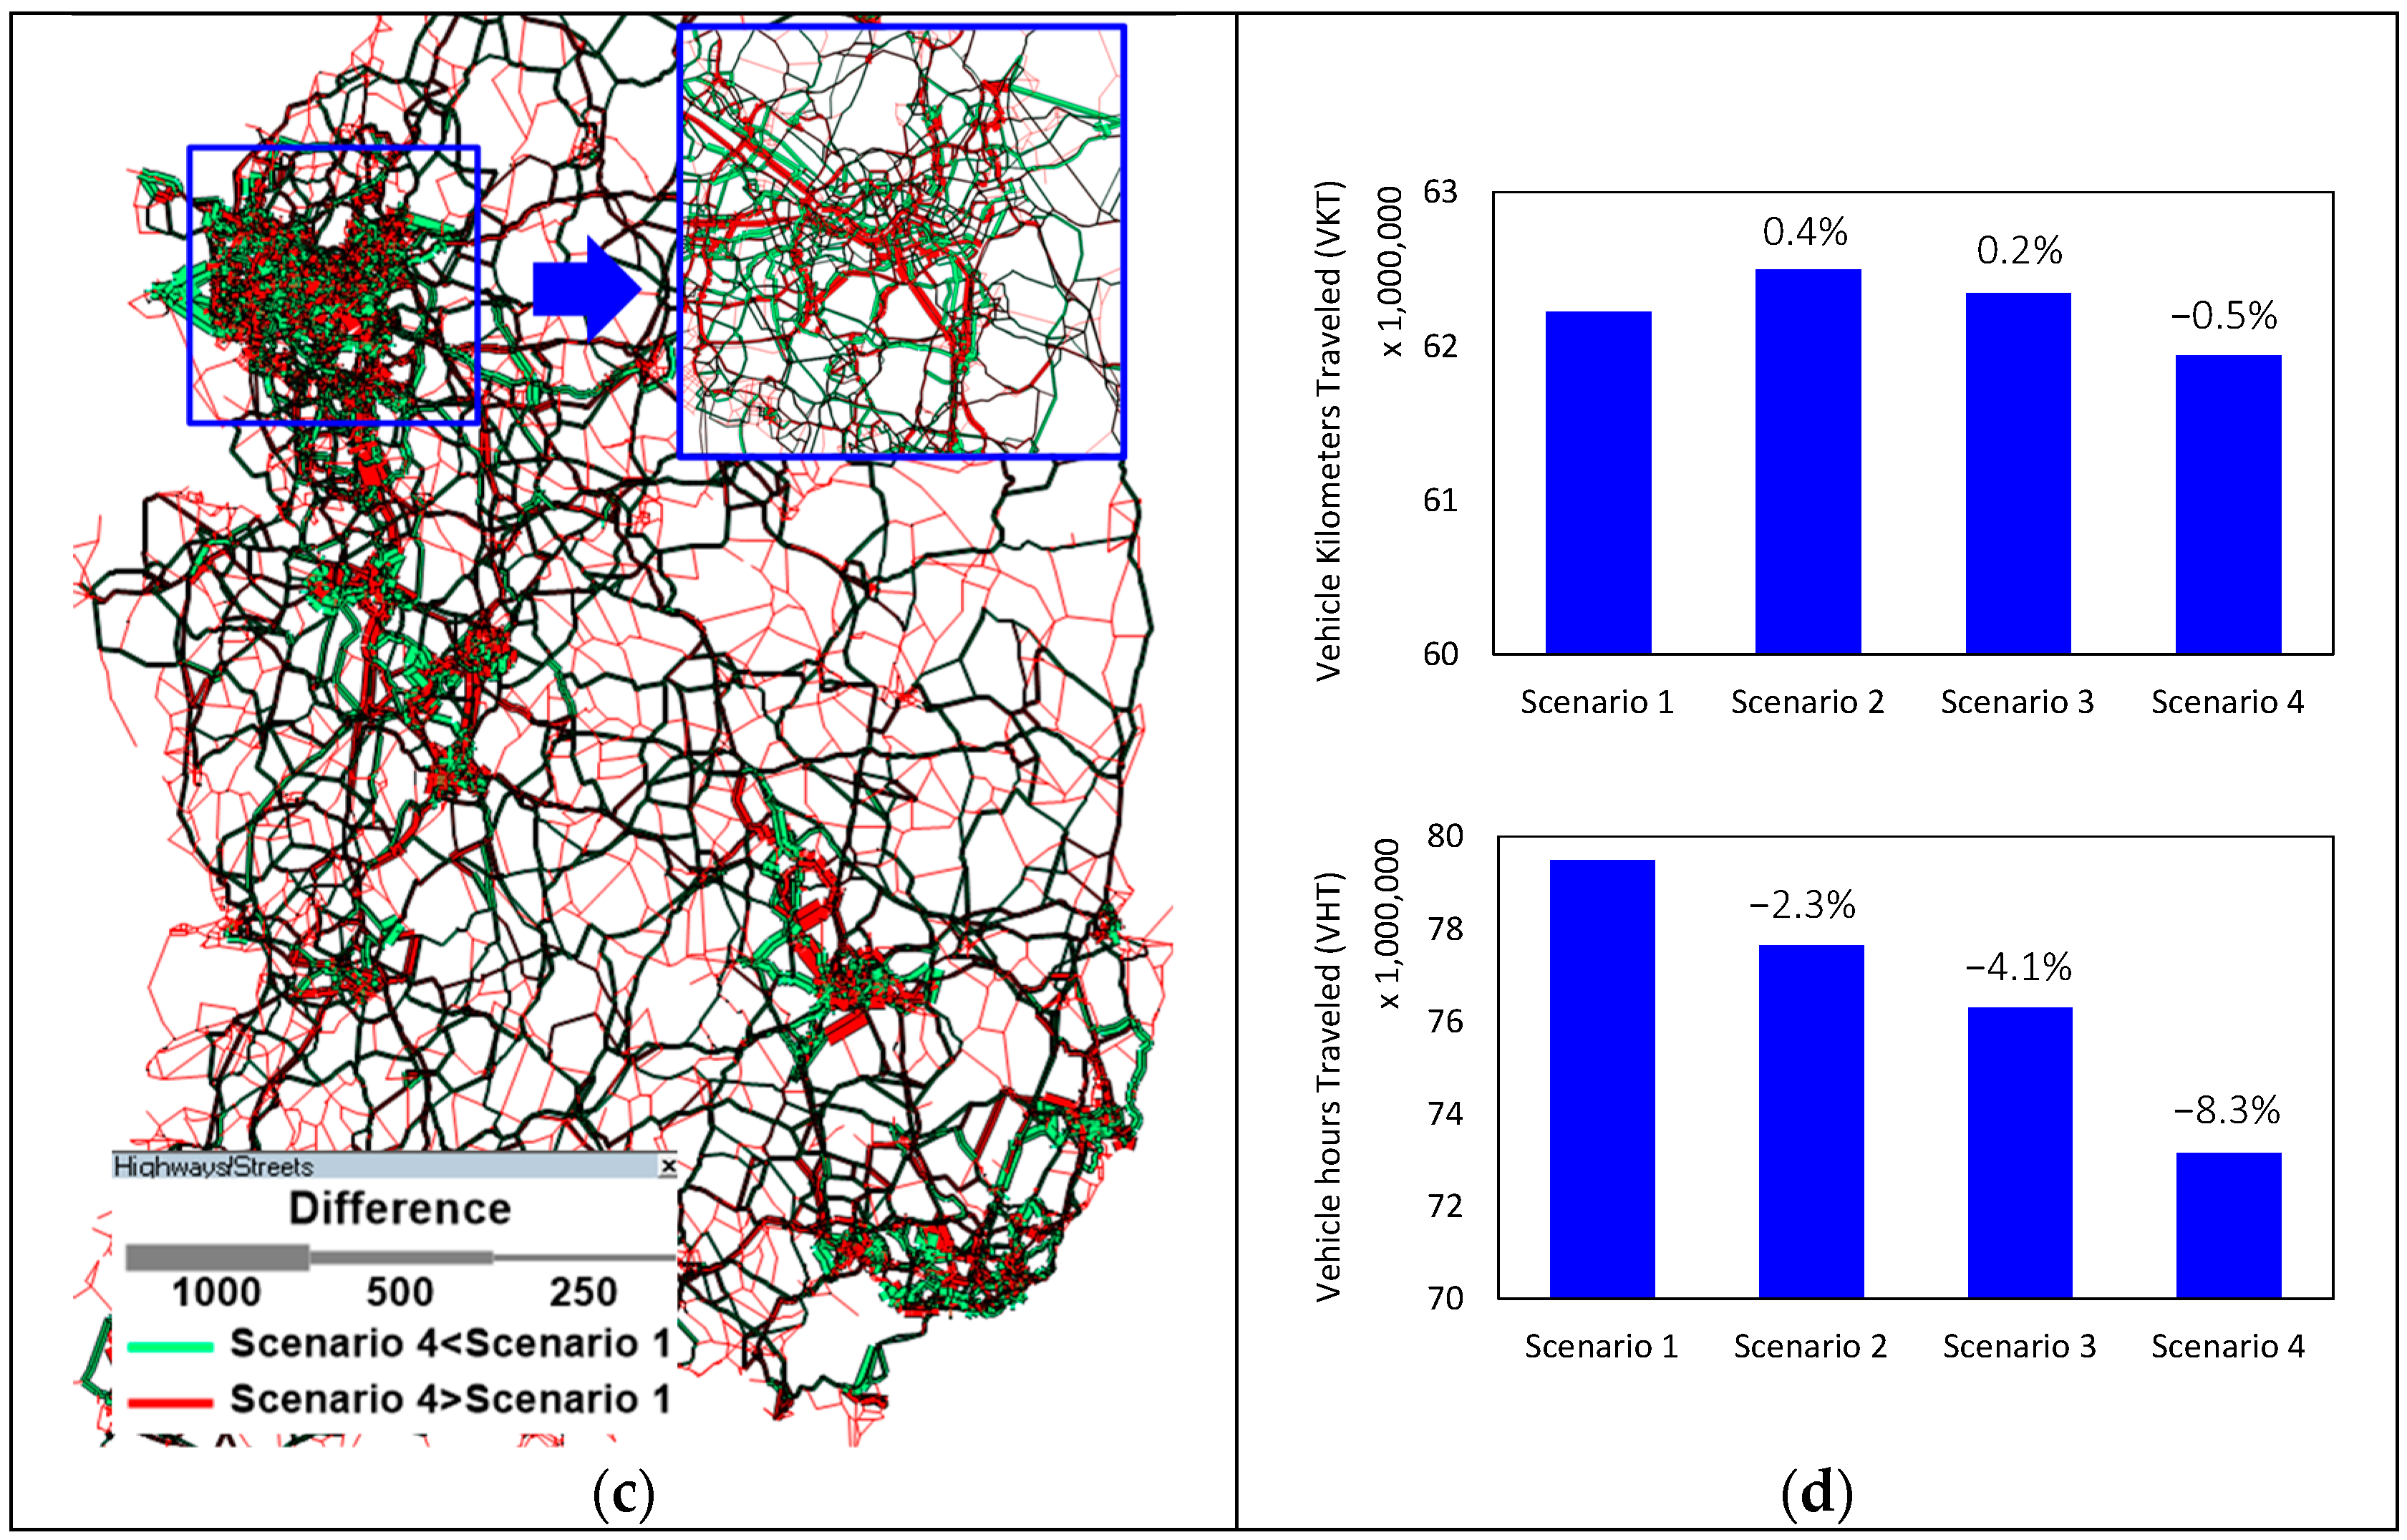
4.2.2. Assigned Flow Comparison

To illustrate the assigned flow difference and effect of travel time alleviation when CAVs drove on different roadway classes, Figure 9 illustrates the link flow differences between scenario 1 and other scenarios on a Geographic Information System (GIS) map. It should be noted that the scenarios were based on the specifications presented in Figure 7c. Links were categorized by thickness and color to emphasize the degree of the difference. The green color showed that the assigned flow in scenario 1 was higher than the assigned flows in other scenarios, and the red color indicated the reverse. The results in Figure 9 clearly show that the multi-class TAP considering mixed modes had a significant impact on flow allocations. The majority of the differences occurred on the freeway, where the freeway generally had a larger capacity; hence capacity was increased more when CAVs traveled more on the freeway compared to other roadways. Using vehicle kilometers traveled (VKT) and vehicle hours traveled (VHT) to evaluate the effect of allowing different rode classes for CAVs, VKT was not significantly affected by CAV driving (the values changed by 0.4%, 0.2%, and −0.5% in scenarios 2, 3, and 4, respectively, compared with scenario 1, whereas VHT was significantly decreased when CAVs drove on more roadways (the values changed by −2.3%, −4.1%, and −8.3% in scenarios 2, 3, and 4, respectively, compared with scenario 1). The reasons for the results were that more CAVs driving on the roadways could promote an increase in the overall network capacity, and this increased capacity influenced travel time reduction. Specially, when CAVs traveled more on the freeway, capacity on the freeway was increased compared to other roadways and travelers changed their route passing through the freeway to minimize their travel time, despite the travel distance increase. As a result, VKT was slightly increased in the comparison between scenario 1 and scenario 2 and between scenario 1 and scenario 3

5. Conclusions

The GP algorithm for solving the multi-class TAP with mixed modes was developed in this paper. It proposed the use of asymmetric travel time functions to represent the effect of vehicle interaction between HVs and CAVs. Two numerical experiments were performed to investigate the proposed model’s features. The numerical results indicated the following: (1) when the proportion of CAVs was increased, travel time decreased significantly; (2) travel time was reduced nonlinearly although the percentage of CAVs was raised linearly; (3) there was a considerable change in the assigned traffic pattern with and without CAV demand; (4) the flow pattern on freeways was more affected by CAV driving; and (5) computational time was more efficient when CAV driving was allowed on more roads. These findings have the potential to have a considerable impact on various fields of research, including road construction, safety, and environmental impact studies. In the future, the issue of CAV performance in terms of travel time function and route choice behavior should be investigated. Another possibility is to consider other types of CAV, such as trucks (medium and heavy trucks) to improve the realism as each type of CAV has unique characteristics. Additionally, computational experiments should be conducted on a variety of network topologies, congestion levels, and zonal densities to determine the route-based GP algorithm’s effectiveness and efficiency.

Author Contributions

Conceptualization, S.R.; methodology, S.R.; formal analysis, S.R.; investigation, M.K.; writing—original draft preparation, S.R.; writing—review and editing, M.K. All authors have read and agreed to the published version of the manuscript.

Funding

This research was funded by the Ministry of Science, ICT, Republic of Korea (K-22-L04-C06-S01).

Institutional Review Board Statement

Not applicable.

Informed Consent Statement

Not applicable.

Data Availability Statement

The data presented in this study are available, upon request, from the corresponding author.

Conflicts of Interest

The authors declare no conflict of interest.

References

  1. Milakis, D. Long-term implications of automated vehicles: An introduction. Transp. Rev. 2019, 39, 1–8. [Google Scholar] [CrossRef]
  2. Severino, A.; Curto, S.; Barberi, S.; Arena, F.; Pau, G. Autonomous Vehicles: An Analysis Both on Their Distinctiveness and the Potential Impact on Urban Transport Systems. Appl. Sci. 2021, 11, 3604. [Google Scholar] [CrossRef]
  3. Razzaq, S.; Dar, A.R.; Shah, M.A.; Khattak, H.A.; Ahmed, E.; El-Sherbeeny, A.M.; Rauf, H.T. Multi-Factor Rear-End Collision Avoidance in Connected Autonomous Vehicles. Appl. Sci. 2022, 12, 1049. [Google Scholar] [CrossRef]
  4. Tientrakool, P.; Ho, Y.C.; Maxemchuk, N.F. Highway capacity benefits from using vehicle-to-vehicle communication and sensors for collision avoidance. In Proceedings of the 2011 IEEE Vehicular Technology Conference, San Francisco, CA, USA, 5–8 May 2011; pp. 1–5. [Google Scholar]
  5. Tran, Q.D.; Bae, S.H. An efficiency enhancing methodology for multiple autonomous vehicles in an Urban network adopting deep reinforcement learning. Appl. Sci. 2021, 11, 1514. [Google Scholar] [CrossRef]
  6. Gkartzonikas, C.; Gkritza, K. What have we learned? A review of stated preference and choice studies on autonomous vehicles. Transp. Res. Part C Emerg. Technol. 2019, 98, 323–337. [Google Scholar] [CrossRef]
  7. Levin, M.W.; Boyles, S.D. A multiclass cell transmission model for shared human and autonomous vehicle roads. Transp. Res. Part C Emerg. Technol. 2016, 62, 103–116. [Google Scholar] [CrossRef] [Green Version]
  8. Xie, D.F.; Zhao, X.M.; He, Z. Heterogeneous traffic mixing regular and connected vehicles: Modeling and stabilization. IEEE Trans. Intell. Transp. Syst. 2018, 20, 2060–2071. [Google Scholar] [CrossRef]
  9. Chen, Z.; He, F.; Yin, Y.; Du, Y. Optimal design of autonomous vehicle zones in transportation networks. Transp. Res. Part B Methodol. 2017, 99, 44–61. [Google Scholar] [CrossRef] [Green Version]
  10. Chen, Z.; He, F.; Zhang, L.; Yin, Y. Optimal deployment of autonomous vehicle lanes with endogenous market penetration. Transp. Res. Part C Emerg. Technol. 2016, 72, 143–156. [Google Scholar] [CrossRef] [Green Version]
  11. Li, R.; Liu, X.; Nie, Y.M. Managing partially automated network traffic flow: Efficiency vs. stability. Transp. Res. Part B Methodol. 2018, 114, 300–324. [Google Scholar] [CrossRef]
  12. Zhang, K.; Nie, Y.M. Mitigating the impact of selfish routing: An optimal-ratio control scheme (ORCS) inspired by autonomous driving. Transp. Res. Part C Emerg. Technol. 2018, 87, 75–90. [Google Scholar] [CrossRef]
  13. Chen, A.; Lee, D.H.; Jayakrishnan, R. Computational study of state-of-the-art path-based traffic assignment algorithms. Math. Comput. Simul. 2002, 59, 509–518. [Google Scholar] [CrossRef]
  14. Jayakrishnan, R.; Tsai, W.T.; Prashker, J.N.; Rajadhyaksha, S. A faster path-based algorithm for traffic assignment. Transp. Res. Rec. 1994, 1443, 75–83. [Google Scholar]
  15. Tan, H.; Du, M.; Chen, A. Accelerating the gradient projection algorithm for solving the non-additive traffic equilibrium problem with the Barzilai-Borwein step size. Comput. Oper. Res. 2022, 141, 105723. [Google Scholar] [CrossRef]
  16. Tan, H.; Yu, C.B.; Du, M. A multiple-path gradient projection method for solving the logit-based stochastic user equilibrium model. J. Transp. Land Use 2020, 13, 539–558. [Google Scholar] [CrossRef]
  17. Chen, A.; Zhou, Z.; Xu, X. A self-adaptive gradient projection algorithm for the nonadditive traffic equilibrium problem. Comput. Oper. Res. 2012, 39, 127–138. [Google Scholar] [CrossRef]
  18. Zhou, Z.; Chen, A.; Bekhor, S. C-logit stochastic user equilibrium model: Formulations and solution algorithm. Transp. A Transp. Sci. 2012, 8, 17–41. [Google Scholar] [CrossRef]
  19. Chen, A.; Xu, X.; Ryu, S.; Zhou, Z. A self-adaptive Armijo stepsize strategy with application to traffic assignment models and algorithms. Transp. A Transp. Sci. 2013, 9, 695–712. [Google Scholar] [CrossRef]
  20. Ryu, S.; Chen, A.; Choi, K. A modified gradient projection algorithm for solving the elastic demand traffic assignment problem. Comput. Oper. Res. 2014, 47, 61–71. [Google Scholar] [CrossRef]
  21. Wardrop, J.G. Road paper. some theoretical aspects of road traffic research. Proc. Inst. Civ. Eng. 1952, 1, 325–362. [Google Scholar] [CrossRef]
  22. Facchinei, F.; Pang, J.S. (Eds.) Finite-Dimensional Variational Inequalities and Complementarity Problems; Springer: New York, NY, USA, 2003. [Google Scholar]
  23. Bertsekas, D.; Gafni, E.; Gallager, R. Second derivative algorithms for mini- mum delay distributed routing in network. IEEE Trans. Commun. 1984, 32, 911–919. [Google Scholar] [CrossRef] [Green Version]
Figure 1. Example of the headway in mixed traffic flows.
Applsci 12 03678 g001
Figure 2. Graphical illustration of travel time and capacity change. (a) Link travel time function and parameters. (b) Travel time and capacity change as a function of the proportion of CAVs.
Applsci 12 03678 g002
Figure 3. Solution procedure strategy for the multi-class TAP with asymmetric vehicle interactions.
Applsci 12 03678 g003
Figure 4. Network topology and features of the small network. (a) Test network; (b) link characteristics; (c) route set, (d) O-D demand with % of CAVs.
Applsci 12 03678 g004
Figure 5. Total travel time improvement as the percentage of CAVs.
Applsci 12 03678 g005
Figure 6. Trajectories of capacities.
Applsci 12 03678 g006
Figure 7. Korea network and analysis scenarios. (a) Test network; (b) network characteristics; (c) available roads for CAVs.
Applsci 12 03678 g007
Figure 8. Convergence characteristics.
Applsci 12 03678 g008
Figure 9. Flow difference between scenario 1 and other scenarios. (a) Scenario 1 and scenario 2; (b) scenario 1 and scenario 3; (c) scenario 1 and scenario 4; (d) VKT and VHT for scenarios.
Applsci 12 03678 g009aApplsci 12 03678 g009b
Publisher’s Note: MDPI stays neutral with regard to jurisdictional claims in published maps and institutional affiliations.

