1. Introduction
With the increasing importance of digital advertising, the significance of ad operations has also increased. Ad operations consist of various tasks, such as preparing ad creatives, determining the bid price and the target audience, and discontinuing inefficient ad creatives. These operations are essential for business revenue; however, operators’ abilities are dependent on their experience. Supporting ad operations is an important topic of study in the field of machine learning (ML) [
1,
2,
3,
4,
5]. Discontinuing ad creatives at the appropriate time is a crucial operation and can have a significant impact on sales. However, to the best of our knowledge, no studies have been conducted so far that support these operations.
To support ad operations, we address the discontinuation of ineffective ad creatives based on ML methods. Ad creatives are generally discontinued manually by ad operators when they become less effective. Considering that ad-serving algorithms (e.g., bid price optimization [
3,
4]) are required to serve a large number of effective ad creatives, multiple studies have been conducted to develop algorithms that can provide accurate predictions [
6,
7]. However, we posit that predicting ad performance for operational efficiency requires other mechanisms because the utilization of the results is different from efficient ad serving. In other words, in this study, we focus on predicting the effectiveness of the ad creatives so as to properly discontinue ineffective ones.
Pre-analyzing 1,000,000 real-world ad creatives, we found two types/patterns of discontinuation: short-term and long-term. These discontinuations were empirically identified as falling into two categories: (a)
cut-out (i.e., for short-term discontinuation) and (b)
wear-out (i.e., for long-term discontinuation). In cut-out discontinuation, ad creatives are discontinued after a short period of time due to incompatible serving effects, whereas in wear-out discontinuation, ad creatives are discontinued when ad creatives’ performance deteriorates after a long time. Ad operators need to take different actions for each type of discontinuation. We clarified these empirical differences by analyzing real-world data (described in detail in
Section 3).
To address the discontinuation of the ad creatives that have an impact on business revenue, we propose a discontinuation prediction framework based on the real-world data; this is the first piece of work focusing on ineffective ad creatives, rather than effective ones. Our framework is a multi-modal deep neural network (DNN) with multiple ad creative features (e.g., text, categorical, image, numerical features) as inputs and incorporates a hazard function, which is frequently used in survival prediction, into a loss function (It is controversial to solve ad discontinuation prediction as a survival prediction. In this paper, we do not elaborate on this topic but only discuss the idea of the hazard function. We intend to tackle this issue in our future studies). To improve the prediction performance for the two different types of discontinuations and for the ad creatives that contribute to sales, we introduce two new techniques: (1) a two-term estimation technique with multi-task learning (MTL) [
8] and (2) a click-through rate (CTR)-weighting technique for the loss function (described in detail in
Section 4). Using the large-scale ad creative dataset, we practically evaluated the proposed framework and techniques with various metrics such as concordance index (CI) [
9], the F1 score, and operational performance measures (described in detail in
Section 5 and
Section 6).
The contributions of our study are summarized as follows:
Analyzing large-scale ad creative dataset: We analyzed 1,000,000 real-world ad creatives, including 10 billion scale impressions, and identified two important aspects. (a) There are two reasons for the discontinuation of ad creatives: cut-out (for the short term) and wear-out (for the long term). (b) The business impact of discontinuation varies significantly for different ad creatives.
Proposing a new framework for predicting ad creative discontinuation: We propose a multi-modal DNN-based framework for predicting ad discontinuation with a hazard function-based loss function. Our framework includes two effective techniques: (i) a two-term estimation technique with MTL and (ii) a CTR-weighting technique for the loss function. Our framework demonstrated significantly better performance (short: 0.896, long: 0.939, and overall: 0.792 in the CI) than the conventional method (0.531 in the CI) did. Additionally, our framework outperformed classification- and regression-based frameworks.
Evaluating the framework through practical case studies: We evaluated our framework from two important perspectives of case studies and confirmed the following: For short-term cases, our framework demonstrated an equivalent or better discontinuation effect compared with manual operations. For long-term cases, our framework provided a high degree of similarity of order to manual discontinuation orders compared with other methods, based on other practical indicators; this is important for long-running ad creatives.
The remainder of this paper is organized as follows.
Section 2 reviews related work about supporting ad operations and survival prediction/hazard functions.
Section 3 describes the insight from the pre-data analysis and clarifies the characteristics of each type of discontinuation.
Section 4 presents the multi-modal DNN-based framework for predicting the timing of the discontinuation of ad creatives.
Section 5 describes offline experiments with standard metrics using already-observed (i.e., offline) data.
Section 6 describes case studies that simulate online experiments using as-yet-unobserved (i.e., online) data.
Section 7 describes the limitations and future works of this study. Finally,
Section 8 concludes this study.
2. Related Work
In this section, we describe related work about supporting ad creative operation process and survival prediction/hazard functions.
2.1. Supporting the Ad Creative Operation Processes
Table 1 shows a classification of ML methods that support the process for ad creatives. The operation process for ad creatives generally includes the following: (1) created and submitted to the ad platform, (2) served to users on the platform, and (3) discontinued when they become less effective. There are several studies to support (1) and (2) based on ML methods, such as supporting the creation of high-performing ad creatives [
1,
2,
10,
11], determining the best bid price [
3,
12,
13], and deciding to whom to serve the ad creatives [
5,
14,
15]. However, to the best of our knowledge, no studies have been conducted on supporting the discontinuation process. Thus, we focus on process (3) and develop a framework for predicting the appropriate timing for the discontinuation of a ad creative.
The serving performance of ads can be inefficient for a variety of reasons, one of which is wear-out. Wear-out is an event caused by decreasing ad performance due to repeated serving to users. To control for wear-out, frequency capping, (
https://support.google.com/google-ads/answer/117579; accessed on 28 March 2022) which restricts the number of times an ad creative is served to a user, is a traditional function, and the number of servings of an ad is useful in predicting the CTR and/or conversion rate (CVR) [
6]. The event is commonly discussed in marketing science literature [
16], and an ad-serving algorithm that incorporates wear-out as a feature has been previously proposed [
17]. However, no studies have directly predicted the wear-out of ad creatives.
In related studies about ad creative discontinuation, a bandit algorithm has been commonly used for selecting effective ad creatives [
18]. Using the algorithm, the efficiency of ad creatives can be estimated correctly with fewer impressions. However, ad operators must decide which ads to discontinue based on their performance; determining the appropriate timing of discontinuation demands much experience.
2.2. Survival Prediction and Hazard Function
Survival prediction is a branch of statistics that deals with time-to-event data, that is, data where the objective variable is the time until the event occurs. The effectiveness of the strategy has been confirmed across various domains, such as credit score analysis [
19] and customer analysis [
20]. In digital advertising, survival prediction helps to predict the conversion rate [
21], user experiences after clicking on an ad [
22], the winning bid price [
23], and the failure rate of the reserve price [
24].
The main feature of the survival prediction task is to correctly model censored data such that no event occurs during the observation period. However, in the ad discontinuation task, such data are scarce because the operator manually determines the time of discontinuation (Although there are some cases where the serving volume is low, they are very few). When such censoring data are scant or nonexistent, Zhong et al. [
25] reported that the survival prediction task can be regarded as equivalent in terms of formulation to the classification task. Although it is debatable whether survival prediction is suitable for ad discontinuation tasks, we assume that the properties of ad discontinuation have some similarities with those of survival prediction tasks. Thus, we attempt to utilize the hazard function, which is an important idea in survival prediction.
The hazard function can model the main variable of interest as the time until an event. This function has been used to represent the decaying survival probability, and deep learning-based survival prediction models have been developed by training a loss function based on the function [
26,
27,
28]. We considered that the function is suitable for modeling the discontinuation probability of exponentially decaying ad creatives (described in detail in
Section 3). Through training based on the hazard function with a deep learning model, we expect to develop a better prediction model that will help ad operators with discontinuation.
3. Pre-Data Analysis
In this section, we clarify the characteristics of the two types of discontinuation (cut-out and wear-out) by analyzing a real-world dataset. First, we provide an overview of the dataset. Second, we analyze the dataset in terms of serving days and sales aspects. Then, we discuss the difference between the two types of discontinuation based on the analysis.
3.1. Dataset Overview
We used real-world data from the Japanese digital advertising program Gunosy Ads, (Gunosy Ads
https://gunosy.co.jp/ad/en/; accessed on 28 March 2022) provided by Gunosy Inc. (Tokyo, Japan) (Gunosy Inc.
https://gunosy.co.jp/en/; accessed on 28 March 2022) Gunosy Inc. is a provider of several news delivery applications, and Gunosy Ads delivers digital advertisements for these applications. The applications have been downloaded more than 53 million times as of November 2019. We used approximately 1,000,000 ad creatives, including 10 billion scale impressions, served from 2018 to 2019 by Gunosy Ads. The ads were managed in units called
campaigns, and each campaign was configured with a target gender, ad genre, and cost per acquisition (CPA).
Table 2 shows the examples included in the ad creative dataset. Each ad creative was associated with a campaign and consisted of texts (e.g., title, description), categorical information (e.g., gender of the serving target, genre of the ad creative), and an image attached to the ad creative, and numerical information (e.g., the number of impressions, clicks, conversions, and the CPA for the ad creative). Ad performance data, including the number of impressions, clicks, conversions, and sales, were tabulated for each ad creative daily. Because the data are confidential, the actual values cannot be disclosed. Thus, relative values are used when discussing the data.
3.2. Analysis of the Dataset
In this section, we report the results of pre-data analysis using the real-world ad creative dataset in terms of serving days and sales. Based on these results, we found that there are two types of ad discontinuation.
3.2.1. Variation of Serving Days
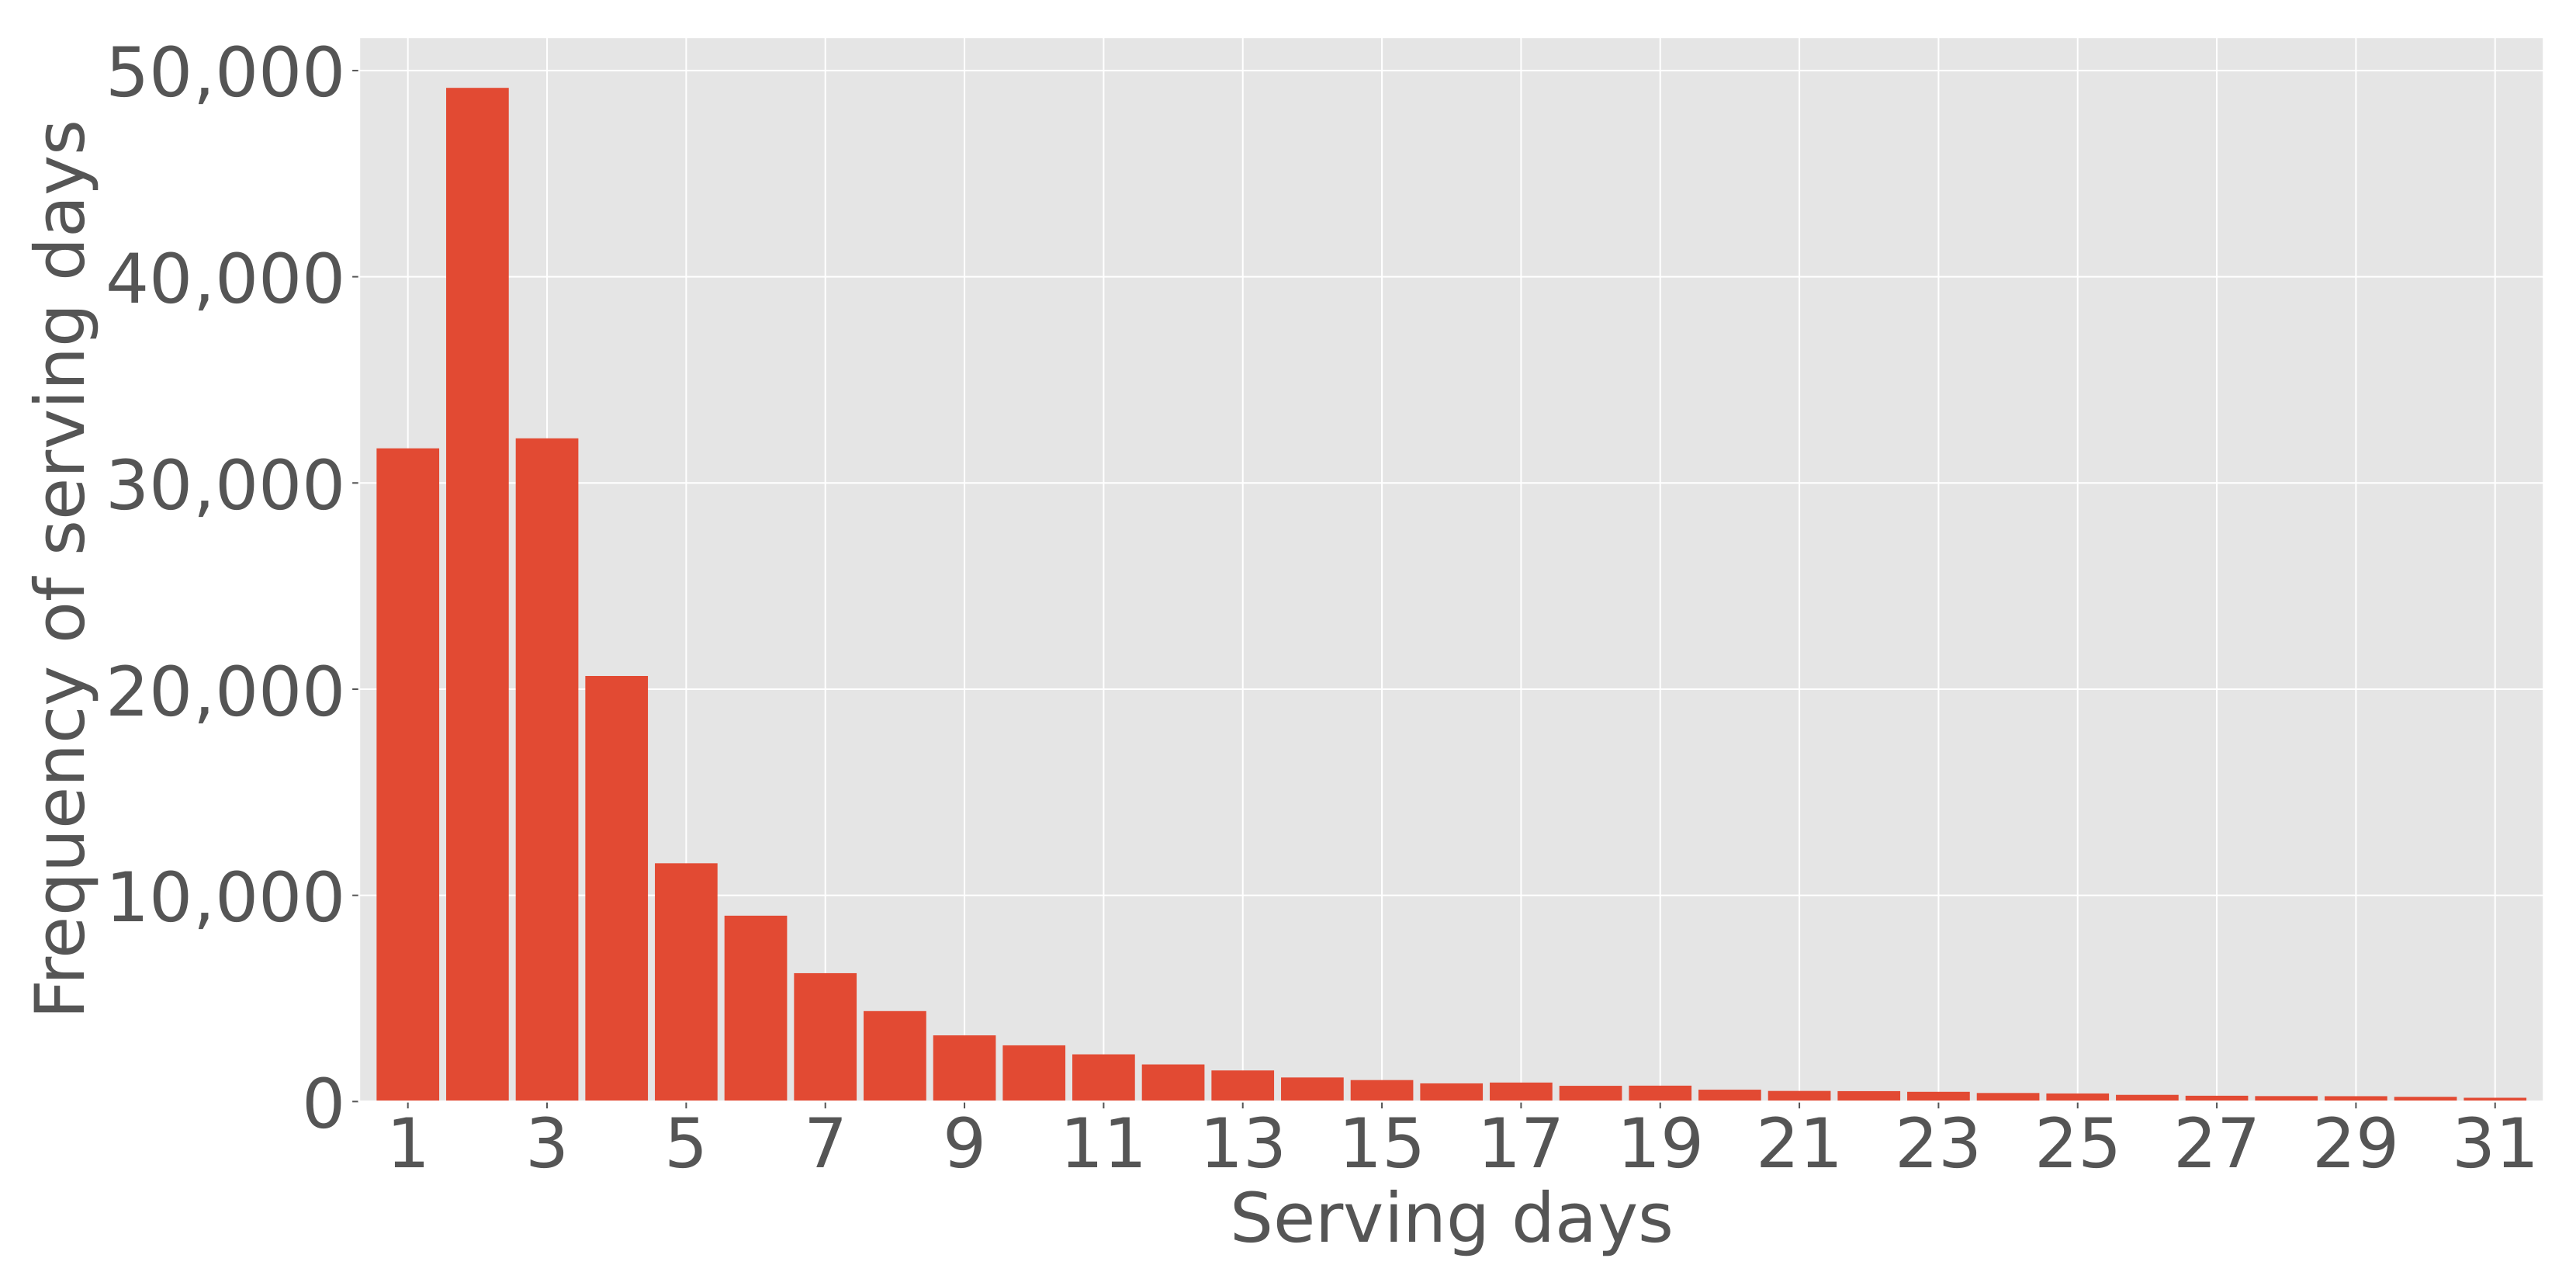
First, we analyzed the distribution of the serving days, which is the period of time since the ad creatives were served, as in
Figure 1. Many ad creatives were discontinued within three days of serving, and the continuous serving days of the ad creatives resemble an exponential distribution.
Table 3 shows the percentage of the number of ads served and their sales on the serving days. Although the number of ad creatives that were served for a long term is small, these creatives account for a large percentage of advertising sales. Specifically, comparing the serving days of
and
, the former has the majority of the ad creatives, but the latter accounts for the highest percentage of sales. From this difference, we assume that each discontinuation is caused by different operations. We discuss the differences in detail in
Section 3.3.
3.2.2. Variation in Sales
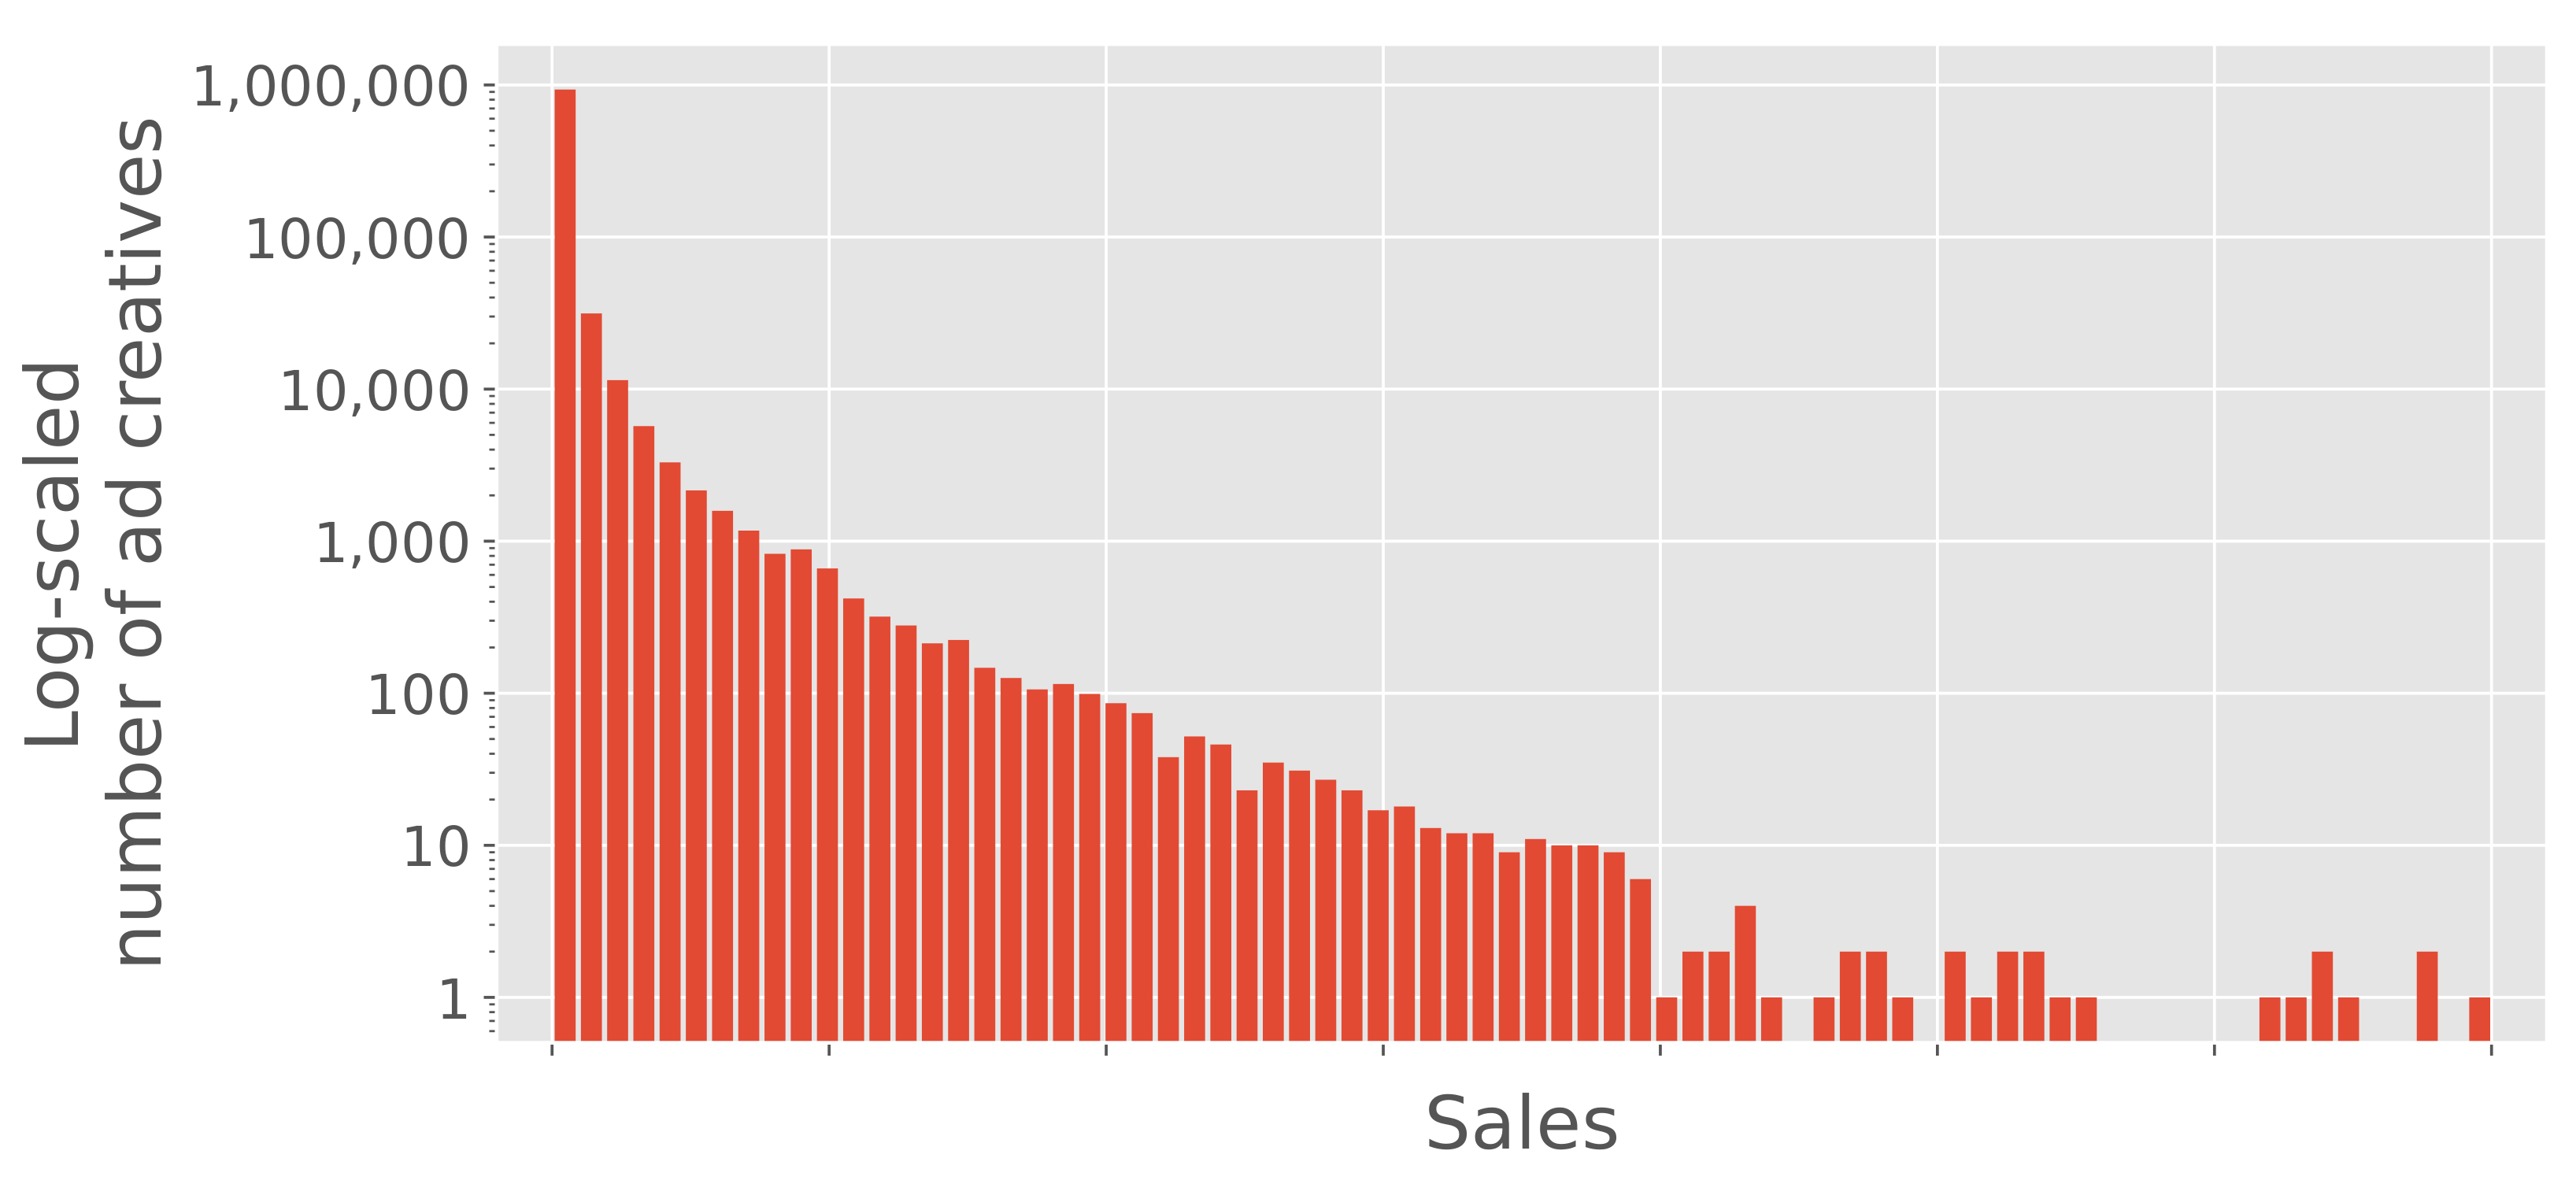
Figure 2 shows the histogram of ad creative sales in descending order. Sales vary considerably for each ad creative. Some are high-sales ad creatives, but most do not contribute to business revenue. Thus, the impact of each ad creative on the revenue is very different.
Accordingly, we attempted to reflect the high-sales ad creatives for the prediction framework. If the framework is trained with equal use of all ad creatives, the framework would reflect the trends of low-sales ad creatives excessively. We assumed that the construction of the framework requires the weighting of learning depending on sales. Therefore, we employ a CTR-weighting technique for the loss function, as described in
Section 4.4.
3.3. Two Types of Discontinuation
In this section, we discuss the differences between the two types of discontinuation based on the analysis in
Section 3.2. We also describe how the differences can be handled effectively using our framework.
The short-term discontinuation is labeled
cut-out. In digital advertising, a best practice is to create various patterns of ad creatives and look for effective ones by serving them. Clearly, it is not easy to find an effective pattern, and thus, many ad creatives are discontinued in the short-term. As
Figure 1 shows, many ad creatives are discontinued early on, but this selection process is conducted manually. Thus, it is a burden on the operation loads. In fact, automation of the process has significant cost advantages (i.e., both time and money) from a business perspective.
In contrast, the discontinuation of an ad creative after it has been served for a long-term period is called
wear-out [
16]. Wear-out occurs when the ad creatives are overexposed to customers and response drops. The discontinuation of long-running ad creatives damages sales; however, the wear-out of ads is inevitable. Thus, ad operators are tasked with creating new compelling ad creatives for their replacement. Ad operators prioritize this task by estimating wear-out, which heavily depends on the operator’s experience. Thus, by predicting wear-out, we expect that the sales loss could be minimized. In terms of ad operations, predicting wear-out has a different role from predicting cut-out.
In short, cut-out occurs when the user is not interested, and wear-out occurs when the user becomes fatigued. The operations involved in each type of discontinuation also differ. In the case of a cut-out, the operator discontinues many inefficient ad creatives rapidly, whereas in the case of a wear-out, the operator estimates when an ad creative’s performance degrades. It is important that our framework predicts both types of discontinuation. Predicting cut-out (for the short term) can save human effort and enable efficient advertising operations. Predicting wear-out (for the long term) can have a significant impact on business revenue.
The properties of these two types of discontinuation are so different that they should be considered as two different tasks. Therefore, we employ a two-term estimation technique (as described in
Section 4.3). Additionally, we analyze two real-world cases to evaluate the availability of each type of discontinuation (as described in
Section 6).
4. Methodology
We propose a multi-modal DNN-based framework for predicting the timing of the discontinuation of ad creatives, based on the idea of survival prediction. First, we provide an overview of our framework. Then, we introduce a loss function based on the hazard function for training our framework. Additionally, we employ two techniques to enhance the performance for the prediction: (1) a two-term estimation technique with MTL and (2) a CTR-weighting technique for the loss function. We believe that it is important to make the DNN model simpler, especially for business problems, and we introduce these effective learning techniques for the simple DNN model.
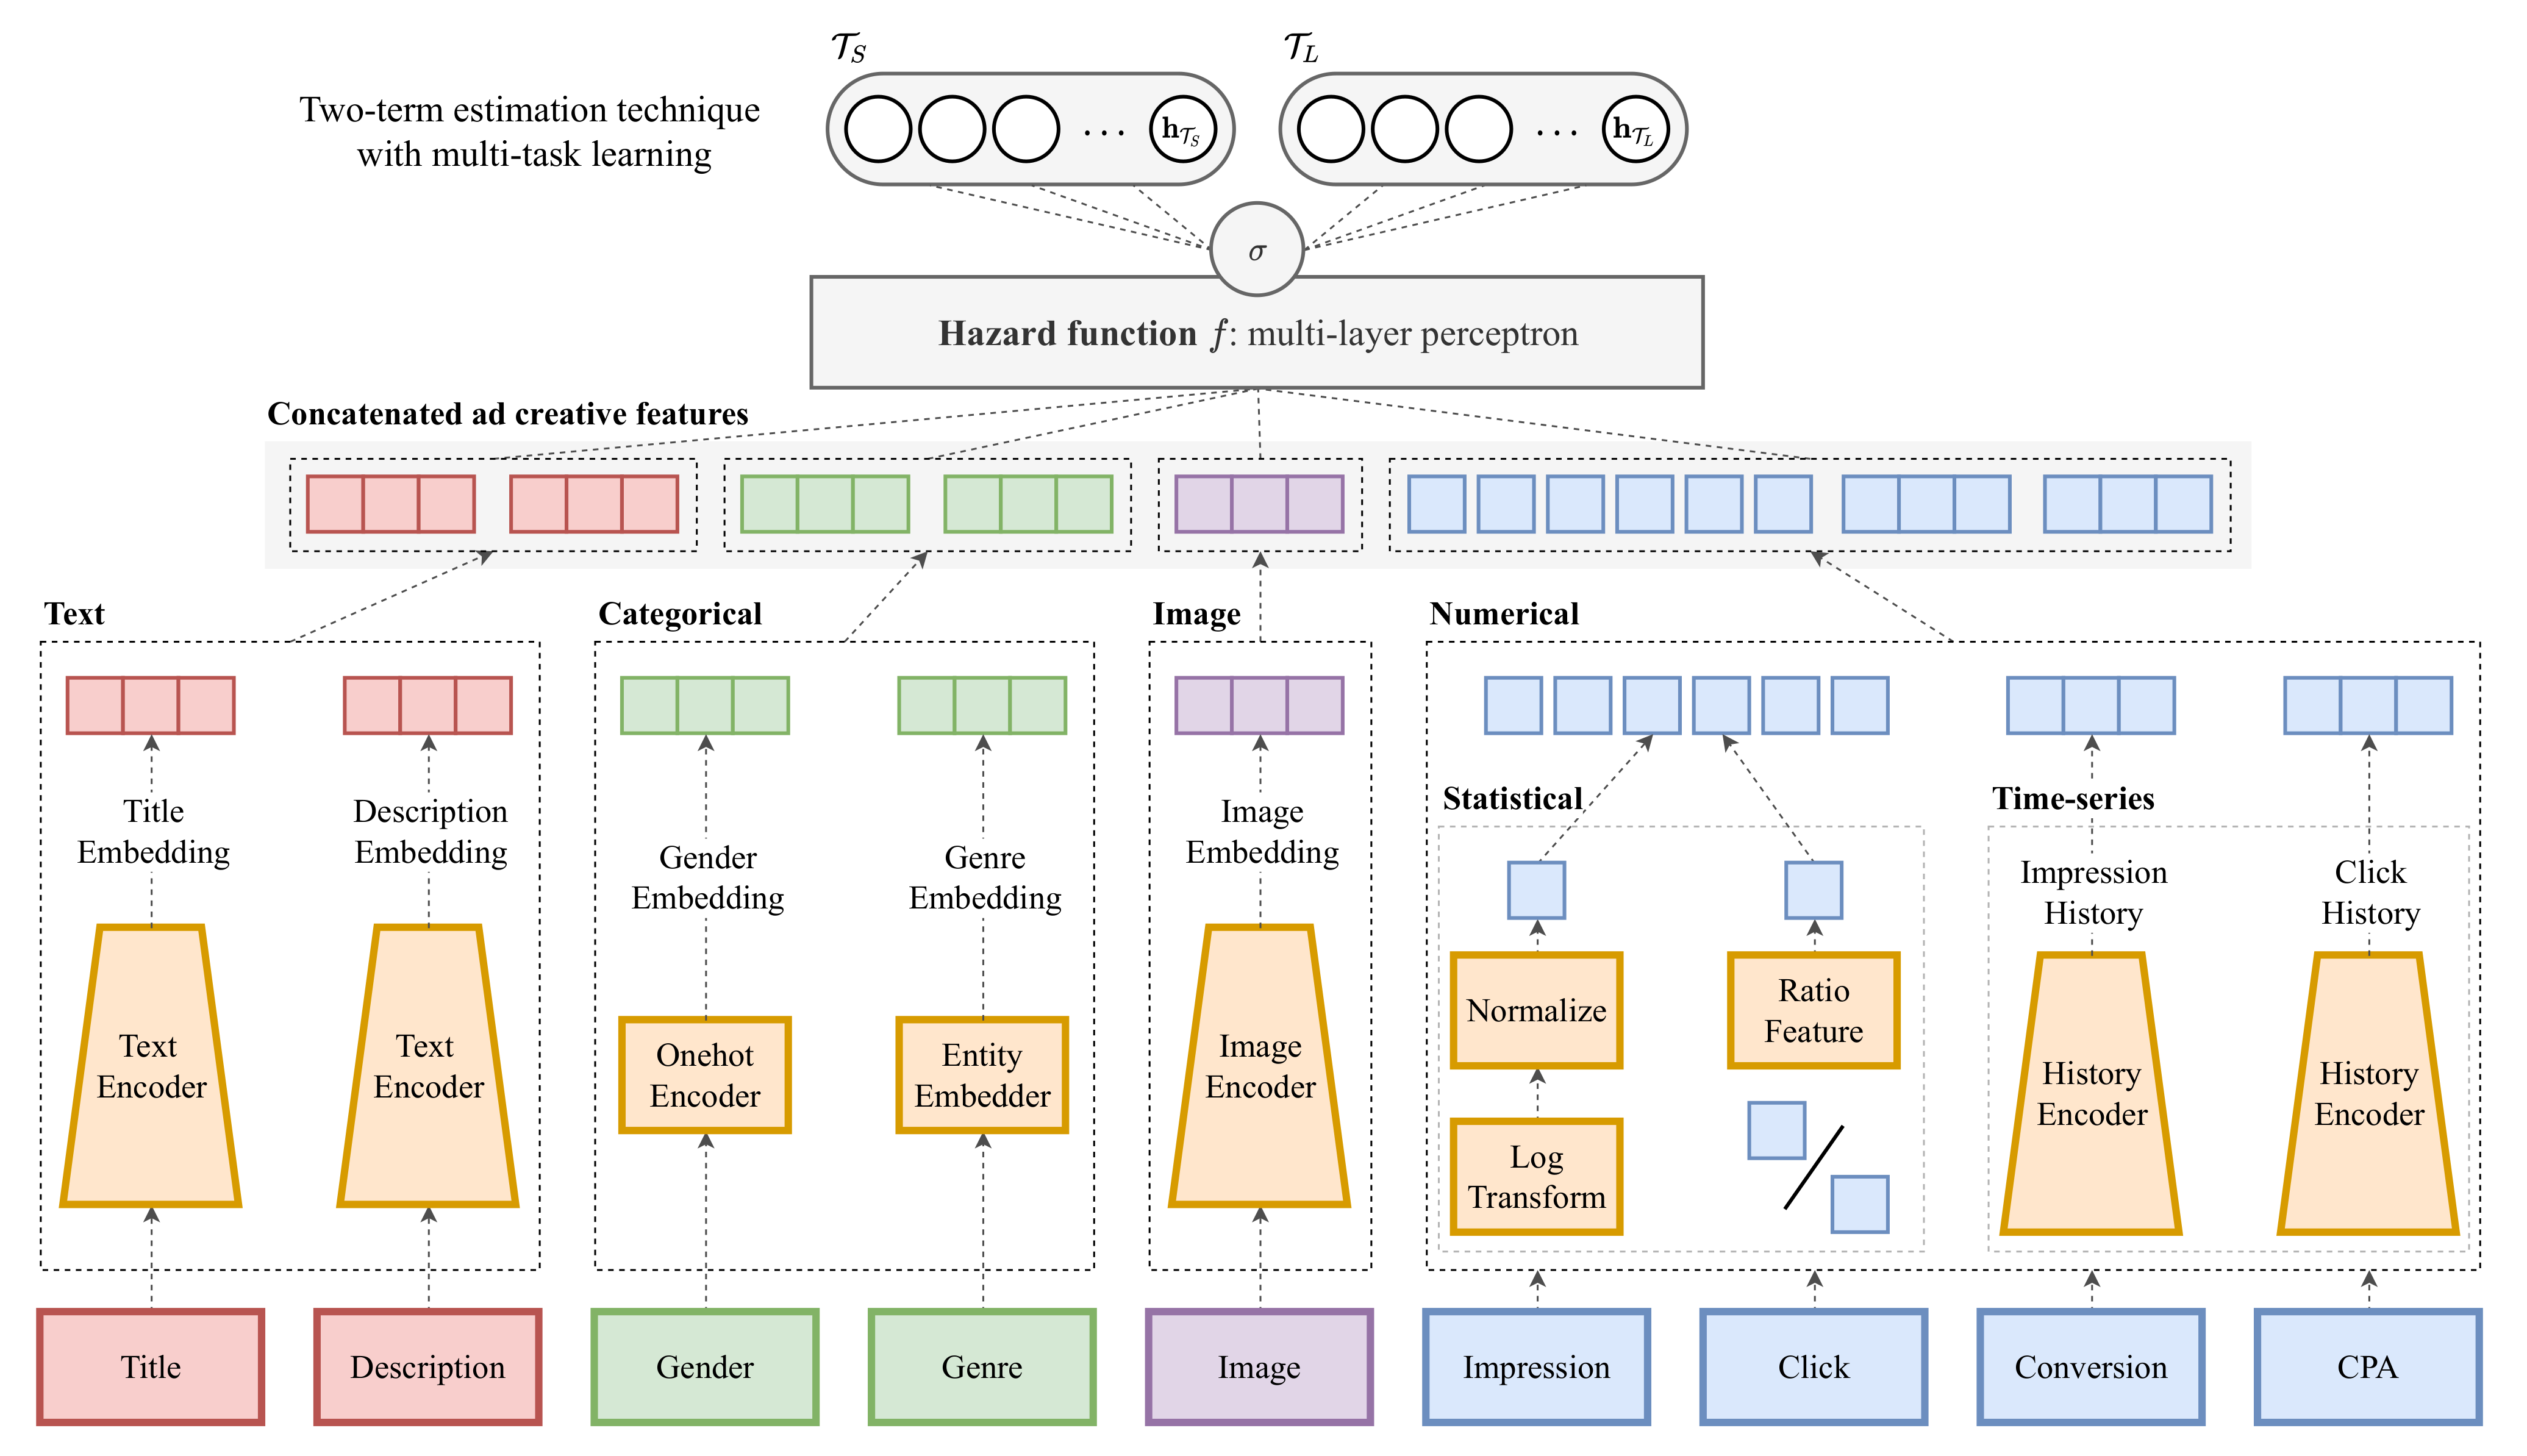
4.1. Overview of the Proposed Framework
Figure 3 shows the outline of our framework. For predicting the timing of ad creative discontinuation, we adopt and integrate the hazard function, which is based on the discrete-time survival prediction strategy [
28]. From the input ad creative
observed in time
t, our framework outputs hazard probability
for
L pre-defined time intervals
t such that
,
, ⋯,
through hazard function
with sigmoid function
:
The details of how the function is learned are in described in
Section 4.2.
The input to our framework is ad creative observed in time t; the framework uses the four types of features that constitute an ad creative: text features (e.g., title, description), categorical features (e.g., gender of the serving target, genre of the ad creative), image features (e.g., the image attached to the ad creative), and numerical features (e.g., the number of impressions, clicks, conversions, and the CPA for the ad creative), which include statistical features and time-series features. to are invariant with time interval t; varies with t due to the serving performance.
For the input features, each type of feature is encoded according to the type, such as text embeddings
, categorical embeddings
, image embeddings
, and numerical embeddings
. For all features, we performed conventional encoding and aggregation as well as encoding based on DNN techniques. Due to the space limitation, the details of these input features and encoding processes are presented in
Appendix A. Additionally, we briefly mention the properties of the features obtained by these encoding processes in the section.
For predicting the hazard probability, the encoded features are finally integrated using a multi-layer perceptron (MLP) to estimate the serving days of an ad creative in the pre-defined time intervals:
4.2. Learning the Hazard Function for Ad Creative Discontinuation
We describe the problem settings of the hazard function in discrete-time survival prediction and how it can be learned for ad discontinuation. The hazard function can model the main variable of interest as the time to an event. To predict the timing of discontinuation, we are interested in discrete problems because currently discontinuation is done manually in real-world scenarios.
In discrete-time survival prediction, the follow-up time is broken up into time intervals, which are often right-closed and left-open. Let
denote the time at which the event occurs,
index the time intervals, and
and
denote the lower and upper bounds of the
l-th time interval, respectively. The hazard probability within the
l-th time interval is defined as follows:
Here, the time interval is the same setting defined in
Section 4.1.
The hazard probability can be modeled as a function of covariates to assess the effect of covariates on the time to the event of interest. It is our belief that this property is appropriate for the discontinuation of ad creatives. The hazard probability of the observation surviving the
l-th time interval
is equal to the
l-th output of the hazard function, which is equivalent to the following:
where
is the
l-th output of hazard function
.
The parameters are estimated through the maximization of the likelihood function for the discrete survival prediction strategy [
28]. The likelihood is written as follows:
where
is the number of time intervals that was observed, and
is the event indicator within the
l-th time interval, which is equal to 1 if the event occurs within that interval, and 0 otherwise. To maximize the likelihood function, we minimized the following negative log-likelihood:
The full log-likelihood is the sum of the log-likelihood for each data and we minimize the log-likelihood by mini-batch gradient decent.
4.3. Two-Term Estimation Technique: For Short- and Long-Term Discontinuations
We employ a two-term estimation technique to improve the performance for the two types of discontinuations (cut-out and wear-out). To account for the difference between the two types of discontinuations, we train two prediction models by setting different time intervals for each model. We call these two models the short-term model and the long-term model, respectively.
The short-term model learns the cut-out features, and the long-term model learns the wear-out features. In the short-term model, for time interval , which has intervals, the target log-likelihood is defined as . In the long-term model, for time interval , which has intervals, the target log-likelihood is defined as . Training with these different time intervals for each model is expected to enable learning of different properties of short- and long-term discontinuation, which will provide better predictions.
The MTL allows us to train short-term and long-term models in a unified single model. In applying this technique to our framework to train the model, we used the following two likelihoods:
where
is a regularization coefficient that controls the balance between the two loss functions. In this study, we set
to 0.5. As the fraction of short-term discontinuation is much larger than that of long-term discontinuation, tuning hyperparameter
would yield better performance. The two hazard probabilities for the short- and long-term time intervals outputted from the MTL technique can be merged, multiplying by the last interval of the short-term time interval and the beginning of the long-term time intervals, to the last time interval of the long-term time intervals. We used this result as the overall model of MTL with short- and long-term time intervals.
In particular,
and
were set to be as follows:
The time intervals for the short- and the long-term model were defined based on observations of a dataset in which most ads were discontinued in about 10 days or 120 days, respectively, under the assumption [
28] that it was effective to make the interval width exponential.
4.4. CTR-Weighting Technique for the Hazard-Based Loss Function
We employ a CTR-weighting technique for the hazard function-based loss function. It is important to capture the features of ad creatives that have a high CTR, because this is known to contribute to business revenues, as stated in
Section 3.2. Thus, we utilize the weighting technique to the loss function with the CTR of ad creatives:
where
and generally takes the value
. Thus, we added one to this value to prevent the loss value from becoming too small for data with a low CTR. For comparison, we used the impression-weighting technique
with the same settings as the CTR-weighting technique. (Using sales directly as a weighting should be avoided in terms of business aspects because it would be too significantly affected by an advertiser’s business).
In the MTL, to apply our CTR-weighting technique, we used the following likelihood:
5. Offline Experiments
In this section, we describe offline experiments with standard metrics using already-observed (i.e., offline) data. First, we explain the motivation and tasks of the offline experiments. Then, we describe the evaluation criteria of the experiment. The results of the evaluation according to the criteria will be presented and discussed.
5.1. Motivation and Tasks of Offline Experiments
The purpose of the offline experiments is to evaluate whether our framework can correctly predict ad discontinuation using observed data. To this end, we used the real-world dataset of ad creatives shown in
Section 3. The discontinuation date of the ad creative was defined as the date on which the ad operator discontinued it manually. The dataset was divided into a training set, a validation set, and a test set in a campaign-based and stratified fashion (In most advertising systems, advertisements are served in units of campaigns, and multiple creatives with similar trends are developed in a campaign. Thus, to avoid data leakage due to potential similarity, we divided the dataset depending on the campaigns), comprising 600,000, 200,000, and 200,000 ad creatives, respectively.
5.2. Evaluation Criteria of Offline Experiments
We evaluated our framework on the following aspects: (1) comparison with the conventional survival prediction-based methods and its suitable metrics, and (2) comparison with the classification and regression frameworks. Regarding the former, considering our framework draws on the idea from survival prediction, we follow the evaluation in a survival prediction manner. For the latter, we evaluate the prediction made by the hazard function in our framework.
5.2.1. Survival Prediction-Based Models with CI
For the performance evaluation, we employed a CI [
9], which is the standard measure for model assessment in survival prediction strategies. A CI evaluates, for each random pair, the probability that the two predicted survival times will be in the same order as the actual survival time. For context, CI = 0.5 is the average CI of a random prediction, whereas CI = 1.0 is the perfect ranking of a prediction. We believe that this measure is sufficient to evaluate the framework based on our survival prediction.
From a business perspective, it is important to accurately predict the duration of top-selling creatives. The differences between the sales of the ad creatives were found to be substantial, as shown in
Section 3. To determine whether the high-value creatives were accurately predicted, we evaluated only the top 25% of the ad creatives in the dataset based on their sales values.
For comparison with the survival prediction technique, we used the conventional methods of the Cox time-varying proportional-hazards model (Cox time-varying PH) [
29] and random survival forest [
30]. The hyperparameters of these methods were tuned by the validation set, and we report the prediction results for the test set. To confirm the effects of our short-term and long-term models, we constructed an overall model that includes the time interval used in the short- and long-term models. The hyperparameter settings of our framework are described in
Appendix B.
5.2.2. Classification and Regression Frameworks with F1 Score
To validate our framework, we compared it with binary classification and regression frameworks that simulate direct discontinuation (Since both methods use the same model architecture (but with different loss functions), the computational costs are almost identical). This leads to an intuitive evaluation with other frameworks for which the CI cannot be directly applied. The details of the classification and regression models are described in
Appendix C.
We used the F1 score to compare our framework with the classification/regression frameworks. The only difference between our framework and the others is the output objective; our framework predicts the hazard probability at each time interval in a single-task model, whereas the classification/regression framework predicts whether to discontinue at the time interval in each model.
5.3. Evaluation Results of Offline Experiments
In this section, we demonstrate the results of survival prediction-based models and classification/regression frameworks.
5.3.1. Comparison of Survival Prediction-Based Models
First, we compared the conventional method of the Cox time-varying PH and random survival forest in terms of the statistical and text features.
Table 4 shows in terms of the CI. We can regard a model with the same features (i.e., the statistical and text features) under a single-task setting as a baseline based on our DNN. Compared the DNN baseline with the conventional methods, our DNN-based framework showed better performance, with an approximate 10-point gain. By using our framework, not only can the performance be improved, but various features, such as image and time-series features, can be accounted for as well. Furthermore, comparing our DNN baseline with the full model of our framework (i.e., the model with all features under multi-task setting), we can confirm an average improvement of 3 points in prediction performance.
For the short- and long-term models, the models that incorporated all features, such as image features, text features, and time-series features, had the best scores by an average of approximately 4 points. In the short-term model, the text and image features contributed more compared with the long-term model. However, in the long-term model, the time-series features contributed more than in the short-term model. These differences are in line with the trends of the two types of discontinuation. The effect of time-series data is described in
Appendix D.
Compared with the models where the short- and long-term models were trained individually, we observed even better performance in the model that was trained simultaneously with MTL. The performance improved significantly by approximately 5 points and 13 points in the short- and long-term models, respectively. MTL further boosted the overall performance, with a clear improvement of about 17 points.
Table 5 shows the MTL model performance comparison to confirm the effect of the CTR- and impression-weighting techniques. By introducing the CTR-weighting technique, the prediction performance was improved in the short-term, long-term, and overall models. The impression-weighting technique performed better than the vanilla model (e.g., without any weighting for the loss) but did not show a better performance compared with the CTR-weighting technique.
In the short-term model with CTR weighting, the CI showed an improvement of approximately 3 points, and in the long-term model, the improvement was approximately 2 points. The improvement in performance was observed even when impression weighting was introduced; however, the performance improved more when the CTR-weighting technique was introduced. We assume that the large variance in the number of impressions is the reason for the difference between these scores. Thus, weighting with CTR enables training for more accurate prediction.
5.3.2. Comparison of Classification and Regression Frameworks
Table 6 compares our framework and classification/regression frameworks. Compared with other frameworks, our framework performed better by approximately 40 points in the short-term model and by 60 points in the long-term model. In the short-term model, our framework achieved superior performance, about twice that of the other frameworks. In the long-term model, the classification/regression frameworks did not appear to perform well. Based on these results, our hazard function-based approach represents an effective method for predicting ad creative discontinuation problems.
5.4. Discussion of Offline Experiments
We discuss the following three points: (1) the effect of input features on prediction performance, (2) the effect of two-term estimation with MTL and CTR-weighting Technique, and (3) the comparison of our hazard function-based framework and classification/regression framework.
5.4.1. The Effect of Input Features on Prediction Performance
In our framework, the effective feature of the prediction of short- and long-term ad discontinuation is different. In the short-term model under the single-task setting, the text and image features that make up the ad creative contribute to the prediction. The short-term discontinuation (i.e., cut-out) may be caused by many users who are not immediately interested in the ad creatives. Since the text and image affect the user’s impression of the ad creative, this result reflects characteristics of the short-term discontinuation. In the long-term model, the time-series feature contribute to the prediction. The long-term discontinuation (i.e., wear-out) is caused by the user getting fatigued, as described in
Section 3. This is due to the fact that users have been repeatedly interacting with similar or the same ads, and thus the CPA has been decreasing. Since the time-series feature captures the user’s fatigue by change of the ad performance, this result reflects characteristics of the long-term discontinuation. As a result, we confirmed that each input feature contributes to the prediction of both cut-out and wear-out appropriately.
5.4.2. The Effect of Two-Term Estimation with MTL and CTR-Weighting Technique
Ad creative discontinuations are of two types with different characteristics, as described in
Section 3. To accurately predict the appropriate timing for the discontinuations, we introduce MTL into our two-term estimation technique. Additionally, we introduce the CTR-weighting technique to learn more valuable ad creative features. We confirmed that these techniques contribute to the prediction of ad creative discontinuation.
For ad creative discontinuation that has two different types of characteristics, we demonstrated that the model with our two-term estimation technique is superior to the single (overall) model. The short- and long-term models trained by the two-term estimation technique achieved much higher prediction performance than the single overall model, which included both short- and long-term time intervals. Furthermore, we found that training a unified model of these two-term models by MTL achieved better performance than the short- and long-term models alone. We believe that the unified model with MTL can learn the fine-grained property of short- and long-term discontinuation than the single overall model.
Our CTR-weighting technique is expected to learn more valuable ad creative features accurately. The results showed that our model was a more accurate predictor with CTR-weighting loss than without it. It improved the accuracy of the prediction of discontinuation of top-selling ad creatives and the overall accuracy. Consequently, it can be assumed that accurate training of effective ad creatives will have a positive effect on the overall prediction.
5.4.3. Our Hazard Function-Based Framework vs. Classification/Regression Framework
Our framework achieves much higher prediction performance for the ad discontinuation prediction problem by introducing the hazard function instead of the conventional classification/regression framework. We assume that there are two reasons due to the property of the discontinuation problem: (1) the data imbalance and (2) the time dependence of the discontinuation. Regarding the data imbalance, most of the ad creatives were discontinued early. If the classification/regression framework is trained on such data, it may output only biased predictions. Regarding the time dependence of the discontinuation, the probability of the ad creative discontinuation increases as time goes on. The classification/regression framework does not have the assumption of time dependency, while the hazard function-based framework is known to have the assumption.
We consider that the hazard function appropriately captures the property of the two reasons derived from the ad creative discontinuation problem. In contrast, the classification/regression framework does not seem to sufficiently handle the problems of the data imbalance and the time dependence. In particular, the classification- and regression-based long-term models may output only discontinuation, which may be why the F1 score is low. Furthermore, as ad creatives tend to be discontinued due to their decreasing effectiveness of serving over time, our framework, which can consider the discontinuation probability at the previous time interval, is considered to function effectively.
6. Case Studies
6.1. Motivation and Tasks of the Case Studies
As our goal is to support ad operations (specifically ad discontinuation), we needed to verify how effective our framework is in practical cases. In
Section 5, we confirmed that our framework performs well for predicting the ad creative discontinuation. However, we should evaluate with other criteria in addition to the traditional performance criteria in survival prediction such as CI.
In this section, we evaluate the availability of our framework on two real-world cases according to the following research questions using as yet unobserved data:
RQ1: How does the efficiency of our framework for discontinued ad creatives compare to that of human operation?
RQ2: How close is the order of the ad discontinuation based on the framework’s predictions to the actual manual order?
In the first case, we evaluate the cut-out (i.e., short-term) performance of our framework. Our purpose in the short-term is to reduce the operation loads on the operators from having to discontinue many ad creatives manually. We confirm how the efficiency changes when the ad is discontinued according to our framework, compared with that under manual operation. In the second case, we evaluate the wear-out (i.e., long-term) performance. Ad operators must prioritize tasks that create new compelling ad creatives to replace of long-running ads, as described in
Section 3.3. Therefore, it is crucial to identify an appropriate order for ad discontinuation in the ad business.
For the evaluation, we use the best model identified in
Section 5. When the hazard probability from the model exceeds 0.9 for the first time, we consider that the ad creative has been discontinued in the time interval. The two practical cases are analyzed for another period to confirm the time robustness with 400,000 ad creatives for three months, unlike in the offline experiments. (These data were sampled randomly to ensure confidentiality).
6.2. Evaluation Criteria of the Case Studies
To evaluate our framework more closely against real-world ad operations, we conducted case studies in terms of CPA (While we understand the importance of the volume metric of the ads, we keep it private for business reasons because the metric is closely linked to real-world commercial systems) and the order in which the ad creative is discontinued. The evaluation results with the criteria respond to the aforementioned research questions. We describe the details of these criteria below.
6.2.1. CPA Ratio: The Ratio of the Actual CPA to the Target CPA
We introduce practical metrics to assess the performance of ad creatives. One of the major metrics for deciding discontinuation in ad operation is the
CPA ratio, which measures the efficiency of the CPA. We use this metric as the baseline for the experiments. The CPA ratio is defined as follows:
The actual CPA is calculated based on the number of sales and conversions and is the indicator of how much the ad creative costs compared with the conversions. The target CPA is the CPA that the advertiser wants. This metric measures CPA efficiency, which represents both the costs and volume. We should avoid simply evaluating a low CPA because it would reduce the exposure of the ad when the CPA is low. Advertisers are expected to minimize the volume within their budgets. We believe that the CPA ratio can be used to evaluate both the cost and volume.
The CPA ratio should not be high but not low either. When the metric is low, the setting of the cost can be satisfied, but the volume can be increased by allowing a higher actual CPA. The closer the CPA ratio is to 1, the more profitable it is for the advertiser and the media. This metric is actually used by ad operators to decide whether discontinue ad creatives. We assume that evaluation based on this metric is similar to professional operator decisions.
6.2.2. The Order of Ad Discontinuation
We evaluated the order of discontinuation for RQ2. To prepare for the sudden discontinuation of long-running ad creatives, it is necessary to ascertain to evaluate whether our framework can accurately predict the order in which ads are discontinued. To evaluate the order of ad discontinuation, we compared the normalized discounted cumulative gain (NDCG) [
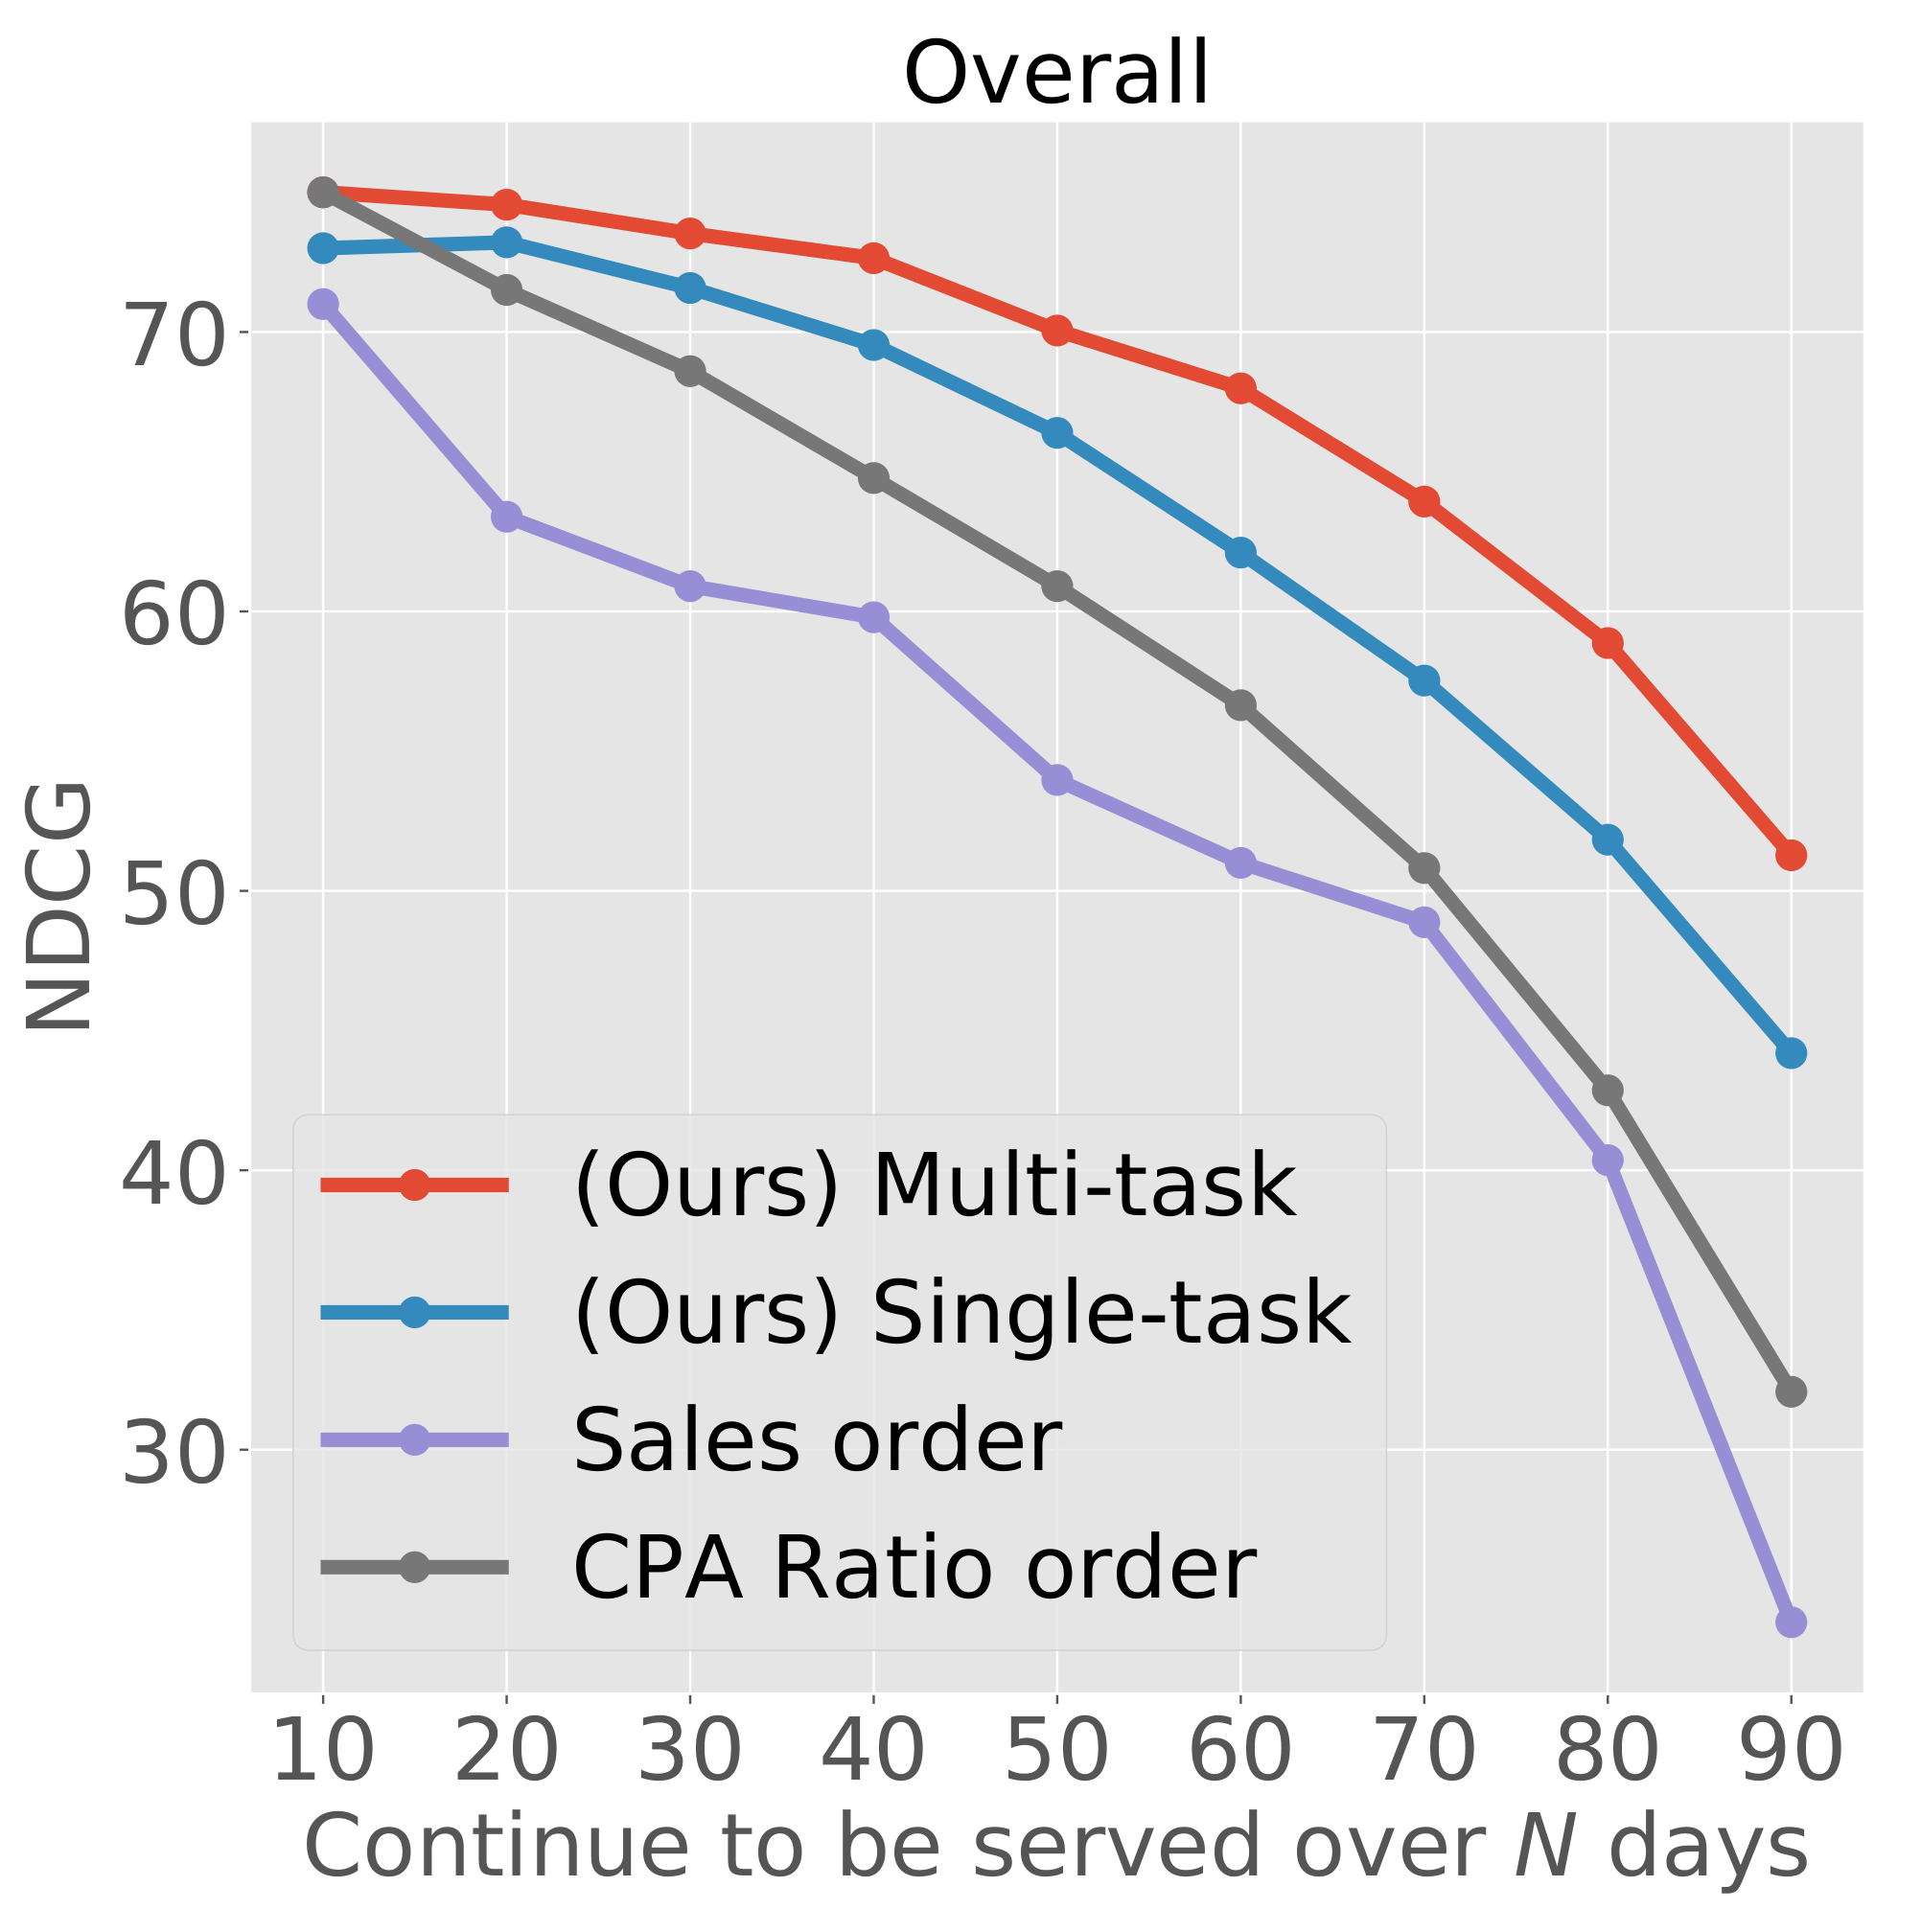
31]. The NDCG is calculated for ad creatives in the order in which they are discontinued by the ad operator and in the order in which our framework predicts discontinuations.
6.3. Evaluation Results of the Case Studies
In this section, we demonstrate the results of CPA ratios and discontinuation-order evaluation. The results suggest that our framework could support human operators.
6.3.1. Comparison of CPA Ratios
To answer RQ1, we evaluated the CPA efficiency if the ad operators decide to discontinue ad creatives according to our framework. Our framework predicted the discontinuation date based on only one day of data from serving. The CPA ratios of our framework are calculated based on the predicted discontinuation date, and the ratios for human performance are calculated based on the actual discontinuation date. We note that the discontinuations by human decision used the performance after the fist day, contrary to our framework. This experiment assumed the cut-out case, and thus, we evaluated the output of the short-term model, as described in
Section 6.1.
Table 7 shows the comparison of the CPA ratios. Compared to the best model under the single-task setting, the best model under the multi-task setting successfully predicted the discontinuation with a CPA ratio close to one. Furthermore, the multi-task model shows better performance of discontinuation in terms of the CPA ratio than the human operator’s decision. Overall, we confirmed that the single- and multi-task models have the same level of human performance.
6.3.2. Comparison of the Discontinuation-Order Evaluation
To answer RQ2, we determined how close the discontinuation order predicted by our framework was to the actual discontinuation order. Correctly predicting which ads are likely to discontinue allows ad operators to set operational priorities. This experiment assumed the wear-out case; hence we evaluated the output of the long-term model, as described in
Section 6.1.
To decide on a discontinuation order using our framework, we utilized the predicted discontinuation date and the hazard probability. To predict the wear-out case, our framework used only the first 10 days of data from serving. In each time interval, we sorted ad creatives based on the probability, and we concatenated the ordered ad creatives in each time interval.
To compare the evaluation results, we introduced two practical rule-based indicators, which are similar to practical operations. One was to sort by sales, namely, sales order. The business is seriously affected if an ad with high sales is discontinued. The other was to sort by the CPA ratio, namely, the CPA ratio order, because ads with a high CPA ratio are easy to discontinue. These indicators are considered to be correlated with human decision-making. (Ad operators usually monitor these indicators daily).
Figure 4 shows the NDCG of the prediction of our framework and the actual discontinuation orders for each continuous serving day. This experiment targeted ad creatives that have been served for more than 10 days. Each evaluation was conducted every 10 days for ad creatives within continuous serving days. For example, when the
x-axis value was 20, the
y-axis showed the NDCG value with ad creatives with 20 or more days of continuous serving. This evaluation determined how accurately we could predict future discontinuation.
6.4. Discussion of the Case Studies
We discuss the results of the case study in terms of the CPA ratio and the order of ad discontinuation. These lead to the answers to RQ1 and RQ2, respectively.
6.4.1. RQ1: Perspective of CPA Ratio
In
Table 7, we confirmed that both single- and multi-task models outperform the performance of the human operator. Because the performance of our models does not use unseen future data, which are used in the human performance, we posit that the same level of the performance is sufficient. This result suggests that, even if we decide the discontinuation using the prediction of our framework, the CPA efficiency does not get worse.
Clearly, the performance after ad discontinuation cannot be known, and thus, when the prediction result comes after the actual discontinuation date, the CPA ratio is the same as the actual CPA ratio. We posit that this problem does not affect our purpose, as our proposal is not to outperform but rather support human decision-making.
To answerRQ1, when our framework discontinues an ad creative, the CPA efficiency is almost equal to human operation.
6.4.2. RQ2: Perspective of the Order of Ad Discontinuation
Overall, our framework provided appropriate predictions of the discontinuation order compared with sales- and CPA ratio-based metrics. The CPA ratio and our framework exhibited the same performance for the first 10 days. However, when the number of serving days was increased, our framework performed better. In other words, the CPA ratio is suitable indicator for predicting which ad will be discontinued in the near future but cannot predict the discontinuation days in the long term, unlike our framework. Because it is important to plan priorities using long-term predictions, our framework plays an important role in prioritizing ad operations.
To answer
RQ2, our framework achieves a closer prediction of the order of the actual discontinuation than practical indicators.
7. Limitation and Future Work
Our framework has been deployed in our production environment, and we engage in regular discussions with the operations team to figure out ways to further improve the operation efficiency. Throughout the operation with the proposed framework, we found some issues/limitations related to the model itself and operation using our framework. One issue with the model is that it requires some experience in setting the appropriate time interval for the two-term estimation. In the experiments, we determined time intervals that were empirically known to perform well. The remaining issue in the operation is how to set the threshold for the discontinuation against the predicted probability by the framework. For these issues, we must work with experienced operators to work out the final operational approach. In the future, by analyzing the prediction results, we intend to establish the best practice to utilize the result and publish our framework for customers. Additionally, although this may be one way to address the above limitation, we intend to train a model that rewards the operator’s discontinuation behavior based on reinforcement learning.
8. Conclusions
Ad creative discontinuation has a major role in ad operations. Although ad operation efficiency using ML methods is an active research topic, there have been few practical studies regarding how to predict the appropriate timing of ad creative discontinuation. To achieve this goal in a real-world environment, we first analyze 1,000,000 real-world ad creatives and found that there are two types/patterns of discontinuation. Based on the finding, we proposed a multi-modal DNN-based framework for predicting the timing of the discontinuation of ad creatives that draws on the idea of survival prediction. Our framework has a loss function based on the hazard function and contains the following two simple but novel techniques: (1) a two-term estimation technique with multi-task learning and (2) a CTR-weighting technique for the loss function.
Evaluations using the large-scale ad creatives confirmed that our two-term estimation technique significantly improves the prediction performance, and CTR-weighting technique further improved the performance. Compared with classification/regression frameworks, we observed that our framework performed notably better for predicting discontinuation. Additionally, for the two practical cases in the case studies, our framework achieved equivalent CPA efficiency with manual operation for short-term prediction and a higher NDCG with manual operation compared with other indicators using actual sales metrics (sales order, CPA ratio order) in long-term predictions. While the DNN-based architecture in our framework is not entirely novel, we addressed a crucial problem encountered in real-world ad operations and confirmed its feasibility in practical cases.
Author Contributions
Conceptualization, H.I. and Y.S.; Data curation, Y.S. and S.K.; Formal analysis, S.K. and Y.S.; Investigation, S.K. and Y.S.; Methodology, S.K. and Y.S.; Project administration, Y.S.; Software, S.K.; Supervision, H.I. and Y.S.; Validation, S.K., H.I. and Y.S.; Visualization, S.K.; Writing—original draft, S.K. and Y.S.; Writing—review and editing, H.I. and Y.S. All authors have read and agreed to the published version of the manuscript.
Funding
This work was partially supported by JSPS KAKENHI under Grant 21J14143.
Institutional Review Board Statement
Not applicable.
Informed Consent Statement
Not applicable.
Data Availability Statement
Not applicable.
Acknowledgments
We thank the Gunosy Ad Engineering team for their useful feedback and Hironori Yamamoto for helping us with the deployment of the proposed framework.
Conflicts of Interest
The authors declare no conflict of interest.
Appendix A. Detail of Features
Our framework used the four feature areas that constitute the ad creative: text features, categorical features, image features, and numerical features. The details of these input features and encoding processes are described as follows.
Appendix A.1. Text Features
Text features were extracted from the title and description of an ad creative. Specifically, words were embedded from the title and the description and encoded by a text encoder using a recurrent neural network (RNN)-based model. For the RNN-based model, we used bi-directional long short-term memory (LSTM) [
32] in our implementation. We can expect the extracted text features to consider the context of the ad creative text. Subsequently, title embedding and description embedding were calculated as the last hidden state of each text encoder as:
and
. Finally, we concatenated these embeddings to text embeddings:
Appendix A.2. Categorical Features
Categorical features were extracted from the gender of the serving target and the genre of the ad creative. Specifically, the gender of the distribution target was extracted as
, which was one-hot encoded. Additionally, the genre of the ad creative, which was embedded by entity embedding method [
33], was extracted as
. We can expect the extracted categorical features to consider the demographic information of the target users. Finally, we combined these embeddings in categorical embeddings:
Appendix A.3. Image Features
Image features were extracted from an image of an ad creative. Specifically, image embedding
was obtained by encoding
sized ad image
using the ResNet34 [
34] pretrained by ImageNet:
We can expect the extracted image feature to consider the characteristics of the ad image.
Appendix A.4. Numerical Features
Numerical features include the number of impressions, clicks, and conversions and the CPA for an ad creative. The numerical features consist of statistical and time-series features.
The statistical feature is composed of statistical information about target date
t. The CTR was obtained from the number of impressions and the number of clicks, and the CVR was obtained from the number of clicks and the number of conversions. We used the following features as the statistical feature: the number of impressions
, clicks
, conversions
, the CTR
, the CVR
, and the CPA
. These features were normalized through logarithmic transformation. Finally, we concatenated these features as statistical embeddings:
Time-series features were extracted from impressions and clicks accumulated from the first day of serving to the target date
t based on statistical features. Specifically, from the accumulated impressions and clicks, those encoded by the history encoder with different LSTM models were obtained as an impression history embedding
and a click history embedding
, respectively. These embeddings are the last hidden states encoded by the history encoder of the serving performance data up to time
t. Then, we combined these features into time-series embeddings:
Finally, we combined statistical embedding
and time-series embedding
into numerical embeddings:
We can expect the extracted numerical features to consider the both statistical and time-series properties of the ad creative.
Appendix B. Implementation Details
The texts of the ad creatives, written in Japanese, were split into words using MeCab [
35], which is a type of morphological analysis for Japanese texts. The custom dictionary mecab-ipadic-neologd (
https://github.com/neologd/mecab-ipadic-neologd), which includes various neologisms, was used as the dictionary.
We used pre-trained word2vec [
36] to initialize the word embedding layer in our framework. For the text encoder,
and
were set to 16. For the history encoder,
and
were set to 10. For an image encoder, we extracted 512 dimensional feature vectors. The feature vectors were then converted using a shallow MLP to
dimensional image features.
We used pycox (
https://github.com/havakv/pycox) to implement the base of our survival prediction framework. The mini-batch size was set to be 32, and the number of epochs was set to be 50. Adam [
37] was used for the model optimization.
In all experiments, we performed the evaluation on the test set only once. The experiments were conducted on an Ubuntu PC with one GeForce GTX 1080 Ti GPU. As our framework is relatively small, we ran the case studies on the CPU.
Regarding the deployment of our framework, we dockerized the implementation of our framework to work on Amazon Web Service (AWS). The prediction from our framework is output daily to a Google spreadsheet for discussion with the ad operation team.
Appendix C. Classification and Regression Frameworks
As binary classification models, we built models that predicted discontinuation after 3, 7, 30, and 90 days. We evaluated the predictions of the model specific to each time interval. In training the binary classification model, we used the binary cross entropy loss to train the model. For a fair comparison, we applied a CTR-weighting technique based on our idea to the comparison models.
Regarding the regression model, we built models for short-term and long-term. The regression models were trained on data with time intervals adjusted for short- and long-term intervals. For training the regression model, we used mean squared error loss to train the model. We used the time interval that was closest to the prediction made by the regression model as the final prediction. Similar to binary classification, we applied the CTR-weighting technique for a fair comparison.
The same architecture as our single-task model (as described in
Section 5) was used in these models, and the same features were used as inputs. Note here that we considered an evaluation based on the mean squared error, but we believe that the metrics and results presented in
Section 5 are more suitable for comparison.
Appendix D. Effects of Time-Series Data
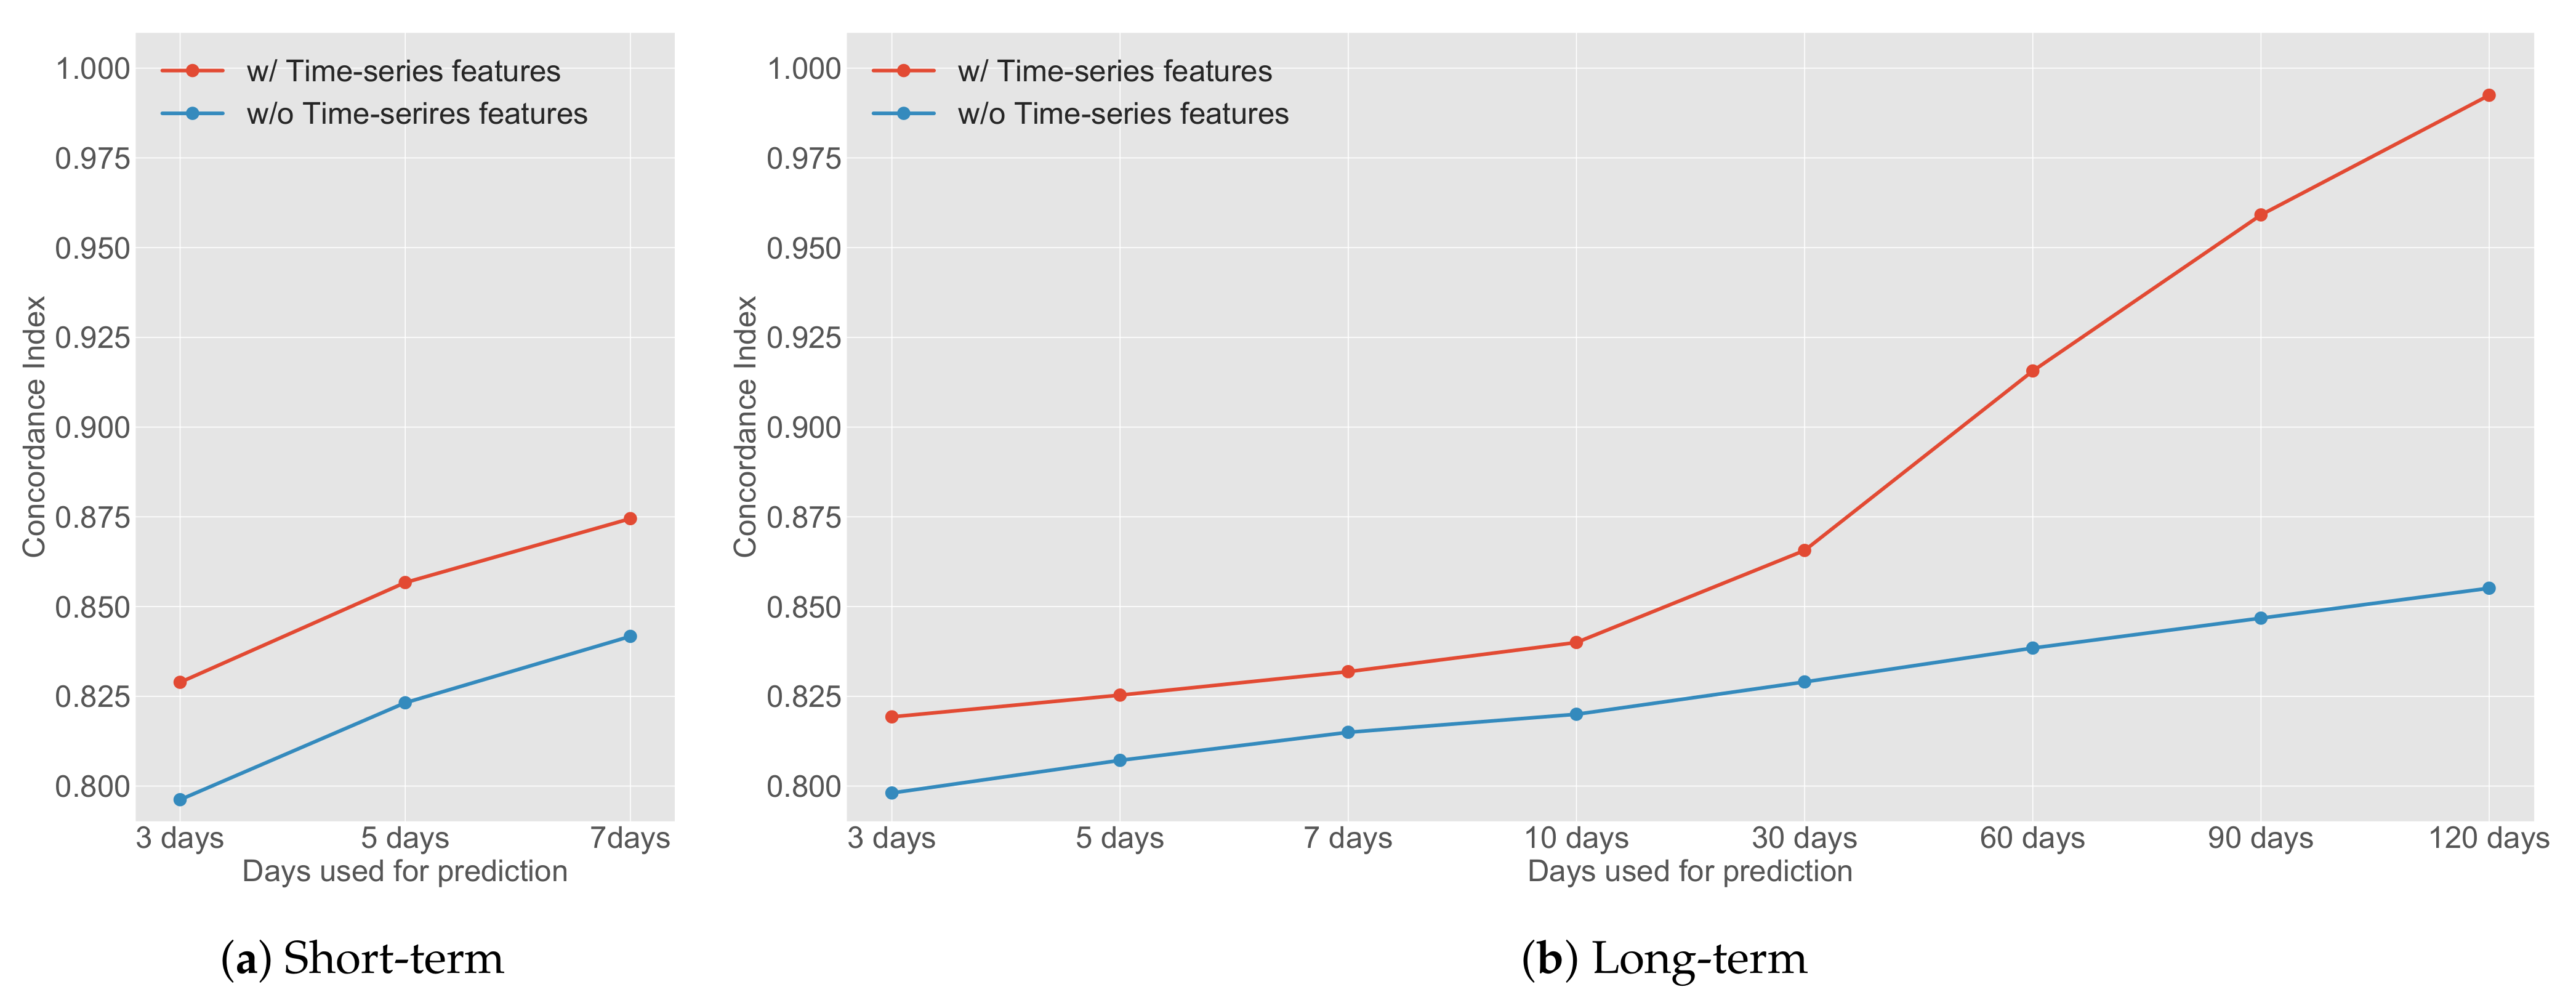
Figure A1 shows the effect on prediction performance of the time-series features, changing the number of days used for prediction.
Figure A1a shows the change in the CI in the short-term model. As described above, the model to which the time-series feature is input achieves a higher score compared with the model to which no time-series feature is input. Additionally, as the number of days used for prediction increased, the prediction performance of each model improved.
Figure A1b shows the change in the CI in the long-term model. Similar to the short-term model, in the long-term setting, the model with time-series features has a higher score compared with the model without time-series features. Therefore, it appears that the effectiveness of the time-series features for prediction increases with time.
Figure A1.
Comparison of the effects of time-series features with daily changes in ad discontinuation prediction task. For the short- and the long-term models, the more days that can be used for prediction, the higher the performance. In the long-term model, when used for prediction for 30 days or more, the concordance index is dramatically improved compared with the case where the time-series feature is not used.
References
- Kitada, S.; Iyatomi, H.; Seki, Y. Conversion Prediction Using Multi-Task Conditional Attention Networks to Support the Creation of Effective Ad Creatives. In Proceedings of the 25th ACM SIGKDD International Conference on Knowledge Discovery & Data Mining (KDD ’19), Anchorage, AK, USA, 4–8 August 2019; pp. 2069–2077. [Google Scholar]
- Mishra, S.; Verma, M.; Gligorijevic, J. Guiding creative design in online advertising. In Proceedings of the 13th ACM Conference on Recommender Systems (RecSys ’19), Copenhagen, Denmark, 16–20 September 2019; pp. 418–422. [Google Scholar]
- Maehara, T.; Narita, A.; Baba, J.; Kawabata, T. Optimal Bidding Strategy for Brand Advertising. In Proceedings of the 27th International Joint Conference on Artificial Intelligence (IJCAI ’18), Stockholm, Sweden, 13–19 July 2018; pp. 424–432. [Google Scholar]
- Yang, X.; Li, Y.; Wang, H.; Wu, D.; Tan, Q.; Xu, J.; Gai, K. Bid Optimization by Multivariable Control in Display Advertising. In Proceedings of the 25th ACM SIGKDD International Conference on Knowledge Discovery & Data Mining (KDD ’19), Anchorage, AK, USA, 4–8 August 2019; pp. 1966–1974. [Google Scholar]
- Doan, K.D.; Yadav, P.; Reddy, C.K. Adversarial Factorization Autoencoder for Look-Alike Modeling. In Proceedings of the 28th ACM International Conference on Information & Knowledge Management (CIKM ’19), Beijing, China, 3–7 November 2019; pp. 2803–2812. [Google Scholar]
- Shatnawi, M.; Mohamed, N. Statistical Techniques for Online Personalized Advertising: A Survey. In Proceedings of the 27th Annual ACM Symposium on Applied Computing (SAC ’12), Trento, Italy, 26–30 March 2012; pp. 680–687. [Google Scholar]
- Chen, J.; Sun, B.; Li, H.; Lu, H.; Hua, X.S. Deep CTR Prediction in Display Advertising. In Proceedings of the 24th ACM international conference on Multimedia (MM ’16), Amsterdam, The Netherlands, 15–19 October 2016; pp. 811–820. [Google Scholar]
- Caruana, R. Multitask learning. Mach. Learn. 1997, 28, 41–75. [Google Scholar] [CrossRef]
- Harrell, F.E.; Califf, R.M.; Pryor, D.B.; Lee, K.L.; Rosati, R.A. Evaluating the yield of medical tests. JAMA 1982, 247, 2543–2546. [Google Scholar] [CrossRef] [PubMed]
- Thomaidou, S.; Lourentzou, I.; Katsivelis-Perakis, P.; Vazirgiannis, M. Automated Snippet Generation for Online Advertising. In Proceedings of the 22nd ACM International Conference on Information & Knowledge Management (CIKM ’13), San Francisco, CA, USA, 27 October–1 November 2013; pp. 1841–1844. [Google Scholar]
- Hughes, J.W.; Chang, K.h.; Zhang, R. Generating Better Search Engine Text Advertisements with Deep Reinforcement Learning. In Proceedings of the 25th ACM SIGKDD International Conference on Knowledge Discovery & Data Mining (KDD ’19), Anchorage, AK, USA, 4–8 August 2019; pp. 2269–2277. [Google Scholar]
- Zhang, W.; Zhang, Y.; Gao, B.; Yu, Y.; Yuan, X.; Liu, T.Y. Joint Optimization of Bid and Budget Allocation in Sponsored Search. In Proceedings of the 18th ACM SIGKDD International Conference on Knowledge Discovery & Data Mining (KDD ’12), Beijing, China, 12–16 August 2012; pp. 1177–1185. [Google Scholar]
- Ren, K.; Zhang, W.; Chang, K.; Rong, Y.; Yu, Y.; Wang, J. Bidding Machine: Learning to Bid for Directly Optimizing Profits in Display Advertising. IEEE Trans. Knowl. Data Eng. 2018, 30, 645–659. [Google Scholar] [CrossRef] [Green Version]
- Shen, J.; Geyik, S.C.; Dasdan, A. Effective Audience Extension in Online Advertising. In Proceedings of the 21st ACM SIGKDD International Conference on Knowledge Discovery & Data Mining (KDD ’15), Sydney, NSW, Australia, 10–13 August 2015; pp. 2099–2108. [Google Scholar]
- Liu, H.; Pardoe, D.; Liu, K.; Thakur, M.; Cao, F.; Li, C. Audience Expansion for Online Social Network Advertising. In Proceedings of the 22nd ACM SIGKDD International Conference on Knowledge Discovery & Data Mining (KDD ’16), San Francisco, CA, USA, 13–17 August 2016; pp. 165–174. [Google Scholar]
- Pechmann, C.; Stewart, D.W. Advertising Repetition: A Critical Review of Wearin and Wearout. Curr. Issues Res. Advert. 1988, 11, 285–329. [Google Scholar]
- Moriwaki, D.; Fujita, K.; Yasui, S.; Hoshino, T. Fatigue-Aware Ad Creative Selection. In Proceedings of the 13th International Conference on Web Search and Data Mining (WSDM ’20) Workshop on State-based User Modelling (SUM), Houston, TX, USA, 3–7 February 2020. [Google Scholar]
- Tang, L.; Rosales, R.; Singh, A.; Agarwal, D. Automatic Ad Format Selection via Contextual Bandits. In Proceedings of the 22nd ACM International Conference on Information & Knowledge Management (CIKM ’13), San Francisco, CA, USA, 27 October–1 November 2013; pp. 1587–1594. [Google Scholar]
- Dirick, L.; Claeskens, G.; Baesens, B. Time to default in credit scoring using survival analysis: A benchmark study. J. Oper. Res. Soc. 2017, 68, 652–665. [Google Scholar] [CrossRef] [Green Version]
- Van den Poel, D.; Lariviere, B. Customer attrition analysis for financial services using proportional hazard models. Eur. J. Oper. Res. 2004, 157, 196–217. [Google Scholar] [CrossRef]
- Chapelle, O. Modeling delayed feedback in display advertising. In Proceedings of the 20th ACM SIGKDD International Conference on Knowledge Discovery & Data Mining (KDD ’14), New York, NY, USA, 24–27 August 2014; pp. 1097–1105. [Google Scholar]
- Barbieri, N.; Silvestri, F.; Lalmas, M. Improving post-click user engagement on native ads via survival analysis. In Proceedings of the 25th International Conference on World Wide Web (WWW ’16), Montréa, QC, Canada, 11–15 April 2016; pp. 761–770. [Google Scholar]
- Wu, W.C.H.; Yeh, M.Y.; Chen, M.S. Predicting winning price in real time bidding with censored data. In Proceedings of the 21st ACM SIGKDD International Conference on Knowledge Discovery & Data Mining (KDD ’15), Sydney, NSW, Australia, 10–13 August 2015; pp. 1305–1314. [Google Scholar]
- Kalra, A.; Wang, C.; Borcea, C.; Chen, Y. Reserve Price Failure Rate Prediction with Header Bidding in Display Advertising. In Proceedings of the 25th ACM SIGKDD International Conference on Knowledge Discovery & Data Mining (KDD ’19), Anchorage, AK, USA, 4–8 August 2019; pp. 2819–2827. [Google Scholar]
- Zhong, C.; Tibshirani, R. Survival analysis as a classification problem. arXiv 2019, arXiv:1909.11171. [Google Scholar]
- Katzman, J.L.; Shaham, U.; Cloninger, A.; Bates, J.; Jiang, T.; Kluger, Y. DeepSurv: Personalized treatment recommender system using a Cox proportional hazards deep neural network. BMC Med. Res. Methodol. 2018, 18, 24. [Google Scholar] [CrossRef] [PubMed]
- Lee, C.; Zame, W.R.; Yoon, J.; van der Schaar, M. Deephit: A deep learning approach to survival analysis with competing risks. In Proceedings of the 32nd AAAI Conference on Artificial Intelligence (AAAI ’18), New Orleans, LA, USA, 2–7 February 2018; Volume 32, pp. 2314–2321. [Google Scholar]
- Gensheimer, M.F.; Narasimhan, B. A scalable discrete-time survival model for neural networks. PeerJ 2019, 7, e6257. [Google Scholar] [CrossRef] [PubMed]
- Fisher, L.D.; Lin, D.Y. Time-dependent covariates in the Cox proportional-hazards regression model. Annu. Rev. Public Health 1999, 20, 145–157. [Google Scholar] [CrossRef] [PubMed] [Green Version]
- Ishwaran, H.; Kogalur, U.B.; Blackstone, E.H.; Lauer, M.S. Random survival forests. Ann. Appl. Stat. 2008, 2, 841–860. [Google Scholar] [CrossRef]
- Järvelin, K.; Kekäläinen, J. Cumulated gain-based evaluation of IR techniques. ACM Trans. Inf. Syst. 2002, 20, 422–446. [Google Scholar] [CrossRef]
- Hochreiter, S.; Schmidhuber, J. Long short-term memory. Neural Comput. 1997, 9, 1735–1780. [Google Scholar] [CrossRef] [PubMed]
- Guo, C.; Berkhahn, F. Entity embeddings of categorical variables. arXiv 2016, arXiv:1604.06737. [Google Scholar]
- He, K.; Zhang, X.; Ren, S.; Sun, J. Deep residual learning for image recognition. In Proceedings of the 2016 IEEE Conference on Computer Vision and Pattern Recognition (CVPR ’16), Las Vegas, NV, USA, 27–30 June 2016; pp. 770–778. [Google Scholar]
- Kudo, T. Mecab: Yet Another Part-of-Speech and Morphological Analyzer. 2006. Available online: https://taku910.github.io/mecab/ (accessed on 28 March 2022).
- Suzuki, M.; Matsuda, K.; Sekine, S.; Okazaki, N.; Inui, K. A joint neural model for fine-grained named entity classification of wikipedia articles. IEICE Trans. Inf. Syst. 2018, 101, 73–81. [Google Scholar] [CrossRef] [Green Version]
- Kingma, D.P.; Ba, J. Adam: A method for stochastic optimization. arXiv 2014, arXiv:1412.6980. [Google Scholar]
Figure 1.
Frequency distribution of the number of serving days of the overall ad creatives in one month. Many creatives were discontinued within three days of serving.
Figure 1.
Frequency distribution of the number of serving days of the overall ad creatives in one month. Many creatives were discontinued within three days of serving.
Figure 2.
Histogram of ad creative sales in descending order. The y-axis is log-scaled. Most ad creatives are included in the first bin. Because the sales data are confidential, the actual values cannot be disclosed. Thus, relative values are used here.
Figure 2.
Histogram of ad creative sales in descending order. The y-axis is log-scaled. Most ad creatives are included in the first bin. Because the sales data are confidential, the actual values cannot be disclosed. Thus, relative values are used here.
Figure 3.
Outline of our framework that exploits a hazard function, which draws on the idea of survival prediction, to predict the discontinuation of ad creatives. The input includes the four types of features: text, categorical, image, and numerical features. The output is the hazard probability, which includes whether the target ad creative has been discontinued in each time interval.
Figure 4.
Comparison of the NDCG for the following prediction and actual discontinuation orders for each continuous serving days: by our framework (i.e., single-task and multi-task) and by the rule-based on the sales and the CPA ratio.
Figure 4.
Comparison of the NDCG for the following prediction and actual discontinuation orders for each continuous serving days: by our framework (i.e., single-task and multi-task) and by the rule-based on the sales and the CPA ratio.
Table 1.
Classification of machine learning methods to support the process for ad creatives.
Table 1.
Classification of machine learning methods to support the process for ad creatives.
| The Process for Ad Creative Operations | Machine Learning Methods to Support the Operation Process |
|---|
| (1) Creating and submitting to the ad platform | Thomaidou et al. [10], Kitada et al. [1], Hughes et al. [11], Mishra et al. [2] |
| (2) Serving to users on the platform | Zhang et al. [12], Shen et al. [14], Maehara et al. [3], Doan et al. [5] |
| (3) Discontinuing when the ads become less effective | Our study |
Table 2.
Examples included in the ad creative dataset. In addition to the Japanese title text and description text shown here, the dataset contains categorical information (e.g., gender of the serving target, genre of the ad creative), images (e.g., the image attached to the ad creative), and numerical information (e.g., the number of impressions, clicks, conversions, and the CPA for the ad creative).
| Title Text | Description Text | Gender | Genre |
|---|
1000万人が選ぶ!みんなが選んでいるゲーム10選
Chosen by 10 million people! The 10 games played by everyone. | スマホに入れておきたい無料ゲームを限定でご紹介
Exclusively introducing free games
that you will want to install on mobile phone. | All | Game App. |
−10 kgのダイエットに成功!痩せる理由はこれ
Success in −10 kg weight loss! This is the reason for getting slim. | 女子に人気の方法で効果を実感
Realizing the effects popular among girls. | Female | Healthy Food |
有名芸能人監修。簡単にできる料理レシピ本
Supervised by a famous celebrity; easy cookbook. | 一人暮らしの男性にもおすすめ!
Recommended for men living alone! | Male | Books |
Table 3.
Percentage of the number of ads served and their sales on the serving date. While 80% of the ads were discontinued within a week of serving, the 20% of the ads that were served for more than a week accounted for 80% of the sales.
Table 3.
Percentage of the number of ads served and their sales on the serving date. While 80% of the ads were discontinued within a week of serving, the 20% of the ads that were served for more than a week accounted for 80% of the sales.
| Serving Days | Number of Ads [%] | Sales [%] |
|---|
| 42.66 | 1.90 |
| 38.72 | 16.34 |
| 18.62 | 81.76 |
Table 4.
Comparison of concordance indexes with different time intervals and different features. The time interval was compared for the short term, long term, and the whole period. We calculated the concordance indexes using the prediction for all test data and the prediction for the top 25% of sales data in the test data.
| Model | Feature | Concordance Index |
|---|
| Short Term | Long Term | Overall |
|---|
| Stat. | Text | Image | Time. | All | Top 25%
of Sales | All | Top 25%
of Sales | All | Top 25%
of Sales |
|---|
| Cox time-varying PH [29] | ✓ | ✓ | | | 0.6098 | 0.7293 | 0.6574 | 0.6932 | 0.5287 | 0.5320 |
| Random Survival Forest [30] | ✓ | ✓ | | | 0.6213 | 0.7578 | 0.6832 | 0.7294 | 0.5311 | 0.5487 |
| Our framework | Single-task | ✓ | ✓ | | | 0.7958 | 0.8262 | 0.7541 | 0.8001 | 0.5874 | 0.6001 |
| | | ✓ | | ✓ | | 0.7962 | 0.8232 | 0.7536 | 0.8045 | 0.5536 | 0.6045 |
| | | ✓ | | | ✓ | 0.7931 | 0.8346 | 0.7880 | 0.8397 | 0.5935 | 0.6101 |
| | | ✓ | ✓ | ✓ | | 0.7962 | 0.8313 | 0.7575 | 0.8113 | 0.5908 | 0.6113 |
| | | ✓ | ✓ | ✓ | ✓ | 0.8289 | 0.8640 | 0.7892 | 0.8456 | 0.6225 | 0.6456 |
| | Multi-task | ✓ | ✓ | ✓ | ✓ | 0.8700 | 0.8712 | 0.9228 | 0.9293 | 0.7915 | 0.8049 |
Table 5.
Comparison of prediction performance by proposed CTR-weighted loss in the multi-task model. We compared the vanilla model (without any special loss), , and .
Table 5.
Comparison of prediction performance by proposed CTR-weighted loss in the multi-task model. We compared the vanilla model (without any special loss), , and .
| Model | Concordance Index |
|---|
| Without | | |
|---|
| Short-term | 0.8700 | 0.8884 | 0.8958 |
| Long-term | 0.9228 | 0.9297 | 0.9390 |
| Overall | 0.7915 | 0.8060 | 0.8127 |
Table 6.
Comparison of the F1 score in discontinuation prediction after N days using the binary classification framework and regression framework.
Table 6.
Comparison of the F1 score in discontinuation prediction after N days using the binary classification framework and regression framework.
| | Short-Term | Long-Term |
|---|
| 3 Days | 7 Days | 30 Days | 90 Days |
|---|
| Classification framework | 0.3208 | 0.3106 | 0.1098 | 0.0980 |
| Regression framework | 0.3813 | 0.2852 | 0.0969 | 0.0735 |
| Our framework | 0.7988 | 0.7796 | 0.7287 | 0.7004 |
Table 7.
Comparison of the CPA ratios for predicting cut-out in the practical evaluation experiment. The CPA ratio is calculated as . The closer the CPA ratio is to 1, the more profitable it is for the advertiser and the media. Human performance is calculated on the day the ad operator discontinues the ad creative.
| Short-Term | Single-Task | Multi-Task | Human Performance |
|---|
| CPA ratio | 1.13 ± 0.92 | 1.12 ± 0.78 | 1.18 ± 0.46 |
| Publisher’s Note: MDPI stays neutral with regard to jurisdictional claims in published maps and institutional affiliations. |
© 2022 by the authors. Licensee MDPI, Basel, Switzerland. This article is an open access article distributed under the terms and conditions of the Creative Commons Attribution (CC BY) license (https://creativecommons.org/licenses/by/4.0/).


