Article

Differential Expression of MicroRNAs in Dark-Cutting Meat from Beef Carcasses

1
Department of Animal Science, Texas A&M University, College Station, TX 77843-2471, USA
2
Department of Mathematics and Statistics, Stephen F. Austin University, SFA Station, P.O. Box 13040, Nacogdoches, TX 75962, USA
3
Department of Veterinary Integrative Biosciences, Texas A&M University, College Station, TX 77843-4461, USA
*
Author to whom correspondence should be addressed.
Appl. Sci. 2022, 12(7), 3555; https://doi.org/10.3390/app12073555
Submission received: 27 February 2022 / Revised: 30 March 2022 / Accepted: 30 March 2022 / Published: 31 March 2022
(This article belongs to the Special Issue New Frontiers in Meat and Meat Products)

Abstract

:

Featured Application

This study represents a new approach for gaining insight into genetic regulatory mechanisms that drive development of dark-cutting meat in beef carcasses. This knowledge provides a step toward further elimination of this phenotype that remains a significant economic problem for the beef industry.

Abstract

“Dark-cutting” meat in beef carcasses can result from conditions such as long-term stress and depleted glycogen stores, but some aspects of the physiological mechanisms that cause dark-cutting phenotypes remain poorly understood. Certain responses to stress factors in fully developed tissues are known to be regulated by specific microRNAs. We investigated microRNA expression in Longissimus lumborum biopsies from carcasses derived from a contemporary group of 78 steers from which a high incidence of dark-cutting meat occurred. Our objective was to identify any potential microRNA signatures that reflect the impact of environmental factors and stresses on genetic signaling networks and result in dark-cutting beef (also known as dark, firm, and dry, or DFD) in some animals. MicroRNA expression was quantified by Illumina NextSeq small RNA sequencing. When RNA extracts from DFD muscle biopsy samples were compared with normal, non-DFD (NON) samples, 29 differentially expressed microRNAs were identified in which expression was at least 20% different in the DFD samples (DFD/NON fold ratio ≤0.8 or ≥1.2). When correction for multiple testing was applied, a single microRNA bta-miR-2422 was identified at a false discovery probability (FDR) of 5.4%. If FDR was relaxed to 30%, additional microRNAs were differentially expressed (bta-miR-10174-5p, bta-miR-1260b, bta-miR-144, bta-miR-142-5p, bta-miR-2285at, bta-miR-2285e, bta-miR-3613a). These microRNAs may play a role in regulating aspects of stress responses that ultimately result in dark-cutting beef carcasses.

1. Introduction

Minimizing stress and ensuring the overall well-being of food animals are necessary and important goals for all livestock producers. Such practices inevitably enhance production operations since reduction of both physiological and environmental stressors is known to improve beef carcass quality [1]. Environmental, psychological, and physical stress significantly increase the costly occurrence of dark-cutting beef, also known as dark, firm, and dry (DFD). Despite efforts to reduce handling and transport stress and improve management practices, DFD beef remains an industry problem. The attributes of DFD beef and its presumed causes have been described in great detail since the 1940s, and Lawrie [2] reported that its occurrence was noted as early as 1774. Although it is known that DFD meat can result from several factors including long-term stress and depleted glycogen stores, some aspects of the physiological mechanisms that cause DFD phenotypes remain poorly understood. In fact, in an extensive literature review, Ponnampalam and colleagues [3] suggested that DFD incidence could be potentially managed with better understanding of the impact and complex interactions of animal phenotype and stress factors with management practices. Six decades earlier, Lawrie [2] noted that effective prevention of DFD beef would depend on “concomitant progress of genetics and neuro-endocrinology.” In considering unexplored approaches and advances in genetics, unrelated research in other mammals has shown how profoundly microRNAs (miRNAs) can regulate the response to stress factors in fully developed tissues (e.g., [4,5]). We hypothesized that certain miRNA signatures expressed in skeletal muscle in response to environmental factors and stresses may regulate physiological networks that result in dark-cutting beef in certain predisposed animals. Better understanding of these phenotypes may enable actionable strategies—including both pre- and post-harvest opportunities—to reduce the economic impact of DFD incidence.
The appearance of DFD beef deviates from the bright, cherry red color desired by consumers, and may vary from slight discoloration to dark purple to nearly black in color [6]. In cattle that experience antemortem stress, muscle glycogen stores can become depleted. After harvest, a process of postmortem glycogen utilization typically occurs in the muscle tissue, resulting in lactic acid production and subsequent pH decline. In stressed animals, however, carcass pH remains high, resulting in de-oxygenated myoglobin and darker color [2,7,8]. Lawrie [2] also noted that certain rations, especially green grass, could cause undesirable color in beef. Grass-fed and grain-fed cattle have been shown to differ energetically, resulting in darker lean [9]. Mitochondrial respiration rate can also influence the DFD phenotype [10].
Occurrence of DFD has been shown to be a seasonal problem with great economic impact [8,11]. In 1946, Bratzler [6] noted a one percent dark cutter incidence in a 1939 survey and estimated Chicago packer economic loss at approximately $1 M at that time. Inflation-adjusted estimates would put that loss at $20.2 M in 2022. In the 2016 United States Beef Quality Audit, overall presence of dark-cutting carcasses was 1.9% [12]. The estimated incidence in the U.S. has fluctuated slightly over the past 20 years with 3.2% in 2011 [13], 1.9% in 2005 [14], and 2.3% in 2000 [15]. Current industry incidence of DFD at the largest U.S. beef packing plants is estimated at approximately 1%. Even at 1%, with an estimated discount averaging $281/head in 2020, the annual economic impact on the US beef industry, with 32.8 million cattle processed, is estimated at $95 to $100 million, demonstrating that dark cutting remains a significant problem. Moreover, this issue is not limited to the U.S. In Australia, for example, a more than 7% incidence of DFD can occur at certain times of year, particularly at the end of summer [11].
We were interested in exploring a potential role for miRNAs in regulating the occurrence of DFD meat. MicroRNAs are small (20–27 nt) RNA molecules that function as molecular rheostats to fine-tune the expression of genes as part of many physiological processes. These small molecules can regulate the function of entire networks of genes [16] and their existence adds layers of complexity to previous understanding of genetic mechanisms [17]. General understanding of the physiological implications of miRNAs is currently limited, and this area of research has not yet been widely explored in livestock species. We have investigated the importance of miRNAs on metabolic capacity in skeletal muscle from mice [18], and recently developed methods for isolation of plasma and muscle miRNAs from beef cattle [19]. Certain miRNAs are potent regulators of skeletal muscle growth and development.
In this project, we utilized muscle samples obtained from a contemporary group of steer carcasses that had an unusually high incidence of DFD meat, to investigate whether miRNA expression profiles were associated with this undesirable phenotype.

2. Materials and Methods

2.1. Animal and Tissue Resources

Tissue samples and phenotypes for this project derived from a beef cattle herd that was established as a designed genetic mapping population for carcass quality traits and female calf production phenotypes [20]. Bos indicusBos taurus steers (Cycle 1) for carcass evaluation were produced in a reciprocal F2 mating design from Angus (A) and Nellore (N) F1 sires and dams (Table 1). Angus-sired (AN; pairs of letters indicate the sire and dam breeds, respectively) and Nellore-sired (NA) parents were utilized, resulting in four parental breed-of-origin combinations (ANAN, ANNA, NAAN, NANA, where the first two letters indicate the sire, and the last two letters indicate the dam, Cycle 2). Contemporary Cycle 3 animals (from parents produced in Cycle 1) were also produced. Although these animals are all 50% Angus and 50% Nellore, the different breeding strategies used to produce them provide for potential genetic segregation for all traits of interest. Previous reports from our group investigated carcass traits of the Cycle 1 animals; this study utilized Cycle 2 and Cycle 3 animals reared during the same year.
Steers were spring-born, castrated at approximately 60 to 70 days of age, and weaned at an average of approximately 7 months of age. After weaning, they were penned together and remained a single group for the rest of their lives. The steers grazed native pastures for approximately 130 days after weaning, were transported 140 km to College Station, Texas, and were fed a growing diet there for approximately 100 days. They were then transported 190 km to a commercial feedlot in South Texas and fed for 170 days until harvest at a commercial processing facility in Corpus Christi, TX, USA. Immediately post-mortem, approximately 1 g of skeletal muscle was biopsied from the Longissimus lumborum (adjacent to the 12th rib steak taken for quality evaluation) of each animal. Muscle biopsies were flash frozen in liquid nitrogen and stored at −80 °C. Numerous carcass traits were obtained at harvest and after processing. For this contemporary group, 25 of the 78 beef carcasses unexpectedly exhibited the DFD phenotype.

2.2. RNA Extraction & Quantification

A modified version of the Molecular Research Center Inc. (MRC; Cincinnati, OH, USA) TRI reagent protocol was used for extraction of total RNA from each of the frozen L. lumborum skeletal muscle biopsies (n = 78) [21]. During RNA extraction, approximately 100–200 mg of each muscle sample was ground in liquid nitrogen in a ceramic mortar and pestle and homogenized in Tri-Reagent. Following extraction and purification, total RNA for each sample was quantified via spectrophotometry (NanoDrop ND-1000 spectrophotometer; ThermoFisher Scientific, Wilmington, DE, USA). Sample integrity was verified via capillary electrophoresis (Agilent 2100 Bioanalyzer; Agilent Technologies, Santa Clara, CA, USA) according to the manufacturer’s protocol. Samples were stored at −80 °C until further use.

2.3. Small RNA Sequencing

Total RNA was submitted to the Texas A&M Institute for Genome Sciences and Society (TIGSS) facility (College Station, TX, USA) for small RNA-sequencing. Prior to sequencing, each sample was re-quantified via fluorometer (Qubit 2.0, ThermoFisher Scientific, Waltham, MA, USA). Libraries of small RNAs were prepared with the NEXTflex® Small RNA-Seq kit v3 library kit (Bioo Scientific, Austin, TX, USA, a Perkin-Elmer company). This kit enables sequencing of the small RNA fraction and uses randomized bases at adapter ligation junctions to reduce bias. The quality of the small RNA libraries was evaluated via the Agilent 2200 TapeStation (Agilent Technologies, Santa Clara, CA, USA) prior to sequencing, as recommended by the manufacturer. The sequence (single-end 100 nt reads) was generated from the libraries via the Illumina NextSeq platform within two flow-cells (Illumina, San Diego, CA, USA). Raw sequence count data for each sample were deposited in NCBI’s Gene Expression Omnibus [22] and are accessible through GEO Series accession number GSE193003 and SRA Bioproject PRJNA794121 https://www.ncbi.nlm.nih.gov/geo/query/acc.cgi?acc=GSE193003 (accessed on 7 January 2022).

2.4. Bioinformatic and Statistical Analysis

Raw sequencing datafiles were transferred from the Illumina BaseSpace cloud-based storage system to the TAMU TIGSS High Performance Computing Cluster (HPCC) for further processing. The overall sequence quality of each sample was assessed via the FastQC program. Low-quality sequence data (Phred score < 20) [23] and the adapter sequences were removed with the Trimmomatic v. 0.32 genomic trimming program [24,25]. FASTA files from miRbase containing known Bos taurus sequence data for known precursor hairpins and mature miRNAs (miRNA hairpins = 1064 and mature miRNAs = 1030), the hairpin.bta.fa, and mature.bta.fa files (miRBase v.22.1) were uploaded to the TIGSS HPCC for further analyses [26]. Filtered sequence reads that passed initial quality control were mapped to precursor hairpins and mature miRNA sequences, then quantified via the mirDeep2 software package [27]. This process generated a miRNA expression profile for all mature miRNAs expressed in each sample. Sequence read counts were organized into an analysis matrix for comparison of NON (n = 53) and DFD (n = 25) samples.
Data were filtered to remove any miRNAs that possessed ≤10 count reads across all samples. Once filtered, the count matrix was normalized via DESeq2 software (v. 1.34.0) with the median of ratios method that scales the raw count data to account for sequencing depth, followed by differential expression analysis by using a generalized linear model [28,29,30]. With this approach, read counts were modelled to a negative binomial distribution and a Wald test was utilized for hypothesis testing to identify potentially differentially expressed transcripts. To correct for multiple testing, p-values generated by the Wald test were adjusted at a false discovery rate (FDR) of 5% according to the method of Benjamini-Hochberg [31,32]. An adjusted p ≤ 0.05 accompanied by a fold difference ≤0.8 or ≥1.2 was set as the cut-off for differentially expressed miRNAs. This cut-off reflects an expression difference between groups of at least 20% and a maximum of 5% probability of false discovery.

2.5. Institutional Approvals

This project utilized only post-mortem muscle biopsy samples. However, animal use protocol 2008-234 was approved by the Texas A&M Agricultural Animal Care and Use Committee for all project activities, including sample collection.

3. Results

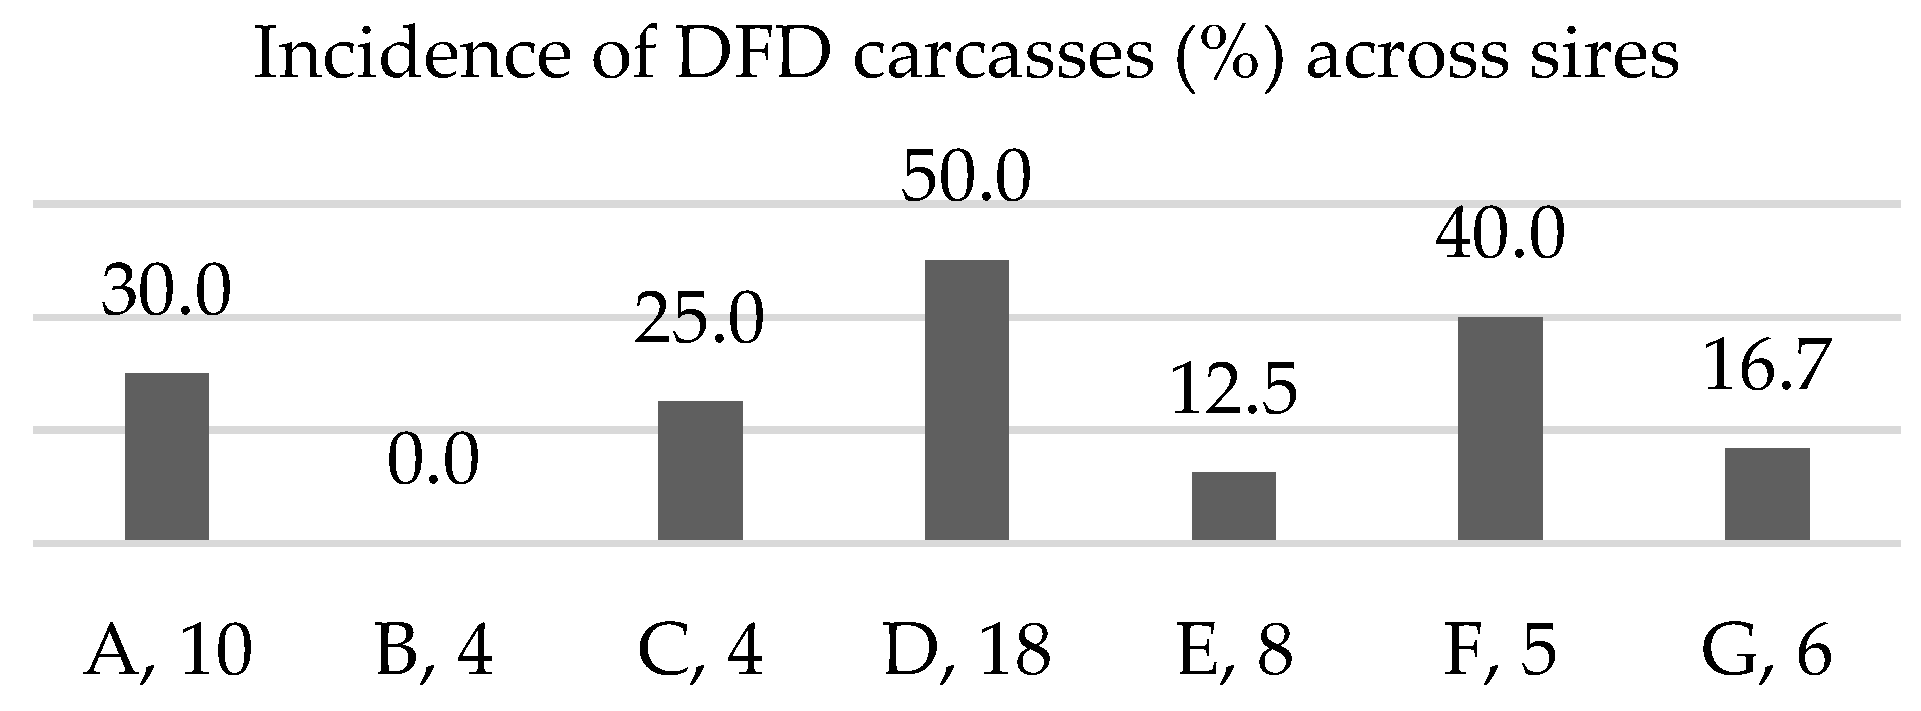
3.1. Family Distribution of Dark-Cutting Phenotype

From a contemporary group of 78 F2 and F3 steers that were part of a designed genetic mapping herd of Bos indicusBos taurus cattle, we unexpectedly observed a 32% incidence of DFD meat in carcasses following harvest. The distribution of incidence across sire groups (Figure 1) demonstrated a likely genetic component contributing to DFD occurrence.

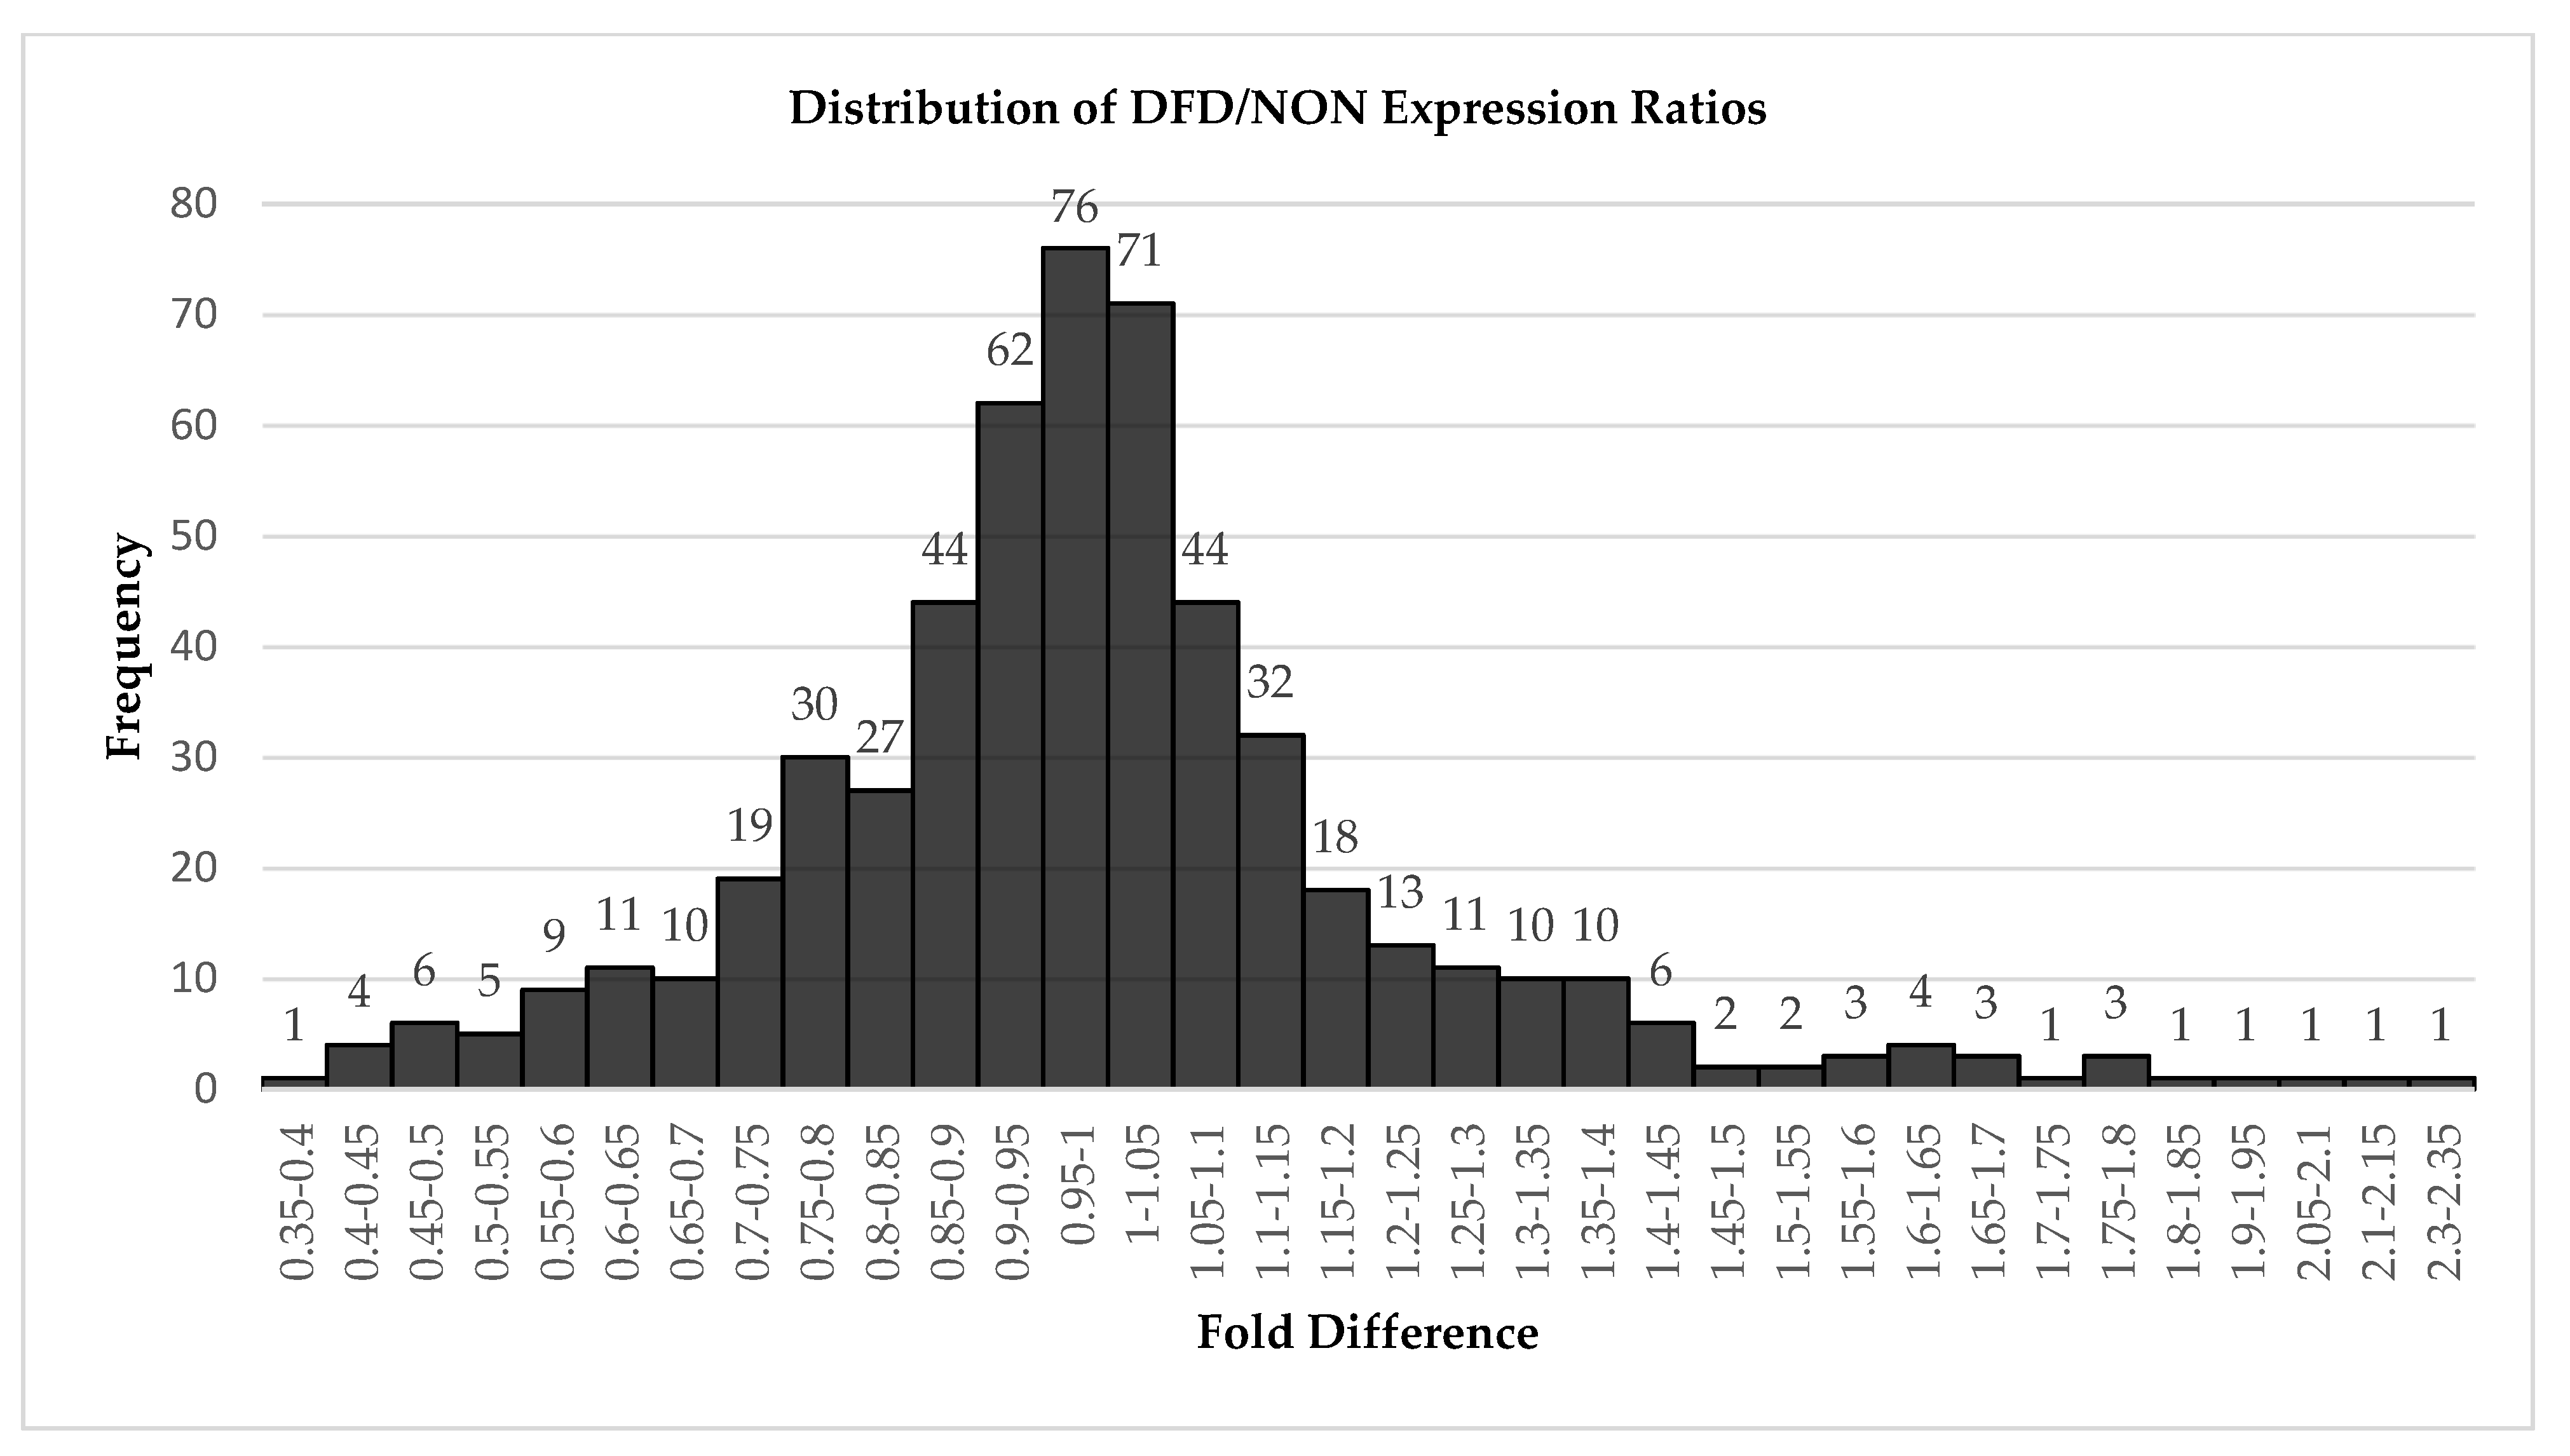
3.2. miRNA Sequence Output

A total of 289,357,401 raw sequence reads were generated across all 78 samples. Sequence reads were 101 bps in length, with an average of 3,709,710 reads generated per sample. Following the excision of the adapters and removal of low-quality reads, 275,932,303 sequence reads were retained, reflecting an average of 3,537,594 usable reads per sample. These miRNA sequence reads possessed an average Phred quality score of 31, GC content of 34.5%, and were 15–22 nucleotides in length. Metpally et al. [33] found that beyond 1.5 million mapped reads, diminishing returns were achieved for miRNA sequencing experiments. Similarly, the trade-off between sequencing depth and sample number has been discussed, demonstrating the value of larger sample sizes for differential expression analyses [34]. With high quality RNA samples obtained immediately postmortem and prior to identification of carcasses with DFD beef, sequence characterization of muscle from 25 genetically defined steers that produced dark cutting meat offers a rare set of data for evaluating genetic regulation of the phenotype.

3.3. Identification of Differentially Expressed miRNAs

After mapping sequences to Bos taurus miRNAs in miRbase (greater than 90% of the total small RNA sequence reads mapped to B. taurus miRNAs), 542 miRNAs passed the initial filtering within the DESeq2 analysis software (Supplemental Table S1). Because this experiment’s goal was to determine whether miRNAs might play a role in the DFD phenotype, other small RNAs were not investigated and we did not attempt to determine potentially novel miRNAs in this dataset. Nearly half of the miRNAs were expressed similarly between the dark-cutting and normal (DFD and NON) groups, exhibiting expression ratios (DFD/NON) between 0.90 and 1.10 (Figure 2).
Because miRNAs can be potent cellular regulators of gene expression and small changes may have great effects, a cut-off for differential expression between DFD and NON was set to a level of at least 20% (ratio of DFD/NON ≤ 0.8 or ≥1.2). Although messenger RNA (mRNA) transcriptome analyses often utilize a two-fold expression difference as a cut-off, much smaller differences in miRNA expression can have powerful downstream impacts on gene expression. As a result, we chose a 20% difference in expression as a reasonable measure for examining potential differences between DFD and NON samples. Of 170 miRNAs meeting the differential expression threshold, 28 miRNAs also met the initial threshold for statistical significance (p ≤ 0.05; Table 2). However, after a correction for multiple testing was applied, only a single miRNA, bta-miR-2422, approached significance with a 5.4% probability of being a false positive (padj = 0.0541; Table 2). Seven additional bovine miRNAs met the cut-off if the FDR threshold was relaxed to 30% (miR-10174-5p, miR-1260b, miR-144, miR-142-5p, miR-2285at, miR-2285e, miR-3613a). These data for the “top” miRNAs presented in Table 2 are also displayed in Supplemental Figure S1 as an expression heatmap of raw read counts across all animals. As was also reflected in the DESeq2 analysis of differential expression, animal-to-animal variability is observed, and small changes in expression are somewhat difficult to visualize graphically.
The “myomiRs” are miRNAs known to be specifically expressed and have a regulatory function within skeletal muscle [35]. These microRNAs (miR-1, miR-133a, miR-133b, miR-206, miR-208a, miR-208b, mir-486, mir-499) are included in the table of differentially expressed microRNAs as a reference because of their specificity to skeletal muscle. All of the myomiRs were detected but were not differentially expressed between the two groups (Table 2).

3.4. TargetScan Search for Putative Targets of bta-miR-2422

To determine potential targets that bta-miR-2422 may regulate, a search was conducted in TargetScan Software, Release 8.0 [36,37]. This software utilizes a statistical model to predict the effects of miRNAs binding to canonical sites based upon 14 different features of the microRNA, miRNA site, or mRNA—including the mRNA sequence around the site—to predict which sites within mRNAs are most effectively targeted by microRNAs [36,37]. However, in the case of poorly annotated or documented miRNAs, the results of analysis can produce primarily false positives. TargetScan analysis of miR-2422 predicted 3375 transcripts with sites potentially targeted by the miRNA, but these predictions are noted by TargetScan as not likely to be functional. The predicted dataset is included as Supplemental Table S2 for completeness, but at this time, no obvious targets of miR-2422 are proposed.

4. Discussion

This study utilized RNAseq analysis to evaluate differential expression of miRNAs in L lumborum skeletal muscle biopsies that were obtained from a contemporary group of carcasses in which an unexpectedly high incidence of dark-cutting beef was observed (25 of 78 carcasses). Similar sets of steers fed in the same manner and same locations in other years did not have similar incidence. Our objective for this study was to determine whether specific miRNAs were associated with the dark-cutting phenotype and the physiological mechanisms underlying this undesirable trait. At more than 3.5 million mapped reads per sample, with 78 biological replicates—including 25 DFD samples—this study is a robust sequence analysis of miRNA expression in skeletal muscle samples, providing a unique and valuable reference for genetic analysis of the DFD phenotype.
From our analyses, a single miRNA, bta-miR-2422 was identified as differentially expressed between DFD and NON muscle samples, with the probability of false discovery at 5.4% based on chosen analytical parameters. To our knowledge, this finding represents the first instance of a specific miRNA associated with the DFD phenotype. The function of miR-2422 has not been examined in detail to date. However, this miRNA, along with those identified at a greater threshold for false discovery, appears to be consistent with an association with inflammation and response to stress. Given the novelty of this study, we include discussion of several miRNAs identified as differentially expressed with a potential false discovery rate of 30%. Although this choice is a generous threshold for consideration, it is not unreasonable for a preliminary investigation of the impact and function of the highest-ranking candidates, even if some of them are later determined to be false positives. Such investigations may lead to additional insight into genetic regulation of muscle physiology.

4.1. MiRNA Role in Inflammation and Inflammatory Response

MicroRNAs have been implicated in mediation of inflammatory response in a variety of conditions and species. A computational study evaluated miRNA-gene interactions to identify potential regulators of immune response in cattle suffering from trypanosome infection [38]. This work evaluated seven key innate immune responsive genomic regions and searched for miRNAs that targeted these genes. The results identified bta-miR-2422 as one of the top ten miRNAs targeting the coding regions (CDS) of these immune responsive genes, specifically ICAM-1, ITGAM, LBP, TLR-2, and TNF. Interestingly, in addition to TLR-2′s association with oxidative stress and inflammation, it has also been linked to skeletal muscle atrophy in mouse studies [39]. In a different report, when cows were challenged with Staphlococcus aureus bacteria for assessment of inflammatory response in mastitis, both miR-2422 and miR-142 were elevated in mammary glands after the challenge [40]. In addition, Singh et al. [41] found that miR-1260b was significantly upregulated in water buffalo (Bubalus bubalis) that were suffering from brucellosis as well as Johne’s disease. The trypanosome work [38] also demonstrated that bta-miR-2422 shares homology with miR-327 in rats and mice (rno-miR-327 and mmu-miR-327). When rats treated intravenously with gold nanoparticles developed lung inflammation, expression of miR-327 was implicated in the inflammatory response [42].

4.2. ThermomiRs and Stress Response

Environmental challenges such as cold and heat can also induce stress responses that alter genetic signaling, including miRNA expression. Heat stress can cause rapid increases in circulating cytokines. Welc et al. [43] demonstrated that in mice, skeletal muscle exhibits a distinct stress-induced immune response that has similarity to systemic responses. When heat stress response was evaluated in cows, miR-2285 was downregulated in bovine mammary glands following heat exposure [44,45]. Additionally, cold stress has been associated with decreases in protein synthesis and induction of atrophy in rat skeletal muscle [46]. The cold-induced RNA-binding protein (CIRP) is upregulated quickly following cold shock, along with RNA-binding motif protein 3 (RBM3). It has also been suggested that CIRP can trigger inflammation [47]. Results from an experimental study in mouse skeletal muscle demonstrated that expression of CIRP promoted glucose metabolism and depleted glycogen through the AKT signaling pathway [48]. RBM3 has been shown to regulate the “thermomir” miR-142-5p, known to be responsive to temperature changes in human cells, and knockdown of miR-142-5p increased T-cell activation [49]. Another effect of cold exposure is induction of white adipose tissue (WAT) browning. In a mouse model, miR-327 was identified as a key regulator of WAT browning and thermogenesis [50]. Cold exposure decreased miR-327 expression, and downregulation of miR-327 increased overall metabolism regardless of thermal environment. Elevation of the homolog bta-miR-2422 in the current study suggests the metabolic response to stress in the DFD steer group may have differed from that in the non-DFD group.
Other stressors have similarly altered miRNA expression. MiRNAs in milk exosomes were evaluated after cows were subjected to group relocation during their lactation period. In cows with elevated cortisol in response to this stress, 13 miRNAs were downregulated compared with controls [51]. One of these, miR-142, was also downregulated in samples from dark cutters in the current study. Interestingly, plasma concentration of miR-142-5p was also altered in grazing cattle compared with housed Japanese Shorthorn, with differences attributed to altered metabolism [52]. Under conditions of another environmental stressor, hypoxia, mir-1260b has been identified among the most greatly upregulated miRNAs (also called “hypoxamiRs”). This miRNA targets GDF11 signaling and is associated with vascular diseases [53,54]. In a rat model, overexpression of miR-327 enhanced hypoxia-induced oxidative stress [55]. When a group of Jersey cattle were stressed due to varying degrees of high-altitude hypoxia, circulating bta-miR-1260b, along with bta-miR-206, were significantly upregulated in plasma from the stressed group compared with control animals [56].

4.3. Muscle and MyomiRs

The myomiRs—miRNAs known to be specifically associated with skeletal muscle (miR-1, miR-133a, miR-133b, miR-206, miR-208a, miR-208b, mir-486, mir-499) [35] were detected but were not differentially expressed (Table 2). Thus, expression of the myomiRs does not appear to directly contribute to the DFD phenotype. This result may further reflect dark cutting’s appearance as a response to stress. However, miR-206 exhibited a fold ratio of DFD/NON = 1.12, p = 0.0048. In pork, polymorphisms in the genes encoding miR-206 altered expression of the miRNA and were associated with fiber type composition, drip loss, and lightness of meat [57]. In light of this finding, the myomiRs may require further investigation.
Differential miRNA expression was also previously evaluated in skeletal muscle from non-small-cell lung cancer patients who develop cachexia during the course of their disease and treatment [58]. In their study, miR-144-5p was one of two miRNAs specifically associated with the cachectic state. Karolina et al. [59] identified miR-144 as a key player in Type 2 diabetes in a rat model and demonstrated its role in targeting expression of IRS1, suggesting its role in regulation of insulin signaling. In addition, miR-142 has been shown to regulate metabolism and lipid utilization in skeletal muscle [60].
The miRNA, bta-mir-10174 was deposited in miRbase as part of an effort to identify miRNAs expressed in bovine corpora lutea [61]. To our knowledge, however, the function of this miRNA has not yet been described.

5. Conclusions

Following sequence analysis of skeletal muscle miRNAs in this experiment, we identified bta-miR-2422 as a potential regulatory molecule that is differentially expressed in samples obtained from dark-cutting beef carcasses, compared with non-dark-cutting samples. These findings offer a first step toward answering the question of whether genetic regulatory mechanisms that function in response to stress can ultimately affect carcass quality. Coupled with the influence of sire on propensity for offspring to result in DFD beef, we hypothesize that gene Χ environment interactions may also factor into DFD occurrence. The identification of miR-2422 is consistent with other reports of stress-induced immune responses and may provide additional insight into the physiological responses that create the DFD phenotype. Additional miRNAs identified in this work with less statistical confidence are also consistent with reports in the literature of miRNAs associated with response to cold and heat stress, glycogen utilization, and other physical attributes of skeletal muscle that are relevant to DFD occurrence. These findings will require substantial validation and further investigation to demonstrate how miR-2422 and other microRNAs function in skeletal muscle, to identify whether they play a role in response to environmental stressors, and to characterize potential target mRNAs. However, this work potentially provides a novel first step toward further elimination of this undesirable carcass phenotype that remains a significant economic problem for the meat industry.

Supplementary Materials

The following supporting information can be downloaded at: https://www.mdpi.com/article/10.3390/app12073555/s1, Table S1: Differentially expressed miRNAs, Table S2: TargetScan analysis results for bta-miR-2422, Figure S1: Heat map illustrating miRNAs with greatest probability of differential expression across all individuals.

Author Contributions

Conceptualization and project design, P.K.R., R.N.V.; methodology, P.K.R., D.A.T., A.D.H., D.G.R.; formal analysis, P.K.R., D.A.T., B.W.D., M.L.R., A.D.H.; investigation, D.A.T., P.K.R., R.N.V.; resources, P.K.R., R.N.V., A.D.H., D.G.R., H.R.C.; data curation, D.A.T.; writing—original draft preparation, P.K.R., D.A.T.; writing—review and editing, all authors; supervision, project administration, and funding acquisition, P.K.R. All authors have read and agreed to the published version of the manuscript.

Funding

This research was supported in part by the Sustainable Beef Production Systems Exceptional Item funding from the Texas Legislature. D.A.T. was partially supported by a Texas A&M University Excellence doctoral fellowship in the College of Agriculture and Life Sciences.

Institutional Review Board Statement

This study utilized only post-mortem samples and no live animals. However the long-term animal study from which the samples derived was approved by the Agricultural Animal Care and Use Committee of Texas A&M Agrilife Research (protocol codes 2008-234, 2011-291, 2015-011a, and 2018-006a, last approved in January 2018) for all project activities, including sample collection.

Informed Consent Statement

Not applicable.

Data Availability Statement

The sequence datasets generated and analyzed for this study are publicly available in NCBI’s Gene Expression Omnibus [22] and are accessible through GEO Series accession number GSE193003. https://www.ncbi.nlm.nih.gov/geo/query/acc.cgi?acc=GSE193003 (accessed on 7 January 2022). The raw sequence data are located in the Sequence Read Archive (SRA) as Bioproject accession #PRJNA794121 https://www.ncbi.nlm.nih.gov/bioproject/PRJNA794121/ (accessed on 7 January 2022).

Acknowledgments

This manuscript is dedicated with great appreciation in memory of Sarah C. Canterberry. The authors also thank Wes Brashear for technical assistance.

Conflicts of Interest

The authors declare no conflict of interest. The funders had no role in the design of the study; in the collection, analyses, or interpretation of data; in the writing of the manuscript, or in the decision to publish the results.

References

  1. Grandin, T. The effect of stress on livestock and meat quality prior to and during slaughter. Int. J. Study Anim. Probl. 1980, 5, 331–337. [Google Scholar]
  2. Lawrie, R.A. Physiological stress in relation to dark-cutting beef. J. Sci. Food Agric. 1958, 9, 721–727. [Google Scholar] [CrossRef]
  3. Ponnampalam, E.N.; Hopkins, D.L.; Bruce, H.; Li, D.; Baldi, G.; Bekhit, A.E.-D.A. Causes and Contributing Factors to “Dark Cutting” Meat: Current Trends and Future Directions: A Review. Compr. Rev. Food Sci. Food Saf. 2017, 16, 400–430. [Google Scholar] [CrossRef] [Green Version]
  4. Biggar, K.K.; Storey, K.B. Functional impact of microRNA regulation in models of extreme stress adaptation. J. Mol. Cell Biol. 2018, 10, 93–101. [Google Scholar] [CrossRef] [PubMed]
  5. Hollins, S.; Cairns, M.J. MicroRNA: Small RNA mediators of the brains genomic response to environmental stress. Prog. Neurobiol. 2016, 143, 61–81. [Google Scholar] [CrossRef] [PubMed] [Green Version]
  6. Bratzler, L.J. Dark cutting beef. MSC Vet. 1946, 6, 78–80. [Google Scholar]
  7. Cross, H.R.; Sorinmade, S.O.; Ono, K. Effect of Electrical Stimulation on Carcasses from Stressed and Unstressed Steers. J. Food Qual. 1983, 6, 73–79. [Google Scholar] [CrossRef]
  8. Tarrant, P.; Sherington, J. An investigation of ultimate pH in the muscles of commercial beef carcasses. Meat Sci. 1980, 4, 287–297. [Google Scholar] [CrossRef]
  9. Apaoblaza, A.; Gerrard, S.; Matarneh, S.; Wicks, J.; Kirkpatrick, L.; England, E.; Scheffler, T.; Duckett, S.; Shi, H.; Silva, S.; et al. Muscle from grass- and grain-fed cattle differs energetically. Meat Sci. 2020, 161, 107996. [Google Scholar] [CrossRef] [PubMed]
  10. Wu, S.; Luo, X.; Yang, X.; Hopkins, D.L.; Mao, Y.; Zhang, Y. Understanding the development of color and color stability of dark cutting beef based on mitochondrial proteomics. Meat Sci. 2020, 163, 108046. [Google Scholar] [CrossRef]
  11. McGilchrist, P.; Perovic, J.L.; Gardner, G.E.; Pethick, D.W.; Jose, C.G. The incidence of dark cutting in southern Australian beef production systems fluctuates between months. Anim. Prod. Sci. 2014, 54, 1765–1769. [Google Scholar] [CrossRef] [Green Version]
  12. Boykin, C.A.; Eastwood, L.C.; Harris, M.K.; Hale, D.S.; Kerth, C.R.; Griffin, D.B.; Arnold, A.N.; Hasty, J.D.; Belk, K.E.; Woerner, D.R.; et al. National Beef Quality Audit–2016: In-plant survey of carcass characteristics related to quality, quantity, and value of fed steers and heifers1. J. Anim. Sci. 2017, 95, 2993–3002. [Google Scholar] [CrossRef] [PubMed] [Green Version]
  13. Moore, M.C.; Gray, G.D.; Hale, D.S.; Kerth, C.R.; Griffin, D.B.; Savell, J.W.; Raines, C.R.; Belk, K.E.; Woerner, D.R.; Tatum, J.D.; et al. National Beef Quality Audit–2011: In-plant survey of targeted carcass characteristics related to quality, quantity, value, and marketing of fed steers and heifers. J. Anim. Sci. 2012, 90, 5143–5151. [Google Scholar] [CrossRef] [PubMed] [Green Version]
  14. Garcia, L.G.; Nicholson, K.L.; Hoffman, T.W.; Lawrence, T.E.; Hale, D.S.; Griffin, D.B.; Savell, J.W.; Vanoverbeke, D.L.; Morgan, J.B.; Belk, K.E.; et al. National Beef Quality Audit–2005: Survey of targeted cattle and carcass characteristics related to quality, quantity, and value of fed steers and heifers1. J. Anim. Sci. 2008, 86, 3533–3543. [Google Scholar] [CrossRef] [PubMed] [Green Version]
  15. McKenna, D.R.; Roebert, D.L.; Bates, P.K.; Schmidt, T.B.; Hale, D.S.; Griffin, D.B.; Savell, J.W.; Brooks, J.C.; Morgan, J.B.; Montgomery, T.H.; et al. National Beef Quality Audit-2000: Survey of targeted cattle and carcass characteristics related to quality, quantity, and value of fed steers and heifers. J. Anim. Sci. 2002, 80, 1212–1222. [Google Scholar] [CrossRef] [PubMed]
  16. Inui, M.; Martello, G.; Piccolo, S. MicroRNA control of signal transduction. Nat. Rev. Mol. Cell Biol. 2010, 11, 252–263. [Google Scholar] [CrossRef] [PubMed]
  17. Jeffries, C.D.; Fried, H.M.; Perkins, D.O. Additional layers of gene regulatory complexity from recently discovered microRNA mechanisms. Int. J. Biochem. Cell Biol. 2010, 42, 1236–1242. [Google Scholar] [CrossRef] [PubMed] [Green Version]
  18. Dawes, M.; Kochan, K.J.; Riggs, P.K.; Lightfoot, J.T. Differential miRNA expression in inherently high- and low-active inbred mice. Physiol. Rep. 2015, 3, e12469. [Google Scholar] [CrossRef] [PubMed] [Green Version]
  19. Kochan, K.J.; Forman, S.E.; Hillhouse, A.E.; Cross, H.R.; Riggs, P.K. Methodology for quantification of circulating cell-free microRNA from bovine plasma for analysis of meat quality traits. In Proceedings of the 22nd Conference of the Association for the Advancement of Animal Breeding and Genetics (AAABG), Townsville, QLD, Australia, 2–5 July 2017; Volume 22, p. 469. [Google Scholar]
  20. Riley, D.G.; Miller, R.K.; Nicholson, K.L.; Gill, C.A.; Herring, A.D.; Riggs, P.K.; Sawyer, J.E.; Savell, J.W.; Sanders, J.O. Genome association of carcass and palatability traits from Bos indicus-Bos taurus crossbred steers within electrical stimulation status and correspondence with steer temperament 1. Carcass. Livest. Sci. 2019, 229, 150–158. [Google Scholar] [CrossRef]
  21. Vaughn, R.N.; Kochan, K.J.; Torres, A.K.; Du, M.; Riley, D.G.; Gill, C.A.; Herring, A.D.; Sanders, J.O.; Riggs, P.K. Skeletal Muscle Expression of Actinin-3 (ACTN3) in Relation to Feed Efficiency Phenotype of F2Bos indicus-Bos taurus Steers. Front. Genet. 2022, 13, 796038. [Google Scholar] [CrossRef]
  22. Edgar, R.; Domrachev, M.; Lash, A.E. Gene Expression Omnibus: NCBI gene expression and hybridization array data repository. Nucleic Acids Res. 2002, 30, 207–210. [Google Scholar] [CrossRef] [PubMed] [Green Version]
  23. Ewing, B.; Hillier, L.; Wendl, M.C.; Green, P. Base-Calling of Automated Sequencer Traces UsingPhred. I. Accuracy Assessment. Genome Res. 1998, 8, 175–185. [Google Scholar] [CrossRef] [PubMed] [Green Version]
  24. Andrews, S. FastQC. 2017. Available online: https://github.com/s-andrews/FastQC (accessed on 27 February 2022).
  25. Bolger, A.M.; Lohse, M.; Usadel, B. Trimmomatic: A flexible trimmer for Illumina sequence data. Bioinformatics 2014, 30, 2114–2120. [Google Scholar] [CrossRef] [Green Version]
  26. Kozomara, A.; Birgaoanu, M.; Griffiths-Jones, S. miRBase: From microRNA sequences to function. Nucleic Acids Res. 2019, 47, D155–D162. [Google Scholar] [CrossRef] [PubMed]
  27. Friedländer, M.R.; Mackowiak, S.D.; Li, N.; Chen, W.; Rajewsky, N. miRDeep2 accurately identifies known and hundreds of novel microRNA genes in seven animal clades. Nucleic Acids Res. 2012, 40, 37–52. [Google Scholar] [CrossRef] [PubMed]
  28. Anders, S.; Huber, W. Differential expression analysis for sequence count data. Genome Biol. 2010, 11, R106. [Google Scholar] [CrossRef] [Green Version]
  29. Love, M.I. Statistical Modeling of High Dimensional Counts. In RNA Bioinformatics; Humana: New York, NY, USA, 2021; Volume 2284, pp. 97–134. [Google Scholar] [CrossRef]
  30. Love, M.I.; Huber, W.; Anders, S. Moderated estimation of fold change and dispersion for RNA-seq data with DESeq2. Genome Biol. 2014, 15, 550. [Google Scholar] [CrossRef] [PubMed] [Green Version]
  31. Benjamini, Y.; Hochberg, Y. Controlling the falser discovery rate: A practical and powerful approach to multiple testing. J. R. Stat. Soc. 1995, 57, 289–300. [Google Scholar]
  32. Yekutieli, D.; Benjamini, Y. Resampling-based false discovery rate controlling multiple test procedures for correlated test statistics. J. Stat. Plan. Inference 1999, 82, 171–196. [Google Scholar] [CrossRef]
  33. Metpally, R.P.R.; Nasser, S.; Malenica, I.; Courtright, A.; Carlson, E.; Ghaffari, L.; Villa, S.; Tembe, W.; Van Keuren-Jensen, K. Comparison of Analysis Tools for miRNA High Throughput Sequencing Using Nerve Crush as a Model. Front. Genet. 2013, 4, 20. [Google Scholar] [CrossRef] [PubMed] [Green Version]
  34. Campbell, J.D.; Liu, G.; Luo, L.; Xiao, J.; Gerrein, J.; Juan-Guardela, B.; Tedrow, J.; Alekseyev, Y.O.; Yang, I.V.; Correll, M.; et al. Assessment of microRNA differential expression and detection in multiplexed small RNA sequencing data. RNA 2014, 21, 164–171. [Google Scholar] [CrossRef] [PubMed] [Green Version]
  35. Giagnorio, E.; Malacarne, C.; Mantegazza, R.; Bonanno, S.; Marcuzzo, S. MyomiRs and their multifaceted regulatory roles in muscle homeostasis and amyotrophic lateral sclerosis. J. Cell Sci. 2021, 134, jcs258349. [Google Scholar] [CrossRef] [PubMed]
  36. Agarwal, V.; Bell, G.W.; Nam, J.-W.; Bartel, D.P. Predicting effective microRNA target sites in mammalian mRNAs. eLife 2015, 4, e05005. [Google Scholar] [CrossRef] [PubMed]
  37. McGeary, S.E.; Lin, K.S.; Shi, C.Y.; Pham, T.M.; Bisaria, N.; Kelley, G.M.; Bartel, D.P. The biochemical basis of microRNA targeting efficacy. Science 2019, 366, eaav1741. [Google Scholar] [CrossRef]
  38. Morenikeji, O.B.; Hawkes, M.E.; Hudson, A.O.; Thomas, B.N. Computational Network Analysis Identifies Evolutionarily Conserved miRNA Gene Interactions Potentially Regulating Immune Response in Bovine Trypanosomosis. Front. Microbiol. 2019, 10, 2010. [Google Scholar] [CrossRef] [Green Version]
  39. Kim, D.-S.; Cha, H.-N.; Jo, H.J.; Song, I.-H.; Baek, S.-H.; Dan, J.-M.; Kim, Y.-W.; Kim, J.-Y.; Lee, I.-K.; Seo, J.-S.; et al. TLR2 deficiency attenuates skeletal muscle atrophy in mice. Biochem. Biophys. Res. Commun. 2015, 459, 534–540. [Google Scholar] [CrossRef]
  40. Li, R.; Zhang, C.-L.; Liao, X.-X.; Chen, D.; Wang, W.-Q.; Zhu, Y.-H.; Geng, X.-H.; Ji, D.-J.; Mao, Y.-J.; Gong, Y.-C.; et al. Transcriptome MicroRNA Profiling of Bovine Mammary Glands Infected with Staphylococcus aureus. Int. J. Mol. Sci. 2015, 16, 4997–5013. [Google Scholar] [CrossRef] [Green Version]
  41. Singh, J.; Dhanoa, J.K.; Choudhary, R.K.; Singh, A.; Sethi, R.S.; Kaur, S.; Mukhopadhyay, C.S. MicroRNA expression profiling in PBMCs of Indian water Buffalo (Bubalus bubalis) infected with Brucella and Johne’s disease. ExRNA 2020, 2, 8. [Google Scholar] [CrossRef]
  42. Ng, C.-T.; Li, J.J.; Balasubramanian, S.K.; You, F.; Yung, L.-Y.L.; Bay, B.-H. Inflammatory Changes in Lung Tissues Associated with Altered Inflammation-Related MicroRNA Expression after Intravenous Administration of Gold Nanoparticles in Vivo. ACS Biomater. Sci. Eng. 2016, 2, 1959–1967. [Google Scholar] [CrossRef]
  43. Welc, S.S.; Clanton, T.; Dineen, S.M.; Leon, L.R. Heat stroke activates a stress-induced cytokine response in skeletal muscle. J. Appl. Physiol. 2013, 115, 1126–1137. [Google Scholar] [CrossRef]
  44. Li, Q.; Yang, C.; Du, J.; Zhang, B.; He, Y.; Hu, Q.; Li, M.; Zhang, Y.; Wang, C.; Zhong, J. Characterization of miRNA profiles in the mammary tissue of dairy cattle in response to heat stress. BMC Genom. 2018, 19, 975. [Google Scholar] [CrossRef] [PubMed] [Green Version]
  45. Miretti, S.; Lecchi, C.; Ceciliani, F.; Baratta, M. MicroRNAs as Biomarkers for Animal Health and Welfare in Livestock. Front. Veter. Sci. 2020, 7, 578193. [Google Scholar] [CrossRef] [PubMed]
  46. Manfredi, L.H.; Zanon, N.M.; Garófalo, M.A.; Navegantes, L.C.C.; Kettelhut, I.C. Effect of short-term cold exposure on skeletal muscle protein breakdown in rats. J. Appl. Physiol. 2013, 115, 1496–1505. [Google Scholar] [CrossRef] [PubMed] [Green Version]
  47. Zhu, X.; Bührer, C.; Wellmann, S. Cold-inducible proteins CIRP and RBM3, a unique couple with activities far beyond the cold. Cell. Mol. Life Sci. 2016, 73, 3839–3859. [Google Scholar] [CrossRef] [PubMed] [Green Version]
  48. Liu, Y.; Liu, P.; Hu, Y.; Cao, Y.; Lu, J.; Yang, Y.; Lv, H.; Lian, S.; Xu, B.; Li, S. Cold-Induced RNA-Binding Protein Promotes Glucose Metabolism and Reduces Apoptosis by Increasing AKT Phosphorylation in Mouse Skeletal Muscle Under Acute Cold Exposure. Front. Mol. Biosci. 2021, 8, 685993. [Google Scholar] [CrossRef] [PubMed]
  49. Wong, J.J.-L.; Au, A.Y.; Gao, D.; Pinello, N.; Kwok, C.-T.; Thoeng, A.; Lau, K.A.; Gordon, J.E.; Schmitz, U.; Feng, Y.; et al. RBM3 regulates temperature sensitive miR-142-5p and miR-143 (thermomiRs), which target immune genes and control fever. Nucleic Acids Res. 2016, 44, 2888–2897. [Google Scholar] [CrossRef] [Green Version]
  50. Fischer, C.; Seki, T.; Lim, S.; Nakamura, M.; Andersson, P.; Yang, Y.; Honek, J.; Wang, Y.; Gao, Y.; Chen, F.; et al. A miR-327–FGF10–FGFR2-mediated autocrine signaling mechanism controls white fat browning. Nat. Commun. 2017, 8, 2079. [Google Scholar] [CrossRef] [Green Version]
  51. Colitti, M.; Sgorlon, S.; Licastro, D.; Stefanon, B. Differential expression of miRNAs in milk exosomes of cows subjected to group relocation. Res. Veter. Sci. 2019, 122, 148–155. [Google Scholar] [CrossRef]
  52. Muroya, S.; Ogasawara, H.; Nohara, K.; Oe, M.; Ojima, K.; Hojito, M. Coordinated alteration of mRNA-microRNA transcriptomes associated with exosomes and fatty acid metabolism in adipose tissue and skeletal muscle in grazing cattle. Asian Australas. J. Anim. Sci. 2020, 33, 1824–1836. [Google Scholar] [CrossRef]
  53. Lee, J.; Heo, J.; Kang, H. miR-92b-3p-TSC1 axis is critical for mTOR signaling-mediated vascular smooth muscle cell proliferation induced by hypoxia. Cell Death Differ. 2019, 26, 1782–1795. [Google Scholar] [CrossRef] [Green Version]
  54. Seong, M.; Kang, H. Hypoxia-induced miR-1260b regulates vascular smooth muscle cell proliferation by targeting GDF11. BMB Rep. 2020, 53, 206–211. [Google Scholar] [CrossRef] [PubMed]
  55. Zheng, T.; Yang, J.; Zhang, J.; Yang, C.; Fan, Z.; Li, Q.; Zhai, Y.; Liu, H.; Yang, J. Downregulated MicroRNA-327 Attenuates Oxidative Stress–Mediated Myocardial Ischemia Reperfusion Injury Through Regulating the FGF10/Akt/Nrf2 Signaling Pathway. Front. Pharmacol. 2021, 12, 669146. [Google Scholar] [CrossRef] [PubMed]
  56. Kong, Z.; Zhou, C.; Li, B.; Jiao, J.; Chen, L.; Ren, A.; Jie, H.; Tan, Z. Integrative plasma proteomic and microRNA analysis of Jersey cattle in response to high-altitude hypoxia. J. Dairy Sci. 2019, 102, 4606–4618. [Google Scholar] [CrossRef] [PubMed] [Green Version]
  57. Lee, J.-S.; Kim, J.-M.; Lim, K.-S.; Hong, J.-S.; Hong, K.-C.; Lee, Y.S. Effects of polymorphisms in the porcine microRNAMIR206/MIR133Bcluster on muscle fiber and meat quality traits. Anim. Genet. 2012, 44, 101–106. [Google Scholar] [CrossRef] [PubMed]
  58. Van de Worp, W.R.P.H.; Schols, A.M.W.J.; Dingemans, A.-M.C.; Op den Kamp, C.M.H.; Degens, J.H.R.J.; Kelders, M.C.J.M.; Coort, S.; Woodruff, H.C.; Kratassiouk, G.; Harel-Bellan, A.; et al. Identification of microRNAs in skeletal muscle associated with lung cancer cachexia. J. Cachexia Sarcopenia Muscle 2020, 11, 452–463. [Google Scholar] [CrossRef] [Green Version]
  59. Karolina, D.S.; Armugam, A.; Tavintharan, S.; Wong, M.T.; Lim, S.C.; Sum, C.F.; Jeyaseelan, K. MicroRNA 144 Impairs Insulin Signaling by Inhibiting the Expression of Insulin Receptor Substrate 1 in Type 2 Diabetes Mellitus. PLoS ONE 2011, 6, e22839. [Google Scholar] [CrossRef]
  60. Chemello, F.; Grespi, F.; Zulian, A.; Cancellara, P.; Hebert-Chatelain, E.; Martini, P.; Bean, C.; Alessio, E.; Buson, L.; Bazzega, M.; et al. Transcriptomic Analysis of Single Isolated Myofibers Identifies miR-27a-3p and miR-142-3p as Regulators of Metabolism in Skeletal Muscle. Cell Rep. 2019, 26, 3784–3797.e8. [Google Scholar] [CrossRef] [Green Version]
  61. Maalouf, S.W.; Liu, W.-S.; Albert, I.; Pate, J.L. Regulating life or death: Potential role of microRNA in rescue of the corpus luteum. Mol. Cell. Endocrinol. 2014, 398, 78–88. [Google Scholar] [CrossRef]
Figure 1. Incidence of DFD in offspring of sires with at least 4 progeny in the contemporary group cohort (n = 78). Letters designate sire, followed by its number of offspring within the cohort.
Applsci 12 03555 g001
Figure 2. Distribution of expression ratios observed between DFD and NON groups for 542 miRNAs detected. Fold difference is expressed as ratio of DFD/NON and numerals indicate number of miRNAs within a bin.
Applsci 12 03555 g002
Table 1. Breeding scheme for animals 1 utilized in the study, derived from Cycle 2 and Cycle 3.
Cycle 1Cycle 2Cycle 3
NA × NA 4 crosses; combinations
of NA and AN F1 parents
NA × NA
1 All animals are 50% Nellore (N, Bos indicus) and 50% Angus (A, Bos taurus). A pair of letters indicate the breeds of sire and dam in the cross, respectively.
Table 2. MicroRNAs differentially expressed in muscle biopsies from normal beef carcasses (NON) and those exhibiting the dark, firm, dry phenotype (DFD). The threshold for statistical significance for differential expression is padj ≤ 0.05. MyomiR data are also included in the table.
MicroRNACounts
(Normalized) 1
Fold Difference (DFD/NON) 2p Value
(Wald Test) 3
padj
(FDR ≤ 0.05) 4
bta-miR-24225.541.729.98 × 10−50.054073752
bta-miR-10174-5p2.681.930.00186980.253362794
bta-miR-1260b12.131.580.00097950.253362794
bta-miR-14425.260.560.00155180.253362794
bta-miR-142-5p145.190.770.00456990.286059911
bta-miR-2285at2.181.770.00438850.286059911
bta-miR-2285e3.141.610.00363490.286059911
bta-miR-3613a375.890.790.00534430.289662932
bta-miR-49320.741.260.0064970.320127236
bta-miR-27a-5p10.571.380.00741490.334904236
bta-miR-1368.860.680.01004350.400069983
bta-miR-146a246.050.750.01103840.400069983
bta-miR-23b-5p1.562.120.0110720.400069983
bta-miR-10162-5p1.321.840.02331580.554531616
bta-miR-130712.531.290.01894020.554531616
bta-miR-2285aa1.320.450.01986970.554531616
bta-miR-2285r1.560.500.01892850.554531616
bta-miR-314.480.630.02217550.554531616
bta-miR-2284k1.440.540.02676590.580285276
bta-miR-2299-5p1.890.560.02654740.580285276
bta-miR-119946.871.280.04681230.604508006
bta-miR-18b0.470.370.04626860.604508006
bta-miR-2285q3.660.660.03048560.604508006
bta-miR-247832.271.240.03073610.604508006
bta-miR-4311.262.080.03232550.604508006
bta-miR-54312.771.280.03282250.604508006
bta-miR-61235.080.730.0479550.604508006
bta-miR-6712.170.600.03482980.604508006
MyomiRs 5
bta-miR-20610,196.551.120.0047500720.286059911
bta-miR-208b236.1050.800.0632408020.604508006
bta-miR-12,711,501.560.920.0906113950.680638063
bta-miR-49916,961.840.930.2582000390.904697654
bta-miR-4861758.971.060.3338753880.973667764
bta-miR-133a59,175.470.990.9927916930.987194328
bta-miR-133b833.481.040.4401912940.992229627
bta-miR-208a2.250.940.7690979480.992229627
1 The normalized geometric mean sequence read counts over all samples. 2 The miRNA expression ratio comparison of normal and DFD groups, reported as the arithmetic ratio of normalized read counts (DFD/NON). 3 Wald statistic. The value of the test statistic for the miRNA as computed within DESeq2 software. 4 Adjusted Wald test p-values corrected for multiple testing at FDR of 5% via the adjusted Benjamini–Hochberg method. 5 The “myomiRs” are miRNAs known to be expressed and have a regulatory function in skeletal muscle. These are included as a reference as common muscle miRNAs.
Publisher’s Note: MDPI stays neutral with regard to jurisdictional claims in published maps and institutional affiliations.

