Article

A Study on the Factors Influencing Overall Fatigue and Musculoskeletal Pains in Automobile Manufacturing Production Workers

Department of Industrial & Management Engineering, Hansung University, Seoul 02876, Korea
*
Author to whom correspondence should be addressed.
Appl. Sci. 2022, 12(7), 3528; https://doi.org/10.3390/app12073528
Submission received: 28 February 2022 / Revised: 27 March 2022 / Accepted: 29 March 2022 / Published: 30 March 2022
(This article belongs to the Special Issue State-of-the-Art in Human Factors and Interaction Design)

Abstract

:
In South Korea, the automobile sector is a key industry that occupies a very large proportion of production, employment, and exports in the national economy. However, production workers in the automobile industry are still exposed to a wide range of risk factors. This study aims to investigate the relationships between personal characteristics or occupational hazard exposure and subjective overall fatigue or musculoskeletal pains in the automobile manufacturing industry. We extracted 446 automobile manufacturing production workers as subjects from the data of the 5th Korean Working Conditions Survey. The χ2 test is performed to test whether there are differences in the distribution of complaints of musculoskeletal pains or overall fatigue in view of personal characteristics and exposure to working environment hazards and logistic regression analysis was used to analyze the relationships between them. Results showed that the proportions of the overall fatigue and musculoskeletal pains of the complaining group increase as the hazard exposure time increases. Longer exposure to tobacco smoke shows higher rates of complaints of overall fatigue and musculoskeletal pain. Results of logistic regression show that gender, longer exposure to fumes and dust, manual heavy loads handling, and to repetitive motion were the risk factors for overall fatigue and that gender, work experience, longer working hours, longer exposure to noise, fumes and dust, awkward posture, and high temperature were risk factors for musculoskeletal pains. The results show that there are close relationships between personal characteristics, working environment hazards, overall fatigue, and musculoskeletal pains.

1. Introduction

The share of the automobile industry in view of the overall size of the national economy varies across countries. The automobile industry accounts for a large portion of output in the large automobile-producing countries such as Germany, Japan, and the Republic of Korea [1].
In Korea, the automobile sector is a key industry that occupies a very large proportion of production, employment, and exports in the national economy. Moreover, there are many related up and downstream industries for the automobile industry from raw materials, equipment, dealers, and services, so the influence of the automobile industry on the entire economy is great.
In Korea, the manufacture of motor vehicles, trailers, and semitrailers employed 359,831 persons in 2019, which accounts for 1.58% of the total employment that year [2]. However, in the U.S., the manufacture of motor vehicles, trailers and semitrailers employed 839,550 persons, which accounts for 0.60% of the total employment in 2020 [3].
Among automobile manufacturing industries, the largest sector is the manufacture of parts and accessories for motor vehicles (new products), accounting for 72.4% of the overall automobile manufacturing industry employment [2]. The manufacture of motor vehicles and engines for the motor vehicle sector (23.8%) follows.
Working conditions for the industry have improved along with the automation, mechanical material handling, and the enclosure of working stations. However, production workers in the automobile industry are still exposed to a wide range of risk factors. ILO [4] addressed the hazards in motor vehicle manufacturing processes: Chemical and physical hazards in foundry processes include silica-containing dust, carbon monoxide, metal fumes, noise, vibration, and heat. Exposure to vapors from the acid plating baths is involved in the electroplating process. Exposure to noise, oil smoke, and heat are hazards in forging and heat treatment. Foreign body injuries, coolant mist, airborne toxic substances, metal dust, ergonomic risk, and noise are common hazards in the machining process. Ergonomic risks, exposure to visible and ultraviolet radiation from welding, welding fumes, noise, and solvent vapor are included in vehicle assembly.
Manual handling of heavy parts and operation of dangerous power tools or high-speed machines are still prevalent [5,6,7]. Also, the incidence of musculoskeletal disorders (MSDs) is high in the automobile manufacturing industry [8,9,10]. In Korea in 2019, of the 9440 workers who suffered work-related musculoskeletal disorders (WMSDs), 1658 (17.56%) occurred in the machine tools, non-metallic and metal product manufacturing sector, which includes the automobile industry [11]. Typical physical hazards in automobile assembly work include repeatability due to a short work cycle time of less than 1 min, uncomfortable posture, and vibration caused by excessive force and power tools. These harmful factors are the main causes of work-related musculoskeletal disorders (WMSDs) [12]. Most of the auto parts manufacturing workers work while standing and complain of shoulder, leg, and back pain due to simple repetitive work that requires physical strength and endurance and handicraft [13].
Subjective symptoms of body parts have been the focus of previous studies [8,9,10,14,15,16]. Kang et al. [17] investigated WMSDs in automobile assembly workers and found that ergonomic and management factors are risk factors for occupational WMSDs. Jamdade et al. [18,19] studied the relationship between low back pain and various factors like core muscle strength, work posture, and flexibility of the workers. Akter et al. [20] found that, among automobile mechanics, musculoskeletal symptoms are prevalent and are associated with physical risk factors. Alipour et al. [21] showed that neck and shoulder pain are prevalent and are associated with lifestyle, work-related physical factors, and psychosocial factors.
Most of the prior studies on WMSDs in the automobile industry restrict the research scope to the specific plant or specific company and some of the working environmental factors, which leads to the lack of industry-wide interpretation and implication or the lack of the overall effect of the working conditions.
Therefore, this study aims to investigate the relationships between personal characteristics or occupational hazard (physical, chemical, and ergonomic) exposure and subjective overall fatigue or musculoskeletal pain in the automobile manufacturing industry based on a nation-wide working condition survey.

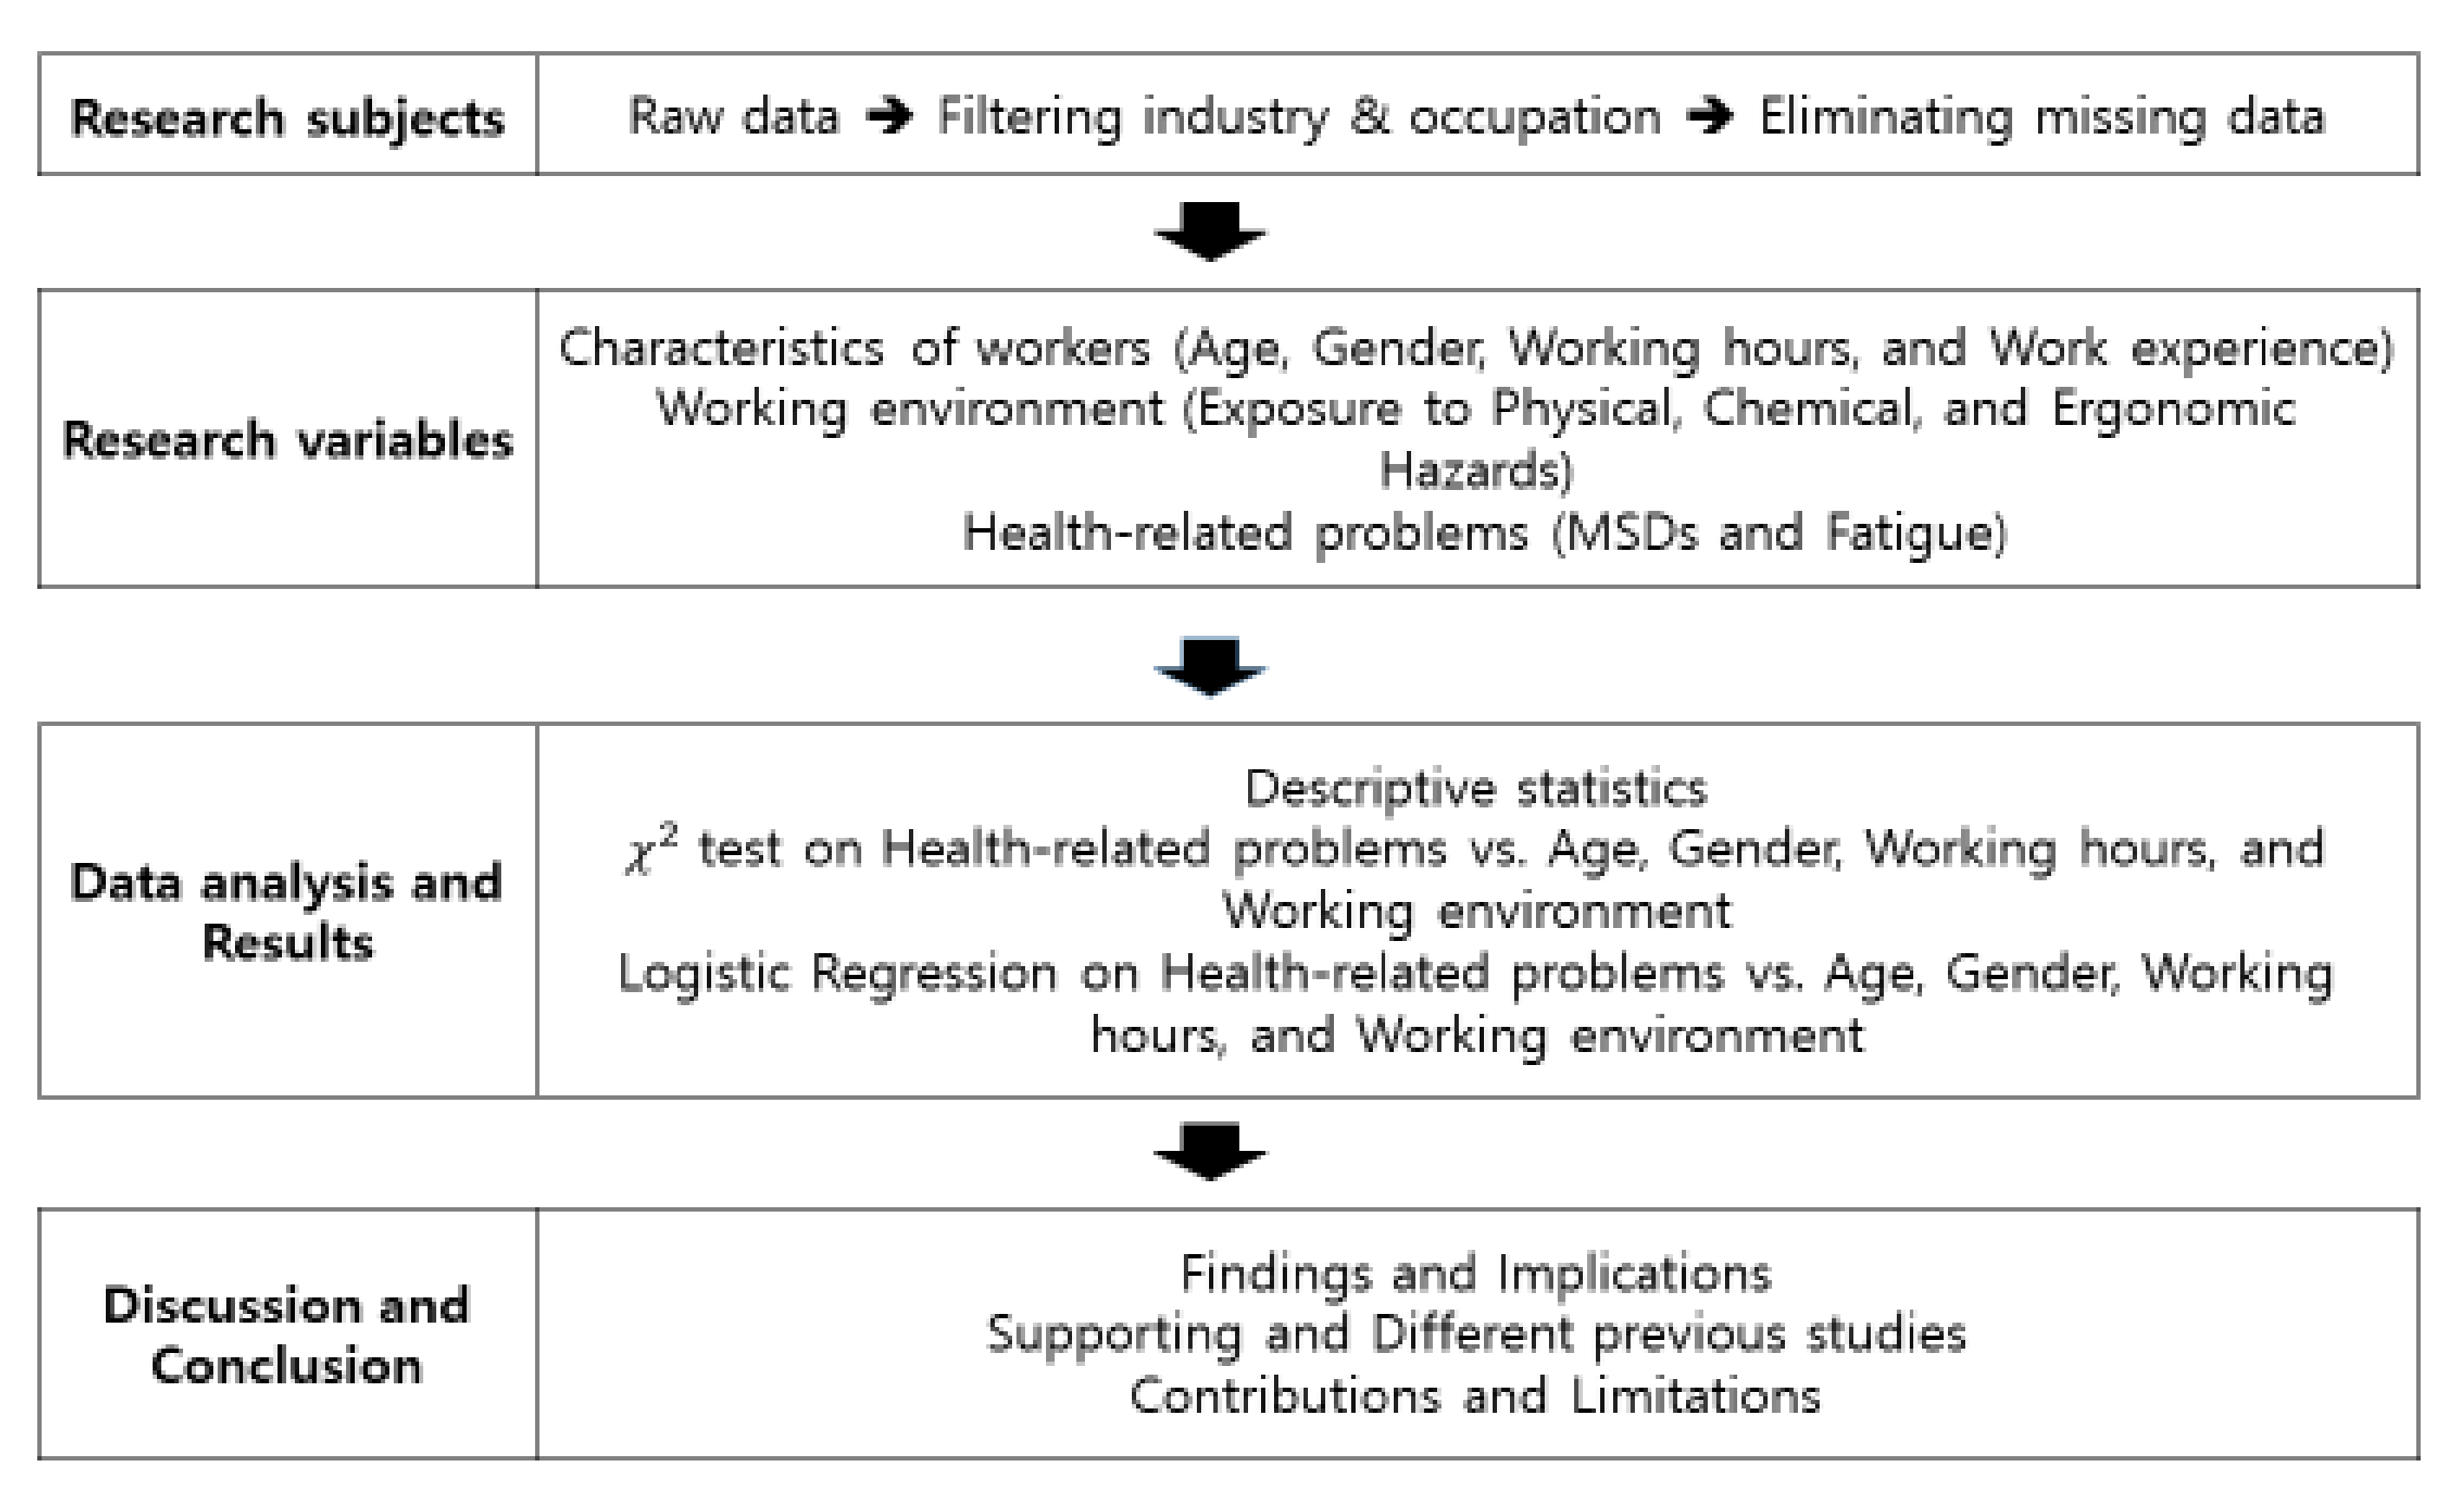
2. Materials and Methods

The extraction of research subjects, the selection of research variables, data analysis, results, discussion on the findings, and conclusive remarks are summarized in Figure 1.

2.1. Data Collection

The raw data of the 5th Korean Working Conditions Survey (KWCS) [22], which was open to the public to promote secondary analysis, was used for this study. The KWCS is the Korean version of the European Working Conditions Survey (EWCS) [23]. The KWCS is a periodic national survey that is designed to investigate risk factors and working conditions of workers by industry and occupation [22]. The KWCS was conducted by professional interviewers [22]. The response rate of the 5th KWCS was 0.449, and 50,205 workers in proportion to each region’s population participated. According to the Korean Standard Industrial Classification (KSIC) [24], we extracted automobile manufacturing workers (workers in “manufacture of motor vehicles and engines for motor vehicles” and in “manufacture of parts and accessories for motor vehicles (new products)”) in the production process and filtered 446 production workers as subjects. They consisted of 15.5% under 29 years, 23.3% in their 30s, 26.5% in their 40s, and 34.8% aged 50 or older. The mean of work experience is 9.85 years. The mean of monthly wage is 3.74 million South Korean Won (KRW). The mean of working hours per week was 44.14 h.

2.2. Research Variables

Table 1 shows the research variables of this study. The research variables consisted of the characteristics of workers, working environments, and the health-related problems from the KWCS questionnaire [22]. Table 1 presents the research variables, descriptions (or questions), and scores observed. Worker characteristics consisted of age, gender, work experience, and working hours per week. Most workers begin their career in their early 20s (female) or mid 20s (male) and retire in their late 50s or early 60s in Korea. Accordingly, the age groups of workers were classified into the following categories: under 29, the 30s, the 40s, and 50 or older. The voluntary turnover rate for those with early careers peaks one to two years after joining the company and shows relatively high value until 5 years, and then tends to decrease [25]. Taking this into consideration, the duration of work experience was classified into less than three years, three to five years, and longer than five years.
Working environment characteristics consisted of exposure to physical and mechanical hazards, ergonomic hazards, and chemical and biological hazards. Exposure to hazards was measured by the adjusted daily hazard exposure time (ADHE). ADHE was assessed on a daily basis by dividing working hours per week by working days per week and then multiplying the frequency of hazard exposures. The frequency of hazard exposure is answered by the questionnaire asking about the proportion of working time exposed to a sort of hazard with seven possible answers (“all of the time”, “almost all of the time”, “around 3/4 of the time”, “around half of the time”, “around 1/4 of the time”, “almost never”, and “never”). The frequency of hazard exposure is as follows: 0.75 for “all of the time”, “almost all of the time”, and “around 3/4 of the time”; 0.5 for “around half of the time”; 0.25 for “around 1/4 of the time”; 0.1 for “almost never” and “never”). Physical or mechanical hazards (exposure to vibration, noise, high and low temperature), chemical and biological hazards (exposure to fumes, and dust, vapor, skin contact, tobacco smoke, infection), and ergonomic hazards (exposure to awkward posture, handling of heavy objects, standing posture, and repetitive motion) comprised the characteristics of the working environment.
Health-related problems are complaints of musculoskeletal pain (backache, upper limb pain, lower limb pain, and any pain (pain complaints in any one of back, upper limb, and lower limb)) and complaints of overall fatigue. Musculoskeletal pain complaints or overall fatigue were answered in response to the question “Over the last 12 months, did you have any of the following health problems due to your job?” with the answer “yes” or “no”.

2.3. Data Analysis

The descriptive statistics for the degree of exposure to physical, ergonomic, and chemical/biological hazards of the respondents are given.
In addition, the χ2 test was done to test whether there is a difference in the distribution of complaints of musculoskeletal pain and the overall fatigue in view of age group, gender, work experience, working hours per week, and ADHE of working environment hazards.
Odds ratios (OR) and 95% confidence intervals (95% CI) for complaints of musculoskeletal pain and overall fatigue according to age, gender, work experience, working hours per week, and working environment hazards were estimated using a logistic regression model. The Hosmer-Lemeshow test (HL test) for goodness of fit test is used for logistic regression and the Nagelkerke’s R squared is used for the power of explanation of the model. The overall classification accuracy rate to assess the performance of a model is also provided.
The statistical package used for statistical analysis was SPSS 18.0, and the significance level was 0.05.

3. Results

3.1. Comparison of Working Environment Hazard Exposures

Table 2 compares the degree of exposure to physical, ergonomic, and chemical/biological hazards of the respondents.
As for the degree of exposure to the physical hazard, vibration (3.551) was the most exposed, followed by noise (2.707), high temperature (2.127), and low temperature (1.619). In view of the ergonomic hazards, the degree of exposure was the highest in repetitive motion (5.019), followed by standing posture (4.447), awkward posture (3.160), and material handling (2.392).
As for the degree of exposure to chemical and biological hazards, fumes and dust (2.152) was the most exposed, followed by skin contact (1.428), vapor (1.401), tobacco smoke (1.160), and infection (1.102).

3.2. Comparison of Self-Reported Musculoskeletal Pains and Overall Fatigue

3.2.1. Self-Reported Musculoskeletal Pains and Overall Fatigue by Age Group

Table 3 presents the distribution of self-reported musculoskeletal pains and overall fatigue by age group. The complaint rate for musculoskeletal pain in any one area was the highest at 27.4%, followed by upper limb pain (22.4%), overall fatigue (21.1%), lower limb pain (11.7%), and backache (7.6%). Upper limb pain (χ2 = 11.077, p = 0.011), and pain in any one area (χ2 = 8.649, p = 0.034) were different by age group. Upper limb pain was the highest for the group in their 40s (26.3%) and pain in any one area was the highest for the group in their 30s (31.7%). There is no significant age group difference in backache, lower limb pain, and overall fatigue.

3.2.2. Self-Reported Musculoskeletal Pains and Overall Fatigue by Gender

Table 4 presents the distribution of self-reported musculoskeletal pains and overall fatigue by gender. Upper limb pain (χ2 = 5.991, p = 0.014), pain in any one area (χ2 = 5.127, p = 0.018), and overall fatigue (χ2 = 5.015, p = 0.025) were different by gender. Upper limb pain (32.5%), pain in any one area (27.4%), and overall fatigue (30.1%) were higher females. There is no significant gender difference in backache and lower limb pain.

3.2.3. Self-Reported Musculoskeletal Pains and Overall Fatigue by Working Hours

Table 5 presents the distribution of self-reported musculoskeletal pains and overall fatigue by working hours per week. Upper limb pain (χ2 = 4.375, p = 0.036), pain in any one area (χ2 = 5.133, p = 0.016), and overall fatigue (χ2 = 7.269, p = 0.007) were different by working hours per week. Upper limb pain (27.6%), pain in any one area (33.3%), and overall fatigue (27.6%) were higher for those who work longer than 41 h per week. There is no significant difference in backache and lower limb pain.

3.3. Self-Reported Overall Fatigue and Musculoskeletal Pains by the Degree of Hazard Exposure

3.3.1. Self-Reported Overall Fatigue by the Degree of Hazard Exposure

Table 6 shows the distribution of self-reported overall fatigue by the degree of hazard exposure. The interpretation of the percentages in the table is as follows. Among 137 subjects having less than two ADHE of vibration exposure, 20 (14.6%) subjects complained of overall fatigue. Among 80 subjects having two to four ADHE of vibration exposure, 13 (16.3%) subjects complained of overall fatigue. And among 229 subjects having more than four ADHE of vibration exposure, 61 (26.6%) subjects complained of overall fatigue. This interpretation of the table is also applied to Table 7, Table 8, Table 9 and Table 10.
There were significant differences between the overall fatigue complaining group and the non-complaining group in most of the hazards except low-temperature exposure (χ2 = 3.378, p = 0.185) and standing posture exposure (χ2 = 4.062, p = 0.131). The proportion of the overall fatigue complaining group increases as the ADHE of hazard exposure increases. Exposure to chemical and biological hazards is the major source of overall fatigue, and longer exposure to tobacco smoke shows the highest rate of complaining of overall fatigue (52.6%).

3.3.2. Self-Reported Backache by the Degree of Hazard Exposure

Table 7 shows the distribution of self-reported backache by the degree of hazard exposure.
There were significant differences between the backache complaining group and the non-complaining group in noise exposure (χ2 = 8.923, p = 0.012), high-temperature exposure (χ2 = 11.152, p = 0.004), awkward posture exposure (χ2 = 10.545, p = 0.005), manual material handling exposure (χ2 = 7.082, p = 0.029), and infection exposure (χ2 = 6.786, p = 0.034). The proportion of the backache complaining group increases as the degree of hazard exposure increases. Longer exposure to infectious material shows the highest rate of backache (21.1%).

3.3.3. Self-Reported Upper Limb Pain by the Degree of Hazard Exposure

Table 8 shows the distribution of self-reported upper limb pain by the degree of hazard exposure.
There were significant differences between the upper limb pain complaining group and the non-complaining group in most of the hazards except manual material handling exposure (χ2 = 4.169, p = 0.124) and infection exposure (χ2 = 4.735, p = 0.094). The proportion of the upper limb pain complaining group increases as the degree of hazard exposure increases. Longer exposure to tobacco smoke shows the highest rate of complaining of upper limb pain (47.4%).

3.3.4. Self-Reported Lower Limb Pain by the Degree of Hazard Exposure

Table 9 shows the distribution of self-reported lower limb pain by the degree of hazard exposure.
There were significant differences between the lower limb pain complaining group and the non-complaining group in most of the hazards except vibration exposure (χ2 = 2.811, p = 0.245), standing posture exposure (χ2 = 5.604, p = 0.061) and infection exposure (χ2 = 2.593, p = 0.274). The proportion of the lower limb pain complaining group increases as the degree of hazard exposure increases.

3.3.5. Self-Reported Pain Complaints in Any One Area by the Degree of Hazard Exposure

Table 10 shows the distribution of self-reported pain complaints in any one area by the degree of hazard exposure.
There were significant differences between the pain complaints in any one area complaining group and the non-complaining group in most of the hazards except infection exposure (χ2 = 4.847, p = 0.089). The proportion of the pain complaints in any one area complaining group increases as the degree of hazard exposure increases. Exposure to chemical and biological hazards is the major source of pain complaints in any one area.

3.4. Logistic Regression Analysis on Self-Reported Overall Fatigue and Musculoskeletal Pains

3.4.1. Logistic Regression Analysis on Overall Fatigue

Results of logistic regression on overall fatigue are presented in Table 11. We classified 446 subjects into two groups depending on the complaint of overall fatigue. The power of explanation of the model was acceptable (Nagelkerke value = 0.194) and the model seems to fit quite well (χ2 = 5.684, significance value = 0.683). The overall rate of correct classification (classification accuracy) was estimated as 80.9%.
Gender (p = 0.043), exposure to fumes and dust (p < 0.001), exposure to manual heavy loads handling (p = 0.015), and exposure to repetitive motion (p = 0.023) were the risk factors for overall fatigue. Complaints of overall fatigue among females was 1.835 times more likely than for male subjects. Complaints of overall fatigue among those who have more than four ADHE of fumes and dust exposure was 4.150 times more likely than for those who have less than two ADHE of fumes and dust exposure. Complaints of overall fatigue among those who have more than four ADHE of manual heavy loads handling exposure was 4.150 times more likely than those who have less than two ADHE of manual heavy loads handling exposure.

3.4.2. Logistic Regression Analysis on Backache

Results of logistic regression on backache are presented in Table 12. Four hundred and forty six subjects were classified into two groups depending on the complaint of backache. The power of explanation of the model was acceptable (Nagelkerke value = 0.084) and the model seems to fit quite well (χ2 = 4.354, significance value = 0.500). The overall rate of correct classification (classification accuracy) was estimated as 92.4%.
Exposure to awkward posture (p = 0.045) was the risk factor for backache. Complaints of backache among those who have more than four ADHE of noise exposure was 2.546 times more likely than those who have less than two ADHE of noise exposure. Complaints of backache among those who have more than four ADHE of awkward posture exposure was 2.749 times more likely than for those who have less than two ADHE of awkward posture exposure.

3.4.3. Logistic Regression Analysis on Upper Limb Pain

The results of logistic regression on upper limb pain are presented in Table 13. 446 subjects were classified into two groups depending on the complaint of upper limb pain. The power of explanation of the model was acceptable (Nagelkerke value = 0.135), and the model seems to fit quite well (χ2 = 2.551, significance value = 0.863). The overall rate of correct classification (classification accuracy) was estimated as 78.7%.
Gender (p = 0.007), work experience (p = 0.020), and exposure to fumes and dust (p < 0.001) were the risk factors for upper limb pain. Complaints of upper limb pain among females was 2.342 times more likely than for males. Complaints of upper limb pain among those who have three to four years of work experience was 3.224 times more likely than those who have less than two years of work experience. Complaints of upper limb pain among those who have more than five years of work experience was 2.640 times more likely than those who have less than two years of work experience. Complaints of upper limb pain among those who have more than four ADHE of fumes and dust exposure was 4.033 times more likely than those who have less than two ADHE of fumes and dust exposure.

3.4.4. Logistic Regression Analysis on Lower Limb Pain

Results of logistic regression on lower limb pain are presented in Table 14. We classified 446 subjects into two groups according to whether or not they had complained of lower limb pain. The explanatory power of the model was acceptable (Nagelkerke value = 0.163) and the model seems to fit quite well (χ2 = 3.834, significance value = 0.574). The overall rate of correct classification (classification accuracy) was estimated as 88.3%.
Exposure to fumes and dust (p < 0.001)) was the risk factor for lower limb pain. Complaints of lower limb pain among those who have more than four ADHE of fumes and dust exposure was 4.074 times more likely than those who have less than two ADHE of fumes and dust exposure.

3.4.5. Logistic Regression Analysis on Pain Complaints in Any One Area

The results of logistic regression on pain in any one area are presented in Table 15. Four hundred and forty six subjects were classified into two groups depending on the pain complaints in any one area. The power of explanation of the model was acceptable (Nagelkerke value = 0.167) and the model seems to fit quite well (χ2 = 2.130, significance value = 0.952). The overall rate of correct classification (classification accuracy) was estimated as 74.4%.
Gender (p = 0.012), work experience (p = 0.002), working hours per week (p = 0.015), and exposure to high temperature (p < 0.001) were the risk factors for pain in any one area. Complaints of pain in any one area among females was 2.018 times more likely than for males. Complaints of pain in any one area among those who have three to five years of work experience was 4.165 times more likely than those who have less than three years of work experience. Complaints of pain in any one area among those who have more than five years of work experience was 3.009 times more likely than those who have less than three years of work experience. Complaints of pain in any one area among those who work longer than or equal to 41 h per week was 1.805 times more likely than those who work less than 41 h per week. Complaints of pain in any one area among those who have more than four ADHE of high-temperature exposure was 4.033 times more likely than those who have less than two ADHE of high-temperature exposure.

4. Discussion

In this study, the characteristics of workers, working environments, and work-related health problems were analyzed for production workers in the automobile manufacturing industry.
As for health problems, the complaint rate for backache was the lowest. This is consistent with the trend that among musculoskeletal diseases, the number of patients with low back pain caused by excessive force such as handling heavy objects is gradually decreasing, but the number of patients suffering from physical burdens such as repetitive motions and awkward posture increases every year in Korea [26].
The complaints of some work-related health problems were different by age, gender, and working hours per week. The complaint rate of upper limb pain increases to the highest for those in their 40s (26.3%). Musculoskeletal disorders are health disorders that occur in workers who are engaged in long-term work that repeatedly burdens the body. It is more likely to occur in older workers than in younger workers since aging leads to a decrease in bone mass and in bone density due to changes in the musculoskeletal system [27,28,29,30]. Upper limb pain (32.5%) and overall fatigue (30.1%) were higher for females. This is consistent with the review article showing that females had significantly higher incidences of various types of upper extremity musculoskeletal disorders [31]. The gender difference can be attributed to the fact that the females are more comfortable reporting discomfort than men, or that women report more illnesses than men [32,33,34,35]. Upper limb pain (27.6%), pain complaints in any one area (33.3%), and overall fatigue (27.6%) were higher for those who work longer than 41 h per week. It was consistent with the results showing that the risk of musculoskeletal symptoms increases because the musculoskeletal system’s opportunity to rest and recover decreases with prolonged physical load duration through prolonged work [36,37,38].
The proportions of the overall fatigue and MSDs complaining group increase as the hazard exposure time increases, as was expected. It was consistent with the results showing hazards in the work process such as repetitive use of specific body parts, excessive force, a cold work environment, vibration, and chronic exposure to awkward postures that results in MSDs [39,40,41,42,43].
Exposure to chemical and biological hazards is the major source of overall fatigue. Longer exposure to tobacco smoke shows the highest rate of complaining of overall fatigue, upper limb pain, and pain in any area. It was consistent with the results that show that the high fatigue group were more likely to claim regular exposure to second-hand cigarette smoke than the low fatigue group [44]. Lee et al. [45] discuss the effect of the second-hand smoke relating to fatigue, sleep disorders, and decreased physical and mental functioning. Exposure to second-hand tobacco smoke is associated with reduced muscle strength [46] and leads to increased respiratory symptoms and reduction of pulmonary function [47]. Respiratory symptoms can induce disc herniation through coughing or cause pathological changes in the intervertebral disc [48]. Longer exposures to infectious material shows the highest complaining rate of backache. As for infections in the automobile manufacturing industry, there is little chance of handling or being in direct contact with bodily fluids, laboratory materials, etc. Handling the waste from production processes may be considered to be exposure to infectious material. Wearing protection gear when handling the waste could cause MSDs.
The results of logistic regression on overall fatigue show that gender, exposure to fumes and dust, to manual heavy load handling, and to repetitive motion were the risk factors for overall fatigue. Complaints of overall fatigue among females was more likely than for males. Complaints of overall fatigue among those who have long exposure to fumes and dust and to manual heavy loads handling was more likely than those who have less exposure. Guo et al. [49] state that work-related fatigue is significantly correlated with the working environment and the duration of the working day.
Results of logistic regression on MSDs show that longer exposure to noise and awkward posture was the risk factor for backache. Noise is the source of MSDs, but previous studies do not support the association between noise and backache. Preceding studies support the strong association between noise and head and neck pain [43,50,51,52]. Basner et al. [51] state that noise can lead to stress and stress-related responses and Evans and Johnson [50] state that a link between stress exposure and MSDs may result from the effects of noise. Magnavita et al. [43] show the association between upper limb disorders and noise and light complaints.
Complaints of upper limb pain among females, those with longer work experience, and those with longer exposure to fumes and dust were more likely. Complaints of lower limb pain among those who have long exposure to fumes and dust was more likely than those who have less exposure. In the automobile industry, fumes and dust are found in foundry processes, casting, heat treatment, machining, welding, plastic works, and vehicle assembly [4]. The exact mechanism through which exposure to fumes and dust at work relates to musculoskeletal pains is not known. Previous studies on the respiratory syndrome in the automobile manufacturing process indicate that exposure to metal dust, welding fumes, and metalworking fluids contribute to the increase of respiratory syndromes such as asthma [53,54,55]. Lunardi et al. [56] state that adults with persistent asthma develop chronic alterations in posture and have musculoskeletal problems irrespective of the severity of their disease. Wearing protection gear could affect fatigue and potentially pain responses. Workers should wear respirators, eye and face protection, hand and arm protection, and oil-resistant aprons if necessary [4]. Wearing respirators makes it uncomfortable to breathe and leads to fatigue [57,58]. It is also recognized that working in dirty environments is a psychosocial risk factor and that psychosocial stressors are related to MSDs [59,60].
The results of logistic regression on pain complaints in any one area show that gender, work experience, working hours per week, and exposure to high temperature were the risk factors for upper limb pain. Magnavita et al. [43] show that the association between upper limb disorders and temperature complaints, including both too high and too low temperature.

5. Conclusions and Limitations of the Study

This study has limitations. First, the KWCS data based on a questionnaire is used in this study. All of the information on exposure to working environment hazards and work-related health problems was self-reported. Second, the factors considered in this study are the work environment characteristics, but there are also personal and socio-psychological characteristics to be considered [61]. Drinking, exercise, hobbies, housework, and personal medical history were considered to be personal factors. In addition, low job satisfaction and lack of social support from colleagues and superiors are considered to be influential as socio-psychological factors [6,41]. In terms of further studies, the implementation of safety culture analyses including psychological and communication factors will contribute to the safety and health of automobile manufacturing workers.
This study derives factors affecting the overall fatigue and musculoskeletal pain of production workers in the automobile manufacturing industry. Furthermore, it is considered to be meaningful as basic data for systematic prevention measures and can serve as an educational guide on overall fatigue and musculoskeletal pain.
In spite of the many improvements in the working environment for the automobile manufacturing industry, more efforts should be made to reduce the exposure to working environment hazards for production workers. It is recommended that a working environment with enclosed workstations be developed, in order to address the sources of noise, fumes and dust, and uncomfortable temperature, with appropriate ventilation for smoke or fumes and dust and vapor, with light weight personal protection gear for noise, fumes and dust, and vapor, and with devices to reduce ergonomic discomfort. Furthermore, measures considering the type of hazard exposures for each production process are to be prepared to secure safety and health for the production workers in the automobile manufacturing industry.

Author Contributions

Conceptualization, J.W.K. and B.Y.J. and M.H.P.; methodology, J.W.K. and M.H.P. and B.Y.J.; data collection & analysis, J.W.K.; resources, J.W.K. and B.Y.J.; data curation, J.W.K. and M.H.P.; writing—original draft preparation, J.W.K. and B.Y.J. and M.H.P.; writing—review and editing, B.Y.J. and M.H.P.; supervision, B.Y.J. and M.H.P.; funding acquisition, M.H.P. All authors have read and agreed to the published version of the manuscript.

Funding

This research was financially supported by Hansung University.

Institutional Review Board Statement

Not applicable.

Informed Consent Statement

Not applicable.

Acknowledgments

The authors are grateful to the Occupational Safety and Health Research Institute (OSHRI) and the Korea Occupational Safety and Health Agency (KOSHA) for providing the raw data from the KWCS.

Conflicts of Interest

The authors declare that they have no conflicts of interest.

References

  1. Haugh, D.; Mourougane, A.; Chatal, O. The Automobile Industry in and Beyond the Crisis; OECD Economics Department Working Papers, No. 745; OECD Publishing: Paris, France, 2010. [Google Scholar]
  2. KOSIS. Survey of Business Activities. 2019. Available online: https://kosis.kr/statisticsList/statisticsListIndex.do?vwcd=MT_ZTITLE&menuId=M_01_01 (accessed on 1 May 2021).
  3. BLS. National Industry-Specific Occupational Employment and Wage Estimates. 2020. Available online: https://www.bls.gov/oes/current/naics3_336000.htm (accessed on 1 May 2021).
  4. ILO. ILO Encyclopaedia of Occupational Health and Safety. 2012. Available online: https://www.ilo.org/safework/info/publications/WCMS_113329/lang--en/index.htm (accessed on 1 May 2021).
  5. Jeong, B.Y. Ergonomics’ role for preventing musculoskeletal disorders. J. Ergon. Soc. Korea 2010, 29, 393–404. [Google Scholar] [CrossRef] [Green Version]
  6. Punnett, L.; Wegman, D.H. Work-related musculoskeletal disorders: The epidemiologic evidence and the debate. J. Electromyogr. Kinesiol. 2004, 14, 13–23. [Google Scholar] [CrossRef] [PubMed]
  7. Yang, S.T.; Jeong, B.Y.; Park, M.H. Characteristics of occupational injuries in the automobile parts manufacturing industry. J. Ergon. Soc. Korea 2017, 36, 231–244. [Google Scholar]
  8. Ferguson, S.A.; Marras, W.S.; Allread, W.G.; Knapik, G.G.; Splittstoesser, R.E. Musculoskeletal disorder risk during automotive assembly: Current vs. seated. Appl. Ergon. 2012, 43, 671–678. [Google Scholar] [CrossRef] [PubMed] [Green Version]
  9. Landau, K.; Rademacher, H.; Meschke, H.; Winter, G.; Schaub, K.; Grasmueck, M.; Moelbert, I.; Sommer, M.; Schulze, J. Musculoskeletal disorders in assembly jobs in the automotive industry with special reference to age management aspects. Int. J. Ind. Ergon. 2008, 38, 561–576. [Google Scholar] [CrossRef]
  10. Ulin, S.S.; Keyserling, W.M. Case studies of ergonomic interventions in automobile parts distribution operations. J. Occup. Rehabil. 2004, 14, 307–326. [Google Scholar] [CrossRef] [PubMed] [Green Version]
  11. Ministry of Employment and Labor. Industrial Accident Analysis by Business Type. 2019. Available online: https://www.kosha.or.kr/kosha/data/industrialAccidentStatus.do?mode=list&article.offset=0&articleLimit=10 (accessed on 1 September 2021).
  12. Lim, H.K.; Luo, M.L.; Kim, D.G.; Kim, H.Y. Prevention and Management of Musculoskeletal Disorders in Automobile-related Industries. J. Ergon. Soc. Korea 2010, 29, 479–486. [Google Scholar] [CrossRef] [Green Version]
  13. Lee, K.H.; Lee, K.S. Effects of Fatigue on Health Promotion Behavior and Mental Health of Automotive Manufacturing Workers. Korean J. Occup. Health Nurs. 2011, 20, 143–152. [Google Scholar] [CrossRef]
  14. Deros, B.M.; Daruis, D.D.I.; Ismail, A.R.; Sawal, N.A.; Ghani, J.A. Work-related musculoskeletal disorders among workers’ performing manual material handling work in an automotive manufacturing company. Am. J. Appl. Sci. 2010, 7, 1087–1092. [Google Scholar] [CrossRef] [Green Version]
  15. Guo, H.R.; Chang, Y.C.; Yeh, W.Y.; Chen, C.W.; Guo, Y.L. Prevalence of musculoskeletal disorder among workers in Taiwan: A nationwide study. J. Occup. Health 2004, 46, 26–36. [Google Scholar] [CrossRef] [Green Version]
  16. Jeon, I.S.; Jeong, B.Y. Effect of job rotation types on productivity, accident Rate, and satisfaction in the automotive assembly line workers. Hum. Factors Ergon. Manuf. Serv. Ind. 2016, 26, 455–462. [Google Scholar] [CrossRef]
  17. Kang, F.M.; Shan, Y.L.; Feng, B.; Wang, Z.X. An investigation of musculoskeletal disorders at multiple sites and related influencing factors among workers in an automobile assembly shop. Chin. J. Ind. Hyg. Occup. Dis. 2021, 39, 40–43. [Google Scholar]
  18. Jamdade, B.; Shimpi, A.; Rairikar, S. Factors Predisposing to Work Related Low Back Pain in Automobile Industry Workers—A Hypothesis. J. Med. Thes. 2015, 3, 26. [Google Scholar]
  19. Jamdade, B.; Shimpi, A.; Rairikar, S.; Shyam, A.; Sancheti, P. Factors predisposing to work-related lower back pain in automobile industry workers. Int. J. Occup. Saf. Ergo. 2021, 27, 79–85. [Google Scholar] [CrossRef]
  20. Akter, S.; Rahman, M.M.; Mandal, S.; Nahar, N. Musculoskeletal symptoms and physical risk factors among automobile mechanics in Dhaka, Bangladesh. South East Asia J. Public Health 2016, 6, 8–13. [Google Scholar] [CrossRef] [Green Version]
  21. Alipour, A.; Ghaffari, M.; Shariati, B.; Jensen, I.; Vingard, E. Occupational neck and shoulder pain among automobile manufacturing workers in Iran. Am. J. Ind. Med. 2008, 51, 372–379. [Google Scholar] [CrossRef]
  22. 5th Korean Working Conditions Survey. Available online: http://oshri.kosha.or.kr/eoshri/resources/KWCSDownload.do (accessed on 10 May 2020).
  23. 6th European Working Conditions Survey (2015) Questionnaire. Available online: https://www.eurofound.europa.eu/sites/default/files/page/field_ef_documents/6th_ewcs_2015_final_source_master_questionnaire.pdf (accessed on 1 May 2021).
  24. Korean Standard Industrial Classification (KSIC). 2017. Available online: http://kssc.kostat.go.kr/ksscNew_web/ekssc/main/main.do# (accessed on 1 September 2021).
  25. Hom, P.W.; Roberson, L.; Ellis, A.D. Challenging conventional wisdom about who quits: Revelations from corporate America. J. Appl. Psycho. 2008, 93, 1. [Google Scholar] [CrossRef]
  26. Eun, S.; Kim, K. Physical activity and related factors to prevent musculoskeletal disorders in blue-collar workers. Korean J. Health Educ. Prom. 2019, 36, 43–51. [Google Scholar] [CrossRef]
  27. Buckwalter, J.A.; Woo, S.L.-Y.; Goldberg, V.M.; Hadley, E.C.; Booth, F.; Oegema, T.R.; Eyre, D.R. Current concepts review: Soft-tissue aging and musculoskeletal function. J. Bone Jt. Surg. 1993, 75, 1533–1548. [Google Scholar] [CrossRef]
  28. Jette, A.M.; Branch, L.G.; Berlin, J. Musculoskeletal impairments and physical disablement among the aged. J. Gerontol. 1990, 45, M203–M208. [Google Scholar] [CrossRef]
  29. Sabrina, N.W.; Lesia, L.C. Investigating the work ability of older employees. Int. J. Ind. Ergonom. 1997, 20, 241–249. [Google Scholar]
  30. Yang, Y.A. The Responding Strategies of Musculoskeletal Disease in Aging Society. J. Ergon. Soc. Korea 2010, 29, 505–511. [Google Scholar] [CrossRef] [Green Version]
  31. Treaster, D.E.; Burr, D. Gender differences in prevalence of upper extremity musculoskeletal disorders. Ergonomics 2004, 47, 495–526. [Google Scholar] [CrossRef]
  32. Elderkin-Thompson, V.; Waitzkin, H. Differences in clinical communication by gender. J. Gen. Intern. Med. 1999, 14, 112–121. [Google Scholar] [CrossRef]
  33. Verbrugge, L.M. Sex differences in complaints and diagnoses. J. Behav. Med. 1980, 3, 327–355. [Google Scholar] [CrossRef] [Green Version]
  34. Nathanson, C.A. Illness and the feminine role: A theoretical review. Soc. Sci. Med. 1975, 9, 57–62. [Google Scholar] [CrossRef]
  35. Wodak, R. Women relate, men report: Sex differences in language behaviour in a therapeutic group. J. Pragmat. 1981, 5, 261–285. [Google Scholar] [CrossRef]
  36. Ando, H.; Ikegami, K.; Sugano, R.; Nozawa, H.; Michii, S.; Shirasaka, T.; Ogami, A. Relationships between chronic musculoskeletal pain and working hours and sleeping hours: A cross-sectional study. J. UOEH 2019, 41, 25–33. [Google Scholar] [CrossRef]
  37. Lee, J.G.; Kim, G.H.; Jung, S.W.; Kim, S.W.; Lee, J.H.; Lee, K.J. The association between long working hours and work-related musculoskeletal symptoms of Korean wage workers: Data from the fourth Korean working conditions survey (a cross-sectional study). Ann. Occup. Environ. Med. 2018, 30, 67. [Google Scholar] [CrossRef]
  38. Garza, J.L.; Ferguson, J.M.; Dugan, A.G.; Decker, R.E.; Laguerre, R.A.; Suleiman, A.O.; Cavallari, J.M. Investigating the relationship between working time characteristics on musculoskeletal symptoms: A cross sectional study. Arch. Environ. Occup. Health 2022, 77, 141–148. [Google Scholar] [CrossRef]
  39. National Institute for Occupational Safety and Health (Estados Unidos). Musculoskeletal Disorders (MSDs) and Workplace Factors: A Critical Review of Epidemiologic Evidence for Work-Related Musculoskeletal Disorders of the Neck, Upper Extremity and Low Back (Archivo de Internet). Niosh. Available online: https://www.cdc.gov/niosh/docs/97-141/default.html (accessed on 27 February 2022).
  40. Sluiter, J.K.; Rest, K.M.; Frings-Dresen, M.H.W. Criteria document for evaluating the work-relatedness of upper-extremity musculoskeletal disorders. Scand. J. Work Environ. Health 2001, 27, 1–102. [Google Scholar] [CrossRef] [PubMed] [Green Version]
  41. Kim, K.S.; Hong, C.W.; Lee, D.K.; Jeong, B.Y. Factors Affecting Musculoskeletal Symptoms of Manufacturing Workers. J. Korean Soc. Occup. Environ. Hyg. 2009, 19, 390–402. [Google Scholar]
  42. Park, H.S.; Lee, Y.K.; Yim, S.H. Prevention of the Musculoskeletal Disorders at Upper or Lower Extremities. J. Ergon. Soc. Korea 2010, 29, 455–463. [Google Scholar] [CrossRef] [Green Version]
  43. Magnavita, N.; Elovainio, M.; De Nardis, I.; Heponiemi, T.; Bergamaschi, A. Environmental discomfort and musculoskeletal disorders. Occup. Med. 2011, 61, 196–201. [Google Scholar] [CrossRef] [PubMed] [Green Version]
  44. Hicks, R.A.; Fernandez, C.; Hicks, G.J. Fatigue and exposure to cigarette smoke. Psychol. Rep. 2003, 92, 1040–1042. [Google Scholar] [CrossRef]
  45. Lee, W.; Lee, S.; Kim, J.; Kim, J.; Kim, Y.K.; Kim, K.; Yoon, J.H. Relationship between exposure to second-hand smoke in the workplace and occupational injury in the Republic of Korea. Ann. Work Expo. Heatlh 2018, 62, 41–52. [Google Scholar] [CrossRef]
  46. Carrasco-Rios, M.; Ortolá, R.; Rodríguez-Artalejo, F.; García-Esquinas, E. Exposure to secondhand tobacco smoke is associated with reduced muscle strength in US adults. Aging 2019, 11, 12674. [Google Scholar] [CrossRef]
  47. Bird, Y.; Staines-Orozco, H. Pulmonary effects of active smoking and secondhand smoke exposure among adolescent students in Juárez, Mexico. Int. J. Chronic Obstr. 2016, 11, 1459. [Google Scholar]
  48. Biering, S.F.; Thomsen, C. Medical, social and occupational history as risk indicators for low-back trouble in a general population. Spine 1986, 11, 720–725. [Google Scholar] [CrossRef]
  49. Guo, F.; Wang, T.; Ning, Z. Subjective measures of work-related fatigue in automobile factory employees. Work 2017, 58, 233–240. [Google Scholar] [CrossRef]
  50. Evans, G.W.; Johnson, D. Stress and open-office noise. J. Appl. Psychol. 2000, 85, 779–783. [Google Scholar] [CrossRef] [Green Version]
  51. Basner, M.; Babisch, W.; Davis, A.; Brink, M.; Clark, C.; Janssen, S.; Stansfeld, S. Auditory and non-auditory effects of noise on health. Lancet 2014, 383, 1325–1332. [Google Scholar] [CrossRef] [Green Version]
  52. Levy, C.D. The Relationship between Ergonomics of the Office Workstation and Related Musculoskeletal Disorders in Library Administrative Staff at the Durban University of Technology. Ph.D. Thesis, Durban University of Technology, Durban, South Africa, 2018. [Google Scholar]
  53. Park, R.M. Medical insurance claims and surveillance for occupational disease: Analysis of respiratory, cardiac, and cancer outcomes in auto industry tool grinding operations. J. Occup. Environ. Med. 2001, 43, 335–346. [Google Scholar] [CrossRef]
  54. Hammond, S.K.; Gold, E.; Baker, R.; Quinlan, P.; Smith, W.; Pandya, R.; Balmes, J. Respiratory health effects related to occupational spray painting and welding. J. Occup. Environ. Med. 2005, 47, 728–739. [Google Scholar] [CrossRef]
  55. Jaakkola, M.S.; Suuronen, K.; Luukkonen, R.; Järvelä, M.; Tuomi, T.; Alanko, K.; Jolanki, R. Respiratory symptoms and conditions related to occupational exposures in machine shops. Scand. J. Work Environ. Heath 2009, 35, 64–73. [Google Scholar] [CrossRef] [Green Version]
  56. Lunardi, A.C.; Marques da Silva, C.C.B.; Rodrigues Mendes, F.A.; Marques, A.P.; Stelmach, R.; Fernandes Carvalho, C.R. Musculoskeletal dysfunction and pain in adults with asthma. J. Asthma 2011, 48, 105–110. [Google Scholar] [CrossRef]
  57. Bach, M.A. Auto Body Paint Workers: An Assessment of Respirators and Occupational Fatigue; State University of New York: Binghamton, NY, USA, 2015. [Google Scholar]
  58. Seliga, R.; Bhattacharya, A.; Succop, P.; Wickstrom, R.; Smith, D.; Willeke, K. Effect of work loan and respirator wear on postural stability, heart rate, and perceived exertion. Am. Ind. Hyg. Assoc. J. 1991, 52, 417–422. [Google Scholar] [CrossRef]
  59. Eatough, E.M.; Way, J.D.; Chang, C.H. Understanding the link between psychosocial work stressors and work-related musculoskeletal complaints. Appl. Ergon. 2012, 43, 554–563. [Google Scholar] [CrossRef]
  60. Houtman, I.L.; Bongers, P.M.; Smulders, P.G.; Kompier, M.A. Psychosocial stressors at work and musculoskeletal problems. Scand. J. Work Environ. Heath 1994, 20, 139–145. [Google Scholar] [CrossRef] [Green Version]
  61. Jung, M.C.; Lee, K.S. Investigation of Work Load and Work Ability by Aging of Automobile Assembly Workers. J. Ergon. Soc. Korea 2019, 38, 445–455. [Google Scholar] [CrossRef]
Figure 1. Research approach of this study.
Applsci 12 03528 g001
Table 1. Research variables of this study.
CharacteristicsVariableVariable DescriptionObserved Score
WorkerAgeAge (years old)1: ≤29, 2: 30s, 3: 40s, 4: ≥50
GenderGender1: Male, 2: Female
Work experienceWork experience (years) 1 :   < 3 ,   2 :   3 5 ,   3 :   5
Working hours/weekWorking hours/week 1 :   < 41 ,   2 :   41
Working environment—Physical hazardsVibrationVibrations from hand tools, machineryMeasured in adjusted daily hazard exposure time (ADHE) = (Working hours per week ÷ Working days per week) × frequency of hazard exposure (0.75 for “all of the time”, “almost all of the time”, and “around 3/4 of the time”: 0.5 for “around half of the time”; 0.25 for “around 1/4 of the time”: 0.1 for “almost never” and “never”)0: <2, 1: 2~4, 2: ≥4
NoiseNoise so loud
High temperatureHigh temperature
Low temperatureLow temperature
Working environment—Chemical hazardsFumes and dustBreathing in smoke, fumes, dust
VaporBreathing in vapors such as solvents
Skin contactSkin contact with chemical
Tobacco smokeTobacco smoke from other people
InfectionHandling infectious materials such as waste, bodily fluids, laboratory materials
Working environment—Ergonomic hazardsAwkward postureTiring or painful positions
Manual heavy loads handlingCarrying or moving heavy loads
Standing postureStanding posture
Repetitive motionRepetitive hand or arm movements
FatigueOverall fatigueOverall fatigue1 = Yes, 0 = No
MSDS problemBackacheBackache
Upper limb painMuscular pains in shoulders, neck, and/or upper limbs
Lower limb painMuscular pains in lower limbs (hips, legs, knees, feet, etc.)
Any painpain complaints in any one of the back, upper limb, and lower limb
Table 2. Comparison of ADHE of the physical, ergonomic, and chemical/biological hazards.
Physical HazardVibrationNoiseHigh TemperatureLow Temperature
Mean3.5512.7072.1271.619
SD(2.408)(2.229)(2.035)(1.617)
Ergonomic HazardAwkward PostureMaterial HandlingStanding PostureRepetitive Motion
Mean3.1602.3924.4475.019
SD(2.305)(2.018)(2.244)(2.101)
Chemical/Biological HazardFumes and DustVaporSkin ContactTobacco SmokeInfection
Mean2.1521.4011.4281.1601.102
SD(2.095)(1.394)(1.363)(9.777)(1.027)
Table 3. Distribution of subjective musculoskeletal pains and overall fatigue by age group.
AgeMusculoskeletal PainsOverall Fatigue
BackacheUpper Limb PainLower Limb PainAny Pain
≤20N = 6915699
%1.4%7.2%8.7%13.0%13.0%
30N = 104927123325
%8.7%26.0%11.5%31.7%24.0%
40N = 118931113519
%7.6%26.3%9.3%29.7%16.1%
≥50N = 1551537234541
%9.7%23.9%14.8%29.0%26.5%
TotalN = 446341005212294
%7.6%22.4%11.7%27.4%21.1%
χ2 testχ24.82011.0772.7378.6497.673
p0.1850.011 *0.4340.034 *0.053
* Significant at 0.05. Note: Any pain = Pain complaints in any one area.
Table 4. Distribution of subjective musculoskeletal pains and overall fatigue by gender.
GenderMusculoskeletal PainsOverall Fatigue
BackacheUpper Limb PainLower Limb PainAny Pain
MaleN = 3632573409169
%6.9%20.1%11.0%25.1%19.0%
FemaleN = 83927123125
%10.8%32.5%14.5%37.3%30.1%
TotalN = 446341005212294
%7.6%22.4%11.7%27.4%21.1%
χ2 testχ21.5025.9910.7755.1275.015
p0.1590.014 *0.3790.018 *0.025 *
* Significant at 0.05. Note: Any pain = Pain complaints in any one area.
Table 5. Distribution of subjective musculoskeletal pains and overall fatigue by working hours.
Working Hours
(Hours)
Musculoskeletal PainsOverall Fatigue
BackacheUpper Limb PainLower Limb PainAny Pain
<41N = 2722052276446
%7.4%19.1%9.9%23.5%16.9%
≥41N = 1741448255848
%8.0%27.6%14.4%33.3%27.6%
TotalN = 446341005212294
%7.6%22.4%11.7%27.4%21.1%
χ2 testχ20.0724.3752.0325.1337.269
p0.7880.036 *0.1540.016 *0.007 *
* Significant at 0.05. Note: Any pain = Pain complaints in any one area.
Table 6. Distribution of subjective overall fatigue by the degree of hazard exposure.
FactorVariablesADHEχ2 Test
<22–4≥4
Physical hazardVibration14.6%16.3%26.6%χ2 = 8.834, p = 0.012 *
Noise15.6%23.0%27.5%χ2 = 7.999, p = 0.018 *
High temperature15.0%17.9%38.2%χ2 = 25.913, p < 0.001 *
Low temperature19.5%20.8%29.7%χ2 = 3.378, p = 0.185
Ergonomic hazardAwkward posture12.0%17.1%30.5%χ2 = 19.526, p < 0.001 *
Manual material handling16.0%16.9%35.5%χ2 = 18.187, p < 0.001*
Standing posture11.7%20.2%23.2%χ2 = 4.062, p = 0.131
Repetitive motion8.5%6.0%24.9%χ2 = 14.407, p = 0.001 *
Chemical and biological Fumes and dust13.2%21.1%42.2%χ2 = 37.465, p < 0.001 *
Vapor17.5%33.3%36.6%χ2 = 13.235, p = 0.001 *
Skin contact with chemical17.6%21.9%48.8%χ2 = 21.427, p = 0.001 *
Tobacco smoke18.9%26.1%52.6%χ2 = 13.155, p = 0.001 *
Infection19.3%30.4%47.4%χ2 = 9.867, p = 0.007 *
* Significant at 0.05. ADHE = adjusted daily hazard exposure time.
Table 7. Distribution of subjective backache by the degree of hazard exposure.
FactorVariablesADHEχ2 Test
<22–4≥4
Physical hazardVibration5.8%5.0%9.6%χ2 = 2.680, p = 0.262
Noise3.8%9.5%11.9%χ2 = 8.923, p = 0.012 *
High temperature6.1%1.8%14.5%χ2 = 11.152, p = 0.004 *
Low temperature7.0%5.7%12.5%χ2 = 2.638, p = 0.267
Ergonomic hazardAwkward posture3.6%4.9%12.2%χ2 = 10.545, p = 0.005 *
Manual material handling7.5%3.7%12.7%χ2 = 7.082, p = 0.029 *
Standing posture5.0%4.5%9.1%χ2 = 2.732, p = 0.255
Repetitive motion8.5%6.0%7.7%χ2 = 0.246, p = 0.884
Chemical and biological Fumes and dust5.5%8.5%12..7%χ2 = 5.625, p = 0.060
Vapor6.8%9.8%12.2%χ2 = 1.919, p = 0.383
Skin contact with chemical6.7%6.3%17.1%χ2 = 5.744, p = 0.057
Tobacco smoke6.8%10.9%15.8%χ2 = 2.833, p = 0.243
Infection7.4%0.0%21.1%χ2 = 6.786, p = 0.034 *
* Significant at 0.05. ADHE = adjusted daily hazard exposure time.
Table 8. Distribution of subjective upper limb pain by the degree of hazard exposure.
FactorVariablesADHEχ2 test
<2 2–4≥4
Physical hazardVibration17.5%10.0%29.7%χ2 = 15.953, p < 0.001 *
Noise16.0%18.9%32.5%χ2 = 14.832, p = 0.001 *
High temperature16.1%17.9%40.9%χ2 = 28.776, p < 0.001 *
Low temperature20.7%18.9%34.4%χ2 = 6.223, p = 0.045 *
Ergonomic hazardAwkward posture15.0%15.9%31.5%χ2 = 16.641, p < 0.001 *
Manual material handling19.0%22.1%29.1%χ2 = 4.169, p = 0.124
Standing posture20.0%11.2%26.3%χ2 = 9.123, p = 0.010 *
Repetitive motion15.8%21.1%41.2%χ2 = 22.824, p < 0.001 *
Chemical and biological Fumes and dust18.4%20.8%39.5%χ2 = 27.679, p < 0.001 *
Vapor19.2%31.4%39.0%χ2 = 10.947, p = 0.004 *
Skin contact with chemical19.4%25.0%43.9%χ2 = 12.965, p = 0.002 *
Tobacco smoke20.5%28.3%47.4%χ2 = 8.532, p = 0.014 *
Infection21.0%34.8%36.8%χ2 = 4.735, p = 0.094
* Significant at 0.05. ADHE = adjusted daily hazard exposure time.
Table 9. Distribution of subjective lower limb pain by the degree of hazard exposure.
FactorVariablesADHEχ2 Test
<22–4≥4
Physical hazardVibration10.2%7.5%14.0%χ2 = 2.811, p = 0.245
Noise7.5%8.1%18.8%χ2 = 12.197, p = 0.002 *
High temperature8.2%5.4%23.6%χ2 = 20.706, p < 0.001 *
Low temperature10.9%5.7%20.3%χ2 = 6.669, p = 0.036 *
Ergonomic hazardAwkward posture7.2%2.4%19.3%χ2 = 21.148, p < 0.001 *
Manual material handling6.5%12.5%20.0%χ2 = 12.692, p = 0.002 *
Standing posture5.0%7.9%14.1%χ2 = 5.604, p = 0.061
Repetitive motion4.3%2.0%14.0%χ2 = 8.951, p = 0.011 *
Chemical and biological Fumes and dust6.6%8.5%27.5%χ2 = 32.208, p < 0.001 *
Vapor9.0%19.6%24.4%χ2 = 11.939, p = 0.003 *
Skin contact with chemical9.4%12.5%29.3%χ2 = 14.101, p = 0.001 *
Tobacco smoke10.2%17.4%26.3%χ2 = 6.179, p = 0.046 *
Infection10.9%17.4%21.1%χ2 = 2.593, p = 0.274
* Significant at 0.05. ADHE = adjusted daily hazard exposure time.
Table 10. Distribution of subjective pain complaints in any one area by the degree of hazard exposure.
FactorVariablesADHEχ2 Test
<22–4≥4
Physical hazardVibration24.8%13.8%33.6%χ2 = 12.425, p = 0.002 *
Noise20.8%23.0%38.1%χ2 = 14.702, p = 0.001 *
High temperature20.7%19.6%48.2%χ2 = 31.900, p < 0.001 *
Low temperature24.9%22.6%43.8%χ2 = 10.228, p = 0.006 *
Ergonomic hazardAwkward posture18.6%19.5%38.1%χ2 = 20.419, p < 0.001 *
Manual material handling23.0%26.5%36.4%χ2 = 6.455, p = 0.040 *
Standing posture25.0%13.5%32.0%χ2 = 11.992, p = 0.002 *
Repetitive motion17.0%6.0%31.8%χ2 = 17.478, p < 0.001 *
Chemical and biologicalFumes and dust21.6%22.5%46.1%χ2 = 23.356, p < 0.001 *
Vapor24.0%33.3%48.8%χ2 = 12.380, p = 0.002 *
Skin contact with chemical24.3%28.1%51.2%χ2 = 13.329, p = 0.001 *
Tobacco smoke25.5%32.6%52.6%χ2 = 7.437, p = 0.024 *
Infection26.0%34.8%47.4%χ2 = 4.847, p = 0.089
* Significant at 0.05. ADHE = adjusted daily hazard exposure time.
Table 11. Results of logistic regression on overall fatigue.
VariablesN%Bp-ValueExp(B)95% C.I. for EXP(B)
LowerUpper
Gender
Male(ref)36381.4%
Female8318.6%0.6070.043 *1.8351.0203.300
Fumes and dust <0.001 *
<2 (ref)27361.2%
2–47115.9%0.5850.1021.7950.8903.621
≥410222.9%1.423<0.001 *4.1502.3597.300
Manual heavy loads handling 0.015 *
<2 (ref)20044.8%
2–413630.5%−0.1700.6000.8440.4481.591
≥411024.7%0.6850.025 *1.9841.0923.605
Repetitive motion 0.023 *
<2 (ref)4710.5%
2–45011.2%−0.6690.4140.5120.1032.550
≥434978.3%0.8260.1412.2840.7616.853
constant −2.784<0.001 *0.062
* Significant at 0.05, Note: ref = reference, C.I. = confidence interval.
Table 12. Results of logistic regression on backache.
Variablesn%Bp-ValueExp(B)95% C.I. for EXP(B)
LowerUpper
Noise 0.095
<2 (ref)21247.5%
2–47416.6%0.9620.0832.6170.8817.776
≥416035.9%0.9350.040 *2.5461.0426.224
Awkward posture 0.045 *
<2 (ref)16737.4%
2–48218.4%−0.0050.9940.9950.2623.778
≥419744.2%1.0110.03*2.7491.0507.199
constant −3.673<0.001 *0.025
* Significant at 0.05, Note: ref = reference, C.I. = confidence interval.
Table 13. Results of logistic regression on upper limb pain.
VariablesN%Bp-ValueExp(B)95% C.I. for EXP(B)
LowerUpper
Gender
Male(ref)36381.4%
Female8318.6%0.7760.007 *2.1721.2363.819
Work experience 0.020 *
<3(ref)8519.1%
3–57015.7%1.1710.009 *3.2241.3447.736
≥529165.2%0.9710.010 *2.6401.2565.550
Fumes and dust <0.001 *
<2 (ref)27361.2%
2–47115.9%0.4380.2001.5490.7933.027
≥410222.9%1.395<0.001 *4.0332.3816.833
constant −2.735<0.001 *0.065
* Significant at 0.05, Note: ref = reference, C.I. = confidence interval.
Table 14. Results of logistic regression on lower limb pain.
VariablesN%Bp-ValueExp(B)95% C.I. for EXP(B)
LowerUpper
Fumes and dust <0.001 *
<2 (ref)27361.2%
2–47115.9%0.1770.7251.1930.4453.197
≥410222.9%1.405<0.001 *4.0741.9588.477
Awkward posture 0.021
<2 (ref)16737.4%
2–48218.4%−1.4230.0710.2410.0511.132
≥419744.2%0.5290.1831.6970.7793.699
constant −2.698<0.0010.067
* Significant at 0.05, Note: ref = reference, C.I. = confidence interval.
Table 15. Results of logistic regression on pain complaints in any one area.
VariablesN%Bp-ValueExp(B)95% C.I. for EXP(B)
LowerUpper
Gender
Male(ref)36381.4%
Female8318.6%0.7020.012 *2.0181.1683.487
Work experience 0.002 *
<3(ref)8519.1%
3–57015.7%1.4270.001 *4.1651.8129.570
≥529165.2%1.1020.002 *3.0091.4886.082
Work hours 0.015 *
<41 (ref)27261.0%
≥41 h17439.0%0.5910.011 *1.8051.1472.842
High temperature <0.001 *
<2 (ref)28062.8%
2–45612.5%0.0240.9501.0240.4872.151
≥411024.7%1.372<0.001 *3.9432.3946.495
constant −2.761<0.001 *0.063
* Significant at 0.05, Note: ref = reference, C.I. = confidence interval.
Publisher’s Note: MDPI stays neutral with regard to jurisdictional claims in published maps and institutional affiliations.

