Article

Geo-Accumulation Index of Manganese in Soils Due to Flooding in Boac and Mogpog Rivers, Marinduque, Philippines with Mining Disaster Exposure

by
Cris Edward F. Monjardin
1,2,3,4,
Delia B. Senoro
1,2,3,4,*,
Jeffersen James M. Magbanlac
3,
Kevin Lawrence M. de Jesus
1,3,4,
Carlito B. Tabelin
5 and
Pablito M. Natal
3,6
1
Doctorate Program in Environmental Engineering, School of Graduate Studies, Mapua University, Manila 1002, Philippines
2
School of Civil, Environmental and Geological Engineering, Mapua University, Manila 1002, Philippines
3
Resiliency and Sustainable Development Center, Yuchengco Innovation Center, Mapua University, Manila 1002, Philippines
4
School of Chemical, Biological, Materials Engineering and Sciences, Mapua University, Manila 1002, Philippines
5
School of Minerals and Energy Resources Engineering, University of New South Wales, Sydney 2052, Australia
6
Department of Civil Engineering, Marinduque State College, Boac 4900, Philippines
*
Author to whom correspondence should be addressed.
Appl. Sci. 2022, 12(7), 3527; https://doi.org/10.3390/app12073527
Submission received: 22 February 2022 / Revised: 24 March 2022 / Accepted: 26 March 2022 / Published: 30 March 2022

Abstract

:
This paper presents the effects of flooding on the accumulation of manganese (Mn) in soils within proximity of the Boac and Mogpog rivers in Marinduque of The Philippines. Marinduque, an island province in the Philippines, experienced two catastrophic tailings storage facility (TSF) failures in the 1990s that released sulfide-rich tailings into the two major rivers. The Philippines experiences 21–23 typhoons every year, 11 of which pass thru Marinduque that causing inundation of floodplain areas in the province. A flood hazard map developed using LiDAR DEM was utilized for the Boac and Mogpog rivers for an accurate representation of flooding events. A portable X-ray fluorescence spectrometer (pXRF) and a Hannah multi-parameter device were used for the on-site analyses of Mn concentration and water physico-chemical properties, respectively. Spatial grid mapping with zonal statistics was employed for a comprehensive analysis of all the data collected and processed. Correlation analysis was carried out on Mn concentrations in soil and surface water, electrical conductivity (EC), total dissolved solids (TDS), pH, temperature, curve number (CN), and flood heights. The curve number indicates the runoff response characteristic of the Mogpog-Boac River basin. The results show that 40% of the total floodplain area of Boac and Mogpog were subjected to high hazards with flood heights above 1.5 m. The Mn content of soils had a statistically significant moderate positive correlation with flood height (r = 0.458) and a moderate negative correlation with pH (r = −0.438). This condition suggested that more extensive flooding promotes Mn contamination of floodplain soils in the two rivers, the source of which includes the mobilization of Mn-bearing silt, sediments, and mine drainage from the abandoned mine pits and TSFs. There is also a strong negative correlation between pH and Mn concentrations in surface water, a relationship attributed to the solubilization of Mn-bearing precipitates based on geochemical modeling results. Using Muller’s geo-accumulation index, 77.5% of the total floodplain of the two rivers was identified as “moderately contaminated” with an average Mn soil content of 3.4% by weight (34,000 mg/kg). The Mn contamination map of floodplain soils in the Mogpog and Boac rivers described in this study could guide relevant regional, national, and local government agencies in planning appropriate intervention, mitigation, remediation, and rehabilitation strategies to limit human exposure to highly contaminated areas.

1. Introduction

The Philippines is located within the pacific ring of fire, where earthquakes, volcanic eruptions, and typhoons occur frequently. Agence France-Presse [1] listed ten of the deadliest natural disasters in the country, and 5 of them were typhoon and flood-related. According to Tropical Cyclone Information, the country is struck by an average of 20 typhoons annually, 70% of which occur from July to October [2]. The Philippine Statistics Authority [3] released a more comprehensive record of all the major disasters in the country from 2010 to 2019, and the results showed flooding as the most frequently experienced disaster at 387 occurrences that induced tremendous economic losses. Data and records proved how flood-prone the country is, and this trend is expected to worsen in the future considering the effects of climate change [4].
Marinduque is one of the most beautiful islands in the country, located in Region IV-B of Luzon. The province’s total land area is 952.58 square kilometers and has a total population of 239,207 as of 2020 [5]. The island is also often visited by typhoons, as presented in Figure 1a. Figure 1b shows that many typhoons passed the province, particularly in May, September, and December, suggesting that these are the months when typhoon-induced flooding events are most likely to occur in the area.
Last 2014, Marinduque experienced one of the strongest typhoons to hit the island, which caused the three major rivers on the island, the Sta Cruz, Boac, and Mogpog rivers, to overflow. The maximum flood height in Boac was 2.52 m during typhoon Glenda last July 2014 [6]. Another typhoon event was experienced in 2020, swelling the same rivers [7] due to intense rainfall. With these frequent and disastrous flooding events in the area, a government project entitled Phil-Lidar 1 created hazard maps to identify flood-prone areas and predict how extensive flooding would be regarding different rainfall return periods. The Boac and Mogpog rivers have a watershed area of 214 km2 and 58 km2, respectively. About 36.1% of the municipality of Boac, and 18.4% Mogpog, are prone to flooding [6].
Another dilemma of the people in the area is the contamination of surface water and soils by hazardous heavy metals from the abandoned open mine pits and tailings storage facilities (TSFs) located upstream of the two rivers. Marinduque province is home to the porphyry copper-gold-molybdenum deposit, a 372-million-ton orebody containing 0.55% copper, 0.004% molybdenum, 0.11 g/t gold, and 0.7 g/t silver [8]. Major mining activities commenced in 1969 and ran smoothly until 1997. The mining operation stopped after two mining incidents that occurred in 1993 and 1996. In December 1993, the company’s Maguilaguila TSF embankment collapsed and flooded the town of Mogpog [9]. Because of this incident, twenty-one barangays in Mogpog were buried in tailings and toxic floodwater. The second disaster, one of the worst mining and environmental disasters in the Philippines, occurred on 24 March 1996 when the concrete drainage tunnel “plug” of the Tapian pit gave way, releasing more than 1.6 million cubic meters of toxic mine tailings into the Boac River [10]. The Tapian pit is a decommissioned open pit, which was repurposed by the company as an in-pit TSF from 1989 for their San Antonio mine site.
These two mining disasters contaminated the two rivers and their surrounding environments with heavy metals via two pathways: (1) release and dispersion of sulfide minerals like pyrite (FeS2), chalcopyrite (CuFeS2), galena (PbS), and sphalerite (ZnS) found in the tailings; and (2) formation mine drainage contaminated with heavy metals in the abandoned mine sites. Acid mine drainage (AMD) is formed when sulfide-rich minerals in the TSFs, waste rock dumps, and open-pits are exposed to the atmosphere with a sufficient amount of oxygen and water [11,12,13]. David and coworkers [14,15,16], for example, reported that the elevated heavy metals concentrations of the Boac and Mogpog rivers could be attributed to mine drainage from the abandoned Maguilaguila TSF located upstream of both rivers. More recently, a previous study of the authors [17] detected eight heavy metals such as chromium (Cr), manganese (Mn), iron (Fe), lead (Pb), cadmium (Cd), zinc (Zn), nickel (Ni), and copper (Cu) exceeding the allowable environmental limits for soils. Among them, Mn had the highest measured concentration at 68,620 mg/kg, a 65-fold increase from 1998 measurements (~1060 mg/kg) [14,17].
Manganese is naturally occurring in soils and is necessary for the normal nutrition and development of plants. At high concentrations, however, it is toxic to plants and humans [18,19]. Excessive Mn exposure of humans causes damage to the central nervous system exhibiting similar symptoms as lead (Pb) poisoning [20,21]. Manganese is also a problematic contaminant because of its high solubility, similar to Cu and Zn in the pH range of surface and ground waters (i.e., pH 6–9) [22], which makes it highly bioavailable. Bio-accumulation of Mn in food crops, for example, has been reported in Marinduque with rice samples harvested in Boac and Mogpog containing around 16.0 and 7.12 mg/kg of Mn [23]. Previous studies have also reported elevated Mn concentrations in the island not only in sediments [13] and soils [16] but also in crustaceans and tilapia [24], string beans, sweet potatoes, eggplant, and bitter melon [25], and corals [14]. United States Environmental Protection Agency (USEPA) stated that humans could only consume 0.14 mg/kg-day of Mn to avoid toxicity. Environmental challenges related to Mn contamination will also become critical due to the clean energy transition and decarbonization because Mn, together with lithium and cobalt, is an essential metal used in rechargeable batteries essential to renewable energy systems and clean storage technologies [26].
Previous studies have shown that flooding is a major contributor to the increase of heavy metals content in soils [27,28,29,30]. Han et al. [27] reported higher Mn levels in the floodplain after a major flooding event caused by Hurricane Harvey. In Poland, Ciesielczuk et al. [28] noted that river flooding events facilitated the migration of heavy metals from sewage treatment plants, landfill leachates, and industrial areas into arable soils. In areas with historic mining operations, soil contamination is exacerbated during flooding events because of overflows from upstream mining areas [29]. Ponting et al. [30] recently reviewed how flooding affects the mobility of heavy metals in floodplain soils and noted five key parameters: (i) soil redox potential, (ii) pH, (iii) dissolved organic matter (DOM), (iv) Fe and Mn hydroxides, and (v) sulfate and metal sulfides. Another factor promoting heavy metal accumulation in soils in flooded areas is the soil infiltration capacity. Antoniadis et al. [31] demonstrated the significant relationship between the permeability of the soil and heavy metal accumulation by developing a centrifuge infiltration setup to quantify metal mobility in soils. Also, the curve number was the parameter used in the study to represent permeability. This is a dimensionless number that indicates runoff response on land-based soil type and land use. These previous studies suggest that the accumulation of Mn in the soils near the Boac and Mogpog rivers is likely promoted by frequent typhoon-induced flooding events.
One way to determine the extent of soil contamination is to calculate pollution indices by comparing heavy metal contents of the study area to a reference or “background” site. This approach is widely used in environmental studies to identify soil contamination in areas impacted by artisanal and small-scale mining activities [32]. Among the pollution indices, Muller’s geo-accumulation index (Igeo) [33] is one of the most widely used and has been applied for heavy metals contamination studies on sediments [34] and soils [35]. One advantage of Igeo over other pollution indices is the introduction of a constant to normalize the variances in background levels caused by site-specific geological variations [33]. Hence, this study investigates the effects of flooding events on the accumulation of Mn in floodplain soils of the Boac and Mogpog rivers. Specifically, this work aims to (i) measure the concentrations of Mn in surface water and floodplain soils of the Boac and Mogpog rivers, (ii) determine the extent of contamination based on Muller’s geo-accumulation index, (iii) apply spatial interpolation to predict soil contamination around the two rivers, and (iv) identify the role of flooding on the accumulation of Mn using geographical information system, correlation analysis, and geochemical modeling. Geo-accumulation indices could provide an important basis for targeted and efficient rehabilitation and remediation planning [36]. Further, it aids the government in providing information to the people about the problem they are facing. Meanwhile, spatial interpolation, a very reliable tool for estimating pollutant coverage in surface water [37] and soils [38,39], was applied to expand the area of coverage of the study. Therefore, a more reliable soil contamination assessment of the target area could be assessed [40] by combining spatial interpolation and geo-accumulation index.

2. Materials and Methods
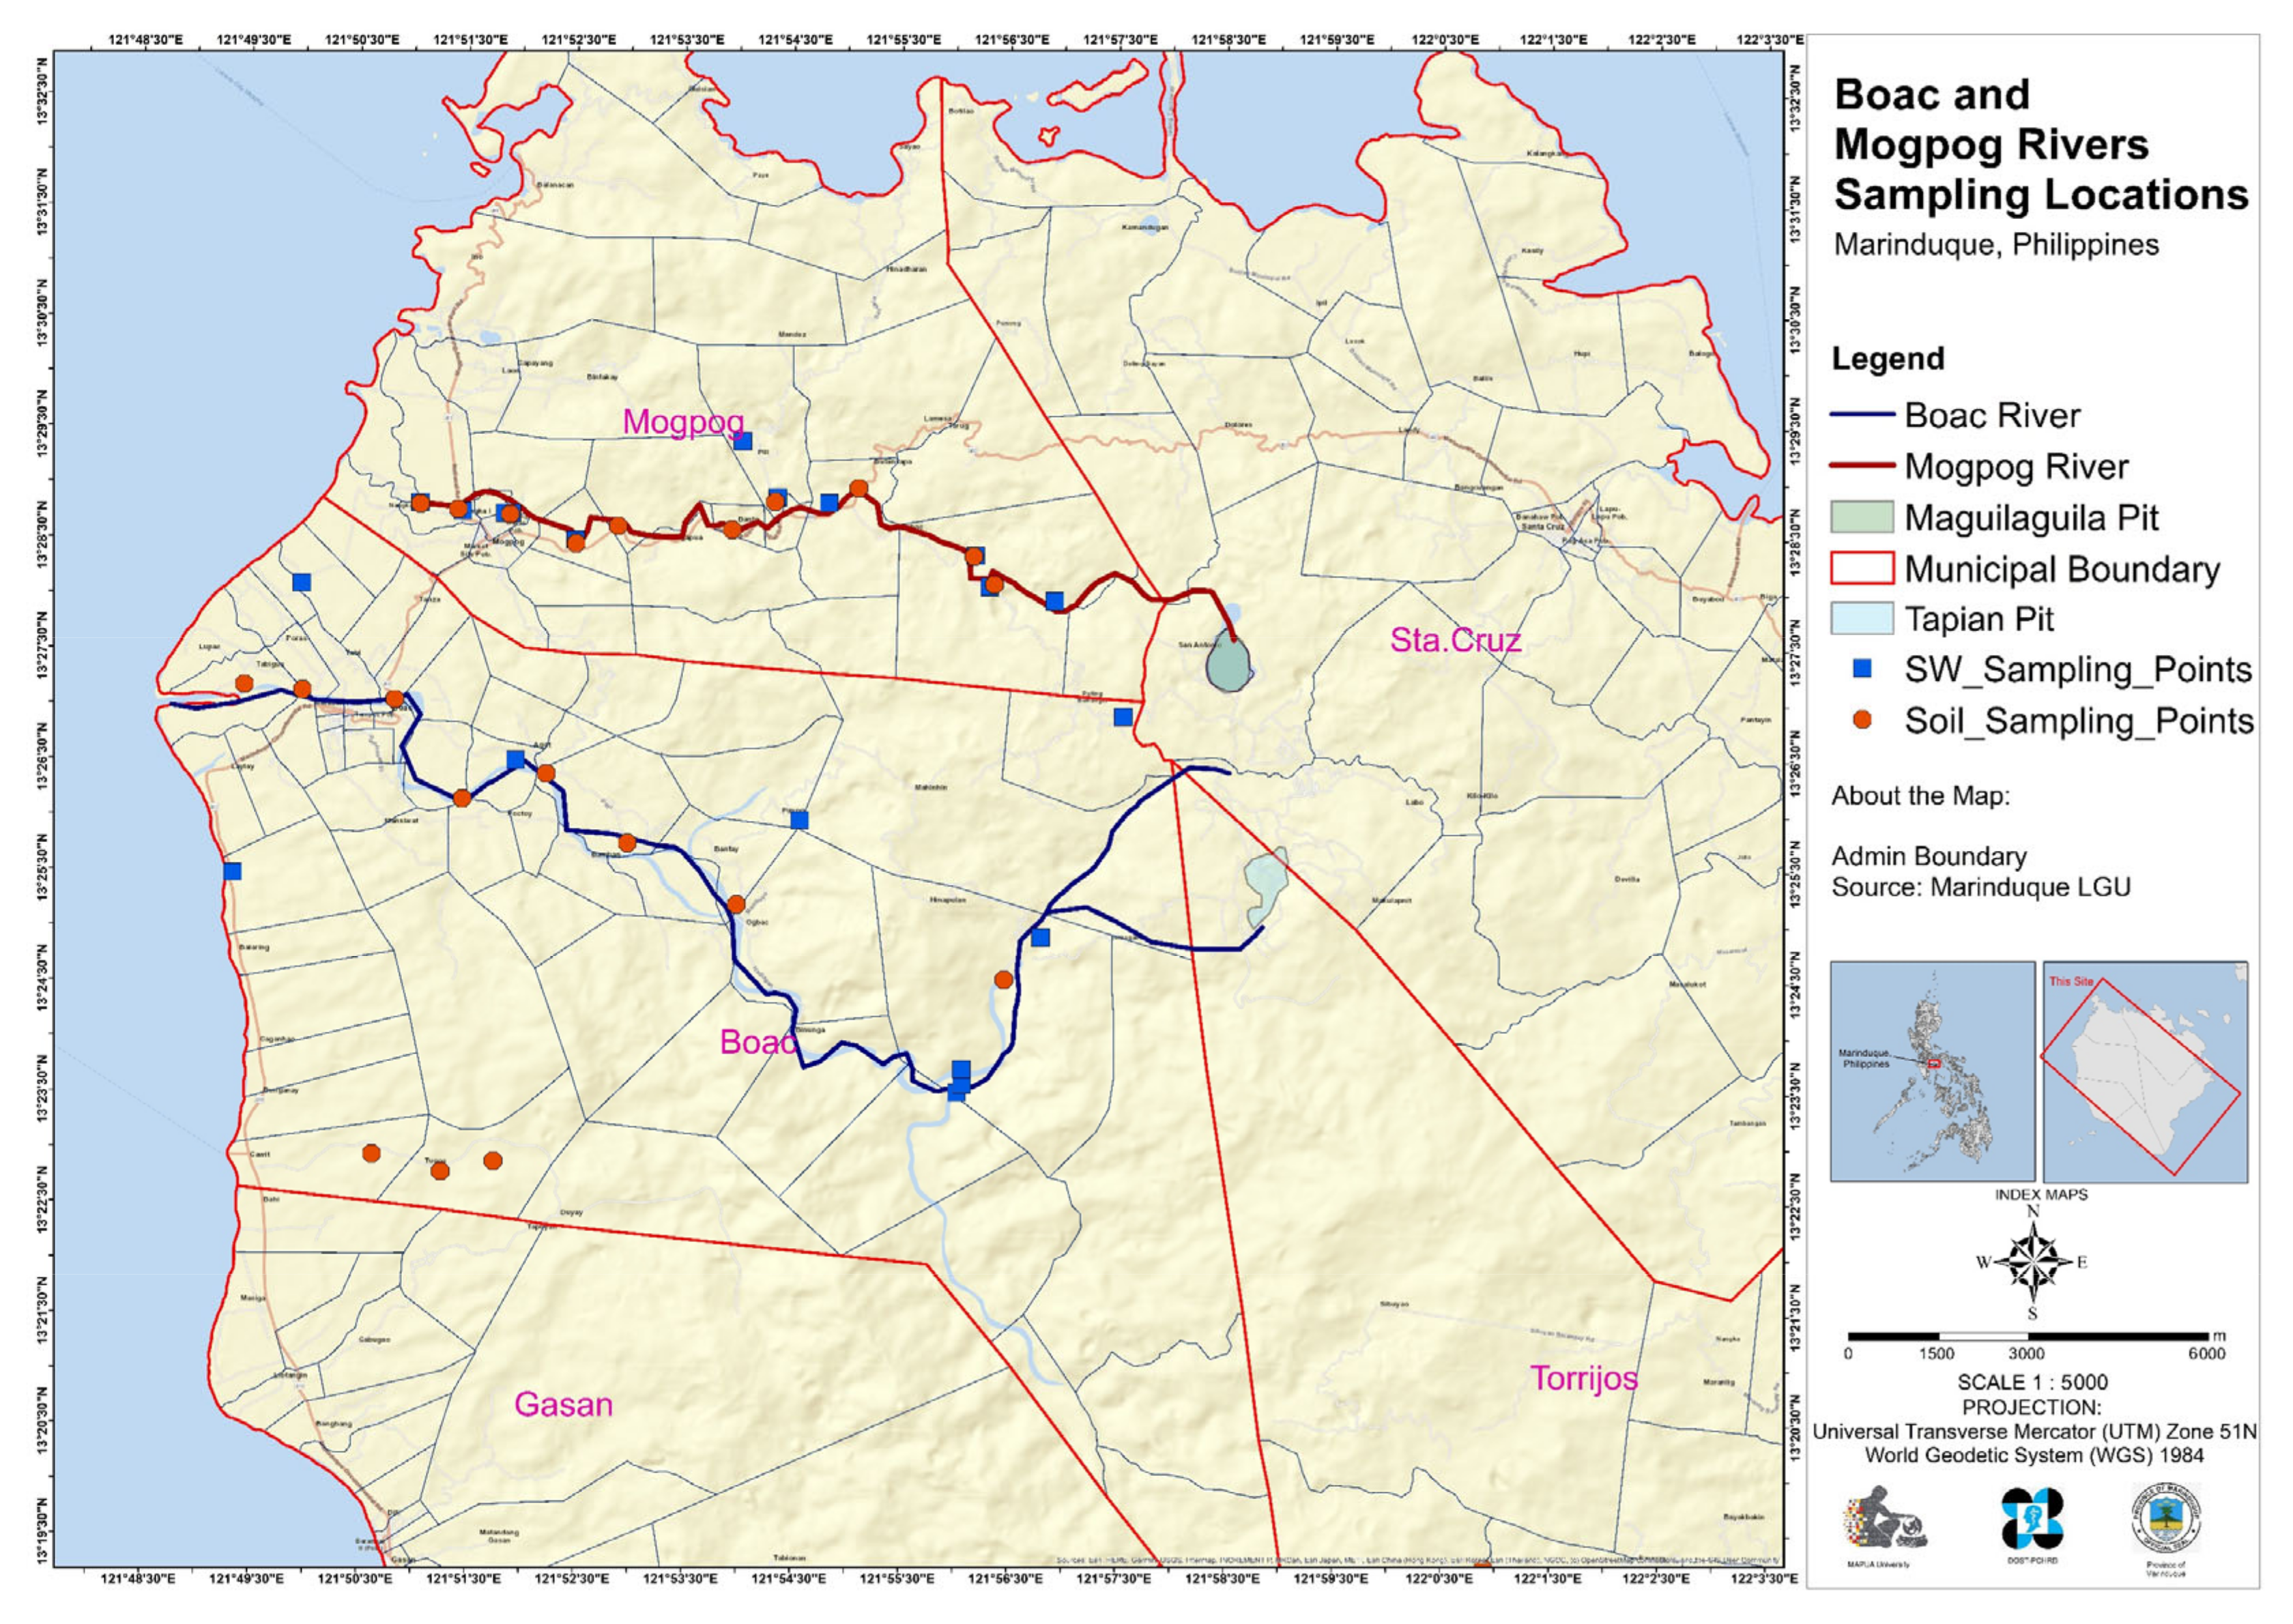
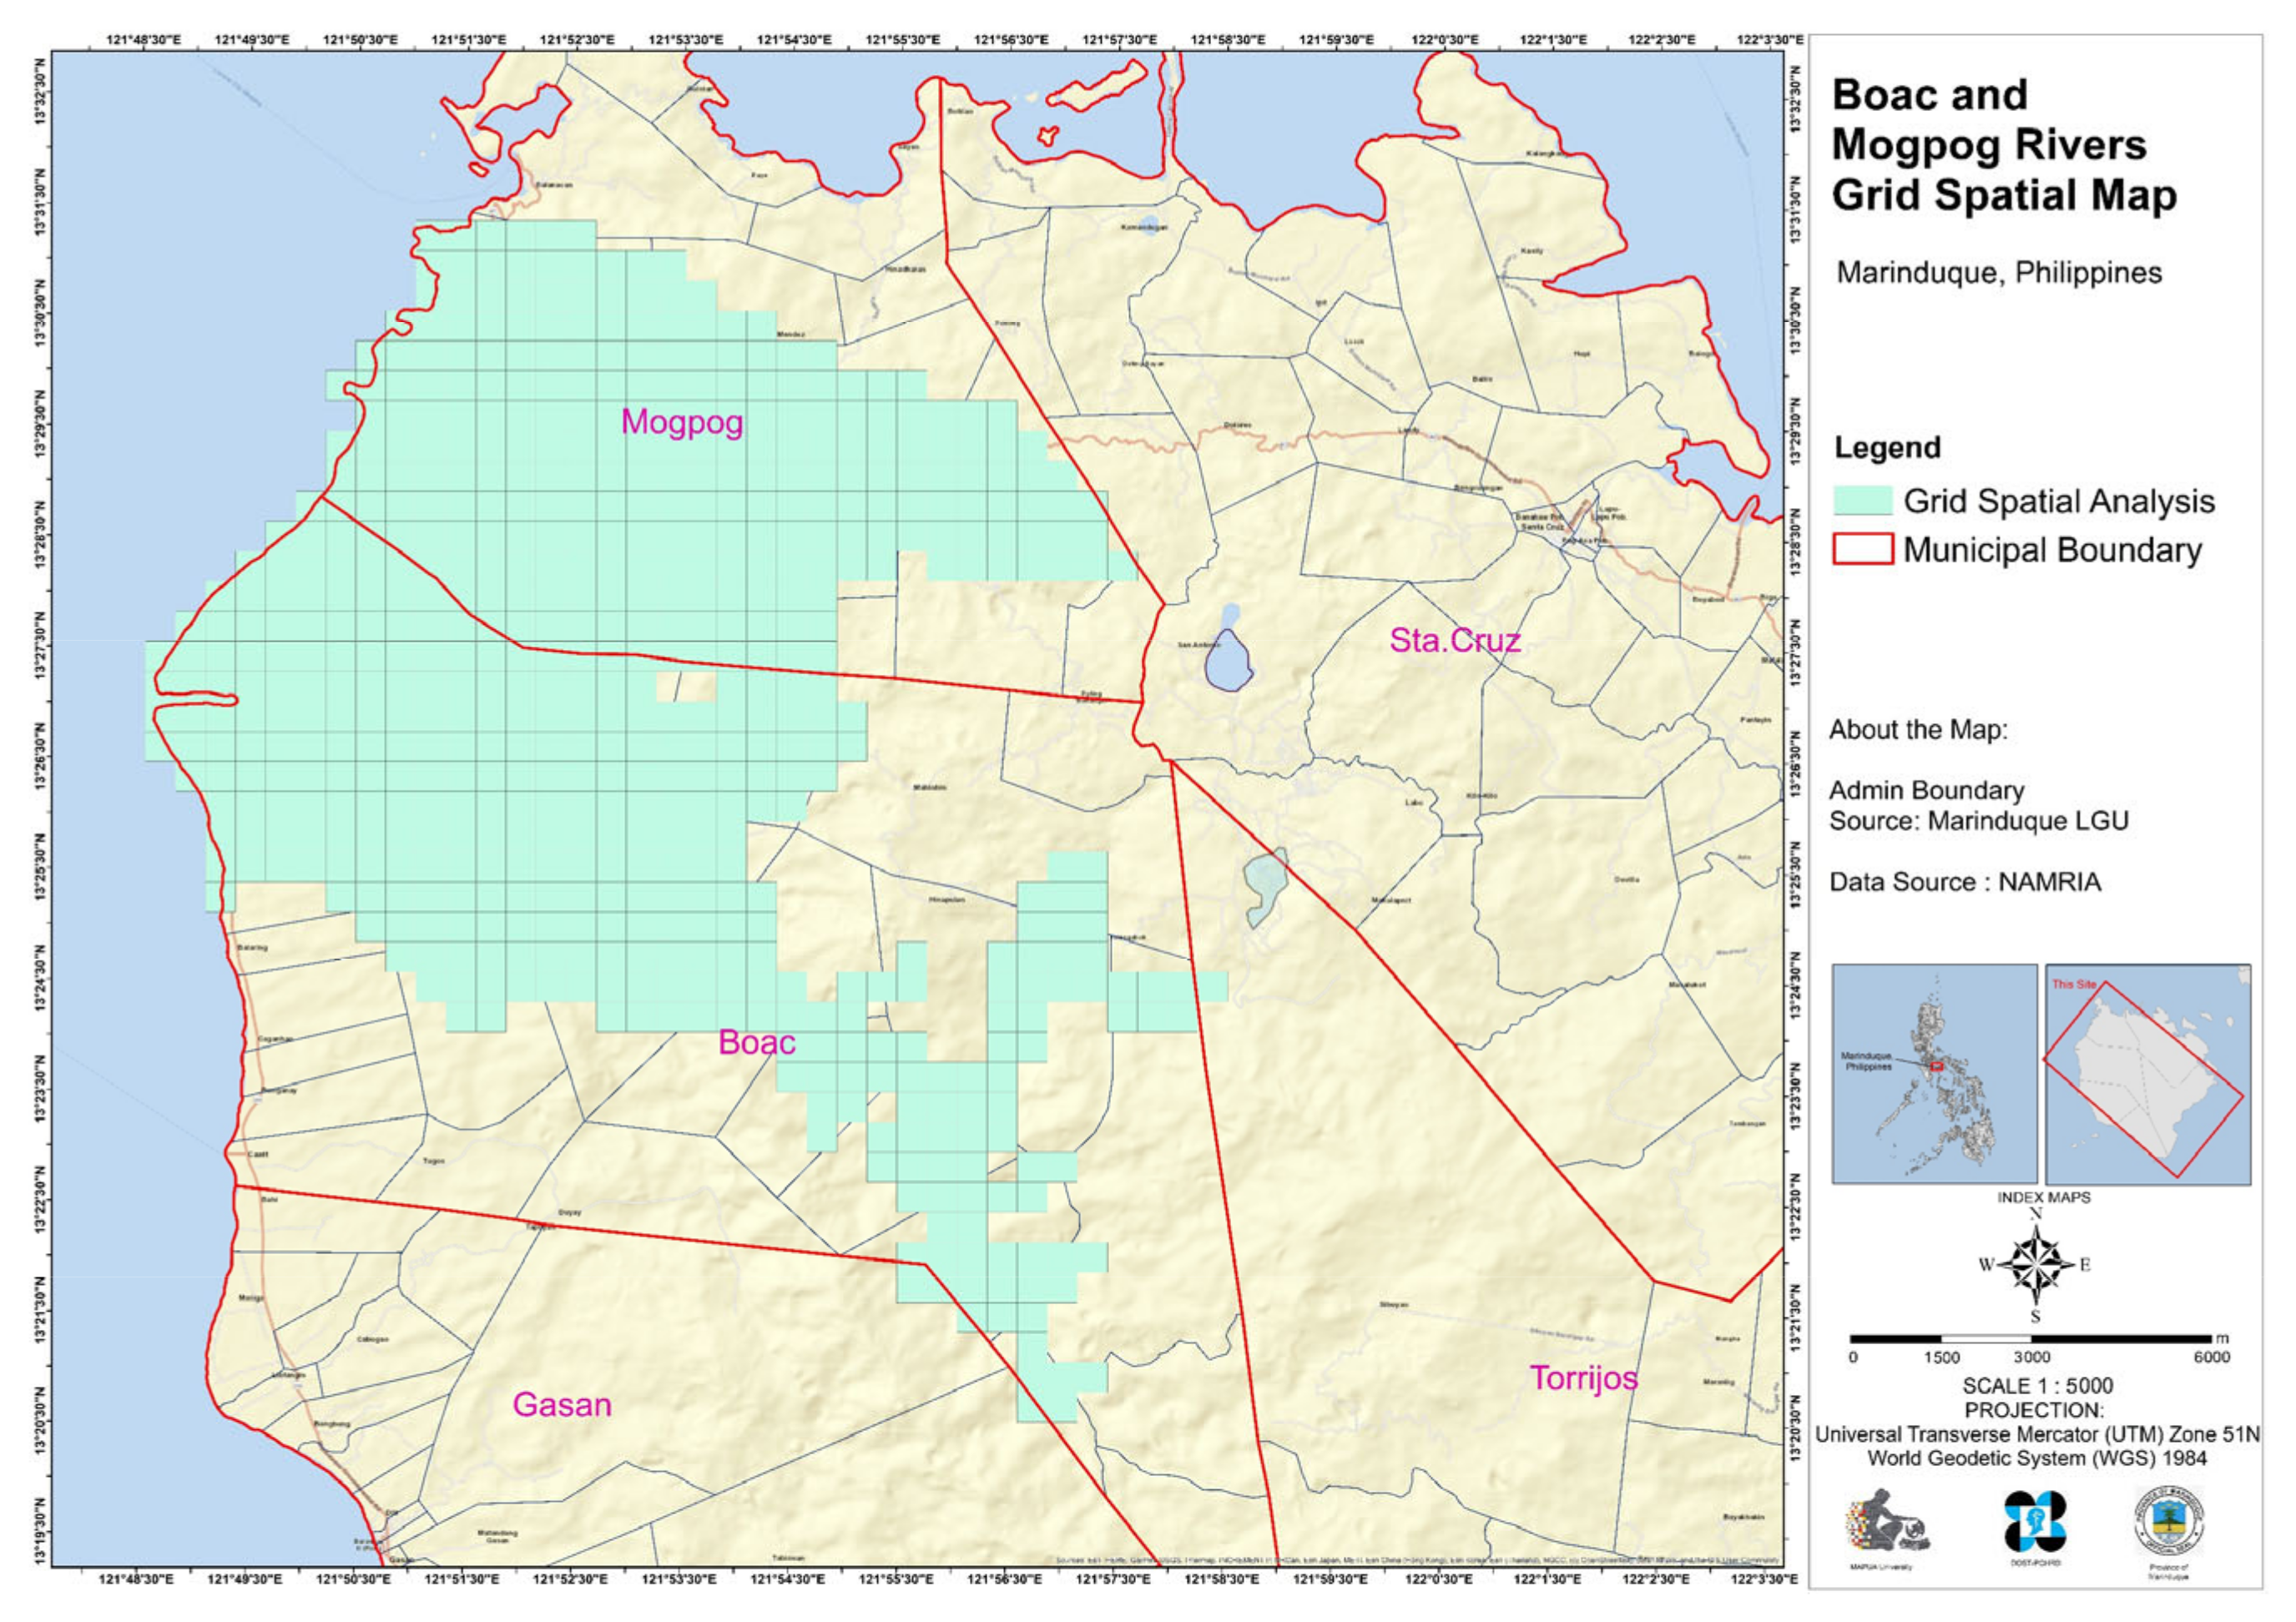
2.1. The Study Area

Marinduque, an island province in Region IV-B of Luzon, is known to have a “heart-shaped” boundary. The province’s total land area is roughly 953 square kilometers, divided into six municipalities: Boac, Mogpog, Sta. Cruz, Torrijos, Buenavista, and Gasan. The focus of this study was on the Boac and Mogpog rivers, as shown in Figure 2. Annual rainfall in the province varies from 1700 to 2500 mm [41]. Its climate is classified as type 3 without a very pronounced maximum rain period, and a dry season during December to February or March to May.
The total length of the major rivers in Marinduque is approximately 178 km, 40.7% of which are attributed to the Boac River (35.71 km) and Mogpog River (35.79 km). These two rivers are the longest in the province and are known to overflow during heavy rainfall [6].
Marinduque is the site of two major TSF failure disasters in 1993 and 1996, considered the most extensive and worst environmental disaster in the Philippine mining industry [42]. The mining operation was stopped after the disaster, but no rehabilitation of impacted areas, including the TSFs and open pits, were implemented. The two abandoned TSFs, i.e., Maguilaguila and Tapian pit, are connected to Boac and Mogpog rivers. Without rehabilitation and management, these two TSFs located upstream of the rivers will continue to contaminate areas downstream of the mining areas, especially when flooding events and transport of mine drainage and tailings to the floodplains of the two rivers occur.

2.2. Sampling, Collection, and Storage of Surface Water and Soil Samples

Two media types were collected in the study: (i) surface waters, and (ii) soils. Samples were collected across the island, but mostly from the Boac and Mogpog rivers. Data collection was conducted in October when frequent flooding events occur [3]. Surface water was collected using plastic bottles following the operating protocol developed by USEPA No. SESDPROC-201-R4 [43]. Similarly, soil samples were collected based on USEPA No. LSASDPROC-300-R4 and stored in plastic bags [44]. Physicochemical properties of water samples like pH, electrical conductivity (EC), and total dissolved solutes (TDS) were measured on-site using a HANNA Multiparameter device.
Soil and surface water samples were collected in 21 and 20 sampling points, respectively. The sampling locations are illustrated in Figure 2 and were selected based on the simulated flood hazard maps of the two rivers.

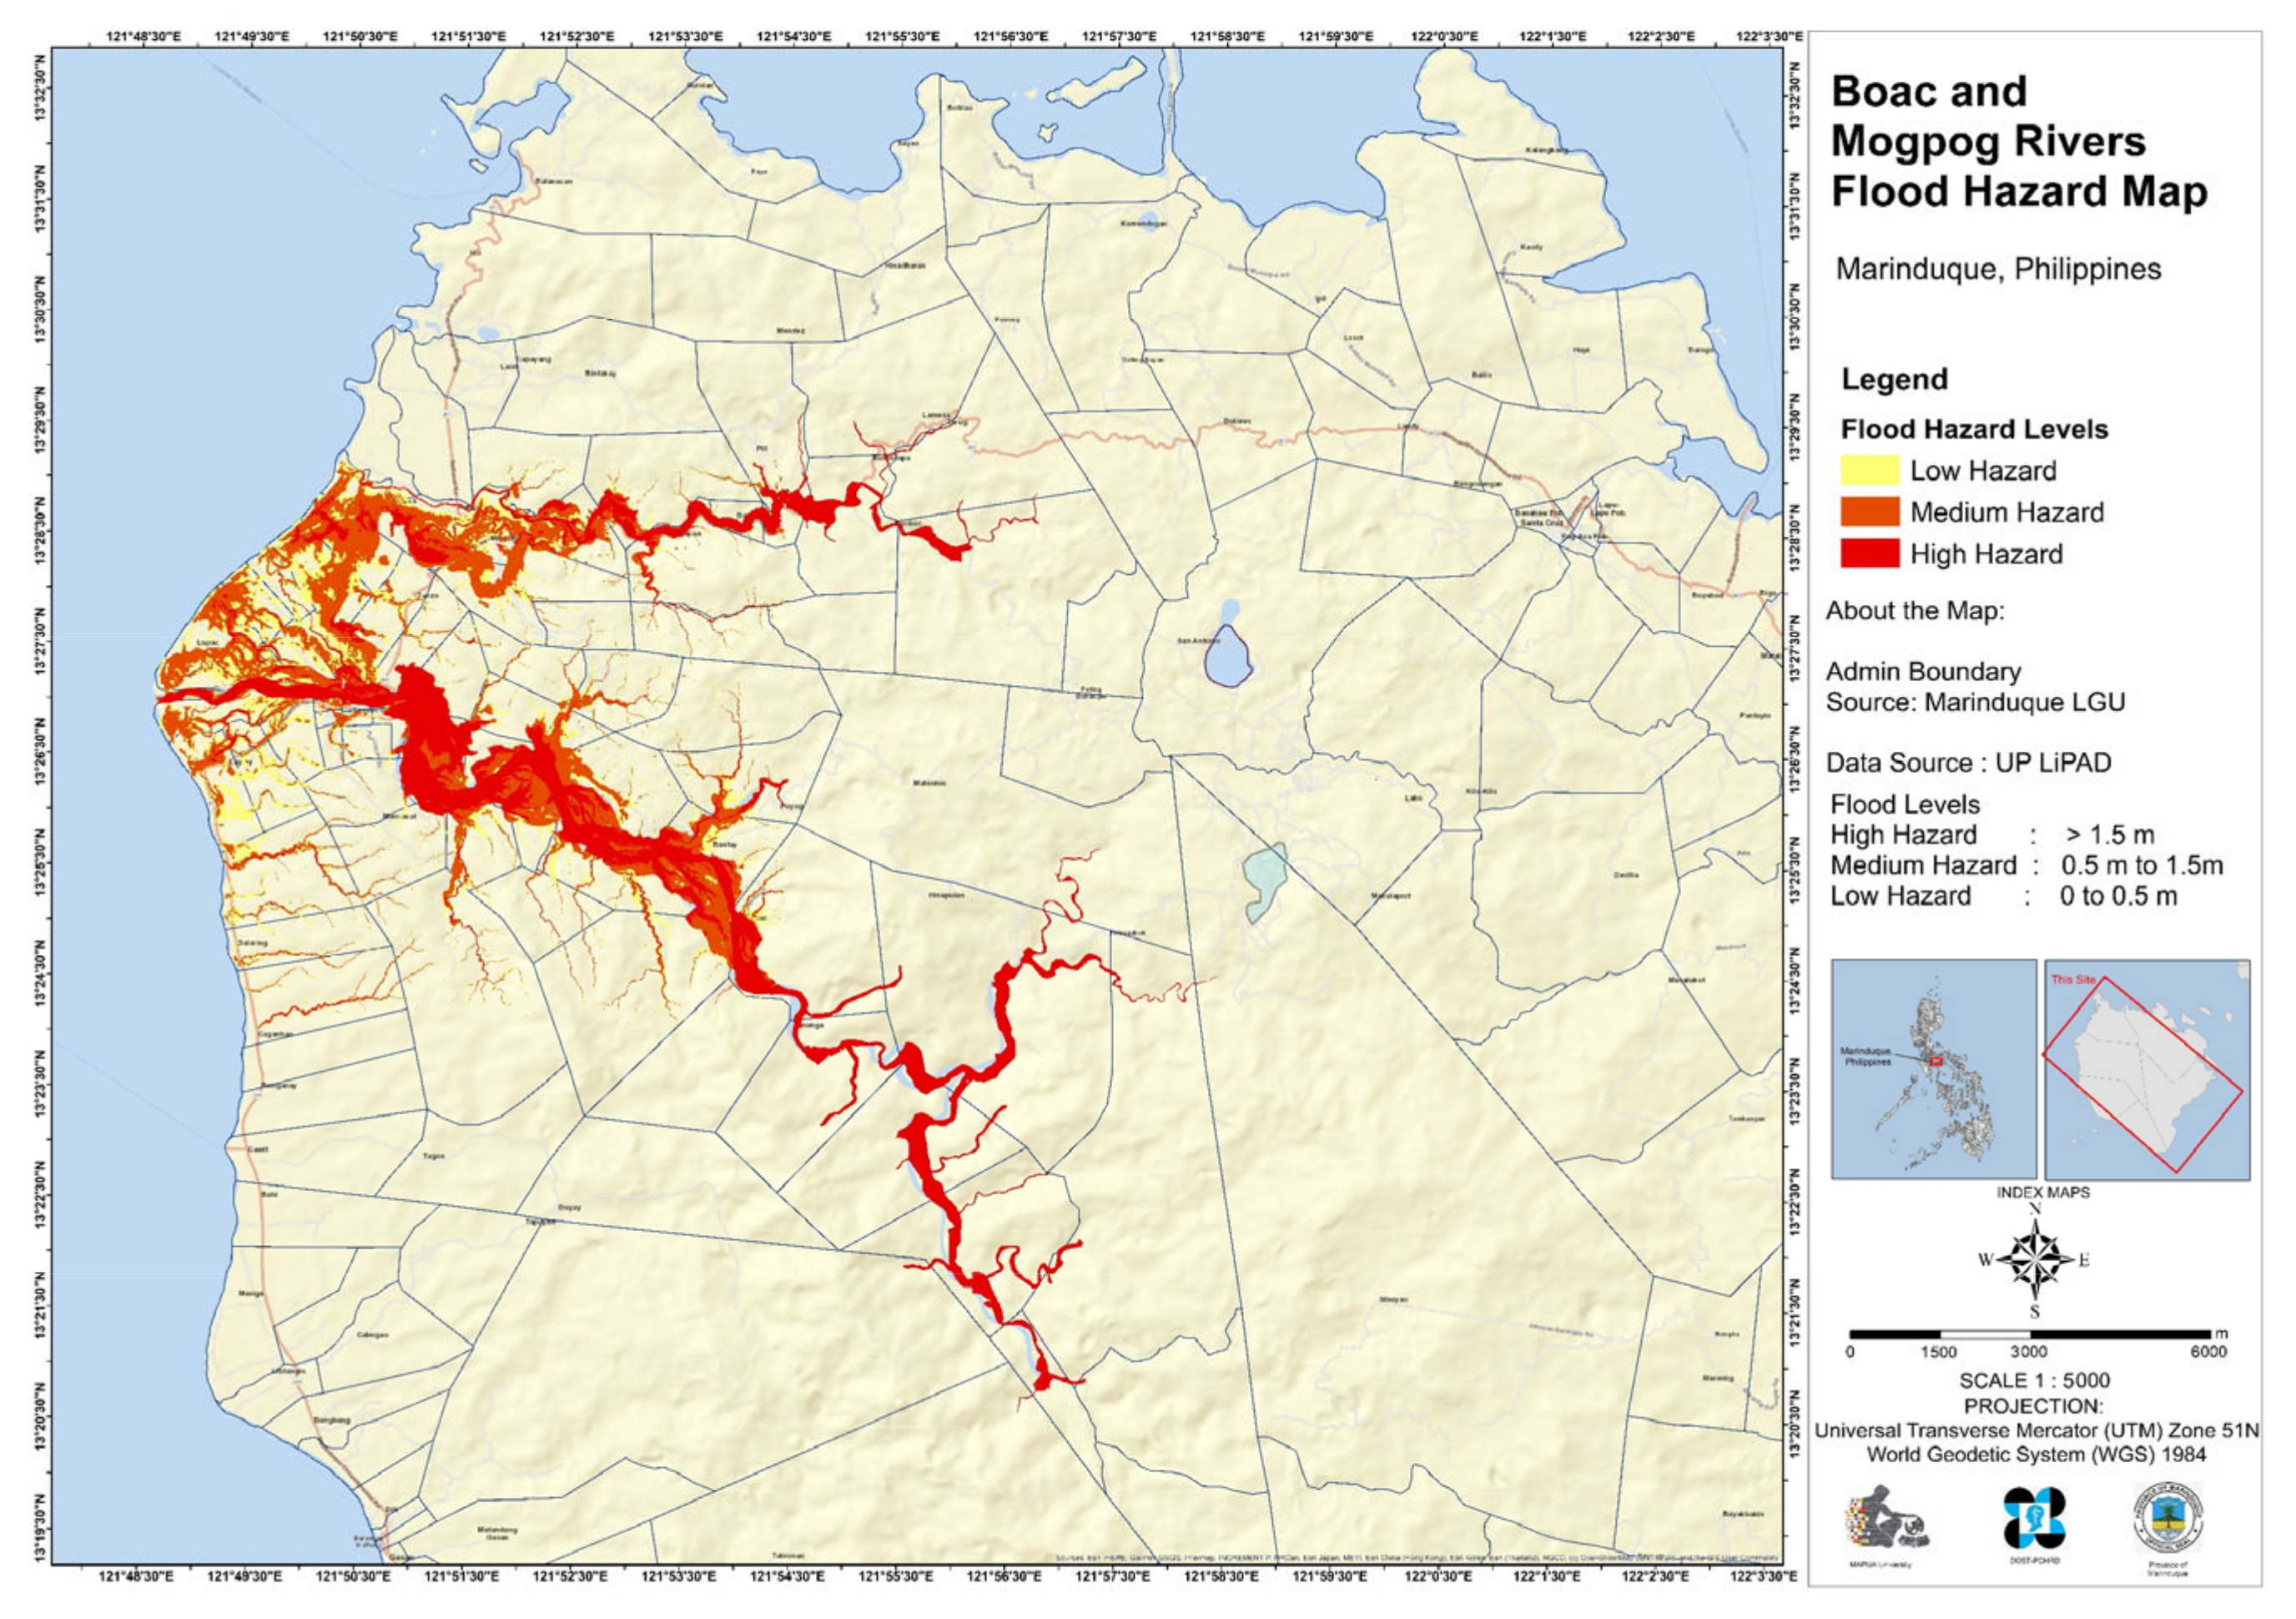
2.3. Flood Hazard Mapping and Analysis

There are many available methodologies and computer software for flood hazard modeling [45,46,47] but what should be considered are the methods accepted and approved by the government agency mandated to disseminate disaster data. In the Philippines, this mandate falls under the Mines and Geosciences Bureau (MGB), an attached agency of the Department of Environment and Natural Resources (DENR). The flood hazard map developed in the study of Monjardin et al. [47] was approved by the MGB and endorsed to the public for dissemination. Similarly, this study used a flood hazard map approved and endorsed by the MGB to ensure data reliability. In the study of Phil-Lidar 1 entitled flood hazard mapping of the Philippines led by the University of the Philippines, flood hazard modeling of all the principal river basins in the country was done using LiDAR data. LiDAR or Light Detection and Ranging uses light pulses (e.g., ultraviolet, visible, or near-infrared) to image objects at very high precision by measuring the time it takes for the reflections to be detected by the sensor [48]. Lidar data acquisition could be airborne or land-based. Phil-Lidar 1 program produced a flood hazard map for the Boac and Mogpog rivers with a lidar resolution of 1 × 1 m and vertical accuracy of ± 15 cm [49]. Flood hazard maps were produced at different return periods regarding rainfall intensities that passed through the area historically.

2.4. Heavy Metal Detection and Testing

Olympus Vanta X-ray Fluorescence (XRF-scanner) was used in this study to measure in situ Mn concentrations in both surface water and soil. A portable XRF was selected in this study to address the remoteness of the sampling locations, including the unavailability of laboratories in the area with heavy metal testing capabilities. Portable XRF scanners have been used in many studies as portable [50,51] and reliable equipment [52] for heavy metals detection in water [50,51] and soil [53,54]. According to Sikora [54], XRF portable scanners measure heavy metal contents of soils on par with other laboratory techniques, provided that the samples were air-dried and sieved. Hence, soil samples in this study were dried and sieved. Heavy metal concentrations were measured in the study using a portable XRF (Figure A1a), which could detect thirty-five heavy metals in a water sample. Twenty water samples were collected and placed in a #2 plastic zipper bag for detection and analysis of metals concentration (Figure A1b). Twenty-one soil samples from different locations were collected to represent the current heavy metal concentrations in floodplain soils in the Boac and Mogpog rivers. These soils were collected and placed in #2 zipper plastic bags, as shown in Figure A1c. The X-ray fluorescence spectrometer was calibrated prior to analysis. The calibration was carried out using the Olympus XRF calibration blank in a #2 plastic zipper bag. Comparative results of the same samples were subjected to inductively coupled plasma optical emission spectrometer (ICP-OES) analysis.

2.5. Spatial Interpolation, Analysis, and Flood Hazard Map

The data collected in the study, such as the physicochemical properties of surface water, hydrogeologic parameters, flood hazard, and Mn concentration of both surface water and soil, underwent spatial interpolation. Spatial interpolation has been used in many environmental studies [55,56] to predict values of spatial phenomena in unsampled locations [57]. In spatial interpolation, the inverse distance weighting (IDW) method is a deterministic method widely used by geoscientists and geographers [58]. The IDW method assumes that the properties of an unsampled location are the weighted average of known values in the area, and the weights are inversely correlated to the distances between the prediction location and sampled locations. IDW was used in this study as the interpolation method to develop spatial data in the floodplains of the two rivers. The value at the unknown location in the floodplain was considered as the weighted sum of the values of “N” known points, as shown in Equation (1) [59].
C P = a i = 1 N o w i C i
w i = 1 d i a i = 1 N o 1 d i
where C P denotes the unknown concentration data, C i signifies the known data, N is the number of sampling stations, w i is the weighting of individual stations, and d i is the distance from every station to the unknown point.
The flood hazard map used in this study was developed by Phil-Lidar 1 using Lidar technology to accurately derive elevation data and define the floodplain terrain of the area. Flood depths identified by the hazard map were then used to identify whether these events, specifically flood heights, affect or stimulate Mn accumulation in soils near the two rivers.

2.6. Correlation Analysis

Considering all the collected parameters related to the elevation of Mn concentration on soils, each correlation was computed using R-studio. The following parameters were included in the analysis: SW pH, electric conductivity (EC), total dissolved solids (TDS), temperature, curve number (CN), flood heights (FH), and Mn concentration in surface water and soils. Correlation coefficient values could range from −1 to +1. A negative correlation indicates that variables are inversely related, while a positive correlation indicates a direct relationship. A very strong correlation could be seen in R values between 0.9 and 1, strong correlation for 0.7 < r < 0.89, moderate correlation 0.4 < r < 0.69, weak correlation 0.1 < r < 0.39 and negligible correlation in r values of 0 to 0.1 [60]. Correlation analysis is critical to understanding the behavior of one particular parameter. This aids in identifying critically important variables which others depend on [61]. Equation (3) shows how to compute correlation coefficient where “N” is the number of data sets, y1 is the data set of one parameter, y2 is the data set of another parameter, y 1 ¯ and y 2 ¯ were the mean values.
r = i = 1 N y 1 y 1 ¯ y 2 y 2 ¯ i = 1 N ( y 1 y 1 ¯ ) 2 i = 1 N ( y 2 y 2 ¯ ) 2

2.7. Muller’s Geo-Accumulation Index

One way to identify the degree of soil contamination would be using Muller’s geoaccumulation. This method uses the actual metal concentration compared to the ordinary or so-called background concentration in the area of study. I g e o is computed using Equation (4). The following values indicate the degree of contamination in soil: I g e o   o f   0 no contamination, 0 < I g e o 1 no contamination to moderately contaminated, 1 < I g e o 2 moderately contaminated, 2 < I g e o 3 moderately to heavily contaminated, 3 < I g e o 4 heavily contaminated, 4 < I g e o 5 heavily to extremely contaminated and I g e o   o f 5 is considered extremely contaminated [33].
I g e o = l o g 2 C n 1.5 × B n
where Cn is the measured concentration of the element in the environment and Bn is the geochemical background value in soil.
Shown in Figure 3 is the research diagram of the study. The data sampling was carried out first, followed by testing its properties using the HANNA multi-parameter and XRF scanner. Measured data then underwent interpolation to create spatial maps using the IDW method. These spatial maps combined with other geospatial data such as CN. Flood hazard maps were processed and then subjected to correlation analysis to determine the degree of relationship of the identified parameters with the continuous elevation of Mn concentration in soil. Geo-accumulation index was also computed to determine the level of contamination in the area by comparing the current concentration with the background concentration of Mn in the area.

3. Results

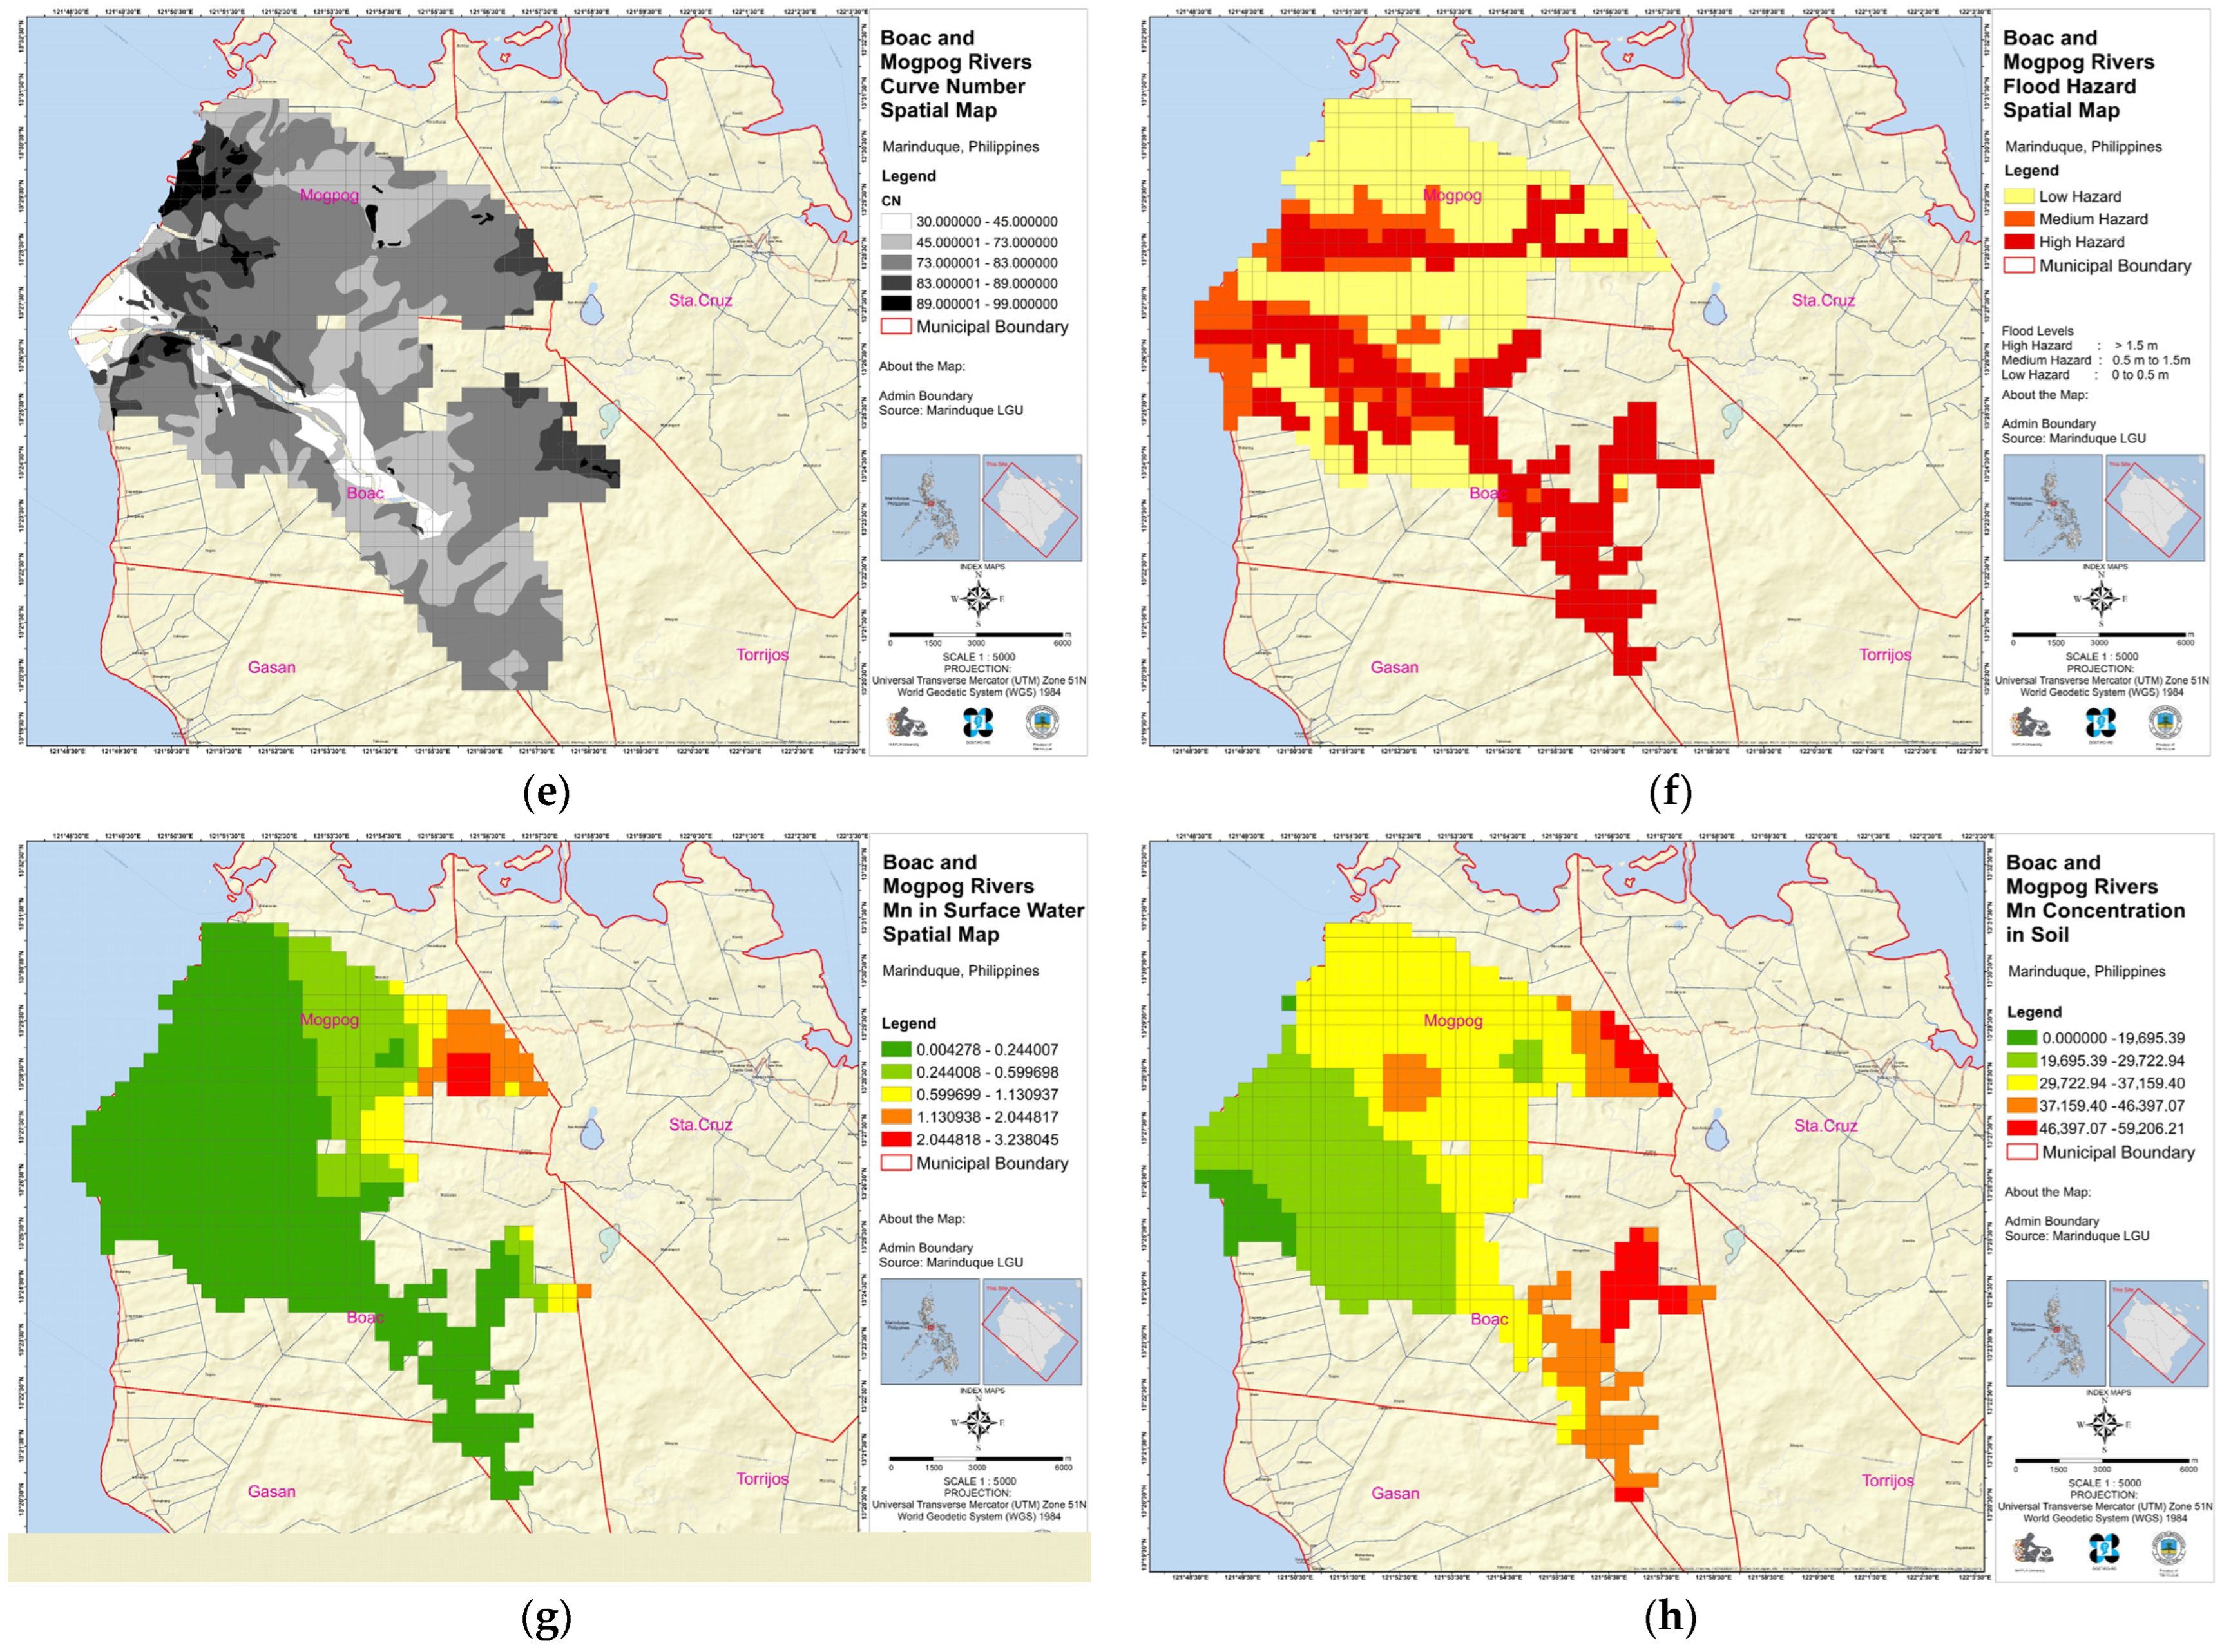
3.1. Flood Hazard Map

The LiDAR DEM used in the flood hazard map has an accuracy of 1 × 1 m pixel size, a vertical of ± 15 cm, and was based on 5, 50, and 100 years return periods. A higher return period denotes a higher intensity of rainfall but has a low likelihood of happening annually. In this study, a 5-year return period was selected because this kind of event has a 20% probability of happening annually [62]. Shown in Figure 4 are areas colored yellow, orange, and red that illustrate low, moderate, and high flooding hazards, respectively. Areas within low hazard areas experienced a flood height of up to 0.5 m, while those in the medium hazard category were flooded between 0.5 and 1.5 m. High hazard areas experienced flood heights greater than 1.5 m. These flood hazard classifications were based on the capability of people to mobilize for evacuation in scenarios with those flood heights.

3.2. Interpolation of Spatial Data

Shown in the Appendix A, Figure A2, Figure A3, Figure A4, Figure A5 and Figure A6 are the interpolated spatial map for each parameter. This interpolation used IDW to identify values in unsampled areas. The interpolation boundary was based on the floodplain only. Limiting the boundary of data interpolation makes it more accurate, as fewer unsampled areas are considered and the density of available data increases [63].

3.3. Spatial Analysis Using Grids and Zonal Statistics

Spatial analysis using grids was used in the study together with zonal statistics [64] to create a comprehensive analysis of all data collected and processed. In the study of Xu et al. [64], they identified the most appropriate grid size for their paper using 500 m, 1 km, 2 km, and 4 km. A 500 m grid size was considered to produce the best representation of spatial data. However, this should still be based on the needs of the specific area under study. In this specific study, since the aim is to create a spatial map where all the mentioned parameters will be compared, a 500 m grid size was used, and properties enclosed in each grid were then extracted using zonal statistics representing the data sets. Grid data has many advantages over point data as grids capture all the data enclosed in each grid, unlike point data that present properties only of a specific point [65]. Shown in Figure 5 is the grid map created in GIS with a size of 500 m covering the flood plain area of Boac and Mogpog rivers. The 599 grids were formed over a 150.25 km2 area. Spatial grid data were created for the following parameters: pH, temperature, EC, TDS, Mn concentrations of surface water (SW), curve number (CN), flood height, and the Mn content of soils are illustrated in the Figure 6a–h. Data of each parameter per grid were extracted and used as data sets in this study. This method helped the researchers simplify data analysis without compromising data quality.

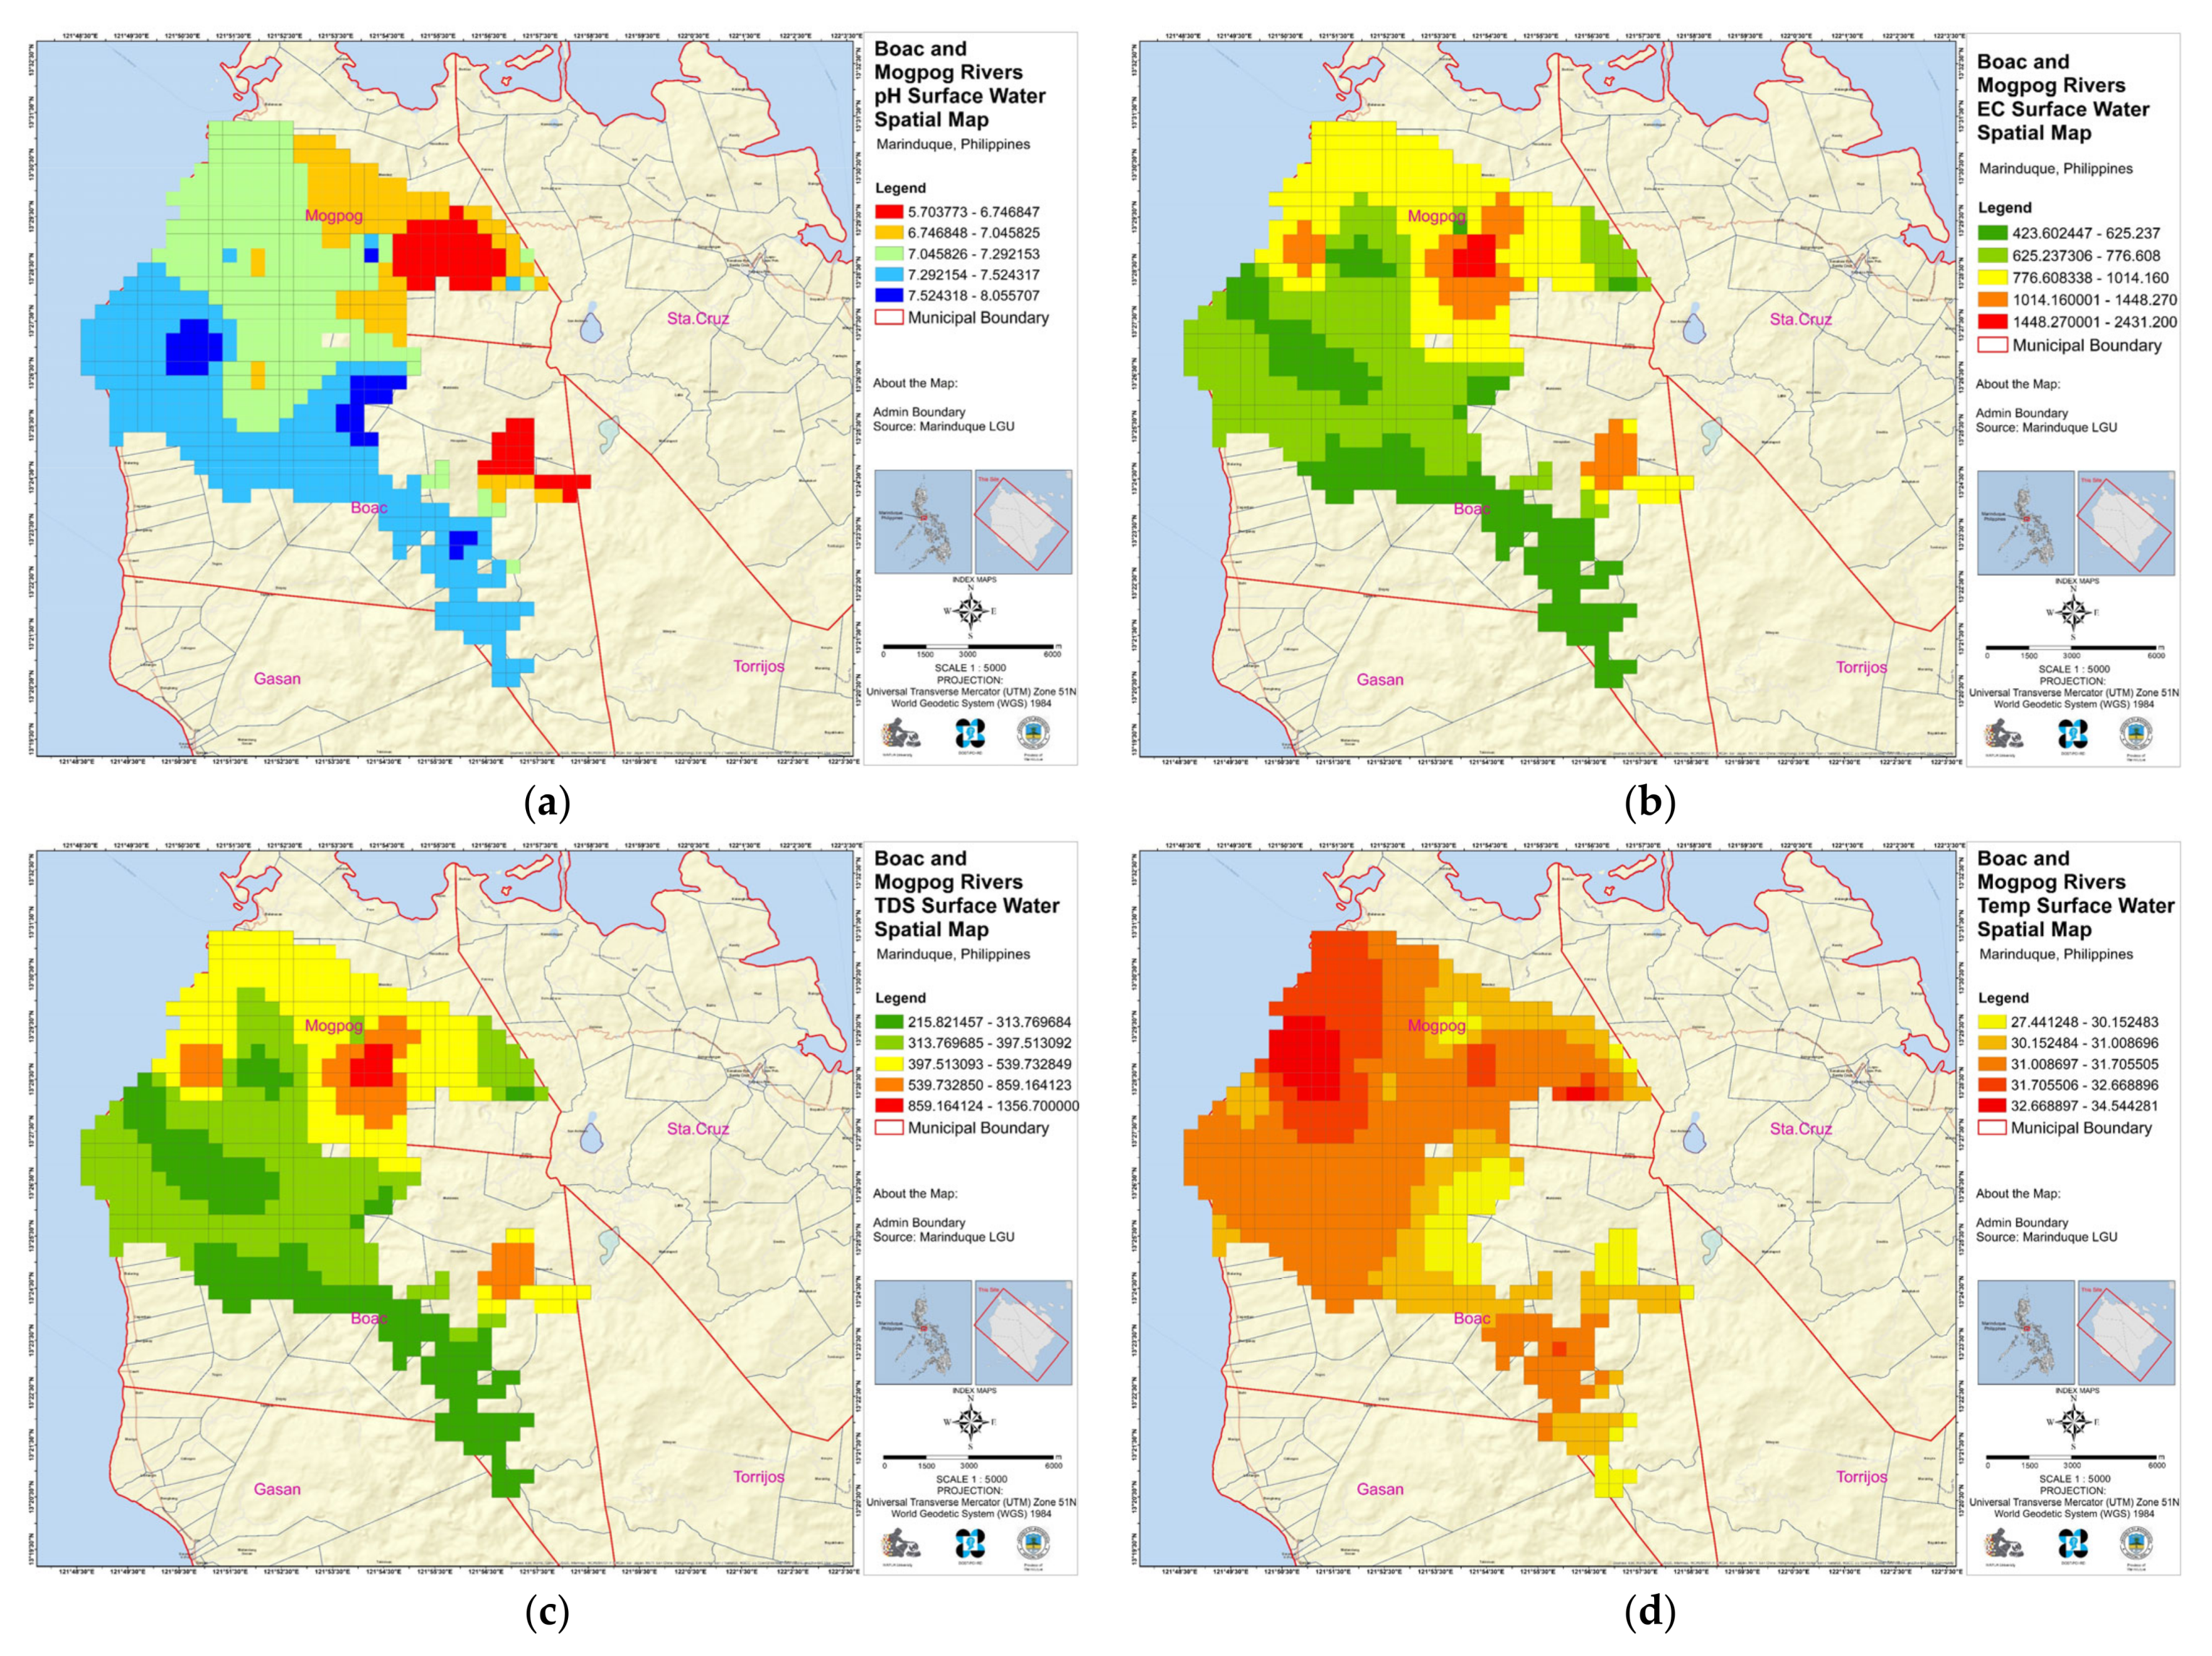
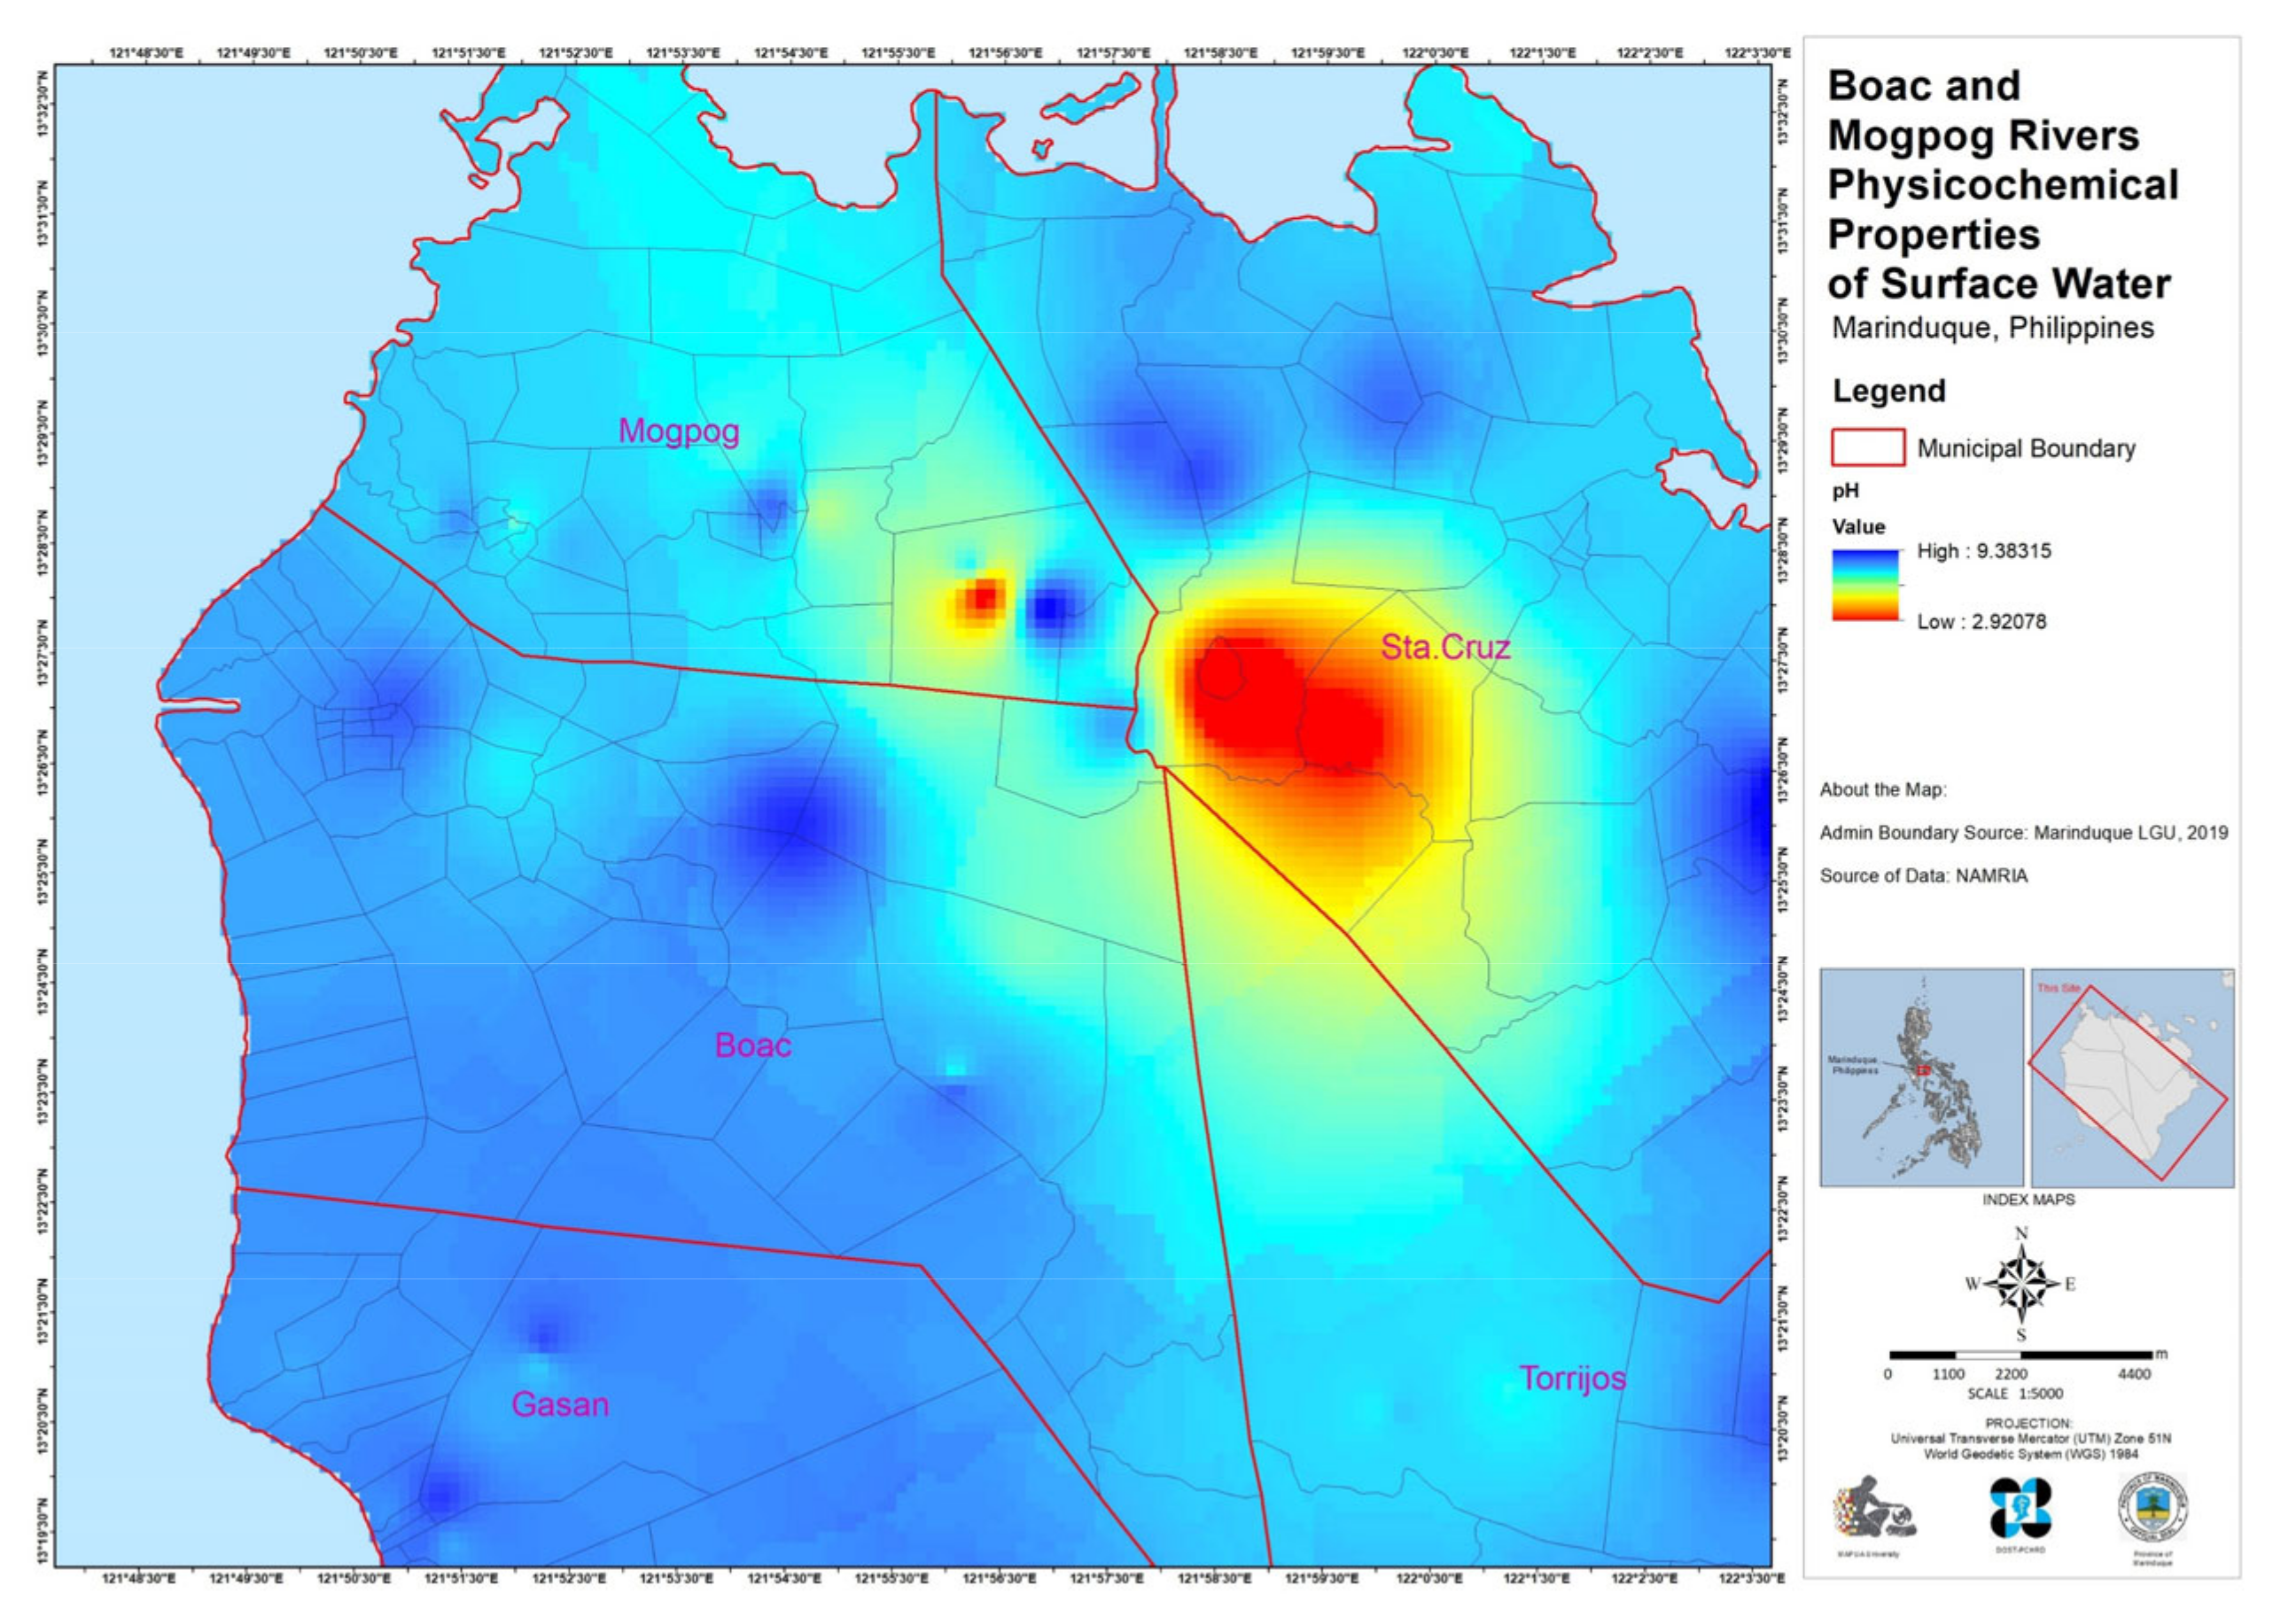
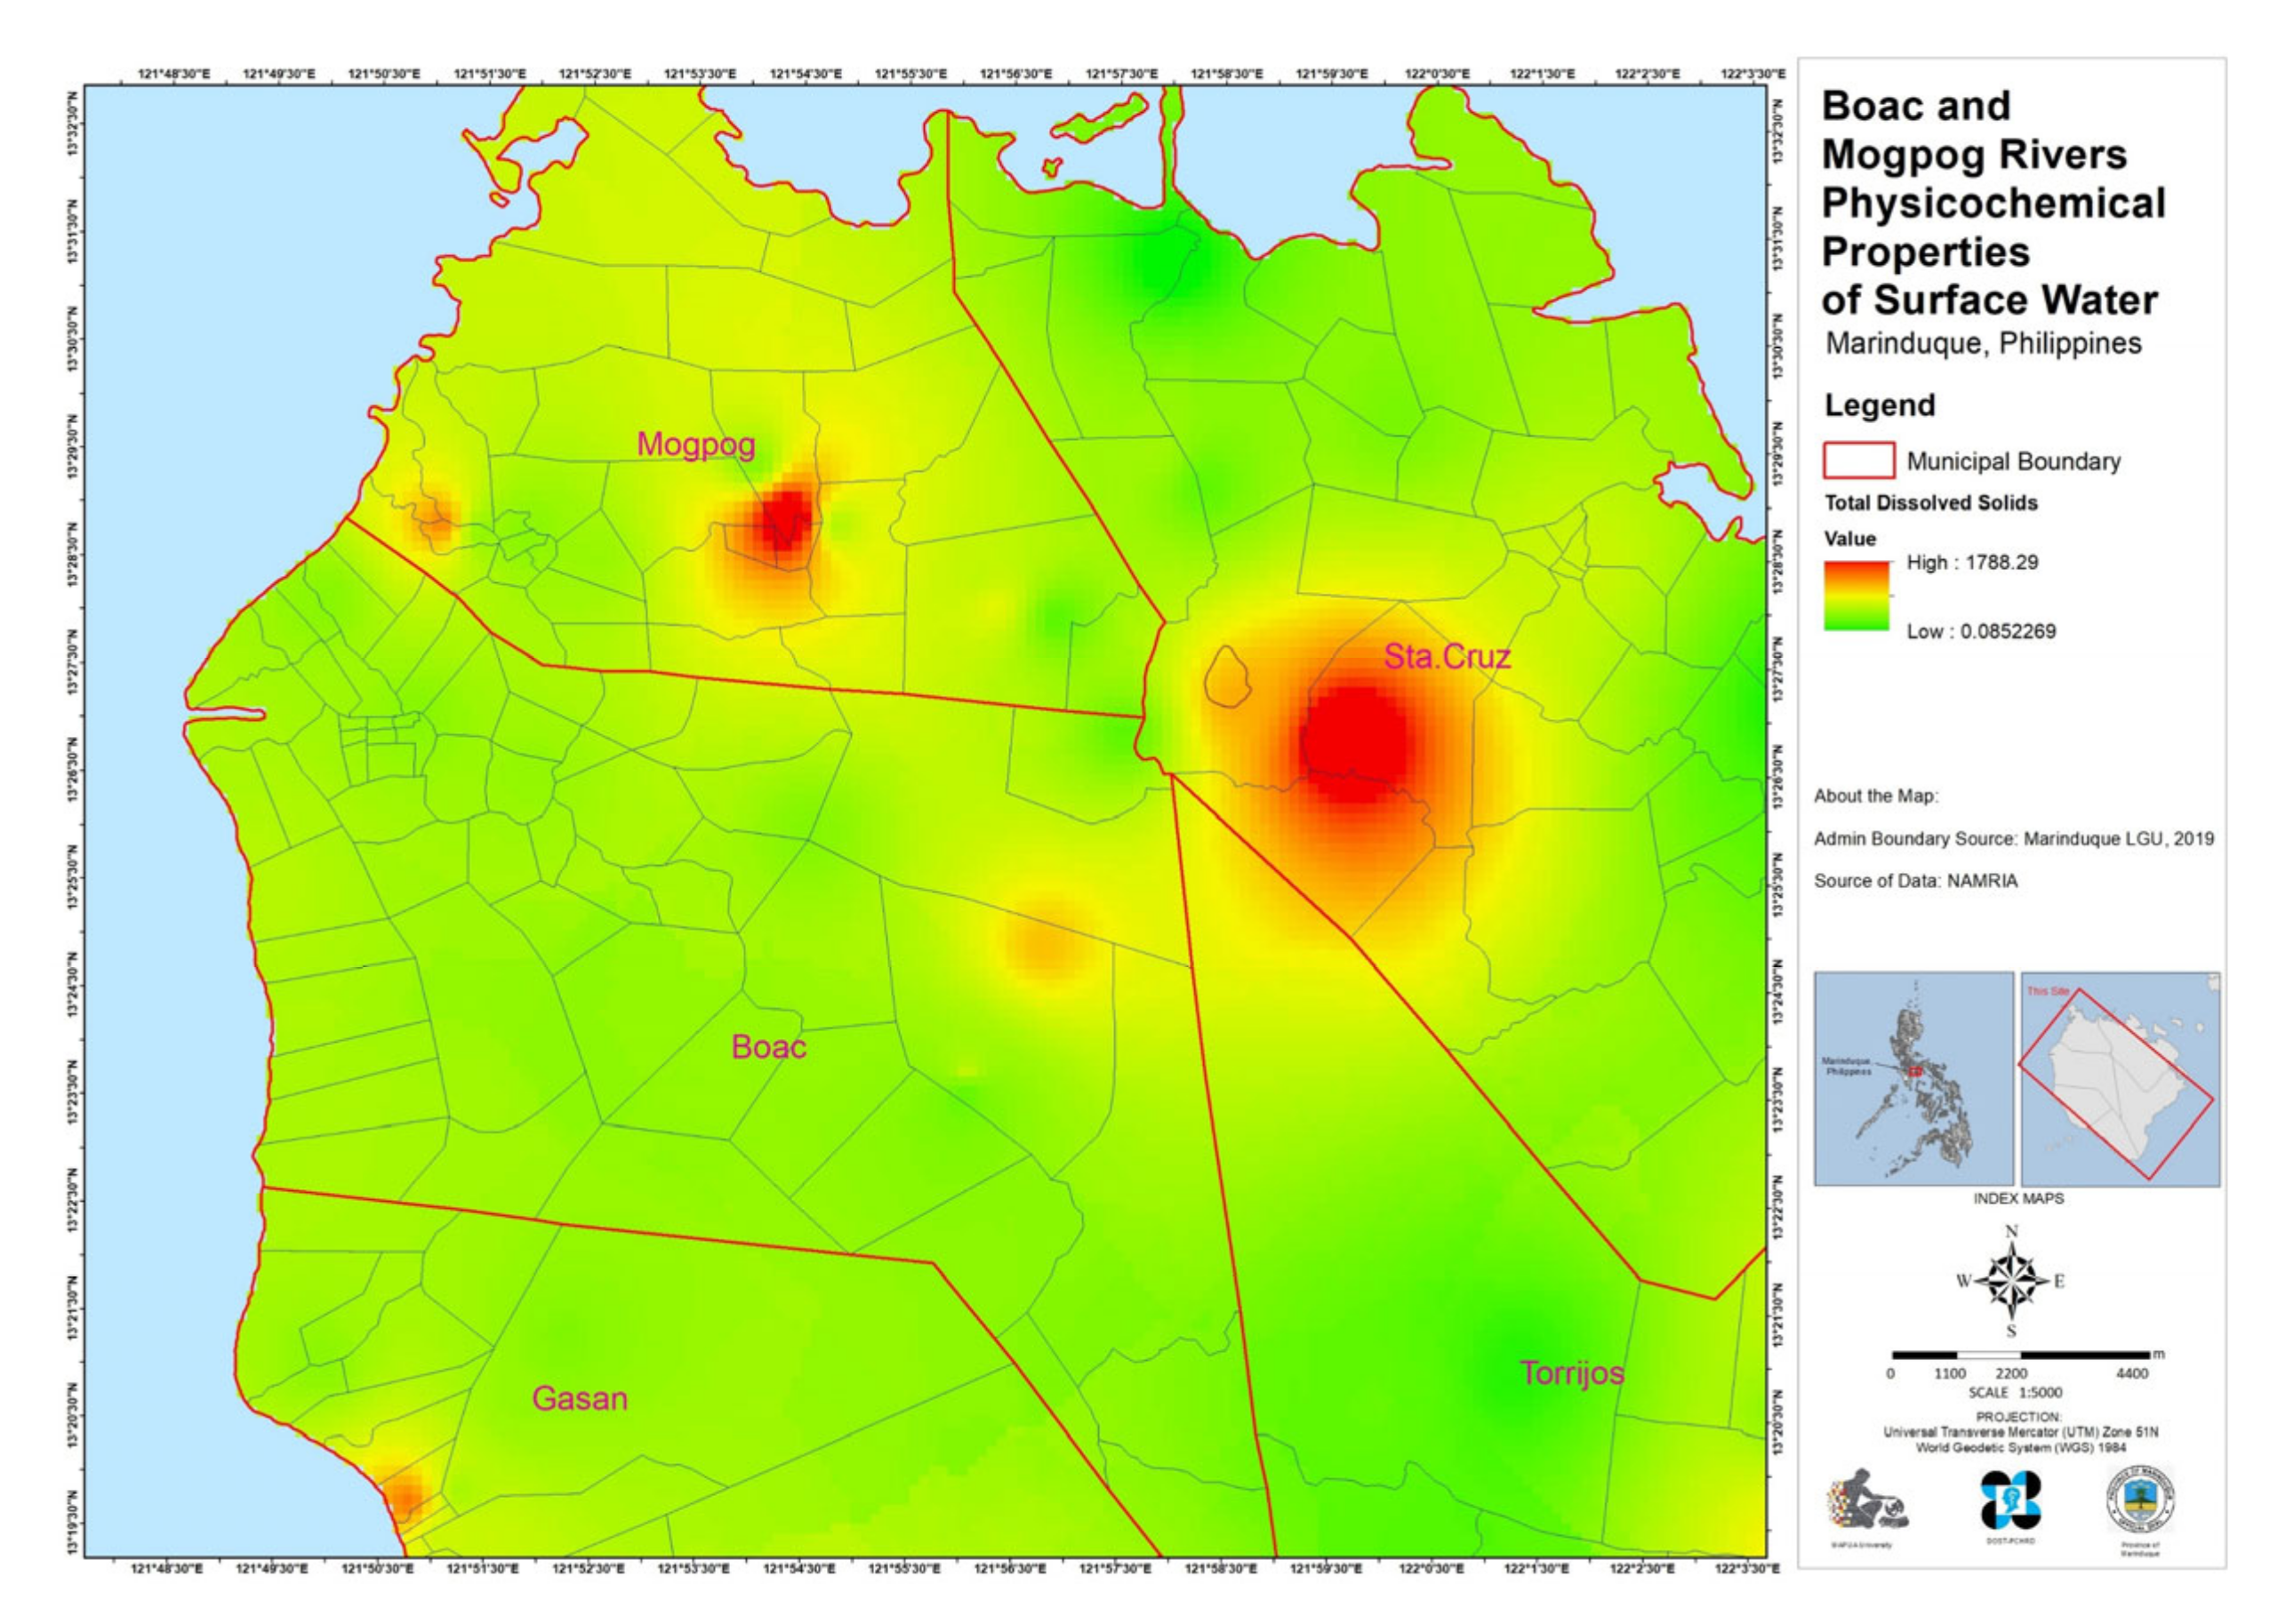
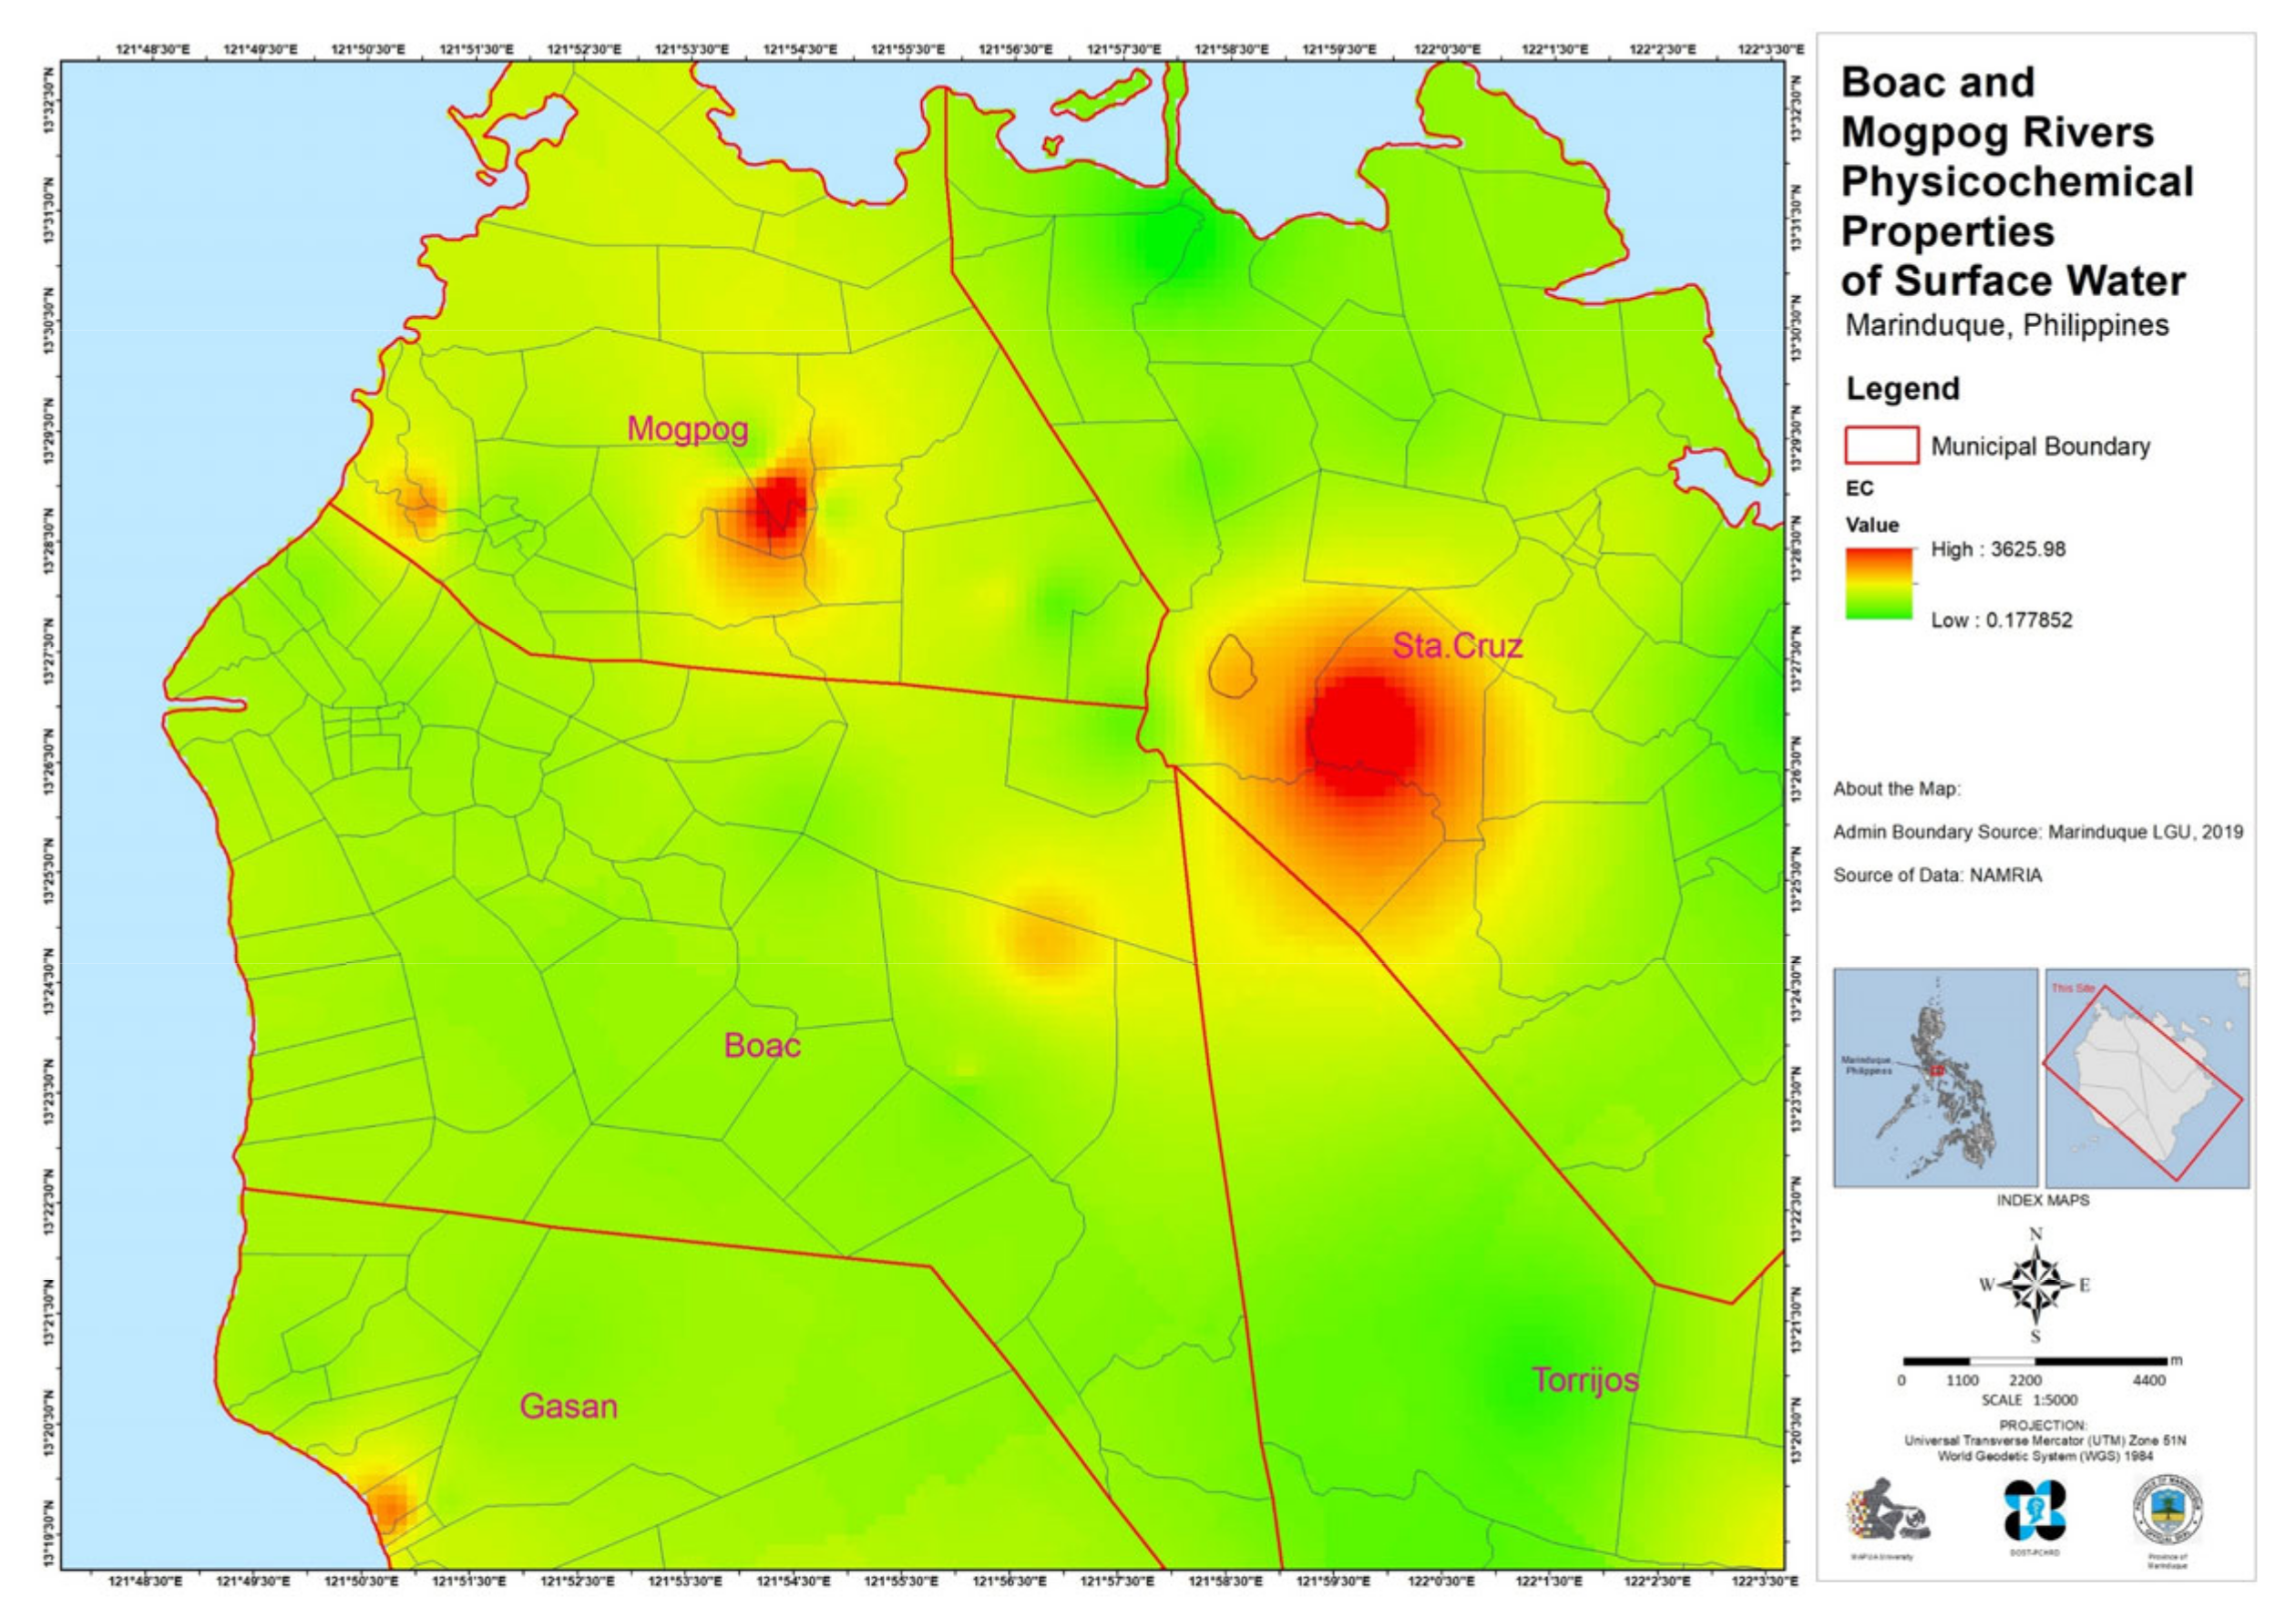
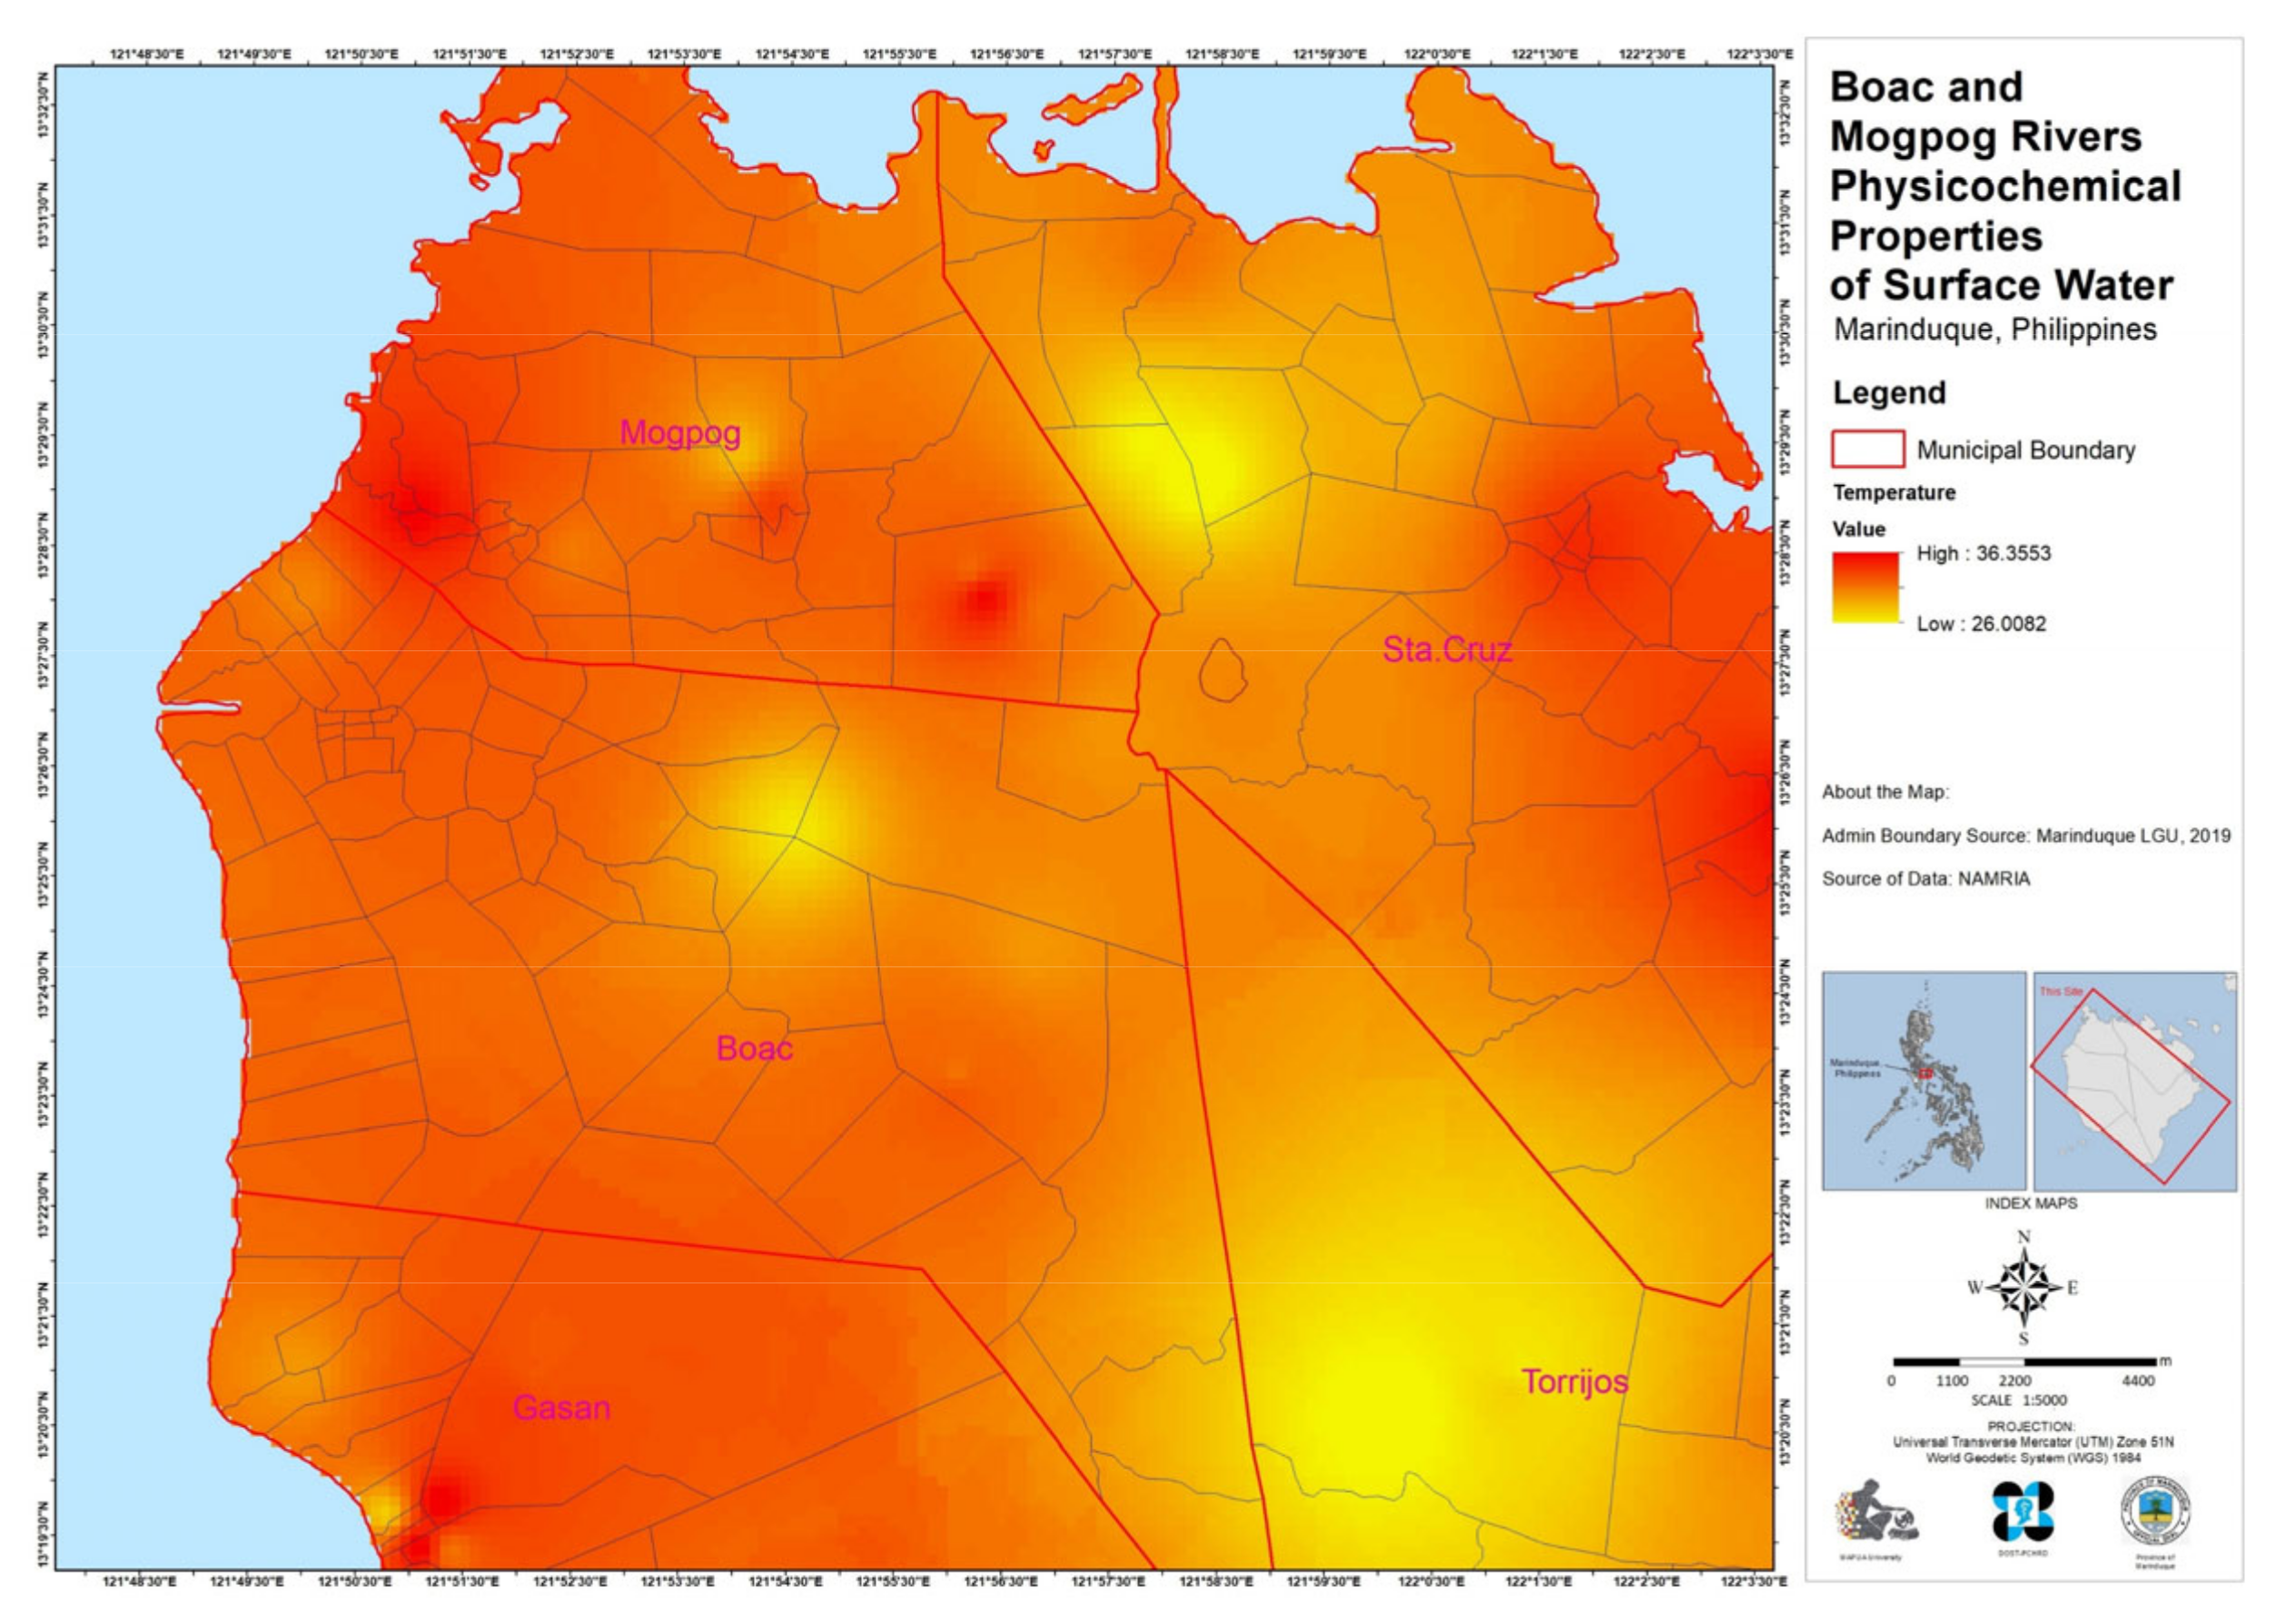
3.4. Physicochemical Properties of Surface Water

Table 1 summarizes the physico-chemical properties of surface water collected in the study.
All surface water collected in the study was tested using the HANNA multi-parameter to gather physicochemical properties of water as this affects heavy metal concentration in it [56]. These parameters could aid in the analysis to identify how Mn concentration in surface water and soils accumulates with time.
These physicochemical properties were compared with the available guidelines set by Philippine National Standards for drinking water (PNSDW) and the World Health Organization (WHO). The pH of the surface water ranged from 5.7 to 8.05 with an average of 7.2, which is within the PNSDW and WHO guidelines, but the results show some areas in the study with acidic pH values. Figure 6a shows the spatial distribution of pH in surface water in the study area. Most of the regions in Mogpog have acidic surface waters, especially near the abandoned mine pit and TSFs. Meanwhile, the highest EC measured in the area was 2430 μ S/cm while the minimum was 763 μ S /cm with an average of 424 μ S /cm. Electric Conductivity was correlated to the salt content of water as the water salinity hazard is measured using this parameter. Although the average EC was less than the WHO guidelines, some locations in the river have high EC even though they are far from the shore (Figure 6b). These high EC samples were concentrated close to the abandoned pit and TSFs, suggesting that the higher EC values could be attributed to mine drainage. The highest value of TDS, a measure of inorganic salts present in solution, was 1356 mg/L which exceeds the WHO guidelines. The lowest TDS was 216 mg/L with an average value over the whole area of 390 mg/L, which is less than the environmental limit (Figure 6c). The TDS was also highest in the areas where EC is highest, showing the direct relationship between these two parameters. Lastly, the temperature doesn’t have any limits identified by NSDW and WHO. The highest surface water temperature in the area was 34.5 °C, while the lowest was 27.4 °C, with a mean of 31.2 °C (Figure 6d).

3.5. Curve Number

Curve number is the hydrologic soil cover correlated to hydrological condition, soil type, and land cover [66]. It indicates the runoff response characteristic of the Mogpog-Boac River basin in this study. Soil map and land cover were provided by NAMRIA. Each soil type corresponds to a particular value of CN, which was used in this study. Curve number ranges from 0 to 99, with higher values denoting lower permeabilities [67]. Figure 6e illustrates the CN distribution in the floodplains of Boac and Mogpog rivers, and the results suggest soils in the Boac area are more permeable than those in Mogpog. Curve numbers between 30 and 68 make up 14.4% of the total floodplain, which are classified as soils having significant permeabilities [67]. In contrast, 85.6% were in the range of 69 to 99, representing areas with low permeability.

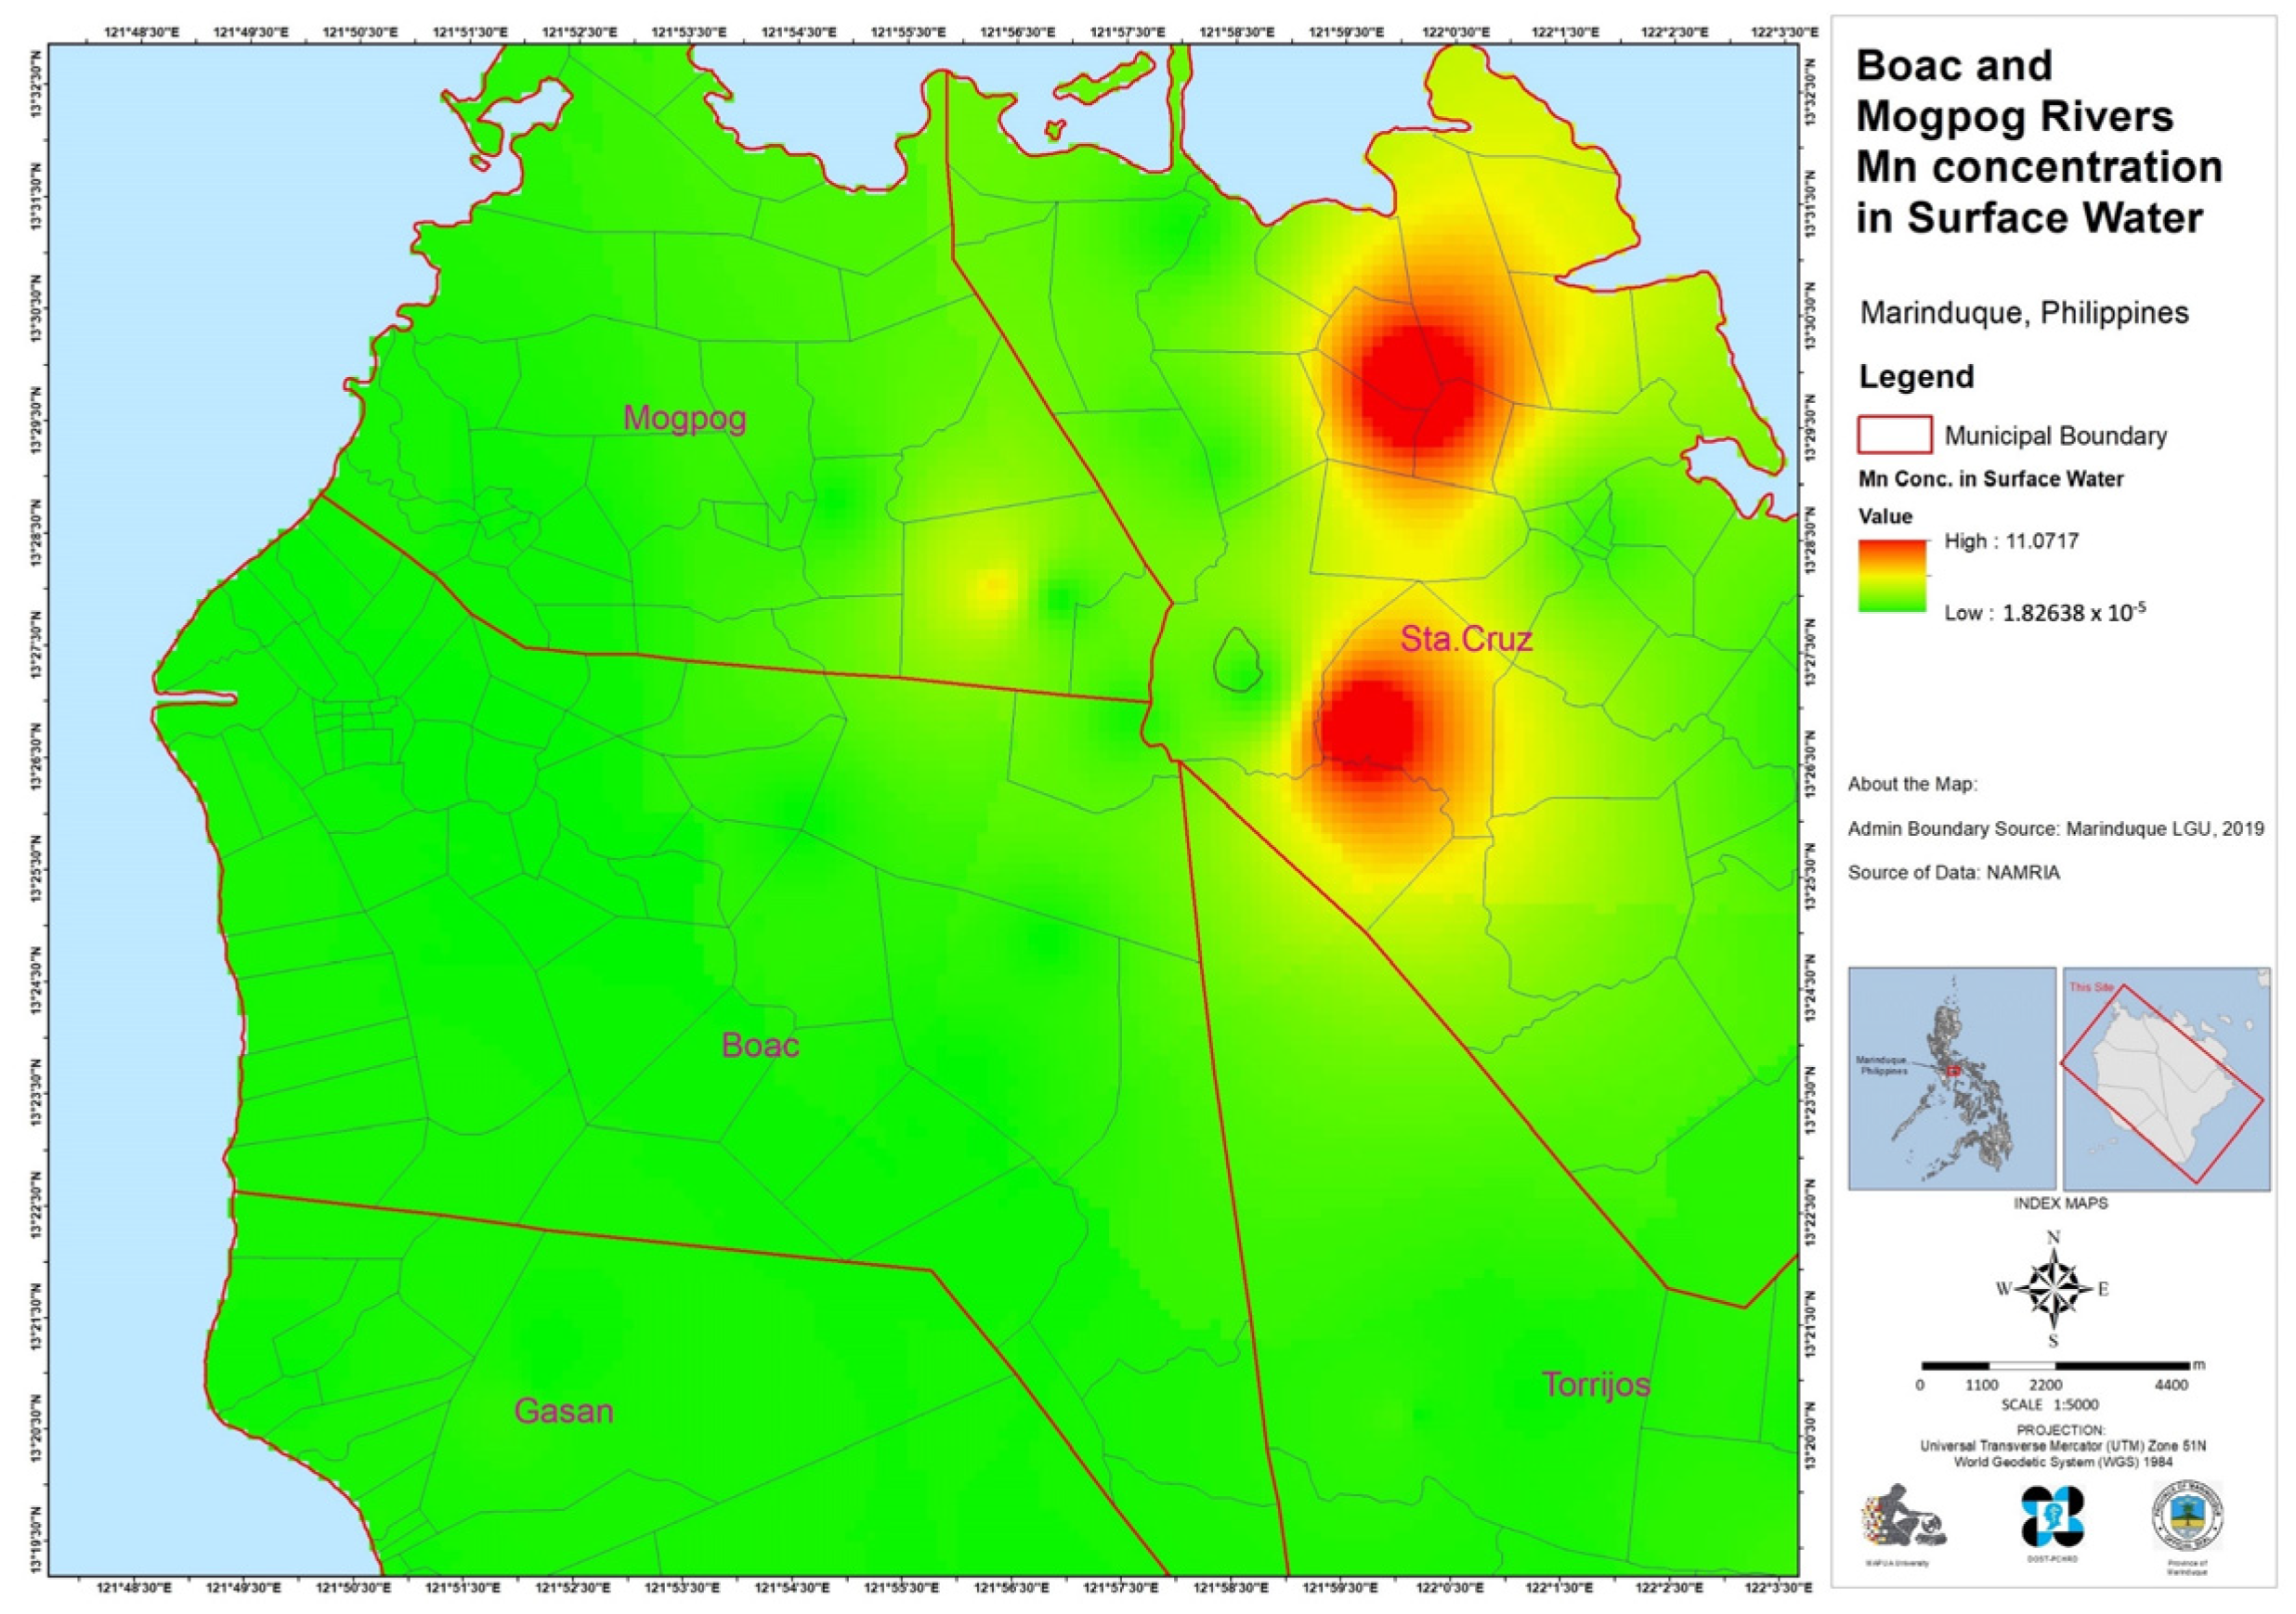
3.6. Manganese Concentration in Surface Water

There were eight heavy metals—Cd, Cr, Fe, Mn, Ni, Zn, Pb, and Cu—detected in the samples, with Mn exhibiting the highest concentrations. The highest Mn concentration measured was 3.24 mg/L, while the lowest was 0.004 mg/L (average of 0.273 mg/L) (Figure 6g). Both the WHO and PNSDW guidelines put the allowable limit of Mn in water at 0.4 mg/L, so even though the average was below the standard, some areas exhibited more than 8-fold (3.24 mg/L) higher than the allowable limit. These values must be taken into consideration because river water in Marinduque is used as a drinking water source with only basic treatment incapable of removing Mn. Moreover, river water is used in agriculture on the island, which could facilitate the bio-accumulation of this contaminant into food crops [68].

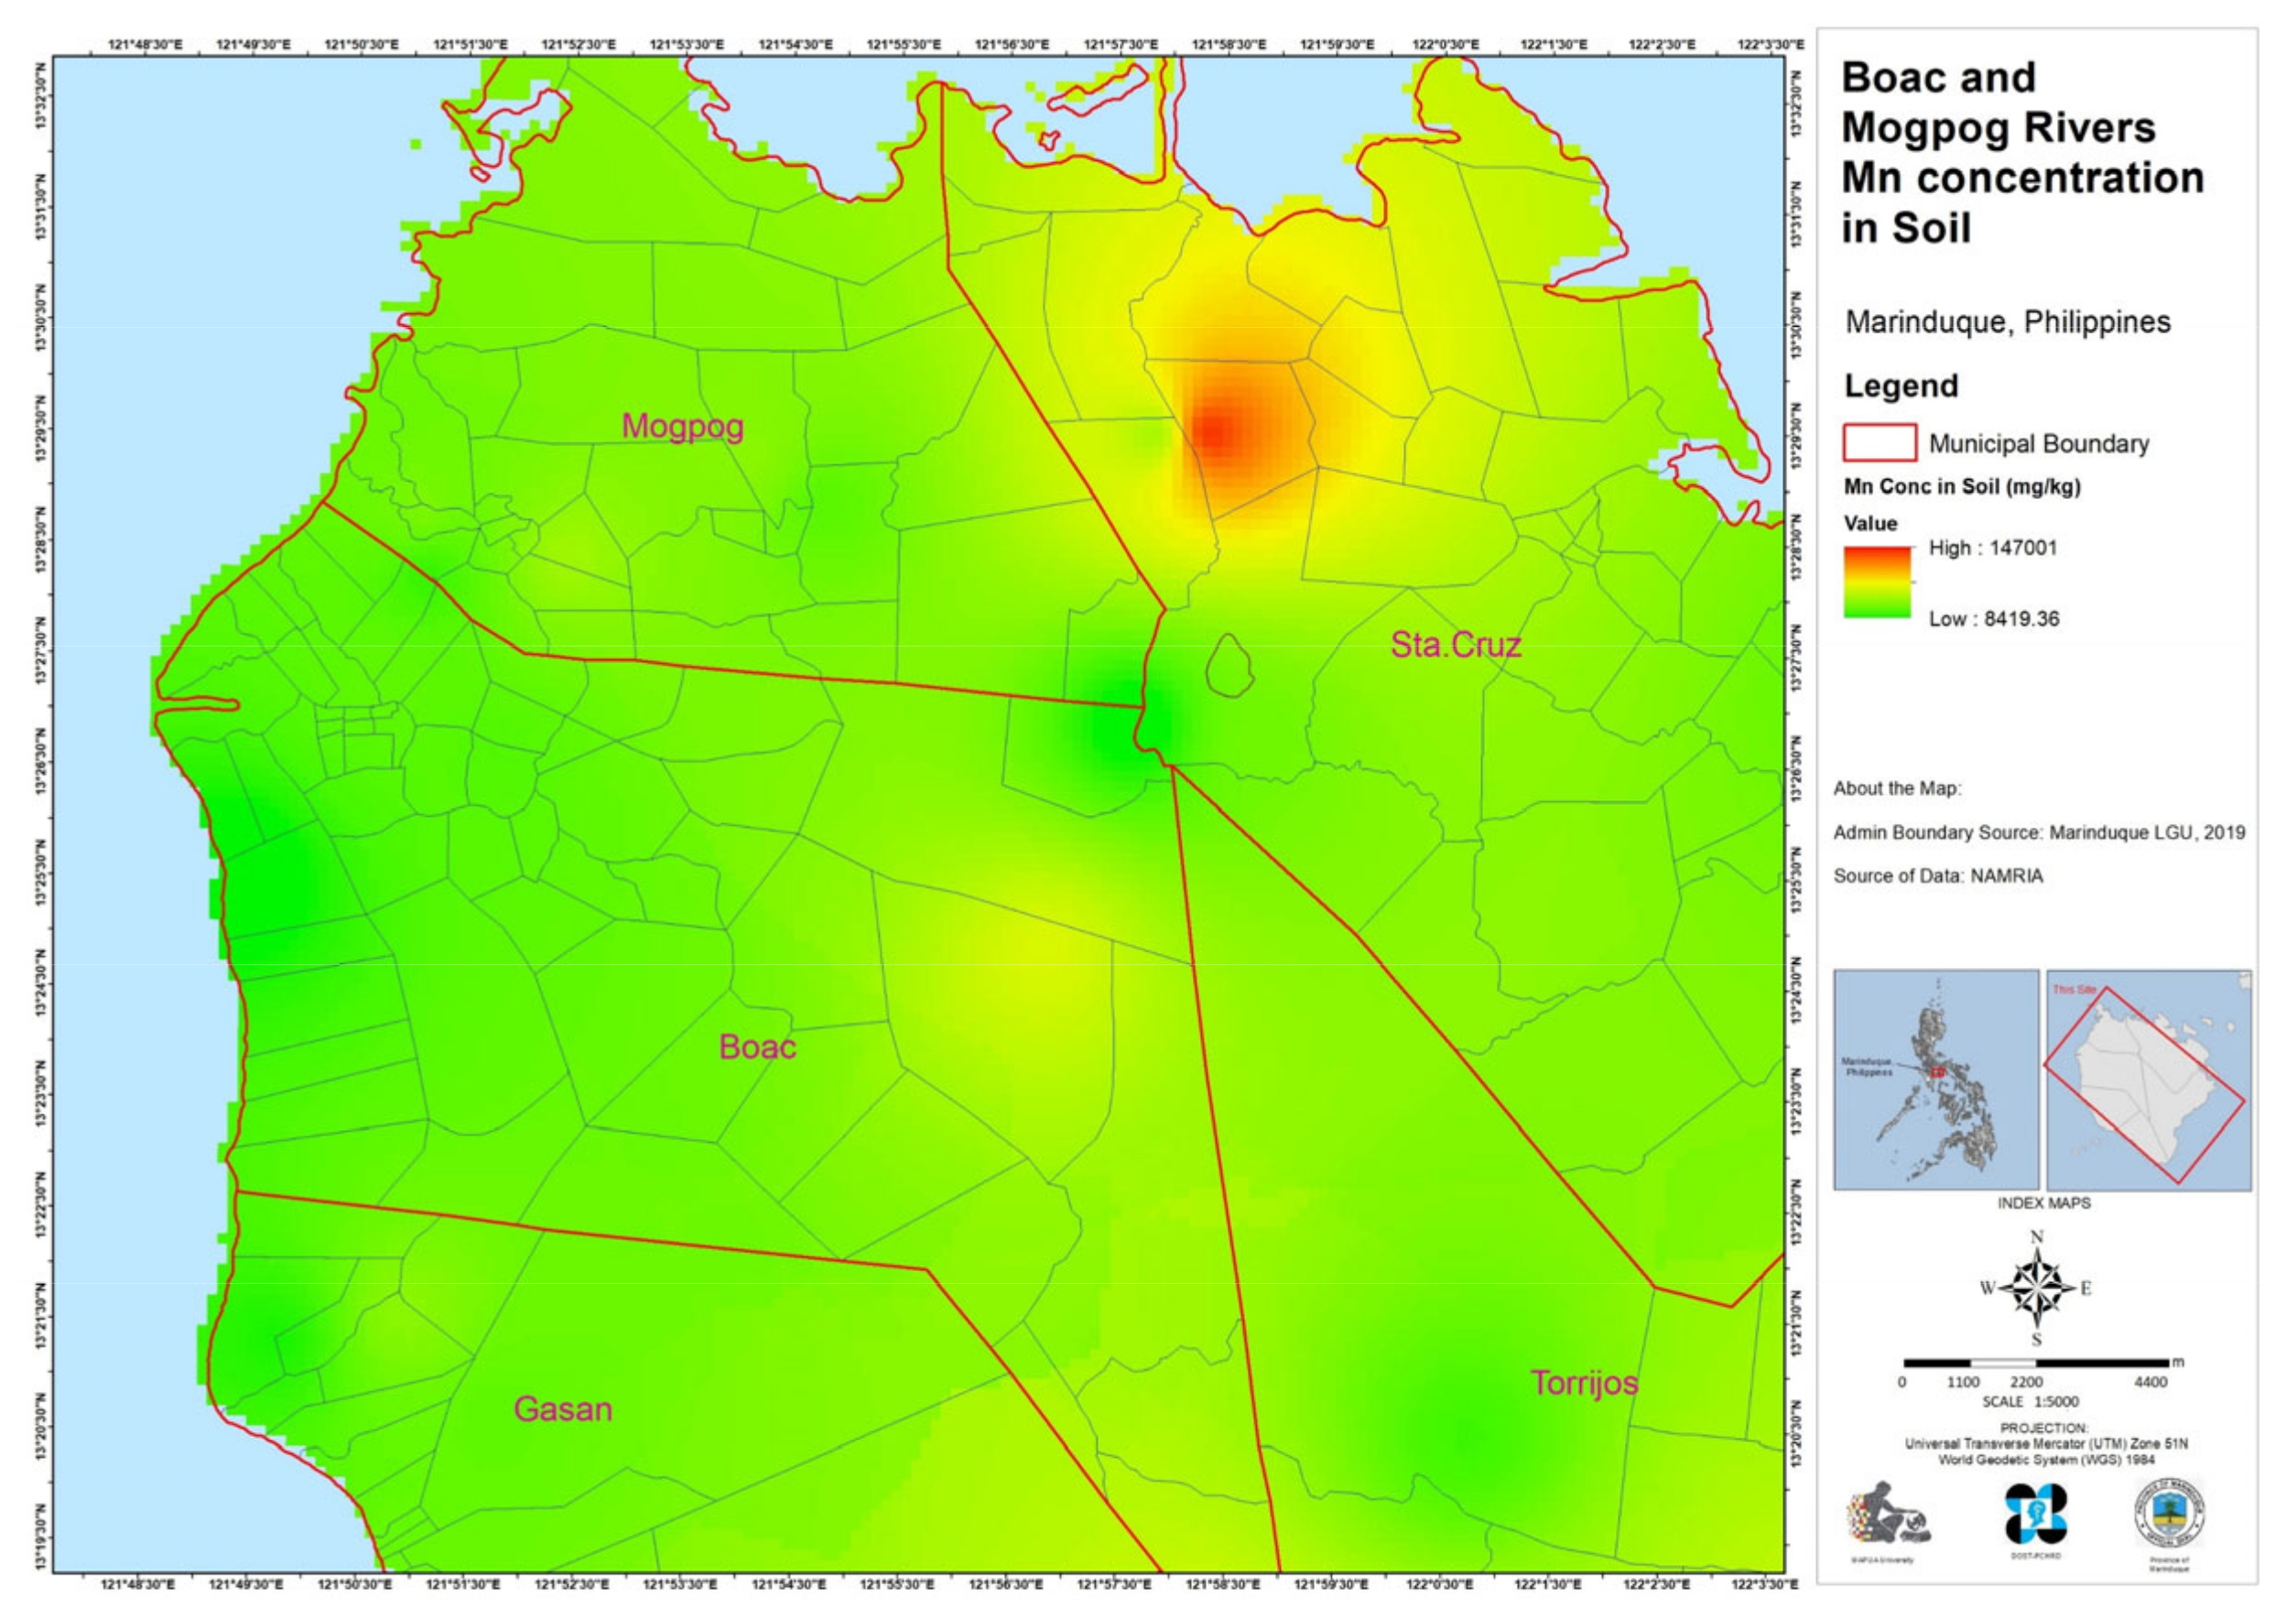
3.7. Manganese Content of Soils

The results show that the highest concentration of Mn in soils was 5.9% (59,000 mg/kg) with an average of 3.3% (33,000 mg/kg) and lowest concentration of 0.86% (8600 mg/kg) (Figure 6h). Based on the map, it is highly likely that the abandoned open pit and TSFs greatly contributed to the accumulation of Mn in soils downstream of the two rivers.

3.8. Data Correlation

In this paper, seven parameters were compared to one another, including the occurring flood heights, in the two rivers to identify their correlation to the Mn content of soils. Table 2 shows the correlation table of each parameter, particularly flood height and Mn concentration.
Table 2 presents the correlation matrix plot of each parameter with one another. Physicochemical properties of water show the following correlation with the Mn concentration in surface water: EC (r = 0.258), TDS (r = 0.231), pH (r = −0.704) and Temp (r = −0.073). Further, Mn concentration in soils was inversely proportional with pH (r = −0.438) and Temp. (r = −0.3). On the other hand, this parameter was positively correlated with EC (r = 0.196), TDS (r = 0.186), Mn in SW (r = 0.381), CN (r = 0.142) and flood heights (r = 0.458). Based on the statistical analysis, there is a significant and moderate positive correlation between flood heights and the Mn content of soils. In contrast, a significant and moderate negative correlation was observed between pH and Mn content of soils. There is also a significant and strong negative correlation between pH and Mn concentration in surface water.

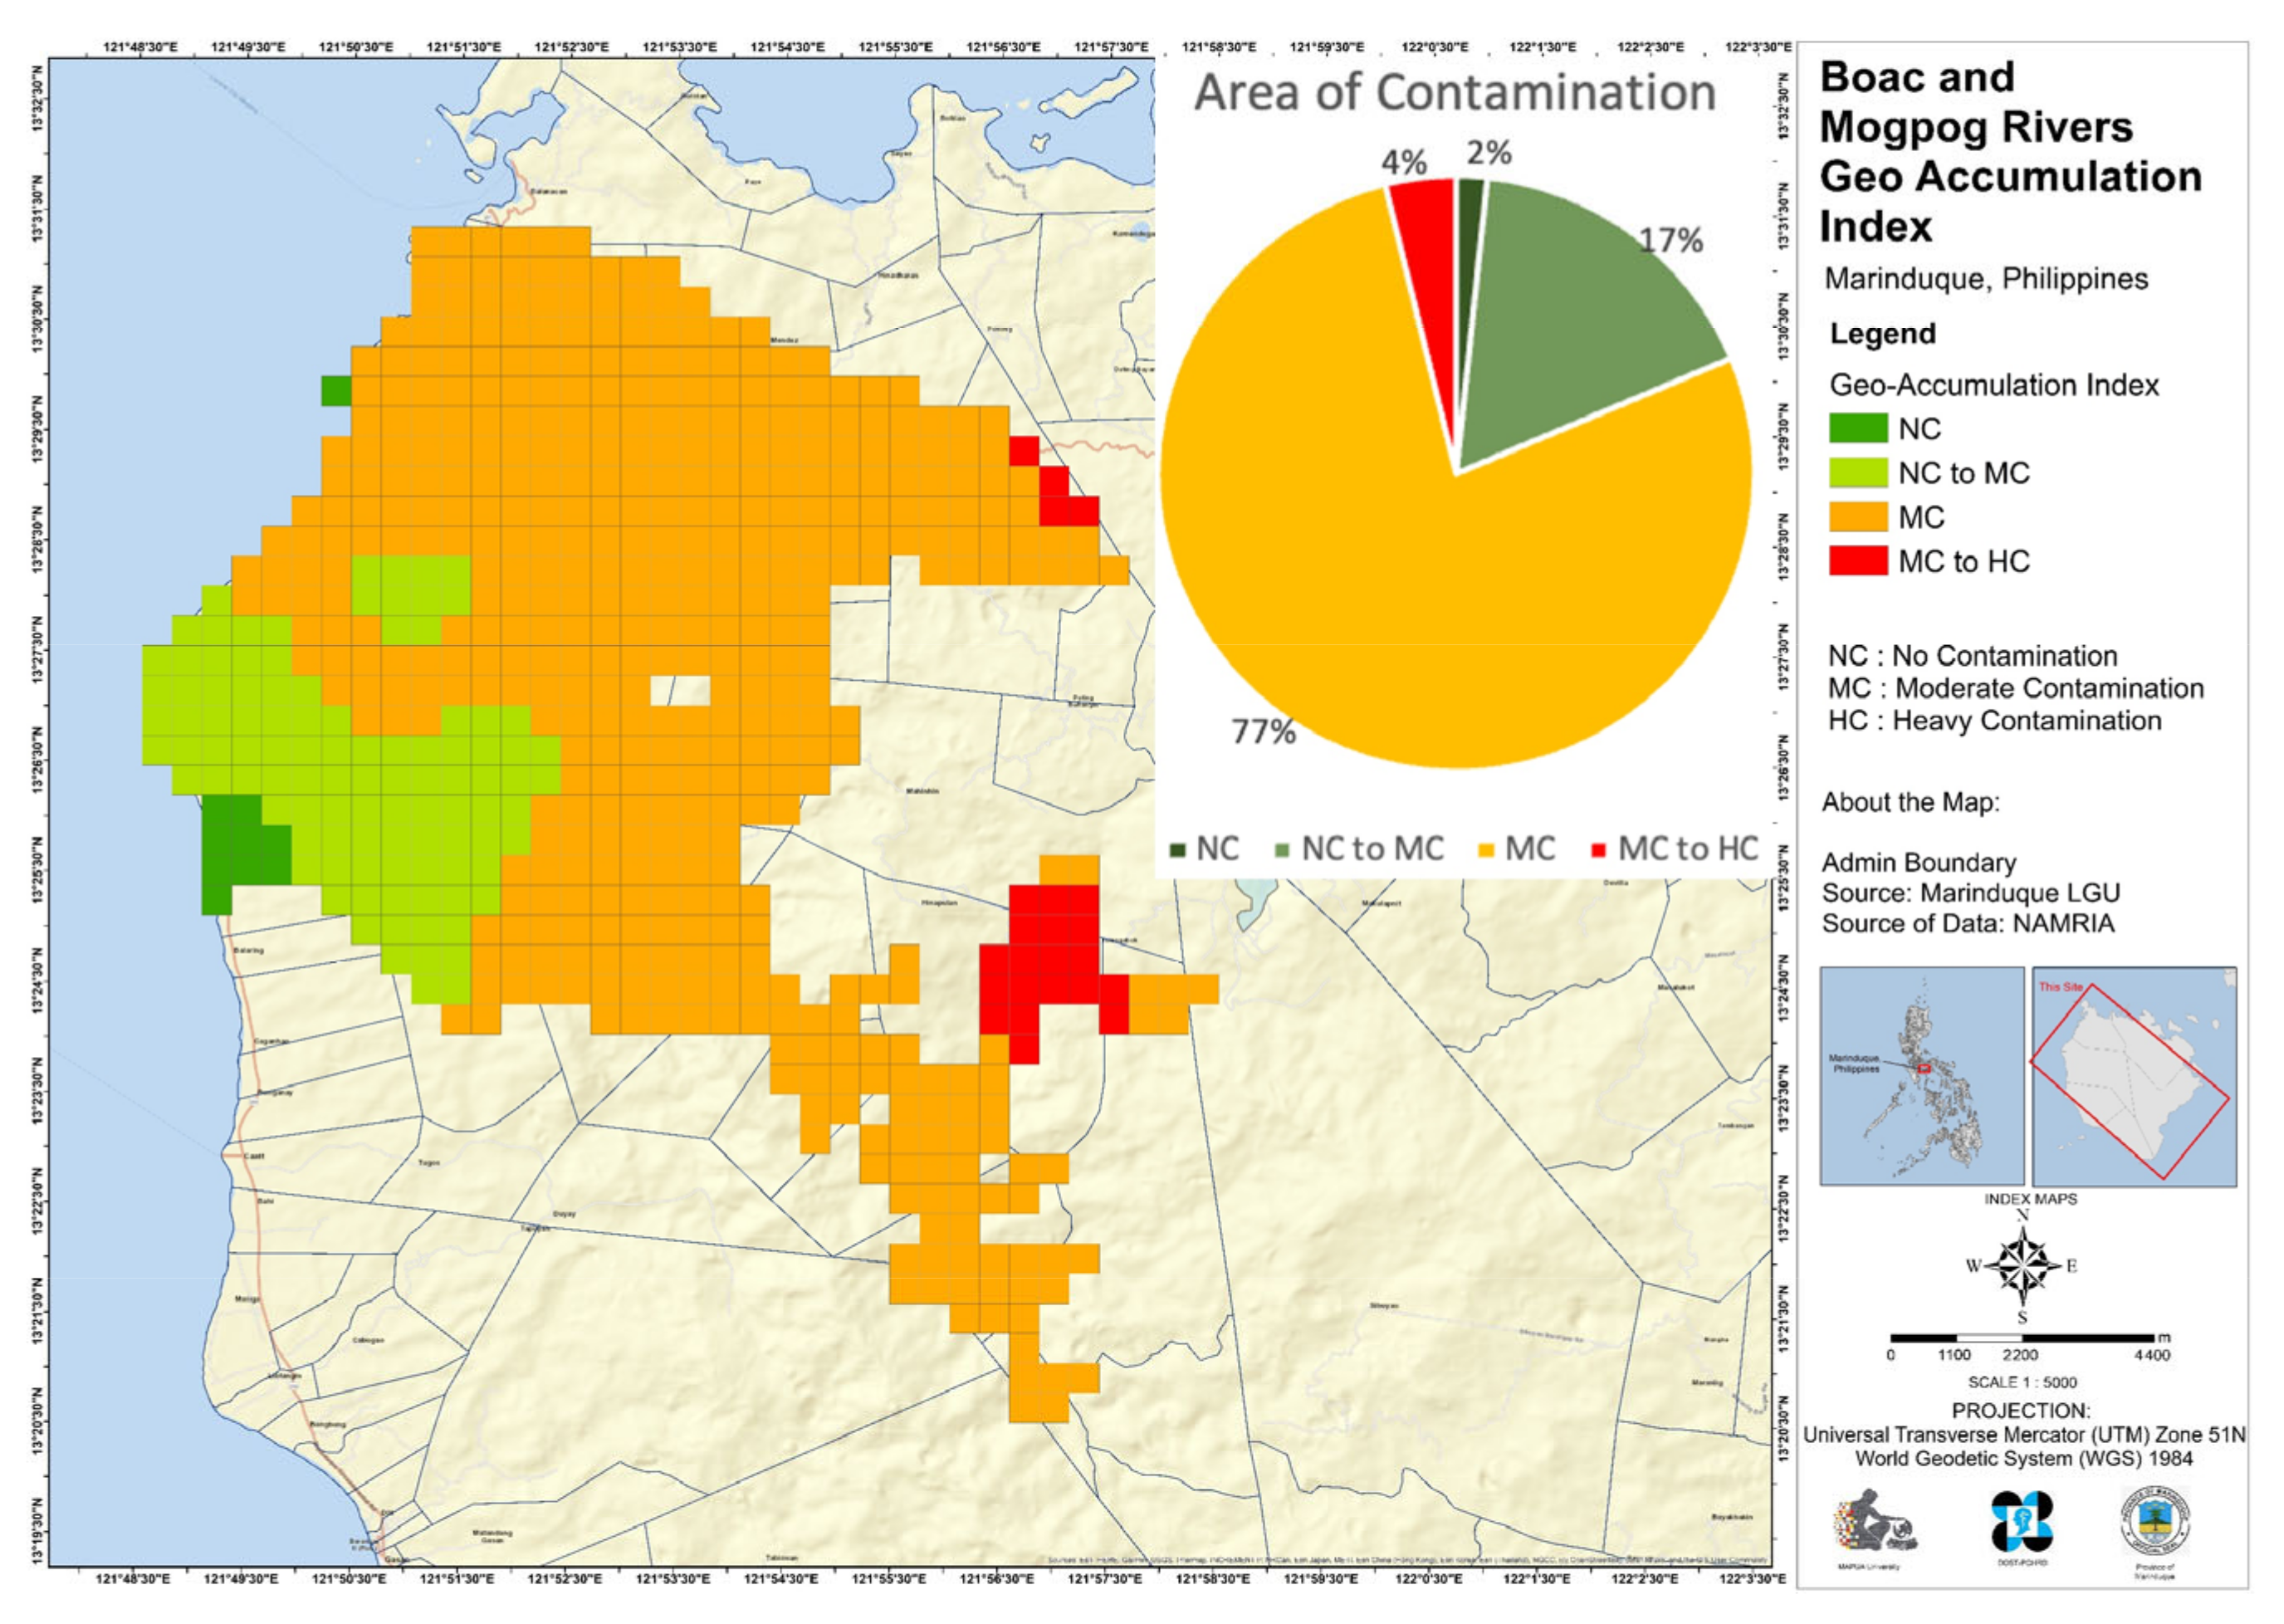
3.9. Geo-Accumulation Index

Figure 7 shows the Igeo map of Mn contamination in the study area and the percentages of land and their degrees of Mn contamination. The majority of the land in the study area is moderately contaminated (MC) with Mn (77.5% or 11,625 ha), while uncontaminated land only constituted 1.67% or 250 ha. These results suggest a serious Mn contamination problem in the areas near the Mogpog and Boac rivers, which are clearly affected by flooding events in the area. On a good note, even though the open mine pit and TSFs were abandoned more than two decades ago, the level of contamination was still at moderately contaminated levels. Without well-planned rehabilitation and remediation interventions, however, heavy metal contamination in the area will worsen with time as areas close to the abandoned mine pit and TSFs are heavily contaminated (Figure 7).

4. Discussion

Based on the results, using geographical information system and data sampling on-site provided a deeper understanding of how flooding events affect the accumulation of Mn in soils near the two rivers. The degree of Mn contamination in floodplain soils at the two rivers was also measured and mapped using Igeo, and areas with the highest contamination indices were identified. In areas with heavy Mn contamination, the Mn concentration in floodplain soils reached 5.9% by weight (~59,000 mg/kg), an amount higher than that found naturally in soils (40–900 mg/kg) [69] and exceeds permissible limits for agricultural use [70].
These maps could guide relevant national and local government agencies in planning appropriate mitigation and rehabilitation plans to limit human exposure to highly contaminated areas along the Mogpog and Boac rivers.
A moderate positive correlation was observed between flood height and Mn content of soils, suggesting that more extensive flooding promotes Mn contamination of floodplain soils in the two rivers. The most likely explanation for this correlation is the mobilization of Mn-bearing silt and sediments from the abandoned mine pits and TSFs and their transport and re-deposition in downstream areas during flooding events. This is also consistent with the moderate negative correlation between pH and Mn content in soils; that is, Mn contamination originated from geologic materials with more acidic pH, like those found in the abandoned mine pits and TSFs (Figure 6).
The most likely carriers of Mn during these flooding events are Fe-oxyhydroxides, which are not only more stable than Mn-oxides (Figure 8) but also more abundant in the soils. These deductions are consistent with the moderate correlation between Fe and Mn in floodplain soils (r = 0.542) and are supported by the Mn geo-accumulation map shown in Figure 7. Fe-oxyhydroxides like ferrihydrite can sequester Mn from solutions via co-precipitation and adsorption reactions, both of which are well-known processes in environmental studies [71]. It is also interesting to note the strong negative correlation between pH and Mn concentration in surface water, a relationship attributed to the redissolution of Mn-bearing minerals in soils like Mn(OH)3 and Hausmannite under acidic conditions, as explained in Figure 8b. Curve number, on the other hand, is a dimensionless number directly correlated to the permeability of the soil that pertains to its capability to absorb water from the surface. In the case of the Boac and Mogpog rivers, where surface water carries Mn, this plays a vital role in how the concentration of this element increases in soil. Frequent flooding in the area provides a course for Mn to enter the soil and increase its concentration to a point above permissible limits and background concentration. An increase of concentration above its background concentration then promotes an increase in the geoaccumulation level, which is what has happened in the Boac and Mogpog rivers over time. There are some areas, such as the USA, where a community does not frequently experience flooding, but after one major flooding event, a significant increase of heavy metal concentration was observed in their area [27].

5. Conclusions

The objective of this study was to investigate the effects of flooding on the accumulation of Mn in the floodplain soils of the Boac and Mogpog rivers. The Inverse Distance Weighting method was used as an interpolation technique to aid in the spatial analysis of the area. Mn concentration in surface water ranged from 0.004–3.33 mg/L with an average of 0.273 mg/L. The average Mn concentration of surface water in the area is still within the standards (0.4 mg/L). However, some surface water samples recorded Mn concentration beyond the reference guideline limits of the USEPA and the International Labour Organization. Mn concentration in soil ranged from 8584–59,206 mg/kg, above the WHO allowable limit of 4000 mg/kg.
Marinduque, like other areas in the Luzon Island and other parts of the country, experiences extreme typhoon events that cause floods in the area, especially in the Boac and Mogpog rivers. We discovered that 40% of the total area considered in the study is subject to high hazards, experiencing flood heights of above 1.5 m based on the available Lidar data.
Correlation analysis and geochemical modeling identified flood height to have a moderate positive correlation with Mn accumulation in the soil, while pH had a moderate negative correlation. This indicates that flooding carries more Mn-bearing materials from the abandoned mine pit and TSFs to floodplains downstream. The correlation result of pH emphasized the effect of acidic mine drainage from the abandoned mine site. These contribute to higher geo-accumulation of Mn with time. Finally, a strong positive-negative correlation between pH and Mn concentrations in surface water, a relationship to be expected because Mn-bearing precipitates like Mn(OH)3 and Hausmannite become more soluble under acidic conditions.
Contamination levels of Mn in floodplain soils of the two rivers were identified using Muller’s geo-accumulation index. The abandoned open pit and TSFs for the last two decades have moderately contaminated 77.5% of the total area ( 1 < I g e o 2 ) while those close to the abandoned open pit and TSFs were moderately to heavily contaminated ( 2 < I g e o 3 ). These results suggest that intervention, remediation, and rehabilitation strategies should be carried out by the national and local governments immediately, especially around the abandoned mine pit and TSF. This could limit the further spread of heavy metal contaminants downstream of the Mogpog and Boac rivers.

Author Contributions

Conceptualization, D.B.S.; methodology, D.B.S. and C.E.F.M.; software, C.E.F.M.; validation, J.J.M.M., P.M.N. and K.L.M.d.J.; formal analysis, P.M.N., C.E.F.M. and C.B.T.; investigation, D.B.S., P.M.N., J.J.M.M. and C.E.F.M.; resources, D.B.S.; data curation, D.B.S., C.E.F.M. and J.J.M.M.; writing—original draft preparation, D.B.S., C.B.T. and C.E.F.M.; writing—review and editing, D.B.S., C.B.T. and K.L.M.d.J.; visualization, C.E.F.M. and C.B.T.; supervision, D.B.S.; project administration, D.B.S.; funding acquisition, D.B.S. All authors have read and agreed to the published version of the manuscript.

Funding

This research was funded by the Department of Science and Technology-Philippine Council for Health Research and Development (DOST-PCHRD), D-HIVE 4B Capital Research Project.

Data Availability Statement

All data are contained in the manuscript.

Acknowledgments

This is to acknowledge the support-in-kind of Mapua University, Marinduque Local Government Units, University of the Philippines LiDAR Portal for Archiving and Distribution, Marinduque State College, and the National Mapping and Resource Information Authority.

Conflicts of Interest

The authors declare no conflict of interest.

Appendix A

Figure A1. Setup of heavy metal testing of surface water and soil using the portable XRF. (a) is the portable XRF, (b) water samples, and (c) soil samples.
Applsci 12 03527 g0a1
Figure A2. Spatial map for pH.
Applsci 12 03527 g0a2
Figure A3. Spatial Map for TDS.
Applsci 12 03527 g0a3
Figure A4. Spatial map for EC.
Applsci 12 03527 g0a4
Figure A5. Spatial map for Temperature.
Applsci 12 03527 g0a5
Figure A6. Spatial map for Mn concentration in Surface Water.
Applsci 12 03527 g0a6
Figure A7. Spatial map for Mn concentration in Soil.
Applsci 12 03527 g0a7

References

  1. Agence France-Presse. The Deadliest Natural Disasters in the Philippines. Available online: https://newsinfo.inquirer.net/507589/the-deadliest-natural-disasters-in-the-philippines (accessed on 11 January 2022).
  2. PAGASA. Tropical Cyclone Information. 2022. Available online: https://www.pagasa.dost.gov.ph/climate/tropicalcyclone-information (accessed on 11 January 2022).
  3. PSA. Damages Due to Natural Extreme Events and Disasters. 2022. Available online: https://psa.gov.ph/content/damages-due-natural-extreme-events-and-disasters-amounted-php-463-billion (accessed on 11 January 2022).
  4. Monjardin, C.E.; Cabundocan, C.; Ignacio, C.; Tesnado, C.J. Impact of climate change on the frequency and severity of floods in the Pasig-Marikina river basin. In Proceedings of the 2019 International Conference on Water Resource and Environmental Engineering (ICWREE2019), Singapore, 22–23 August 2019; EDP Sciences: Les Ulis, France, 2019; Volume 117, p. 00005. [Google Scholar]
  5. PhilAtlas Marinduque. Available online: https://www.philatlas.com/luzon/mimaropa/marinduque.html (accessed on 11 January 2022).
  6. Ruby Dumps Rains in Marinduque; Boac River, Mogpog River Swell. Available online: https://newsinfo.inquirer.net/655977/ruby-dumps-rains-in-marinduque-Boac-river-Mogpog-river-swell (accessed on 11 January 2022).
  7. Lidar Surveys and Floodplain Mapping of Boac River. Available online: https://dream.upd.edu.ph/assets/Publications/LiDAR-Technical-Reports/UPLB/LiDAR-Surveys-and-Flood-Mapping-of-Boac-River.pdf (accessed on 13 January 2022).
  8. Loudon, A.G. Marcopper porphyry copper deposit, Philippines. Econ. Geol. 1976, 71, 721–732. [Google Scholar] [CrossRef]
  9. Bennagen, M.E. Estimation of environmental damages from mining pollution: The Marinduque island mining accident. In EEPSEA Research Report rr1998111; Economy and Environment Program for Southeast Asia (EEPSEA): Los Baños, Philippines, 1998. [Google Scholar]
  10. The Marcopper Disaster: A Tragedy That Continues in People’s Veins. Available online: https://miningwatch.ca/news/2019/4/3/marcopper-disaster-tragedy-continues-people-s-veins (accessed on 11 January 2022).
  11. Igarashi, T.; Herrera, P.S.; Uchiyama, H.; Miyamae, H.; Iyatomi, N.; Hashimoto, K.; Tabelin, C.B. The two-step neutralization ferrite-formation process for sustainable acid mine drainage treatment: Removal of copper, zinc and arsenic, and the influence of coexisting ions on ferritization. Sci. Total Environ. 2020, 715, 136877. [Google Scholar] [CrossRef]
  12. Tabelin, C.B.; Corpuz, R.D.; Igarashi, T.; Villacorte-Tabelin, M.; Alorro, R.D.; Yoo, K.; Raval, S.; Ito, M.; Hiroyoshi, N. Acid mine drainage formation and arsenic mobility under strongly acidic conditions: Importance of soluble phases, iron oxyhydroxides/oxides and nature of oxidation layer on pyrite. J. Hazard. Mater. 2020, 399, 122844. [Google Scholar] [CrossRef] [PubMed]
  13. Tomiyama, S.; Igarashi, T.; Tabelin, C.B.; Tangviroon, P.; Ii, H. Modeling of the groundwater flow system in excavated areas of an abandoned mine. J. Contam. Hydrol. 2020, 230, 103617. [Google Scholar] [CrossRef] [PubMed]
  14. David, C. Heavy metal concentrations in marine sediments impacted by a mine-tailings spill, Marinduque Island, Philippines. Environ. Geol. 2002, 42, 955–965. [Google Scholar]
  15. David, C.P. Heavy metal concentrations in growth bands of corals: A record of mine tailings input through time (Marinduque Island, Philippines). Mar. Pollut. Bull. 2003, 46, 187–196. [Google Scholar] [CrossRef]
  16. David, C.P.C.; Plumlee, G.S. Comparison of dissolved copper concentration trends in two rivers receiving ARD from an inactive copper mine (Marinduque Island, Philippines). In Proceedings of the 7th International Conference on Acid Rock Drainage (ICARD), St. Louis, MO, USA, 26–30 March 2006; pp. 26–30. [Google Scholar]
  17. Senoro, D.B.; de Jesus, K.L.M.; Yanuaria, C.A.; Bonifacio, P.B.; Manuel, M.T.; Wang, B.N.; Kao, C.C.; Wu, T.N.; Ney, F.P.; Natal, P. Rapid site assessment in a small island of the Philippines contaminated with mine tailings using ground and areal technique: The environmental quality after twenty years. In IOP Conferences Series: Earth and Environmental Science; IOP Publishing: Bristol, UK, 2019; Volume 351, p. 012022. [Google Scholar]
  18. Millaleo, R.; Reyes-Diaz, M.; Ivanov, A.G.; Mora, M.L.; Alberdi, M. Manganese as essential and toxic element for plants: Transport, accumulation and resistance mechanisms. J. Soil Sci. Plant Nutr. 2010, 10, 470–481. [Google Scholar] [CrossRef] [Green Version]
  19. Alejandro, S.; Holler, S.; Meier, B.; Peiter, E. Manganese in plants: From acquisition to subcellular allocation. Front. Plant Sci. 2020, 11, 300. [Google Scholar] [CrossRef] [Green Version]
  20. Park, I.; Tabelin, C.B.; Jeon, S.; Li, X.; Seno, K.; Ito, M.; Hiroyoshi, N.A. Review of recent strategies for acid mine drainage prevention and mine tailings recycling. Chemosphere 2019, 219, 588–606. [Google Scholar] [CrossRef]
  21. Aronson, J.K. (Ed.) Meyler’s Side Effects of Drugs: The International Encyclopedia of Adverse Drug Reactions and Interactions; Elsevier: Amsterdam, The Netherlands, 2015. [Google Scholar]
  22. Fuchida, S.; Tajima, S.; Nishimura, T.; Tokoro, C. Kinetic modeling and mechanisms of manganese removal from alkaline mine water using a pilot scale column reactor. Minerals 2022, 12, 99. [Google Scholar] [CrossRef]
  23. Senoro, D.B.; Bonifacio, P.B.; Mascareñas, D.R.; Tabelin, C.B.; Ney, F.P.; Lamac, M.R.L.; Tan, F.J. Spatial distribution of agricultural yields with elevated metal concentration of the island exposed to acid mine drainage. J. Degrad. Min. Lands Manag. 2020, 8, 2551–2558. [Google Scholar] [CrossRef]
  24. Agarin, C.J.M.; Mascareñas, D.R.; Nolos, R.; Chan, E.; Senoro, D.B. Transition metals in freshwater crustaceans, tilapia, and inland water: Hazardous to the population of the small island province. Toxics 2021, 9, 71. [Google Scholar] [CrossRef] [PubMed]
  25. Nolos, R.C.; Agarin, C.J.M.; Domino, M.Y.R.; Bonifacio, P.B.; Chan, E.B.; Mascareñas, D.R.; Senoro, D.B. Health Risks due to metal concentrations in soil and vegetables from the six municipalities of the Island Province in the Philippines. Int. J. Environ. Res. Public Health 2022, 19, 1587. [Google Scholar] [CrossRef]
  26. WBG (World Bank Group). Minerals for Climate Action: The Mineral Intensity of the Clean Energy Transition. 2020. Available online: http://pubdocs.worldbank.org/en/961711588875536384/Minerals-for-Climate-Action-The-Mineral-Intensity-of-the-Clean-Energy-Transition.pdf (accessed on 30 September 2020).
  27. Han, I.; Whitworth, K.W.; Christensen, B.; Afshar, M.; Han, H.A.; Rammah, A.; Oluwadario, T.; Symanski, E. Heavy metal pollution of soils and risk assessment in Houston, Texas following Hurricane Harvey. Environ. Pollut. 2021, 296, 118717. [Google Scholar] [CrossRef] [PubMed]
  28. Ciesielczuk, T.; Kusza, G.; Poluszynska, J.; Kochanowska, K. Pollution of flooded arable soils with heavy metals and polycyclic aromatic hydrocarbons (PAHs). Water Air Soil Pollut. 2014, 225, 2145. [Google Scholar] [CrossRef] [PubMed] [Green Version]
  29. Marrugo-Negrete, J.; Pinedo-Hernandez, J.; Combatt, E.M.; Bravo, A.G.; Diez, S. Flood-induced metal contamination in the topsoil of floodplain agricultural soils: A case-study in Colombia. Land Degrad. Dev. 2019, 30, 2139–2149. [Google Scholar] [CrossRef]
  30. Ponting, J.; Kelly, T.J.; Verhoef, A.; Watts, M.J.; Sizmur, T. The impact of increased flooding occurrence on the mobility of potentially toxic elements in floodplain soil–A review. Sci. Total Environ. 2021, 754, 142040. [Google Scholar] [CrossRef]
  31. Antoniadis, V.; McKinley, J.D. Measuring heavy metal migration rates in a low-permeability soil. Environ. Chem. Lett. 2003, 1, 103–106. [Google Scholar] [CrossRef]
  32. Tabelin, C.B.; Silwamba, M.; Paglinawan, F.C.; Mondejar, A.J.S.; Duc, H.G.; Resabal, V.J.; Opiso, E.M.; Igarashi, T.; Tomiyama, S.; Ito, M.; et al. Solid-phase partitioning and release-retention mechanisms of copper, lead, zinc and arsenic in soils impacted by artisanal and small-scale gold mining (ASGM) activities. Chemosphere 2020, 260, 127574. [Google Scholar] [CrossRef]
  33. Muller, G. Schwermetalle in den sediments des Rheins-Veran-derngen seitt. Umschan 1979, 79, 778–783. [Google Scholar]
  34. Liu, Z.; Meng, R.; Hong, Q.; Yan, Q.; Liu, Y.; Wang, H.; Chen, T. Evaluation of heavy metals pollution in surface sediments using an improved geo-accumulation index method. J. Agro-Environ. Sci. 2019, 38, 2157–2164. [Google Scholar]
  35. Kyszczarz, S.; Blonska, E.; Lasota, J. The application of the geo-accumulation index and geostatistical methods to the assessment of forest soil contamination with heavy metals in the Babia Góra National Park (Poland). Arch. Environ. Prot. 2020, 46, 69–79. [Google Scholar]
  36. Liu, L.; Li, W.; Song, W.; Guo, M. Remediation techniques for heavy metal-contaminated soils: Principles and applicability. Sci. Total Environ. 2018, 633, 206–219. [Google Scholar] [CrossRef] [PubMed]
  37. Yang, W.; Zhao, Y.; Wang, D.; Wu, H.; Lin, A.; He, L. Using principal components analysis and IDW interpolation to deter-mine spatial and temporal changes of surface water quality of Xin’anjiang River in Huangshan, China. Int. J. Environ. Res. Public Health 2020, 17, 2942. [Google Scholar] [CrossRef] [PubMed]
  38. Ma, H.H.; Yu, T.; Yang, Z.F.; Hou, Q.Y.; Zeng, Q.L.; Wang, R. Spatial interpolation methods and pollution assessment of heavy metals of soil in typical areas. Huan Jing Ke Xue Huanjing Kexue 2018, 39, 4684–4693. [Google Scholar] [PubMed]
  39. Chen, T.; Chang, Q.; Liu, J.; Clevers, J.G.P.W.; Kooistra, L. Identification of soil heavy metal sources and improvement in spatial mapping based on soil spectral information: A case study in northwest China. Sci. Total Environ. 2016, 565, 155–164. [Google Scholar] [CrossRef] [PubMed]
  40. Ma, Z.; Chen, K.; Li, Z.; Bi, J.; Huang, L. Heavy metals in soils and road dusts in the mining areas of Western Suzhou, China: A preliminary identification of contaminated sites. J. Soils Sediments 2016, 16, 204–214. [Google Scholar] [CrossRef]
  41. Salvacion, A.R. Mapping land limitations for agricultural land use planning using fuzzy logic approach: A case study for Marinduque Island, Philippines. GeoJournal 2021, 86, 915–925. [Google Scholar] [CrossRef]
  42. Miningwatch in the News. Available online: https://miningwatch.ca/news/2019/4/3/marcopper-mine-spill-and-unending-wait-justice (accessed on 15 January 2022).
  43. Surface Water Sampling Operating Procedure by US EPA. Available online: https://www.epa.gov/sites/default/files/2017-07/documents/surface_water_sampling201_af.r4.pdf (accessed on 15 January 2022).
  44. Soil Sampling Operating Procedure by US EPA. Available online: https://www.epa.gov/sites/default/files/2015-06/documents/Soil-Sampling.pdf (accessed on 15 January 2022).
  45. Nkwunonwo, U.C.; Whitworth, M.; Baily, B. A review of the current status of flood modelling for urban flood risk management in the developing countries. Sci. Afr. 2020, 7, e00269. [Google Scholar] [CrossRef]
  46. Yan, K.; Di Baldassarre, G.; Solomatine, D.P.; Schumann, G.J.P. A review of low-cost space-borne data for flood modelling: Topography, flood extent and water level. Hydrol. Process. 2015, 29, 3368–3387. [Google Scholar] [CrossRef]
  47. Monjardin, C.E.F.; Transfiguracion, K.M.; Mangunay, J.P.J.; Paguia, K.M.; Uy, F.A.A.; Tan, F.J. Determination of river water level triggering flood in Manghinao River in Bauan, Batangas, Philippines. J. Mech. Eng. 2021, 18, 181–192. [Google Scholar]
  48. Carter, J.; Schmid, K.; Waters, K.; Betzhold, L.; Hadley, B.; Mataosky, R.; Halleran, J. An Introduction to LiDAR Technology, Data, and Applications; NOAA Coastal Services Center: Charleston, SC, USA, 2012; Volume 2. [Google Scholar]
  49. Reutebuch, S.E.; McGaughey, R.J.; Andersen, H.E.; Carson, W.W. Accuracy of a high-resolution lidar terrain model under a conifer forest canopy. Can. J. Remote Sens. 2003, 29, 527–535. [Google Scholar] [CrossRef]
  50. Melquiades, F.L.; Appoloni, C. Application of XRF and field portable XRF for environmental analysis. J. Radioanal. Nucl. Chem. 2004, 262, 533–541. [Google Scholar] [CrossRef]
  51. Zhou, S.; Yuan, Z.; Cheng, Q.; Zhang, Z.; Yang, J. Rapid in situ determination of heavy metal concentrations in polluted water via portable XRF: Using Cu and Pb as example. Environ. Pollut. 2018, 243, 1325–1333. [Google Scholar] [CrossRef] [PubMed]
  52. Wu, C.M.; Tsai, H.T.; Yang, K.H.; Wen, J.C. How reliable is X-ray fluorescence (XRF) measurement for different metals in soil contamination? Environ. Forensics 2012, 13, 110–121. [Google Scholar] [CrossRef]
  53. Kim, S.M.; Choi, Y. Mapping heavy metal concentrations in Beach Sands using GIS and Portable XRF data. J. Mar. Sci. Eng. 2019, 7, 42. [Google Scholar] [CrossRef] [Green Version]
  54. Sikora, A.L.; Maguire, L.W.; Nairn, R.W.; Knox, R.C. A comparison of XRFS and ICP-OES methods for soil trace metal analyses in a mining impacted agricultural watershed. Environ. Monit. Assess. 2021, 193, 490. [Google Scholar] [CrossRef]
  55. Li, J.; Heap, A.D. Spatial interpolation methods applied in the environmental sciences: A review. Environ. Model. Softw. 2014, 53, 173–189. [Google Scholar] [CrossRef]
  56. De Jesus, K.L.M.; Senoro, D.B.; Dela Cruz, J.C.; Chan, E.B. A hybrid neural network—Particle swarm optimization informed spatial interpolation technique for groundwater quality mapping in a Small Island Province of the Philippines. Toxics 2021, 9, 273. [Google Scholar] [CrossRef]
  57. Mitas, L.; Mitasova, H. Spatial interpolation. In Geographical Information Systems: Principles, Techniques, Management and Applications; Wiley: Hoboken, NJ, USA, 1999; Volume 1. [Google Scholar]
  58. Lu, G.Y.; Wong, D.W. An adaptive inverse-distance weighting spatial interpolation technique. Comput. Geosci. 2008, 34, 1044–1055. [Google Scholar] [CrossRef]
  59. Noori, M.J.; Hassan, H.H.; Mustafa, Y.T. Spatial estimation of rainfall distribution and its classification in Duhok governorate using GIS. J. Water Resour. Prot. 2014, 6, 2. [Google Scholar] [CrossRef] [Green Version]
  60. Schober, P.; Boer, C.; Schwarte, L.A. Correlation coefficients: Appropriate use and interpretation. Anesth. Analg. 2018, 126, 1763–1768. [Google Scholar] [CrossRef]
  61. Fuhrimann, S.; Mol, H.G.; Dias, J.; Dalvie, M.A.; Roosli, M.; Degrendele, C.; Figueiredo, D.M.; Huss, A.; Portengen, L.; Vermeulen, R. Quantitative assessment of multiple pesticides in silicone wristbands of children/guardian pairs living in agricultural areas in South Africa. Sci. Total Environ. 2022, 812, 152330. [Google Scholar] [CrossRef] [PubMed]
  62. Dirk, R.A.E.S. Frequency Analysis of Rainfall Data; College on Soil Physics—30th Anniversary (1983–2013); The Abdus Salam International Centre for Theoretical Physica: Trieste, Italy, 2013; pp. 210–244. [Google Scholar]
  63. Weng, Q. An evaluation of spatial interpolation accuracy of elevation data. In Progress in Spatial Data Handling; Springer: Berlin/Heidelberg, Germany, 2006; pp. 805–824. [Google Scholar]
  64. Xu, Y.; Wang, L.; Fu, C.; Kosmyna, T. A fishnet-constrained land use mix index derived from remotely sensed data. Ann. GIS 2017, 23, 303–313. [Google Scholar] [CrossRef] [Green Version]
  65. Ramsdale, J.D.; Balme, M.R.; Conway, S.J.; Gallagher, C.; van Gasselt, S.A.; Hauber, E.; Orgel, C.; Sejourne, A.; Skinner, J.A.; Costard, F.; et al. Grid-based mapping: A method for rapidly determining the spatial distributions of small features over very large areas. Planet. Space Sci. 2017, 140, 49–61. [Google Scholar] [CrossRef] [Green Version]
  66. HECRAS Manual Infiltration Methods. Total Dissolved Solids in Drinking Water. Available online: https://www.who.int/water_sanitation_health/dwq/chemicals/tds.pdf (accessed on 20 January 2022).
  67. Bansode, A.; Patil, K.A. Estimation of runoff by using SCS curve number method and arc GIS. Int. J. Sci. Eng. Res. 2014, 5, 1283–1287. [Google Scholar]
  68. Arao, T.; Ishikawa, S.; Murakami, M.; Abe, K.; Maejima, Y.; Makino, T. Heavy metal contamination of agricultural soil and countermeasures in Japan. Paddy Water Environ. 2010, 8, 247–257. [Google Scholar] [CrossRef]
  69. Howe, P.; Malcolm, H.; Dobson, S. Manganese and Its Compounds: Environmental Aspects; World Health Organization: London, UK, 2004. [Google Scholar]
  70. Li, J.; Jia, Y.; Dong, R.; Huang, R.; Liu, P.; Li, X.; Wang, Z.; Liu, G.; Chen, Z. Advances in the mechanisms of plant tolerance to manganese toxicity. Int. J. Mol. Sci. 2019, 20, 5096. [Google Scholar] [CrossRef] [PubMed] [Green Version]
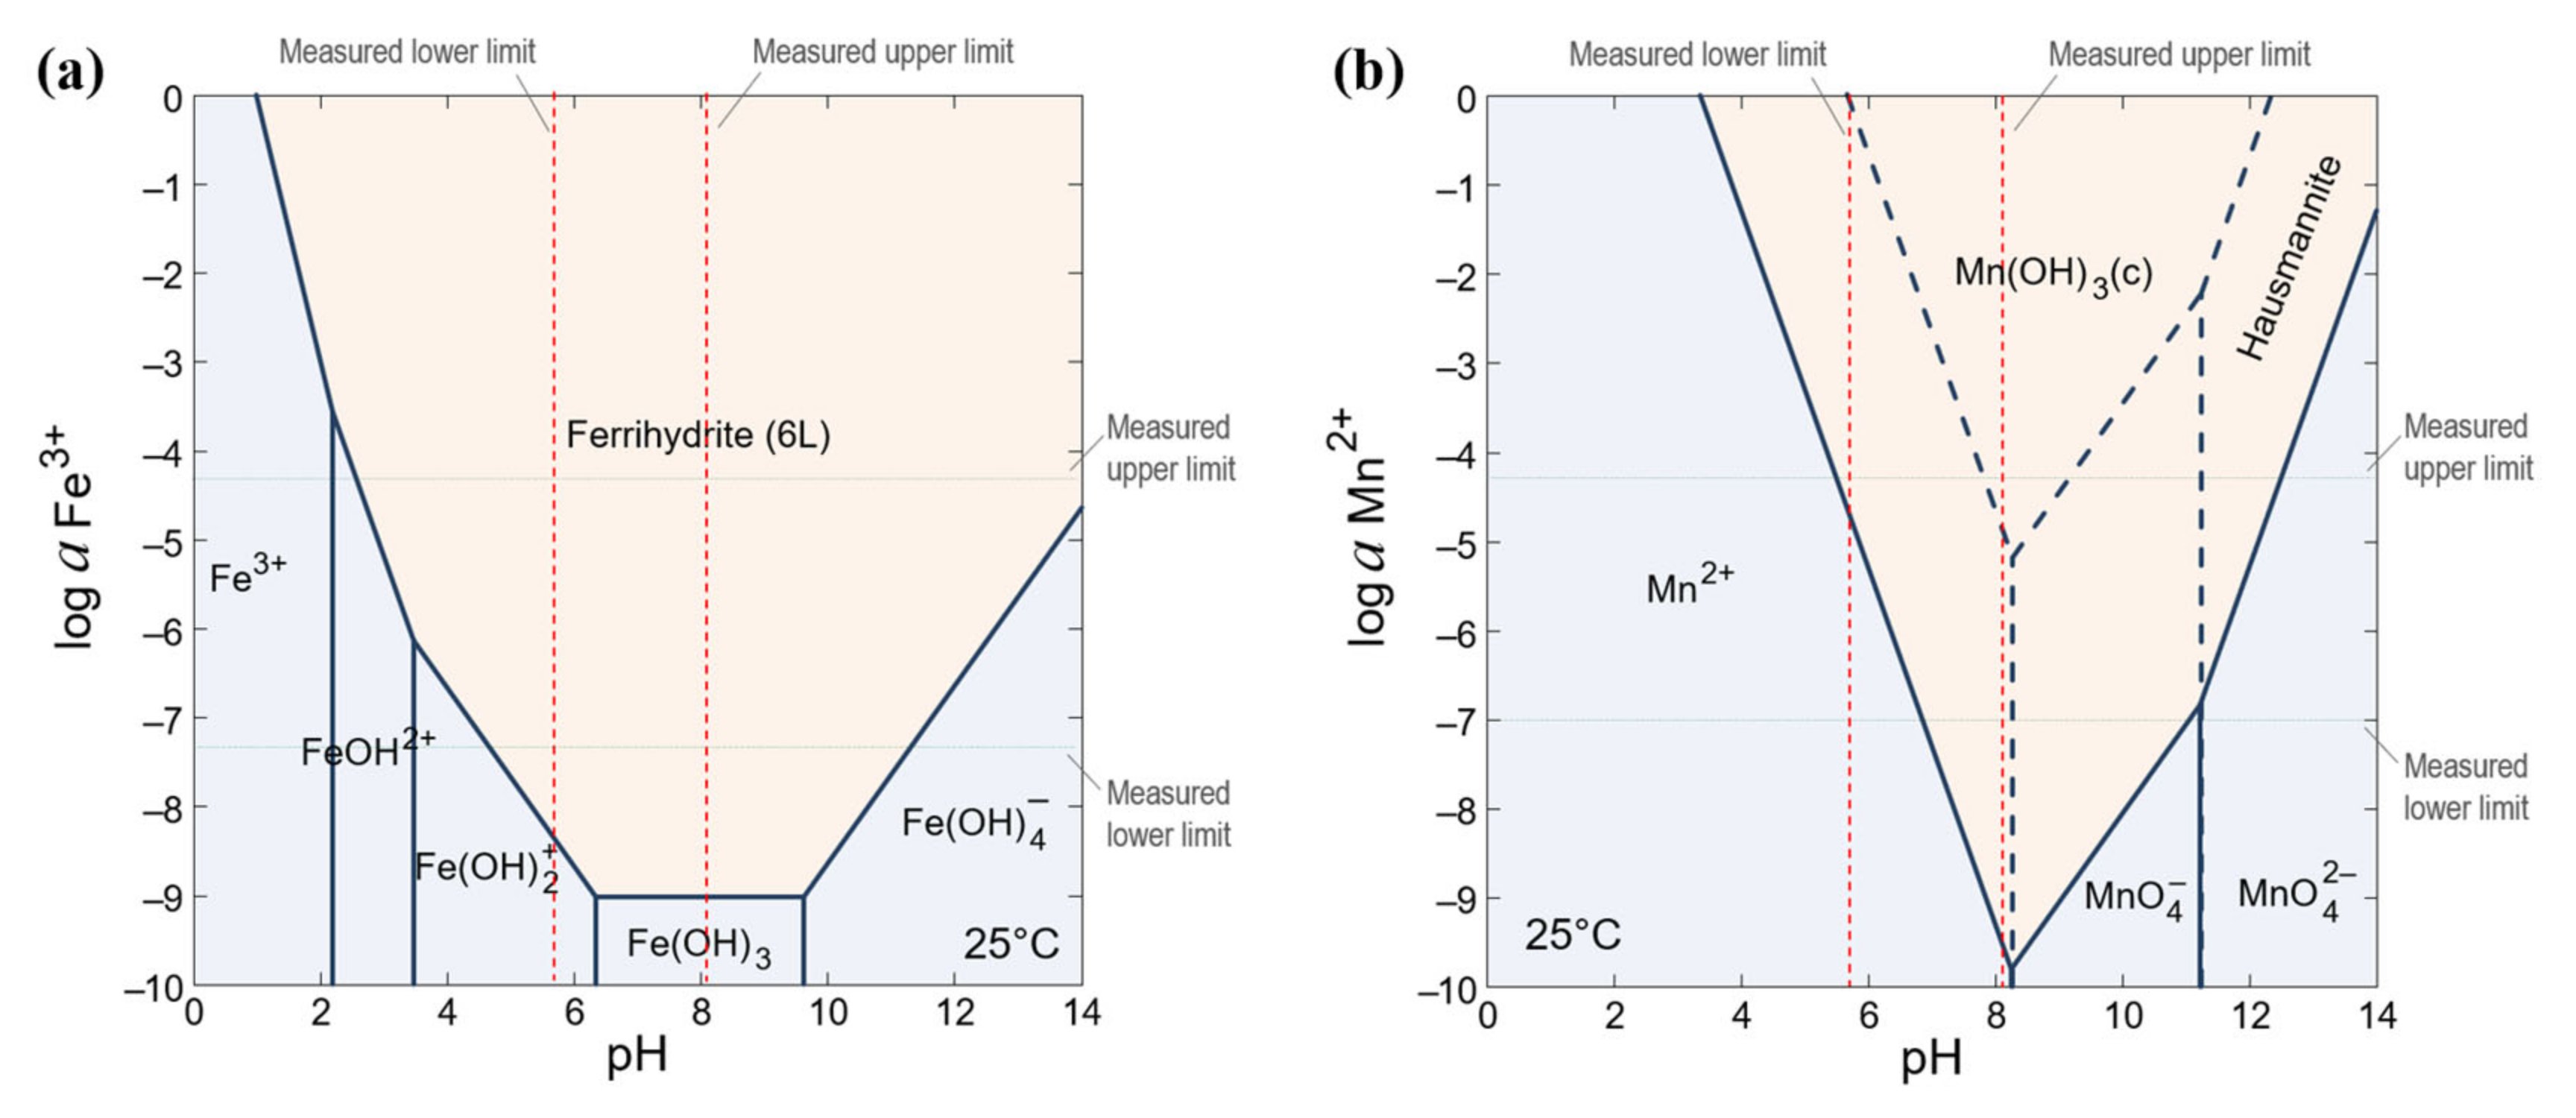
  71. Lan, S.; Wang, X.; Xiang, Q.; Yin, H.; Tan, W.; Qiu, G.; Liu, F.; Zhang, J.; Feng, X. Mechanisms of Mn (II) catalytic oxidation on ferrihydrite surfaces and the formation of manganese (oxyhydr) oxides. Geochim. Cosmochim. Acta 2017, 211, 79–96. [Google Scholar] [CrossRef]
Figure 1. Typhoon Occurrences in Marinduque Province (a) Typhoon Tracks and (b) Number of typhoons that visited the island per month from 1948 to 2017.
Applsci 12 03527 g001
Figure 2. A map of the Philippines and Marinduque superimposed with surface water and floodplain soil sampling locations and location of Boac (red) and Mogpog (blue) rivers.
Applsci 12 03527 g002
Figure 3. Research Diagram.
Applsci 12 03527 g003
Figure 4. The flood hazard map of Boac and Mogpog rivers using LiDAR DEM.
Applsci 12 03527 g004
Figure 5. Spatial Grid map of the floodplains of Boac and Mogpog rivers.
Applsci 12 03527 g005
Figure 6. Spatial Grid map of (a) pH SW, (b) EC SW, (c) TDS SW, (d) Temperature SW, (e) Curve Number, (f) Flood hazard map, (g) Mn concentration in SW and (h) Mn content of soils with a 500 m grid size.
Applsci 12 03527 g006aApplsci 12 03527 g006b
Figure 7. Boac and Mogpog geo-accumulation index map of manganese.
Applsci 12 03527 g007
Figure 8. (a) Log activity–pH diagram of Fe-H2O System created using the Geochemist’s Workbench® in equilibrium with atmospheric O2 (Fugacity = 0.2), and (b) Log activity–pH diagram of Mn-H2O system created using the Geochemist’s Workbench® in equilibrium with atmospheric O2 (Fugacity = 0.2). The dotted and dashed lines represent the maximum and minimum values measured for Mn concentrations and pH in surface water on-site, respectively.
Applsci 12 03527 g008
Table 1. Physicochemical properties of surface water.
ParameterMaxMinMeanSDPNSDW 2017
Guideline
Value
WHO Guidelines
Temperature34.527.431.20.972n/an/a
pH8.055.707.200.3646.5–8.56.5–9.2
EC (μS/cm)2430424763187.780n/a1500
TDS (mg/L)1360216390112.5266001200
Table 2. Correlation analysis of EC, TDS, pH, and Temp. of SW, Mn in SW, CN, flood height with Mn content of soils.
ECTDSpHTemp.Mn SWCNFHMn Soil
EC10.983 **−0.524 **0.206 **0.258 **0.199 **−0.216 **0.196 **
TDS 1−0.471 **0.223 **0.231 **0.191 **−0.186 **0.186 **
pH 1−0.107 **−0.704 **−0.278 **0.195 **−0.438 **
Temp. 1−0.0730.319 **−0.148 **−0.300 **
Mn SW 10.153 **−0.155 **0.381 **
CN 1−0.213 **0.142 **
FH 10.458 **
Mn Soil 1
** Correlation is significant at the 0.01 level (2-tailed). “FH” means flood height.
Publisher’s Note: MDPI stays neutral with regard to jurisdictional claims in published maps and institutional affiliations.

