Article

Strength, Flexibility and Postural Control of the Trunk and Lower Body in Participants with and without Patellofemoral Pain

1
Department of Physical Therapy, Faculty of Health Sciences, University of Primorska, Polje 42, 6310 Izola, Slovenia
2
Clinical Institute of Occupational, Traffic and Sports Medicine, University Medical Centre Ljubljana, Zaloška Cesta 7, 1000 Ljubljana, Slovenia
3
Department of Kinesiology, Faculty of Sport, University of Ljubljana, Gortanova Ulica 22, 1000 Ljubljana, Slovenia
4
Laboratory for Motor Control and Motor Behavior, Science to Practice, Ltd., S2P, Tehnološki Park 19, 1000 Ljubljana, Slovenia
*
Author to whom correspondence should be addressed.
Appl. Sci. 2022, 12(7), 3238; https://doi.org/10.3390/app12073238
Submission received: 24 January 2022 / Revised: 9 March 2022 / Accepted: 21 March 2022 / Published: 22 March 2022
(This article belongs to the Special Issue Musculoskeletal Rehabilitation and Clinical Biomechanics)

Abstract

:
Patellofemoral pain (PFP) is a frequent knee condition. The aim of this study was to investigate strength, flexibility and postural control in people with and without PFP. Fifty-five participants between 14 and 54 years of age (PFP = 18, control group = 37) were included. Strength and flexibility for all trunk, hip, knee and ankle muscle groups were measured along with postural control outcomes. Analyses were conducted based on the “affected” and “non-affected” leg within-group and between-groups. Between-groups analysis demonstrated a statistically lower strength of trunk muscles (range: 35.8–29.3%, p < 0.001), knee extensors (20.8%, p = 0.005) and knee flexors (17.4%, p = 0.020) in PFP participants. Within-group analysis proved an 8.7% (p = 0.018) greater hip internal rotation strength and ankle extension flexibility (p = 0.032) of the “affected side” in PFP participants. This was, to our knowledge, the first study to investigate the strength of all trunk muscle groups. The results indicate that participants with PFP exhibit impaired strength of trunk muscle groups, along with knee muscle deficits, which may present a rehabilitation target. Clinicians should consider implementing trunk strengthening exercises into PFP programs along with knee-targeting exercise programs.

1. Introduction

Patellofemoral pain (PFP) is one of the most common knee conditions clinicians encounter in their practices. It is estimated that 22.7% of the general population is affected by PFP at some point, while the prevalence in adolescents is slightly higher at 28.9% [1]. PFP is defined as pain around (peripatellar) or behind the kneecap (retropatellar) that is aggravated by activities loading the knee joint, such as running, squatting, climbing stairs or even prolonged sitting with knee flexion above 90° [2]. A variety of factors including biomechanical, psychological and behavioral have been linked to PFP [3]. However, there is still a lack of consensus regarding a clear pathophysiology behind PFP. It has been widely accepted that patellar maltracking reduces the articular contact area and increases the stress on the patellofemoral joint (PFJ) [4,5]. Nonetheless, the primary factor leading to this maltracking is not yet clearly understood.
Increasing emphasis is being placed upon the influence of trunk and hip muscle strength and function, alongside local influences regarding the muscles surrounding the knee [6,7]. However, despite the large number of studies investigating prevalent characteristics of PFP patients [7,8,9], there is conflicting evidence regarding trunk muscles strength. Trunk stability has been shown to play an important role in the mechanisms of lower extremity injuries in athletes [10]. Furthermore, some authors suggest that PFP patients demonstrate impaired neuromuscular trunk control [11]. Powers [12] suggested that abnormal trunk movements during functional tasks may influence moments at the knee due to impaired pelvic stability. Trunk stability is therefore an important component of the generation, transmission and control of knee movements as it affects lower limb alignment. However, few studies have been conducted on trunk muscles strength in PFP and the results remain inconclusive. Cowan et al. [13] reported that trunk lateral flexion strength was significantly (−29%) lower in PFP patients. However, these investigators did not examine trunk flexion or extension strength. In contrast, a more recent study concluded that there was no significant difference in trunk lateral flexion strength between participants with and without PFP [14]. To our knowledge, most studies investigating trunk muscle strength have focused upon lateral flexion, whereas no study to date has determined trunk extension and flexion strength in participants with PFP.
Powers et al. [15] suggested that altered foot and ankle strength, structure and/or mobility may contribute to PFP. Distal factors such as excessive calcaneal eversion [16] and increased navicular drop during standing [17] are arising as potential risk factors in the development of PFP. Although PFP patients have been shown to have a more pronated foot posture compared to participants without PFP [18], strength measurements show no difference in isometric ankle dorsiflexion between women with and without PFP [19]. Although there is a growing body of evidence on the importance of gender differences in PFP [20], to the best of our knowledge no study has yet examined ankle muscles strength in males with PFP. Therefore, there is insufficient evidence to conclude with certainty whether ankle muscle strength differs significantly between participants with and without PFP or whether it affects lower leg flexibility. However, electromyographic analyses of the lower limb muscles suggest that women with PFP exhibit greater activity of the biceps femoris and vastus lateralis muscles during the pre-activation and stance phase of the single leg triple hop test [21]. Finally, knee extension strength has been shown to be impaired compared to participants without PFP, but only among adults with PFP [22]. Rathleff et al. [23] highlight the heterogeneity of PFP, suggesting that knee extension strength differs by 0.3% between adolescents with and without PFP and is not a significant characteristic of PFP in adolescents. Additionally, although recent evidence suggests that leg dominance may be associated with anterior cruciate ligament injury [24], the correlation between the affected and the dominant leg in patients with a chronic condition such as PFP remains unknown. Thus, there are still significant gaps in the literature regarding trunk and lower extremity muscle strength, flexibility and postural control in heterogeneous groups of PFP patients. Identifying and filling these knowledge gaps can play an important role in the management of PFP, as it may help in the development and implementation of effective rehabilitation programs into clinical practice.
The aim of this controlled case-control laboratory study was to assess trunk and lower body muscle strength and flexibility as well as postural control in participants with uni- or bi-lateral PFP compared to a well-matched group of participants without PFP. The secondary aim of our study was to explore correlations between the leg dominance and muscle strength, flexibility and postural control impairments in participants with PFP. We hypothesized that participants with PFP would exhibit reduced muscle strength outcomes compared to both participants without PFP and their own non-affected side. Our goal was to support the current evidence-based understanding of PFP and to identify significant muscle strength and flexibility deficits in participants with PFP that, if overlooked, may potentially delay treatment results.

2. Materials and Methods

2.1. Participants

We included 18 participants with PFP (13 females and 5 males, mean age: 24.6 ± 12.5 years, mean body height: 171.1 ± 10.1 cm, mean body mass: 67.3 ± 17.2 kg) and 37 participants without PFP (26 females and 11 males; mean age: 21.6 ± 8.8 years, mean body height: 170.6 ± 8.9 cm, mean body mass: 64.1 ± 12.4 kg), who served as the control group (CG) (Table 1). Sample size calculations were performed using the G Power software package (version 3.1.9.2) and based on trunk lateral flexion strength as the primary outcome. We calculated the required minimal number of participants in the study (n = 46) to reach statistical power, β = 0.80 and α = 0.05 [14]. Participants in the CG were matched based on their gender, age, activity level, body mass and body height. Participants with PFP were recruited by a licensed sports medicine physician according to two specific inclusion criteria. These criteria included (i) pain ≥ 3 on the Visual Analogue Scale (VAS) during at least two of the following activities: stair climbing/descending, squats, running, jumping, prolonged sitting and isometric quadriceps contraction; (ii) positive patellar tilt or compression test and (iii) duration of PFP ≥ 3 months prior to the inclusion in the study [25]. Participants with unilateral and bilateral symptoms were included in the study, with the worst side determined as “affected”. All subsequent analyses were performed separately for participants with unilateral or bilateral PFP. In the recruited participants with PFP who met the inclusion criteria and volunteered to take part in the study, the following clinical tests parameters have been observed and reported based on the unilateral or bilateral presentation of PFP (Table 2): patellar tilt or compression, excessive femoral internal rotation [26]; lateral patellar tilt; patellar hypo- or hyper-mobility; contralateral pelvic drop (>3°) and knee valgus during the single leg-squat [27]; navicular drop test or poor foot flexibility [28,29] and high-riding patella (Insall–Salvati index > 1.2) [30]. Participants were excluded from the study if they showed symptoms or signs of any of the following conditions: patellar tendinopathy; pre/infrapatellar bursitis; a history of previous surgery on the hip or knee; meniscal or intra-articular injury; involvement of the crucial or collateral ligaments; sign of patellar apprehension and Osgood–Schlatter or Sinding–Larsen-Johansson syndromes [27,31]. Participants in the CG were recruited through regional sports clubs and were excluded from the study if they presented any current of previous injury of the lower extremity for at least one year prior to participating in the study. All participants gave written informed consent prior to participation. For underaged participants, informed consent was provided by the parents. The study protocol was conducted in accordance with the Declaration of Helsinki and approved by the Slovenian National Medical Ethics Committee (0120-99/2018/5).

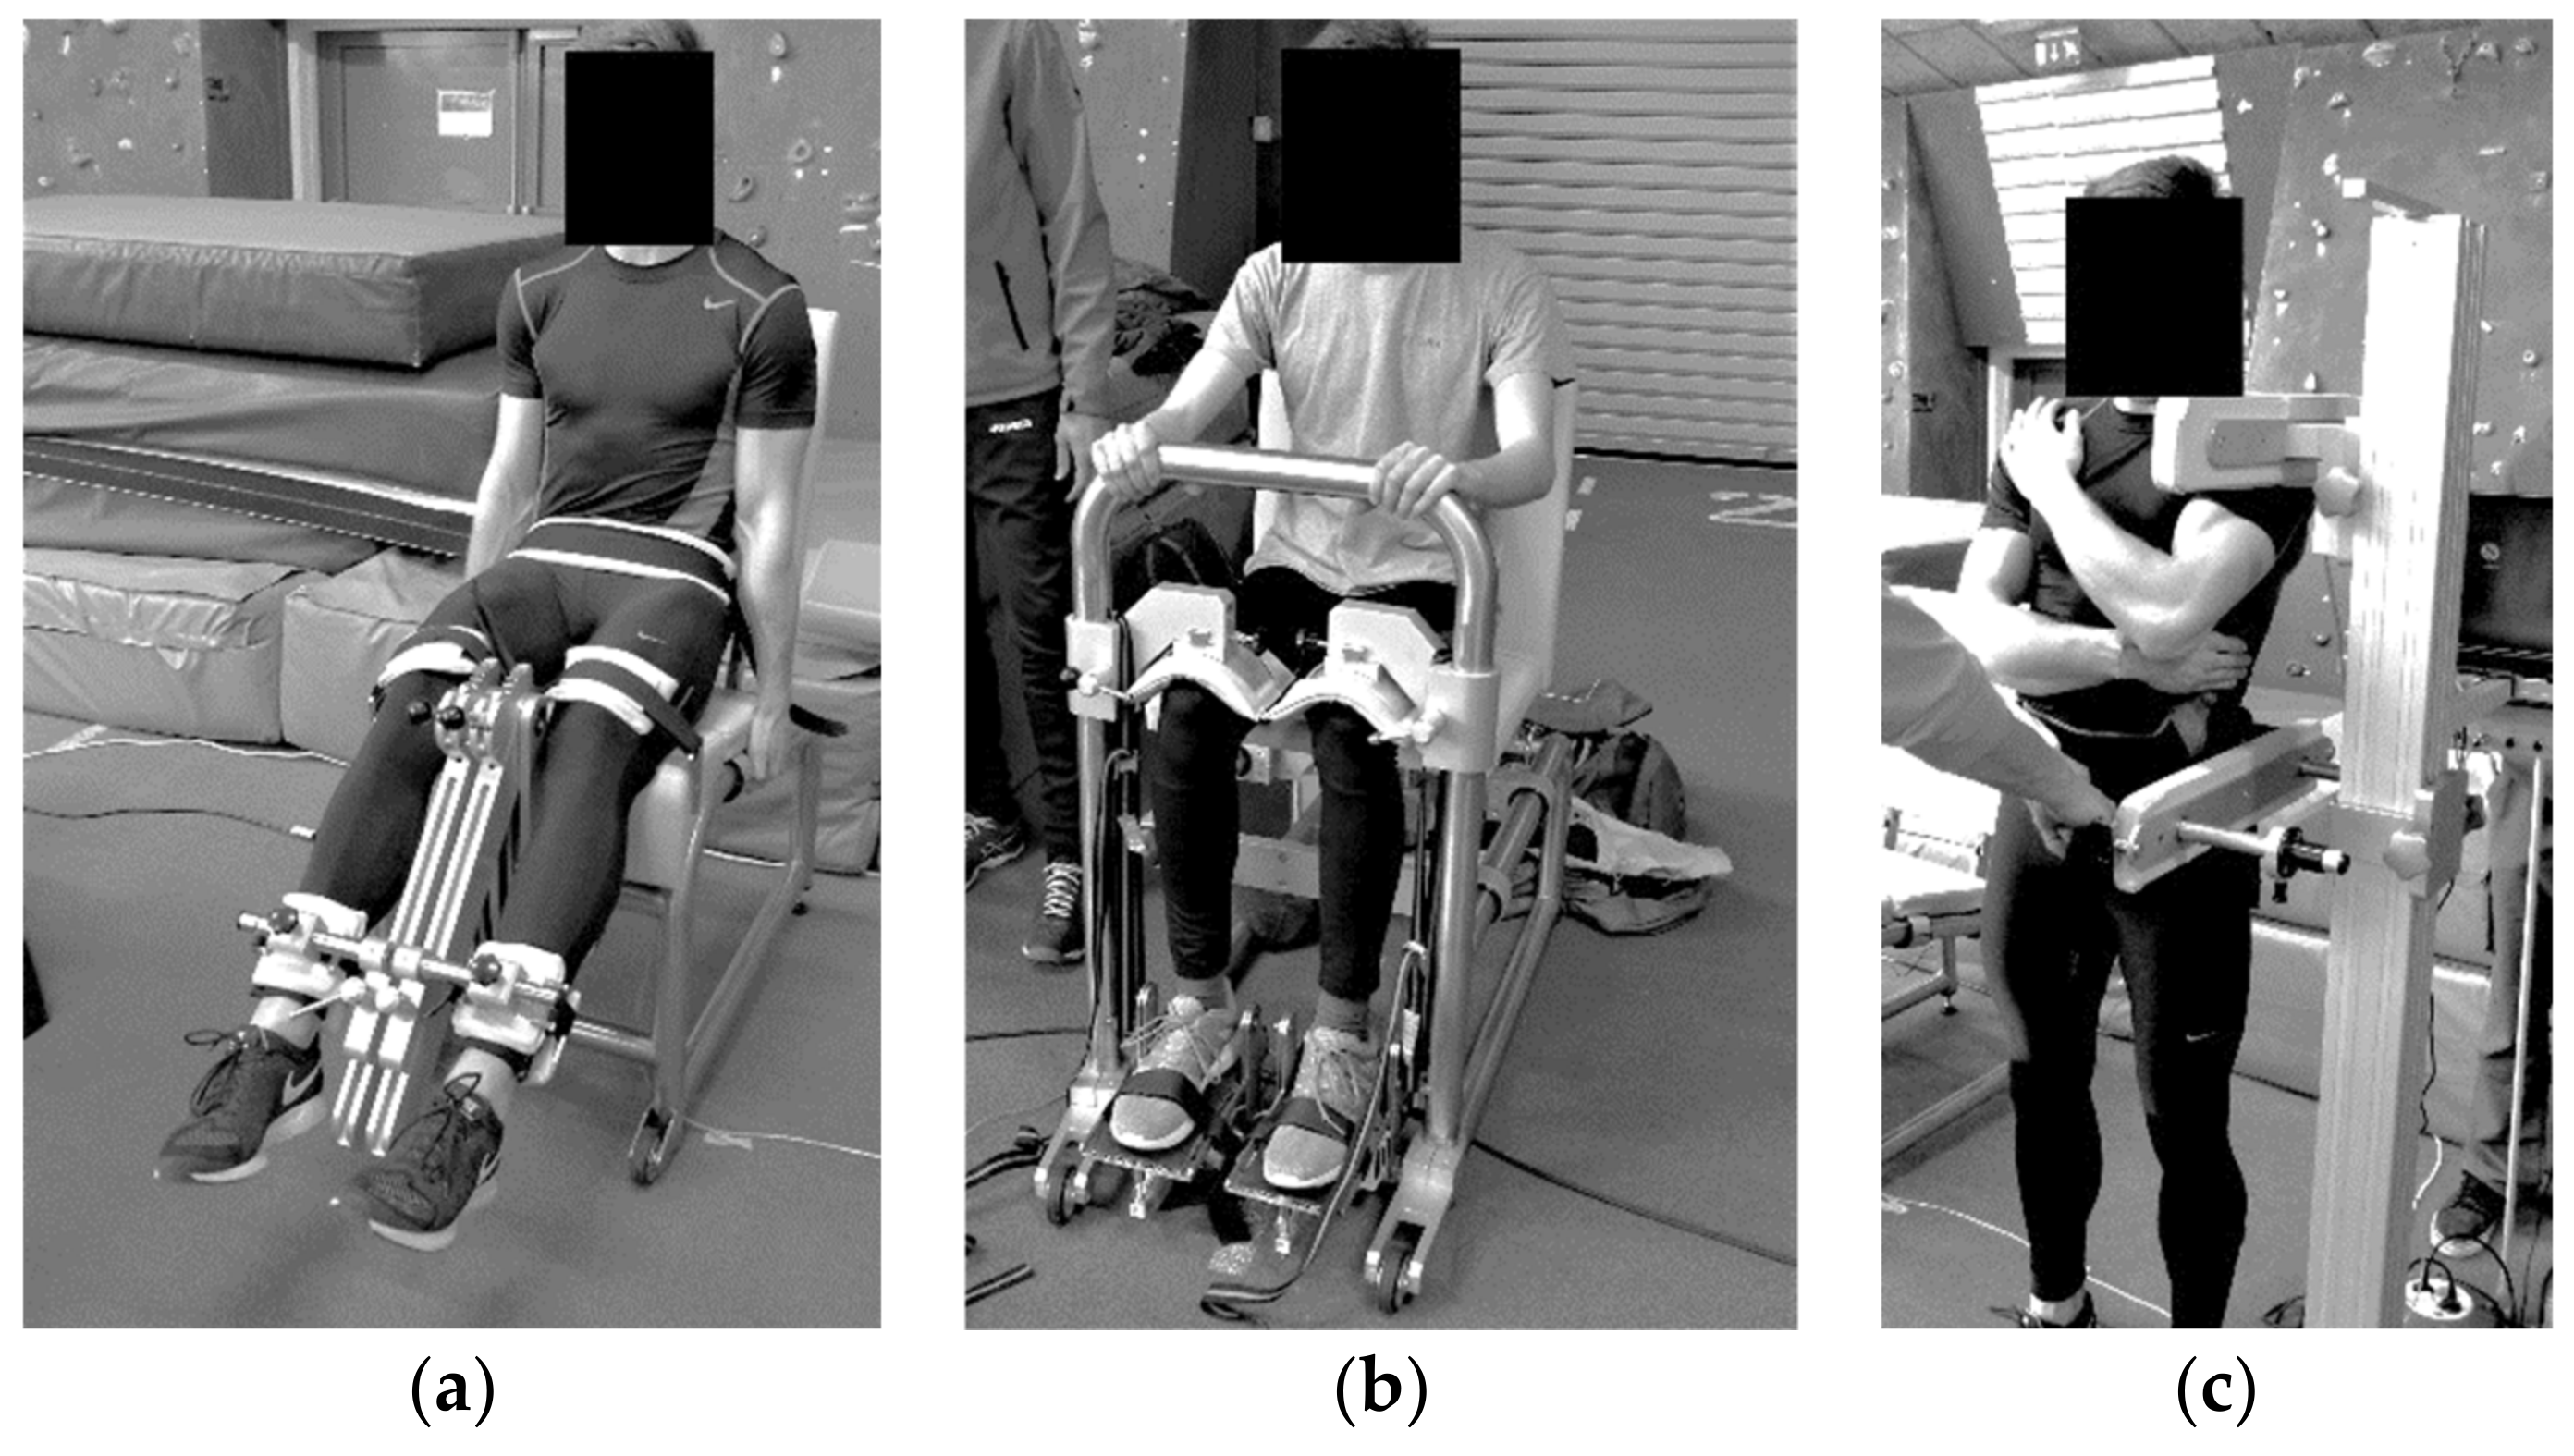
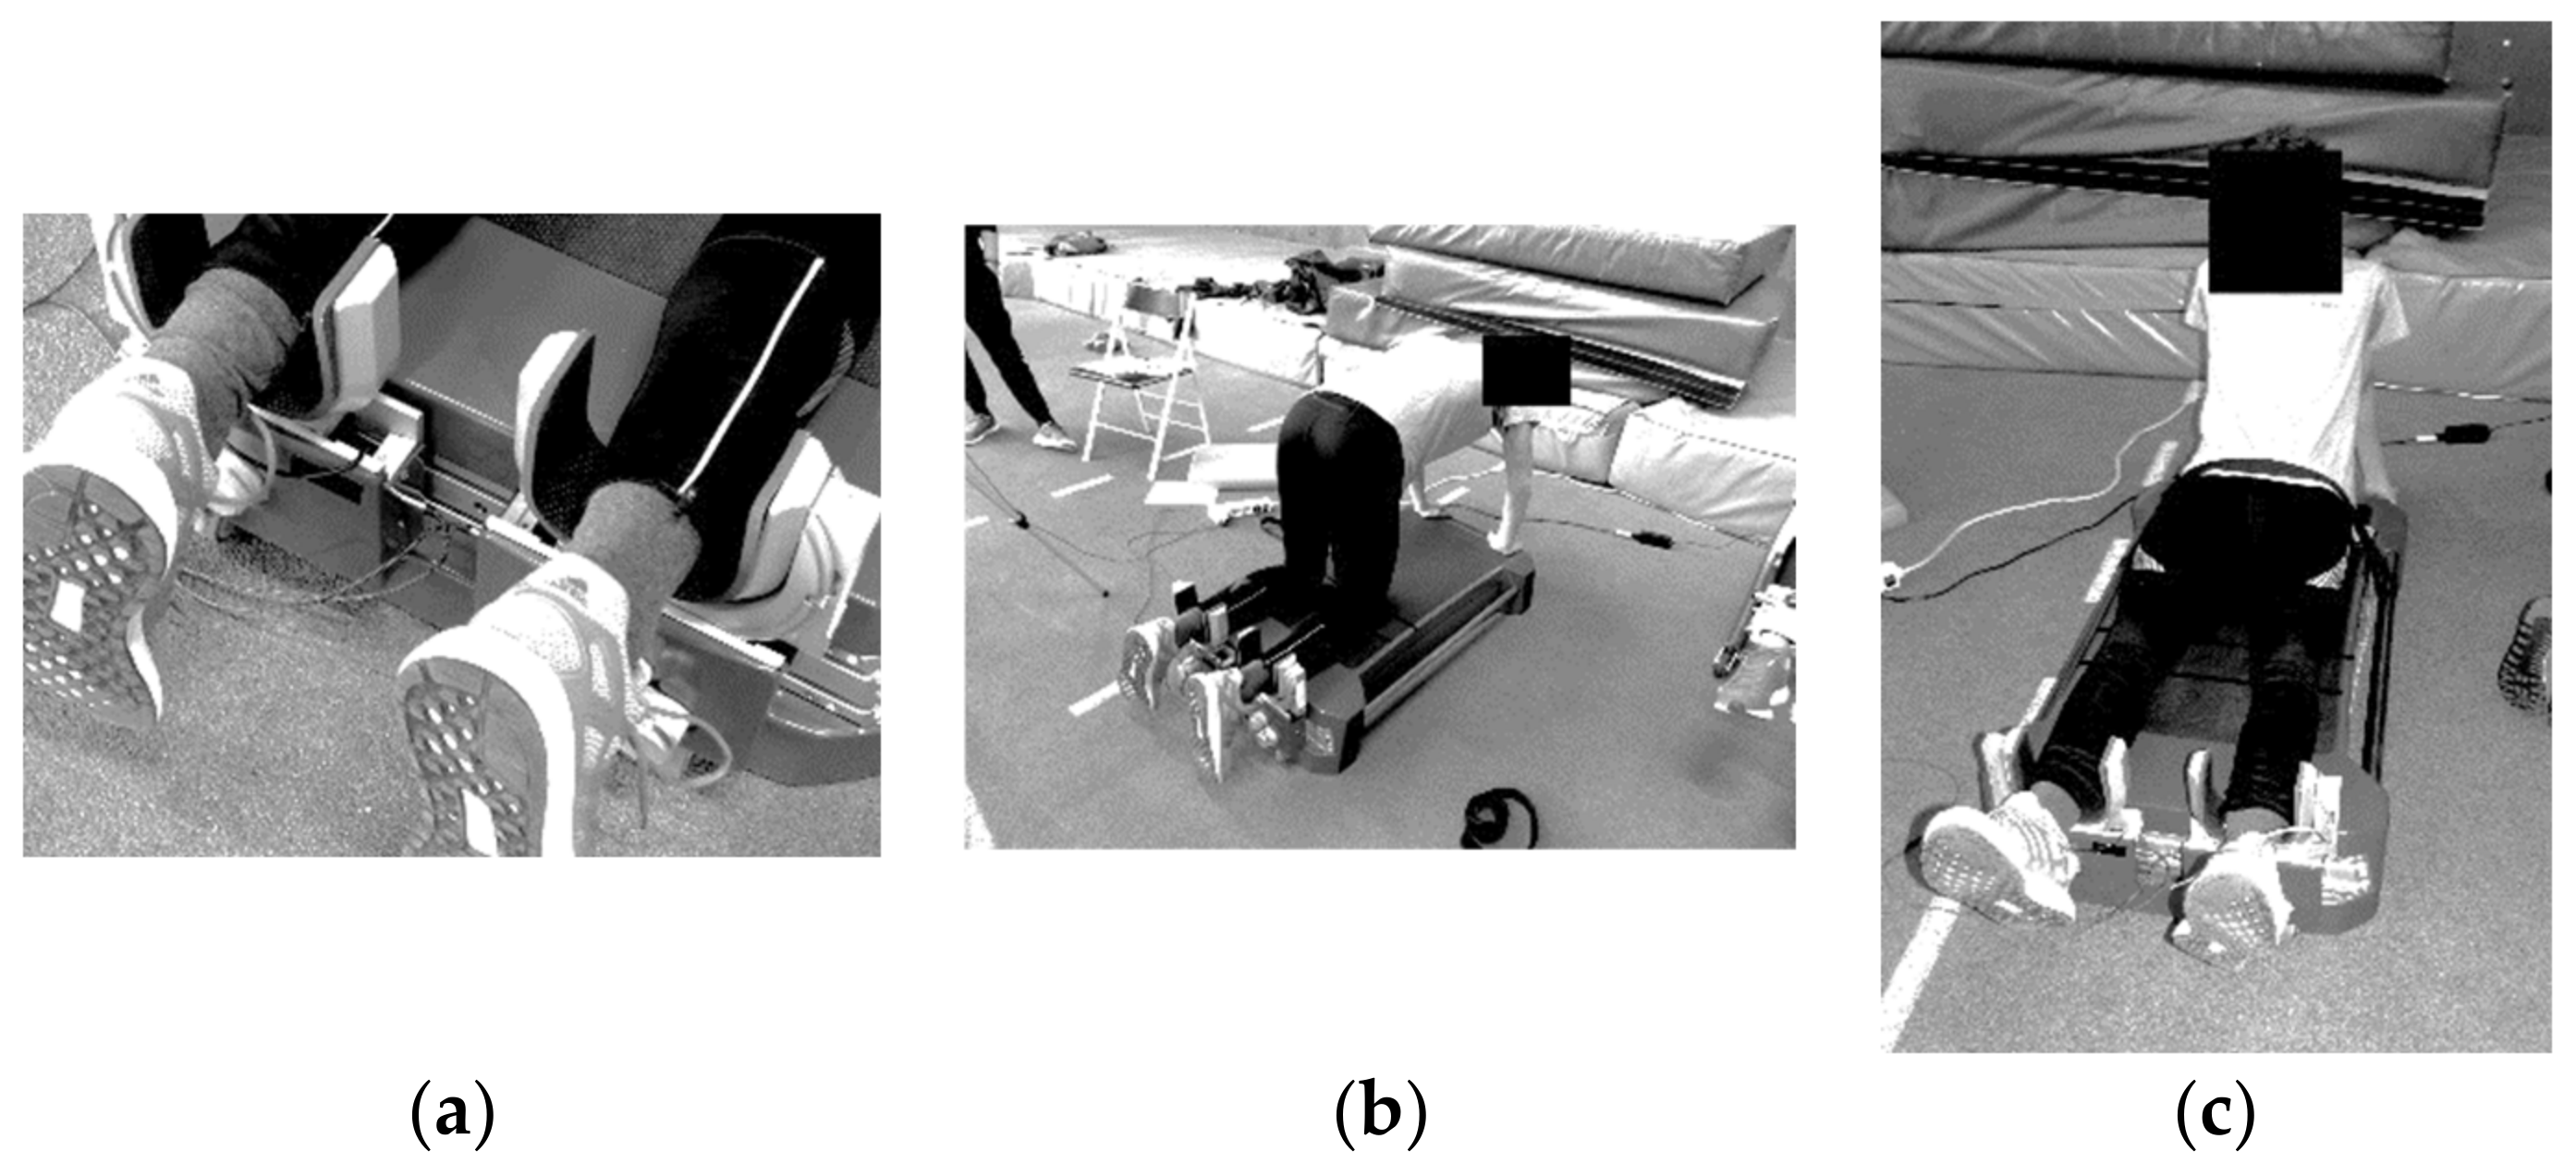
2.2. Study Design, Tasks and Measurement Procedure

Strength and flexibility for all trunk, hip, knee and ankle muscle groups, along with postural control outcomes, were measured in a random order. This protocol was used, as recent studies report that body sway did not increase after a whole-body fatigue protocol [32]. Trunk, hip, knee and ankle muscle strength were evaluated by performing maximal voluntary contractions (MVC) using specific custom-made dynamometers (S2P Ltd., Science to practice, Ljubljana, Slovenia) [33]. As previously reported, the dynamometer proved to be both a reliable and valid (ICC ≥ 0.95) muscle strength assessment tool [34,35]. For trunk muscle strength assessments, participants were positioned standing hip-wide on the dynamometers’ anti-slip platform. Participants were positioned facing the dynamometers’ sensor for trunk flexion muscle strength assessment, while they turned their back to the sensor when assessing the trunk extension muscle strength. The lower support was positioned below the iliac crist, and the upper support was at shoulder height. Both supports were individually adjusted to the participants’ heights. The lever-arm length was expressed as the distance between the lower and upper support. To avoid compensating mechanisms, participants’ pelvises were stabilized with a fixating strap, and they were asked to stand with feet flat on the platform (Figure 1).
Hip muscle assessment was performed with participants positioned supine (abduction, adduction and flexion) or prone (extension, internal and external rotation) on the dynamometer’s platform (Figure 2).
These positions were chosen based upon previous hip muscle strength assessments as well as to minimize the changes in participants position [36]. Knee and ankle (Figure 1) muscle strengths were assessed sitting with adjacent segments fixated. Participants were allowed to hold on to the dynamometer’s handle provided for that purpose. For all strength measures, participants were provided a demonstration and a test trial. They were instructed to “push as hard as possible” against the dynamometer while being constantly provided by strong verbal encouragement. Each repetition was hold for approximately 5 s before allowing participants a 30-second break before the next MVC. The best of three consecutive repetitions was considered for further analysis [7]. Additionally, the Nordic hamstring exercise was performed as it requires trunk muscle activation and elicits a high activation of the hamstrings [37].
Passive trunk, hip, knee and ankle ranges of motion (RoM) were measured by the same three investigators, one performing the movement, the other reading the measurements and the third noting the results. Participants were positioned supine while prominent anatomical landmarks of the lower extremities were marked. Measurements were provided using a digital inclinometer providing measurements of 0.01° accuracy/interval (Baseline Digital Inclinometer, Fabrication Enterprises, Inc., White Plains, NY, USA) [38,39] and a standard 31.7 cm long and 4.5 cm wide goniometer made of clear plastic with 1° increments and 360° scale. The participants’ pelvises were stabilized during all hip measurements to prevent pelvic rotation. Hip flexion and ankle plantar flexion were tested with both knees extended and knees flexed. All ankle measurements were performed with the axis of movement on the lateral malleolus, with one arm of the goniometer following the base of the thumb and the other arm aligned with the shin [40]. No warm-up or test trials were performed prior to assessment. One repetition of each movement was performed based on previous recommendations suggesting that one RoM measurement was as reliable as the mean of repeated measurements [41].
Body sway and symmetry were evaluated on bilateral force platforms (9260AA, Kistler, Winterthur, Switzerland). Participants were assessed barefoot with hands positioned on their hips. After adopting a comfortable position, they were asked to remain quiet during the 30-s single-leg stance with eyes open. Assessment was performed on both legs with center of pressure parameters such as velocity, amplitude and direction defined as main outcome measures. Standing symmetry was expressed in percentage (%) and evaluated with hand on their hips in standing, semi-squat and full squat positions, respectively. Symmetry indexes were determined based on the <10% inter-limb symmetry threshold [42].
Data for MVC, RoM and stability measures were collected into pre-prepared spreadsheets and transcribed into MS Excel Software (Version 2019, Microsoft, Redmond, Washington, DC, USA). Muscle strength data were sampled at 1000 Hz and low-pass filtered with a Butterworth filter (20 Hz cut-off frequency, 2nd order). Maximal torque was determined as the maximum value reached during the 1-s interval of each repetition. All strength measures were normalized to the participants’ body masses and expressed in Nm/kg. For each outcome measure, the data were adjusted with respect to the “affected” and the “non-affected” leg in the PFP group and in “affected matched” and “non-affected matched” in the CG. In the case of bilateral symptoms, the worse leg was labeled as “affected” and used for further analysis. Similarly, the data were adapted with respect to the “dominant” and “non-dominant” leg based on the participant’s personal judgement. The dominant leg was defined as the “leg you would use to kick a ball”.

2.3. Statistical Analysis

All statistical analyses were conducted in SPSS (version 26.0, SPSS Inc., Chicago, IL, USA). Data are presented as means ± standard deviations. The normality of the data distribution was tested with the Shapiro–Wilk test. The differences between groups were analyzed using the two-tailed independent sample t-test where data were normally distributed and the Mann–Whitney U test where data were non-normally distributed. Correlations between the outcome measures of the affected leg and the dominant leg data were assessed based on the PFP group and on both groups with the Pearson’s correlation coefficient (0.0–0.1 (no association), 0.1–0.4 (weak), 0.4–0.6 (moderate), 0.6–0.8 (strong) and >0.8 (very strong)) [43]. Correlations between pain levels and strength, flexibility and stability outcome measures were calculated with Spearman’s correlation coefficient. The level of significance for all analysis was set to p < 0.05, and the effect sizes were calculated as Cohen’s d (0.0–0.2—trivial; 0.2–0.6—moderate; 0.6–1.2—large; >1.2 very large) [44]. Statistical significance was set at p < 0.05.

3. Results

Unilateral PFP was reported by 12 participants (7 females and 5 males), while 6 participants (6 females) reported bilateral PFP. Positive patellar tilt or compression test was the most prevalent clinical presentation in both participants with unilateral (nine participants) and bilateral (six participants) PFP, followed by excessive femoral internal rotation observed in three participants with unilateral and two participants with bilateral PFP (Table 2).

3.1. Within-Group Differences

When comparing the “affected” and the “non-affected” leg in participants with unilateral PFP, the “affected” leg showed 12.1% greater hip internal rotation (p = 0.041) and 27.1% greater ankle flexion strength (p = 0.022) compared to the “non-affected” leg. All other outcomes showed no statistically significant difference in the within-group of participants with unilateral PFP (p > 0.05) (Table 3). No significant within-group or between-groups differences were found regarding the symmetry outcomes either in participants with unilateral or participants with bilateral PFP.

3.2. Between-Groups Differences

Statistically significant differences were shown between groups in terms of muscle strength and flexibility considering the “affected”. The CG exhibited 18.2% superior muscle strength in terms of knee extension compared to participants with unilateral (p = 0.048) and bilateral (p = 0.27) PFP. Additionally, the CG exhibited lower ankle flexion strength (p < 0.001), greater trunk lateral flexion strength (p = 0.003, p = 0.004) and greater trunk extension strength (p = 0.002) compared both to participants with uni- and bi-lateral PFP. The CG exhibited greater hip abduction strength (p = 0.008) and knee flexion strength (p = 0.042) compared to participants with unilateral PFP as well as lower trunk flexion strength compared to participants with bilateral PFP (p < 0.001) (Table 4). In terms of flexibility, the CG showed greater ankle extension compared to participants with unilateral PFP (p = 0.050). No other difference between-groups regarding any of the outcome measures was noted (Table 5).

3.3. Correlations

Ten participants in the PFP group exhibited PFP on their dominant leg (55.5%). The majority (72.2%) of PFP participants defined their right leg as their dominant, while only 40.5% of participants in the CG presented the same preference. Considering participants with unilateral PFP, the correlation coefficients between the dominant leg and all the outcome measures on the affected leg were strong for hip extension (r = 0.611; p = 0.021) and moderate for hip adduction strength (r = 0.503; p = 0.005), while for other outcome measures the correlations were trivial (r = 0.034–0.087; p = 0.582–0.875) to weak (r = 0.112–0.392: p = 0.756–0.130). Considering participants with bilateral PFP, the correlation coefficients between the dominant leg and the outcome measures were trivial to weak (r = 0.021–0.259; p = 0.078–0.124). The correlation between pain levels and strength, flexibility and stability outcome measures in participants with unilateral PFP seemed to be significant for hip internal rotation (r = −0.591; p = 0.031) and hip extension strength (r = −0.502; p = 0.042). Correlations between pain duration and outcome measures showed a significant correlation in terms of knee extension strength (r = −0.598, p = 0.009). All correlation coefficients based on participants with bilateral PFP regarding the dominant leg and the outcome measures were trivial (r = 0.010–0.091; p = 0.326–0.824) or weak (r = 0.127–0.392; p = 0.066–0.079).

4. Discussion

The aims of the present study were (a) to investigate the trunk and lower body muscle strength, flexibility and postural control between participants with and without PFP, (b) to investigate the differences between the “affected” and “non-affected” leg in the PFP group and (c) to investigate possible correlations between the occurrence of PFP and leg dominance. Our first conclusion is that all trunk muscle strength outcomes are significantly impaired both in participants with uni- and bi-lateral PFP compared to participants without PFP. Our results are in concordance with previous studies reporting that participants with PFP exhibit 24–29% lower trunk lateral flexion strength compared to participants without PFP [13,45]. However, both of these studies included participants with bilateral symptoms and therefore lacked further analysis on the “affected” and the “non-affected” leg compared with the matched side in the CG. Our study classifies participants with PFP based on their (more) affected leg and therefore provides a deeper insight into side-specific impairments.
Our study demonstrated that only participants with unilateral PFP exhibit excessive contralateral pelvic drop, which may be linked to impaired trunk lateral flexion strength of the affected side in participants with PFP [7]. Accordingly, we demonstrated that participants with unilateral PFP exhibit lower trunk extension alongside impaired trunk lateral flexors compared to participants without PFP. However, it should be noted that PFP may affect the amount of the participants’ physical activity and sports participation. Thus, our findings suggest that people with PFP may be more vulnerable to great external forces in the sagittal plane during functional activities. Increased posterior trunk lean during sports and functional activities could increase the knee flexion moment and forces on the knee extensors, leading to increased PFJ stress [12]. Similarly, the results of our study indicate lower trunk flexion strength between participants with bilateral PFP and participants without PFP. However, it should be noted that bilateral PFP was reported solely by females with PFP. To our knowledge, this was the first study to investigate trunk flexion strength in participants with uni- or bi-lateral PFP. We found that participants with bilateral PFP exhibit significant trunk flexion strength impairments compared to participants without PFP. Previous studies report impaired trunk flexion with rotation strength [7] and kinematic changes in terms of increased trunk flexion during stair descent in participants with PFP [46]. The reason for this may lay in the fact that forward trunk lean during walking and running has been proposed as an effective strategy to reduce PFJ stress [47]. Although these conclusions may be important factors in designing rehabilitation programs, improvements in PFP symptoms seem to be more related to gains in strength than changes in kinematic behavior [48]. Therefore, the reciprocal relationship of trunk muscle strength and kinematics in people with PFP remains to be further investigated.
We found no difference in hip muscle strength between groups, with the exception of hip abduction strength in participants with unilateral PFP. These findings are in contrast to previous studies reporting impaired muscle strength of the hip abduction, external rotation and extension muscles both in participants with unilateral and bilateral PFP [8,14,49]. However, it was proposed that, although hip strength deficits may be important in women, it may not be a feature of PFP in a mixed gender sample [13]. Additionally, hip internal rotation strength was significantly greater in the “affected” compared with the “non-affected” side in participants with unilateral PFP. These results may be related to increased femoral rotation in participants with unilateral PFP [50]. Consequently, excessive hip internal rotation can be linked to the dynamic valgus in the knee, which finally contributes to greater PFJ stress [51]. Furthermore, it was previously reported that hip strength is not affected in adolescents with PFP [23]. These results suggest that, apart from gender, age group may also be an important factor in the clinical decision in patients with PFP. Our study confirmed previous research regarding the deficits of the knee muscle strength [52]. It was reported that both knee extension and flexion strength were impaired in the PFP group. The findings also suggest that regardless of the affected side, participants with PFP tend to have weaker knee muscles than participants without PFP. Finally, participants with unilateral PFP exhibit greater ankle flexion strength and extension flexibility compared to participants without PFP. Power et al. [15] suggested that foot and ankle flexibility and strength could be associated with knee valgus and, therefore, diminish the quality of movement during functional tasks. Moreover, increased ankle extension below the lateral malleolus could indicate increased navicular drop while standing.
Consistent with previous studies [53], we demonstrated no differences between groups in postural control during the one-legged stance. It has been suggested that deficits in hip abduction strength play an important role in postural control in women with PFP [54]. However, our study included a mixed-gender sample, and the results indicate no differences between groups in hip abduction strength. Therefore, it is possible that such differences occur only in women with hip abduction strength deficits. Similarly, although participants with PFP had slightly higher asymmetries in the standing, semi-squat and squat positions, this did not reach statistical significance. Additionally, we found a significant between-group difference in terms of ankle extension flexibility. These findings may be a result of an increased calcaneal eversion and foot pronation previously found in PFP patients [16,17], although the small difference between groups limits definite conclusions. Although ankle extension flexibility seems to be lower than in the CG, further studies examining ankle flexibility in participants with PFP are warranted. The clinical relevance of these finding remains therefore unclear and requires further research. No other between-group difference was found in terms of flexibility. Surprisingly, the majority of participants with PFP defined their right leg as their dominant one. Our findings suggest that there is a strong relationship between side-dominance and hip extension strength in the PFP group. On the other hand, no significant correlation was observed between the outcome measures and dominant leg based on both groups. These findings suggest that leg dominance is associated with hip extension and adduction strength, but only in participants with unilateral PFP.
Some limitations and considerations related to our study need to be addressed. First of all, because of a case-control study design, it was not possible to draw conclusions on the cause and effect relationships. Secondly, our sample of participants with PFP was small, preventing clear conclusions on the characteristics of PFP. A larger sample size is needed to better determine lower extremity strength and flexibility deficits in PFP patients. Another major limitation of our study is the inclusion of participants of all age groups. Considering the higher prevalence of PFP in adolescents, future studies should include only adolescents or young adults to better determine strength, flexibility and postural control deficits in this population. Additionally, most participants were female, which may limit our findings. Although PFP is more common in young females, future studies should aim to investigate muscle strength, flexibility and postural control in male participants with PFP. Lastly, it should be considered that we included both participants with uni- and bi-lateral symptoms. However, in participants with bilateral PFP, the side reported as worst was used in further analyses as the “affected” side and compared both to the “non-affected” and to participants without PFP [6,8,27,45]. To the authors’ knowledge, this was the first study measuring all trunk, hip, knee and ankle muscles’ strength and flexibility outcomes in participants with PFP in respect to the affected side. Additionally, the study compared all the above-mentioned outcomes to participants without PFP and explored correlations with PFP levels and duration. As such, this study may provide valuable clinical guidelines in the prevention and rehabilitation of PFP. Preventative or rehabilitative exercise programs addressing weaknesses of the impaired muscle groups may lead to a more effective and long-lasting recovery with respect to the individuals’ goals. Based on the results of our study, clinicians should consider implementing trunk strengthening exercises into PFP programs, when estimated as necessary. Therefore, routine testing should include testing of the trunk muscles along with knee muscles for providing a reliable base for a custom-designed rehabilitation program of PFP patients.

5. Conclusions

The present study investigated strength and the flexibility of trunk, hip, knee and ankle muscles as well as postural control in participants with and without unilateral or bilateral PFP as well as within-group deficits. Trunk and knee muscle deficits have been identified compared to participants without PFP, and it has been demonstrated that, although often overlooked, trunk muscle strength may play a significant role in PFP clinical presentation. The results indicate that clinicians should perform a thorough musculoskeletal examination of the proximal, local and distal segments in order to design appropriate rehabilitation programs. These assessments may help in the development on effective preventative and rehabilitative exercise programs for patients with PFP. However, further clinical trials, examining the benefits of adding trunk exercise to knee strengthening programs are warranted in order to achieve the best rehabilitation results.

Author Contributions

Conceptualization, N.Š. and D.M.; methodology, N.Š., M.Z., D.S. and D.M.; validation, N.Š., M.Z., D.S. and D.M.; formal analysis, D.M.; investigation, D.M., M.Z. and D.S.; resources, N.Š.; data curation, D.M.; writing—original draft preparation, D.M.; writing—review and editing, N.Š., M.Z., D.S. and D.M.; visualization, D.M.; supervision, N.Š.; project administration, N.Š. All authors have read and agreed to the published version of the manuscript.

Funding

This research received no external funding.

Institutional Review Board Statement

The study was conducted according to the guidelines of the Declaration of Helsinki and approved by the Slovenian National Ethics Committee (approval number: 0120-99/2018/5).

Informed Consent Statement

Informed consent was obtained from all subjects involved in the study.

Data Availability Statement

The data of the current study are available on reasonable request from the corresponding author.

Acknowledgments

The study was supported by the Slovenian Research Agency through the project TELASI-PREVENT [L5-1845] (Body asymmetries as a risk factor in musculoskeletal injury development: studying etiological mechanisms and designing corrective interventions for primary and tertiary preventive care) by the Rector’s fund of University of Primorska throughout internal post-doc project IZO-STAR (2991-2/2021) and program KINSPO (2990-1-2/2021). The Slovenian Research Agency provided authors N.S and D.S. with support in the form of a salary through the program ‘Kinesiology of monostructural, polystructural and conventional sports’ [P5-0147]. The funders had no role in study design, data collection and analysis, decision to publish or preparation of the manuscript.

Conflicts of Interest

The authors declare no conflict of interest.

References

  1. Smith, B.E.; Selfe, J.; Thacker, D.; Hendrick, P.; Bateman, M.; Moffatt, F.; Rathleff, M.S.; Smith, T.O.; Logan, P. Incidence and prevalence of patellofemoral pain: A systematic review and meta-analysis. PLoS ONE 2018, 13, e0190892. [Google Scholar] [CrossRef] [PubMed] [Green Version]
  2. Crossley, K.M.; Stefanik, J.J.; Selfe, J.; Collins, N.J.; Davis, I.S.; Powers, C.M.; McConnell, J.; Vicenzino, B.; Bazett-Jones, D.M.; Esculier, J.F.; et al. 2016 Patellofemoral pain consensus statement from the 4th International Patellofemoral Pain Research Retreat, Manchester. Part 1: Terminology, definitions, clinical examination, natural history, patellofemoral osteoarthritis and patient-reported outcome measures. Br. J. Sports Med. 2016, 50, 839–843. [Google Scholar] [CrossRef] [PubMed]
  3. Lankhorst, N.E.; Bierma-Zeinstra, S.M.A.; Van Middelkoop, M. Risk factors for patellofemoral pain syndrome: A systematic review. J. Orthop. Sports Phys. Ther. 2012, 42, 81–94. [Google Scholar] [CrossRef]
  4. Farrokhi, S.; Keyak, J.H.; Powers, C.M. Individuals with patellofemoral pain exhibit greater patellofemoral joint stress: A finite element analysis study. Osteoarthr. Cartil. 2011, 19, 287–294. [Google Scholar] [CrossRef] [PubMed] [Green Version]
  5. Brechter, J.H.; Powers, C.M. Patellofemoral stress during walking in persons with and without patellofemoral pain. Med. Sci. Sports Exerc. 2002, 34, 1582–1593. [Google Scholar] [CrossRef] [PubMed]
  6. Magalhães, E.; Fukuda, T.Y.; Sacramento, S.N.; Forgas, A.; Cohen, M.; Abdalla, R.J. A comparison of hip strength between sedentary females with and without patellofemoral pain syndrome. J. Orthop. Sports Phys. Ther. 2010, 40, 641–647. [Google Scholar] [CrossRef] [Green Version]
  7. Nakagawa, T.H.; Maciel, C.D.; Serrão, F.V. Trunk biomechanics and its association with hip and knee kinematics in patients with and without patellofemoral pain. Man. Ther. 2015, 20, 189–193. [Google Scholar] [CrossRef] [PubMed]
  8. Ireland, M.L.; Willson, J.D.; Ballantyne, B.T.; Davis, I.M.C. Hip Strength in Females with and without Patellofemoral Pain. J. Orthop. Sports Phys. Ther. 2003, 33, 671–676. [Google Scholar] [CrossRef] [PubMed]
  9. Willson, J.D.; Ellis, E.D.; Kernozek, T.W. Plantar loading characteristics during walking in females with and without patellofemoral pain. J. Am. Podiatr. Med. Assoc. 2015, 105, 1–7. [Google Scholar] [CrossRef]
  10. Leetun, D.T.; Ireland, M.L.; Willson, J.D.; Ballantyne, B.T.; Davis, I.M.C. Core stability measures as risk factors for lower extremity injury in athletes. Med. Sci. Sports Exerc. 2004, 36, 926–934. [Google Scholar] [CrossRef] [PubMed] [Green Version]
  11. Yelvar, G.D.Y.; Çirak, Y.; Dalkilinç, M.; Demir, Y.P.; Baltaci, G.; Kömürcü, M. Impairments of postural stability, core endurance, fall index and functional mobility skills in patients with patello femoral pain syndrome. J. Back Musculoskelet. Rehabil. 2017, 30, 163–170. [Google Scholar] [CrossRef] [PubMed]
  12. Powers, C.M. The influence of abnormal hip mechanics on knee injury: A biomechanical perspective. J. Orthop. Sports Phys. Ther. 2010, 40, 42–51. [Google Scholar] [CrossRef] [PubMed] [Green Version]
  13. Cowan, S.M.; Crossley, K.M.; Bennell, K.L. Altered hip and trunk muscle function in individuals with patellofemoral pain. Br. J. Sports Med. 2009, 43, 584–588. [Google Scholar] [CrossRef] [PubMed]
  14. Almeida, G.P.L.; De Moura Campos Carvalho e Silva, A.P.; França, F.J.R.; Magalhães, M.O.; Burke, T.N.; Marques, A.P. Relationship between frontal plane projection angle of the knee and hip and trunk strength in women with and without patellofemoral pain. J. Back Musculoskelet. Rehabil. 2016, 29, 259–266. [Google Scholar] [CrossRef]
  15. Powers, C.M.; Witvrouw, E.; Davis, I.S.; Crossley, K.M. Evidence-based framework for a pathomechanical model of patellofemoral pain: 2017 patellofemoral pain consensus statement from the 4th International Patellofemoral Pain Research Retreat, Manchester, UK: Part 3. Br. J. Sports Med. 2017, 51, 1713–1723. [Google Scholar] [CrossRef] [PubMed] [Green Version]
  16. Barton, C.J.; Lack, S.; Hemmings, S.; Tufail, S.; Morrissey, D. The “Best Practice Guide to Conservative Management of Patellofemoral Pain”: Incorporating level 1 evidence with expert clinical reasoning. Br. J. Sports Med. 2015, 923–934. [Google Scholar] [CrossRef] [PubMed]
  17. Boling, M.; Padua, D.; Marshall, S.; Guskiewicz, K.; Pyne, S.; Beutler, A. A prospective investigation of biomechanical risk factors for patellofemoral pain syndrome. The joint undertaking to monitor and prevent ACL injury (JUMP-ACL) cohort. Am. J. Sports Med. 2009, 37, 2108. [Google Scholar] [CrossRef] [Green Version]
  18. Barton, C.J.; Bonanno, D.; Levinger, P.; Menz, H.B. Foot and ankle characteristics in patellofemoral pain syndrome: A case control and reliability study. J. Orthop. Sports Phys. Ther. 2010, 40, 286–296. [Google Scholar] [CrossRef] [PubMed] [Green Version]
  19. Carvalho, A.P.D.M.C. Comparison of isometric ankle strength between females with and without patellofemoral pain syndrome. Int. J. Sports Phys. Ther. 2014, 9, 628–634. [Google Scholar]
  20. Boling, M.C.; Nguyen, A.D.; Padua, D.A.; Cameron, K.L.; Beutler, A.; Marshall, S.W. Gender-Specific Risk Factor Profiles for Patellofemoral Pain. Clin. J. Sport Med. 2021, 31, 49–56. [Google Scholar] [CrossRef] [PubMed]
  21. Martins Kalytczak, M.; Roberto Garcia Lucareli, P.; Curcio dos Reis, A.; Serra Bley, A.; Aparecida Biasotto-Gonzalez, D.; Carlos Ferrari Correa, J.; Politti, F. Kinematic and electromyographic analysis in patients with patellofemoral pain syndrome during single leg triple hop test. Gait Posture 2016, 49, 246–251. [Google Scholar] [CrossRef] [PubMed]
  22. Neal, B.S.; Lack, S.D.; Lankhorst, N.E.; Raye, A.; Morrissey, D.; Van Middelkoop, M. Risk factors for patellofemoral pain: A systematic review and meta-analysis. Br. J. Sports Med. 2019, 53, 270–281. [Google Scholar] [CrossRef] [PubMed] [Green Version]
  23. Rathleff, C.R.; Neill Baird, W.; Olesen, J.L.; Roos, E.M.; Rasmussen, S.; Rathleff, M.S. Hip and Knee Strength Is Not Affected in 12–16 Year Old Adolescents with Patellofemoral Pain-A Cross-Sectional Population-Based Study. PLoS ONE 2013, 8, e79153. [Google Scholar] [CrossRef] [Green Version]
  24. Morishige, Y.; Harato, K.; Kobayashi, S.; Niki, Y.; Matsumoto, M.; Nakamura, M.; Nagura, T. Difference in leg asymmetry between female collegiate athletes and recreational athletes during drop vertical jump. J. Orthop. Surg. Res. 2019, 14, 424. [Google Scholar] [CrossRef] [PubMed]
  25. Dolak, K.L.; Silkman, C.; Mckeon, J.M.; Hosey, R.G.; Lattermann, C.; Uhl, T.L. Hip strengthening prior to functional exercises reduces pain sooner than quadriceps strengthening in females with patellofemoral pain syndrome: A randomized clinical trial. J. Orthop. Sports Phys. Ther. 2011, 41, 560–570. [Google Scholar] [CrossRef] [Green Version]
  26. Vambergue, A.; Vantyghem, M.C.; Leclerc, L.; Hober, C.; Fourrier, F. Syndrome De Wiedemann-Beckwith Infantile, Avec Hypoglycemie Maternelle Severe, Steatose Hepatique Aigue Gravidique Et Syndrome De Sheehan. Rev. Fr. Endocrinol. Clin. Nutr. Metab. 1994, 35, 69–76. [Google Scholar] [CrossRef]
  27. Nakagawa, T.H.; Moriya, E.T.U.; MacIel, C.D.; Serrão, F.V. Trunk, pelvis, hip, and knee kinematics, hip strength, and gluteal muscle activation during a single-leg squat in males and females with and without patellofemoral pain syndrome. J. Orthop. Sports Phys. Ther. 2012, 42, 491–501. [Google Scholar] [CrossRef] [Green Version]
  28. Eslami, M.; Damavandi, M.; Ferber, R. Association of navicular drop and selected lower-limb biomechanical measures during the stance phase of running. J. Appl. Biomech. 2014, 30, 250–254. [Google Scholar] [CrossRef]
  29. Aenumulapalli, A.; Kulkarni, M.M.; Gandotra, A.R. Prevalence of flexible flat foot in adults: A cross-sectional study. J. Clin. Diagn. Res. 2017, 11, AC17–AC20. [Google Scholar] [CrossRef]
  30. Biedert, R.M.; Tscholl, P.M. Patella Alta: A Comprehensive Review of Current Knowledge. Am. J. Orthop. 2017, 46, 290–300. [Google Scholar]
  31. Ismail, M.M.; Gamaleldein, M.H.; Hassa, K.A. Closed Kinetic Chain exercises with or without additional hip strengthening exercises in management of Patellofemoral pain syndrome: A randomized controlled trial. Eur. J. Phys. Rehabil. Med. 2013, 49, 687–698. [Google Scholar] [PubMed]
  32. Kozinc, Ž.; Trajković, N.; Smajla, D.; Šarabon, N. The Effect of Fatigue on Single-Leg Postural Sway and Its Transient Characteristics in Healthy Young Adults. Front. Physiol. 2021, 12, 720905. [Google Scholar] [CrossRef] [PubMed]
  33. Kozinc, Ž.; Smajla, D.; Šarabon, N. Relationship between hip abductor strength, rate of torque development scaling factor and medio-lateral stability in older adults. Gait Posture 2020, in press. [Google Scholar] [CrossRef] [PubMed]
  34. Smajla, D.; Žitnik, J.; Šarabon, N. Advancements in the Protocol for Rate of Force Development/Relaxation Scaling Factor Evaluation. Front. Hum. Neurosci. 2021, 15, 159. [Google Scholar] [CrossRef]
  35. Maffiuletti, N.A.; Aagaard, P.; Blazevich, A.J.; Folland, J.; Tillin, N.; Duchateau, J. Rate of force development: Physiological and methodological considerations. Eur. J. Appl. Physiol. 2016, 116, 1091. [Google Scholar] [CrossRef] [Green Version]
  36. Meyer, C.; Corten, K.; Wesseling, M.; Peers, K.; Simon, J.-P.; Jonkers, I.; Desloovere, K. Test-Retest Reliability of Innovated Strength Tests for Hip Muscles. PLoS ONE 2013, 8, 81149. [Google Scholar] [CrossRef] [Green Version]
  37. Narouei, S.; Imai, A.; Akuzawa, H.; Hasebe, K.; Kaneoka, K. Hip and trunk muscles activity during nordic hamstring exercise. J. Exerc. Rehabil. 2018, 14, 231. [Google Scholar] [CrossRef] [Green Version]
  38. Roach, S.; San Juan, J.G.; Suprak, D.N.; Lyda, M. Concurrent validity of digital inclinometer and universal goniometer in assessing passive hip mobility in healthy subjects. Int. J. Sports Phys. Ther. 2013, 8, 680–688. [Google Scholar]
  39. Fraeulin, L.; Holzgreve, F.; Brinkbäumer, M.; Dziuba, A.; Friebe, D.; Klemz, S.; Schmitt, M.; Anna-Lena Theis, A.; Tenberg, S.; van Mark, A.; et al. Intra- And inter-rater reliability of joint range of motion tests using tape measure, digital inclinometer and inertial motion capturing. PLoS ONE 2020, 15, e0243646. [Google Scholar] [CrossRef]
  40. Trajković, N.; Kozinc, Ž.; Smajla, D.; Šarabon, N. Relationship between ankle strength and range of motion and postural stability during single-leg quiet stance in trained athletes. Sci. Rep. 2021, 11, 11749. [Google Scholar] [CrossRef]
  41. Norkin, C.; White, J. Measurement of Joint Motion: A Guide to Goniometry; F.A. Davis: Philadelphia, PA, USA, 2016. [Google Scholar]
  42. Kozinc, Ž.; Šarabon, N. Inter-limb asymmetries in volleyball players: Differences between testing approaches and association with performance. J. Sport. Sci. Med. 2020, 19, 745–752. [Google Scholar]
  43. Akoglu, H. User’s guide to correlation coefficients. Turk. J. Emerg. Med. 2018, 18, 91–93. [Google Scholar] [CrossRef] [PubMed]
  44. Bernards, J.; Sato, K.; Haff, G.; Bazyler, C. Current Research and Statistical Practices in Sport Science and a Need for Change. Sports 2017, 5, 87. [Google Scholar] [CrossRef] [Green Version]
  45. Willson, J.D.; Binder-Macleod, S.; Davis, I.S. Lower extremity jumping mechanics of female athletes with and without patellofemoral pain before and after exertion. Am. J. Sports Med. 2008, 36, 1587–1596. [Google Scholar] [CrossRef] [PubMed]
  46. Nakagawa, T.H.; Moriya, É.T.U.; MacIel, C.D.; Serrão, F.V. Frontal plane biomechanics in males and females with and without patellofemoral pain. Med. Sci. Sports Exerc. 2012, 44, 1747–1755. [Google Scholar] [CrossRef] [PubMed]
  47. Teng, H.L.; Powers, C.M. Sagittal Plane Trunk Posture Influences Patellofemoral Joint Stress during Running. J. Orthop. Sport. Phys. Ther. 2014, 44, 785–792. [Google Scholar] [CrossRef] [Green Version]
  48. Rabelo, N.D.d.A.; Costa, L.O.P.; de Lima, B.M.; dos Reis, A.C.; Bley, A.S.; Fukuda, T.Y.; Lucareli, P.R.G. Adding motor control training to muscle strengthening did not substantially improve the effects on clinical or kinematic outcomes in women with patellofemoral pain: A randomised controlled trial. Gait Posture 2017, 58, 280–286. [Google Scholar] [CrossRef] [PubMed]
  49. Bolgla, L.A.; Earl-Boehm, J.; Emery, C.; Hamstra-Wright, K.; Ferber, R. Pain, Function, and Strength Outcomes for Males and Females with Patellofemoral Pain Who Participate in Either a Hip/Core- or Knee-Based Rehabilitation Program. Int. J. Sports Phys. Ther. 2016, 11, 926–935. [Google Scholar] [PubMed]
  50. Emamvirdi, M.; Letafatkar, A.; Khaleghi Tazji, M. The Effect of Valgus Control Instruction Exercises on Pain, Strength, and Functionality in Active Females with Patellofemoral Pain Syndrome. Sports Health 2019, 11, 223–237. [Google Scholar] [CrossRef]
  51. Crossley, K.M.; van Middelkoop, M.; Barton, C.J.; Culvenor, A.G. Best Practice & Research Clinical Rheumatology Rethinking patellofemoral pain: Prevention, management and long-term consequences. Best Pract. Res. Clin. Rheumatol. 2019, 33, 48–65. [Google Scholar] [CrossRef]
  52. Lankhorst, N.E.; Bierma-Zeinstra, S.M.A.; Van Middelkoop, M. Factors associated with patellofemoral pain syndrome: A systematic review. Br. J. Sports Med. 2013, 47, 193–206. [Google Scholar] [CrossRef] [PubMed]
  53. Zamboti, C.L.; da Silva, R.A., Jr.; Gobbi, C.; Shigaki, L.; Macedo, C.d.S.G. Analysis of pain, functional capacity, muscular strength and balance in young women with Patellofemoral Pain Syndrome. Fisioter. Mov. 2017, 30, 433–441. [Google Scholar] [CrossRef] [Green Version]
  54. Lee, S.P.; Souza, R.B.; Powers, C.M. The influence of hip abductor muscle performance on dynamic postural stability in females with patellofemoral pain. Gait Posture 2012, 36, 425–429. [Google Scholar] [CrossRef] [PubMed]
Figure 1. Isometric strength measurements of the (a) knee, (b) ankle and (c) trunk muscles.
Applsci 12 03238 g001
Figure 2. Isometric hip muscle testing. (a) Ankle position during hip external and internal rotation, (b) position during hip external and internal rotation and (c) hip adduction and abduction.
Applsci 12 03238 g002
Table 1. General characteristics of the patellofemoral pain and the control group.
Patellofemoral PainControlp-Value
FemalesMalesAllFemalesMalesAll
n13518261137/
Unilateral PFP7512////
Bilateral PFP606////
Age (years)19.1 ± 8.437.4 ± 12.324.2 ± 12.520.0 ± 7.425.3 ± 11.221.6 ± 8.80.436
Body height (cm)167.5 ± 7.1181.0 ± 11.4170.7 ± 10.2167.6 ± 7.4177.8 ± 8.5170.6 ± 9.00.972
Body mass (kg)57.9 ± 6.784.2 ± 19.762.5 ± 11.460.1 ± 9.073.7 ± 14.364.1 ± 12.40.638
Average training frequency (x/week)4.2 ± 2.83.5 ± 0.64.1 ± 2.43.7 ± 1.43.36 ± 0.93.6 ± 1.20.413
Average training session duration (min)86.3 ± 24.0112.5 ± 15.092.8 ± 24.691.7 ± 16.180.0 ± 22.488.2 ± 18.60.489
Average pain (cm)6.0 ± 1.15.2 ± 0.95.8 ± 1.2////
Average pain duration (months)9.0 ± 4.09.2 ± 4.19.1 ± 3.9////
Table 2. Clinical presentation of the participants in the patellofemoral pain group.
Patellar Tilt/CompressionInternal Femoral RotationLateral Patellar TiltPatellar Hyper/HypomobilityContralateral Pelvic DropKnee ValgusNavicular DropPoor Foot FlexibilityHigh-Riding Patella
Unilateral930343211
Bilateral621101120
All1551444331
Percent94%31%6%25%25%25%19%19%6%
Table 3. Affected and non-affected leg strength outcome measures within participants with unilateral PFP.
Outcome MeasureMeans ± SDDifference
Affected LegNon-Affected LegtpES
Knee extension (Nm/kg)2.36 ± 0.562.51 ± 0.61−1.610.1360.25
Knee flexion (Nm/kg)1.23 ± 0.341.09 ± 0.312.020.0690.43
Ankle extension (Nm/kg)1.70 ± 0.861.90 ± 0.78−0.520.1140.24
Ankle flexion (Nm/kg)0.85 ± 0.380.62 ± 0.211.680.022 *0.75
Trunk lateral flexion (Nm/kg)3.87 ± 1.823.92 ± 1.74−0.210.8400.03
Hip abduction (Nm/kg)0.87 ± 0.110.88 ± 0.15−0.120.8770.08
Hip adduction (Nm/kg)0.79 ± 0.140.79 ± 0.13−0.350.7310.09
Hip external rotation (Nm/kg)0.80 ± 0.200.82 ± 0.21−1.830.0971.00
Hip internal rotation (Nm/kg)0.99 ± 0.230.87 ± 0.201.680.041 *0.92
Hip flexion (Nm/kg)1.72 ± 0.311.75 ± 0.25−0.450.6630.11
Hip extension (Nm/kg)2.03 ± 0.341.92 ± 0.381.500.1640.31
Nordic hamstring (Nm/kg)1.47 ± 0.331.53 ± 0.29−1.110.2930.19
* Statistically significant difference.
Table 4. Affected leg strength outcome measures and between-group differences.
Outcome MeasureMeans ± SDDifferenceMeans ± SDDifference
Unilateral PFP (n = 12)Control (n = 37)tpESBilateral PFP (n = 6)Control (n= 37)tpES
Knee extension (Nm/kg)2.36 ± 0.562.79 ± 0.92−1.540.048 *0.561.91 ± 0.272.79 ± 0.92−2.290.027 *1.29
Knee flexion (Nm/kg)1.23 ± 0.341.49 ± 0.38−2.090.042 *0.721.25 ± 0.221.49 ± 0.38−1.350.1860.77
Ankle extension (Nm/kg)1.70 ± 0.861.67 ± 0.520.190.8530.041.64 ± 0.441.67 ± 0.52−0.130.8990.06
Ankle flexion (Nm/kg)0.85 ± 0.380.48 ± 0.115.400.000 *1.320.75 ± 0.280.48 ± 0.114.370.000 *1.27
Trunk lateral flexion (Nm/kg)3.87 ± 1.825.32 ± 1.26−3.090.003 *0.923.53 ± 1.795.32 ± 1.26−3.040.004 *1.16
Trunk extension (Nm/kg)5.22 ± 2.567.72 ± 2.19−3.310.002 *1.054.45 ± 2.387.72 ± 2.19−3.360.002 *1.42
Trunk flexion (Nm/kg)4.25 ± 2.485.84 ± 1.40−0.580.5670.793.17 ± 1.475.84 ± 1.40−4.300.000 *1.86
Hip abduction (Nm/kg)0.87 ± 0.110.90 ± 0.18−2.780.008 *0.200.86 ± 0.100.90 ± 0.18−0.520.6030.27
Hip adduction (Nm/kg)0.79 ± 0.140.90 ± 0.22−1.620.1110.600.83 ± 0.100.90 ± 0.22−0.690.4950.41
Hip external rotation (Nm/kg)0.80 ± 0.200.80 ± 0.17−0.080.9390.090.86 ± 0.150.80 ± 0.170.690.4960.37
Hip internal rotation (Nm/kg)0.99 ± 0.230.98 ± 0.190.090.9260.051.10 ± 0.210.98 ± 0.191.250.2200.59
Hip flexion (Nm/kg)1.72 ± 0.311.87 ± 0.33−0.610.5420.472.04 ± 0.321.87 ± 0.33−0.330.7430.52
Hip extension (Nm/kg)2.03 ± 0.342.13 ± 0.48−1.280.2060.242.06 ± 0.372.13 ± 0.481.120.2700.16
Nordic hamstring (Nm/kg)1.47 ± 0.333.20 ± 0.81−1.390.1702.791.42 ± 0.263.20 ± 0.81−1.390.1722.95
* Statistically significant difference.
Table 5. Affected leg flexibility and stability outcome measures and between-group differences.
Outcome MeasureMeans ± SDDifferenceMeans ± SDDifference
Unilateral PFP
(n = 12)
Control
(n = 37)
tpESBilateral PFP (n = 6)Control
(n = 37)
tpES
Knee extension (°)3.78 ± 3.923.84 ± 3.72−0.180.8610.024.01 ± 5.183.84 ± 3.720.090.9260.03
Knee flexion (°)148.78 ± 6.92152.38 ± 6.44−1.900.0630.54148.33 ± 3.14152.38 ± 6.44−1.500.1420.79
Ankle extension (°)76.72 ± 10.4781.46 ± 6.94−2.000.050 *0.5377.83 ± 13.7881.46 ± 6.94−1.020.3140.33
Ankle flexion (°)18.22 ± 7.0415.24 ± 0.421.100.2780.3418.00 ± 6.3615.24 ± 0.420.630.5350.61
Hip abduction (°)42.28 ± 8.6442.68 ± 6.85−0.190.8530.0541.83 ± 8.2342.68 ± 6.85−0.270.7870.11
Hip adduction (°)28.61 ± 5.8329.89 ± 6.30−0.720.4710.2127.50 ± 3.9429.89 ± 6.30−0.900.3750.45
Hip external rotation (°)57.68 ± 15.0165.50 ± 15.72−1.760.0840.5160.70 ± 18.3165.50 ± 15.72−0.680.5010.28
Hip internal rotation (°)56.38 ± 13.4256.17 ± 15.190.050.9590.0168.75 ± 10.5856.17 ± 15.191.940.0590.96
Hip flexion with knee extended (°)96.57 ± 13.18102.81 ± 18.08−1.300.1980.3997.45 ± 15.52102.81 ± 18.08−0.680.4980.32
Hip flexion with knee flexed (°)145.34 ± 8.44144.58 ± 10.680.260.7930.08143.57 ± 5.81144.58 ± 10.68−0.230.8220.11
Hip extension (°)29.57 ± 11.0128.86 ± 10.020.240.8110.0731.28 ± 13.2428.86 ± 10.020.530.6020.21
Trunk lateral flexion diff (cm)24.33 ± 5.8923.37 ± 4.270.690.4900.1926.17 ± 4.9323.37 ± 4.271.460.1520.60
CoP sway path A-P (mm)5.01 ± 1.445.55 ± 1.46−1.290.2010.374.98 ± 1.955.55 ± 1.46−1.090.3250.33
CoP sway path M-L (mm)5.95 ± 2.246.60 ± 2.43−0.950.3430.285.89 ± 2.226.60 ± 2.43−0.850.3520.30
CoP sway velocity A-P (mm/s)23.22 ± 4.9925.76 ± 6.36−1.480.1320.4423.04 ± 5.1725.76 ± 6.36−1.310.2010.81
CoP sway velocity M-L (mm/s)25.64 ± 5.6826.83 ± 6.69−0.640.5240.1924.01 ± 5.2726.83 ± 6.69−0.780.0980.47
Standing asymmetry index (%)3.77 ± 3.673.21 ± 2.560.660.5100.183.11 ± 2.953.21 ± 2.560.580.6110.04
Semi-Squat asymmetry index (%)4.70 ± 2.233.87 ± 2.321.260.2120.374.54 ± 2.023.87 ± 2.320.980.2040.31
CoP = Center of Pressure. * Statistically significant difference.
Publisher’s Note: MDPI stays neutral with regard to jurisdictional claims in published maps and institutional affiliations.

