1. Introduction
Recently, as the number of families raising pets such as dogs and cats has increased, interest in human–pet interaction (HPI) has also increased. For HPI, it is necessary to know the emotions and health conditions of pets; however, it is difficult for humans to recognize pets’ expressions. To solve this issue, monitoring studies of behavioral observation of dogs using cameras, wearable devices, and pet products are being conducted [
1,
2,
3].
Among them, the basic factor monitored in dogs in daily life is the dog’s amount of activity, such as the number of steps it takes. Like a smartwatch worn by a human, a wearable device records how much the wearer has moved. In addition, such devices make it possible to understand the sleeping time or patterns of the dog; when changes in the dog’s movement are observed or the amount of activity decreases rapidly, a disease may be suspected.
To determine the activity level of dogs, a video camera or a wearable device can be used. A camera is installed in the house to observe the dog’s behavior in an empty house, so it is widely used in monitoring research for disease care [
2,
3,
4]. For a wearable device, various sensors can be used to analyze a dog’s movements. There are various commercial wearable devices such as Petpace, Fitbark, and Whistle, that measure and track the number of steps taken by a dog, which serves as a proxy for activity level [
1,
5].
With the combination of the technologies of Internet of Things (IoT), machine learning, and artificial intelligence, the amount of activity in dogs can be specified. In the past, only the direction or speed of the movement of the dog in the video was detected, or the activity level was estimated in 3–5 steps with data centered on acceleration for wearable devices. Recently, the amount of activity has been obtained through recognition of the behavior of dogs. Through examination of the detection area or joint movement in the video or embedding various sensors such as a gyroscope and inertial measurement unit (IMU) in the wearable device, it became possible to recognize specific behaviors such as sitting and standing, which greatly improved the accuracy [
1]. With these methods, detailed dog monitoring is possible if the amount of activity is obtained through behavior recognition of dogs. For example, since it is possible to measure the calorie consumption for each behavior, it is possible to suggest an appropriate amount or type of feed. In addition, in the case of a dog whose leg has been operated on, the degree of movement can be checked for rehabilitation, and exercise can be recommended on days when there is little movement.
However, various issues may arise in the process of collecting the behavior data of dogs. Cameras should be installed in such a way that as little overlapping with people or other objects occurs as possible. In addition, for wearable devices, the wearing direction or position should be constant. Some existing studies have controlled the experimental environment when collecting dog behavior data, so the collection method’s performance may degrade in real-life applications [
1]. To reduce the noise of the data collected in such an environment, preprocessing and analysis methods suitable for the characteristics of the data are also required; however, this is only a supplementary method.
To address this problem, multiple, rather than single types of data can be used. The fusion of multiple data types makes it possible to complement data noise and improve the accuracy of the behavior recognition of dogs. In research on human behavior recognition, various behavior recognition studies using multiple data have already been conducted [
6]; however, there have been few behavior recognition studies for dogs.
Accordingly, this paper proposes behavior recognition that combines multimodal data to estimate the amount of activity for the most commonly raised dogs. For this purpose, we aimed to recognize seven behaviors (standing, sitting, lying with raised head, lying without raised head, walking, sniffing, and running) with video data from a camera and sensor data (acceleration, gyroscope) from a wearable device.
The main contributions of this paper are:
Exploration of a suitable dog detection method using video data by comparing object detection methods (FasterRCNN, YOLOv3, YOLOv4) mainly used in computer vision.
Exploration of the combination of statistical characteristics that affect the recognition of dog behavior using sensor data (acceleration, gyroscope) collected from wearable devices.
Comparison of the performance of the existing method using single data and the method that fuses multimodal data and exploration of the model for dog behavior recognition improvement through performance comparison between deep learning-based fusion models (CNN, LSTM, CNN-LSTM).
2. Related Works
2.1. Behavior Recognition Based on Multimodal Data
Research on behavior recognition has been progressing rapidly and has focused mostly on humans. Most existing studies on behavior recognition have focused on images [
7,
8]. However, due to problems with various shooting environments and hardware resource problems, most studies use sensors that are cheaper and have a high computational efficiency [
9,
10,
11].
In recent years, multimodal data-based studies have been gradually increasing in number to improve the accuracy of behavior recognition. Among them, the study of behavior recognition through the fusion of various sensor data were focused on and the accuracy was improved when using multiple-sensor data compared to single-sensor data [
6]. In general, accelerometer and gyroscope data are often used in behavior recognition. Steels et al. performed badminton behavior recognition using accelerometer and gyroscope data, and the accuracy of most actions such as drive, smash, and net drop was improved [
12]. Uddin et al. proposed a behavior recognition system for health management that required wearing electrocardiogram (ECG) sensors, accelerometers, and gyroscope sensors on the chest, wrist, and ankle [
13].
Furthermore, studies based on multimodal data that combine different types of data have been conducted. Fusing these different types of data can complement the quality of data, which can have a good effect on performance. Ehatisham Ul Haq et al. proposed a multimodal feature feature-level fusion approach for human behavior recognition using RGB cameras, depth sensors, and wearable inertial sensors, and the accuracy was improved when data of RGB cameras, accelerometers, and gyroscopes was fused [
9].
Behavior recognition based on multimodal data that fuses these different types of data requires deep learning techniques that can automatically extract abstract features for each data type. Accordingly, multilayer perceptron (MLP), convolutional neural networks (CNNs), and recurrent neural networks (RNNs) are widely used to study behavior recognition and show higher performance than existing methods [
7,
14,
15,
16].
Accordingly, this paper collected multimodal data using a camera and a wearable device and fused them based on the abovementioned studies to obtain behavior recognition. In addition, we used a deep learning-based model to extract features from multimodal data.
2.2. Dog Behavior Recognition
Pet behavior recognition research is important for understanding the condition of pets. Various studies are being conducted to check the status of pets in daily life such as their activity and sleep or to predict diseases using medical data [
17]. Among them, the study of dog behavior recognition can be divided into cases using video data and cases using sensor data.
Research using video data can be further divided into research to detect dogs and research to extract joint motion. For dog detection, data collection and analysis are only easy when the shooting location is fixed, so a camera is generally attached to the ceiling to observe the dog’s movements. Bleuer Elsner et al. analyzed movement patterns in dogs with attention-deficit/hyperactivity disorder (ADHD)-like behavior, which they observed by installing a camera on the ceiling [
3]. However, when the camera was attached to the ceiling, only the movement and speed of the dog could be identified [
3]. Furthermore, research is also being conducted to recognize the behavior of livestock animals such as pigs, cows, and horses [
18].
Research on the skeletons of dogs is focused on pose estimation. The 3D position of dogs can be estimated using Kinect, a camera that can recognize depth and is mainly composed of RGB and IR cameras. Kearney et al. proposed a markerless approach for 3D canine pose estimation from RGBD images using the Kinect v2 [
19]. Pereira et al. proposed SLEAP, a multi-animal pose tracking framework for living things ranging from insects to vertebrates [
20].
In studies using these video data, overlap with other objects significantly lowers the recognition accuracy. In addition, since behavior recognition is only possible within the shooting radius, it is difficult to target dogs at home unless the entire house is photographed with cameras.
In comparison, studies using sensor data generally collect data by strapping a wearable device onto a dog. Currently, commercialized devices such as Fitbark, Petpace, and Whistle have been released and are used for tracking dogs’ activity; these are mainly used to increase the activity of dogs and improve their health [
21].
The appropriate location for the device to be worn—such as the neck, stomach, legs, or tail—has been extensively studied; it is important to select an appropriate location because a poor choice can cause discomfort to the dog. Most commercially available devices are worn around the neck [
22,
23], which has relatively less noise than other locations [
24]. In addition, when examining the behavior types of dogs, most commercialized dog wearable devices have an accelerometer sensor to estimate the dog’s behavior [
22]. Since a single sensor is used, the activity level of dogs is divided into three to five levels rather than more sophisticated behavior recognition. Recently, more detailed behavior recognition has become possible because gyroscope sensor data can be integrated and analyzed, but it is difficult to obtain high recognition accuracy for all behaviors.
Table 1 summarizes previous studies of dog behavior recognition using video data or sensor data. To date, there have been many machine learning-based behavior recognition studies, but research has been conducted by collecting either only video or sensor data. There are studies on behavior recognition based on multimodal data that embed various sensors in wearable devices, but fusing it with other types of data can improve the accuracy, and if data noise occurs, it can be compensated. Accordingly, in this paper, we aimed to improve the behavior recognition accuracy of dogs by solving the problems of existing studies through deep learning-based fusion of sensor data and video data.
3. Dog Behavior Recognition Based on Multimodal Data
In this study, we propose dog behavior recognition based on multimodal data. The purpose of this study was to find a method to improve the behavior recognition accuracy of dogs. This was performed to estimate the specific amount of activity of dogs. We limited our analysis to the most common dog breed, and we used a commonly used camera and wearable device. We assumed that the camera was installed in a place where the dog can be seen easily with minimal overlapping of other objects inside or outside the house and the wearable device was a collar.
Table 2 illustrates seven behaviors to recognize: standing, sitting, lying with raised head, lying without raised head, walking, sniffing, and running. Although dogs display various behaviors in daily life, such as eating and shaking, the behaviors representing the amount of activity of dogs were selected after referring to existing studies on dog behavior recognition [
1,
2,
25,
26]. In addition, since the wearable device is worn on the neck, it is sensitive to the movement of the head. In this paper, the criterion for lying was divided by whether the head was raised. Since the shortest length of each behavior is 4 s, it was processed by generating behavior sequence data for 4 s segments.
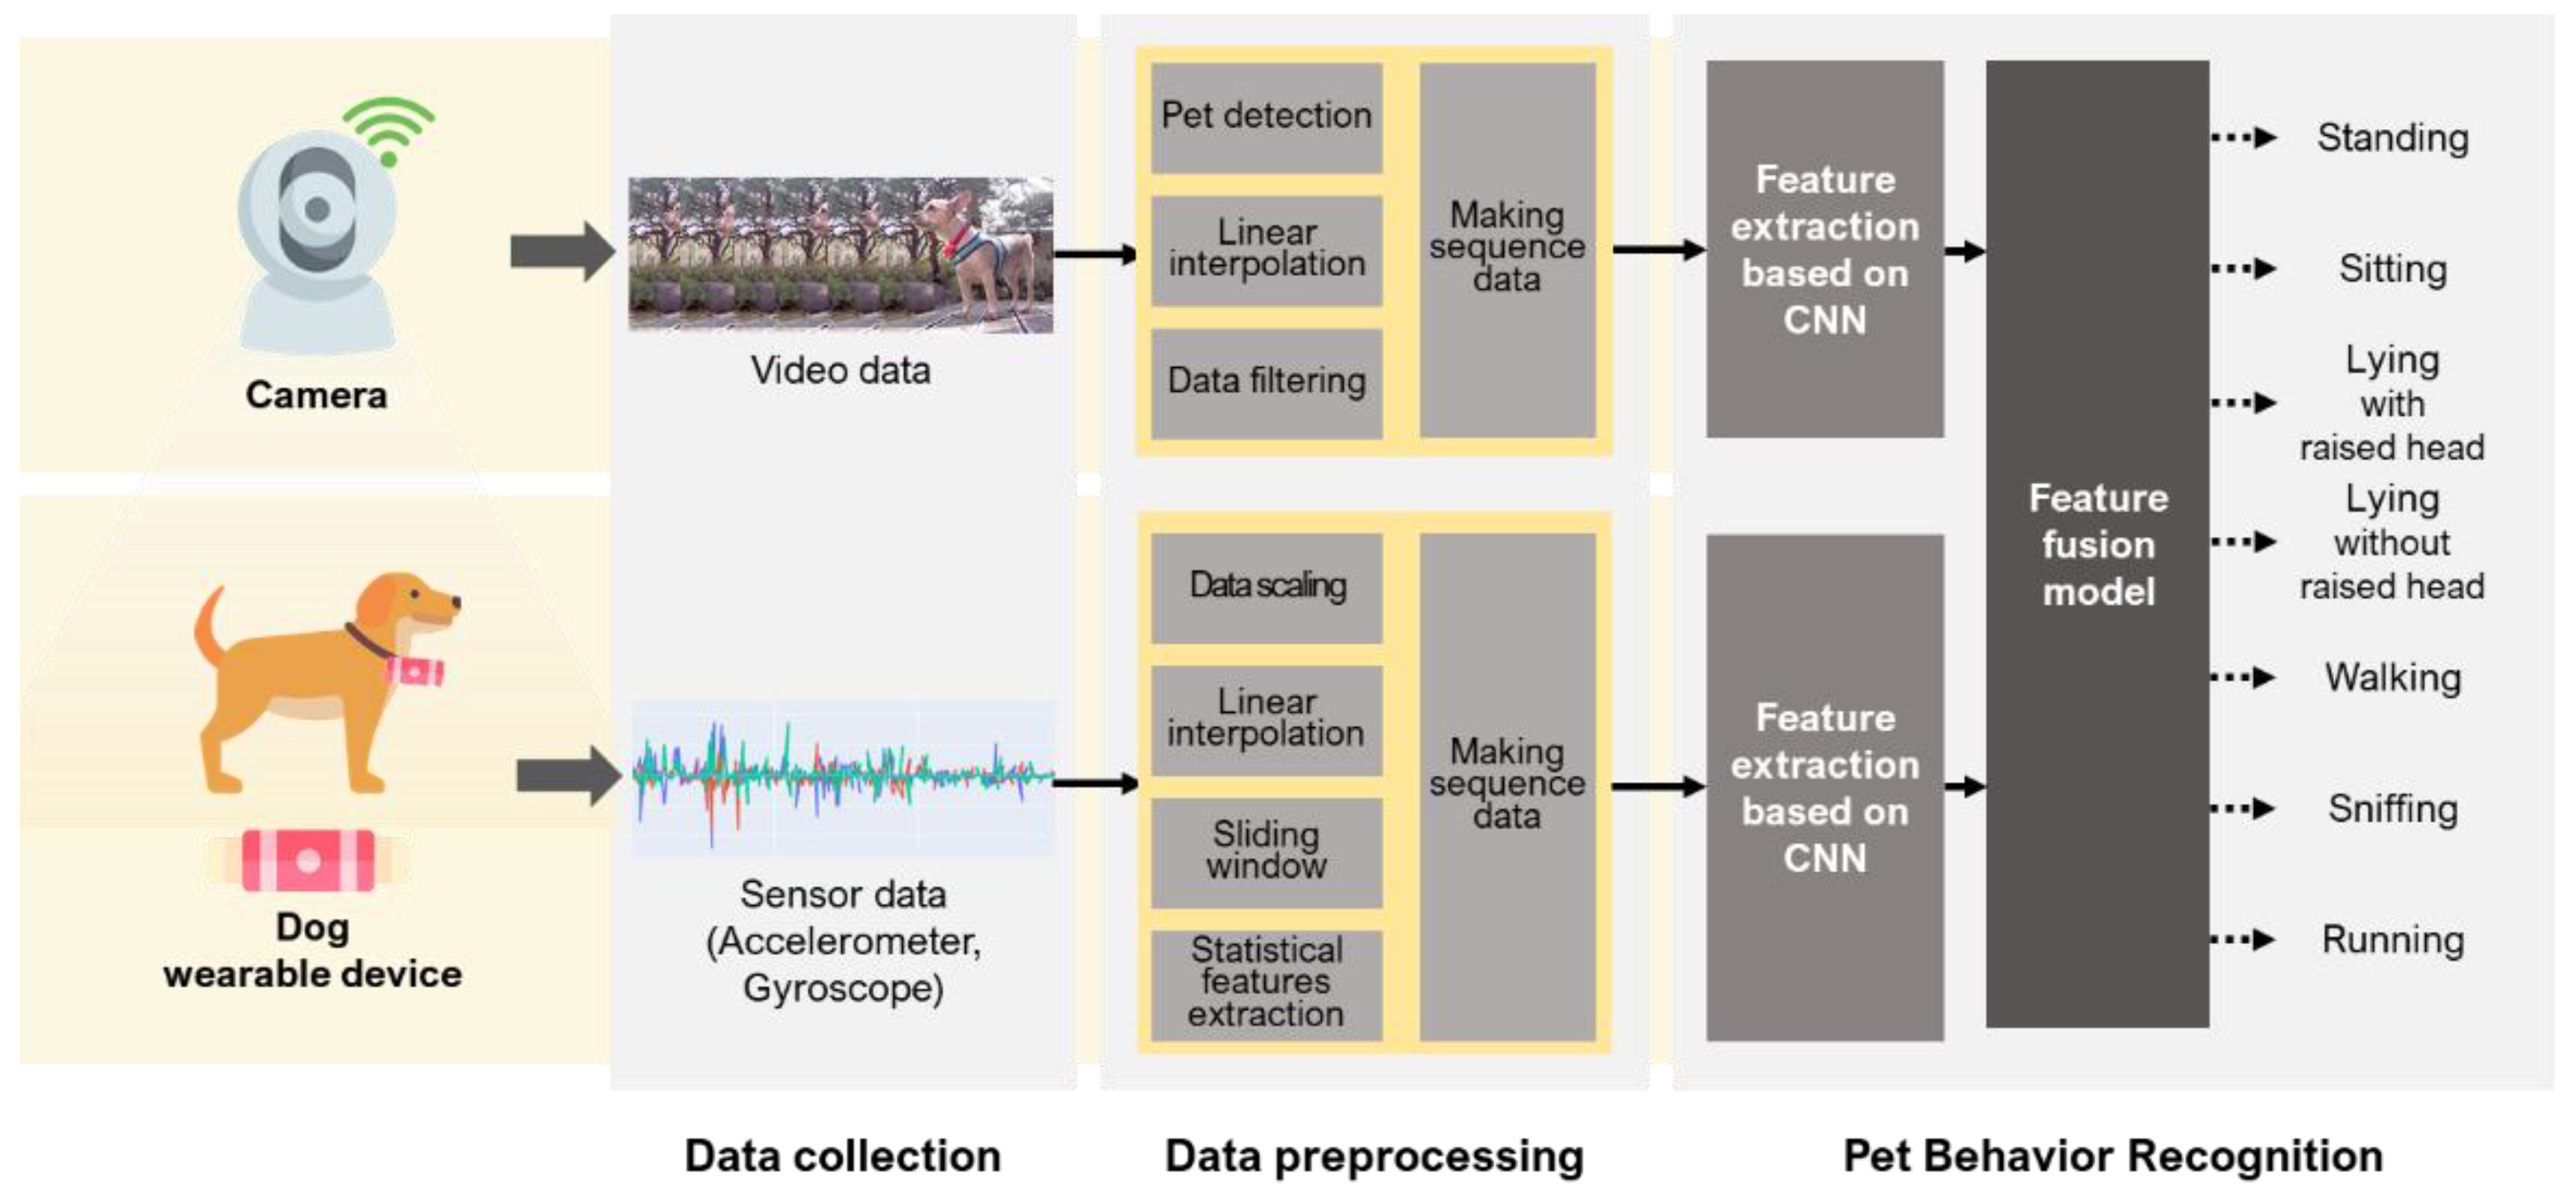
Figure 1 describes the overall process of data collection, data preprocessing, and dog behavior recognition. First, behavior data on videos and sensors were collected through cameras and wearable devices, followed by data preprocessing. For the video data, a dog was detected in a frame, missing values that were not detected were processed; for sensor data, outliers were removed, and missing values were processed. After that, the two types of data were synchronized based on time to generate behavior sequence data. These data were input into the proposed fusion model, which then learned to recognize dog behavior. The following subsections describe the details of each step.
3.1. Video Data Collection and Preprocessing
The video data were used to check the movement area of the dog, and an IP camera was used to capture the front or side view of the dog. Data were collected at 20 FPS with a resolution of 1920 × 1080.
Since various objects such as the owner or dog products appeared in the collected video data, dog detection was performed to check only the movement of dogs. Currently, various methods have been proposed for object detection in computer vision; however, detecting a distant dog inside a house requires a method with good performance at small object detection. Among the representative small object detection methods, Liu compared the performance of methods such as YOLOv3, FasterRCNN, and SSD [
27]. In addition, Nguyen compared the performance of RetinaNet, Fast RCNN, YOLOv3, and FasterRCNN [
28]. In terms of processing speed, it was confirmed that the performances of Faster RCNN and YOLOv3 were excellent. Accordingly, in this paper, we performed dog detection by adding FasterRCNN, YOLOv3, and YOLOv4, which has improved performance over YOLOv3 [
29].
The collected data were sliced into 4-s units, and the result of dog detection for each frame was the center coordinates (x, y), width, and height of the detected bounding box. However, it is difficult to detect dogs in various shooting environments every time. For the learning model, if all data for undetected frames is removed, the learning performance may be degraded, so it is necessary to process missing values. For this purpose, missing values were replaced using linear interpolation, which is one of the most widely used methods because of its simplicity and low computational cost. Since the length of the video data were not long, even if the missing values were continuous, if there were detected bounding boxes before and after the missing values, it was set to be interpolated to replace the missing values. If 50% or more of the values for one video were missing, the data were filtered because the reliability of the data would be lost even if the missing values were replaced.
3.2. Sensor Data Collection and Preprocessing
The collected sensor data were three-axis accelerometer and three-axis gyroscope da-ta taken once per second from a wearable device placed on the neck of a dog. The collected data were scaled using the median and quartiles values to minimize the influence of outliers on data collected from the wearable device. Next, an upsampling process was performed for each time-series index to display the collected data as a sequence. In the communication process, it was also necessary to process missing values for the time not collected because of the possibility that some data may have been lost. As with the video data, the missing values were replaced using linear interpolation. The sensor data had a shorter length, so to interpolate only data for 1 s out of 4 s, the number of consecutively interpolating missing values was limited to one. Next, for input into the learning model, the sensor data were divided into 4-s windows through a sliding window.
Next, we proceeded with feature extraction. Feature extraction can generally be divided into handcrafting features and learning features. Handcrafting features require little computation and can be easily extracted, but the sensor type is specific and feature selection is required, whereas learning features automatically learn features from raw data and are robust, but it is difficult to adjust parameters and interpret learned features [
8]. Accordingly, we want to improve the behavior recognition accuracy by extracting handcrafting features and reflecting them in the learning model.
In several studies, statistical features have been extracted and used for behavior recognition; however, this study only used features with little computation because complex features were automatically extracted and input into the next step, a fusion model. The features (
) selected in this study were the mean (
), variance (
), standard deviation (
), amplitude (
), and skewness (
); their equations are (1)–(5) for data length
n and data value
x. These features were counted 30 times for the three axes of the accelerometer and three axes of the gyroscope, and these features became the input values of the fusion model together with the raw data to determine how much they affect dog behavior recognition accuracy.
3.3. Dog Behavior Recognition
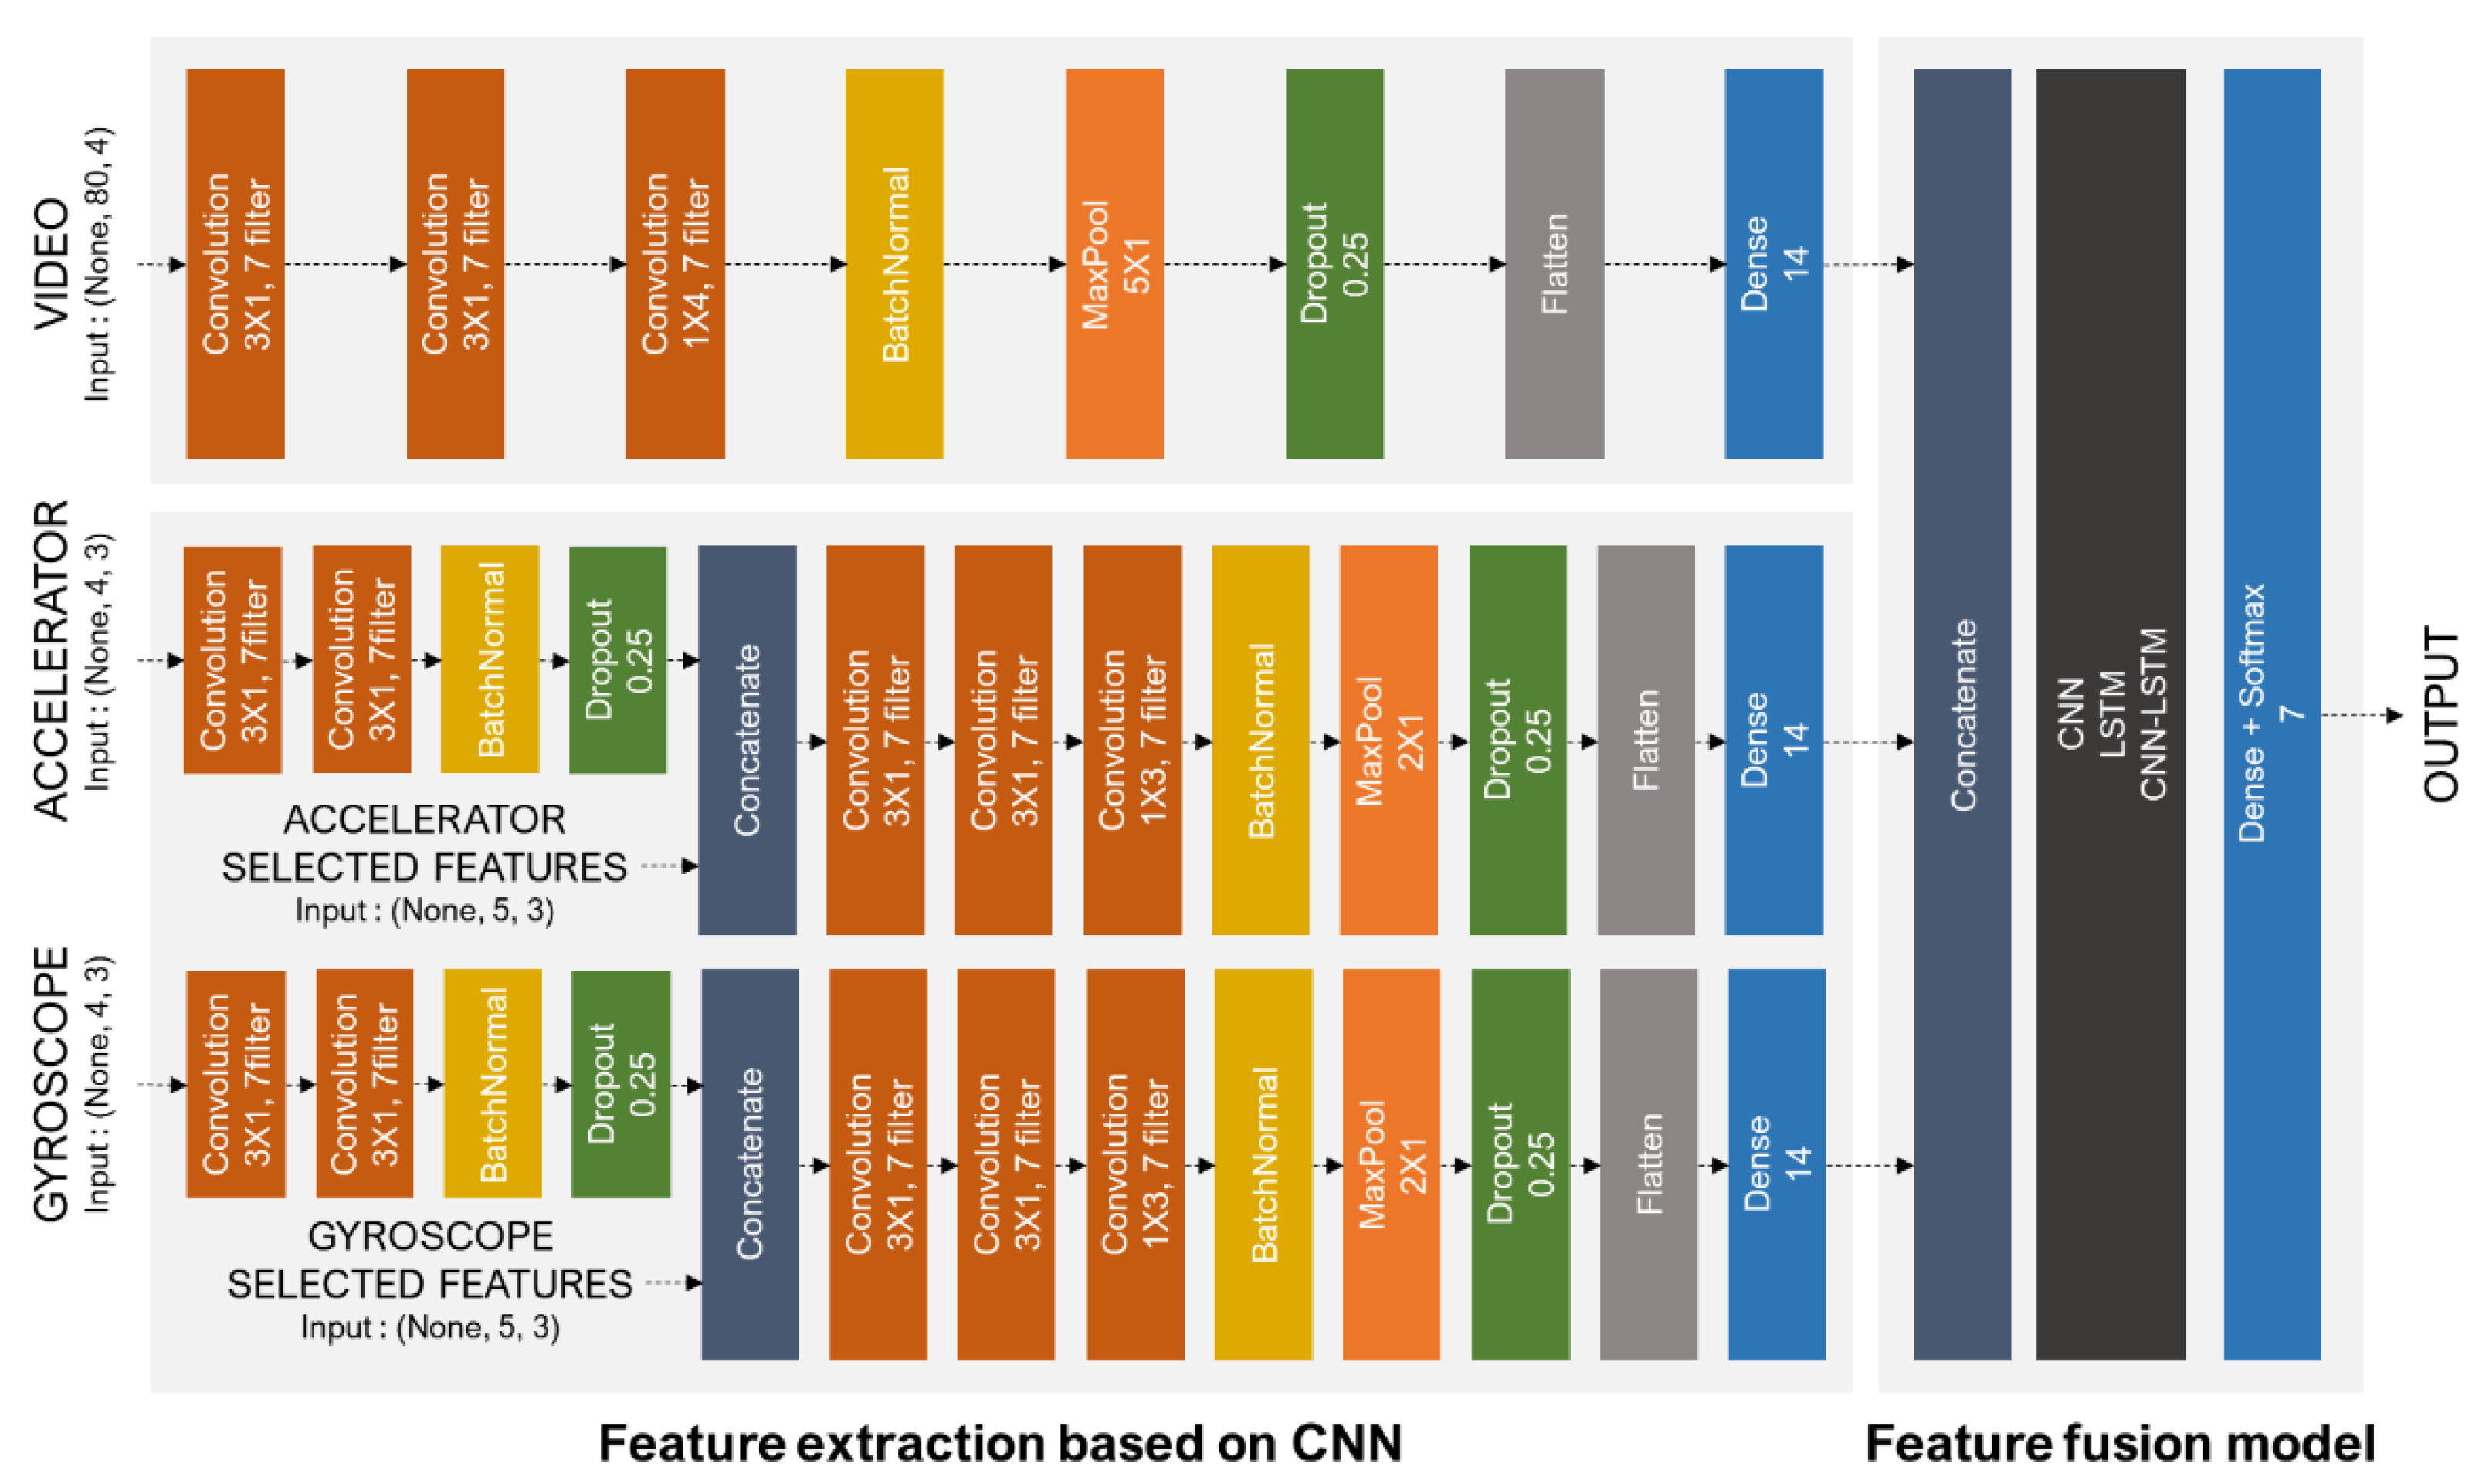
Figure 2 describes the model based on the multimodal data for dog behavior recognition extracted the features of video data and sensor data and then merged the extracted data to recognize behaviors.
3.3.1. Feature Extraction
Feature extraction uses CNN, which performs a convolution operation. CNNs can extract high-level features from both time-series data and video data. In this study, we extracted features using CNN for both video data and sensor data, which required us to conduct feature extraction separately.
Since the feature extraction of video data were 80 4-s frames, we focused on reducing the frame dimension. The convolution operation consists of seven filters of size (3, 1) and proceeds three times through the ReLU activation function, after which batch normalization is performed. Then, after max-pooling with (5, 1) size, dropout is performed at a rate of 0.25 to prevent overfitting. Finally, the extracted features are flattened to perform dense layer and batch normalization.
Feature extraction for sensor data were performed by dividing the accelerator and gyroscope. First, the raw data and the selected features are concatenated. Next, the convolution operation is performed twice with size (3, 1) and once with size (1, 3). The first two are for dimensionality reduction for features, and the last is dimensionality reduction for three axes. Then, after batch normalization, maxpooling of size (2, 1) is performed, and dropout is performed at a rate of 0.25. Finally, through flattening of the extracted features, the dense layer and batch normalization are performed. For the gyroscope data, the same process was performed. Finally, the extracted features of the accelerator and gyroscope are concatenated again.
3.3.2. Feature Fusion Model for Dog Behavior Recognition
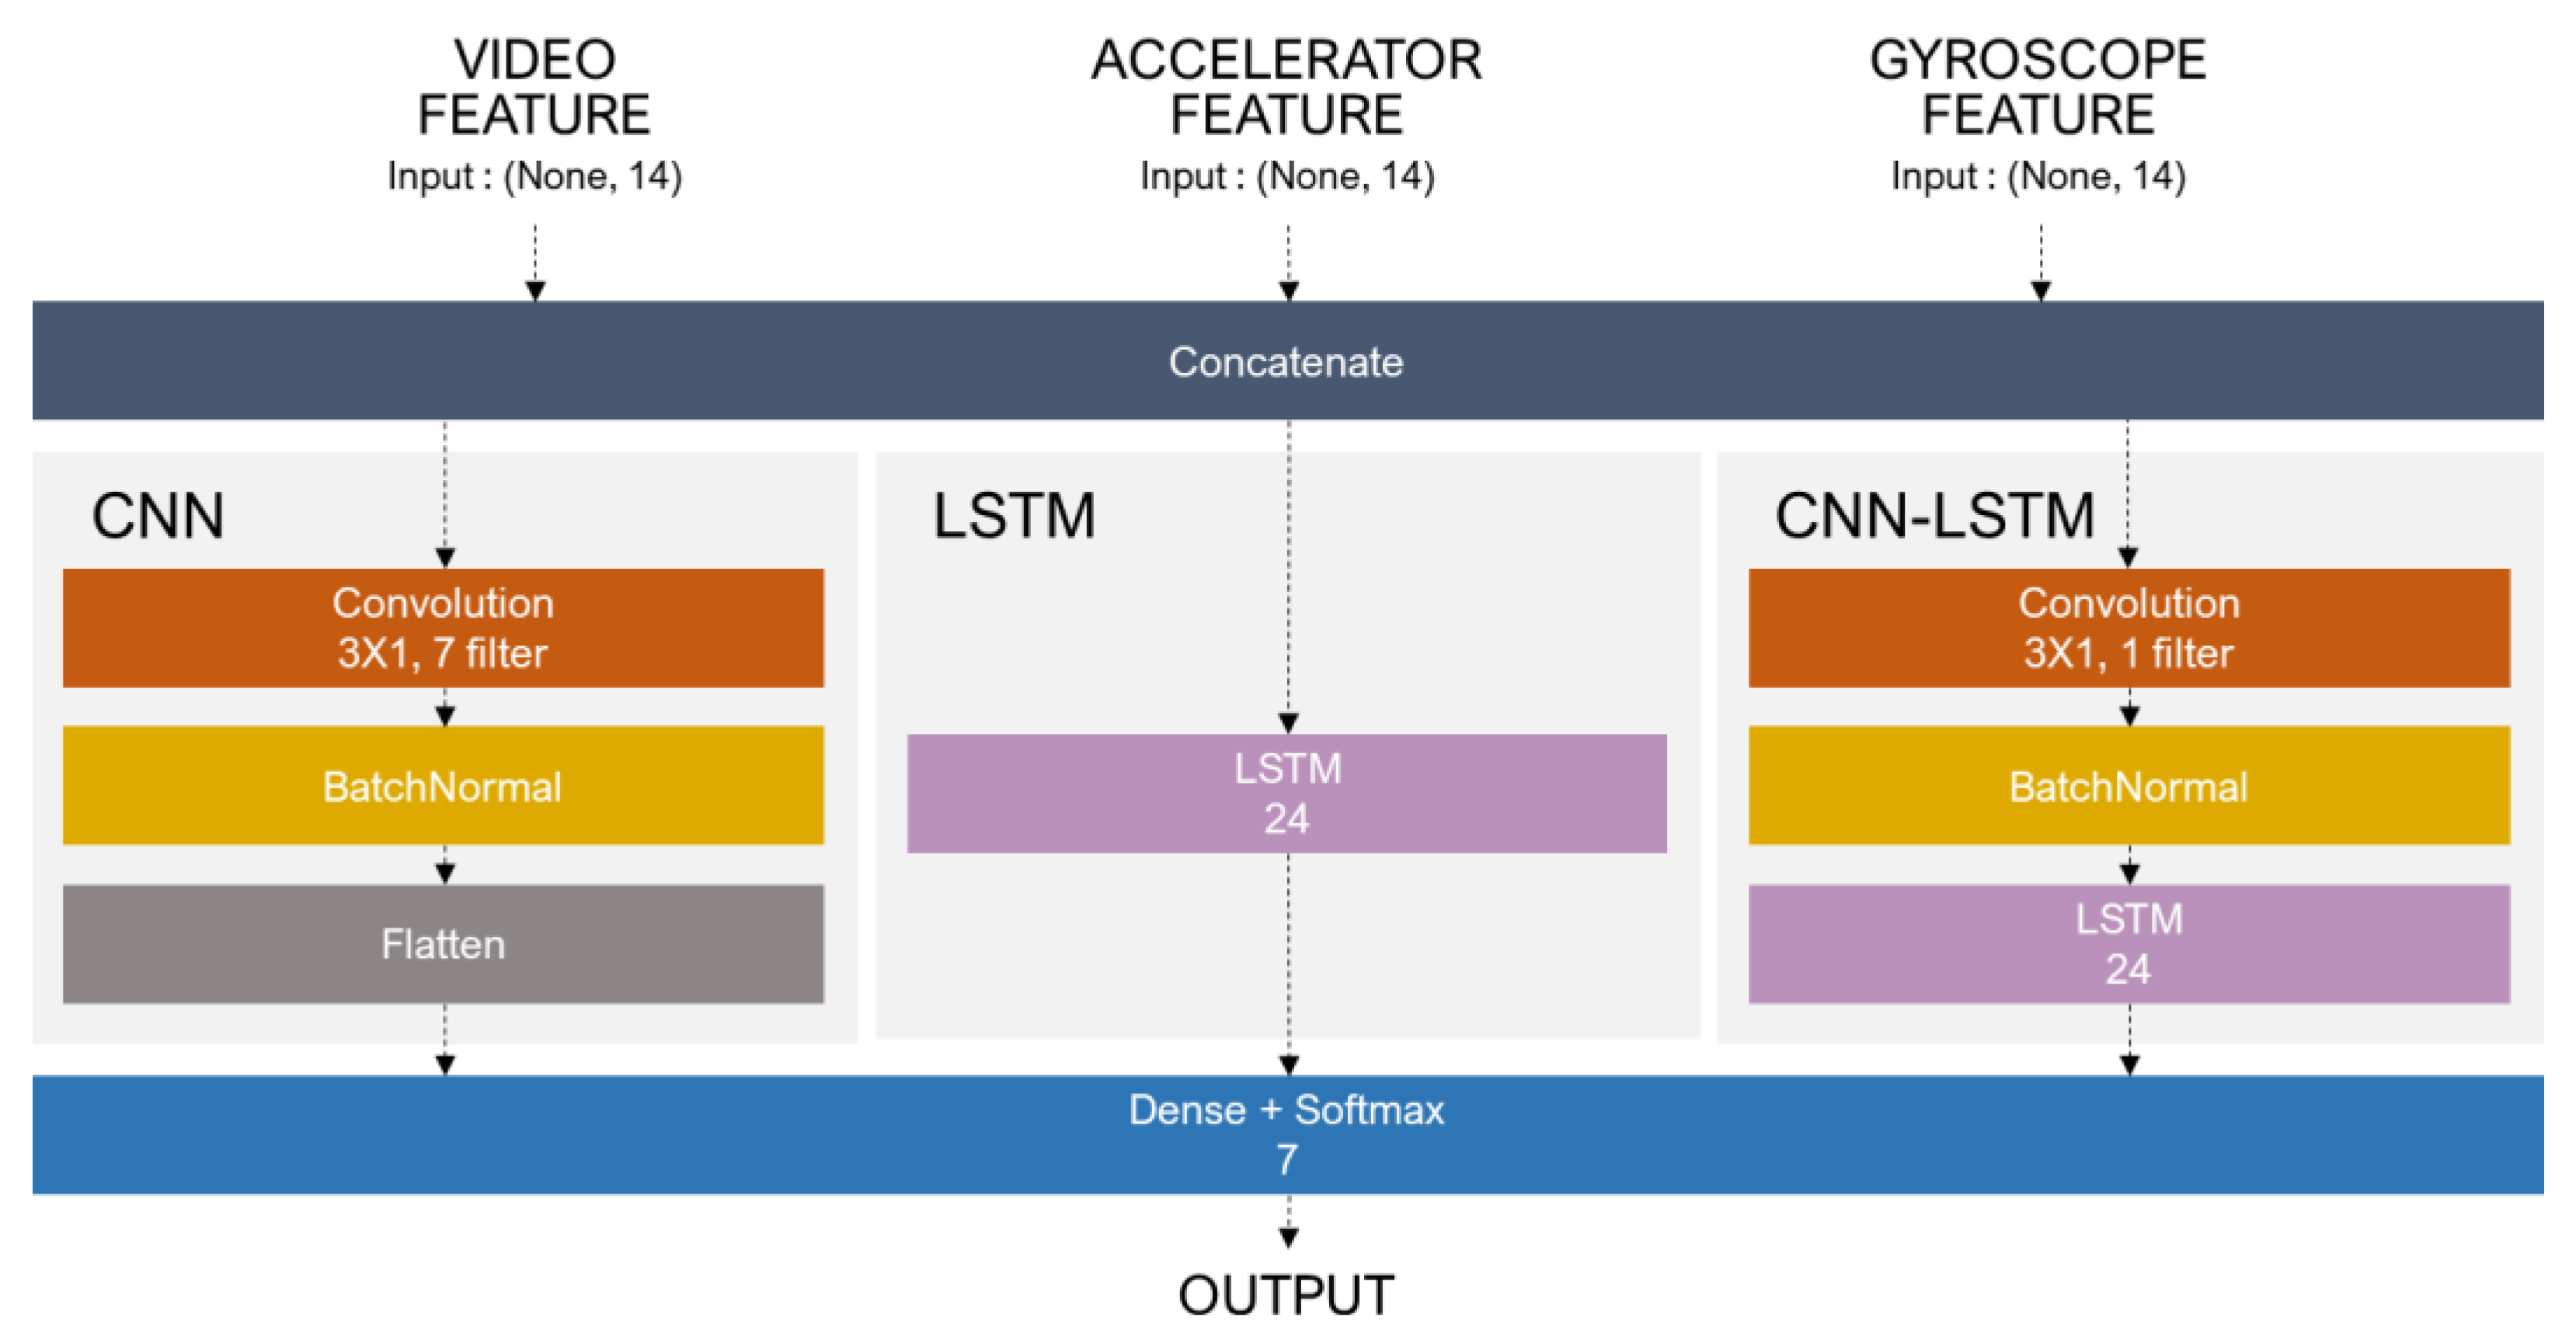
Next, the extracted features were fused and classified to recognize dog behaviors. We used CNN, LSTM, and CNN-LSTM models, which are the most commonly used deep learning methods. LSTM is a type of RNN that is specialized for time-series and improves the vanishing gradient problem of RNN. Furthermore, a recent hybrid method of CNN and LSTM has shown good performance in feature extraction considering time-series and is being used in research on prediction and classification in various fields. The structures of the CNN, LSTM, and CNN-LSTM models constructed in this study are shown in
Figure 3. As the final step of all models, softmax was performed for multiple behavior recognition to derive behavior-specific probabilities.
4. Experiments
4.1. Experimental Setup
This study was implemented using Keras as a backend with TensorFlow as a Python language.
Table 3 shows the detailed experimental specifications of this study.
4.1.1. Data Collection Process and Dataset
The experiment was conducted with one dog: a 4-year-old male Yorkshire terrier. Data collection was conducted in compliance with animal ethics. To obtain consent from the owner and to eliminate the dog’s anxiety, the collection was always carried out in situations where the owner accompanied the dog. In addition, to reflect the environment in daily life as much as possible, natural behaviors, not trained behaviors, were observed within the radius captured by the camera. Among the data collected in this process, behaviors that were externally influenced, other than self-moving behaviors such as petting or touching the dog, were removed through filtering. In addition, the total time for collection of data did not exceed 30 min to ensure that the health of the dog was not affected.
To make the collection environment as similar as possible to the environment in daily life, there were no restrictions on the space inside the house, such as the living room or outdoor space, and a camera was installed so that the front or side of the dog could be seen. In addition, to increase the detection rate of the dog in the video, videos were not taken from too far away. The IP camera used was the HejHome Smart Home Camera pro, and the resolution was Full HD (1920 × 1080) and 20 FPS.
Figure 4 describes the process of collecting sensor data from a manufactured wearable device based on the Arduino nano 33 IoT board. The wearable device was manufactured as a collar. Data were collected from the server through Bluetooth with an Android-based smart device. The accelerometer and gyroscope data were collected using the LSM6DS3 module.
The collected data were matched based on the time of the video data and the sensor data, and cases where even one of the two data were not collected were excluded. In the collected dataset, the behavior of the dog was determined based on the video, and the behavior was labeled. The collected and pre-processed dataset is shown in
Table 4. To reduce the data imbalance, the most frequently collected behavior, sitting, was set as 30 differences from the second-largest behavior. For learning, 80% of the entire dataset was used as the training dataset, the rest was used for the test dataset, and 20% of the training dataset was used for the validation dataset.
4.1.2. Performance Evaluation Measurement and Method
Performance evaluation was compared by measuring the accuracy, precision, recall, and f-score. Accuracy represents the ratio of correctly recognized numbers among all N pieces of data. Precision is the ratio of the prediction and the actual value of the positive data among the positive prediction data and is defined in Equation (6). Recall is the ratio of prediction and actual positive data among actual positive data and is defined as Equation (7). The final f-score was calculated as the harmonic average of precision and recall, as shown in Equation (8). In addition, various model evaluations were conducted with 100 epochs and a batch size of 16. Adam was used as the optimizer, and the learning rate was set to 0.001.
4.2. Experimental Results
The experiment had three goals. The first was to find a suitable dog detection method by comparing the performance of object detection methods using video data. The second was to find the combination of statistical features that affect the behavioral recognition of dogs by comparing the performance using sensor data. The third was to compare the performance difference methods that use single data and those that fuse multimodal data and to determine the proper model for improving dog behavior recognition through performance comparison of deep learning-based fusion models.
4.2.1. Behavior Recognition Using Video Data
For the video data, FasterRCNN, YOLOv3, and YOLOv4 were used to check the dog detection rate. To confirm the detection rate, an experiment was conducted using a pre-trained model with the COCO dataset in three dog detection methods.
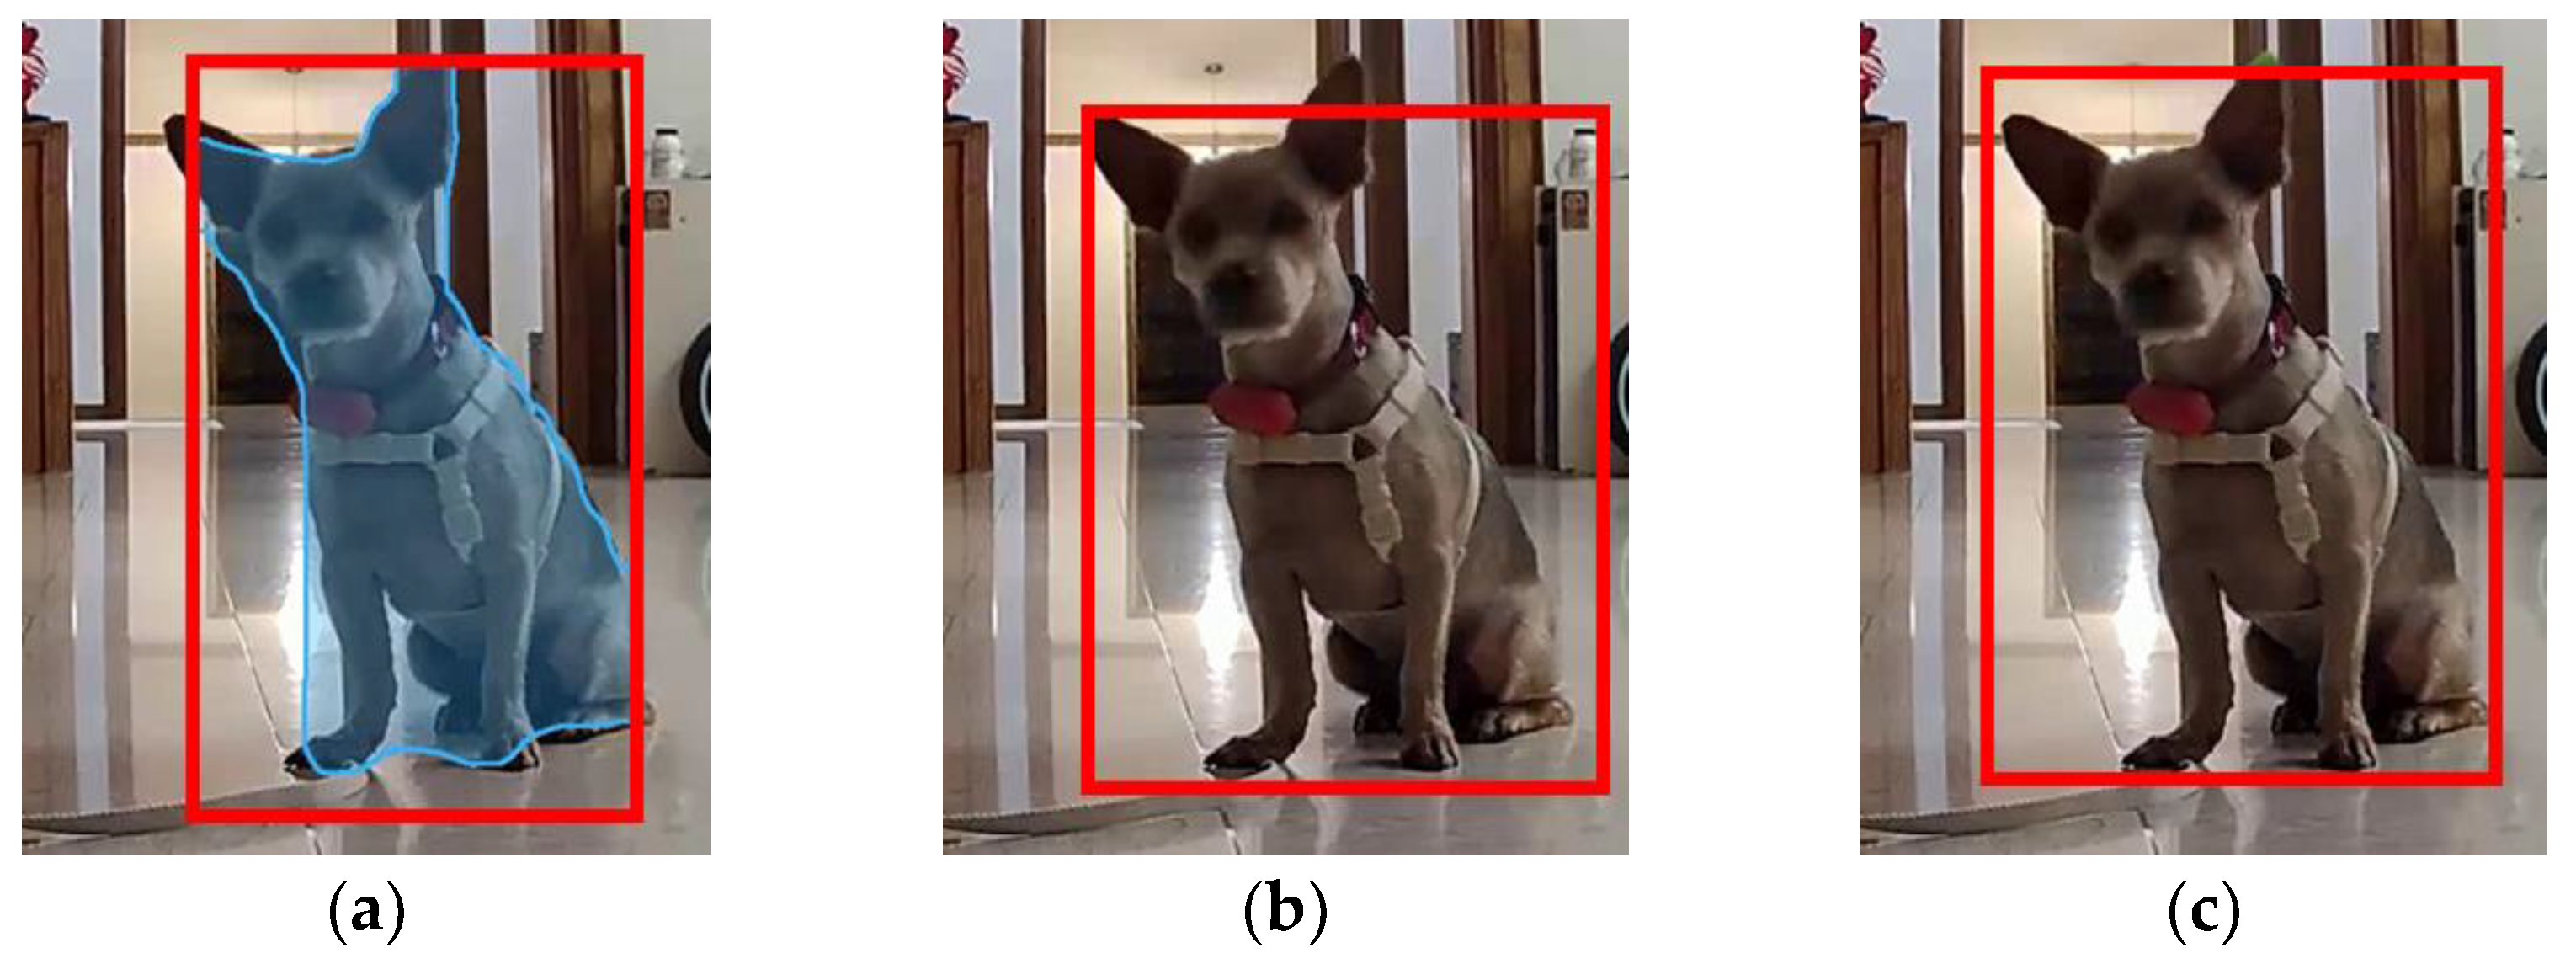
Figure 5 displays one of the detected results for “sitting”. YOLOv4 detected the dog’s size better than the other methods.
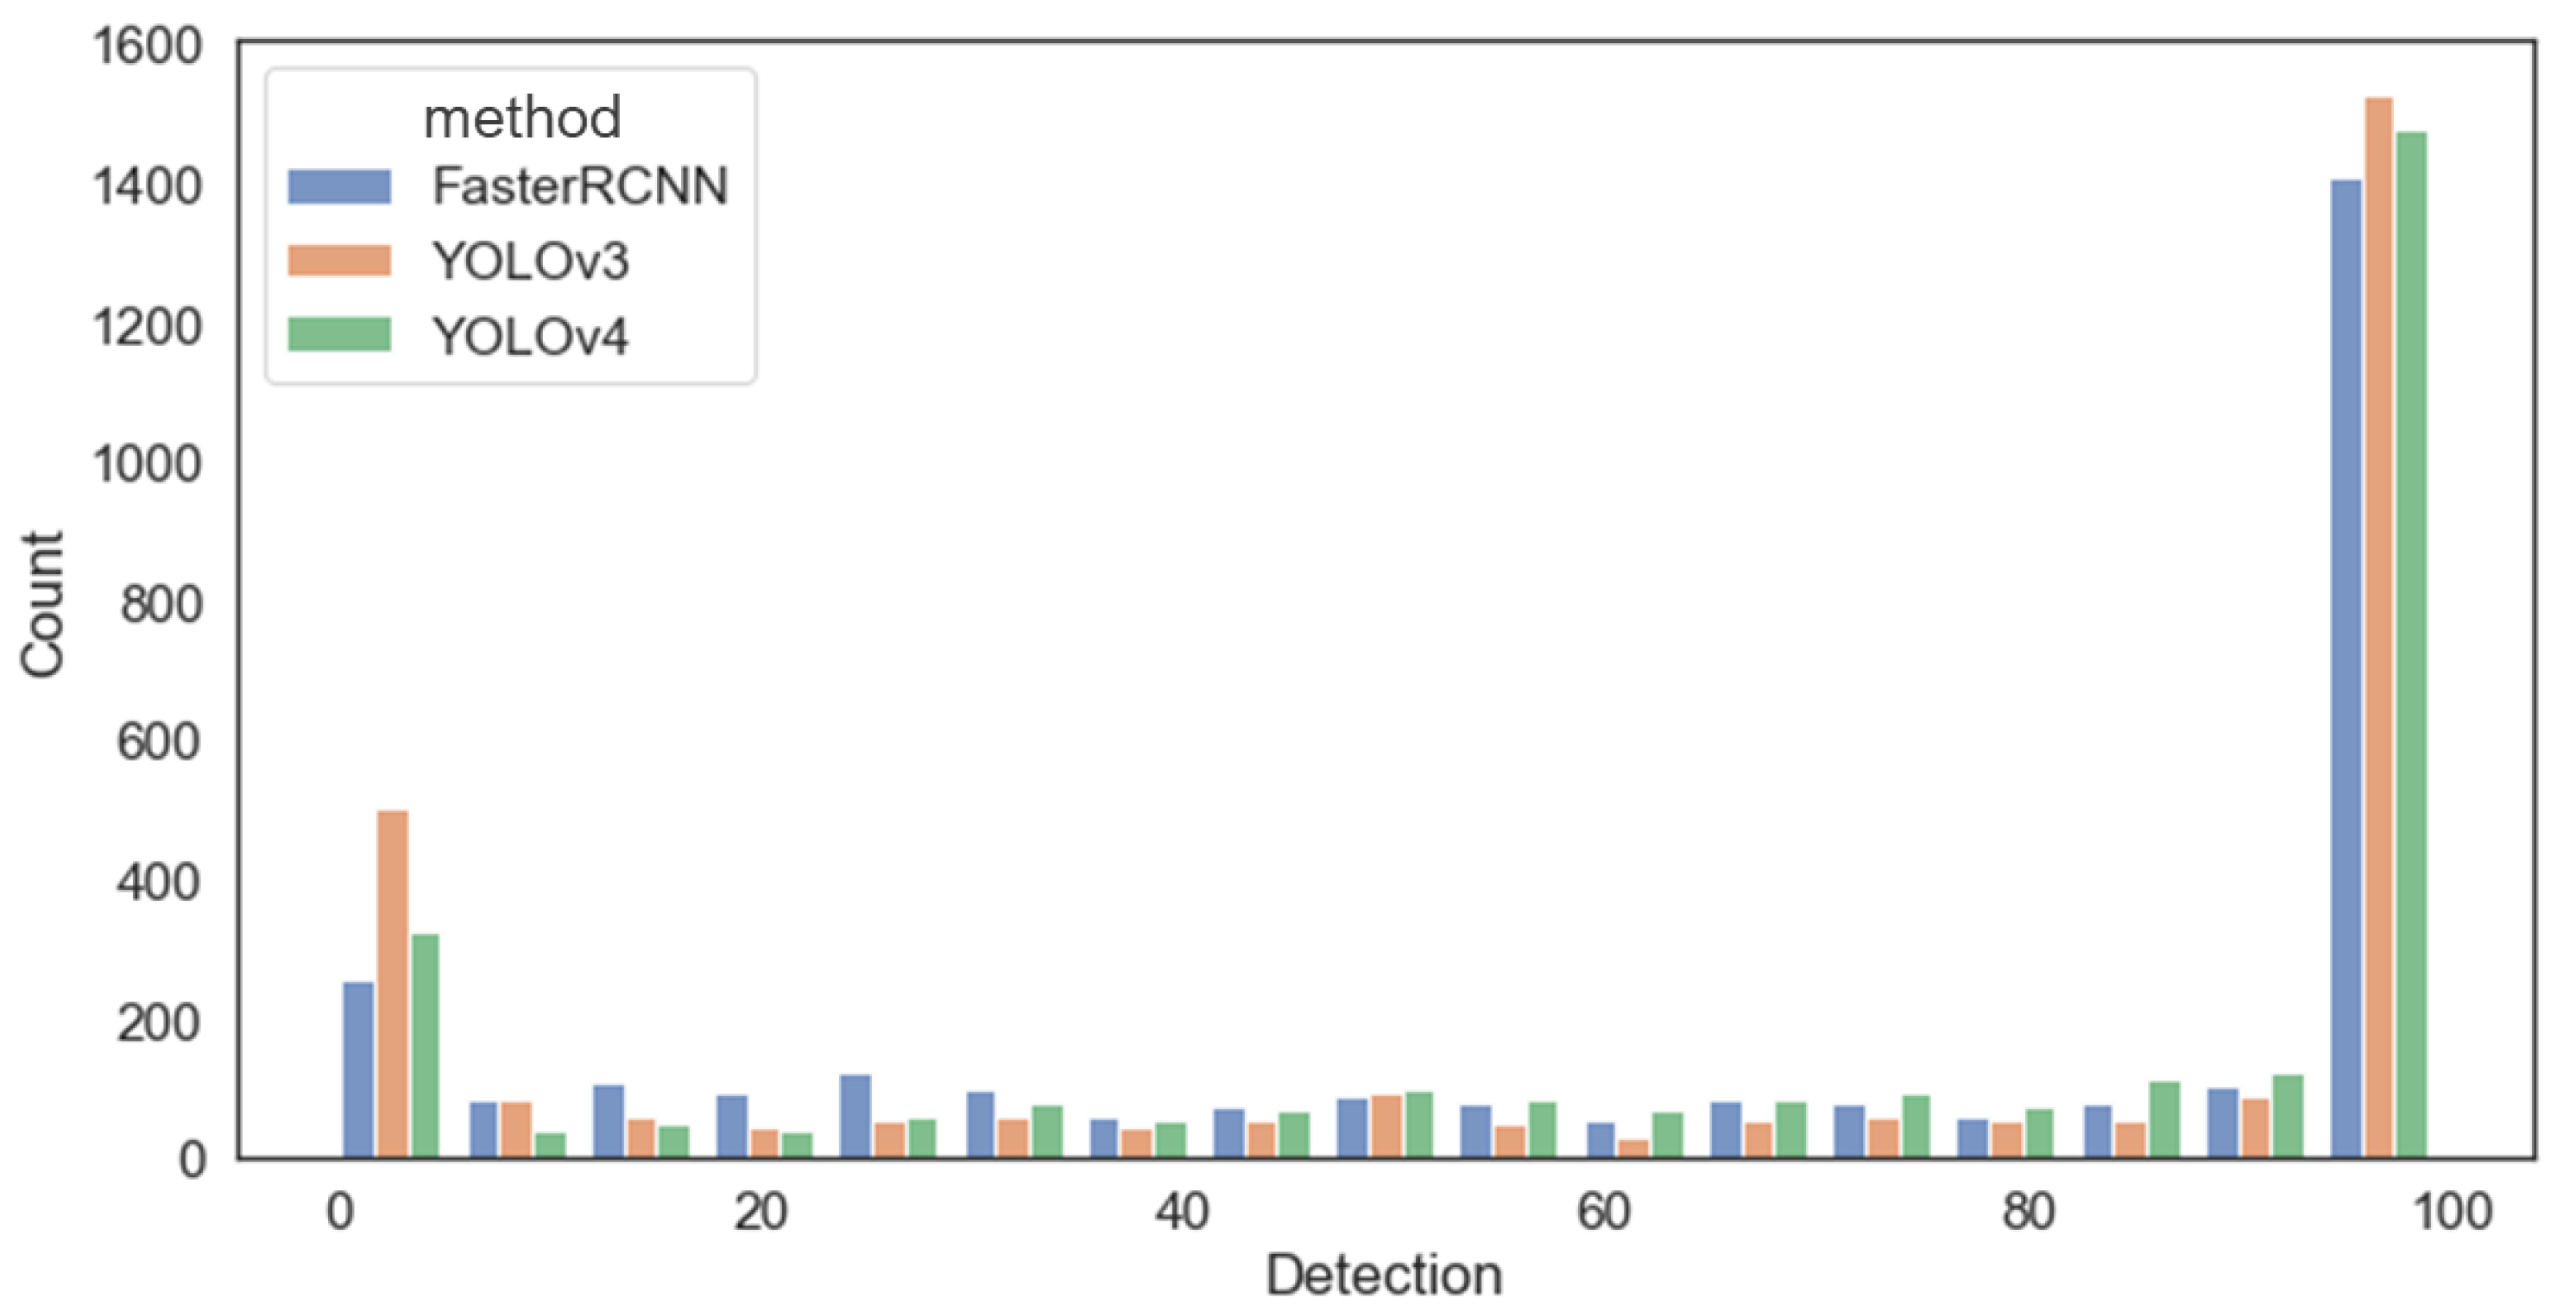
Figure 6 shows the detection distribution according to the amount of data. YOLOv3 had the largest amount of data with a 100% detection rate and the largest amount of data with a 0% detection rate. On average, FasterRCNN’s detection rate was 68.62%, YOLOv3′s was 67.13%, and YOLOv4 had the highest detection rate at 72.01%.
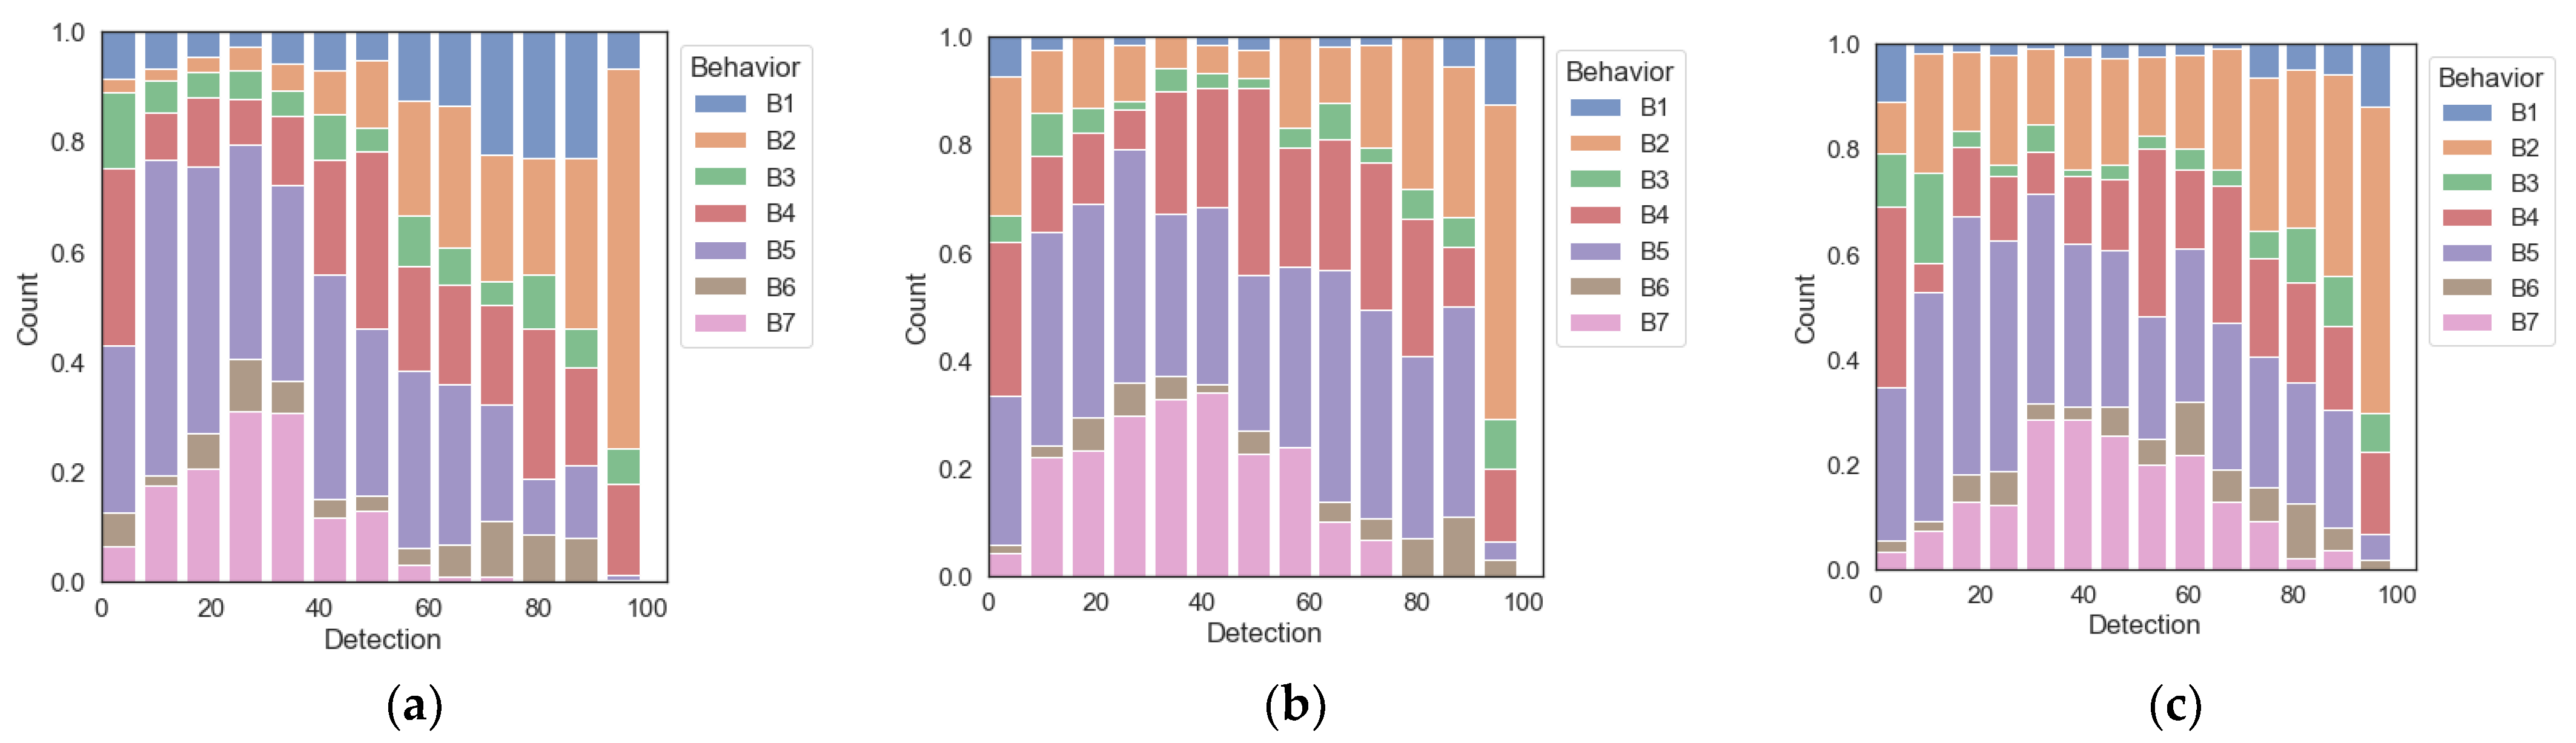
Figure 7 shows the detection distribution by behavior. Overall, the recognition rate was high when the dog performed B2 behavior, and the detection rate was the lowest when the dog performed B7 behavior.
Table 5 shows the performance evaluation results for behavior recognition with the object detection method using only video data. On average, the accuracy was 86.7%, and among the methods, YOLOv4 had the highest accuracy (89.2%).
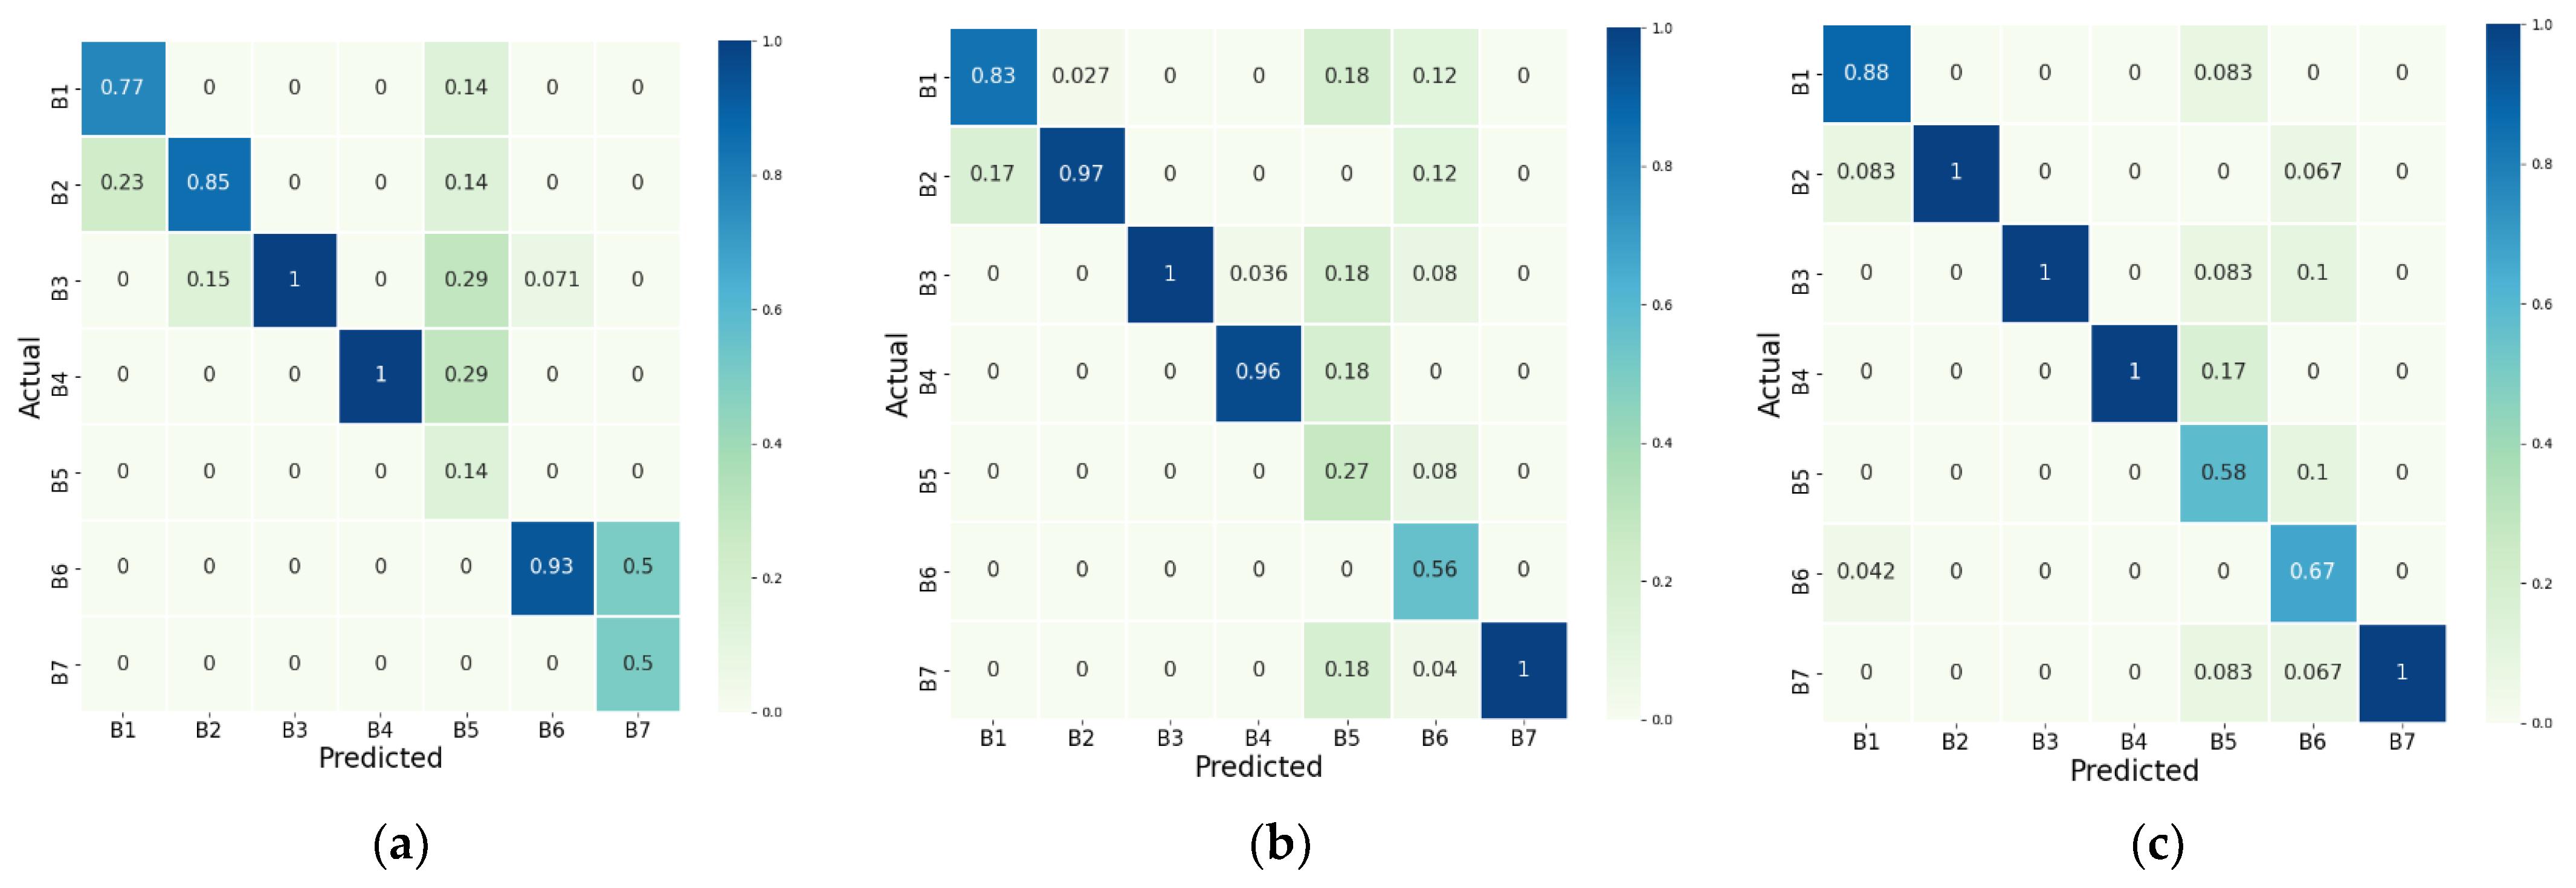
Figure 8 shows the fusion matrix of behavior recognition by behavior. In general, B1–B4, which did not involve movement, had a high recognition rate. In contrast, in the case of B7, since the B7 data of FasterRCNN were too small compared to that of YOLOv3 and YOLOv4, it was judged that YOLOv3 and YOLOv4 were relatively well aware of running, whereas FasterRCNN was not.
4.2.2. Behavior Recognition Using Sensor Data
Experiments on sensor data were conducted by combining the five statistical features specified in
Section 3.2, and it was confirmed which combination of features had the greatest effect on performance.
Table 6 shows the experimental results for the case where no features were selected (None), those for the single-feature case, and the ten feature combinations that showed the best performance among multiple features from a total of 32 feature combinations.
As a single feature, performed well, but when combined with other features, was the best complementary feature. In contrast, degraded performance or did not affect performance. In the case of multiple features, since the degree of complementation between features was different, there was a difference in performance even when features were similarly combined; however, the performance was generally improved when was included. As a result, the combination of multiple features elicited better performance than the result using only raw data. Among them, the combination that showed the best performance was , which showed an accuracy of 56.3%.
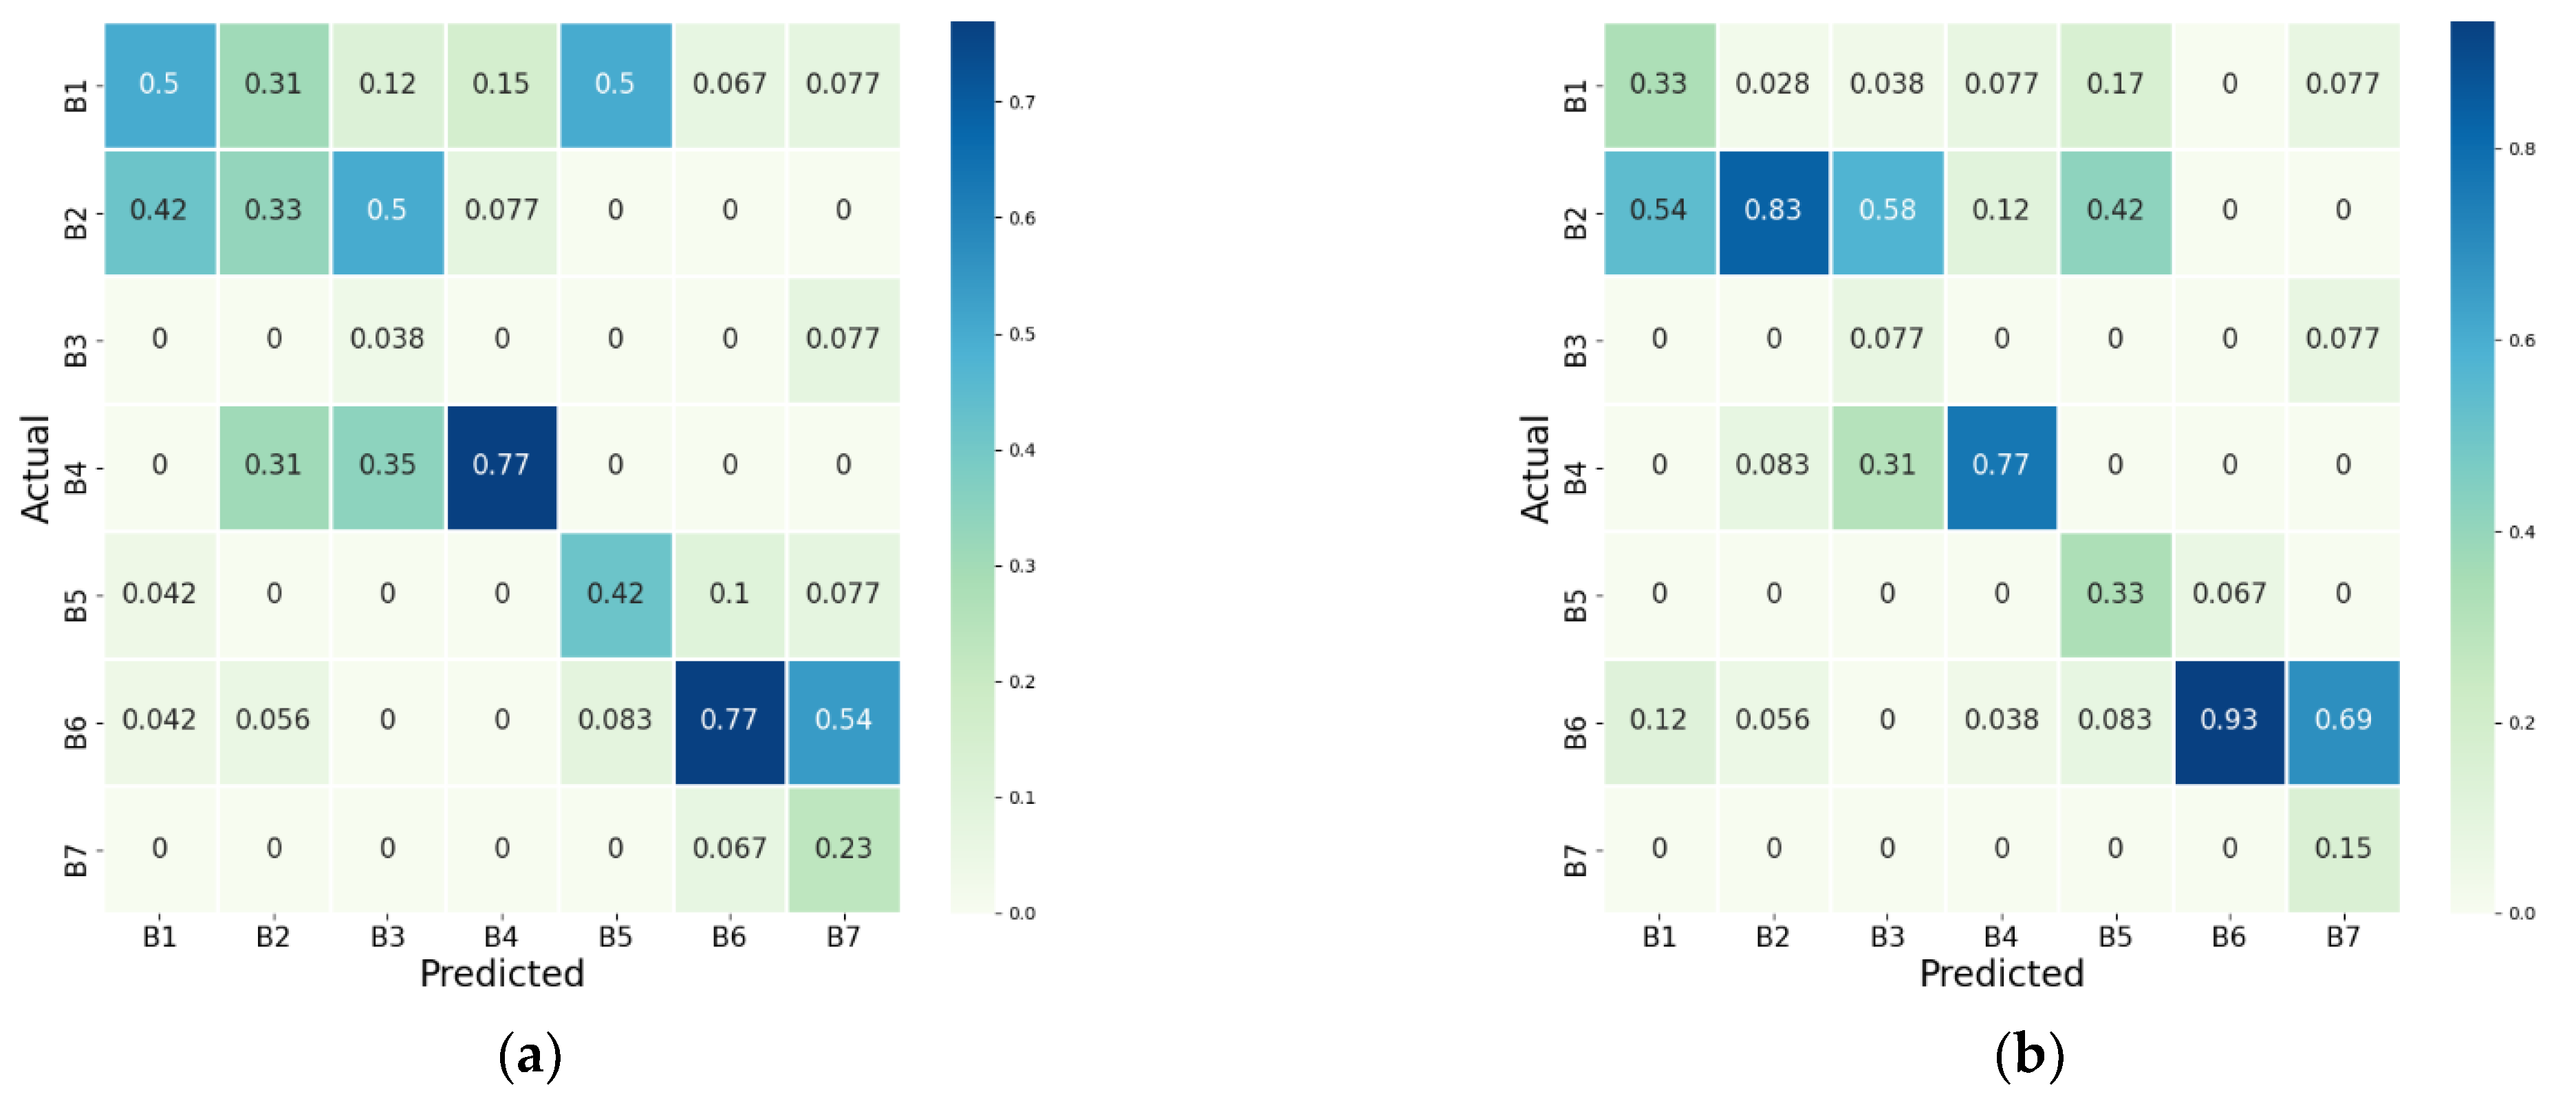
Figure 9 shows the confusion matrix for None with no features selected and for the best feature combination in
Table 6. The sensor data showed that behavior recognition for B4 and B6 was well achieved, and it was confirmed that the recognition rate for B2 was improved when statistical features were included. Since the device worn around the neck was sensitive to the movement of the head, it is judged that the recognition rate was high because these behaviors feature fewer head movements than other behaviors.
4.2.3. Dog Behavior Recognition Based on Multimodal Data
The performance evaluation of the fusion model was performed on the fusion models CNN, LSTM, and CNN-LSTM for each dog detection method. In addition, a model that only concatenated the extracted features for each set of data were added to the performance evaluation to compare the results of single data and multimodal data models.
Experimental results are shown in
Table 7. Compared with the performance when using only a single data type in
Section 4.2.1 and
Section 4.2.2, it was confirmed that the average performance was improved by about 90.3% when the data were integrated. Among the fusion models for each dog detection method, the CNN-LSTM model showed higher accuracy than other fusion models. In particular, in the case of YOLOv4, which had the highest behavior recognition accuracy using video data, the CNN-LSTM model showed the highest accuracy at about 93.4%. The performance of the CNN model and the LSTM model is expected to improve slightly if they had as deep layers as the CNN-LSTM model.
Figure 10 shows the confusion matrix for each fusion model. The recognition rate for all behaviors is improved overall compared to the case of using single data. However, among them, the behavior recognition rate for B5 and B7 is slightly low. FasterRCNN, which showed a very lower recognition rate for B5 and B7 when using only video data, improved when using multimodal data, but still shows low numbers as shown in
Figure 10a. Even with the CNN-LSTM model, FasterRCNN had a low behavior recognition rate for B5 and B7 as shown in
Figure 10d, whereas YOLOv3 and YOLOv4 significantly improved the behavior recognition rate with the CNN-LSTM model as shown in
Figure 10e,f.
Since some aspects of sniffing may look similar to standing or walking, and walking has similar appearances to running except for speed, it is thought that detailed feature extraction is necessary to improve the accuracy of behavior recognition. Since the model structure proposed in this paper is not an optimal model for behavior recognition of dogs, if the model is improved, such as by increasing the layer depth or finding an appropriate hyperparameter, the recognition rate of all behaviors will probably be improved.
5. Conclusions
This paper proposed a multimodal data-based behavior recognition of dogs by fusing video data from a camera and sensor data (accelerator, gyroscope) from a wearable device. The collected data were about dogs, and seven types of behavior (standing, sitting, lying with raised head, lying without raised head, walking, sniffing, and running) were recognized after preprocessing according to the characteristics of each data type.
In the case of video data, FasterRCNN, YOLOv3, and YOLOv4, which are representative object detection methods, were used to identify the movement area of dogs. Among them, YOLOv4 had the highest dog detection rate and the best behavior recognition performance. Because behavior recognition was performed by extracting the detected area, the object detection rate and the accuracy of behavior recognition had a high correlation. In the case of sensor data, accelerator and gyroscope data were collected using a wearable device manufactured based on Arduino, and various statistical feature extraction methods were used. When two or more features were used rather than a single feature, high performance was generally achieved, and the combination of the features with the highest performance among them—the mean, variance, standard deviation, amplitude, and skewness—were all combined. Finally, multimodal data-based CNN, LSTM, and CNN-LSTM models were used to evaluate and compare performance with existing single data-based models. When the video data and the sensor data were fused, the average accuracy was about 90.3%, and the multimodal data-based models showed improved performance over that of the single data-based models. In particular, when the CNN-LSTM model was used, the performance was good, and the case of dog detection using YOLOv4 was the highest at about 93.4%.
In the process of carrying out this study, it was confirmed that there was a difference in the recognition rate for each behavior in the results of the case where only video data were used compared to the case where only sensor data were used. In the case of video data, the recognition rate was high when there was no movement, such as standing, sitting, lying with raised head, and lying without raised head. The recognition rate for running was also high. Unlike sniffing and walking, running generally does not feature di-rection change within 4 s, so it is probably judged that the feature was differentiated from other behaviors. In the case of sensor data, the recognition rate for sitting, lying without raised head, and walking was high, and the behaviors with little change in the head movement were well recognized. Finally, the recognition rate for all behaviors overall increased as the two data complemented each other for the multimodal data-based models.
Since optimizing the model was not the purpose of the study, we proceeded with one dog, but in the future, data collection according to breed and size is required to reflect the properties of various dogs. This study can be applied for the treatment or health monitoring of dogs, and among them, it is expected to provide a simple way to estimate the amount of activity. Various diseases such as obesity and depression can be identified through changes in the activity level of dogs. To this end, if the data collection cycle is changed or the model layer (number of layers, appropriate hyperparameters, etc.) is changed, then the performance can be improved compared to the results found in this study. In the future, to improve the accuracy of dog behavior recognition, we plan to find an optimal fusion model and expand the behavior types.
Author Contributions
Conceptualization, J.K. and N.M.; methodology, J.K. and N.M.; software, J.K.; validation, J.K.; formal analysis, J.K. and N.M.; investigation, J.K. and N.M.; resources, J.K.; data curation, J.K. and N.M.; writing—original draft preparation, J.K.; writing—review and editing, J.K. and N.M.; visualization, J.K.; supervision, N.M.; project administration, N.M.; funding acquisition, N.M. All authors have read and agreed to the published version of the manuscript.
Funding
This research was supported by the National Research Foundation of Korea (NRF) grant funded by the Korea government (MSIT) (No. 2021R1A2C2011966).
Institutional Review Board Statement
The animal study protocol was approved by the Institutional Animal Care and Use Committee of Hoseo University IACUC (protocol code: HSUIACUC-22-006(2)).
Informed Consent Statement
Not applicable.
Data Availability Statement
The data presented in this study are available from the corresponding author upon request. The data are not publicly available due to privacy and ethical concerns.
Conflicts of Interest
The authors declare no conflict of interest.
References
- Chambers, R.D.; Yoder, N.C.; Carson, A.B.; Junge, C.; Allen, D.E.; Prescott, L.M.; Bradley, S.; Wymore, G.; Lloyd, K.; Lyle, S. Deep Learning Classification of Canine Behavior Using a Single Collar-Mounted Accelerometer: Real-World Validation. Animals 2021, 11, 1549. [Google Scholar] [CrossRef] [PubMed]
- Griffies, J.D.; Zutty, J.; Sarzen, M.; Soorholtz, S. Wearable Sensor Shown to Specifically Quantify Pruritic Behaviors in Dogs. BMC Vet. Res. 2018, 14, 124. [Google Scholar] [CrossRef] [PubMed]
- Bleuer-Elsner, S.; Zamansky, A.; Fux, A.; Kaplun, D.; Romanov, S.; Sinitca, A.; Masson, S.; van der Linden, D. Computational Analysis of Movement Patterns of Dogs with ADHD-Like Behavior. Animals 2019, 9, 1140. [Google Scholar] [CrossRef] [Green Version]
- Stephan, G.; Leidhold, J.; Hammerschmidt, K. Pet Dogs Home Alone: A Video-Based Study. Appl. Anim. Behav. Sci. 2021, 244, 105463. [Google Scholar] [CrossRef]
- Colpoys, J.; DeCock, D. Evaluation of the FitBark Activity Monitor for Measuring Physical Activity in Dogs. Animals 2021, 11, 781. [Google Scholar] [CrossRef] [PubMed]
- Nweke, H.F.; Teh, Y.W.; Mujtaba, G.; Alo, U.R.; Al-garadi, M.A. Multi-Sensor Fusion Based on Multiple Classifier Systems for Human Activity Identification. Hum. Cent. Comput. Inf. Sci. 2019, 9, 34. [Google Scholar] [CrossRef] [Green Version]
- Dang, L.M.; Min, K.; Wang, H.; Piran, M.J.; Lee, C.H.; Moon, H. Sensor-Based and Vision-Based Human Activity Recognition: A Comprehensive. Survey Pattern Recognit. 2020, 108, 107561. [Google Scholar] [CrossRef]
- Wang, Y.; Cang, S.; Yu, H. A Survey on Wearable Sensor Modality Centred Human Activity Recognition in Health Care. Expert Syst. Appl. 2019, 137, 167–190. [Google Scholar] [CrossRef]
- Ehatisham-Ul-Haq, M.; Javed, A.; Azam, M.A.; Malik, H.M.A.; Irtaza, A.; Lee, I.H.; Mahmood, M.T. Robust Human Activity Recognition Using Multimodal Feature-Level Fusion. IEEE Access 2019, 7, 60736–60751. [Google Scholar] [CrossRef]
- Khowaja, S.A.; Yahya, B.N.; Lee, S.L. CAPHAR: Context-Aware Personalized Human Activity Recognition Using Associative Learning in Smart Environments. Hum. Cent. Comput. Inf. Sci. 2020, 10, 35. [Google Scholar] [CrossRef]
- Gerina, F.; Massa, S.M.; Moi, F.; Reforgiato Recupero, D.; Riboni, D. Recognition of Cooking Activities through Air Quality Sensor Data for Supporting Food Journaling. Hum. Cent. Comput. Inf. Sci. 2020, 10, 27. [Google Scholar] [CrossRef]
- Steels, T.; Van Herbruggen, B.; Fontaine, J.; De Pessemier, T.; Plets, D.; De Poorter, E. Badminton Activity Recognition Using Accelerometer Data. Sensors 2020, 20, 4685. [Google Scholar] [CrossRef] [PubMed]
- Uddin, M.Z.; Hassan, M.M.; Alsanad, A.; Savaglio, C. A Body Sensor Data Fusion and Deep Recurrent Neural Network-Based Behavior Recognition Approach for Robust Healthcare. Inf. Fusion 2020, 55, 105–115. [Google Scholar] [CrossRef]
- Cicceri, G.; De Vita, F.; Bruneo, D.; Merlino, G.; Puliafito, A. A Deep Learning Approach for Pressure Ulcer Prevention Using Wearable Computing. Hum. Cent. Comput. Inf. Sci. 2020, 10, 5. [Google Scholar] [CrossRef]
- Malik, S.; Ullah, I.; Kim, D.; Lee, K. Heuristic and Statistical Prediction Algorithms Survey for Smart Environments. J. Inf. Process. Syst. 2020, 16, 1196–1213. [Google Scholar] [CrossRef]
- Alshammari, H.; El-Ghany, S.A.; Shehab, A. Big IoT Healthcare Data Analytics Framework Based on Fog and Cloud Computing. J. Inf. Process. Syst. 2020, 16, 1238–1249. [Google Scholar] [CrossRef]
- Chen, R.C.; Saravanarajan, V.S.; Hung, H.T. Monitoring the Behaviours of Pet Cat Based on YOLO Model and Raspberry Pi. Int. J. Appl. Sci. Eng. 2021, 18, 1–12. [Google Scholar] [CrossRef]
- Wutke, M.; Schmitt, A.O.; Traulsen, I.; Gültas, M. Investigation of Pig Activity Based on Video Data and Semi-Supervised Neural Networks. AgriEngineering 2020, 2, 581–595. [Google Scholar] [CrossRef]
- Kearney, S.; Li, W.; Parsons, M.; Kim, K.I.; Cosker, D. RGBD-Dog: Predicting Canine Pose from RGBD Sensors. In Proceedings of the 2020 IEEE/CVF Conference on Computer Vision and Pattern Recognition (CVPR), Seattle, WA, USA, 16 June 2020; pp. 8333–8342. [Google Scholar]
- Pereira, T.D.; Aldarondo, D.E.; Willmore, L.; Kislin, M.; Wang, S.S.H.; Murthy, M.; Shaevitz, J.W. Fast Animal Pose Estimation Using Deep Neural Networks. Nat. Methods 2019, 16, 117–125. [Google Scholar] [CrossRef]
- Zamansky, A.; van der Linden, D.; Hadar, I.; Bleuer-Elsner, S. Log My Dog: Perceived Impact of Dog Activity Tracking. Computer 2019, 52, 35–43. [Google Scholar] [CrossRef] [Green Version]
- van der Linden, D.; Zamansky, A.; Hadar, I.; Craggs, B.; Rashid, A. Buddy’s Wearable Is Not Your Buddy: Privacy Implications of Pet Wearables. IEEE Secur. Priv. 2019, 17, 28–39. [Google Scholar] [CrossRef]
- Aich, S.; Chakraborty, S.; Sim, J.S.; Jang, D.J.; Kim, H.C. The Design of an Automated System for the Analysis of the Activity and Emotional Patterns of Dogs with Wearable Sensors Using Machine Learning. Appl. Sci. 2019, 9, 4938. [Google Scholar] [CrossRef] [Green Version]
- Ladha, C.; Hammerla, N.; Hughes, E.; Olivier, P.; Ploetz, T. Dog’s Life: Wearable Activity Recognition for Dogs. In Proceedings of the 2013 ACM International Joint Conference on Pervasive and Ubiquitous Computing, Zurich, Switzerland, 8 September 2013; pp. 415–418. [Google Scholar]
- Kumpulainen, P.; Cardó, A.V.; Somppi, S.; Törnqvist, H.; Väätäjä, H.; Majaranta, P.; Gizatdinova, Y.; Hoog Antink, C.; Surakka, V.; Kujala, M.V.; et al. Dog Behaviour Classification with Movement Sensors Placed on the Harness and the Collar. Appl. Anim. Behav. Sci. 2021, 241, 105393. [Google Scholar] [CrossRef]
- Jo, Y.H.; Lee, H.J.; Kim, Y.H. Implementation of a Classification System for Dog Behaviors using YOLI-based Object Detection and a Node.js Server. J. Inst. Converg. Signal Process. 2020, 21, 29–37. [Google Scholar] [CrossRef]
- Liu, Y.; Sun, P.; Wergeles, N.; Shang, Y. A Survey and Performance Evaluation of Deep Learning Methods for Small Object Detection. Expert Syst. Appl. 2021, 172, 114602. [Google Scholar] [CrossRef]
- Nguyen, N.D.; Do, T.; Ngo, T.D.; Le, D.D. An Evaluation of Deep Learning Methods for Small Object Detection. J. Electr. Comput. Eng. 2020, 2020, 1–18. [Google Scholar] [CrossRef]
- Bochkovskiy, A.; Wang, C.Y.; Liao, H.Y.M. YOLOv4: Optimal Speed and Accuracy of Object Detection. arXiv 2020, arXiv:2004.10934. [Google Scholar]
Figure 1.
Process of dog behavior recognition based on multimodal data.
Figure 1.
Process of dog behavior recognition based on multimodal data.
Figure 2.
Overall model structure based on the multimodal data for dog behavior recognition.
Figure 2.
Overall model structure based on the multimodal data for dog behavior recognition.
Figure 3.
Model structures of CNN, LSTM, and CNN-LSTM for feature fusion.
Figure 3.
Model structures of CNN, LSTM, and CNN-LSTM for feature fusion.
Figure 4.
The process of collecting sensor data from a manufactured wearable device.
Figure 4.
The process of collecting sensor data from a manufactured wearable device.
Figure 5.
Result of dog detection for “sitting”: (a) FasterRCNN; (b) YOLOv3; (c) YOLOv4.
Figure 5.
Result of dog detection for “sitting”: (a) FasterRCNN; (b) YOLOv3; (c) YOLOv4.
Figure 6.
Distribution of detection by method according to the amount of data.
Figure 6.
Distribution of detection by method according to the amount of data.
Figure 7.
Distribution of detection by dog behavior per method: (a) FasterRCNN; (b) YOLOv3; (c) YOLOv4.
Figure 7.
Distribution of detection by dog behavior per method: (a) FasterRCNN; (b) YOLOv3; (c) YOLOv4.
Figure 8.
Confusion matrix of behavior recognition by dog detection methods using video data: (a) FasterRCNN; (b) YOLOv3; (c) YOLOv4. The bluer the cell, the higher the accuracy of dog recognition.
Figure 8.
Confusion matrix of behavior recognition by dog detection methods using video data: (a) FasterRCNN; (b) YOLOv3; (c) YOLOv4. The bluer the cell, the higher the accuracy of dog recognition.
Figure 9.
Confusion matrix of behavior recognition by selected features using sensor data: (a) Confusion matrix with no selected features; (b) Confusion matrix with selected features of .
Figure 9.
Confusion matrix of behavior recognition by selected features using sensor data: (a) Confusion matrix with no selected features; (b) Confusion matrix with selected features of .
Figure 10.
Confusion matrix of behavior recognition by fusion models based on multimodal data: (a) Only concatenate model with FasterRCNN; (b) Only concatenate model with YOLOv3; (c) Only concatenate model with YOLOv4; (d) CNN-LSTM model with FasterRCNN; (e) CNN-LSTM model with YOLOv3; (f) CNN-LSTM model with YOLOv4.
Table 1.
Summary of dog behavior recognition studies using a camera or wearable device.
Table 1.
Summary of dog behavior recognition studies using a camera or wearable device.
| Paper | Using Video Data | Using Sensor Data | Number of Behaviors | Machine Learning | Deep Learning |
|---|
| Position | Acc | Gyro |
|---|
| [1] | | Neck | O | | 10 | | O |
| [2] | | Neck | O | | 3 | O | |
| [23] | | Neck
Tail | O | O | 7 | O | |
| [25] | | Neck
Back | O | O | 7 | O | |
| [26] | O | | | | 10 | | O |
| This paper | O | Neck | O | O | 7 | | O |
Table 2.
Dog behavior to be recognized.
Table 2.
Dog behavior to be recognized.
| Behavior Code | Behavior | Description |
|---|
| B1 | Standing | Standing still with all four legs touching the ground. |
| B2 | Sitting | The buttocks touch the floor without the stomach touching the floor. |
| B3 | Lying with raised head | Lying down on the floor with their side, back, or stomach on the floor with their head raised. |
| B4 | Lying without raised head | Lying down the floor with their side, back, or stomach on the floor without raising their head. |
| B5 | Walking | Moving forward with four legs moving (three legs touching the ground). |
| B6 | Sniffing | Moving or stopping with light head movement and the nose close to the ground. |
| B7 | Running | Moving forward with legs moving simultaneously at a faster speed than walking. |
Table 3.
Experimental specifications.
Table 3.
Experimental specifications.
| Metric | Description |
|---|
| CPU | Intel Core i7-8700K |
| GPU | NVIDIA GeForce RTX 3080 |
| RAM | 32 GB |
| Python | 3.8 |
| TensorFlow | 2.4.1 |
| Keras | 2.5.0 |
Table 4.
Experimental dataset.
Table 4.
Experimental dataset.
| Behavior | FasterRCNN | YOLOv3 | YOLOv4 |
|---|
| Training | Test | Training | Test | Training | Test |
|---|
| Standing | 89 | 22 | 96 | 24 | 98 | 24 |
| Sitting | 132 | 34 | 144 | 37 | 142 | 36 |
| Lying with raised head | 99 | 25 | 121 | 30 | 105 | 26 |
| Lying without raised head | 109 | 27 | 111 | 28 | 103 | 26 |
| Sniffing | 29 | 7 | 44 | 11 | 48 | 12 |
| Walking | 57 | 14 | 101 | 25 | 118 | 30 |
| Running | 8 | 2 | 31 | 8 | 54 | 13 |
| Total | 523 | 131 | 648 | 163 | 668 | 167 |
Table 5.
Results of behavior recognition performance evaluation by dog detection methods using video data.
Table 5.
Results of behavior recognition performance evaluation by dog detection methods using video data.
| Dog Detection Method | Accuracy | Precision | Recall | F-Score |
|---|
| FasterRCNN | 86.3% | 0.91 | 0.86 | 0.88 |
| YOLOv3 | 84.7% | 0.9 | 0.85 | 0.86 |
| YOLOv4 | 89.2% | 0.92 | 0.89 | 0.9 |
| Average | 86.7% | 0.91 | 0.87 | 0.88 |
Table 6.
Results of behavior recognition performance evaluation by selected features using sensor data.
Table 6.
Results of behavior recognition performance evaluation by selected features using sensor data.
| Selected Features | Feature Length | Accuracy | Precision | Recall | F-Score |
|---|
| None | 6 | 0.455 | 0.56 | 0.46 | 0.49 |
| 12 | 0.383 | 0.6 | 0.38 | 0.46 |
| 12 | 0.443 | 0.76 | 0.44 | 0.48 |
| 12 | 0.509 | 0.62 | 0.51 | 0.55 |
| 12 | 0.479 | 0.63 | 0.48 | 0.54 |
| 12 | 0.395 | 0.66 | 0.4 | 0.47 |
| 18 | 0.521 | 0.63 | 0.52 | 0.56 |
| 18 | 0.515 | 0.62 | 0.51 | 0.54 |
| 18 | 0.515 | 0.63 | 0.51 | 0.55 |
| 24 | 0.515 | 0.61 | 0.51 | 0.55 |
| 24 | 0.551 | 0.63 | 0.55 | 0.57 |
| 30 | 0.503 | 0.68 | 0.5 | 0.56 |
| 30 | 0.551 | 0.7 | 0.55 | 0.61 |
| 30 | 0.539 | 0.61 | 0.54 | 0.56 |
| 30 | 0.539 | 0.67 | 0.54 | 0.58 |
| 36 | 0.563 | 0.76 | 0.56 | 0.62 |
Table 7.
Results of behavior recognition performance evaluation by fusion models based on multimodal data.
Table 7.
Results of behavior recognition performance evaluation by fusion models based on multimodal data.
| Dog Detection Method | Fusion Model | Measure |
|---|
| Accuracy | Precision | Recall | F-Score |
|---|
| FasterRCNN | Only concatenate | 0.885 | 0.89 | 0.89 | 0.89 |
| CNN | 0.855 | 0.88 | 0.85 | 0.86 |
| LSTM | 0.885 | 0.91 | 0.89 | 0.89 |
| CNN-LSTM | 0.924 | 0.94 | 0.92 | 0.93 |
| YOLOv3 | Only concatenate | 0.908 | 0.92 | 0.91 | 0.91 |
| CNN | 0.926 | 0.94 | 0.93 | 0.93 |
| LSTM | 0.914 | 0.92 | 0.91 | 0.92 |
| CNN-LSTM | 0.920 | 0.93 | 0.92 | 0.92 |
| YOLOv4 | Only concatenate | 0.904 | 0.91 | 0.9 | 0.9 |
| CNN | 0.898 | 0.91 | 0.9 | 0.9 |
| LSTM | 0.880 | 0.9 | 0.88 | 0.88 |
| CNN-LSTM | 0.934 | 0.94 | 0.93 | 0.93 |
| Average | 0.903 | 0.92 | 0.90 | 0.91 |
| Publisher’s Note: MDPI stays neutral with regard to jurisdictional claims in published maps and institutional affiliations. |
© 2022 by the authors. Licensee MDPI, Basel, Switzerland. This article is an open access article distributed under the terms and conditions of the Creative Commons Attribution (CC BY) license (https://creativecommons.org/licenses/by/4.0/).


