Article

Research on the Coupled Modulation Transfer Function of the Discrete Sampling System with Hexagonal Fiber-Optic Imaging Bundles

1
Changchun Institute of Optics, Fine Mechanics and Physics, Chinese Academy of Sciences, Changchun 130033, China
2
Daheng College, University of Chinese Academy of Sciences, Beijing 100049, China
3
Center of Materials Science and Optoelectrics Engineering, University of Chinese Academy of Sciences, Beijing 100049, China
*
Authors to whom correspondence should be addressed.
Appl. Sci. 2022, 12(6), 3135; https://doi.org/10.3390/app12063135
Submission received: 21 January 2022 / Revised: 14 March 2022 / Accepted: 14 March 2022 / Published: 18 March 2022
(This article belongs to the Topic Optical and Optoelectronic Materials and Applications)

Abstract

:
In this study, we developed a numerical model of the coupled modulation transfer function (coupled-MTF) based on the discrete sampling system from the perspective of optical system imaging quality evaluation for coupled two-dimensional discrete sampling characteristics of the hexagonally aligned fiber-optic imaging bundles and CCD image elements. The results show that when the spatial frequency of the input target signal deviates from the Nyquist frequency by 1%, an increase in the number of fibers leads to a faster convergence of the oscillation of the coupled-MTF, and the coupled-MTF converges to a stable value when the number of fibers reaches 1000 × 1000. The deviation of the spatial frequency of the input target signal from the Nyquist frequency is within 1%, and the oscillatory convergence of the coupled-MTF accelerates with increasing deviation. The coupled-MTF oscillates with the deviation period of the wave peak of the input target signal from the initial position of the fiber center, and the theoretical oscillation spatial period is twice the fiber diameter. This study produces important guidelines for the selection of the number of fibers, input spatial frequency, and initial position deviation of the hexagonally arranged fiber imaging bundles.

1. Introduction

In recent years, fiber-optic imaging technology has seen increasing adoption in traditional photoelectric imaging systems [1]. The progress in the preparation process has made the fiber-optic imaging bundle more flexible than traditional imaging components, owing to significant advantages [2], especially in fields such as industrial use, medical scopes [3], military night vision [4], and space target surveillance. The hexagonal arrangement of the fiber-optic imaging bundle is of great interest to researchers because of its good stability, high transmission rate, high resolution [5], and other advantages.
The addition of a hexagonally aligned fiber-optic imaging bundle to an optoelectronic imaging system using a CCD as a detector can significantly improve the overall imaging performance of the system. The image quality of conventional optoelectronic imaging systems is evaluated based on the assumption that the optical system is a spatially invariant linear system, but hexagonally aligned fiber-optic imaging bundles, CCD devices, etc., do not have the characteristic of “space invariance”. W. Wittenstein [6] extended the definition of the local isoplanatic condition for discrete imaging systems, which allows the modulation transfer function (MTF) to be used for the image quality evaluation of discrete imaging systems in the frequency range satisfying the Nyquist criterion. Barnard et al. [7] derived the MTF based on the Fourier transform of the spectrum of the image being the spectrum of the object, to make an average transfer function curve for hexagonal gazing focal plane arrays with rectangular and hexagonal arrangements. Bingquan Chen [8] presented a method for measuring the modulation transfer function of line-array fiber-optic image bundles and obtained good agreement with theoretically computed results. I. Stamenov and team at the University of California, San Diego, designed an optical system with two-glass symmetric monocentric lenses coupled with fiber bundles [9] and developed an ultra-wide-angle camera using the structure of concentric lens-coupled fiber-optic panels with a camera field of view of 126° × 16°, a transfer function larger than 0.4 in the full field of view at 200 lp/mm, and a billion pixels [10]. Stephen J. [11] studied the methods to mitigate moiré artifacts and local obscuration of fiber bundles. Jianbo Shao [12] proposed a restoration method to remove honeycomb patterns and improve resolution for fiber bundle images. In China, research on fiber-optic image transfer has been ongoing. Bing-Hua Su [13] conducted a study on the equivalent evaluation of the MTF for a fiber-optic panel image transmission system and confirmed that the image transmission process of a fiber-optic panel is an integral sampling process. He Xu of the Changchun Institute of Optics studied the MTF of linear fiber bundles [14] and established a one-dimensional coupled discrete sampling model for the MTF [15]. Most of the existing research on the coupled-MTF of fiber-optic imaging bundles is based on the one-dimensional arrangement of physical models, and He Xu studied the coupled-MTF characteristics between square-arranged fiber bundles and area array CCD [16]. However, fiber-optic imaging bundles are arranged in hexagonal structures. In this paper, we establish the numerical model of the coupled-MTF between hexagonally aligned fiber-optic imaging bundles and rectangular image CCD, based on the special structure of hexagonally aligned fiber-optic imaging bundles, using the assumption of generalized null invariance and the definition of MTF, and analyze the relevant characteristics of the coupled-MTF. The numerical model of the coupled-MTF of a hexagonally aligned fiber-optic imaging bundle and a rectangular image element CCD was established, and the relevant characteristics of the coupled-MTF were analyzed.

2. Theory and Derivation

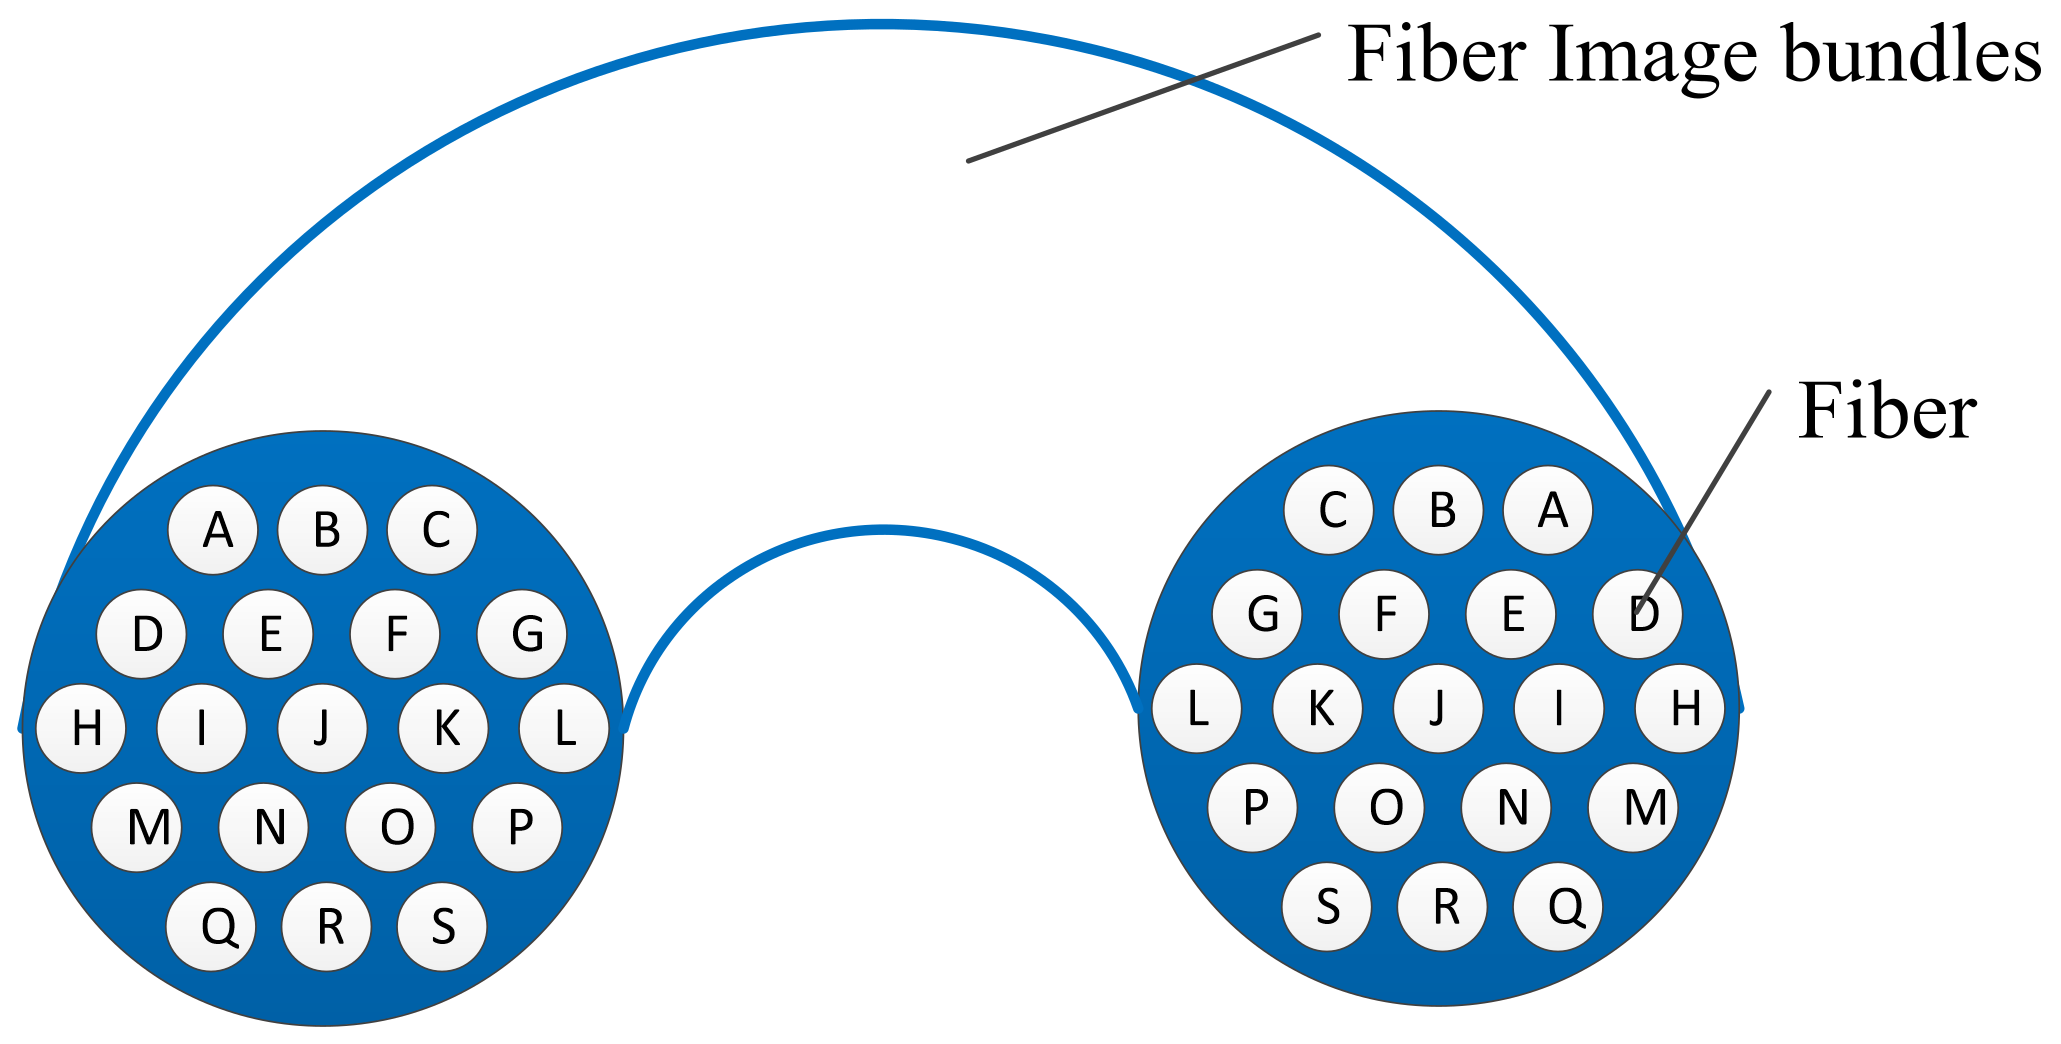
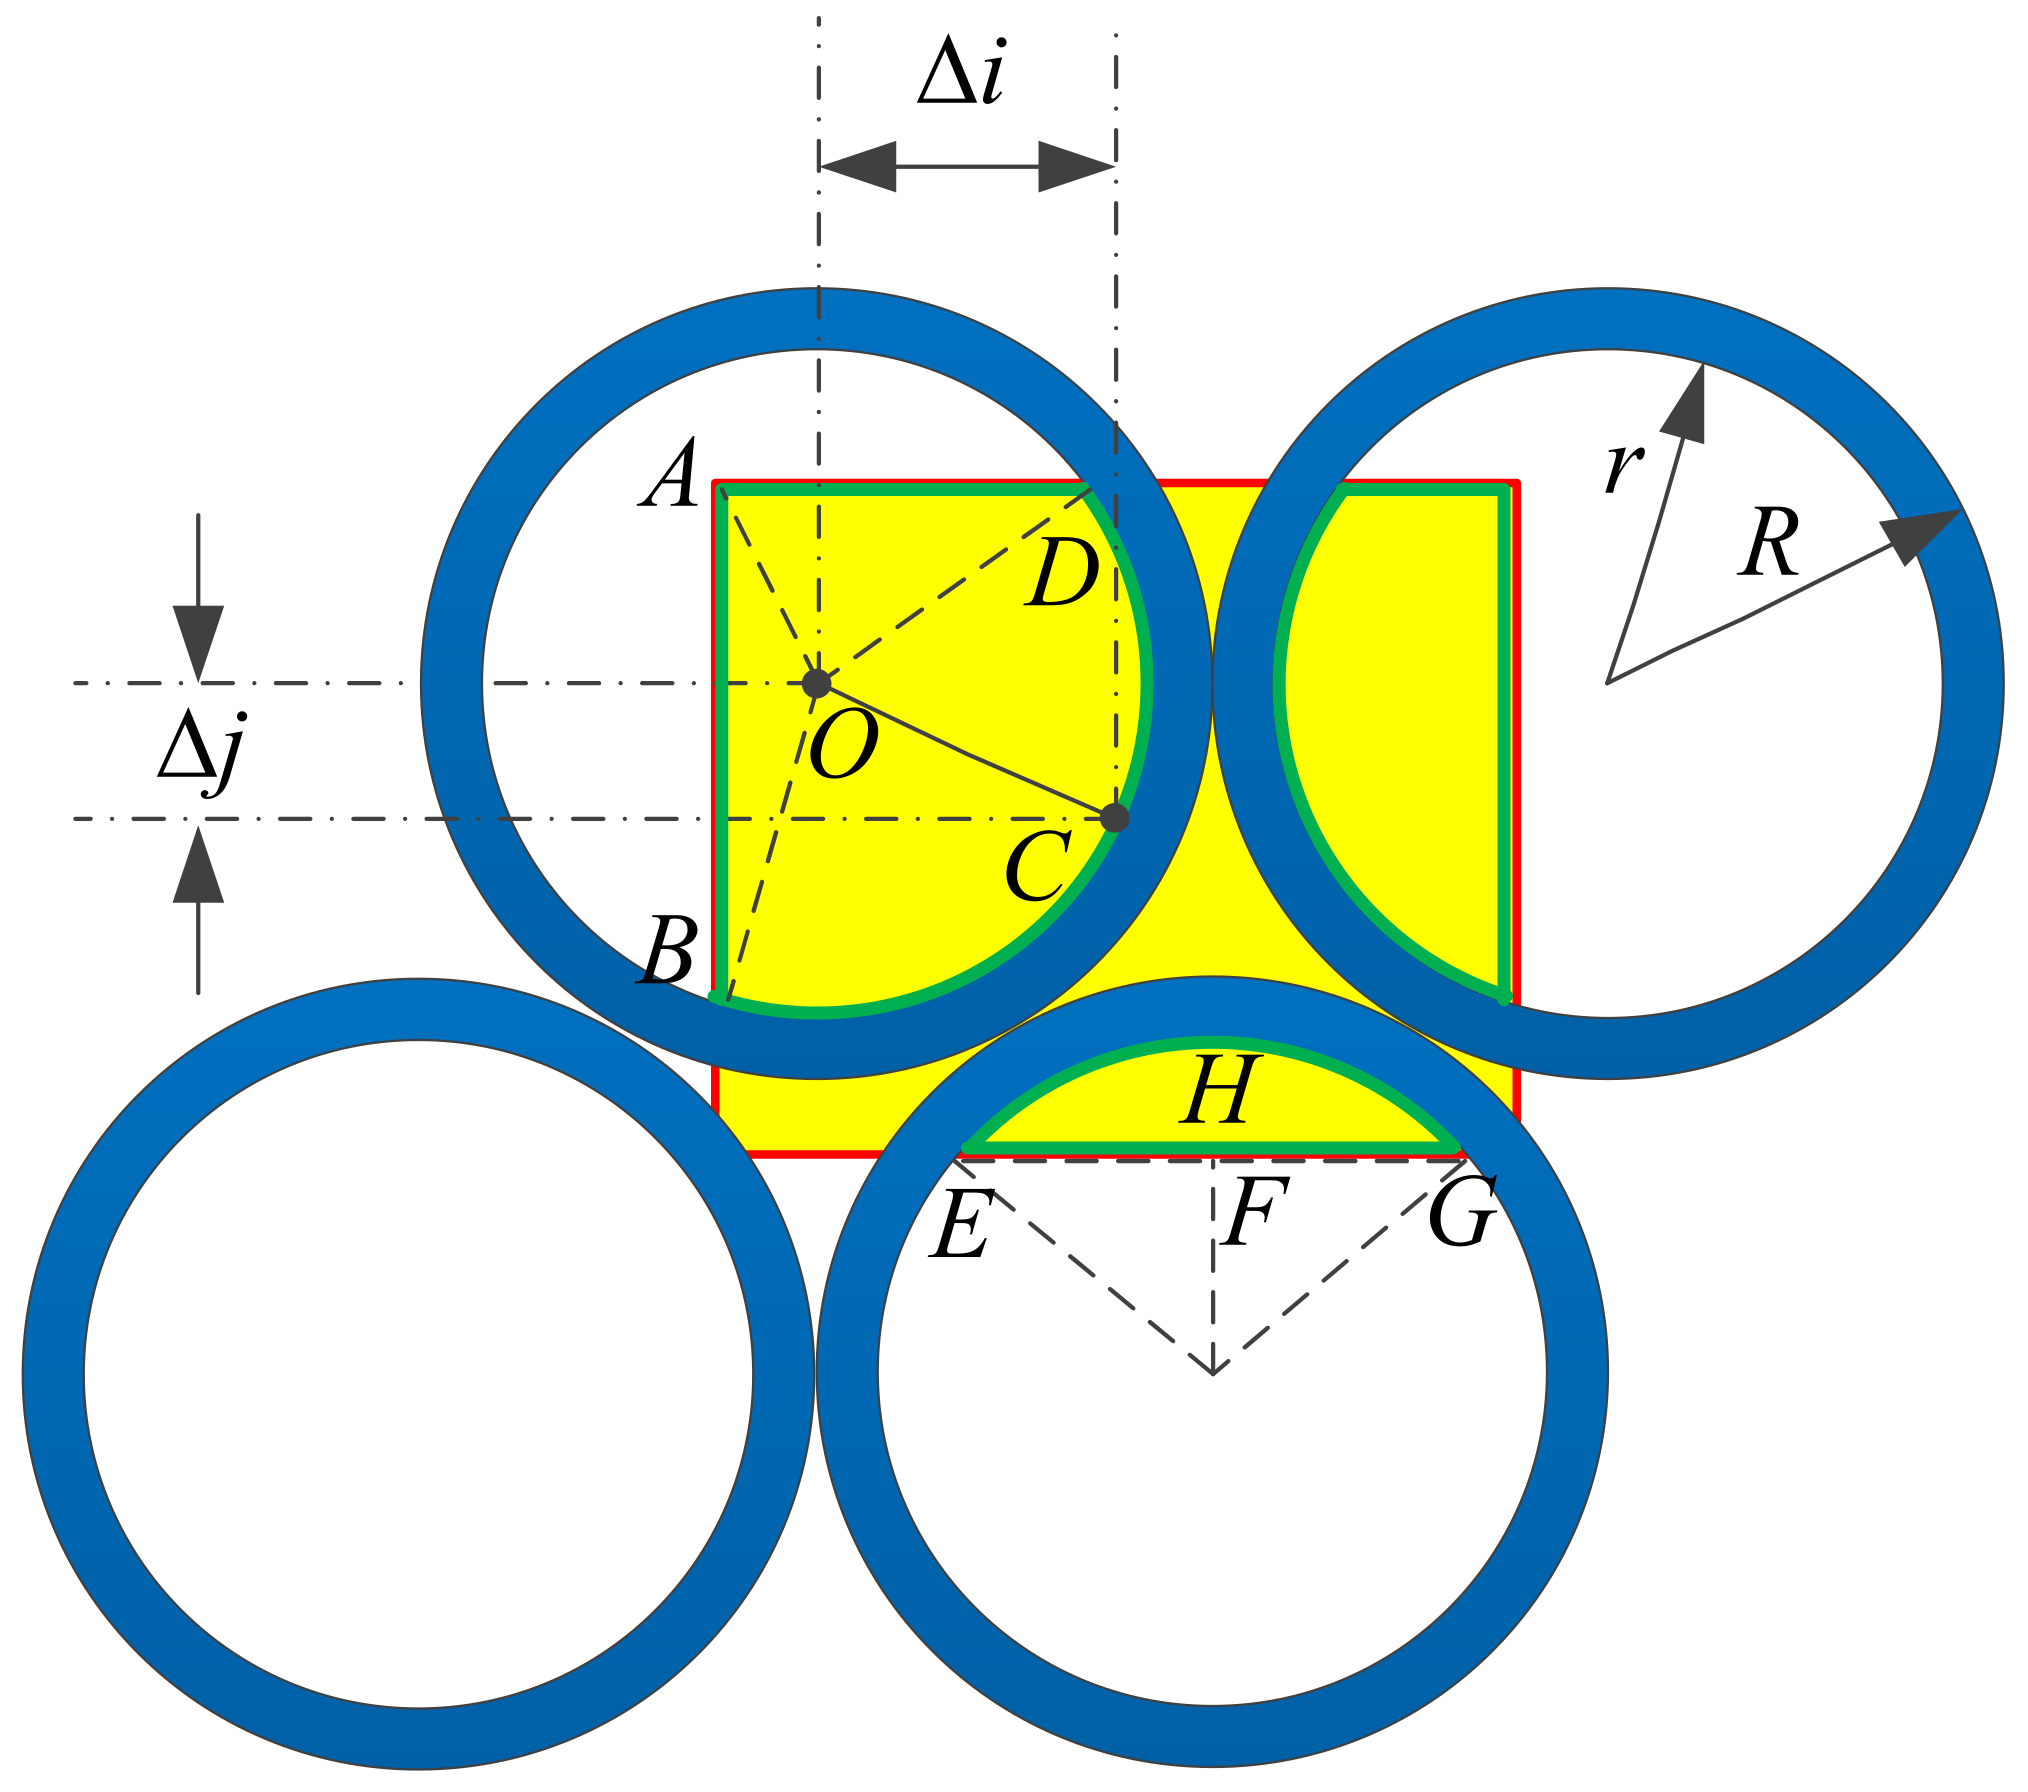
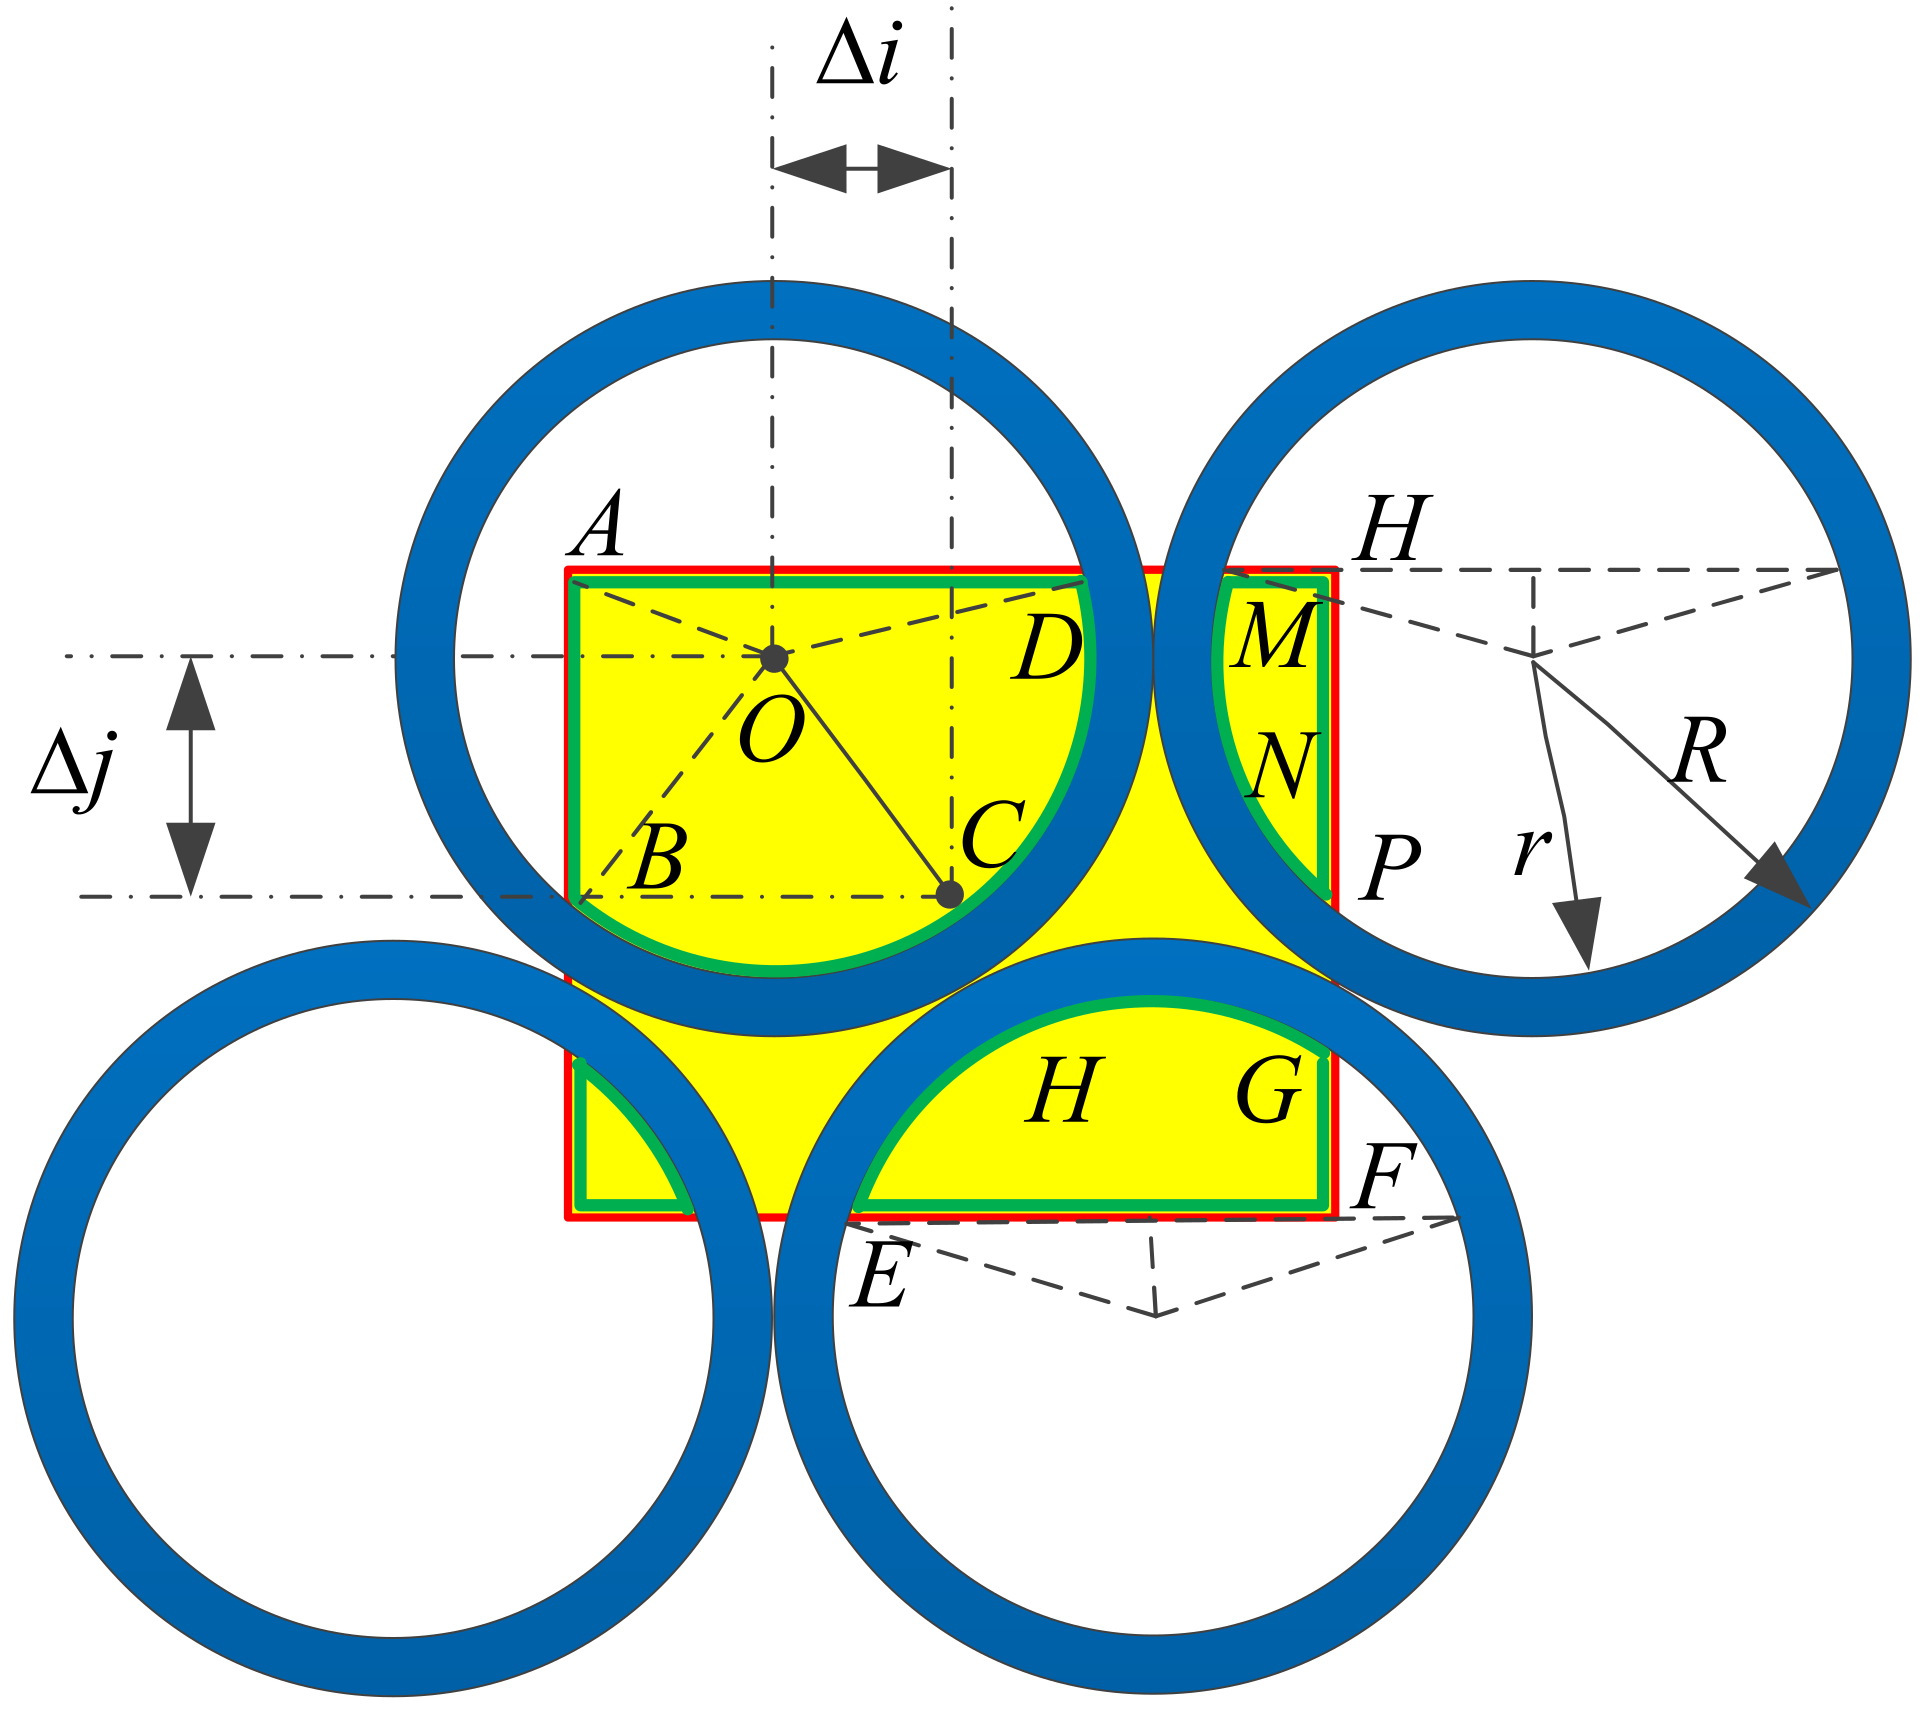
2.1. Image Transmission Mechanism of Hexagonally Aligned Fiber-Optic Imaging Bundles

A fiber-optic imaging bundle consisting of tens, or even hundreds, of thousands of multi-component glass fibers with thick cores and thin cladding was arranged identically on the input and output end faces, as shown in Figure 1. Most of the fiber filaments in the middle were kept free and loose to ensure flexibility. The ideal image transmission mechanism of the bundle [17] is that each fiber in the bundle has good optical insulation so that each fiber can transmit light independently. Each fiber at the input of the bundle can be regarded as a sampling hole, which independently transmits an image element with a certain brightness. The object is imaged on the input side of the bundle and divided into several image elements with different brightness levels by the sampling hole. Due to the correlation between the input and output sides of the bundle, all the images are transmitted separately by each fiber channel and are then recombined at the output into an image identical to the one at the input side.
The working principle of the hexagonally aligned fiber-optic imaging bundle is shown in Figure 2. The imaging system consists of a front visible imaging system, a relay imaging element (hexagonally aligned fiber-optic imaging bundle), a coupling objective lens, and an area array CCD.
The detection target was magnified to a certain extent and imaged into the incident face of the hexagonally arranged fiber-optic bundle through the telescope objective. Each fiber end can be regarded as a sampling hole. The image of the object is divided into a number of different brightness image elements by the sampling hole. The image elements transmit signals along the respective channels, which are recombined at the output end into an image consistent with that of the input end. The coupling objective lens couples the image from the fiber-optic beam onto the surface of the CCD sensor if the relative aperture of the area array fiber-optic beam is unchanged, and the fiber-optic core layer diameter is much larger than the Airy spot radius of the telescope system. The incident side of the hexagonally arranged fiber-optic beam is located on the image-side focal plane of the telescope objective, the outgoing side is located on the object-side focal plane of the coupling objective, and the surface CCD sensing plane is located on the image-side focal plane of the coupling objective.

2.2. Selection of CCD Image Elements and Sampling Direction

The hexagonally arranged fiber-optic bundles are arranged in a cascaded, cross-stacked manner, which results in a stable fiber bundle structure with less deformation on the end face and a high fill rate. The literature shows that at approximately 0.907 [17], the fill factor of a hexagonally aligned fiber bundle is higher than that of a squarely aligned fiber bundle with the same fiber material. That is, both the imaging quality and the optical image transmission rate of a hexagonally aligned fiber bundle are better under the same conditions. Figure 3a shows the cell structure of the hexagonal fiber bundle in which the fiber core radius is r, and the fiber outer radius is R. In the right-angled ∆ ABC, BC = 4R and AB = 2R, so we can obtain A C = 2 3 R . To achieve equal spacing sampling, a rectangular image element CCD with an image element size of 3 R is proposed. In general, r is less than or equal to 3 2 R .
Assuming r = 3 2 R , i.e., the single fiber core diameter divided by fiber diameter, the fiber core layer area over fiber area is 3 : 2 . Considering the effect of the filling factor, the light transmission area of the imaging bundle can be obtained as a factor of about 68% of the total area.
R. Drougard [18] classified the particular orientations of the hexagonally arranged fiber-optic imaging bundles, as shown in Figure 3b, by classifying the directions marked as solid lines in the figure as one category and the directions marked as dashed lines I I as another category, i.e., by adding an angular coordinate system to the beam, where the directions 0 , π 3 , and 2 π 3 are one category, and the directions π 6 , π 2 , and 5 π 6 are another category. O. Hadar et al. [19,20] confirmed the validity of using the function for sampling, i.e., when the input signal is a cosine target, the direction of 2D discrete sampling is not restricted, and any direction is possible. Combining the above two points, we studied the modulation transfer function of a hexagonally arranged fiber-optic imaging bundle coupled with a rectangular image element CCD based on the direction of I in Figure 3b.
The numerical model of a hexagonally arranged fiber-optic imaging bundle is simplified as follows:
  • Fiber-optic imaging bundles are manufactured using multi-component glass fiber, and unlike communication fiber, multi-component glass fiber has a large light im-aging area. In practice, the thickness of the single fiber cladding of the optical fiber bundle is controlled to be approximately 1/10 of the diameter of the fiber. In general, the light imaging area of various types of imaging bundles accounts for 60~90% of the total area of the image bundle. The attenuation of the 1000 m communication fiber at a wavelength of 1300 nm is approximately 1 dB, while the attenuation of image transmission of the multi-component glass fibers in the broad spectrum (400 nm~800 nm) beam is approximately 1 dB/m, and for a few tens of millimeters of the hexagonal fiber imaging bundle, the attenuation is much smaller than 1 dB, which is negligible;
  • The multi-component glass fiber introduces a glass cladding structure that substantially reduces the severe crosstalk effect between adjacent fibers. Light-absorbing materials are introduced into the structure of the optical fiber imaging element to attenuate the inter-fiber crosstalk and absorb stray light. In this study, it was assumed that there was no crosstalk between fibers and that each monofilament fiber transmitted image information independently and efficiently;
  • Broken filaments are undesirable, but likely to exist in fiber-optic bundles. A broken filament will block the path of a single filament, produce a black spot in the field of view, and even lose the target image information. If two or more adjacent fibers break to form a group of broken filaments, it causes even more distortion. In the actual process of fiber-optic beam production, the breakage rate should be <0.3‰ (small cross-sectional bundle) ~0.8‰ (large cross-sectional bundle), and the group breakage is restricted from appearing in the center of the beam;
  • Since both the imaging objective lens and the coupling objective lens shown in Figure 2 are conventional optics, the modulation transfer function of each field of view is assumed to be constant. Since the magnification error of the coupling objective may lead to image element scaling and introduce other coupling errors, the magnification of the coupling objective needs to be precisely adjusted and calibrated during the actual setup process to ensure the dimensional coupling between the fiber-optic imaging bundle and the CCD.

2.3. Numerical Modeling of the Coupled-MTF

In a classical system of unity magnification [17], the input signal is set to be a target with a cosine distribution of optical intensity, whose signal distribution function at the input end of the fiber bundle is as follows:
I i n ( x ) = 1 + C i f , δ cos 2 π f x + δ
where f is the spatial frequency of the input signal, C i f , δ is the input signal modulation system, and δ is the cosine wave peak and the fiber center initial position difference. The imaging process of the fiber-optic imaging beam can be seen as first sampled by the input end plane, then uniformly illuminated by the fiber bundle, and then transformed into the outgoing end plane image. Then, the light intensity of the output signal of the first i row and j column of the fiber can be expressed as follows:
I o u t , i , j ( x ) = 2 x j r x j + r 1 + C i f , δ cos 2 π f x + δ r 2 x x j 2 1 2 d x = 2 2 j R r 2 j R + r 1 + C i f , δ cos 2 π f x + δ r 2 x 2 j R 2 1 2 d x
Two simplified models of the coupling of the hexagonally aligned fiber-optic image transfer beam image element with the area array CCD image element are shown in Figure 4 and Figure 5. For these two coupled discrete sampling cases, the following numerical model is derived.
The first type of coupling error is shown in Figure 4, where the coupling error between the hexagonally arranged fiber-optic imaging beam image elements and the area array CCD image elements only causes a single CCD image element to receive the output optical signal from three adjacent fiber-optic image elements. The coupling error of the image element in the arc vector direction is set to Δ i , and the coupling error of the image element in the meridian direction is set to Δ j . The light-receiving area represented by the bow ABCD in the figure is as below:
S A B C D = 1 2 R Δ i 3 2 R Δ j + r 2 R Δ i 2 + 1 2 3 2 R Δ j R Δ i + r 2 3 2 R Δ j 2 + r 2 2 3 2 π arccos 3 2 R Δ j r arccos R Δ i r
The bow EFGH represents a light-receiving area calculated as follows:
S i , j = 1 2 R Δ i 3 2 R Δ j + r 2 R Δ i 2 + 1 2 3 2 R Δ j R Δ i + r 2 3 2 R Δ j 2 + r 2 2 3 2 π arccos 3 2 R Δ j r arccos R Δ i r
S i + 1 , j + 1 = r 2 arccos 3 2 R Δ j r 3 2 R Δ j r 2 3 2 R Δ j 2
S i , j + 1 = π r 2 S i , j S i + 1 , j + 1
For the case of the first type of coupling error, the expression of the output signal intensity of the first row and column of the image element in the face array CCD is as follows:
I c o u p l i n g , i , j = S i , j π r 2 I o u t , i , j + S i , j + 1 π r 2 I o u t , i , j + 1 + S i + 1 , j + 1 π r 2 I o u t , i + 1 , j + 1
where, I o u t , i , j is the output signal strength of the first i row and j column of fibers, I o u t , i , j + 1 is the output signal strength of the first i row and j + 1 column of fibers, and I o u t , i + 1 , j + 1 is the output signal strength of the first i + 1 row and j + 1 column of fibers.
The second type of coupling error case is shown in Figure 5, where the coupling error between the image elements of the hexagonally arranged fiber-optic imaging bundle and the area array CCD causes a single CCD image element to receive the output optical signal from four adjacent fiber-optic image elements. As above, the light-receiving area of the adjacent four fibers in the hexagonal fiber imaging bundle has the following relationship:
S i , j = 1 2 R Δ i 3 2 R Δ j + r 2 R Δ i 2 + 1 2 3 2 R Δ j R Δ i + r 2 3 2 R Δ j 2 + r 2 2 3 2 π arccos 3 2 R Δ j r arccos R Δ i r
S i , j + 1 = r 2 3 2 R Δ j 2 3 2 R Δ j + r 2 π arccos 3 2 R Δ j r S i , j
S i + 1 , j + 1 = r 2 Δ i 2 × Δ i × r 2 × π arccos Δ i r S i , j
S i + 1 , j = π r 2 S i , j S i , j + 1 S i + 1 , j + 1
For the case of the second type of coupling error, the expression of the output signal intensity of the first row and column of the image element in the area array CCD is as follows:
I c o u p l i n g , i , j = S i , j π r 2 I o u t , i , j + S i , j + 1 π r 2 I o u t , i , j + 1 + S i + 1 , j π r 2 I o u t , i + 1 , j + S i + 1 , j + 1 π r 2 I o u t , i + 1 , j + 1
According to the definition of MTF, when the light intensity of the input signal is cosine-distributed, the MTF of the system is equal to the ratio of the light intensity modulation of the outgoing signal to the light intensity modulation of the incoming signal, as shown in Equation (13). That is, the response characteristics of the two-stage coupled discrete system for the input signal with cosine distribution of light intensity are reflected by the ratio of modulation.
M T F f , δ = C o f , δ C i f , δ
According to Equation (1), the optical intensity modulation system of the incident signal is C i f , δ , C o f , δ , which is the optical intensity modulation system of the outgoing signal, and according to (9) and (14), the two-dimensional discrete sampling cases with different coupling errors, the optical intensity distribution of the outgoing optical signal can be obtained. Then, according to the definition of the modulation system, the optical intensity modulation system of the outgoing optical signal can be obtained, and finally, according to (2), (3), (9), and (14), the response function of the coupled discrete sampling system, composed of a hexagonally arranged fiber-optic imaging bundle and an area array CCD for a signal with a cosine distribution of light intensity, can be obtained, i.e., the coupled-MTF of the system.
M T F c o u p l i n g f , n , δ = 1 N i = 1 N I c o u p l i n g , i , j , max f , n , δ 1 M i = 1 M I c o u p l i n g , i , j , min f , n , δ 1 N i = 1 N I c o u p l i n g , i , j , max f , n , δ + 1 M i = 1 M I c o u p l i n g , i , j , min f , n , δ
in which n is the number of fibers in the imaging beam, N is the number of image elements with the output signal greater than the average value, M is the number of image elements with the output signal less than the average value, and I c o u p l i n g , i , j , max f , n , δ and I c o u p l i n g , i , j , min f , n , δ are the maximum and minimum values of the output signal intensity of the first i row and the first j column of the image elements, respectively. The MTF of the front telescope and coupling objective is set to a constant value, and the optical emphasis of the input signal C i f , δ is set to 1.
According to Equation (14), for the coupled discrete sampling system, the coupled-MTF of the system is related to the number n of fibers in the imaging bundle, the spatial frequency of the input signal f , the difference between the cosine peak and the initial position of the fiber center δ , and the coupling error Δ j along the two directions between the hexagonal fiber imaging bundle and the area array Δ i CCD image elements. These were further observed by mathematical simulation.

3. Simulation and Discussion

3.1. Effect of Number of Fibers on the Coupled-MTF

According to the sampling theorem, if a bandlimited signal is sampled at a sampling rate no less than twice the highest frequency of the signal, then the resulting discrete sampling value accurately determines the original signal. The Nyquist frequency f N is the highest spatial frequency that can be theoretically resolved, which is half the spatial sampling frequency of the input signal. The fiber column sampling interval is 2 R , and the sampling frequency is 1 / 2 R , so then the Nyquist frequency f N = 1 2 1 2 R = 1 4 R . Assuming that the fiber radius R = 3.2 μ m , the fiber core layer radius r = 2.67 μ m , the initial position deviation is set to 0.1R, and the spatial frequency of the input cosine distribution target is the Nyquist frequency f N , then the image element coupling error along the x direction is Δ i = 0.5 R , and the image element coupling error along the y direction is Δ j = 0.7 R . The simulation results of the coupled-MTF with the number of fibers can be obtained using Equation (14).
When the parameters of the hexagonally aligned optical fiber imaging bundle and area array CCD, as well as their coupling errors, are the same as the second case, and when the number of optical fiber imaging bundles increases sequentially from 10 × 10 to 100 × 100 , 1000 × 1000 , and 2000 × 2000 , the coupled-MTF can be obtained. The simulation result of the oscillation convergence is shown in Figure 6.
From Figure 6a–c, when the fiber parameters, initial position deviation, and image element coupling deviation are fixed values, the coupled-MTF oscillation converges faster at the Nyquist frequency as the number of fibers increases and converges to a stable value at 1000 × 1000 the number of fibers, as can be seen from Figure 6d. After this, the number of fibers increases again, but the oscillation period effectively remains the same. This has no effect on the final convergence value of the coupled-MTF.

3.2. Effect of Nyquist Frequency Shift on the Coupled-MTF

The Nyquist frequency f N is the highest spatial frequency that can be theoretically resolved. Let the spatial frequency of the input optical signal be f = f N / l , l 1 , let L = 1 / l be the frequency offset, and 0 < L 1 . The spatial frequency of the final input optical signal can be obtained as
f = L × f N ,   0 < L 1 ,
assuming that the fiber radius R = 3.2 μ m , the fiber core layer radius r = 2.67 μ m , the number of fibers is 1000 × 1000 , the initial position deviation is set to 0.1 R , the image coupling error along the x-direction is Δ i = 0.5 R , and the image coupling error along the y-direction is Δ j = 0.7 R . The simulation results of the oscillatory convergence of the coupled-MTF with the input frequency offset are obtained using Equation (14).
The simulation results of the oscillation convergence of the coupled-MTF as the number of fibers in the fiber bundle increases; when the parameters of the hexagonally aligned fiber imaging bundle and the area array CCD, as well as its coupling errors, are the same as in the second case; and when the spatial frequency of the input cosine target deviates from the Nyquist frequency by 2%, i.e., f = 0.98 f N , are shown in Figure 7.
The simulation results of the oscillation convergence of the coupled-MTF as the number of fibers in the fiber bundle increases; when the parameters of the hexagonally aligned fiber imaging bundle and the area array CCD, as well as its coupling errors, are the same as in the second case; and when the spatial frequency of the input cosine target deviates from the Nyquist frequency by 1%, i.e., f = 0.99 f N , are shown in Figure 8.
The simulation results of the oscillation convergence of the coupled-MTF when the parameters of the hexagonally aligned fiber imaging bundle and the area array CCD, as well as its coupling errors, are the same as in the second case, and when the spatial frequency of the input cosine target deviates from the Nyquist frequency by 0.5% (i.e., f = 0.995 f N as the number of fibers in the fiber bundle increases), are shown in Figure 9.
The simulation results of the oscillation convergence of the coupled-MTF when the parameters of the hexagonally aligned fiber imaging bundle and the area array CCD, as well as its coupling errors, are the same as in the second case, and when the spatial frequency of the input cosine target deviates from the Nyquist frequency by 0.1% (i.e., f = 0.999 f N as the number of fibers in the fiber bundle increases), are as shown in Figure 10.
The simulation results shown in Figure 8, Figure 9 and Figure 10 demonstrate that the coupled-MTF exhibits a clear trend of gradually increasing the convergence rate as the deviation of the spatial frequency of the input cosine target from the Nyquist frequency gradually increases from 0.1% to 1%. The simulation results shown in Figure 7 and Figure 8 demonstrate that, as the deviation of the spatial frequency of the input cosine target from the Nyquist frequency increases from 1% to 2%, the coupled-MTF oscillation amplitude converges faster, but the total oscillation amplitude is consistent, and all converge to a fixed value of approximately 0.5. According to Figure 7, Figure 8, Figure 9 and Figure 10, as the deviation of the spatial frequency of the input cosine target from the Nyquist frequency gradually increases, the coupled-MTF exhibits a clear tendency to converge faster. The results show that when the deviation of position, the deviation of image element coupling, and the number of fibers ( 1000 × 1000 ), are fixed values, the spatial frequency of the input cosine target converges to a fixed value of 0.5. As the deviation of the spatial frequency of the input cosine target from the Nyquist frequency gradually increases, the convergence speed of coupled-MTF accelerates and finally converges to a fixed value of 0.5.

3.3. Effect of Initial Position Deviation on the Coupled-MTF

Affected by the fitting error, there is always an error δ in the translation direction between the peak of the input cosine target wave and the initial position of the fiber center. Assuming that the fiber radius R = 3.2 μ m , the fiber core layer radius r = 2.67 μ m , the number of fibers is 1000 × 1000 , the image coupling error along the x direction is Δ i = 0.5 R , the image coupling error along the y direction is Δ j = 0.7 R , the initial position deviation is set to 0 ~ 4 R 0 ~ 12.8 μ m , and the spatial frequency of the input cosine target is the Nyquist frequency, that is, the f = f N , then the simulation of the coupled-MTF with the initial position variation can be obtained, as shown in Figure 11.
The simulation results in Figure 11 show that if the input signal is a cosine, the modulation transfer function of the hexagonally aligned fiber image imaging bundle coupled with the area array CCD exhibits periodic oscillation with increase δ of the initial position error value of the cosine signal wave peak and the fiber center, and the oscillation period is T = 4 R , i.e., two fiber diameters. The minimum value is reached at the initial position error value of 6.4, i.e., when δ = 2 R , then the coupled-MTF falls to the valley value of 0. The maximum value is reached when the initial position error values are 0 and 12.8, i.e., when δ = 0 or δ = 4 R , then the coupled-MTF rises to the peak value of 1.

4. Conclusions

To address the problem that the two-level discrete coupled sampling effect contained in a fiber-optic imaging system bundle as a relay imaging element could lead to the limitations of the conventional imaging quality evaluation model, a numerical analysis method of the modulation transfer function based on the coupling of hexagonally arranged fiber-optic imaging bundle and area array CCD image elements is proposed. The explicit numerical relationships between the number of fibers and input signal parameters and the coupled-MTF are established, and mathematical simulations were performed. The results show that at the Nyquist frequency, when the fiber parameters, the deviation of the input cosine target signal peak from the initial position of the fiber center, and the deviation of the image element coupling are fixed, then the oscillation convergence of the coupled-MTF increases with an increase in the number of fibers and converges to a stable value that equals the number of fibers; then, the number of fibers increases again, and the oscillation period and the final convergence value of the coupled-MTF remain unchanged. In order to analyze the mechanism of the deviation between the spatial frequency of the input cosine target signal and the Nyquist frequency on the coupled-MTF, a comparative study of the relationship between the convergences of the coupled-MTF with different input spatial frequencies was conducted. This study shows that when the deviation between the spatial frequency of the input cosine target and the Nyquist frequency gradually increases from 0.1% to 1%, the coupled-MTF shows an obvious trend of faster convergence and smaller oscillation periods, and the final convergence value gradually increases and converges to a stable value of 0.5 when the amount of frequency deviation is 1%. Thereafter, when the frequency deviation increases from 1% to 2%, the coupled-MTF oscillation period, convergence rate, and final convergence stable value remain unchanged. This paper further investigates the effect of the initial position deviation on the coupled-MTF and shows that if the input signal is a cosine, the coupled-MTF oscillates periodically with the increase in the initial position deviation, and the oscillation period is two fiber diameters. When the initial position deviation is 6.4, which is 1 fiber diameter, it drops to the minimum value of 0. It reaches the maximum value of 1 when the initial position deviation is 0/12.8, which is 0, or 2 fiber diameters. The transmission model of the hexagonally aligned fiber-optic imaging bundles established in this paper is more in line with the actual situation. This study produces important guidelines for the selection of the number of fibers in a hexagonally arranged fiber-optic imaging bundle, the input spatial frequency and the initial position deviation, and also for other discrete transmission components.

Author Contributions

Conceptualization, W.L. and C.W.; methodology, W.L.; software, W.L. and Y.H.; validation, C.H. and C.W.; formal analysis, W.L.; investigation, W.L. and Y.H.; resources, C.W.; writing—original draft preparation, W.L.; writing—review and editing, W.L.; funding acquisition, C.W. and H.Z. All authors have read and agreed to the published version of the manuscript.

Funding

This work was supported by the National Natural Science Foundation of China (grant number 61805235) and Natural Science Foundation of Jilin Province (grant number 20200201203JC).

Conflicts of Interest

The authors declare no conflict of interest.

References

  1. Zhou, D.; Yu, F.; Tan, F. Preparation and Optical Properties of High Resolution Optical Fiber image bundles. China J. Laser 2009, 36, 723–726. [Google Scholar] [CrossRef]
  2. Wang, X.; Yang, J.; Yan, X.; Chen, G.; Xu, Y. Fabrication and optical performances measurements of flexible chalcogenide imaging fiber bundles. Opt. Precis. Eng. 2017, 25, 3137–3144. [Google Scholar] [CrossRef]
  3. Yang, D.; Hou, C.; Sun, Z.; Ji, J.; Li, Y. Chord-line detection method for optical performance of medical rigid endoscopes. Opt. Precis. Eng. 2014, 22, 576–581. [Google Scholar] [CrossRef]
  4. Roberto, S.; Mark, A.; Maurizio, C.; Mario, T.; Pietro, F. A novel approach to night vision imaging systems development, integration and verification in military aircraft. Aerosp. Sci. Technol. 2013, 31, 10–23. [Google Scholar]
  5. Guo, J.; Liu, P.; Jiao, G.; Lu, Y.; Lv, J. Three-dimensional measurement of industrial endoscope binocular optical system. Opt. Precis. Eng. 2014, 22, 2337–2344. [Google Scholar]
  6. Wittenstein, W.; Fontanella, J.C.; Newbery, A.R.; Baars, J. The definition of the OTF and the measurement of aliasing for sampled imaging systems. Opt. Acta Int. J. Opt. 1982, 29, 41–50. [Google Scholar] [CrossRef]
  7. Barnard, K.J.; Boreman, G.D. Modulation transfer function of hexagonal staring focal plane arrays. Opt. Eng. 1991, 30, 1915–1919. [Google Scholar] [CrossRef]
  8. Li, H.; Chen, H.; Feng, K.; Ma, H. Modulation transfer function measurement method for fiber optic imaging bundles. Opt. Laser Technol. 2008, 40, 415–419. [Google Scholar] [CrossRef]
  9. Stamenov, I.; Agurok, I.P.; Ford, J.E. Optimization of two-glass monocentric lenses for compact panoramic imagers: General aberration analysis and specific designs. Appl. Opt. 2012, 51, 7648–7661. [Google Scholar] [CrossRef] [PubMed]
  10. Stamenov, I.; Arianpour, A.; Olivas, S.J. Panoramic monocentric imaging using fiber-coupled focal planes. Opt. Express 2014, 22, 31708–31721. [Google Scholar] [CrossRef] [PubMed]
  11. Stephen, J.; Ashkan, A.; Igor, S.; Rick, M.; Ron, A.; Adam, R.; Ilya, P.; Joseph, E. Image processing for cameras with fiber bundle image relay. Appl. Opt. 2015, 54, 1124–1137. [Google Scholar]
  12. Shao, J.; Zhang, J.; Xiao, H.; Liang, R.; Barnard, K. Fiber bundle image restoration using deep learning. Opt. Lett. 2019, 44, 1080–1083. [Google Scholar] [CrossRef] [PubMed]
  13. Su, B. Theoretical Analysis of Optical Fiber Panel Imaging and Discussion of Equivalent Mean MTF. J. Appl. Opt. 1988, 1, 54–58. [Google Scholar]
  14. He, X.; Xiang, Y. Study on Contrast Transfer Function of Fiber-Optic Image Bundles. Acta Opt. Sin. 2011, 31, 0706006. [Google Scholar]
  15. He, X.; Yuan, L.; Jin, C.; Zhang, X. Characteristics of modulation transfer function of pixel coupling between array fiber image bundles and array CCD. Acta Opt. Sin. 2017, 37, 0506002. [Google Scholar]
  16. He, X.; Xiang, Y. Study on a method of evaluating the alignment of pixels between fiber-optic image bundles and detector arrays. Appl. Opt. 2011, 50, 189–192. [Google Scholar] [CrossRef]
  17. Chi, Z. Applied Optics and Optical Design Basis, 2nd ed.; Higher Education Press: Beijing, China, 2013. [Google Scholar]
  18. Drougard, R. Optical Transfer Properties of Fiber Bundles. J. Opt. Soc. Am. 1964, 54, 907–914. [Google Scholar] [CrossRef]
  19. Hadar, O.; Boreman, G.D. Oversampling requirements for pixelated-imager systems. Opt. Eng. 1999, 38, 782–785. [Google Scholar]
  20. Rudoler, S.; Hadar, O.; Fisher, M.; Kopeika, N.S. Image resolution limits resulting from mechanical vibrations. Part 2: Experiment. Opt. Eng. 1991, 30, 577–589. [Google Scholar] [CrossRef]
Figure 1. The input end has the same arrangement of fiber imaging bundles as the output end.
Applsci 12 03135 g001
Figure 2. Working principle of hexagonally arranged fiber imaging bundles.
Applsci 12 03135 g002
Figure 3. (a) A pixel in an array CCD is a rectangle of size 2 × 3 ; (b) three particular directions of hexagonally arranged fiber imaging bundles: 0 , π 3 , 2 π 3 .
Applsci 12 03135 g003
Figure 4. Diagram of the first kind of pixel-coupled error.
Applsci 12 03135 g004
Figure 5. Diagram of the second kind of pixel-coupled error.
Applsci 12 03135 g005
Figure 6. Simulation of oscillation convergence of the coupled-MTF with the number of fibers: (a) the number of fibers is 10 × 10 ; (b) the number of fibers is 100 × 100 ; (c) the number of fibers is 1000 × 1000 ; (d) the number of fibers is 2000 × 2000 .
Applsci 12 03135 g006
Figure 7. Simulation of oscillation convergence of the coupled-MTF with the number of fibers when the deviation between the cosine target spatial frequency and Nyquist frequency is 2%.
Applsci 12 03135 g007
Figure 8. Simulation of oscillation convergence of the coupled-MTF with the number of fibers when the deviation between the cosine target spatial frequency and Nyquist frequency is 1%.
Applsci 12 03135 g008
Figure 9. Simulation of oscillation convergence of the coupled-MTF with the number of fibers when the deviation between the cosine target spatial frequency and Nyquist frequency is 0.5%.
Applsci 12 03135 g009
Figure 10. Simulation of oscillation convergence of the coupled-MTF with the number of fibers when the deviation between the cosine target spatial frequency and Nyquist frequency is 0.1%.
Applsci 12 03135 g010
Figure 11. Simulation of the coupled-MTF with the initial position deviation δ .
Applsci 12 03135 g011
Publisher’s Note: MDPI stays neutral with regard to jurisdictional claims in published maps and institutional affiliations.

