Article

The Impact of Technical Error of Measurement on Somatotype Categorization

Faculty of Health and Wellbeing, University of Winchester, Winchester SO22 4NR, UK
*
Author to whom correspondence should be addressed.
Appl. Sci. 2022, 12(6), 3056; https://doi.org/10.3390/app12063056
Submission received: 30 September 2021 / Revised: 11 March 2022 / Accepted: 14 March 2022 / Published: 17 March 2022

Abstract

:

Featured Application

Researchers measuring somatotype should report technical capability of data collectors and technical error of measurement in order to ensure somatotype categorization is accurate.

Abstract

Inquiry into somatotype often seeks to assign participants into somatotype groups. The aim of this study was to demonstrate how the intra-tester reliability of anthropometric measures can influence how somatotype is categorized. Sixty-eight physically active males (mean [SD] 24.8 [7.9] y; 79.8 [14.4] kg; 1.81 [0.07] m) had their anthropometric profiles measured and somatotype components calculated. Technical error of measurement (TEM) was used to calculate 95% confidence intervals (CI) for overall somatotype calculation (RTEM) for the data collected by the lead researcher. CIs were further calculated based on the International Society for the Advancement of Kinanthropometry accreditation Level 1 and 2/3 thresholds. Somatotype groups were categorized as either simple (four groups) or detailed (13 groups). RTEM had the smallest TEM values (0.05 somatotype units). Detailed somatotype categorization demonstrated larger potential for misclassification (39.7–72.1%) versus simple categorization (29.4–38.2%). Researchers investigating somatotype should keep technical skill high and group according to the four simple somatotype categories in order to maintain acceptable categorization reliability.

1. Introduction

Variation in biological or mechanical (equipment) factors can result in measurement error in experimental environments [1,2]. The true value of any measurement will be one that is free of measurement error [2]. In reality, continuous measurements will always include some magnitude of error [1] but the key is to try to minimize this error in order to identify actual differences or changes in performance.
Anthropometry is susceptible to measurement error due to variations in technique, equipment issues and human error [3]. It is important to try to minimize this error to ensure measurements are as reliable and accurate as possible. The International Society for the Advancement of Kinanthropometry (ISAK) have provided standardized techniques for the measurement of anthropometric variables [4]. The provision of standardized protocols with exactly defined landmarks to determine a measurement, and the associated training provided by ISAK can help to decrease the imprecision and inconsistency that accompanies measurement by individuals with poor technique [5,6]. Reliability is often assessed using the intra-tester technical error of measurement (TEM) [7,8], which determines the magnitude of the difference between repeated measures on the same participant by the same measurer. Calculation of the TEM for any anthropometric dimension will allow further computation of confidence intervals around the actual value [8]. This will help to assess how accurately the sample mean reflects the mean in the population, giving boundaries around which the true value should fall [9]. The calculation of TEM is also considered to represent absolute reliability within the sample population and therefore preferential to measures of relative reliability such as intra-class correlation coefficients (ICC) [10].
Somatotype is a numerical representation of physique, quantifying the morphology and characteristics of the human body [11]. Somatotypes are commonly reported in terms of their dominant components, with 13 categories providing detailed grouping [12]. However, it is also possible to simplify these 13 categories into four simple groups, each representing the dominance of endomorphy (relative adiposity), mesomorphy (musculo-skeletal robustness), or ectomorphy (linearity), or central (no dominance) [13]. Many studies have identified that somatotype components are highly related to performance in certain sports including combat sports [14,15], rowing [16], basketball [17], volleyball [18] and endurance and ultra-endurance events including Ironman [19]. It has also been established that the task-specific nature of sports such as soccer, basketball and volleyball require discrete positional somatotypes with detailed grouping [17,18,20]. Somatotype has also been linked to functional capacity [21,22,23]. Given the propensity for researchers to assign populations to somatotype groups, establishing the reliability of this grouping is important to confirm the observations made. Despite the need for reliability in anthropometric measures, authors rarely report measurement errors in human populations [24] particularly in somatotype research [25,26,27,28,29,30,31]. No other study has outlined the impact of error on somatotype categorization. Measurement error needs serious consideration if statistical methods are to remain uncompromised and grouping of individuals is to remain correct [32]. This study aims to demonstrate the influence of intra-tester technical error of measurement (TEM) on somatotype categorization in a large population of participants with different somatotypes. The objective is to give researchers confidence in their categorization of participants.

2. Materials and Methods

Sixty-eight physically active males (mean [SD] 24.8 [7.9] y; 79.8 [14.4] kg; 1.81 [0.07] m) were recruited to the study from the local community. Participants provided written informed consent prior to participating in the study. The study received approval from the Institutional Human Ethics Committee.
Participants were recruited initially using purposive sampling for body composition assessment. Participants were tested on one occasion and were instructed to attend the session fully hydrated and having refrained from intense physical activity for the 24 h preceding testing. Anthropometric measures were taken from the participant, with a minimum of two measures taken at each site. If a difference existed between the first two measures of <5% for skinfolds and <1% for all other measures, a third measure was taken [4]. The two closest values were transferred to the TEM calculation.
Participants’ anthropometric profiles were measured by a Level 3 ISAK anthropometrist using ISAK protocols [4], and somatotype calculated in line with the Heath-Carter methods [13]. Mean TEM for skinfolds was 2.2% and for all other measures was 0.2%.
Technical error of measurement was calculated for each individual anthropometric variable using Equation (1) as follows:
TEM = ( Σ ( sd ) 2 2 n )
where sd = standard deviation (of two repeat measurements) and n = number of participants measured.
This was used to calculate 95% confidence intervals (CI) for the individual variables, and for the overall somatotype calculation. Further, TEMs equivalent to those who train to become ISAK Level 1 (7.5% for skinfolds, 1.5% for all other measures) and Level 2/3 (5.0% for skinfolds, 1.0% for all other measures) in the post-course guidelines [4] were calculated and used to calculate equivalent 95% CI’s for theoretical operators at the relevant qualification thresholds. Each individual participant was assigned a detailed and a simplified somatotype category. It was further analyzed if they were still assigned to this category based on their 95% CI’s from the researcher’s TEM (RTEM), a theoretical Level 1 ISAK anthropometrist TEM (L1TEM) or a theoretical Level 2/3 ISAK anthropometrist TEM (L23TEM) based on the allowable accreditation thresholds for these levels [4].

3. Results

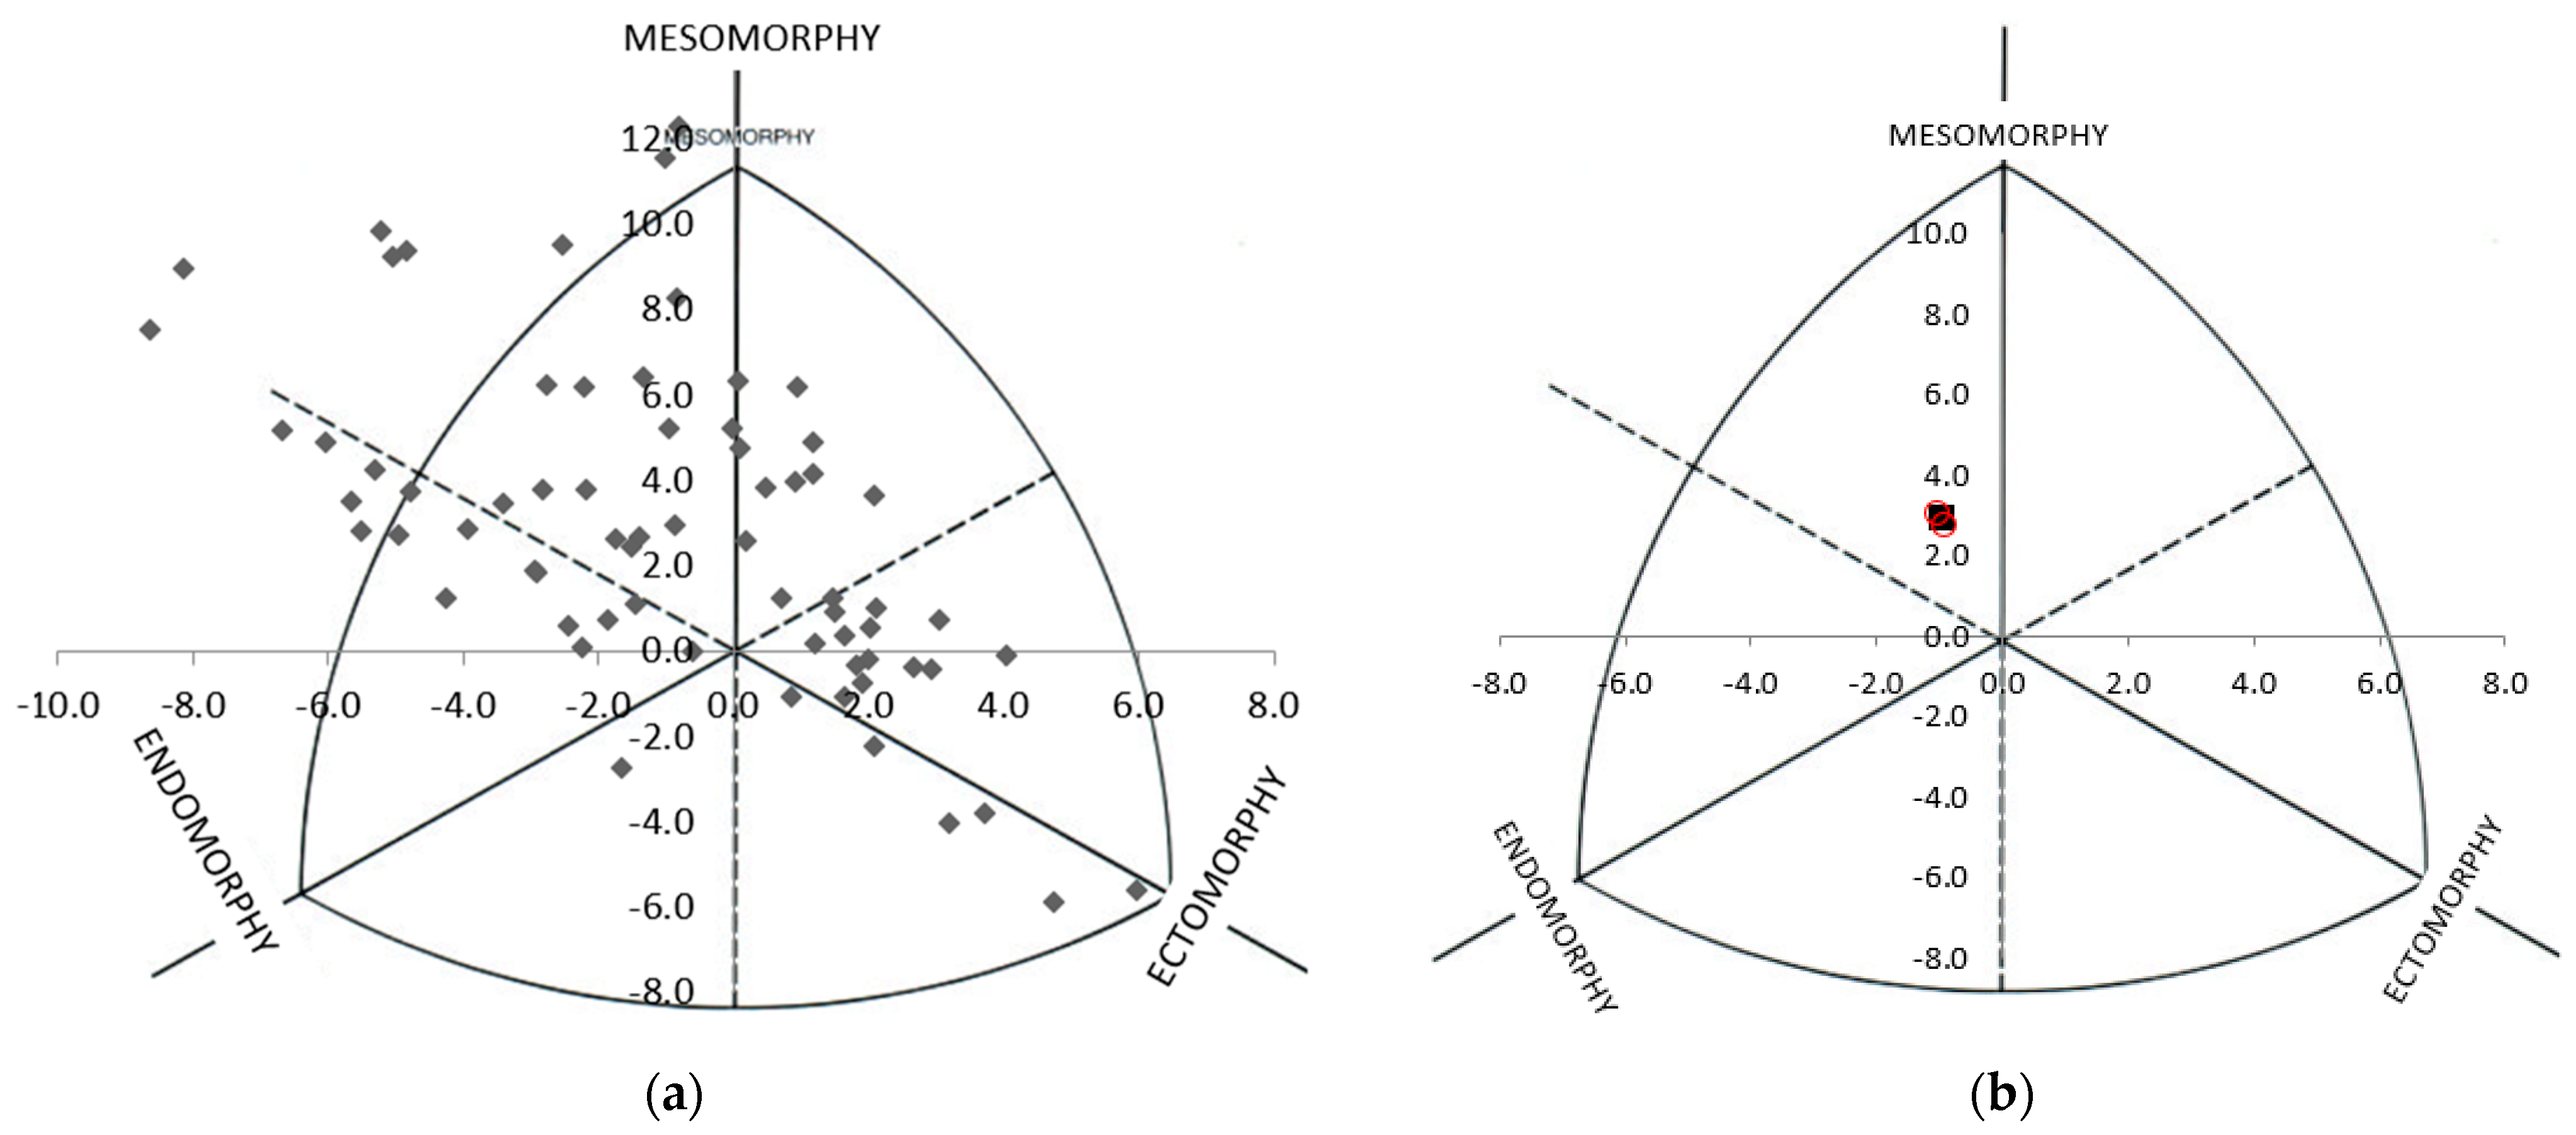
3.1. Somatotype Distribution

Mean (±SD) somatotype component values were Endomorphy 3.5 (±1.8), Mesomorphy 4.4 (±1.6), Ectomorphy 2.6 (±1.6) across the sample population. Somatotype attitudinal distances (SADs) ranged from 0.1 to 6.8, and the Somatotype attitudinal mean (SAM) was 2.5 somatotype units. Calculation of somatotypes demonstrated a range of values with extremes in each of the three classifications (Figure 1a). The endomorphy scores ranged from 1.2–8.7; mesomorphy from 0.7–8.7 and ectomorphy from 0.1–7.1. RTEM provided the smallest average TEM (0.05 somatotype units) and range of 95% CI’s (within 0.1 somatotype units of the mean; Figure 1b). The average TEM and the 95% CI range increased with L23TEM (TEM 0.11 somatotype units; 95%CI within 0.2 somatotype units of the mean; Figure 1c) and increased even further with L1TEM (TEM 0.16 somatotype units; 95% CI within 0.3 somatotype units of the mean; Figure 1d).

3.2. Somatotype Categorization

Simplified categorization of somatotype was more accurate for all intra-tester reliability levels, with the RTEM potentially misclassifying 29.4% of participants, L23TEM 35.3% and L1TEM 38.2% respectively (Table 1). With the RTEM only four participants could have been misclassified into a completely different somatotype category (1 × central, 1 × non-dominant mesomorph, 1 × non-dominant endomorph and 1 × non-dominant ectomorph). All other participants still had their highest number in the dominant category, even if they went from dominant (more than 0.5 units higher) to non-dominant, or vice versa. This increased to five participants for L23TEM and 15 participants for L1TEM, with the majority of these being those in non-dominant categories. The potential to misclassify somatotype was higher for detailed somatotype category with RTEM potentially misclassifying 39.7%, L23TEM 61.8%, and L1TEM 72.1% respectively.

4. Discussion

The results of this study demonstrate that TEM should be taken into account when calculating somatotype category. A lower TEM reduces the chance of mis-categorizing a person with respect to their somatotype, and increases the reliability of determining the dominant somatotype in a simplified categorization. This is an important finding in the context of research or applied practice that groups participants according to somatotype.
This study demonstrated that nearly one third (29.4%) of the results from an individual with a high technical skill (ISAK Level 3) misclassify somatotype categories. Therefore, researchers should be aiming for TEMs < 2.5% for skinfolds and <0.5% for all other measures in line with those demonstrated in the current study. Somatotype papers that utilize ISAK protocols often report individual measure TEMs of a similar magnitude to those shown in the current data set [33,34,35]. When TEM is at ISAK Level 1 accreditation threshold, there is a larger spread of values on the somatochart compared to those of a higher technical competency. The reliability of somatotype also demonstrates that mis-categorization occurs more often with higher TEMs and with a detailed approach to classification. There are very few somatotype-focused papers that report TEM as standard [24,25,26,27,28,29,30], and there are no other known papers that look specifically at how error can affect somatotype categorization.
Previous researchers have attempted to establish population somatotype trends in specific sports. Busko et al. [14] compared the Judo athletes in their study to untrained students indicating that judoist were more mesomorphic and ectomorphic than untrained participants (Table 2). However, despite using simplified categorization the paper demonstrated no consideration of TEM when categorizing the participants potentially leading to up to 6 of their judoists being classified incorrectly in terms of their somatotype group. The influence of TEM on the categorization of the judoists, in particular, could be important as this group had the most population variability due to the presence of athletes from different weight categories and there only being 15 participants in total. The variation due to weight-category was also present within a more recent paper investigating male and female judokas [15], and may account for some of the differences in somatotype groupings between the two papers. Busko et al. [14] indicated their judo athletes to be mesomorphic and ectomorphic, whilst Roklicer et al. [15] had more of a predominance towards mesomorphic and endomorphic. If TEM was taken into account in a similar manner to the current study in either paper, it may be that the two judo populations are more similar than they appear in terms of somatotype.
Table 2 gives a summary of reviewed somatotype literature, indicating the impact of lack of acknowledgement of TEM on potential categorization. Certain sports indicate that their athletes’ somatotype is often determined by the task requirements of particular positions [18,20], age [17] or competition standards [18]. Detailed categorization is often used to determine these differences between position, age or competition standard. The current study indicates that this type of categorization is the most susceptible to error. Combined with a lack of acknowledgement of TEM, a high chance of mis-categorization may result in less obvious differences between these groups. Cardenas-Fernandez et al. [20] report TEMs for their skinfolds and other measures of a similar magnitude to the current study, but fail to convert this into somatotype units making it difficult to determine the accuracy of their categorization pattern. If researchers want to accurately determine the exact somatotype grouping of specific sporting populations, it is important that they consider TEM in their data analysis.
The current study demonstrated similar TEMs to previous research which assessed the relationship between somatotype and function during exercise [35]. Bolonchuk et al. [35] reported their technical error to be less than 0.2 somatotype units (compared to less than 0.1 for the researcher TEM in the current study), and grouped their participants with simple dominance. Accordingly, due to the similar error to the current study, it is postulated that 19 out of the 63 participants were mis-categorized. Despite this they demonstrated a difference in function during exercise between the somatotype groups, with ectomorphs in particular showing different values to those grouped as meso- and endomorphs. Ectomorphs appear to be the least susceptible to mis-categorization via technical error in the current study and so observations in functional differences in this group are likely to be a true representation. In a study with a similar focus, participants were grouped according to dominant somatotype in the more detailed form with 9 endo-mesomorphs, 11 mesomorphs, 12 meso-ectomorphs and 9 ectomorphs following a 12-week endurance training program [36]. However, there is no mention of the magnitude of error within the latter paper. Given that the expertise of the investigator is also not referred to, it is possible that up to 72% of participants (30 of 41) were mis-categorized, leaving the results highly questionable. Sunitha and Joseph [30] also indicated that adolescents of different somatotype categories demonstrated different training responses, yet they did not report their technical error for either individual measures or somatotype as a whole. If participants were miscategorized due to measurement error, their observations may not be as informative. This demonstrates the importance of reporting reliability data when assessing any relationships of somatotype to factors such as training response.
The importance of the current study’s findings can be contextualized in light of the strengths and weaknesses of the study design. The strong technical skills exercised in the current data set have resulted in low technical error scores. Even then, recognition that some participants may fall slightly outside of their established dominant group is evident, although with low technical error dominance is often still attributed to the originally assigned category. This could be a concern when grouping participants according to dominant somatotype, but is less of a concern when considering the rating as part of a continuum. The population of the current study are from a breadth of somatotype categories, as demonstrated by the SAM of 2.5 being in excess of the 1.0 somatotype unit threshold set by Carter et al. [36] being represented of a large spread of data. This results in the error being representative of somatotypes across the spectrum of possible values and categories.
Recent research often reports both the protocol (often ISAK) and TEM used [32,33,34], demonstrating values that are similar to those seen in the current study. However, despite somatotype being a focus of these studies, they do not report how these errors influence somatotype calculations by reporting somatotype TEM or potential for mis-categorization. Studies that group participants according to somatotype category should take into account measurement error and indicate any potential mis-categorizations. It is also recommended that those studies keep their categorization system simple rather than increasing potential mis-categorization through a detailed system.
Table 2. Summary of reviewed somatotype literature using grouping to determine differences in outcome measures.
Author, YearParticipantsPopulation SomatotypeSomatotype GroupingTEMs Reported?Potential for Mis-Classification
Busko et al., 2017 [14]15 male Judoists (training experience 10.0 ± 2.8 years); 154 untrained students.Judoists: 3.21 [±0.78], 5.87 [±1.16], 1.83 [±0.96].
Untrained: 3.90 [±1.56], 4.60 [±1.14], 2.88 [±1.27]
SimpleNoUp to 6 judoists and 59 untrained students.
Roklicer et al., 2020 [15]61 male judokas, 37 female judokas separated into 7 weight categoriesMales range: 1.69–2.92, 3.65–6.35, 0.91–3.99
Females range: 2.17–4.44, 2.71–5.68, 0.22–3.48.
In descriptive text—detailed.NoUp to 44 male and 27 female judokas.
Guereno et al., 2018 [16]20 elite male rowers3.5 [±0.4], 4.7 [±0.6], 2.4 [±3.5]In descriptive text—detailedNoUp to 15 participants
Gryko et al., 2018 [17]70 male basketball players (young [n = 35] and adult [n = 35])Young: 2.12 [±0.81], 3.75 [±1.01], 4.17 [±1.08].
Adult: 2.26 [±0.59], 4.57 [±1.07], 3.04 [±0.89].
In descriptive text—detailed.NoUp to 50 participants
Giannopoulos et al., 2017 [18]144 Greek male volleyball players grouped by Division and position3.05 [±0.74], 2.32 [±1.09], 2.93 [±1.01]DetailedTest-retest reliability but no TEM provided.Up to 104 participants
Cardenas-Fernandez et al., 2019 [20]174 youth soccer players (U14 n = 34; U16 n = 40; U19 n = 100)Range: 2.8–4.5, 3.2–5.2, 2.2–3.9DetailedYes—<3% for skinfolds, <1% all other measures.Up to 69 players (U14 = 13; U16 = 16; U19 = 40).
Cinarli and Kafkas, 2019 [22]150 untrained malesMedian: 2.8, 4.3, 2.6.DetailedNoUp to 108 participants
Chatterjee et al., 2019 [23]148 trained athletes (aged 10–20 years)Not givenSimpleNoUp to 57 participants
Sunitha and Joseph, 2018 [30]60 male PE students (15–17 years)Not givenSimpleNoUp to 23 participants
Bolunchuk et al., 2000 [35]63 male participants3.1 [±0.2], 3.7 [±0.2], 2.4 [±0.2]SimpleYes, <0.2 somatotype units.19 participants
Chaouachi et al., 2005 [36]41 fit PE studentsRange: 1.7–4.1, 2.0–4.8, 2.1–5.0.DetailedNo30 participants

5. Conclusions

This study has demonstrated that somatotype can be accurately classified in simplified form when TEMs are low, although this may still lead to 29% of participants being mis-categorized into the incorrect somatotype group. Error needs to be kept as low as possible when calculating somatotype and may need to be even lower than that stated by ISAK for accreditation of the most technically skilled anthropometrists. If a participant is mis-categorized into the incorrect somatotype group, observations between groups could be mis-represented. For this reason, simplified categorization should be used in group comparison studies. It is also recommended that authors of somatotype papers clearly state the technical skill of the measurer and the TEMs of their measures so any potential mis-classification can be accounted for. Future research could look to establish the minimum magnitude of error required to ensure exact categorization of somatotype grouping.

Author Contributions

Conceptualization, H.R.-S. and S.J.; methodology, H.R.-S.; software, H.R.-S.; validation, H.R.-S., J.F. and S.J.; formal analysis, H.R.-S.; investigation, H.R.-S.; resources, H.R.-S.; data curation, H.R.-S.; writing—original draft preparation, H.R.-S.; writing—review and editing, J.F. and S.J.; visualization, H.R.-S.; supervision, J.F. and S.J.; project administration, H.R.-S. All authors have read and agreed to the published version of the manuscript.

Funding

This research received no external funding.

Institutional Review Board Statement

The study was conducted according to the guidelines of the Declaration of Helsinki, and approved by the Institutional Ethics Committee of University of Winchester (protocol code BLS/11/15 and 06/11/2015).

Informed Consent Statement

Informed consent was obtained from all subjects involved in the study.

Data Availability Statement

The data presented in this study are available on request from the corresponding author. The data are not publicly available due to original ethical approval and consent not allowing for the sharing of data on a public repository.

Conflicts of Interest

The authors declare no conflict of interest.

References

  1. Atkinson, G.; Nevill, A.M. Statistical methods for assessing measurement error (reliability) in variables relevant to sports medicine. Sports Med. 1998, 26, 217–238. [Google Scholar] [CrossRef]
  2. Hopkins, W.G. Measures of reliability in sports medicine and science. Sports Med. 2000, 30, 1–15. [Google Scholar] [CrossRef] [Green Version]
  3. Harris, E.F.; Smith, R.N. Accounting for measurement error: A critical but often overlooked process. Arch. Oral Biol. 2009, 54, S107–S117. [Google Scholar] [CrossRef] [Green Version]
  4. Stewart, A.; Marfell-Jones, M.; Olds, T.; de Ridder, H. International Standards for Anthropometric Assessment; International Society for the Advancement of Kinanthropometry: Wellington, New Zealand, 2011. [Google Scholar]
  5. Ulijaszek, S.J.; Kerr, D.A. Anthropometric measurement error and the assessment of nutritional status. Br. J. Nutr. 1999, 82, 165–177. [Google Scholar] [CrossRef] [Green Version]
  6. Hume, P.; Marfell-Jones, M. The importance of accurate site location for skinfold measurement. J. Sports Sci. 2008, 26, 1333–1340. [Google Scholar] [CrossRef]
  7. Mueller, W.H.; Martorell, R. Reliability and accuracy of measurement. In Anthropometric Standardisation Reference Manual; Lohman, T.G., Roche, A.F., Martorell, R., Eds.; Human Kinetics Books: Champaign, IL, USA, 1988; pp. 83–86. [Google Scholar]
  8. Perini, T.A.; de Oliveira, G.L.; Ornellas, J.d.S.; de Oliveira, F.P. Technical error of measurement in anthropometry. Rev. Bras. Med. Esporte 2005, 11, 86–90. [Google Scholar]
  9. Field, A. Discovering Statistics Using SPSS, 3rd ed.; SAGE: London, UK, 2009. [Google Scholar]
  10. Eliasziw, M.; Young, S.L.; Woodbury, M.G.; Fryday-Field, K. Statistical Methodology for the Concurrent Assessment of Interrater and Intrarater Reliability: Using Goniometric Measurements as an Example. Phys. Ther. 1994, 74, 777–788. [Google Scholar] [CrossRef]
  11. Willgoose, C.E.; Rogers, M.L. Relationship of Somatotype to Physical Fitness. J. Educ. Res. 1949, 42, 704–712. [Google Scholar] [CrossRef]
  12. Carter, J.E.; Heath, B.H. Somatotyping Development and Applications; Cambridge University Press: Cambridge, UK, 1990. [Google Scholar]
  13. Carter, J.E.L. Somatotyping. In Anthropometrica; Norton, K., Olds, T., Eds.; University of New South Wales Press: Sydney, Australia, 2002; pp. 147–170. [Google Scholar]
  14. Buśko, K.; Pastuszak, A.; Kalka, E. Body composition and somatotype of judo athletes and untrained male students as a reference group for comparison in sport. Biomed. Hum. Kinet. 2017, 9, 7–13. [Google Scholar] [CrossRef] [Green Version]
  15. Roklicer, R.; Atanasov, D.; Sadri, F.; Jahic, D.; Bojanic, D.; Ljubojevic, M.; Trivic, T.; Drid, P. Somatotype of male and female judokas according to weight categories. Biomed. Hum. Kinet. 2020, 12, 34–40. [Google Scholar] [CrossRef] [Green Version]
  16. Guereño, P.L.; Otegui, A.U.; Zourdos, M.C.; Ayuso, J.M. Anthropometric profile, body composition and somatotype in elite traditional rowers: A cross-sectional study. Rev. Esp. Nutr. Hum. Diet. 2018, 22, 279–286. [Google Scholar] [CrossRef] [Green Version]
  17. Gryko, K.; Kopiczko, A.; Mikołajec, K.; Stasny, P.; Musálek, M. Anthropometric Variables and Somatotype of Young and Professional Male Basketball Players. Sports 2018, 6, 9. [Google Scholar] [CrossRef] [Green Version]
  18. Giannopoulos, N.; Vagenas, G.; Noutsos, K.; Barzouka, K.; Bergeles, N. Somatotype, Level of Competition, and Performance in Attack in Elite Male Volleyball. J. Hum. Kinet. 2017, 58, 131–140. [Google Scholar] [CrossRef] [Green Version]
  19. Kandel, M.; Baeyens, J.P.; Clarys, P. Somatotype, training and performance in Ironman athletes. Eur. J. Sport Sci. 2013, 14, 301–308. [Google Scholar] [CrossRef]
  20. Cárdenas-Fernández, V.; Chinchilla-Minguet, J.L.; Castillo-Rodríguez, A. Somatotype and Body Composition in Young Soccer Players According to the Playing Position and Sport Success. J. Strength Cond. Res. 2019, 33, 1904–1911. [Google Scholar] [CrossRef]
  21. Ryan-Stewart, H.; Faulkner, J.; Jobson, S. The influence of somatotype on anaerobic performance. PLoS ONE 2018, 13, e0197761. [Google Scholar] [CrossRef]
  22. Çinarli, F.; Kafkas, M. The effect of somatotype characters on selected physical performance parameters. Phys. Educ. Stud. 2019, 23, 279–287. [Google Scholar] [CrossRef] [Green Version]
  23. Chatterjee, P.; Bandyopadhyay, A.; Chatterjee, P.; Nandy, P. Assessment and Comparative Analysis of Different Lung Capacities in Trained Athletes According to Somatotype. Am. J. Sports Sci. 2019, 7, 72–77. [Google Scholar] [CrossRef]
  24. Arroyo, M.; Freire, M.; Ansotegui, L.; Rocandio, A.M. Intraobserver error associated with anthropometric measurements made by dietitians. Nutr. Hosp. 2010, 25, 1053–1056. [Google Scholar] [PubMed]
  25. Buśko, K.; Lewandowska, J.; Lipińska, M.; Michalski, R.; Pastuszak, A. Somatotype-variables related to muscle torque and power output in female volleyball players. Acta Bioeng. Biomech. 2013, 15, 119–126. [Google Scholar]
  26. Ferrari, E.P.; Silva, D.A.S.; Martins, C.R.; Fidelix, Y.L.; Petroski, E.L. Morphological characteristics of professional ballet dancers of the Bolshoi theater company. Coll. Antropol. 2013, 37, 37–43. [Google Scholar] [PubMed]
  27. Marta, C.C.; Marinho, D.A.; Barbosa, T.M.; Carneiro, A.L.; Izquierdo, M.; Marques, M.C. Effects of Body Fat and Dominant Somatotype on Explosive Strength and Aerobic Capacity Trainability in Prepubescent Children. J. Strength Cond. Res. 2013, 27, 3233–3244. [Google Scholar] [CrossRef] [PubMed]
  28. Grgantov, Z.; Padulo, J.; Milić, M.; Ardigò, L.P.; Erceg, M.; Cular, D. Intra-Positional and Inter-Positional Differences in Somatotype Components and Proportions of Particular Somatotype Categories in Youth Volleyball Players. Ann. Appl. Sport Sci. 2017, 5, 37–49. [Google Scholar] [CrossRef]
  29. Gjonbalaj, M.; Georgiev, G.; Bjelica, D. Differences in Anthropometric Characteristics, Somatotype Components, and Functional Abilities among Young Elite Kosovo Soccer Players Based on Team Position. Int. J. Morphol. 2018, 36, 41–47. [Google Scholar] [CrossRef] [Green Version]
  30. Sunitha, K.B.; Joseph, M.M. Effect of dominant somatotype on motor quality trainability. Yoga 2018, 3, 880–883. [Google Scholar]
  31. Goto, R.; Mascie-Taylor, C.N. Precision of Measurement as a Component of Human Variation. J. Physiol. Anthr. 2007, 26, 253–256. [Google Scholar] [CrossRef] [PubMed] [Green Version]
  32. Alvero-Cruz, J.R.; Mathias, V.P.; García-Romero, J.C. Somatotype Components as Useful Predictors of Disordered Eating Attitudes in Young Female Ballet Dance Students. J. Clin. Med. 2020, 9, 2024. [Google Scholar] [CrossRef] [PubMed]
  33. Sanchez Munoz, C.; Muros, J.J.; Lopez Belmonte, O.; Zabala, M. Anthropometric characteristics, body composition and somatotype of elite male young runners. Int. J. Environ. Res. Public Health 2020, 17, 674. [Google Scholar] [CrossRef] [Green Version]
  34. Bolonchuk, W.W.; Siders, W.A.; Lykken, G.I.; Lukaski, H.C. Association of dominant somatotype of men with body structure, function during exercise, and nutritional assessment. Am. J. Hum. Biol. 2000, 12, 167–180. [Google Scholar] [CrossRef]
  35. Chaouachi, M.; Chaouachi, A.; Chamari, K.; Chtara, M.; Feki, Y.; Amri, M.; Trudeau, F. Effects of dominant somatotype on aerobic capacity trainability. Br. J. Sports Med. 2005, 39, 954–959. [Google Scholar] [CrossRef] [Green Version]
  36. Carter, J.E.L.; Mirwald, R.L.; Heath-Roll, B.H.; Bailey, D.A. Somatotypes of 7- to 16-year-old boys in Saskatchewan, Canada. Am. J. Hum. Biol. 1997, 9, 257–272. [Google Scholar] [CrossRef]
Figure 1. Somatocharts demonstrating: (a) distribution of somatotype for study participants (n = 68); (b) mean somatotype for population with RTEM mean ranges; (c) Mean somatotype for population with L23TEM mean ranges; (d) Mean somatotype for population with L1TEM mean ranges. ▪ = population mean. O = RTEM 95% confidence intervals.
Applsci 12 03056 g001aApplsci 12 03056 g001b
Table 1. Percentage of participants potentially mis-classified based on 95% CI’s.
Somatotype CategoryRTEML23TEML1TEM
Detailed39.7%61.8%72.1%
Simplified29.4%35.3%38.2%
Note: RTEM = Researcher TEM, L23TEM = Error associated with ISAK Level 2 and 3 TEM, L1TEM = Error associated with ISAK Level 1 TEM.
Publisher’s Note: MDPI stays neutral with regard to jurisdictional claims in published maps and institutional affiliations.

