Article

Catalytic Degradation of Anionic Organic Dye on Greenly Synthesized CuO/ZnO Nanocomposites

1
Department of Biomedical Engineering, Faculty of Engineering, King Faisal University, P.O. Box 400, Al-Ahsa 31982, Saudi Arabia
2
Department of Chemistry, Faculty of Science, King Faisal University, P.O. Box 400, Al-Ahsa 31982, Saudi Arabia
3
Department of Chemistry, Faculty of Science and Technology, Al-Neelain University, P.O. Box 12702, Khartoum 11121, Sudan
*
Authors to whom correspondence should be addressed.
Appl. Sci. 2022, 12(6), 2910; https://doi.org/10.3390/app12062910
Submission received: 16 February 2022 / Revised: 7 March 2022 / Accepted: 9 March 2022 / Published: 11 March 2022

Abstract

:
CuO/ZnO nanocomposites were greenly prepared and tested for the catalytic degradation of methyl orange. The XRD analysis confirmed the existence of CuO and ZnO with crystallite sizes within the range of 15–30 nm. TEM and SEM images showed different morphological properties. The TGA analysis revealed a good thermal stability of the nanocomposite, with a total loss of less than 18% at a temperature of 700 °C. The nanocomposites were tested for the catalytic degradation of methyl orange under mild conditions with a catalyst mass/wastewater volume of 10 g/3 L, an initial dye concentration of 40 ppm, a pH of 4.5, and a degradation time of 3 h. The best efficiency of 49.1% was achieved by CuO nanoparticles (C), followed by 47.6%, which was obtained by 1C1Z. The degradation efficiency of ZnO (Z) was 16.4%, and it was increased by increasing the CuO precursor in the synthesis mixture, while adding ZnO to the CuO, resulting in a decrease in its catalytic performance.

1. Introduction

With increasing human activities, higher levels of contamination are emerging, especially water contamination. The main source of water contamination is the direct discharge of industrial waste into water bodies, such as from textile industries, paper printing, leather, plastic, pharmaceutical, and cosmetics [1,2]. Furthermore, contamination may be a result of the pollutants’ precipitation from atmospheric air [1]. Among different water pollutants, organic dyes, such as methyl orange, are considered the main risk factor, due to their complex structure. Most of these dyes are highly water-soluble and non-biodegradable. Thus, it is very difficult to eliminate them and they tend to accumulate [2]. Furthermore, these dyes are classified as highly toxic, chromatic, and carcinogenic. In addition, they are very harmful to aquatic life, since they affect the light absorbance by the water bodies, which in turn affects all of the biological degradation occurring with the aid of light and also causes oxygen imbalance in the aquatic system [1,3].
Adsorption is considered one of the most attractive techniques for the remediation of organic dyes from water systems. This is mainly due to its simplicity, low cost, low maintenance requirements, and the availability of a very wide range of adsorbents that can be utilized for this purpose [4]. Many researchers have reported the successful removal of methyl orange by adsorption using different adsorbents, such as activated carbon, chitosan-based adsorbents [1,5], mesoporous maghemite [4], ulexite [2], nanoparticles [6,7], nanotubes [8], polymers [9], MOF/graphite oxide composites [10], hydrogel composites [11], and many others [12]. In a previous contribution to our research group, ZnO/NiO nanocomposites were greenly prepared and utilized for the adsorption of methyl orange, and reported a removal efficiency of 100% from 6.25 ppm [13].
However, despite all the advantages of the adsorption technique for removing organic dyes from wastewater, it has some drawbacks, such as the separation of adsorbents from water bodies, safe disposal of the saturated adsorbent especially if they are single-use adsorbents, and the possibility of leaching the dye back into to the water system under certain conditions. Accordingly, there is a need for a more suitable technique to be developed. Photocatalytic degradation is considered very attractive, especially if a suitable catalyst is used under suitable conditions to produce non-harmful products [14]. The main advantages of photocatalytic degradation over other treating methods are that there is no need for further treatment or another separation process, there is a low consumption of chemicals, and the catalyst can be reused for many treatment cycles [15].
For this purpose, semiconductor-based catalysts were developed and applied for the photodegradation of methyl orange [15]. The development of ZnO-based nanoparticles has attracted much attention due to their high chemical and physical stabilities, availability, nontoxicity, low cost, wide bandgap (3.37 eV), and very high photosensitivity [16,17,18]. However, it suffers from a fast recombination of the photo-generated electrons and the holes; also, it absorbs light only in the UV region and does not absorb the visible light. To overcome this shortage, ZnO can be improved by being mixed with CuO, as the oxide is a p-type semiconductor with a small bandgap (1.2–1.5 eV), to improve its photodegradation activity [19]. In addition to this, mixing metal oxides’ nanoparticles also enhances the charge carriers’ transfer (holes and electrons) and inhibits the recombination of these charge carriers [15].
However, there are still some limitations of the photodegradation treatment, such as the fluctuation of light between days and nights, which leads to an instability of the processes [20]. Therefore, there is still a need to develop a catalyst material that can work under dark conditions without the need for exposure to any kind of light. Accordingly, this work aims to investigate CuO/ZnO greenly prepared nanocomposites’ catalytic ability towards the degradation of methyl orange under mild conditions (dark and stagnant). The catalytic degradation of the dye was investigated by changing the composition of the nanocomposite and, also, with and without controlling the pH of the reaction mixture.

2. Materials and Methods

2.1. Chemicals

Zinc chloride (ZnCl2), copper chloride hexahydrate (CuCl2.6H2O), and potassium hydroxide (KOH) were bought from Sigma-Aldrich (Missouri, USA). All chemicals were of an analytical grade and were used without any treatment. The Acacia nilotica pods were bought from a local Al-Ahsa market in Saudi Arabia. Double-distilled water was used to prepare all the solutions used for the synthesis and degradation tests.

2.2. Experimental Procedures

2.2.1. Preparing the Acacia nilotica (ANE)

The dried Acacia nilotica pods were thoroughly washed with tap water, to remove any contamination such as dust, then with distilled water, before being dried at room temperature for a few days. The pods were ground into powder, to enhance the extraction process. After that, 10 g of the pods’ powder was mixed with 100 mL of double-distilled water and boiled for 15 min. Finally, the extract was centrifuged at 8000 rpm for 5 min and then separated by filtration using Whatman filter paper and kept refrigerated until it was used.

2.2.2. Green Synthesis of CuO/ZnO Nanocomposite

Copper chloride hexahydrate (CuCl2.6H2O, 0.2 M) and zinc chloride (ZnCl2, 0.2 M) solutions were first prepared with double-ionized water in two different volumetric flasks. To prepare the nanocomposites, a specific amount of the Acacia nilotica extract was mixed with certain volumes of the CuCl2.6H2O and ZnCl2 solutions, according to Table 1. Then, the pH of the mixture was adjusted to 10 by adding 1 M KOH and an Orion star pH meter. The mixture was then added into a Teflon autoclave and hydrothermally treated in the oven at 250 °C for 2.5 h. After that, the mixture was poured into a 250 mL beaker, mixed with 100 mL of double-distilled water, and then sonicated for 1 h. The mixture was, then, allowed to settle down under the effect of gravity, and the top liquid layer was disposed of. Sonication with water and gravity settling was triplicated and, finally, with ethanol. The sample was then dried in a convection oven at 75 °C for 17 h. To ensure that all the plant extract had been eliminated from the sample, it was calcined at 300 °C for 2 h, then cooled down to room temperature, coded according to Table 1, and stored in a well-sealed container until it was used. To measure the exact composition of the prepared nanocomposites, a specific amount ( m T ) of each nanocomposite was dissolved in a specific amount of HNO3, then diluted with double-distilled and deionized water. The solution was then analyzed with atomic absorption spectroscopy (AAS) to measure the concentration of Zn2+. The following calculations were then performed to calculate the percentage of ZnO and CuO of each sample:
m Z n O = Z n + 2 × V × M w Z n O                
m C u O = m T m Z n O                
%   Z n O = m Z n O m T × 100          
%   C u O = m C u O m T × 100      
where V is the total volume of the prepared solution (mL), M w Z n O is the molecular weight of ZnO (gmol−1), and m T , m C u O , and m Z n O are the total mass of the nanocomposite (mg), mass of CuO, and of ZnO (mg), respectively.

2.2.3. Catalytic Degradation Experiments

The catalytic degradation of methyl orange (MO) was performed to evaluate the catalytic activity of the CuO/ZnO nanocomposites. The catalytic degradation tests were performed by mixing 3 mL of MO solution (40 ppm, pH = 4.5) with 0.2 mL of hydrogen peroxide (H2O2), and 0.01 g of the nanocomposite. The degradation was followed by measuring the UV absorbance every 10 min for 3 h. The absorbance measurement was performed with a UVVis spectrophotometer (Shimadzu) at ʎmax of 465 nm. The percentage of catalytic degradation was calculated by Equation (5):
%   Degradation =   A 0   A   A 0 × 100
where A0 is the initial absorbance of MO at ʎmax, while A is the absorbance at time t.

2.2.4. pH of Zero Point Charge (pHzpc)

To estimate the pH of zero charges of each sample, the equilibrium technique was used as follows: A 0.1 M NaCl solution was prepared and divided into six 200 mL beakers. Then, each beaker was adjusted to different pH values in the range of 2–12 with HNO3 and KOH solutions. For each sample, 20 mL of the solution was stirred with 0.01 g of the nanocomposite for 24 h to allow equilibrium and, finally, the equilibrium pH of each solution was measured with an Orion star pH meter.

2.3. Characterization

The thermal stability of the prepared samples was investigated via thermal gravimetric analysis, which was performed with a Q500 thermogravimetric analyzer. Specifically, 6.7 mg of sample 1C1Z was placed in a platinum pan and heated under the flow of nitrogen (40 mL/min) and a heating ramp of 10 °C/min from 20 °C to 700 °C. The FTIR spectrum of the five prepared samples was collected using a Cary 630 FT-IR spectrophotometer within the wavenumber range of 400–4000 cm−1. The XRD analysis was performed with a Burker D8 x-ray diffractometer with Ni-filtered Cu-Kα radiation and a graphite monochromator to produce x-rays with a wavelength of 1.5418 Å at 35 kV and 25 mA, using a glancing angle from 10° to 60° and a scan step of 0.02°. Scanning electron microscope (SEM) was performed with a Philips XL30 at an accelerating voltage of 30 kV and a magnification of up to 400,000×. Transmission electron microscope (TEM) was performed with a high-resolution JEOL JEM-1011.

3. Results and Discussion

Figure 1 shows the FTIR of ANE, Z, 1C3Z, 1C1Z, 3C1Z, and C nanocomposites before (a) and after hydrothermal treatment and calcination (b). The ANE spectrum contains more than five peaks, indicating that it is not a simple chemical, and it has some common peaks with the nanocomposites. Before hydrothermal treatment (Figure 1a), all nanocomposites have the same pattern with a broad peak in the range of 3200–3400 cm−1, which indicates a hydrogen bond. This band indicates the existence of hydroxyl (-OH) and (H2O) adsorbed on the surface [21]. The other common peak at 1620 cm−1 is related to the hydroxyl group (-OH). The small peak at around 2100 cm−1 can be related to the absorption band of C≡C [21]. After hydrothermal treatment and calcination, the intensity of the peaks at 3200–3400 cm−1 and 1620 cm−1 become very weak due to the conversion of metal hydroxide into metal oxide and due to the dehydration of the surface during the calcination process. In Figure 1b, the appearance of the peaks below 700 cm−1 after hydrothermal treatment confirms the successful conversion of metal hydroxide into metal oxide, since this band is related to the metaloxygen bonds in both ZnO and CuO.
Figure 2 shows the XRD patterns for the five prepared nanocomposites. Lines 1, 3, 5, 7, and 10 located at 2Ɵ ~ 31.96°, 34.61°, 36.44°, 47.74°, and 56.73° represent the diffraction planes (1 0 0), (0 0 2), (1 0 1), (0 1 2), and (1 1 0), respectively, of the ZnO hexagonal structure (Card no. 96-900-4179). The intensity of these peaks decreased by decreasing the zinc precursor in the synthesis mixture, and disappeared in sample C, which represents pure CuO. Lines 2, 4, 6, 8, and 9, passing through the peaks at 2θ ~ 32.47°, 35.60°, 38.90°, 48.96°, and 53.576°, correspond to planes (1 1 0), (1 1 1), (1 1 1), (2 0 2), and (0 2 0), respectively, of tenorite copper oxide with a monoclinic phase (Card no. 96-721-2243). The intensity of the monoclinic tenorite copper oxide peaks increases gradually, by the increase in copper precursor in the synthesis mixture, according to Table 1.
The crystallite sizes of ZnO and CuO were measured using the DebyeScherrer equation and are reported in Table 2. The main peaks of the plane (101) of ZnO and plane (111) of CuO were used to estimate the crystallite size of ZnO and CuO, respectively. The crystallite sizes of pristine zinc oxide and pristine copper oxide were 26 and 29 nm, respectively. It is clear from Table 2 that, when the starting mixture contained 25% of a copper precursor, the crystallite size of ZnO increased to 30 nm. By a further increase in the copper precursor to 50% and 75%, the crystallite size of ZnO decreased to 21 and 17 nm, respectively. However, adding ZnO to the starting synthesis mixture always resulted in a lower crystallite size of CuO and for any composition, as shown in Table 2. In addition to this qualitative evidence for the presence of both CuO and ZnO in the prepared nanocomposites, another qualitative analysis was performed for each sample; the compositions are shown in Table 2. It is apparent that the tendency of CuO for formation is higher than that of ZnO under the conditions used in this work. For example, sample 3, which was prepared with a 1:1 ratio of the precursors of both metal oxide. However, the final nanocomposite contains 69.3% of CuO and 30.7% of ZnO.
Figure 3 shows the SEM images of the five prepared samples at two different magnifications. Sample Z has a stacked layers structure with sharp edges. Adding CuO precursor to the synthesis mixture caused a huge change in the surface morphology, as obtained for sample 1C3Z, which had a mixture of spherical CuO particles and ZnO rods, with a more porous structure. Increasing the percentage of the CuO precursor in the synthesis mixture to 50% (1C1Z) resulted in irregular shapes for both CuO and ZnO with almost similar sizes. Further increase in the CuO precursor to 75% (3C1Z) resulted in flakes (ZnO) with spherical particles (CuO). Sample C, which is made of 100% CuO, has 1 irregularly shaped particle with sharp edges.
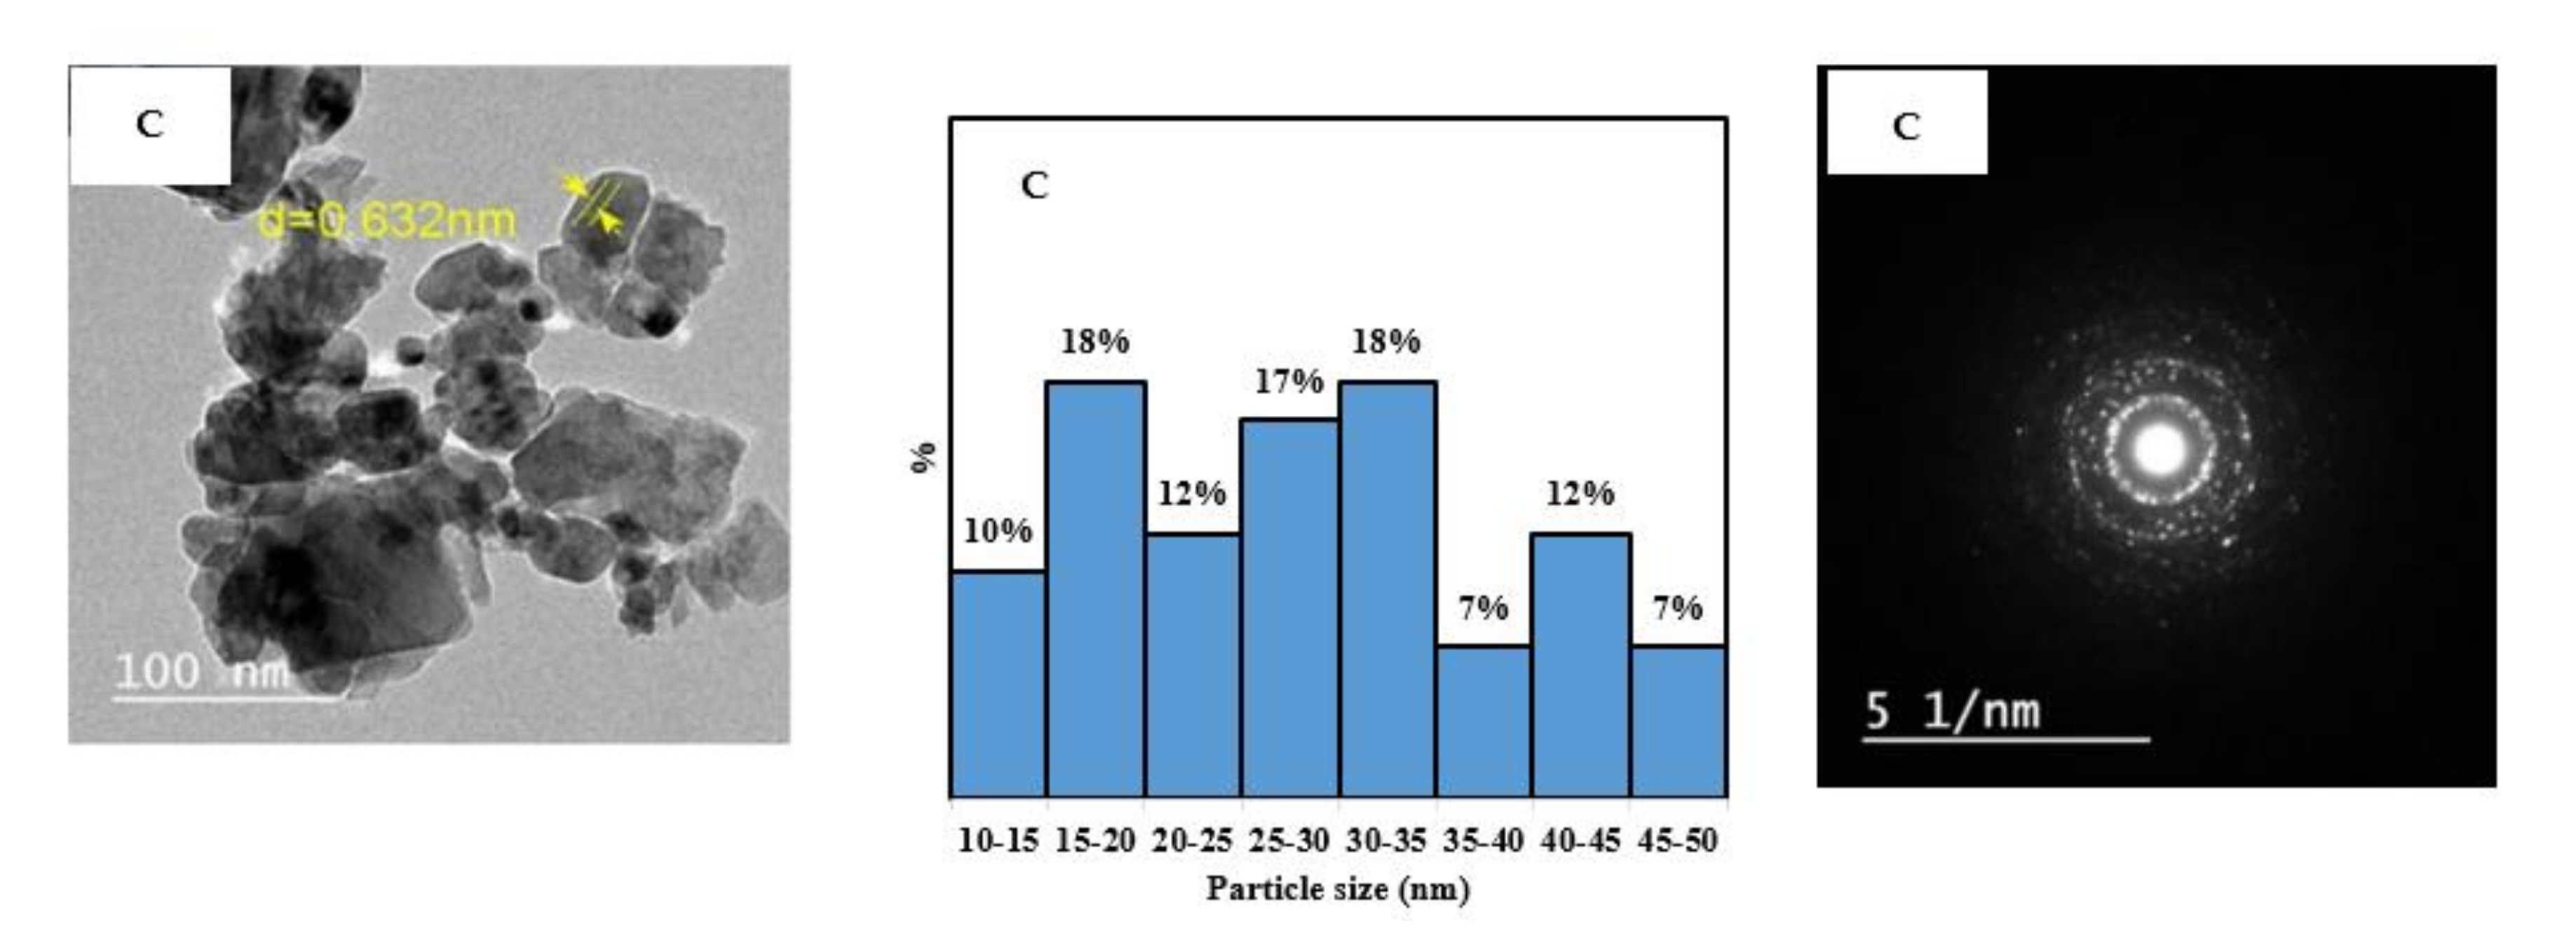
Figure 4 shows the TEM images of the five prepared samples. The concentric rings shown in the SAED images confirm the crystalline structure for all samples. The TEM images were used with image J software to find the particle size distribution for each nanocomposite. Figure 4 shows that the nanocomposite Z has the narrowest particle size distribution, with 73% of the particles in the range of 5–10 nm. By increasing the percentage of the Cu precursor in the synthesis mixture, wider distribution and larger particle size were obtained. For 1C3Z, 1C1Z, and 3C1Z, 40%, 43%, and 40% of the particles, respectively, are in the range of 10–15 nm. For sample C, the particle size distribution is very widely distributed in the range of 0–50 nm, with most of the particles between 15–35 nm.
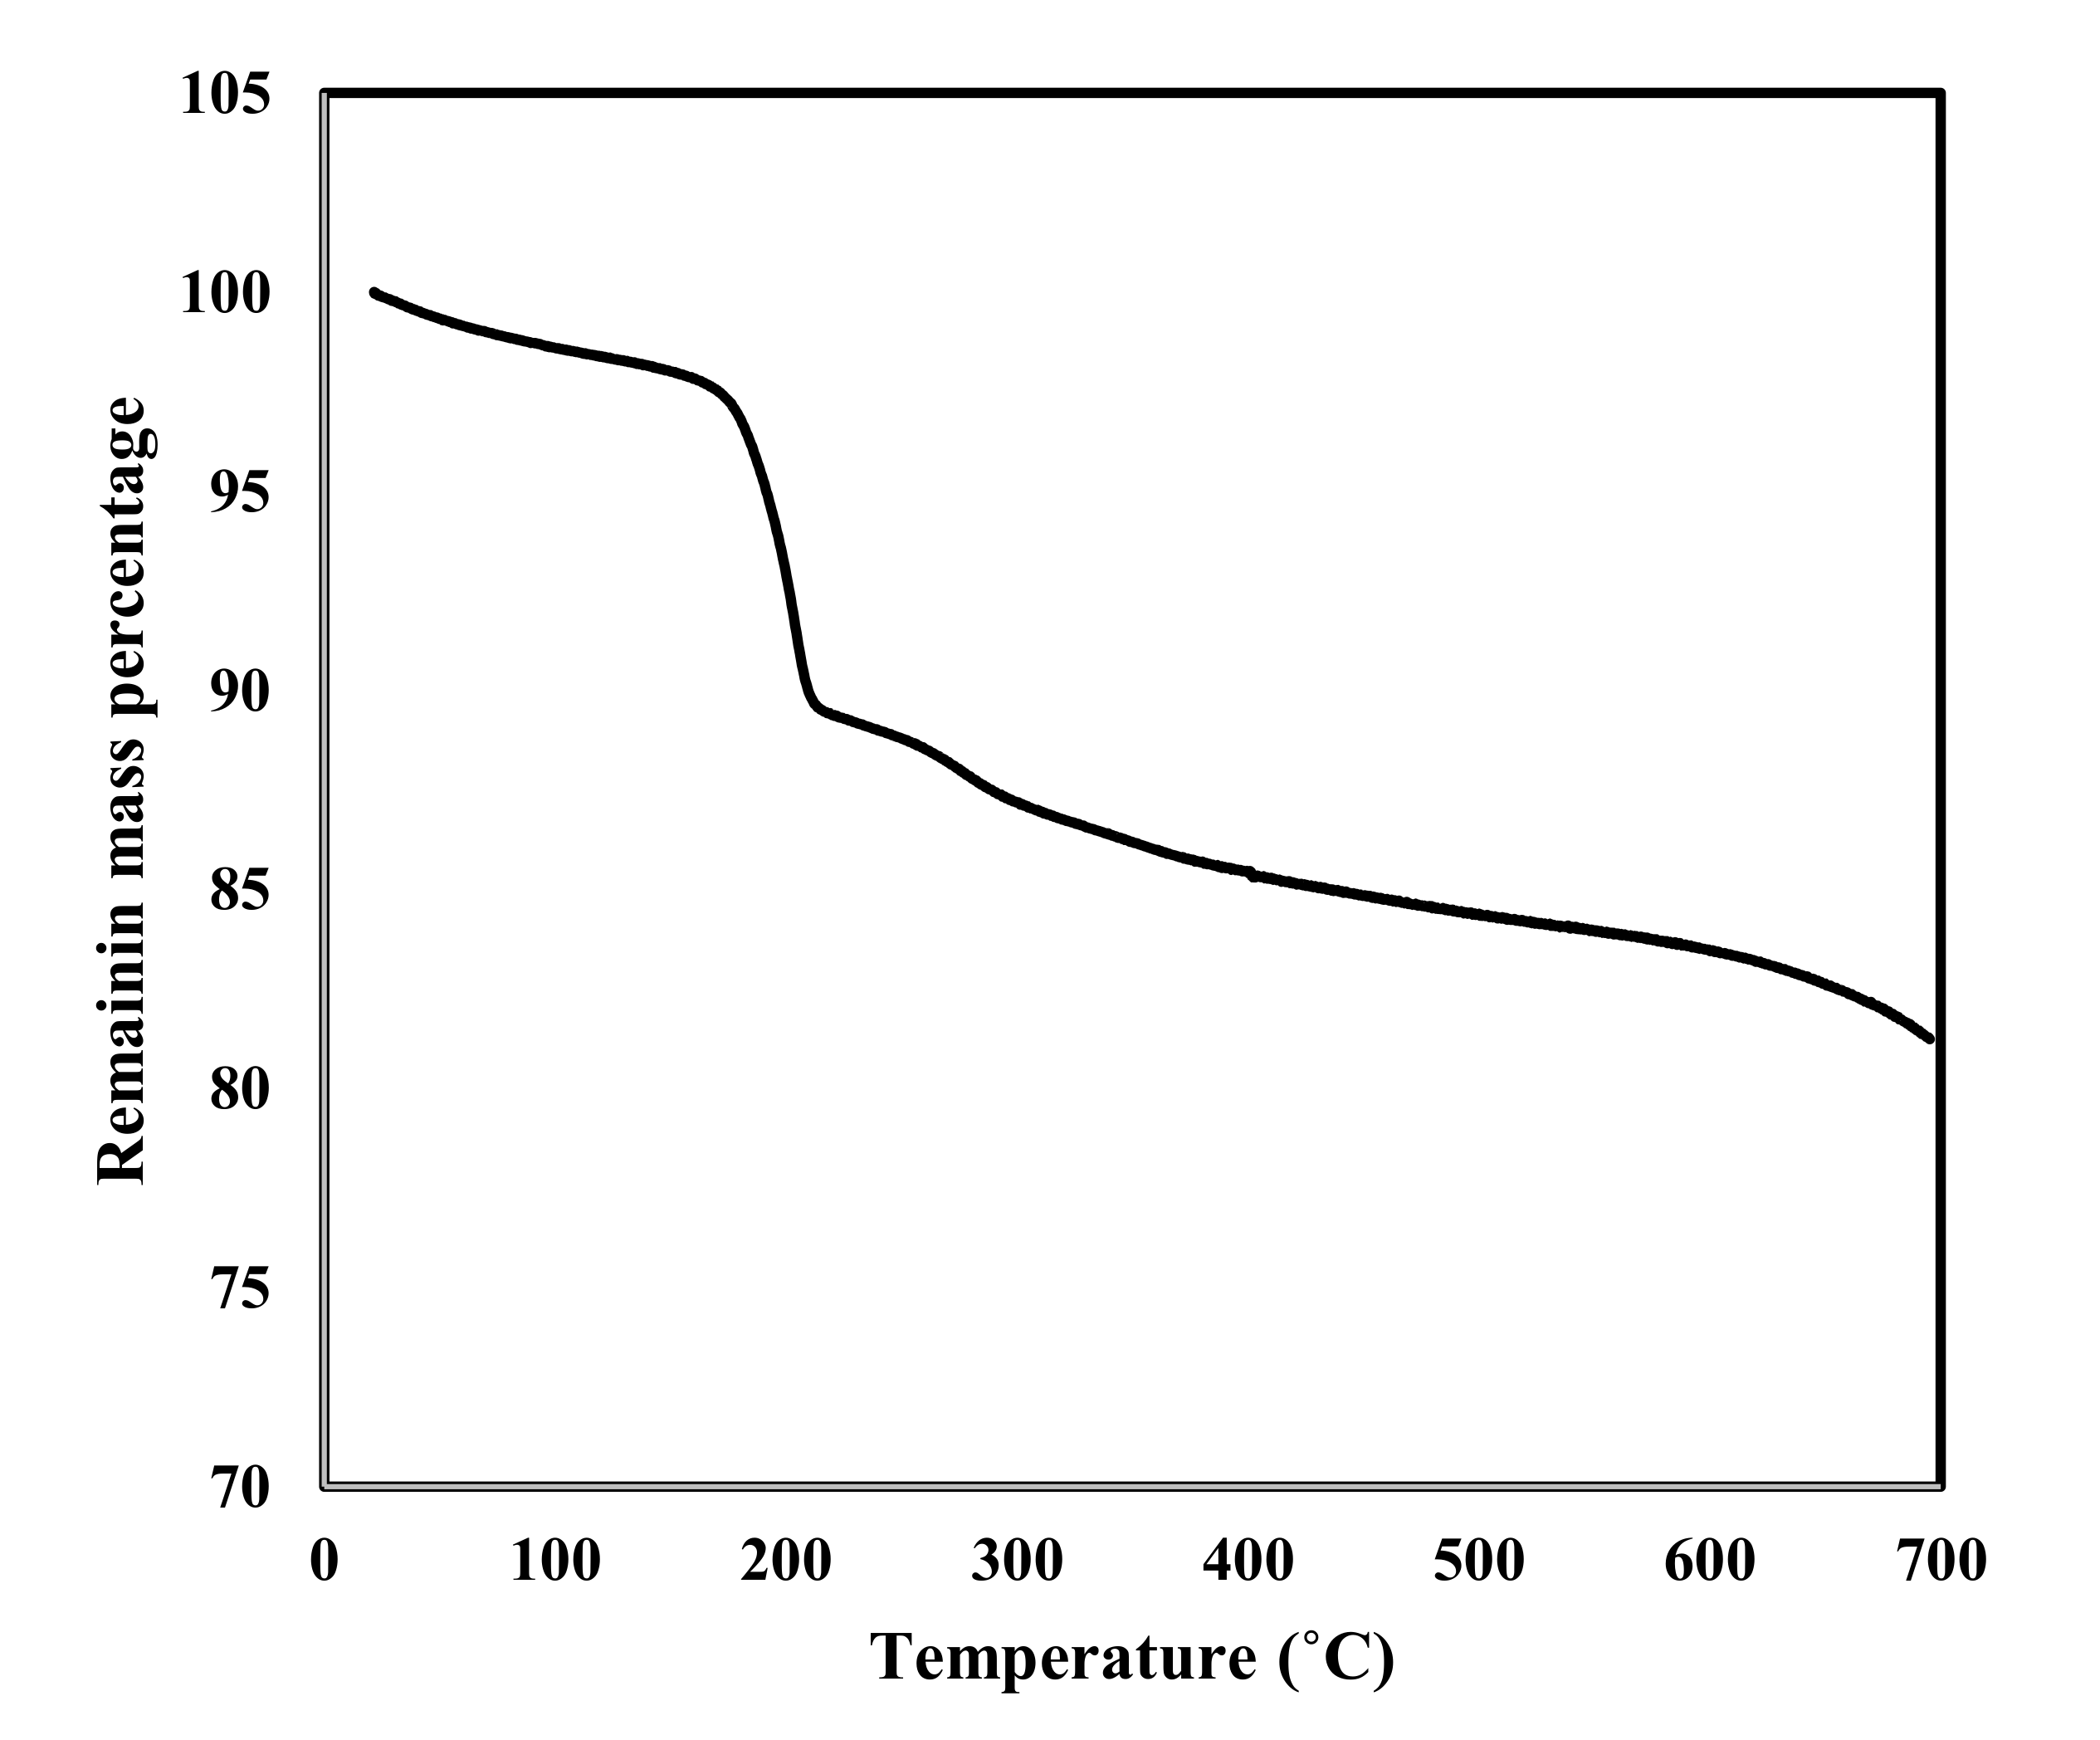
TGA analysis was performed for sample 1C1Z for the temperature range of 20–700 °C, as shown in Figure 5. The sample lost only 2.5% during the first period of treatment (20–175 °C), which is mainly related to the loss of some adsorbed gases (CO2, N2) and water on the external surface of the sample. After that, the sample lost 7% before reaching 220 °C, which may be related to the strongly adsorbed water within the pores. After that sharp decrease in mass, the sample continued to lose mass in a slower and almost regular manner, until it reached a total loss of 18% at 700 °C. The last loss of material, almost 9%, may be related to the decomposition of some organic residual from the extract. This is supported by the EDEX analysis performed for the same sample (Figure 6), which shows the presence of some minerals (Na, K) and Cl ions. These ions are mainly from the plant extract used during the synthesis process.
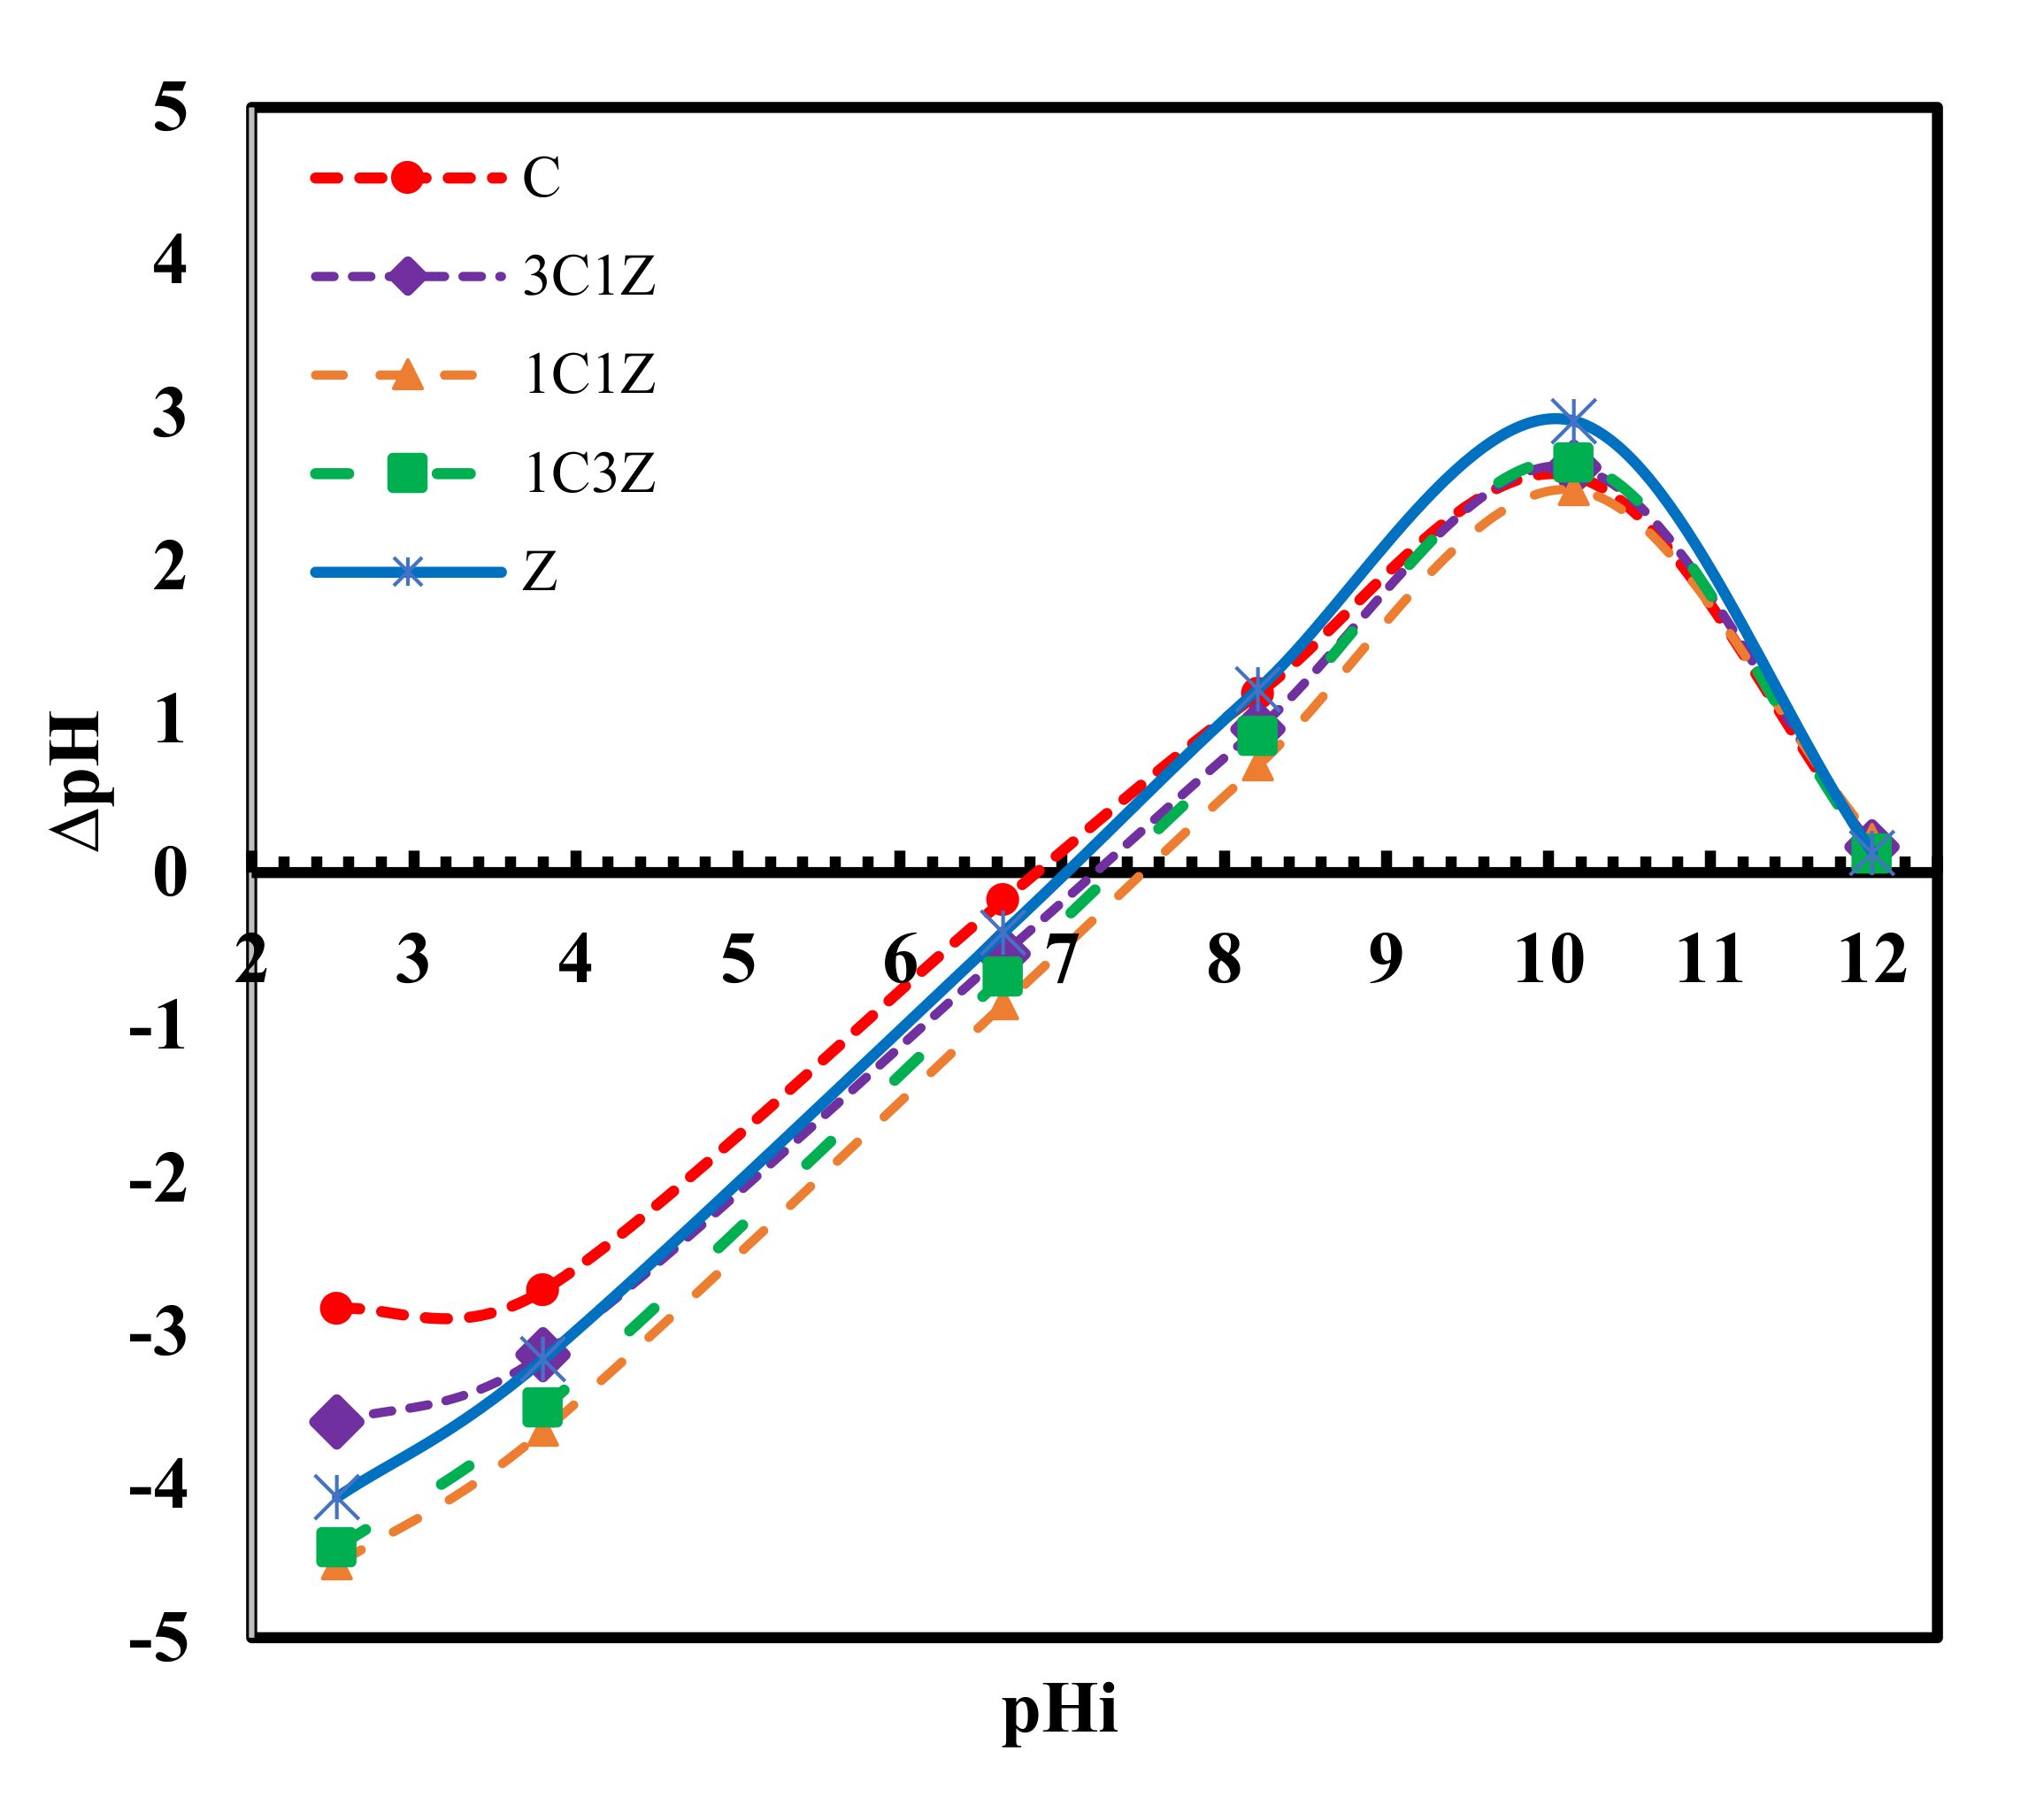
Figure 7 shows the results of the equilibrium technique used to measure the pH of the zero point charge for each sample. This point represents the x-intercept of the ∆pH versus pHi. From the figure, it is apparent that the pHZPC of Z, 1C3Z, 1C1Z, 3C1Z, and 1C are 7.0, 7.3, 7.5, 7.2, and 6.8, respectively. These values imply that, for a solution with a pH of higher than 7.2, all the samples are expected to be deprotonated and their surfaces will become negatively charged. On the contrary, if these samples are placed in a solution with a pH of less than 6.8, they will be protonated with a positively charged surface. This concept is very important for any surface phenomena such as adsorption or heterogeneous catalytic reactions, since the first step is expected to be the diffusion of the target molecule, which is MO, to reach the active sites on the catalyst surface; since MO dye is known to be an anionic dye that forms anions in aqueous solution, it is expected that decreasing the pH of the solution to a lower value than the pHZPC would enhance the degradation process by increasing the rate of reaching MO to the surface under the effect of electrical attraction. Accordingly, all the degradation tests were performed at a pH of 4.5, as will be discussed next. It is expected that under this pH value (4.5), the most positively charged surface will be 1C1Z, and this is maybe one reason for the best degradation efficiency obtained by this nanocomposite, compared to the other samples. Degradation results shown in Figure 8 and Figure 9 suggest that the main two parameters affecting the degradation efficiency of the prepared samples are pHZPC and the content of CuO. For samples Z, 1C3Z, and 1C1Z, there was a gradual increase in the degradation efficiency as a result of increasing both the CuO% and pHZPC. For samples 3C1Z and C, the degradation efficiency started to decline despite the increase in the CuO%. This may be related to the decrease in the pH0 for these two samples.
Figure 10 shows that for the five nanocomposites, gas bubbles appear after adding the nanocomposite to the MO solution, which indicates the formation of CO2 gas as a result of MO degradation, as reported by other research groups [22,23]. As the time passed, the number of gas bubbles decreased, as shown in the third row of Figure 10, indicating that the rate of reaction slowed over time. This is mainly because the concentration of MO declines over time as a result of degradation; accordingly, the driving force for the diffusion of MO from the bulk of the solution to the surface of the catalyst becomes smaller, especially as the tests were performed stagnantly without any stirring, leading to a smaller amount of MO adsorbed on the surface of the catalyst and, thus, a slower rate of degradation. Figure 10 also shows the change in solution color as a result of degradation.
To confirm the rule of the nanocomposite in the degradation process, a blank test (B) was performed by mixing the MO solution with H2O2 and adjusting the pH at 4.5. As shown in the first column of Figure 10, there was no change in the solution color after 3 h or 24 h, indicating that no degradation took place. Another test was performed to confirm that catalytic degradation took place, rather than adsorption. This test was performed by mixing the MO solution with the nanocomposites without adding H2O2, and the pH was adjusted at 4.5. The obtained results showed no decrease in the concentration of MO. 
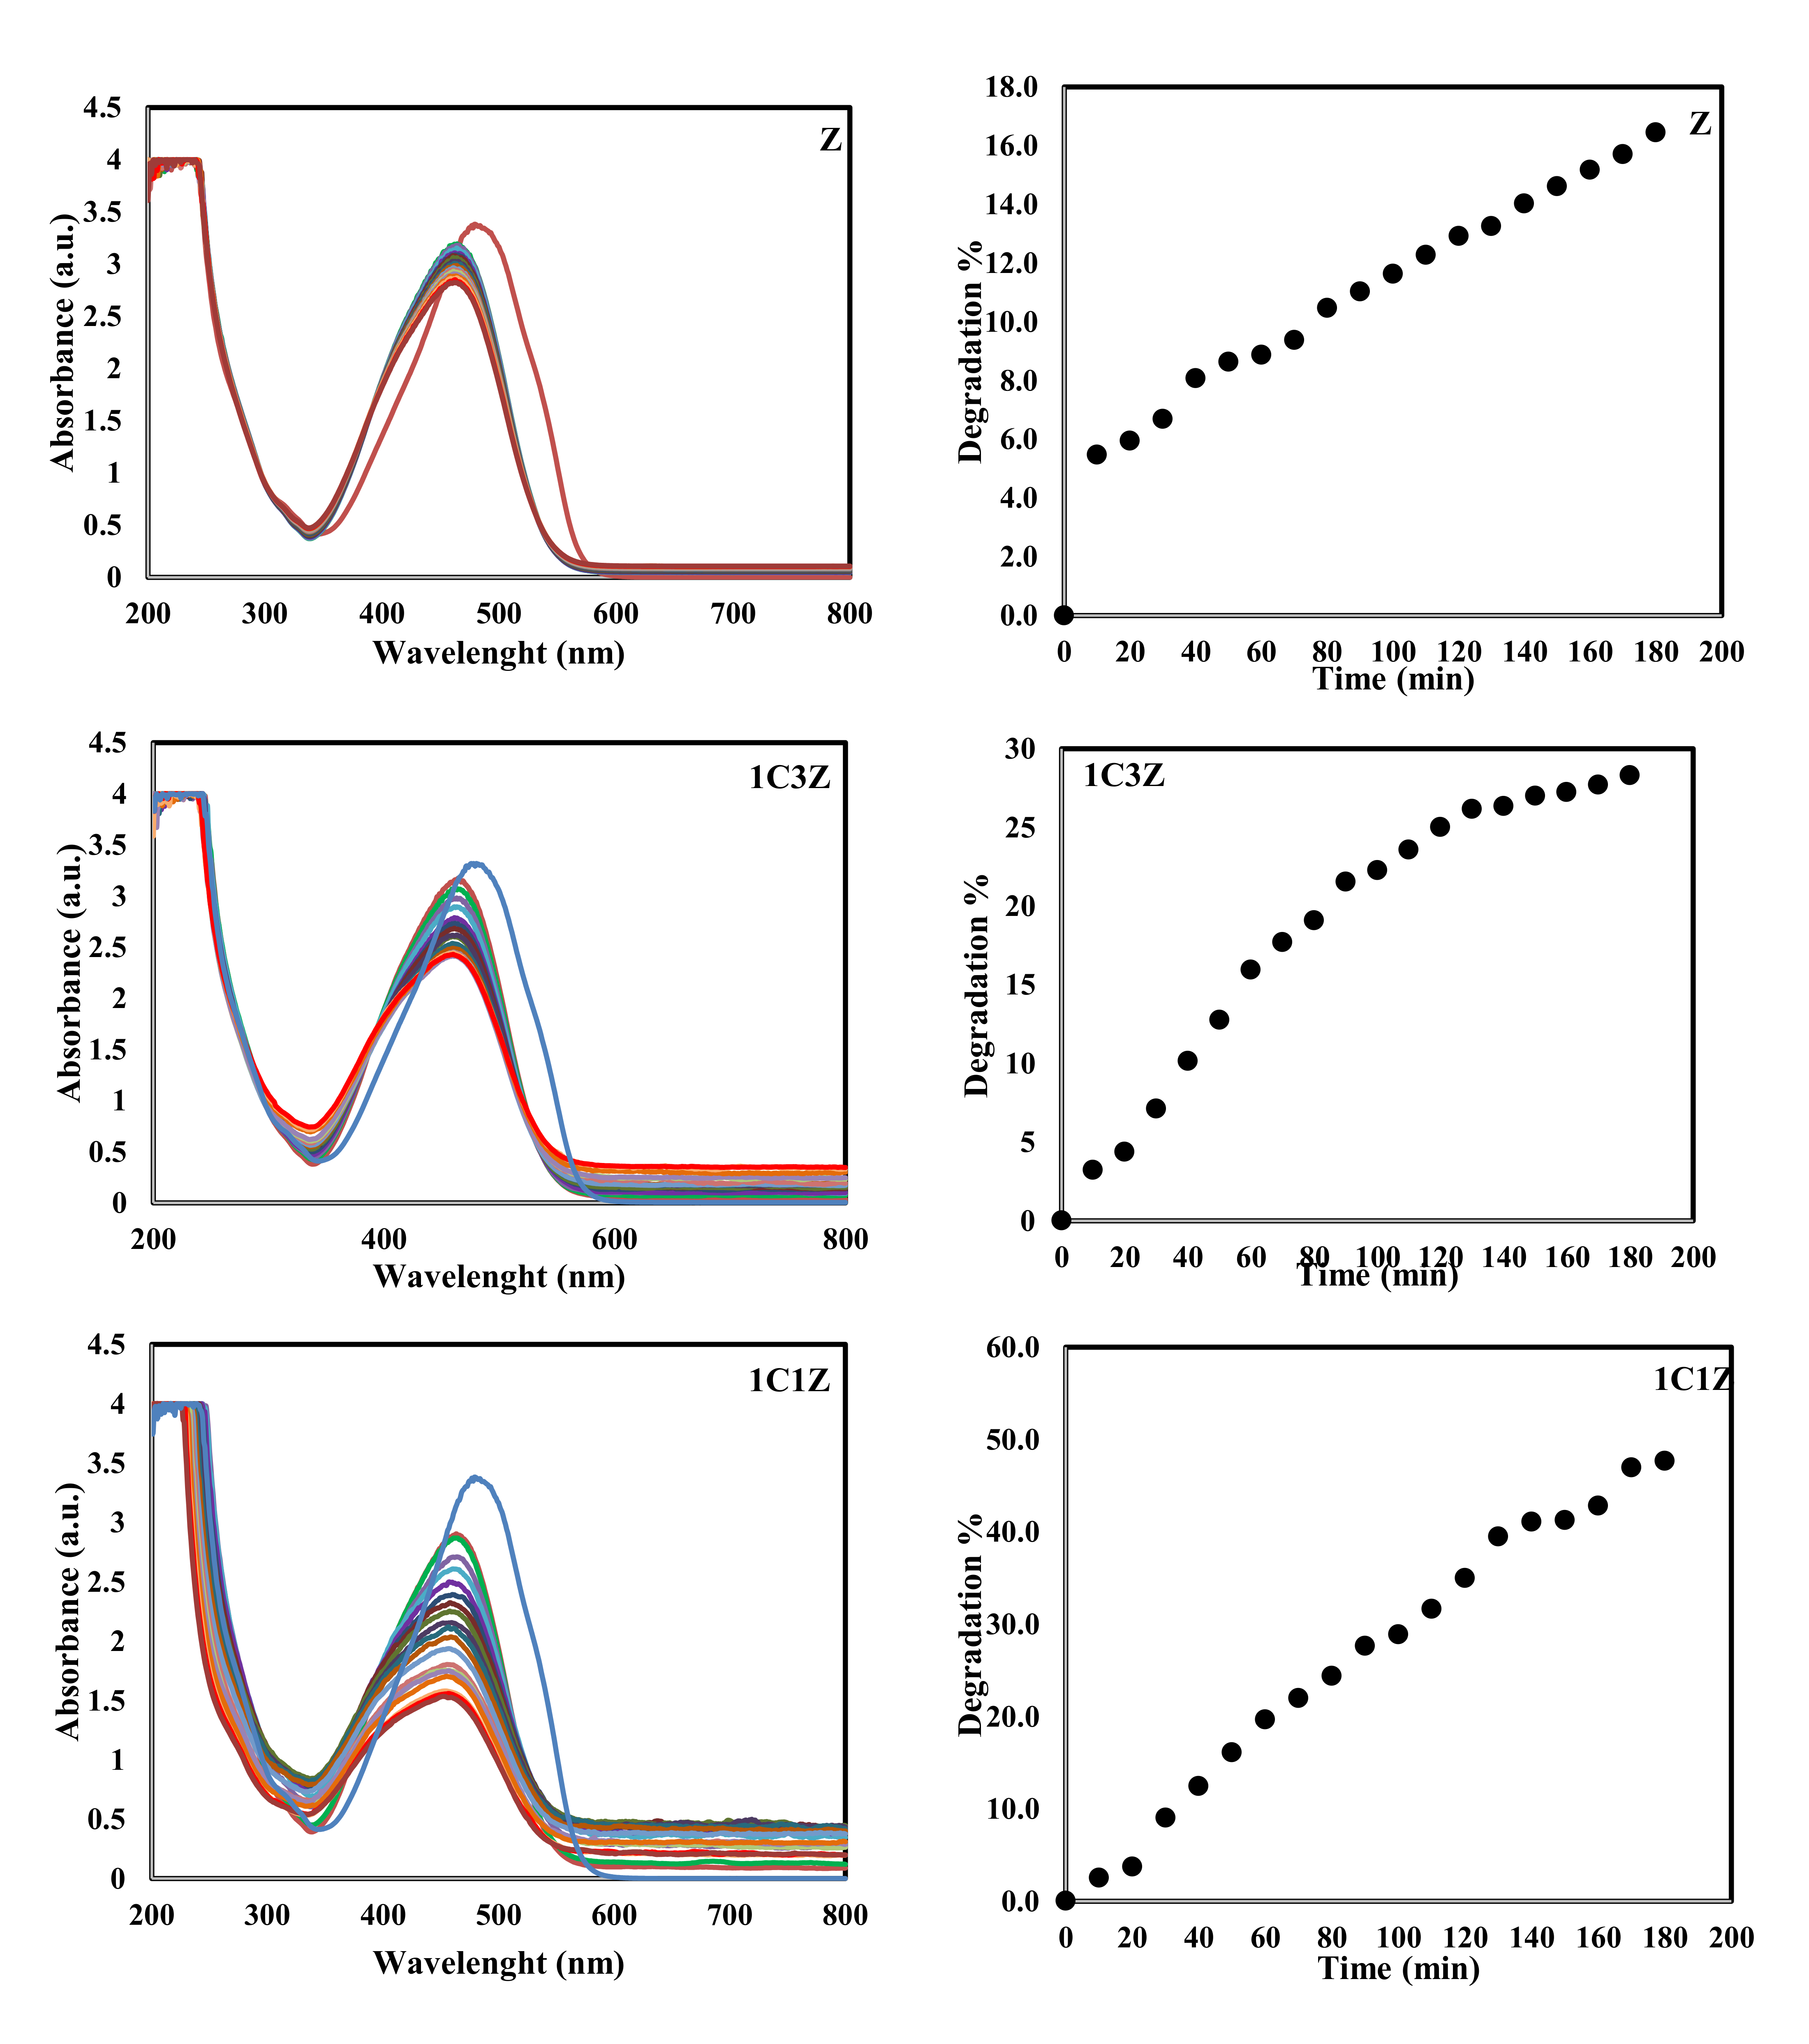
Figure 8 confirms the same thing through the absorbance of UV at different intervals (the highest spectra of each figure represents the absorbance at time zero, before adding the catalyst, and each lower one represents the absorbance after 10 min, until the end of the experiment). There is no change in the absorbance even after 24 h. Another experiment was performed using 1C1Z nanocomposite without controlling the pH at 4.5, as shown in Figure 10, column 2. In this experiment, there was also no change in the color of the solution or the UV absorbance, as shown in Figure 8, indicating that there was also no degradation in this experiment. This is mainly because MO is an ionic dye, which forms anions in an aqueous solution. When the pH of the solution (around 7.5) is higher than the zero point charge of the nanocomposite, the surface of the nanocomposite will gain a negative charge. Under this condition, a repulsive force between the anionic MO and the nanocomposite will prevent the MO molecules from reaching the active sites on the nanocomposite surface; thus, no degradation will take place. On the contrary, when the pH of the solution is lower than the zero point charge of the nanocomposite, the surface will gain a positive charge, which will attract the negatively charged MO, leading to a higher concentration of MO on the surface and, accordingly, a higher degradation rate.
Figure 8 and Figure 9 show that the performance of the five samples toward degradation of MO follows the order C > 1C1Z > 1C3Z > 3C1Z > Z. For all the samples except C, there is a relation between the pHZPC and the degradation %. The higher the pHZPC is, the more the surface will be protonated and positively charged under the same pH condition, leading to a higher degradation performance. For sample C, one possible reason for the deviation is the larger and wider particle size distribution, compared to the other samples, which leads to a lower surface area and, accordingly, a lower number of active sites available for catalytic activity.

4. Conclusions

In this work, CuO/ZnO nanocomposites were prepared hydrothermally with the aid of ANE as a capping and stabilizing agent. The nanocomposites were tested for the degradation of MO under very mild conditions (no light and no stirring) and they showed different performances according to their composition. The two best samples were C and 1C1Z, with degradations of 49% and 48%, respectively, after 3 h, and 68% and 88% after 24 h. These nanocomposites are considered attractive for industrial water treatment since they can perform in a closed, dark container and without any stirring. It is expected to achieve a higher performance by increasing the nanocomposite/solution ratio.

Author Contributions

Conceptualization, E.D. Data; curation, E.D. and A.T.; Formal analysis, E.D. and A.T.; Methodology, E.D., A.T. and M.H.; Project administration, E.D.; Writing—original draft, E.D.; Writing—review & editing, E.D., A.T. and M.H. All authors have read and agreed to the published version of the manuscript.

Funding

This research was funded by Deanship of Scientific Research, King Faisal University, Saudi Arabia, project number NA000252.

Data Availability Statement

Data only available upon request from the corresponding authors.

Acknowledgments

The authors extend their appreciation to the Deanship of Scientific Research, King Faisal University, Saudi Arabia, for funding this research work through project number NA000252.

Conflicts of Interest

The authors declare no conflict of interest.

References

  1. Tsai, F.-C.; Ma, N.; Chiang, T.C.; Tsai, L.-C.; Shi, J.-J.; Xia, Y.; Jiang, T.; Su, S.-K.; Chuang, F.-S. Adsorptive removal of methyl orange from aqueous solution with crosslinking chitosan microspheres. J. Water Process Eng. 2014, 1, 2–7. [Google Scholar] [CrossRef]
  2. Hacıosmanoğlu, G.G.; Genç, S.; Can, Z.S. Efficient removal of methyl orange from aqueous solutions using ulexite. Environ. Technol. Innov. 2021, 22, 101466. [Google Scholar] [CrossRef]
  3. Da Silva, R.J.; Mojica-Sánchez, L.C.; Gorza, F.D.; Pedro, G.C.; Maciel, B.G.; Ratkovski, G.P.; da Rocha, H.D.; Nascimento, K.T.D.; Medina-Llamas, J.C.; Chávez-Guajardo, A.E.; et al. Kinetics and thermodynamic studies of Methyl Orange removal by polyvinylidene fluoride-PEDOT mats. J. Environ. Sci. 2021, 100, 62–73. [Google Scholar] [CrossRef] [PubMed]
  4. Asuha, S.; Gao, Y.W.; Deligeer, W.; Yu, M.; Suyala, B.; Zhao, S. Adsorptive removal of methyl orange using mesoporous maghemite. J. Porous Mater. 2011, 18, 581–587. [Google Scholar] [CrossRef]
  5. Hu, P.; Zhang, L.; Wang, J.; Huang, R. Removal of methyl orange from aqueous solution with crosslinked quaternized chitosan/bentonite composite. Desalin. Water Treat. 2017, 80, 370–379. [Google Scholar] [CrossRef]
  6. Sarvari, H.; Goharshadi, E.K.; Samiee, S.; Ashraf, N. Removal of methyl orange from aqueous solutions by ferromagnetic Fe/Ni nanoparticles. Phys. Chem. Res. 2018, 6, 433–446. [Google Scholar] [CrossRef]
  7. Zhuang, M.; Zheng, Y.; Liu, Z.; Huang, W.; Hu, X. Shape-dependent performance of TiO2 nanocrystals as adsorbents for methyl orange removal. RSC Adv. 2015, 5, 13200–13207. [Google Scholar] [CrossRef]
  8. Ruichao, L.; Fu, K.; Zhang, B.; Mei, D.; Zhang, H.; Liu, J. Removal of methyl orange by modified halloysite nanotubes. J. Dispers. Sci. Technol. 2012, 33, 711–718. [Google Scholar]
  9. Bahrudin, N.N.; Nawi, M.A.; Ismail, W.I.N.W. Physical and adsorptive characterizations of immobilized polyaniline for the removal of methyl orange dye. Korean J. Chem. Eng. 2018, 35, 1450–1461. [Google Scholar] [CrossRef]
  10. Wu, S.-C.; Yu, L.-L.; Xiao, F.-F.; You, X.; Yang, C.; Cheng, J.-H. Synthesis of aluminum-based MOF/graphite oxide composite and enhanced removal of methyl orange. J. Alloy. Compd. 2017, 724, 625–632. [Google Scholar] [CrossRef]
  11. Tang, Y.; Yang, R.; Ma, D.; Zhou, B.; Zhu, L.; Yang, J. Removal of methyl orange from aqueous solution by adsorption onto a hydrogel composite. Polym. Polym. Compos. 2018, 26, 161–168. [Google Scholar] [CrossRef]
  12. Iwuozor, K.O.; Ighalo, J.O.; Emenike, E.C.; Ogunfowora, L.A.; Igwegbe, C.A. Adsorption of methyl orange: A review on adsorbent performance. Curr. Res. Green Sustain. Chem. 2021, 4, 100179. [Google Scholar] [CrossRef]
  13. Da’Na, E.; Taha, A.; Hessien, M. Application of ZnO–NiO greenly synthesized nanocomposite adsorbent on the elimination of organic dye from aqueous solutions: Kinetics and equilibrium. Ceram. Int. 2021, 47, 4531–4542. [Google Scholar] [CrossRef]
  14. Liu, Y.; Zhang, G.; Chong, S.; Zhang, N.; Chang, H.; Huang, T.; Fang, S. NiFe(C2O4)x as a heterogeneous Fenton catalyst for removal of methyl orange. J. Environ. Manag. 2017, 192, 150–155. [Google Scholar] [CrossRef] [PubMed]
  15. Gerawork, M. Photodegradation of methyl orange dye by using zinc oxide–copper oxide nanocomposite. Optik 2020, 216, 164864. [Google Scholar] [CrossRef]
  16. Dimapilis, E.A.S.; Hsu, C.-S.; Mendoza, R.M.O.; Lu, M.-C. Zinc oxide nanoparticles for water disinfection. Sustain. Environ. Res. 2018, 28, 47–56. [Google Scholar] [CrossRef]
  17. Wang, L.; Muhammed, M. Synthesis of zinc oxide nanoparticles with controlled morphology. J. Mater. Chem. 1999, 9, 2871–2878. [Google Scholar] [CrossRef]
  18. Hessien, M.; Da, E.; Al-amer, K.; Khalaf, M.M. Nano ZnO (hexagonal wurtzite) of different shapes under various conditions: Fabrication and characterization. Mater. Res. Express 2019, 17, 085057. [Google Scholar] [CrossRef]
  19. Dighore, N.; Jadhav, S.; Gaikwad, S.; Rajbhoj, A. Copper oxide nanoparticles synthesis by electrochemical method. Mater. Sci. 2016, 22, 170–173. [Google Scholar] [CrossRef] [Green Version]
  20. Zhang, F.; Dong, G.; Wang, M.; Zeng, Y.; Wang, C. Efficient removal of methyl orange using Cu2O as a dual function catalyst. Appl. Surf. Sci. 2018, 444, 559–568. [Google Scholar] [CrossRef]
  21. Nandiyanto, A.B.D.; Oktiani, R.; Ragadhita, R. How to read and interpret FTIR spectroscope of organic material. Indones. J. Sci. Technol. 2019, 4, 97–118. [Google Scholar] [CrossRef]
  22. Xie, S.; Huang, P.; Kruzic, J.; Zeng, X.; Qian, H. A highly efficient degradation mechanism of methyl orange using Fe-based metallic glass powders. Sci. Rep. 2016, 6, 21947. [Google Scholar] [CrossRef] [PubMed] [Green Version]
  23. Saeed, M.; Adeel, S.; Abdur-Raoof, H.; Usman, M.; Mansha, A.; Ahmad, A.; Amjed, M. ZnO catalyzed degradation of methyl orange in aqueous medium. Chiang Mai J. Sci. 2017, 44, 1646–1653. [Google Scholar] [CrossRef]
Figure 1. FTIR spectra of ANE, Z, 1C3Z, 1C1Z, 3C1Z, and C greenly prepared before (a) and after hydrothermal treatment (pH = 10, T = 250 °C, t = 2.5 h) and calcination for 2 h at 300 °C (b).
Applsci 12 02910 g001
Figure 2. XRD patterns of Z, 1C3Z, 1C1Z, 3C1Z, and C greenly prepared via hydrothermal route (pH = 10, T = 250 °C, t = 2.5 h) and calcination for 2 h at 300 °C.
Applsci 12 02910 g002
Figure 3. SEM images of Z, 1C3Z, 1C1Z, 3C1Z, and C greenly prepared via hydrothermal route (pH = 10, T = 250 °C, t = 2.5 h) and calcination for 2 h at 300 °C.
Applsci 12 02910 g003aApplsci 12 02910 g003b
Figure 4. TEM images of Z, 1C3Z, 1C1Z, 3C1Z, and C greenly prepared via hydrothermal route (pH = 10, T = 250 °C, t = 2.5 h) and calcination for 2 h at 300 °C.
Applsci 12 02910 g004aApplsci 12 02910 g004b
Figure 5. Thermal gravimetric analysis of 1C1Z greenly prepared via the hydrothermal route (pH = 10, T = 250 °C, t = 2.5 h) and calcination for 2 h at 300 °C.
Applsci 12 02910 g005
Figure 6. EDEX analysis of 1C1Z greenly prepared via the hydrothermal route (pH = 10, T = 250 °C, t = 2.5 h) and calcination for 2 h at 300 °C.
Applsci 12 02910 g006
Figure 7. pH of zero point charge of Z, 1C3Z, 1C1Z, 3C1Z, and C greenly prepared via hydrothermal route (pH = 10, T = 250 °C, t = 2.5 h) and calcination for 2 h at 300 °C.
Applsci 12 02910 g007
Figure 8. The UV spectra of the MO solution and the removal percentage of MO after adding the nanocomposites as a function of time.
Applsci 12 02910 g008aApplsci 12 02910 g008bApplsci 12 02910 g008c
Figure 9. The removal percentage of MO after different intervals for Z, 1C3Z, 1C1Z, 3C1Z, and C greenly prepared via hydrothermal route (pH = 10, T = 250 °C, t = 2.5 h) and calcination for 2 h at 300 °C.
Applsci 12 02910 g009
Figure 10. The color and the appearance of the MO solution before adding a catalyst (first row), after 3 h (second row), and 24 h (third row) of adding the nanocomposite.
Applsci 12 02910 g010
Table 1. The volumetric composition of the CuCl2.6H2O and ZnCl2 solutions was used to prepare the nanocomposites.
The Volume of Solution (mL)Sample ID
Z1C3Z1C1Z3C1ZC
CuCl2∙6H2O0255075100
ZnCl21007550250
Table 2. The crystalline size (nm) of CuO and ZnO was estimated by the Debye–Scherrer formula, and the composition of each nanocomposite was obtained from AAS analysis.
Crystalline Size (nm)Mass %
Z1C3Z1C1Z3C1ZCZ1C3Z1C1Z3C1ZC
CuO-272115290.049.969.380.9100.0
ZnO26302117-100.050.130.719.10.0
Publisher’s Note: MDPI stays neutral with regard to jurisdictional claims in published maps and institutional affiliations.

