Article

In-Gel Assay to Evaluate Antioxidant Enzyme Response to Silver Nitrate and Silver Nanoparticles in Marine Bivalve Tissues

1
Department of Science and Technological Innovation, Università degli Studi del Piemonte Orientale, Viale Michel 11, 15121 Alessandria, Italy
2
Department of Earth and Marine Sciences, Università di Palermo, Piazza Marina 61, 90133 Palermo, Italy
*
Author to whom correspondence should be addressed.
Appl. Sci. 2022, 12(6), 2760; https://doi.org/10.3390/app12062760
Submission received: 27 January 2022 / Revised: 3 March 2022 / Accepted: 5 March 2022 / Published: 8 March 2022
(This article belongs to the Special Issue Aquatic Toxicology and Aquaculture: Questions and Advances)

Abstract

:
Silver is back in vogue today as this metal is used in the form of nanomaterials in numerous commercial products. We have developed in-gel electrophoretic techniques to measure the activity of the antioxidant enzymes catalase (CAT), superoxide dismutase (SOD), and glutathione peroxidase (GPX), and used the same techniques in combination with HSP70 Western blot analysis to evaluate the effects of nanomolar amounts of silver nitrate and 5 nm alkane-coated silver nanoparticles in tissues of the marine bivalve Mytilus galloprovincialis (Lam.) exposed for 28 days in mesocosms. Our results showed a negligible effect for nanosilver exposure and dose-dependent effects for the nitrate form.

Graphical Abstract

1. Background

In the last century, the marine environment has been severely affected by pollution associated with heavy industrialization and enormous population growth. Most of the world’s population lives near the coast and therefore anthropogenic activities such as industry, urbanization, extensive agriculture, and tourism contribute to the pollution of the marine environment [1,2]. Pollutants such as heavy metals, pesticides, oil-based products, plastics, particles from antifouling paint, and industrial and civil wastes pollute the marine environments [3,4,5,6]. In the last two decades, nanotechnology has been one of the most innovative arguments for the scientific community. This is also because it can be a novel source of pollutants, especially for the marine environment [7,8,9,10]. Nanomaterials (NMs)—which have at least one dimension in the range of 1–100 nm [11]—include nanoparticles (NP), which are normally found in nature and are formed by natural phenomena, mainly weathering and mineral formation processes in soil [12,13,14]. In addition, engineered nanomaterials (ENMs) and/or nanoparticles (ENPs) of human origin have become emerging contaminants nowadays. Among inorganic ENPs, the Organisation for Economic Co-operation and Development (OECD) has highlighted four metal or metal oxide ENPs that are of great interest due to their intrinsic properties, widespread use, and commercial importance, namely cerium oxide (CeO2), silver (Ag), zinc oxide (ZnO), and titanium dioxide (TiO2). In particular, silver nanoparticles (AgNPs) are used for their antibacterial properties [15,16,17,18] and are included in over two hundred consumer medical products [19]. In addition, AgNPs are used in microelectronics due to their attractive properties such as high electrical and thermal conductivity, chemical stability, catalytic activity, and nonlinear optical behavior [20]. All these properties make AgNPs one of the most commercialized nanomaterials. AgNPs originating from wastewater generated during their synthesis and/or use in consumer products, as well as during their recycling and disposal, can enter the aquatic environment via industrial and municipal wastewaters. Their presence in the marine environment is a potential source of stress [7]. Oxidative stress is an important component of the stress response of marine organisms exposed to impairments from a variety of pollutants [3,21,22].
AgNPs can promote oxidative stress responses in aquatic organisms by impairing the capacity of antioxidant enzymes [23,24,25]. In zebrafish, Choi et al. [26] showed increased levels of malondialdehyde and total glutathione (GSH), a decrease in catalase (CAT) and glutathione peroxidase activity (GPx), and DNA damage. It seems that the mechanism of AgNPs-mediated cytotoxicity in marine invertebrates is also mainly due to the action of reactive oxygen species (ROS) [8,27,28]. Bivalves are sensitive and ecologically relevant organisms that have a sessile filter-feeding diet and can accumulate organic and inorganic pollutants due to their low metabolic detoxification rate. Therefore, they are good bioindicators for monitoring chemical pollution of the marine environment [29,30,31]. The Mytilus congeners are not only valuable indicators of pollution, but extensive background information is also available on their biological responses to a wide range of inorganic and organic chemicals [32,33,34,35,36,37]. Indeed, Canesi et al. [30] proposed to use them as sentinel species for studying the specific effects of nanoparticles.
The aim of this work is to develop electrophoretic techniques to evaluate the activity of antioxidant enzymes—catalase, superoxide dismutase, and glutathione peroxidase—and then apply the same techniques in an ecotoxicological study of the effects of AgNPs in the tissues of Mytilus galloprovincialis (Lam.), i.e., in the digestive gland and gills. These proteins represent the main component of the enzymatic antioxidant defense of the cell and are considered very effective biomarkers of oxidative stress. In this work, the different steps of the construction of the gel assay are presented, starting from the existing knowledge in the literature to their practical application in an ecotoxicological study. Namely, these methods are used to study the mechanistic effects of different forms of silver (nano-metallic and ionic) in important molluscan tissues. An evaluation of HSP70 protein concentrations by Western blot was also considered to support the enzyme activity data.

2. Materials and Methods

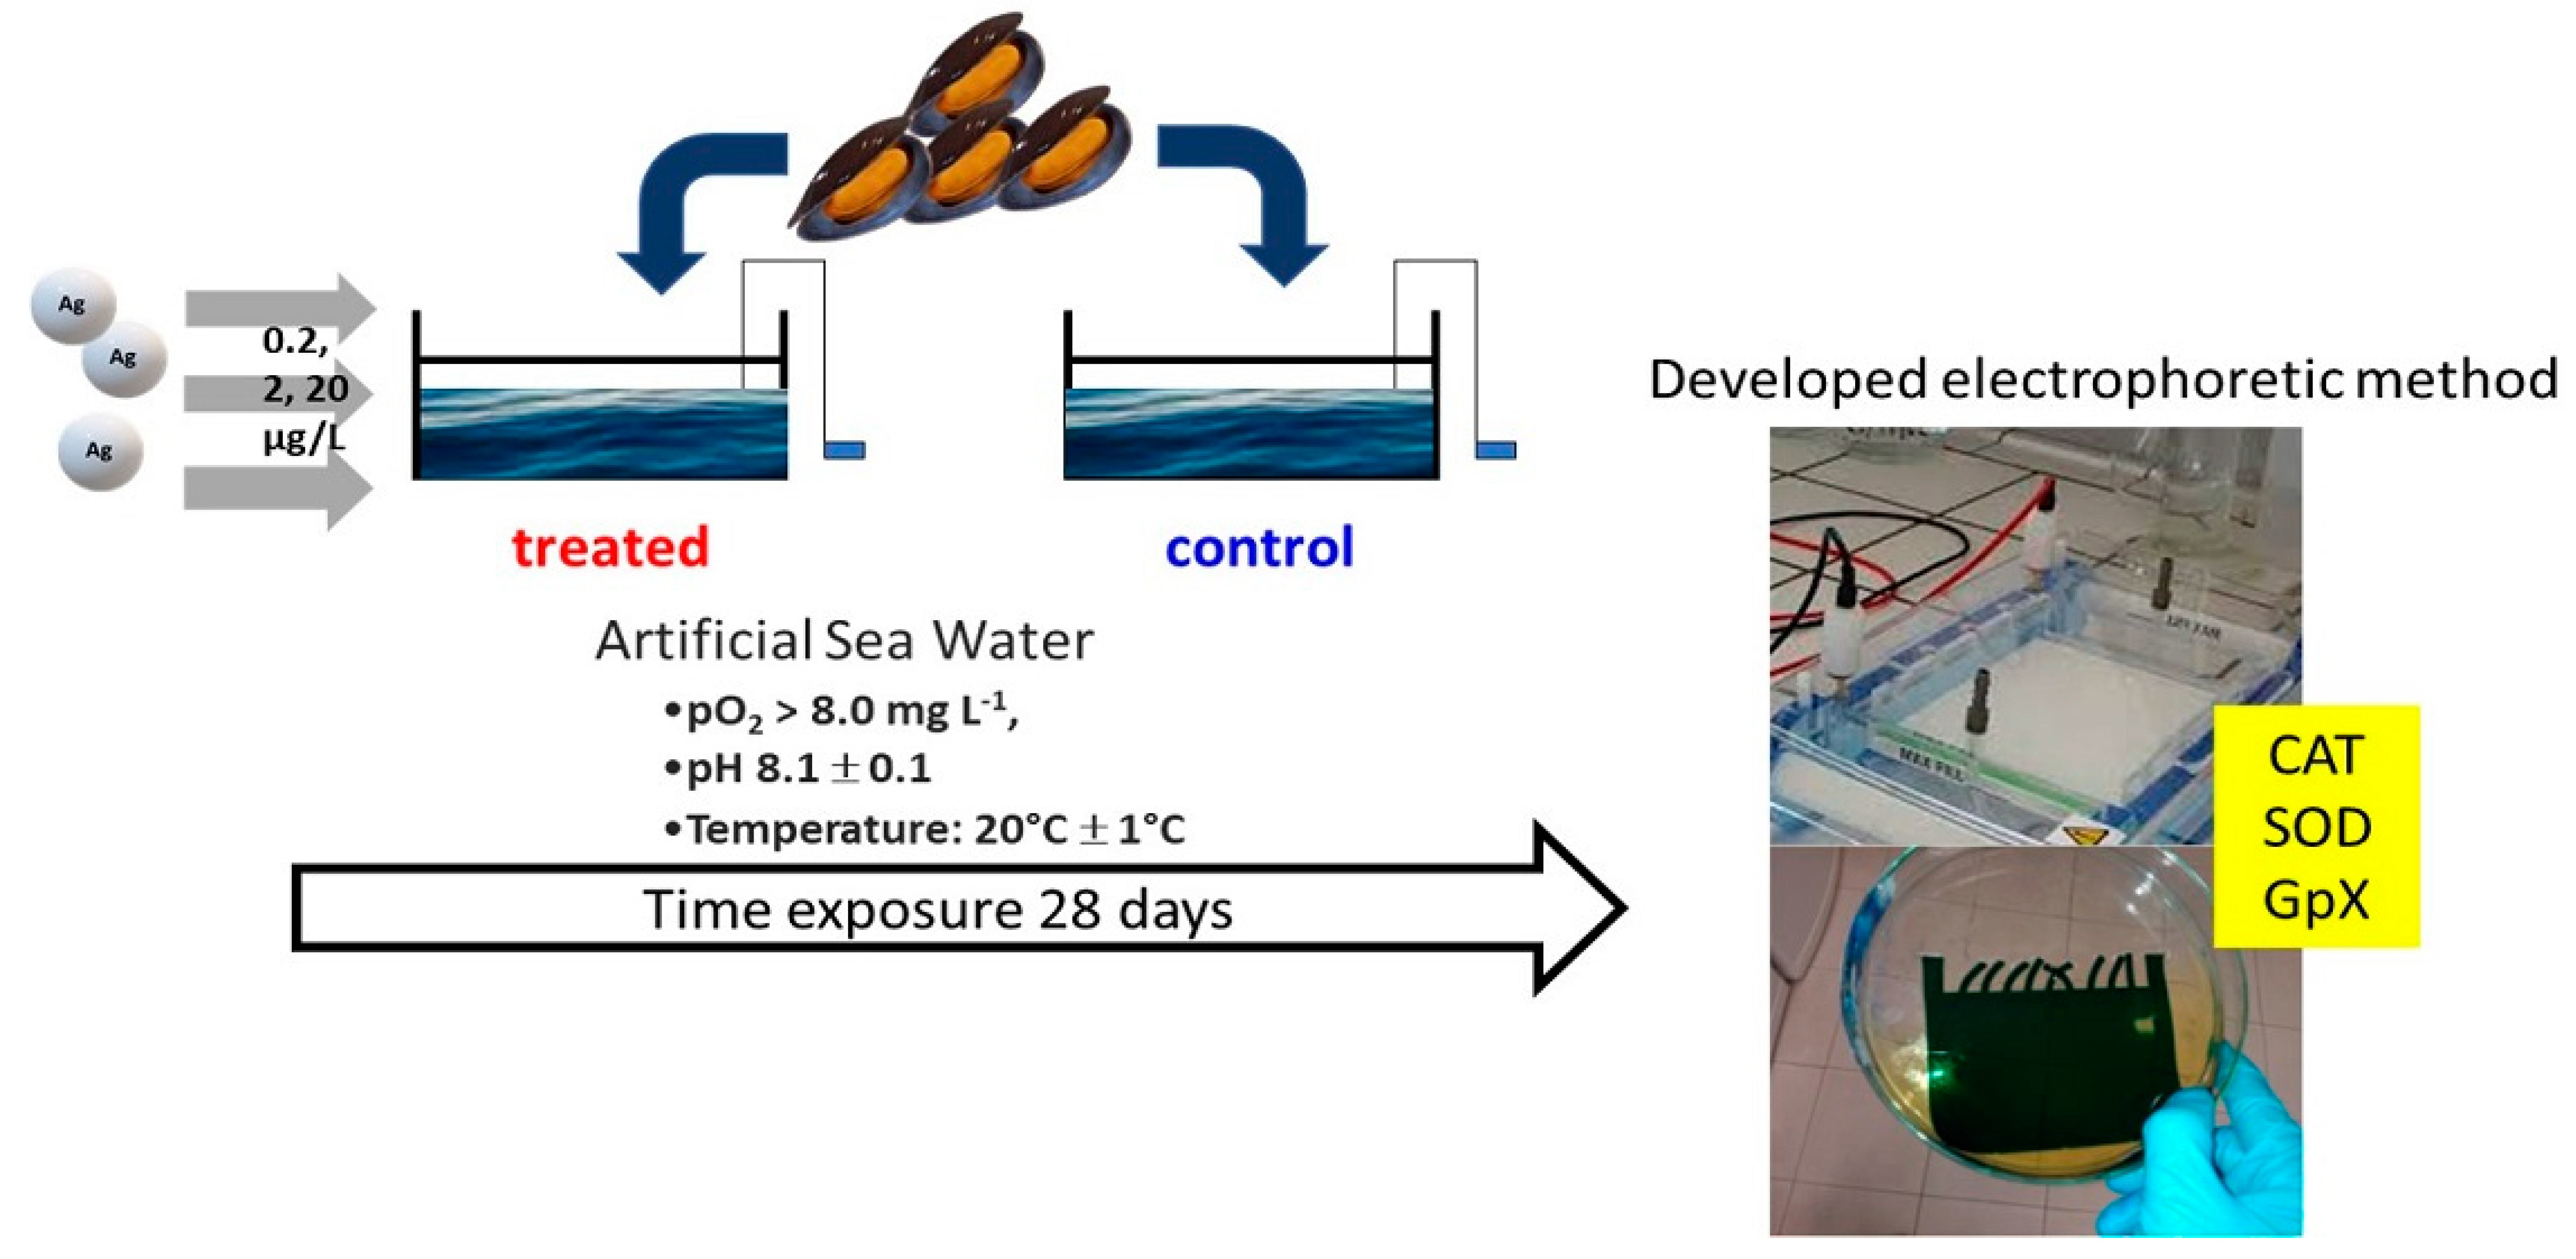
2.1. Animal Treatment and Experimental Design

Mytilus galloprovincialis (Lam.) were collected from Lake Ganzirri and Faro (Messina, eastern Sicily, Italy, 38°15′ North, 15°36′ East), transported to the laboratory under temperature- and humidity-controlled conditions, purified from epibionts, and acclimated for 15 days at a controlled temperature of 22 °C in naturally filtered seawater (~37‰ salinity; pH 8.1) that was continuously aerated (60 L h−1). Organisms were fed ad libitum with fresh cultures of Nannochloropsis spp. or Isochrysis galbana via an adjustable drip dispenser. Animals were housed in 50-L glass containers at a density of 1 specimen per liter and maintained under the above conditions. Organisms were treated with 5 nm silver nanoparticles (AgNP) or silver nitrate for 28 days. Three nominal exposure concentrations were considered (0.2, 2.0, and 20 μg L−1), as well as an unexposed population as a control reference. Two mesocosms with a capacity of 50 L per treatment were prepared to obtain two biological replicates. AgNPs were added daily to the experimental samples from a stable suspension of 1 g L−1 prepared by the manufacturer (Amepox®, Lodz, Poland) in ultrapure water. These particles have been described elsewhere [38,39]. Silver nitrate from a stock solution of 1 g Ag+ L−1 prepared in acidified ultrapure water was also used. Each day, 10% of the water content was changed, and a complete change was performed on the 15th day. The organisms were fed ad libitum with fresh algal cells of Nannochloropsis spp. or Isochrysis galbana. During exposure, physicochemical parameters (temperature and oxygen content) were regularly controlled and kept within a range of 20 ± 1 °C; >8 mg L−1 O2. After exposure, the soft tissues of the mussels (digestive gland and gills) were collected and stored at −80 °C for subsequent biochemical analysis.
Tissues were homogenized in an ice/water bath at 0–4 °C in homogenization buffer (0.5 M sucrose, 0.15 M NaCl, 0.02 M Tris HCl pH 8.0, 1 mM phenylmethylsulfonyl fluoride, 5 mM DTT) at a ratio of 1:6 w/v (one-part tissue plus five-parts buffer) for the digestive gland and 1:4 w/v (one-part tissue plus three-parts buffer) for the gills. The homogenates were centrifuged at 20,000× g for 20 min at 4 °C, and the pellet (approximately mitochondria plus lysosomes) and supernatant—SN20—(approximately cytosol plus microsomes) were collected and stored at −80 °C until analysis. SN20 was used to detect the antioxidant response in mussel tissues if not otherwise stated.
According to Directive 2010/63/EU of the European Parliament and of the Council in force in Europe, no specific regulation or approval by an ethics committee was required for the use of mussels.

2.2. In Gel Antioxidant Enzyme Assays

Total protein content was quantified using the Bradford method and bovine serum albumin as a standard [40]. For the in-gel assay, precast polyacrylamide gels (Mini-PROTEAN® TGX™, Bio-Rad Laboratories, Hercules, CA, USA) with a stacking gel were used, at 7.5% or 12% for CAT or SOD and GPX, respectively. Protein samples (25–100 μg)—either digestive gland or gill extracts—were diluted 1:1 with loading buffer (0.05 M Tris-HCl buffer pH 6.8; 50% glycerol; 0.05% bromophenol blue) before native electrophoresis. Horse cytochrome C, bovine serum albumin, bovine aprotinin, bovine catalase, and bovine erythrocyte carbonic anhydrase (1 μg each) were used as multiprotein markers when appropriate. Samples were separated directly without pre-electrophoresis using a running buffer of 0.05 M Tris-HCl pH 8.3, 0.3 M glycine (Serva GMBH, Heidelberg, Germany), 0.002 M di-sodium EDTA (Serva GMBH, Heidelberg, Germany) at 40 mA, at 4 °C for 90 min. After native electrophoresis, gels were further treated according to the different enzyme assays for CAT, SOD, or GPX. If necessary, proteins were stained in the gel with Coomassie Brilliant Blue R250 (0.025% Coomassie Brilliant Blue, 50% ethanol, 10% acetic acid) and destained in a solution of 30% ethanol and 7.5% acetic acid.

2.2.1. Catalase Assay

Catalase activity was detected by the reaction between ferric chloride and potassium ferricyanide (III) in the presence of hydrogen peroxide. Indeed, after electrophoresis, the native gels were washed three times for 10 min in ultrapure water (18 MΩ·cm), then incubated for 10 min in a 0.01% hydrogen peroxide solution freshly prepared from a 30% stock (Sigma-Aldrich®, Merck, Darmstadt, Germany), and washed twice more in ultrapure water. Then the gels were incubated with gentle shaking in a freshly prepared solution of 1% ferric chloride hexahydrate and 1% potassium ferricyanide trihydrate (both from Sigma Aldrich®, Merck, Darmstadt, Germany). Catalase activity was negatively stained (achromatic bands) against a strong green–blue background resulting from the reduction of hydrogen peroxide and the dissolution of Prussian blue precipitate in the gel [41]. Catalase activity was then quantified semi-quantitatively or quantitatively against a bovine catalase standard curve by digital image analysis.

2.2.2. Superoxide Dismutase

The enzymatic activity of SOD was based on the inhibition of nitroblue tetrazolium (NBT) reduction by the action of superoxide, originally described by Beuchamp and Fridowich [42]. After native polyacrylamide gel electrophoresis (12%) as described above for CAT, the gel was incubated directly in 50–100 mL of SOD staining solution freshly prepared in ultrapure water containing 2.43 mM nitro blue tetrazolium chloride (NBT) (Serva GMBH, Heidelberg Germany), 28 mM N,N,N′,N′-Tetramethyl-ethylenediamine (TEMED) (Serva GMBH, Heidelberg, Germany), 0.028 mM riboflavin-5′-phosphate, and 50 mM sodium phosphate buffer pH 7.8 and kept under gentle stirring for 20 min in the dark at room temperature. Then, the gel was washed twice in ultrapure water and illuminated with a 15 W fluorescent lamp for 20 min. SOD activity was quantified semi-quantitatively by digital image analysis of achromatic bands.

2.2.3. Glutathione Peroxidase

This assessment of GPX enzyme activity in the gel was as previously described for the catalase assay by the reaction of ferric chloride and potassium ferricyanide in the presence of peroxide and reduced glutathione.
After native 12% polyacrylamide gel electrophoresis, slab gels were washed twice for 20 min in 50 mM Tris-HCl pH 7.9. Then, the gels were incubated at room temperature in a freshly prepared solution of 1 mM reduced GSH (Serva GMBH, Heidelberg, Germany), cumene hydroperoxide 0.008% (Sigma Aldrich®, Merck, Darmstadt, Germany), and 50 mM Tris-HCl pH 7.9. After washing twice in ultrapure water for 10 min, GPX activity was negatively stained (achromatic bands) in a 1% ferric chloride hexahydrate and 1% potassium ferricyanide solution as previously described for catalase.

2.3. HSP70 Evaluation

HSP70 content was determined by Western blot. SN20 (100 µg) was mixed with 10% glycerol, 2% SDS, 0.005% bromophenol, 20 mM TCEP, and 25 mM Tris-HCl pH 6.8, boiled at 100 °C for 5 min, and separated along with Spectra ™ Multicolour Broad Range (Thermofisher-Scientifics, Waltham, MA, USA) pre-stained protein markers by 4–20% SDS-PAGE using precast gels (Bio-Rad MINIPROTEIN® TGX™, Bio-Rad Laboratories, Hercules, CA, USA) in standard Tris/glycine running buffer (in the presence of 1 mM EDTA). After equilibration of the slab gel in Towbin buffer (25 mM Tris-HCl pH 8.3, 192 mM glycine) for 15 min, proteins were blotted onto positively charged PVDF membranes (Bio-Rad Laboratories, Hercules, CA, USA) that had been previously wetted in methanol. A Trans-Blot® SD Semi-Dry Transfer Cell (Bio-Rad Laboratories, Hercules, CA, USA) was used for 35 min at 12 V in Towbin buffer. The membrane was stained with 0.5% Ponceau S Red to normalize protein loading, imaged, and washed twice in ultrapure water for destaining. The membrane was then blocked in 10% nonfat skim milk for 1 h and incubated for 90 min at RT with 0.5 µg mL−1 (1:2000) anti-Hsp701A (HSPA1A T100, Aviva Systems Biology, San Diego, CA, USA) in TBS, 0.1% Tween-20 with 5% nonfat dry milk, and washed twice for 10 min in TBS-T (150 mM NaCl, 50 mM Tris HCl pH 7.8, 0.05% TWEEN20). The membrane was incubated for 1 h with a horseradish peroxidase-labeled secondary antibody against rabbit IgG Fc (Sigma-Aldrich®, Merck, Darmstadt, Germany) at a dilution of 1:5000, washed twice for 10 min in TBS-T, and once for 5 min in TBS. Protein bands were detected by chemiluminescence reaction using the Immun-Star™ WesternC™ Chemiluminescent Kit (Bio-Rad Laboratories, Hercules, CA, USA) in ChemiDoc™ XRS Digital Imaging System (Bio-Rad Laboratories, Hercules, CA, USA).

2.4. Digital Image Analysis

In-gel enzymatic activity and immunological data were analyzed by digital image analysis of inverted 8- or 16-bit grayscale images using Quantity One® V.10 software (Bio-Rad Laboratories, Hercules, CA, USA). Semiquantitative analysis of enzyme activity or the HSP70 protein concentration was carried out using the integrated density of each band (area of the band by mean intensity).

2.5. Statistical Analysis

Data were analyzed for statistically significant differences using nonparametric statistics (Mann–Whitney U-test and Two-sample Kruskal–Wallis). The software used for statistical analysis was Systat 10, Systat Software, Inc., San Jose, CA, USA.

3. Results

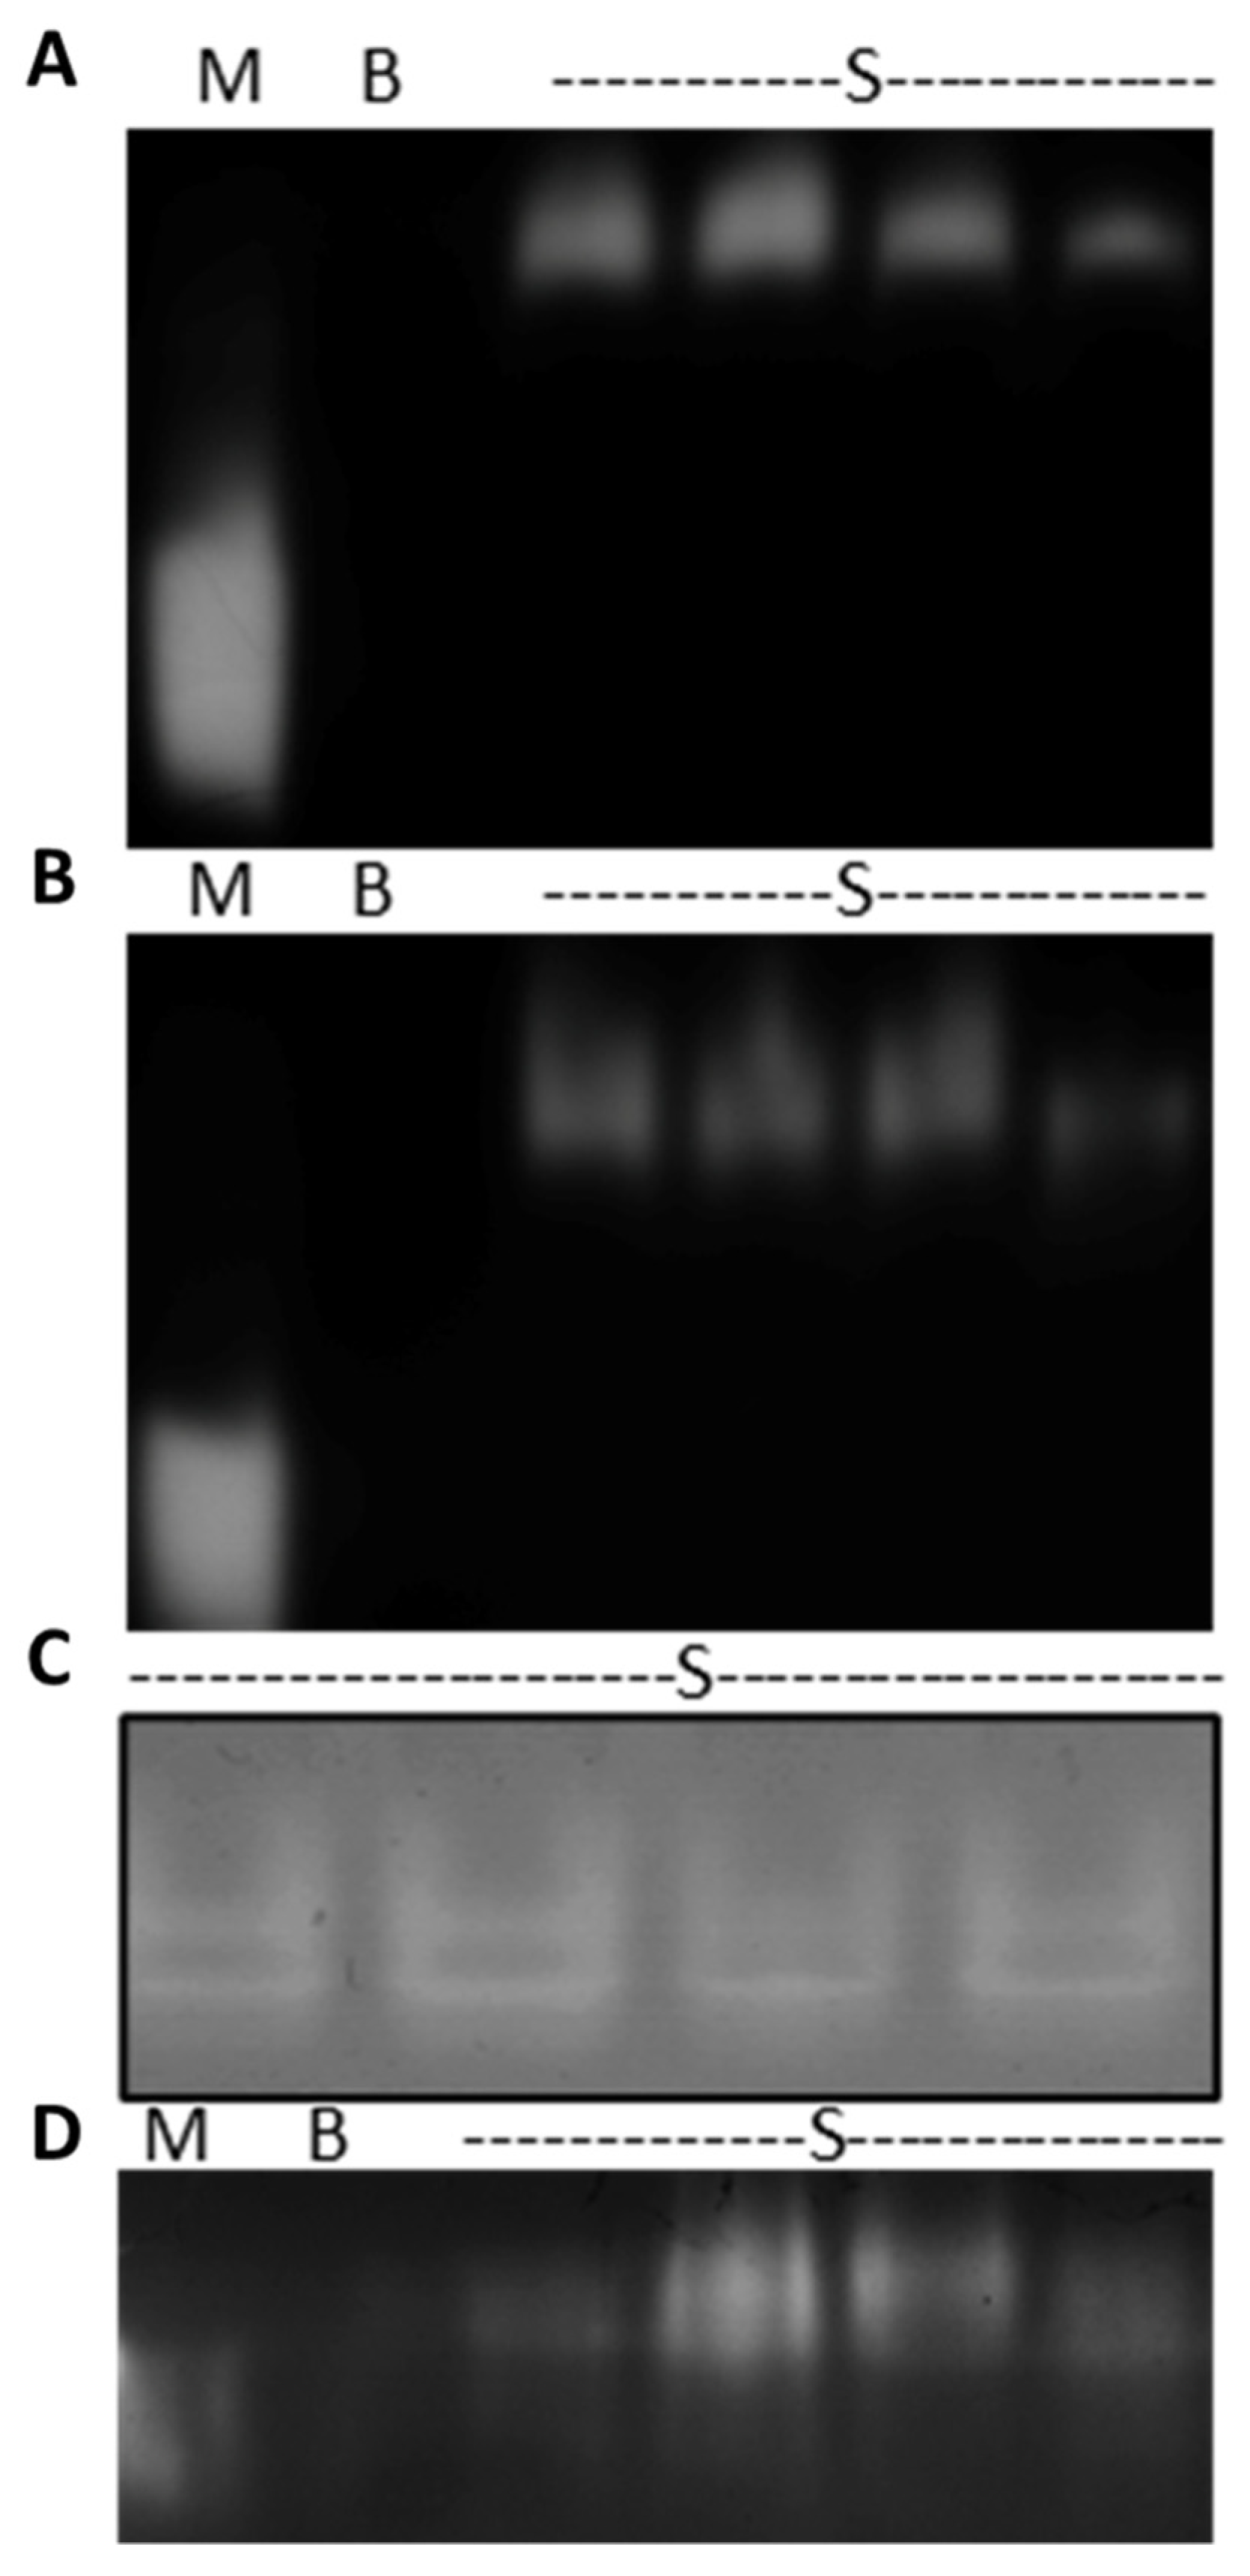
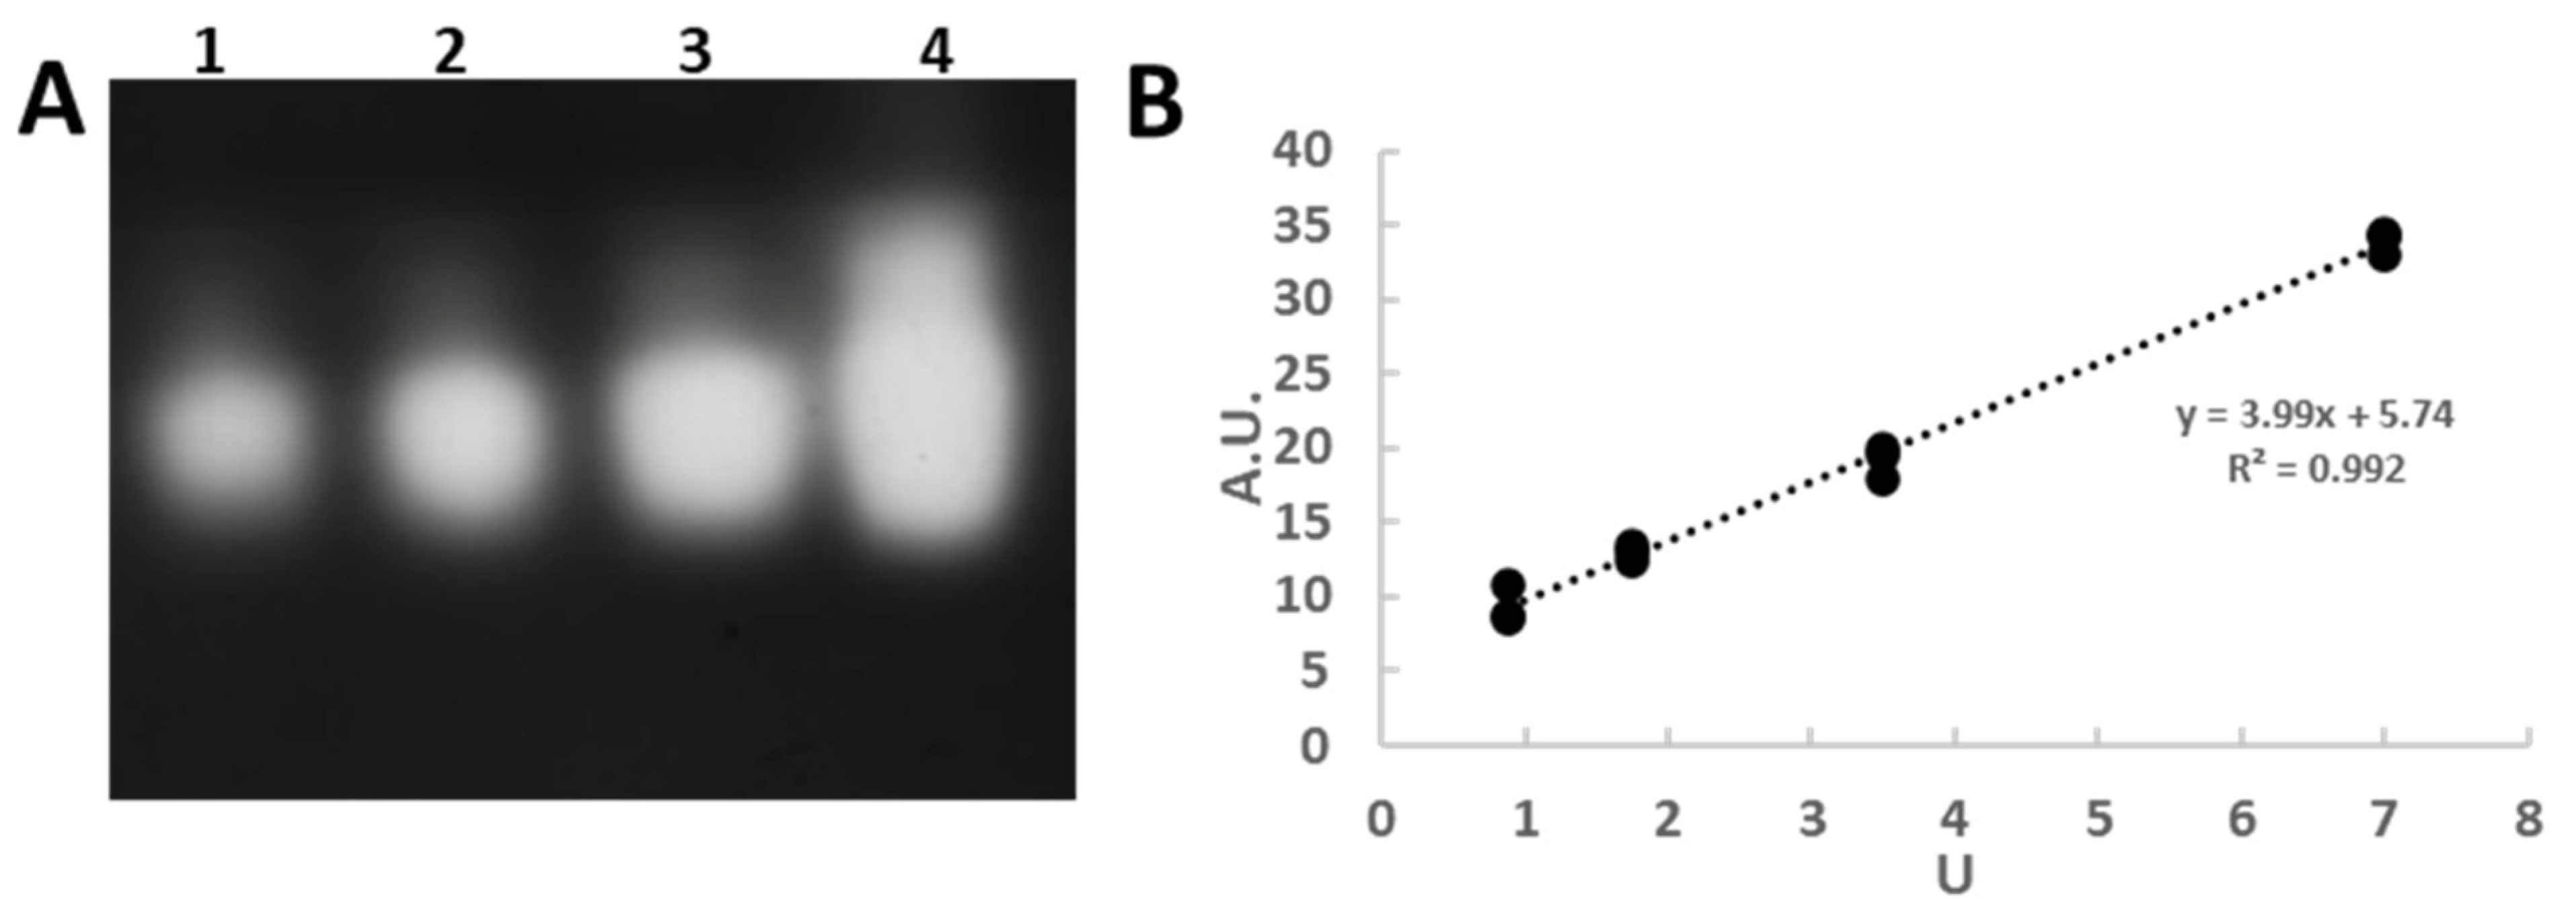
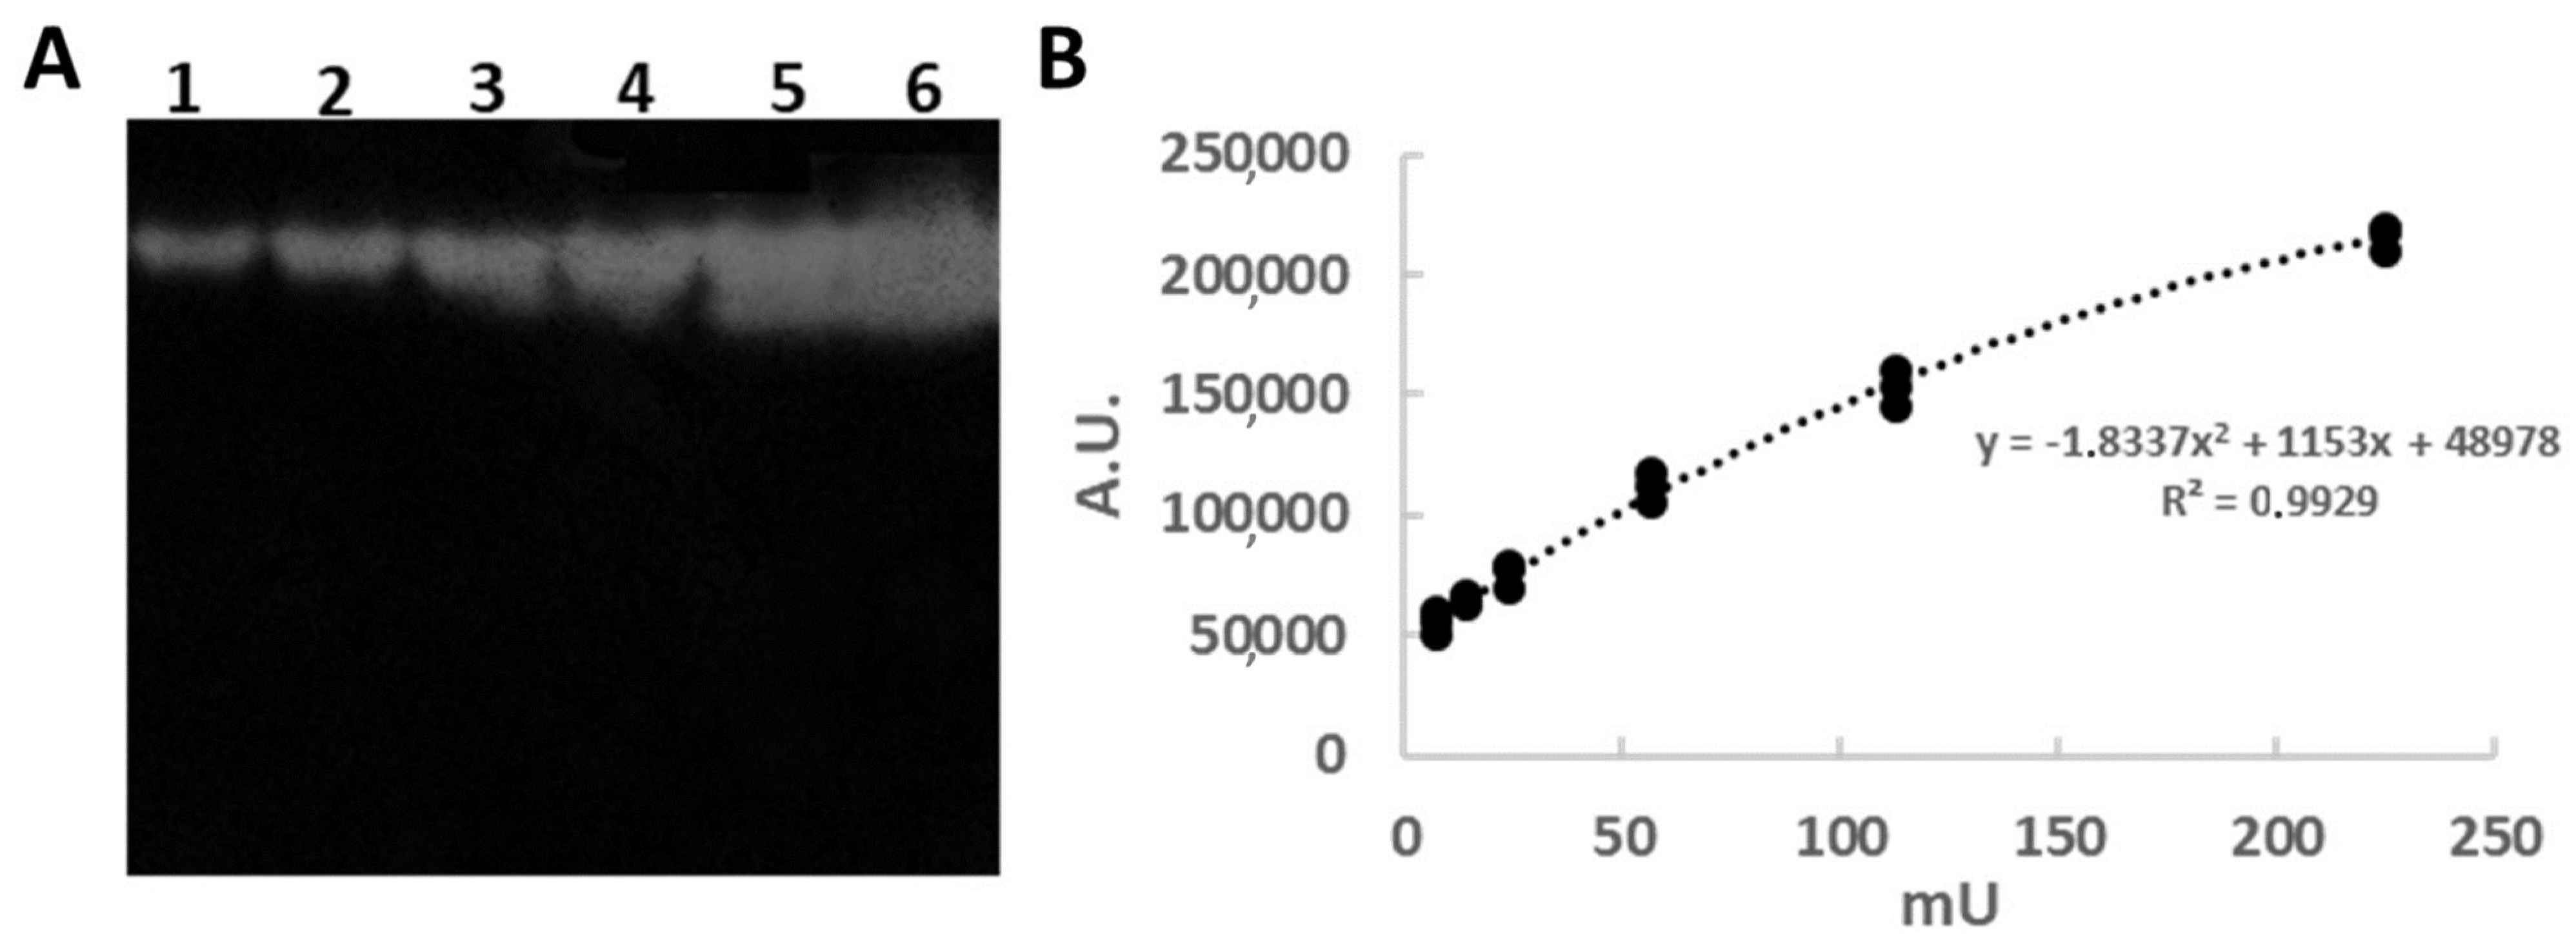
3.1. In-Gel Enzyme Protocol Development

In this work, we adapted in-gel electrophoresis assay protocols to test the activities of antioxidant enzymes (CAT, SOD, and GPX) in tissues of the ectothermic marine bivalve Mytilus galloprovincialis (Lam.), an ecologically relevant bioindicator of anthropogenic marine pollution and or disturbance (Figure 1). In-gel CAT and GPX detection is based on negative staining with ferric chloride/ferrocyanide. Ferrocyanide (III) competes with these enzymes for a peroxide substrate and forms a stable blue–green precipitate, ferrocyanide (II), and achromatic bands at the migration position of the enzyme [41].
The two enzyme activities can be distinguished by the different reaction mixtures. The improvements over previous protocols [41,43,44] mainly concern the run of native polyacrylamide gel electrophoresis, which was standardized to only 90 min at 40 mA, using commercial precast gels and a standard native Tris-glycine buffer. Pre-electrophoresis and/or a discontinuous buffer system are no longer required, resulting in significant optimization of overall process times. Other adjustments include the standardization of substrates. For CAT, the concentration of hydrogen peroxide in the reaction mixture was increased to 0.01%, resulting in satisfactory contrast enhancement and a satisfactory dynamic determination range of at least 1 order of magnitude (Figure 2). This is not trivial because the intensity of the achromatic bands may depend on the amount of ferrycyanide available and not on the activity of the enzyme and/or its concentration in the gel.
It was found that the specific activity of CAT was similar in the SN20 fraction and the pellet, but the absolute activity was larger in the supernatant, where more proteins are present. This result is in agreement with Livingstone et al. [45], who explain the presence of CAT in SN20 by the degradation of peroxisomes during centrifugation. However, it seems to be very convenient to measure the enzyme activity in this fraction, so it was finally decided to use it for measuring the CAT reactions upon silver exposure (see Section 3.2).
For the in-gel GPX assay, Lin et al. [43] was used as a reference to establish a mussel protocol. After 12% native PAGE and washing in Tris-HCl pH 7.9, a single reaction solution containing 1 mM GSH and peroxide was used to develop the achromatic bands due to GPX activity. Purified bovine GPX and protein extracts (SN20) from the digestive glands and gills of Mytilus galloprovincialis (Lam.) were used to standardize our method. Specifically, we tested the reaction in the presence and absence of 1 mM GSH and 10 mM sodium azide—a catalase inhibitor—in conjunction with two different substrates: hydrogen peroxide or cumene hydroperoxide. Cumene hydroperoxide at a concentration of 0.008% was confirmed as the optimal substrate to detect the total and genuine GSH-dependent GPX activity (Figure 3).
Indeed, the ferricyanide reaction reveals several achromatic bands (Figure 1, Panel D), most likely representing selenium-dependent GPX, selenium-independent GPX, and an intrinsic GSH-dependent peroxidase activity of GST as suggested by Livingstone et al. [45]. Once the protocol was established, the linearity of the in-gel reaction was tested using a purified standard (Figure 4).
As for the evaluation of SOD activity, the principle of the assay is based on the ability of superoxide (O2) to react with NBT by reducing the yellow tetrazolium stain to a violet–blue precipitate in the gel. SOD catalytic activity is negatively stained (achromatic bands) due to competition between SOD and NBT for the substrate (O2). The only adaptation to the original protocol [42] was the use of precast gels and fast electrophoresis run in the native standard Tris glycine buffer. Mussel Cu/Zn SOD appeared in the gel as multiple bands, as was also reported by Weydert and Cullen [44] (Figure 1).

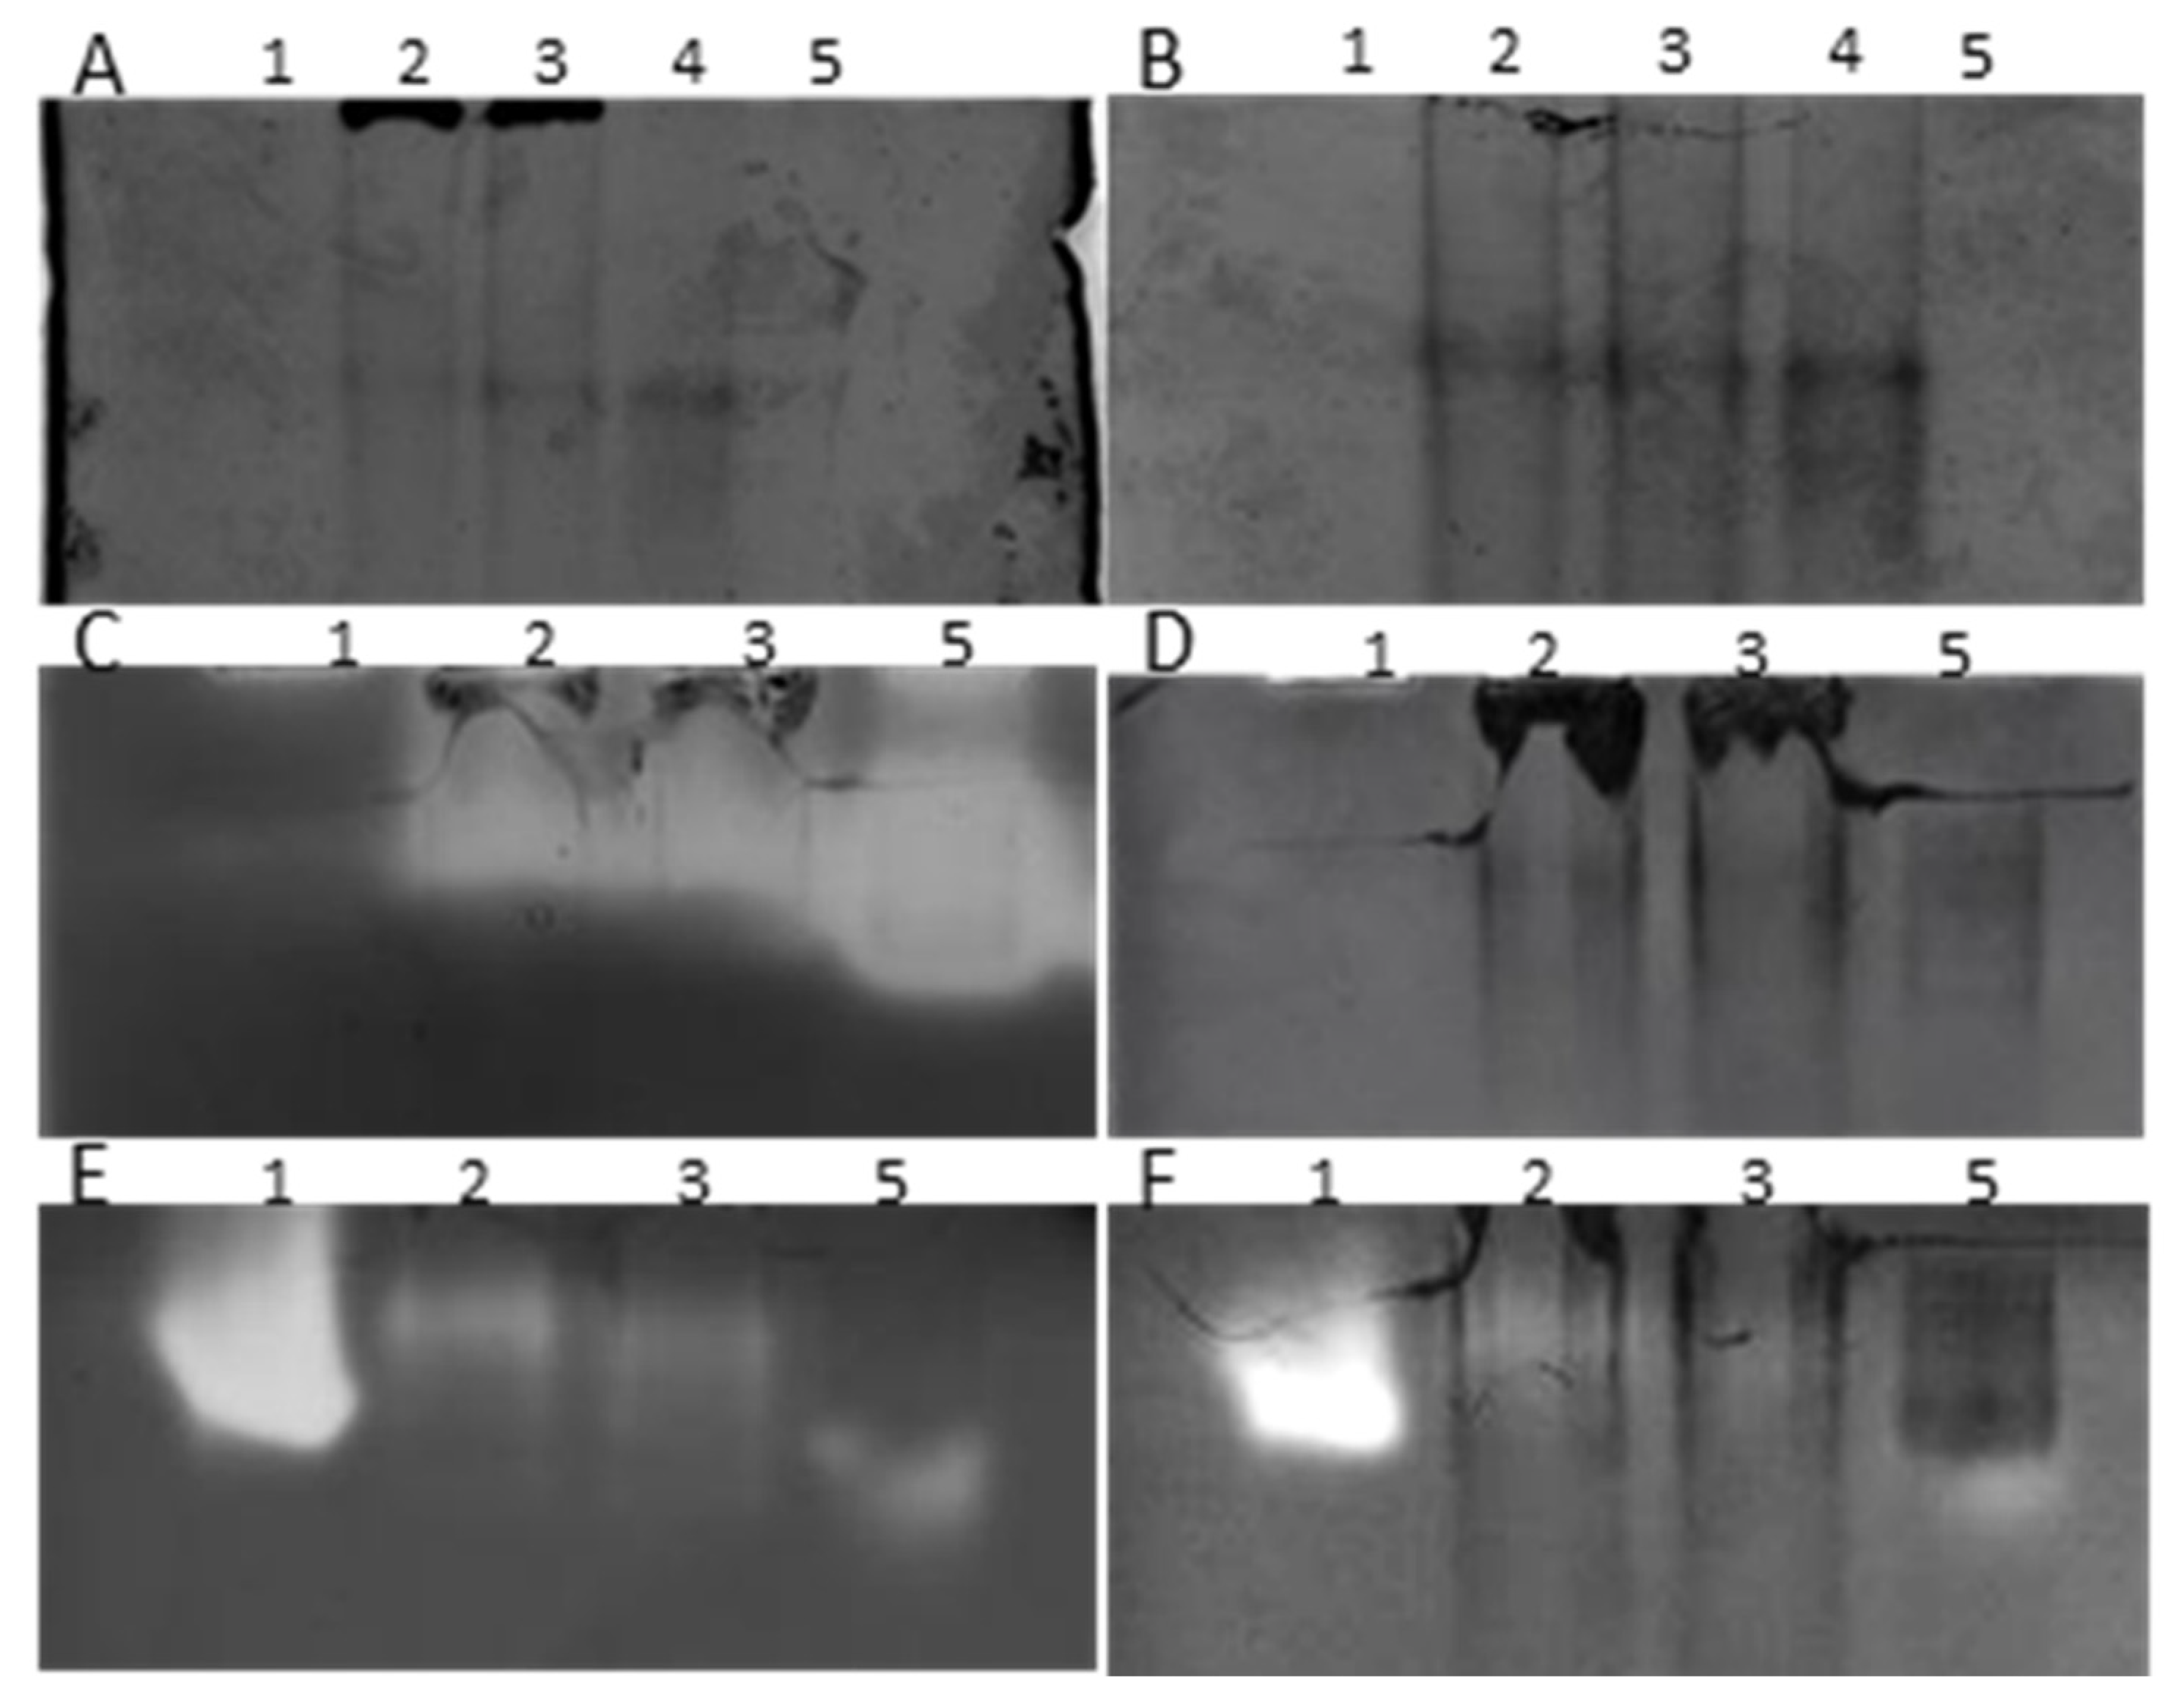
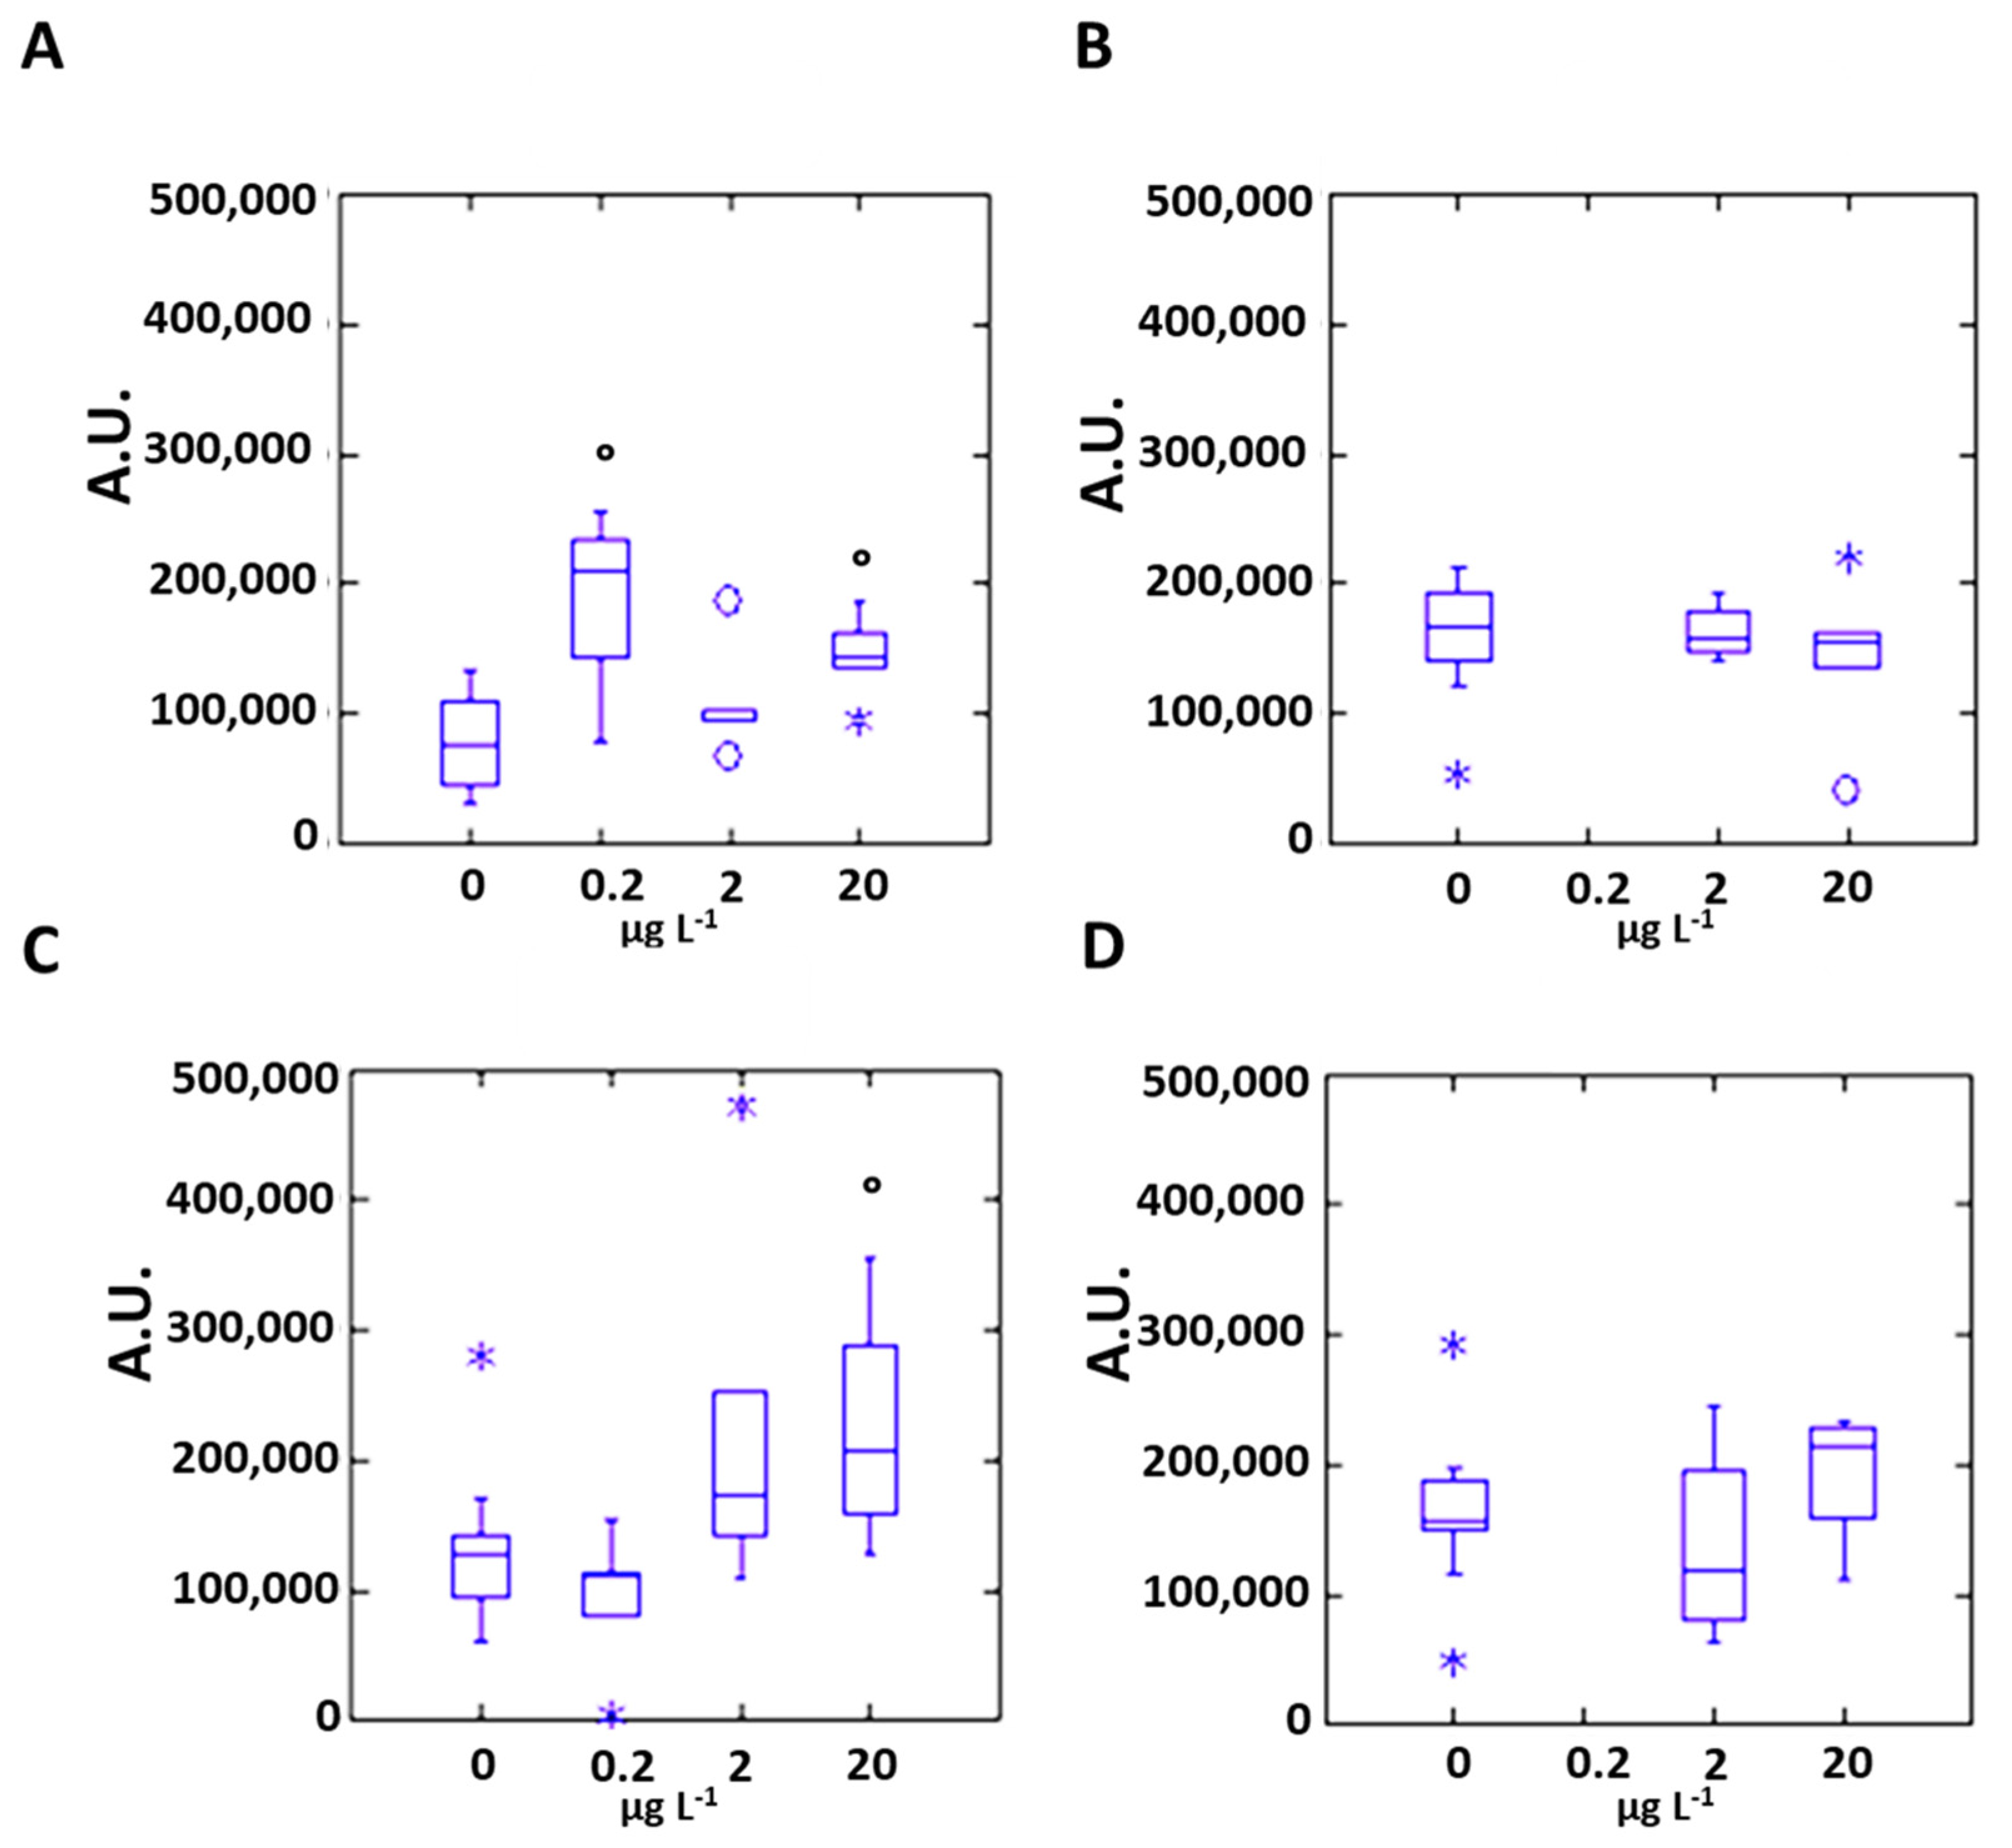
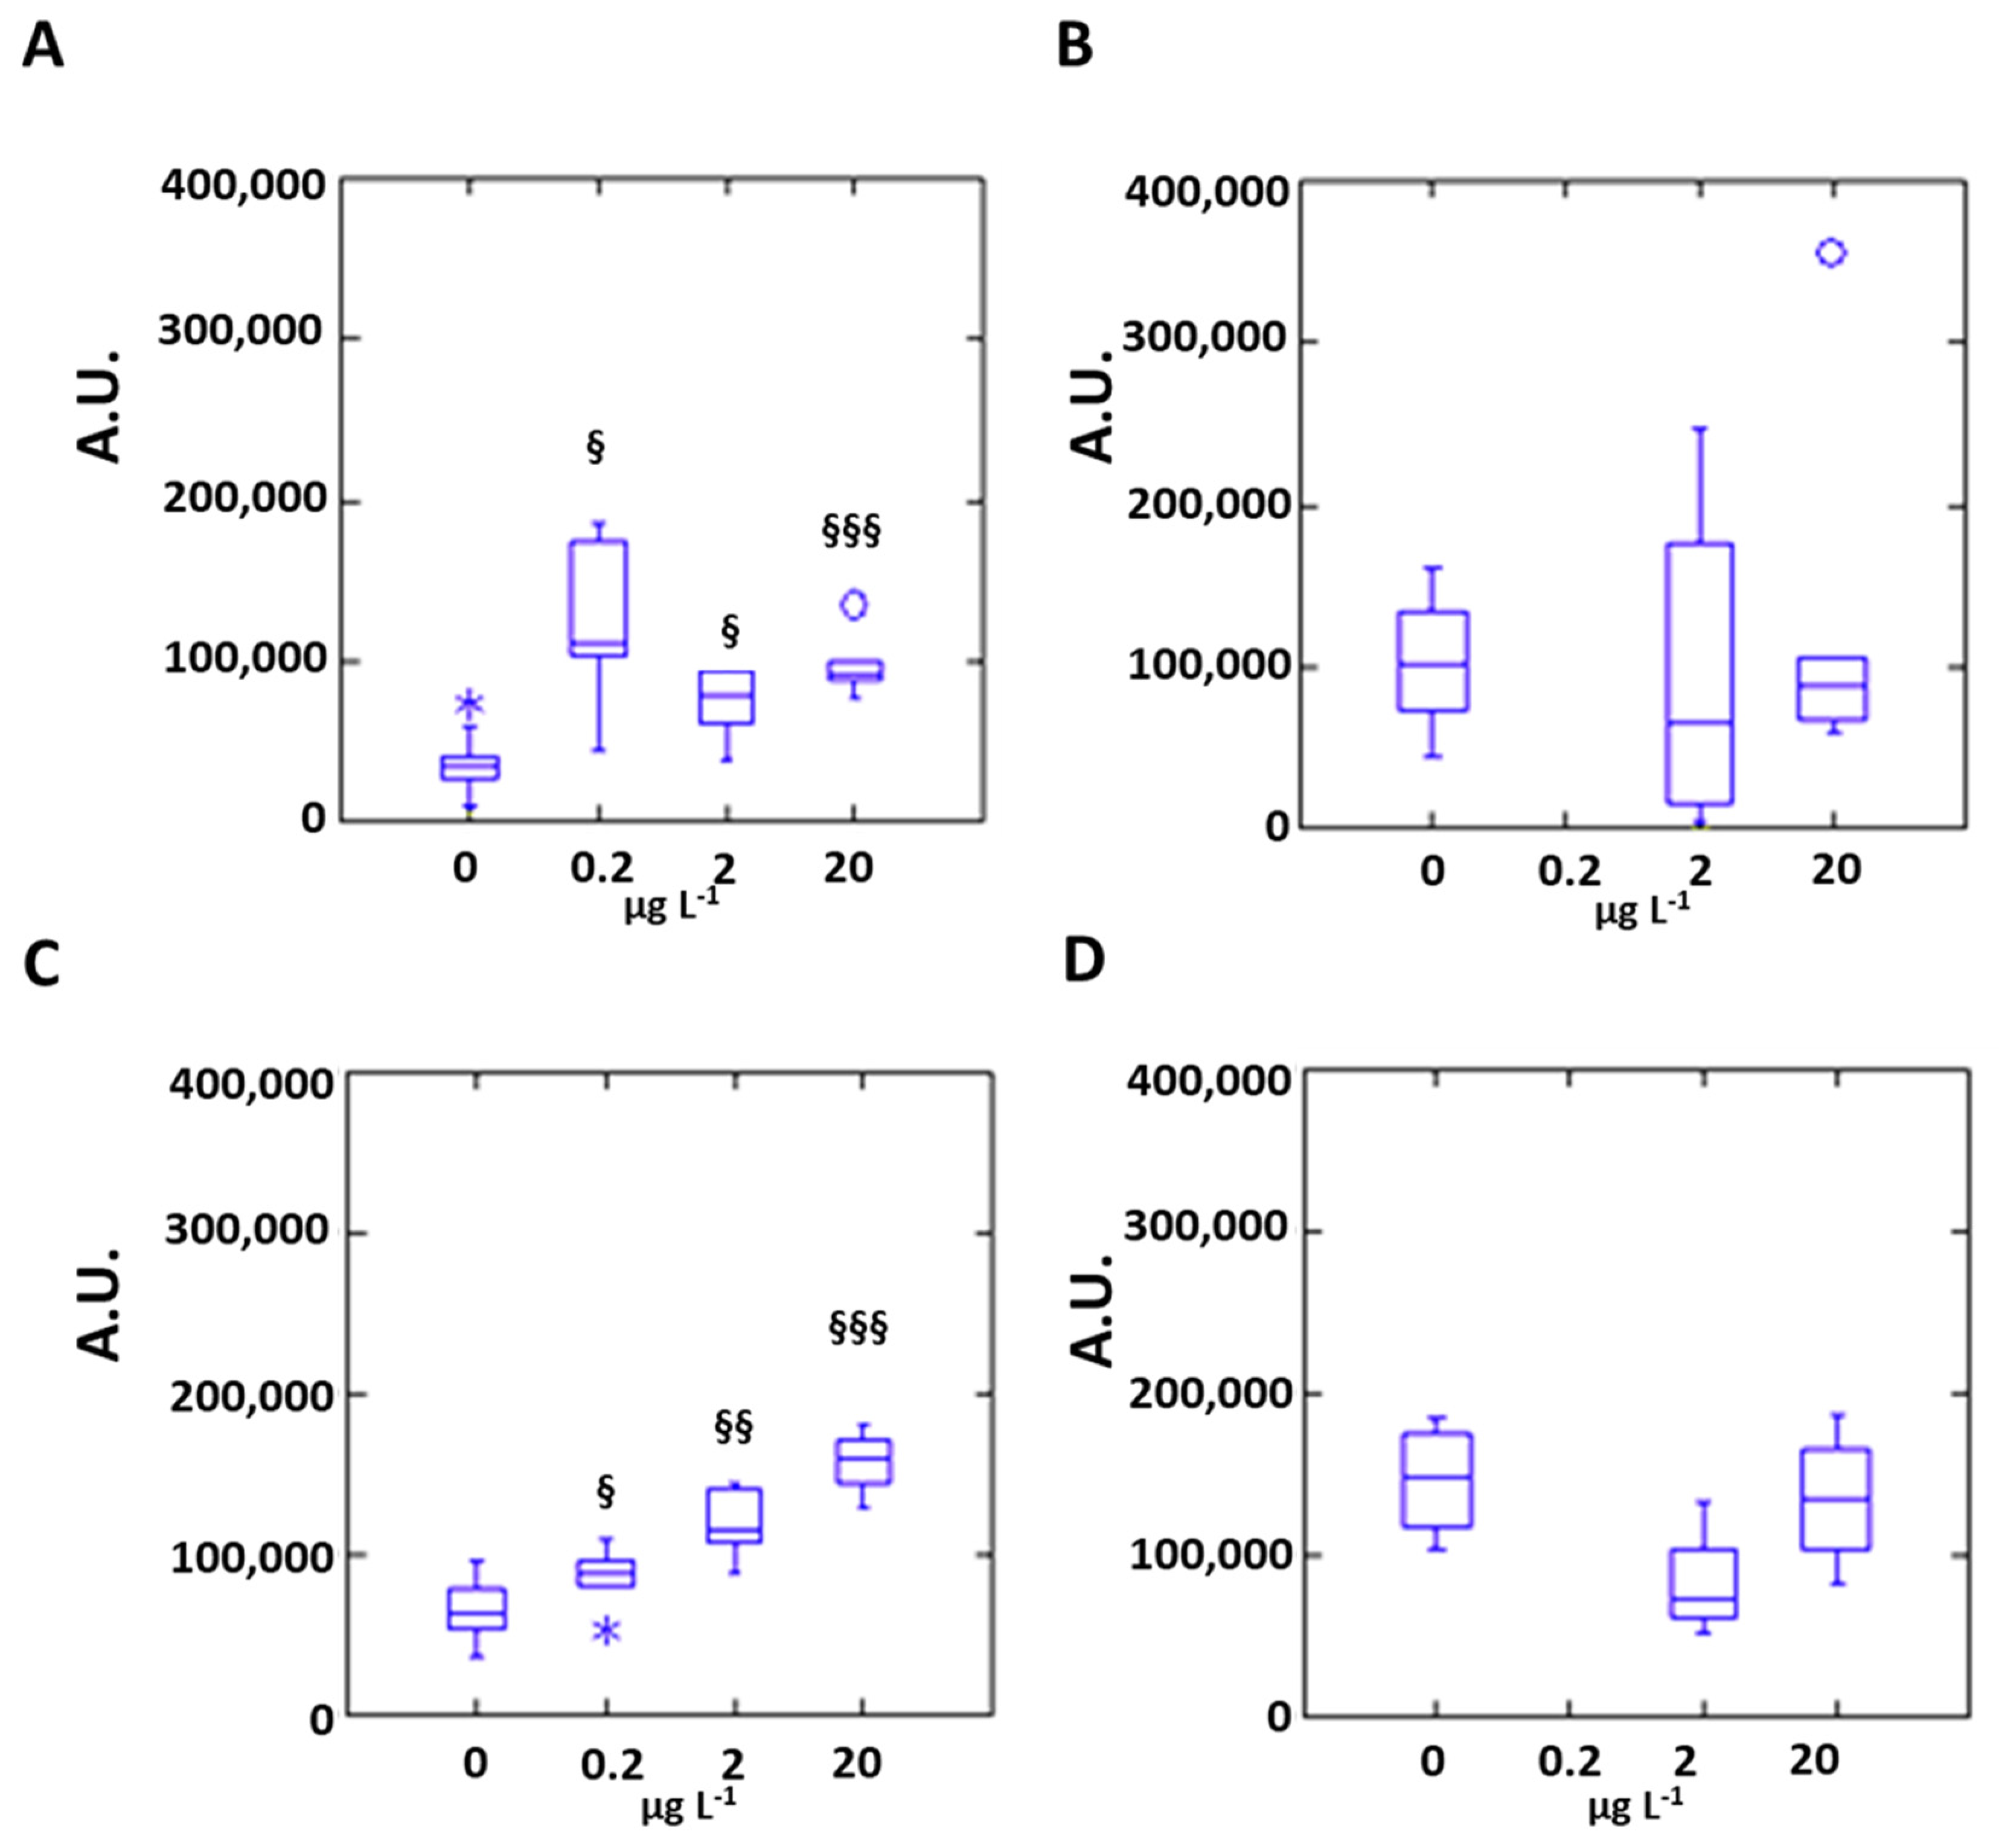
3.2. Silver Effects on Mussel Antioxidant System

In-gel assays were used to evaluate the long-term effects (28 days) of silver exposure—either to the nitrate form or with 5 nm alkane-coated AgNPs—on the antioxidant enzyme systems of mussels in the digestive glands or gills. Figure 5 shows the effects on catalase activity. Indeed, silver nanoparticles evoked no significant changes at the exposure levels tested, whereas the effects of silver nitrate were statistically significant in both digestive gland and gills (Kruskal–Wallis one-way analysis of variance, p = 0.019 and 0.040, respectively), with enzyme activity increasing in the latter tissue in accordance with a dose-dependent trend.
A more pronounced dose dependence was observed for the activity of SOD in the gills, while in the digestive gland, the appearance of a threshold effect of silver nitrate is now more evident. Both effects were highly significant (Kruskal–Wallis one-way analysis of variance, p < 0.001). In contrast, no significant effects were observed for exposure to AgNPs (Figure 6).
In the case of GPX, the total glutathione-dependent peroxidase activity increased for the effects of silver nitrate, but only in gills at the highest concentration tested (20 μg L−1) (Figure 7).

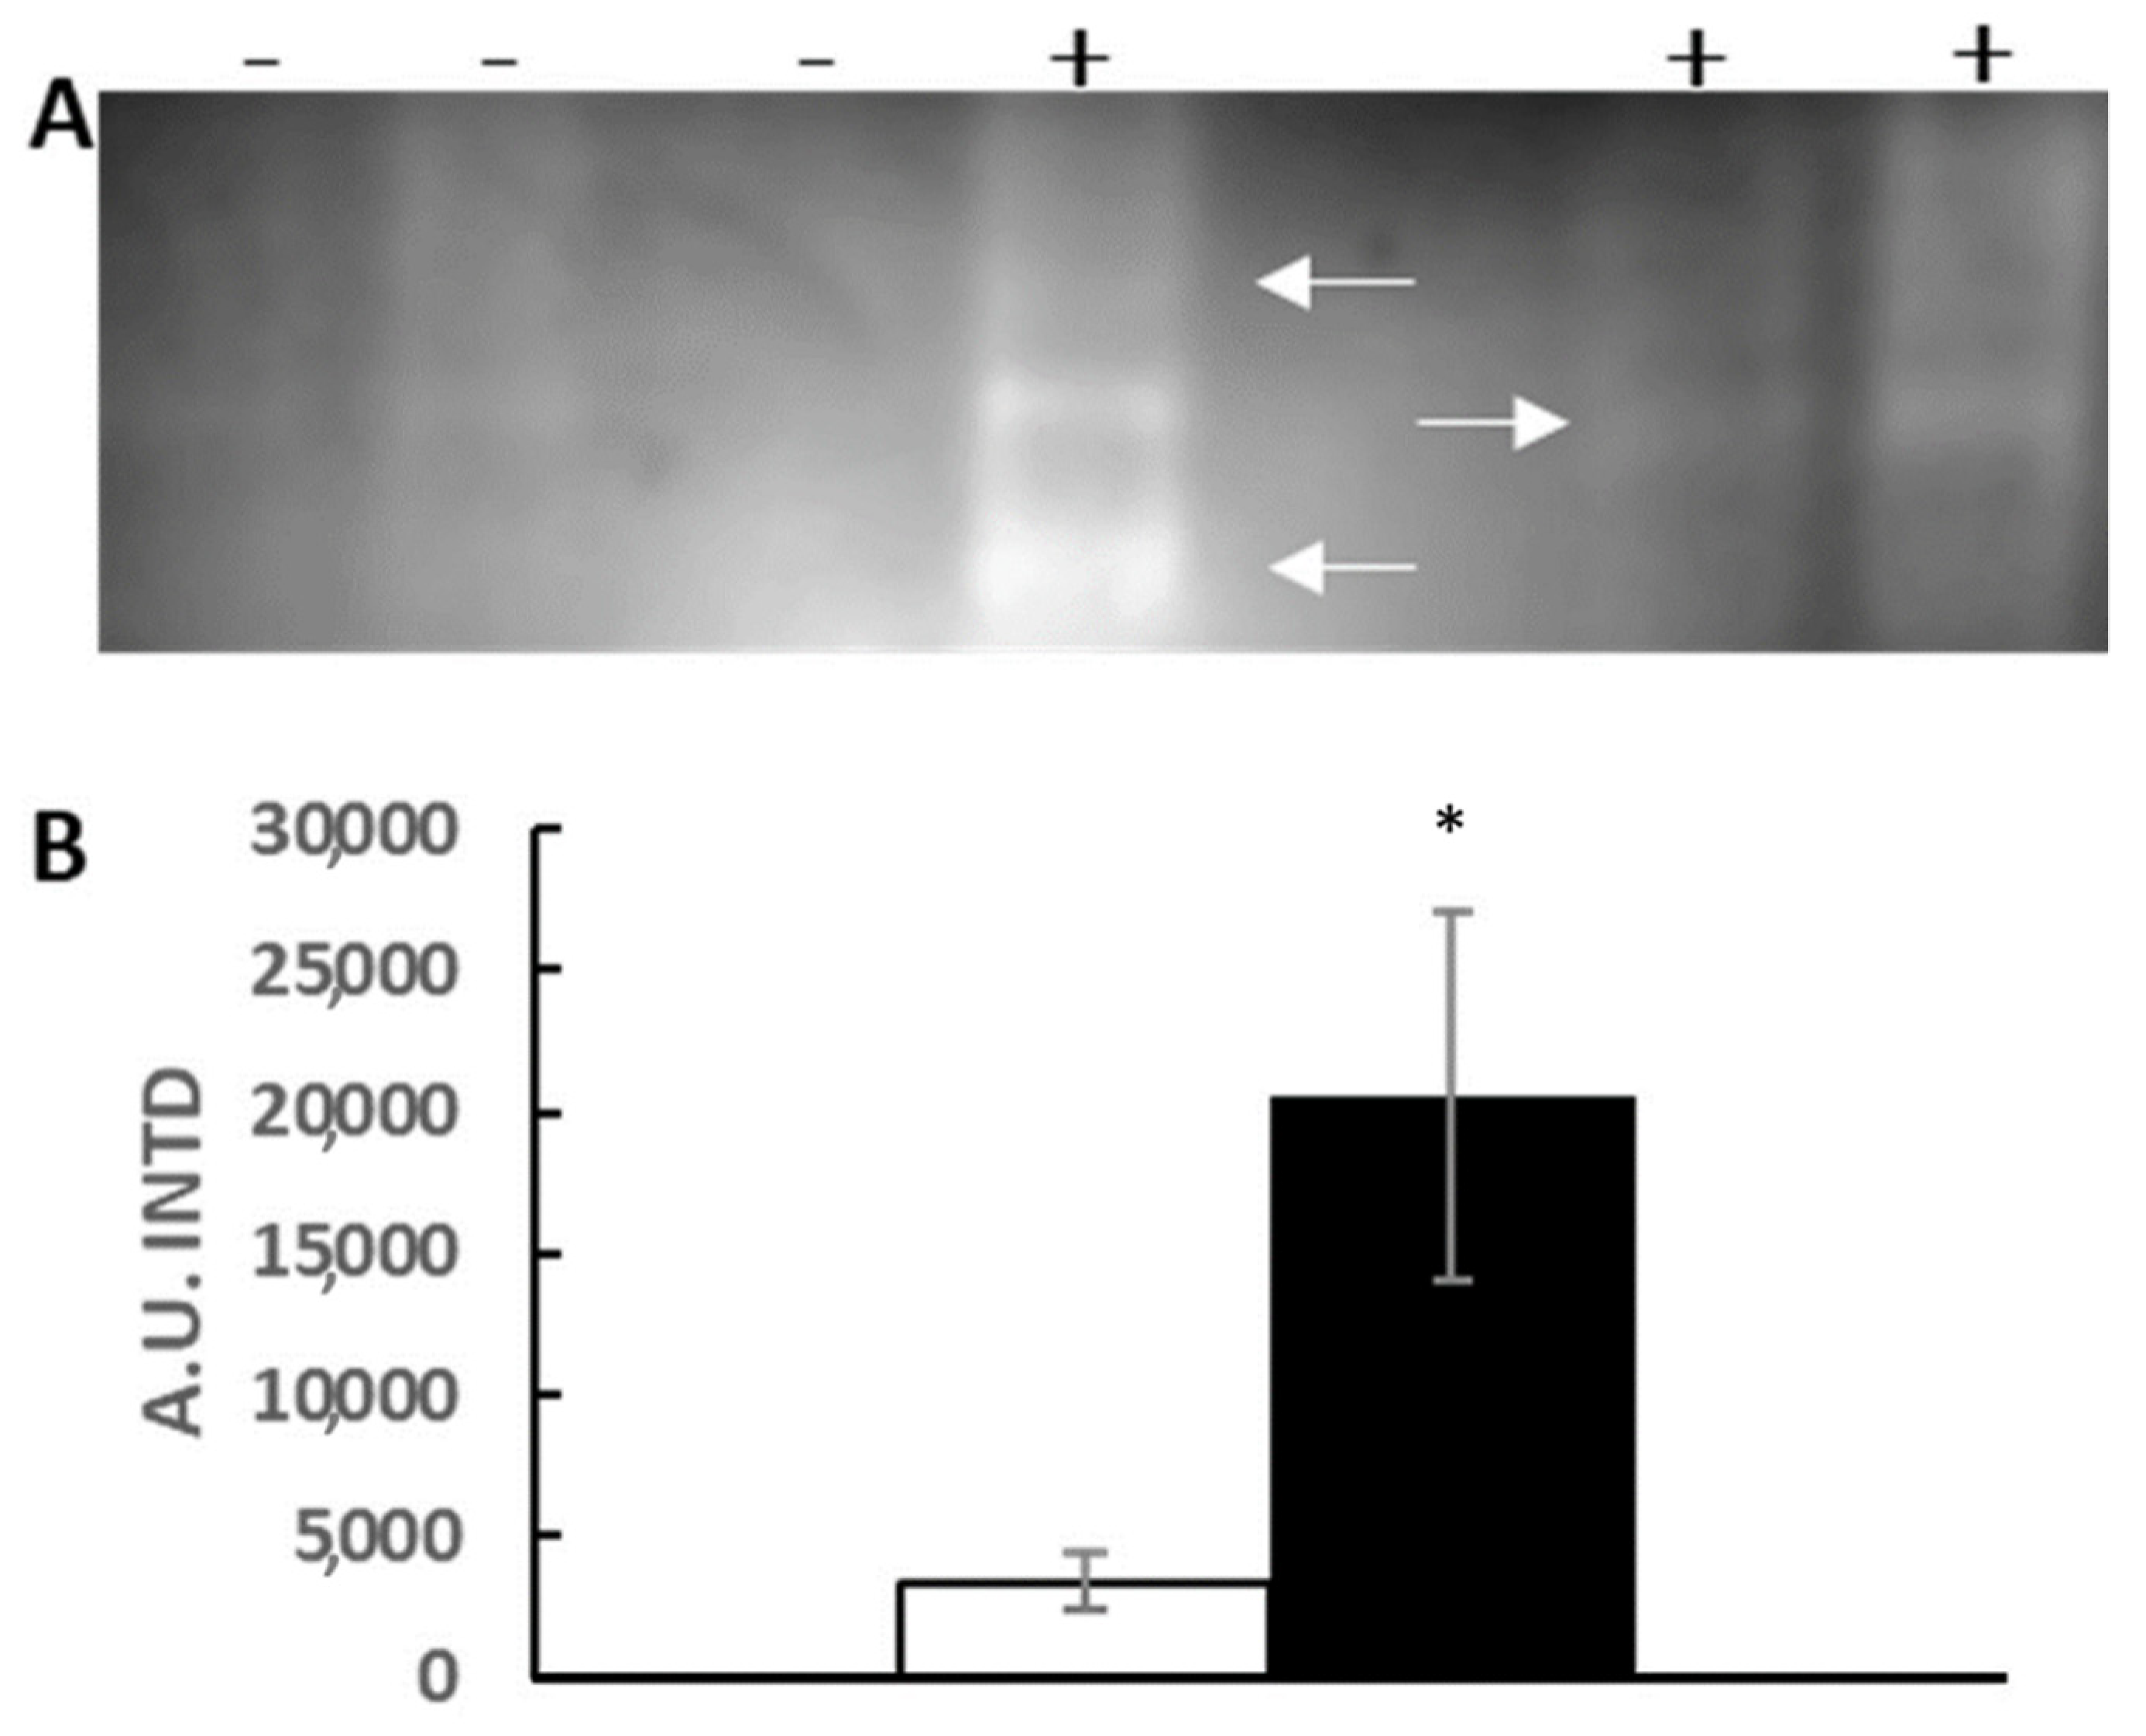
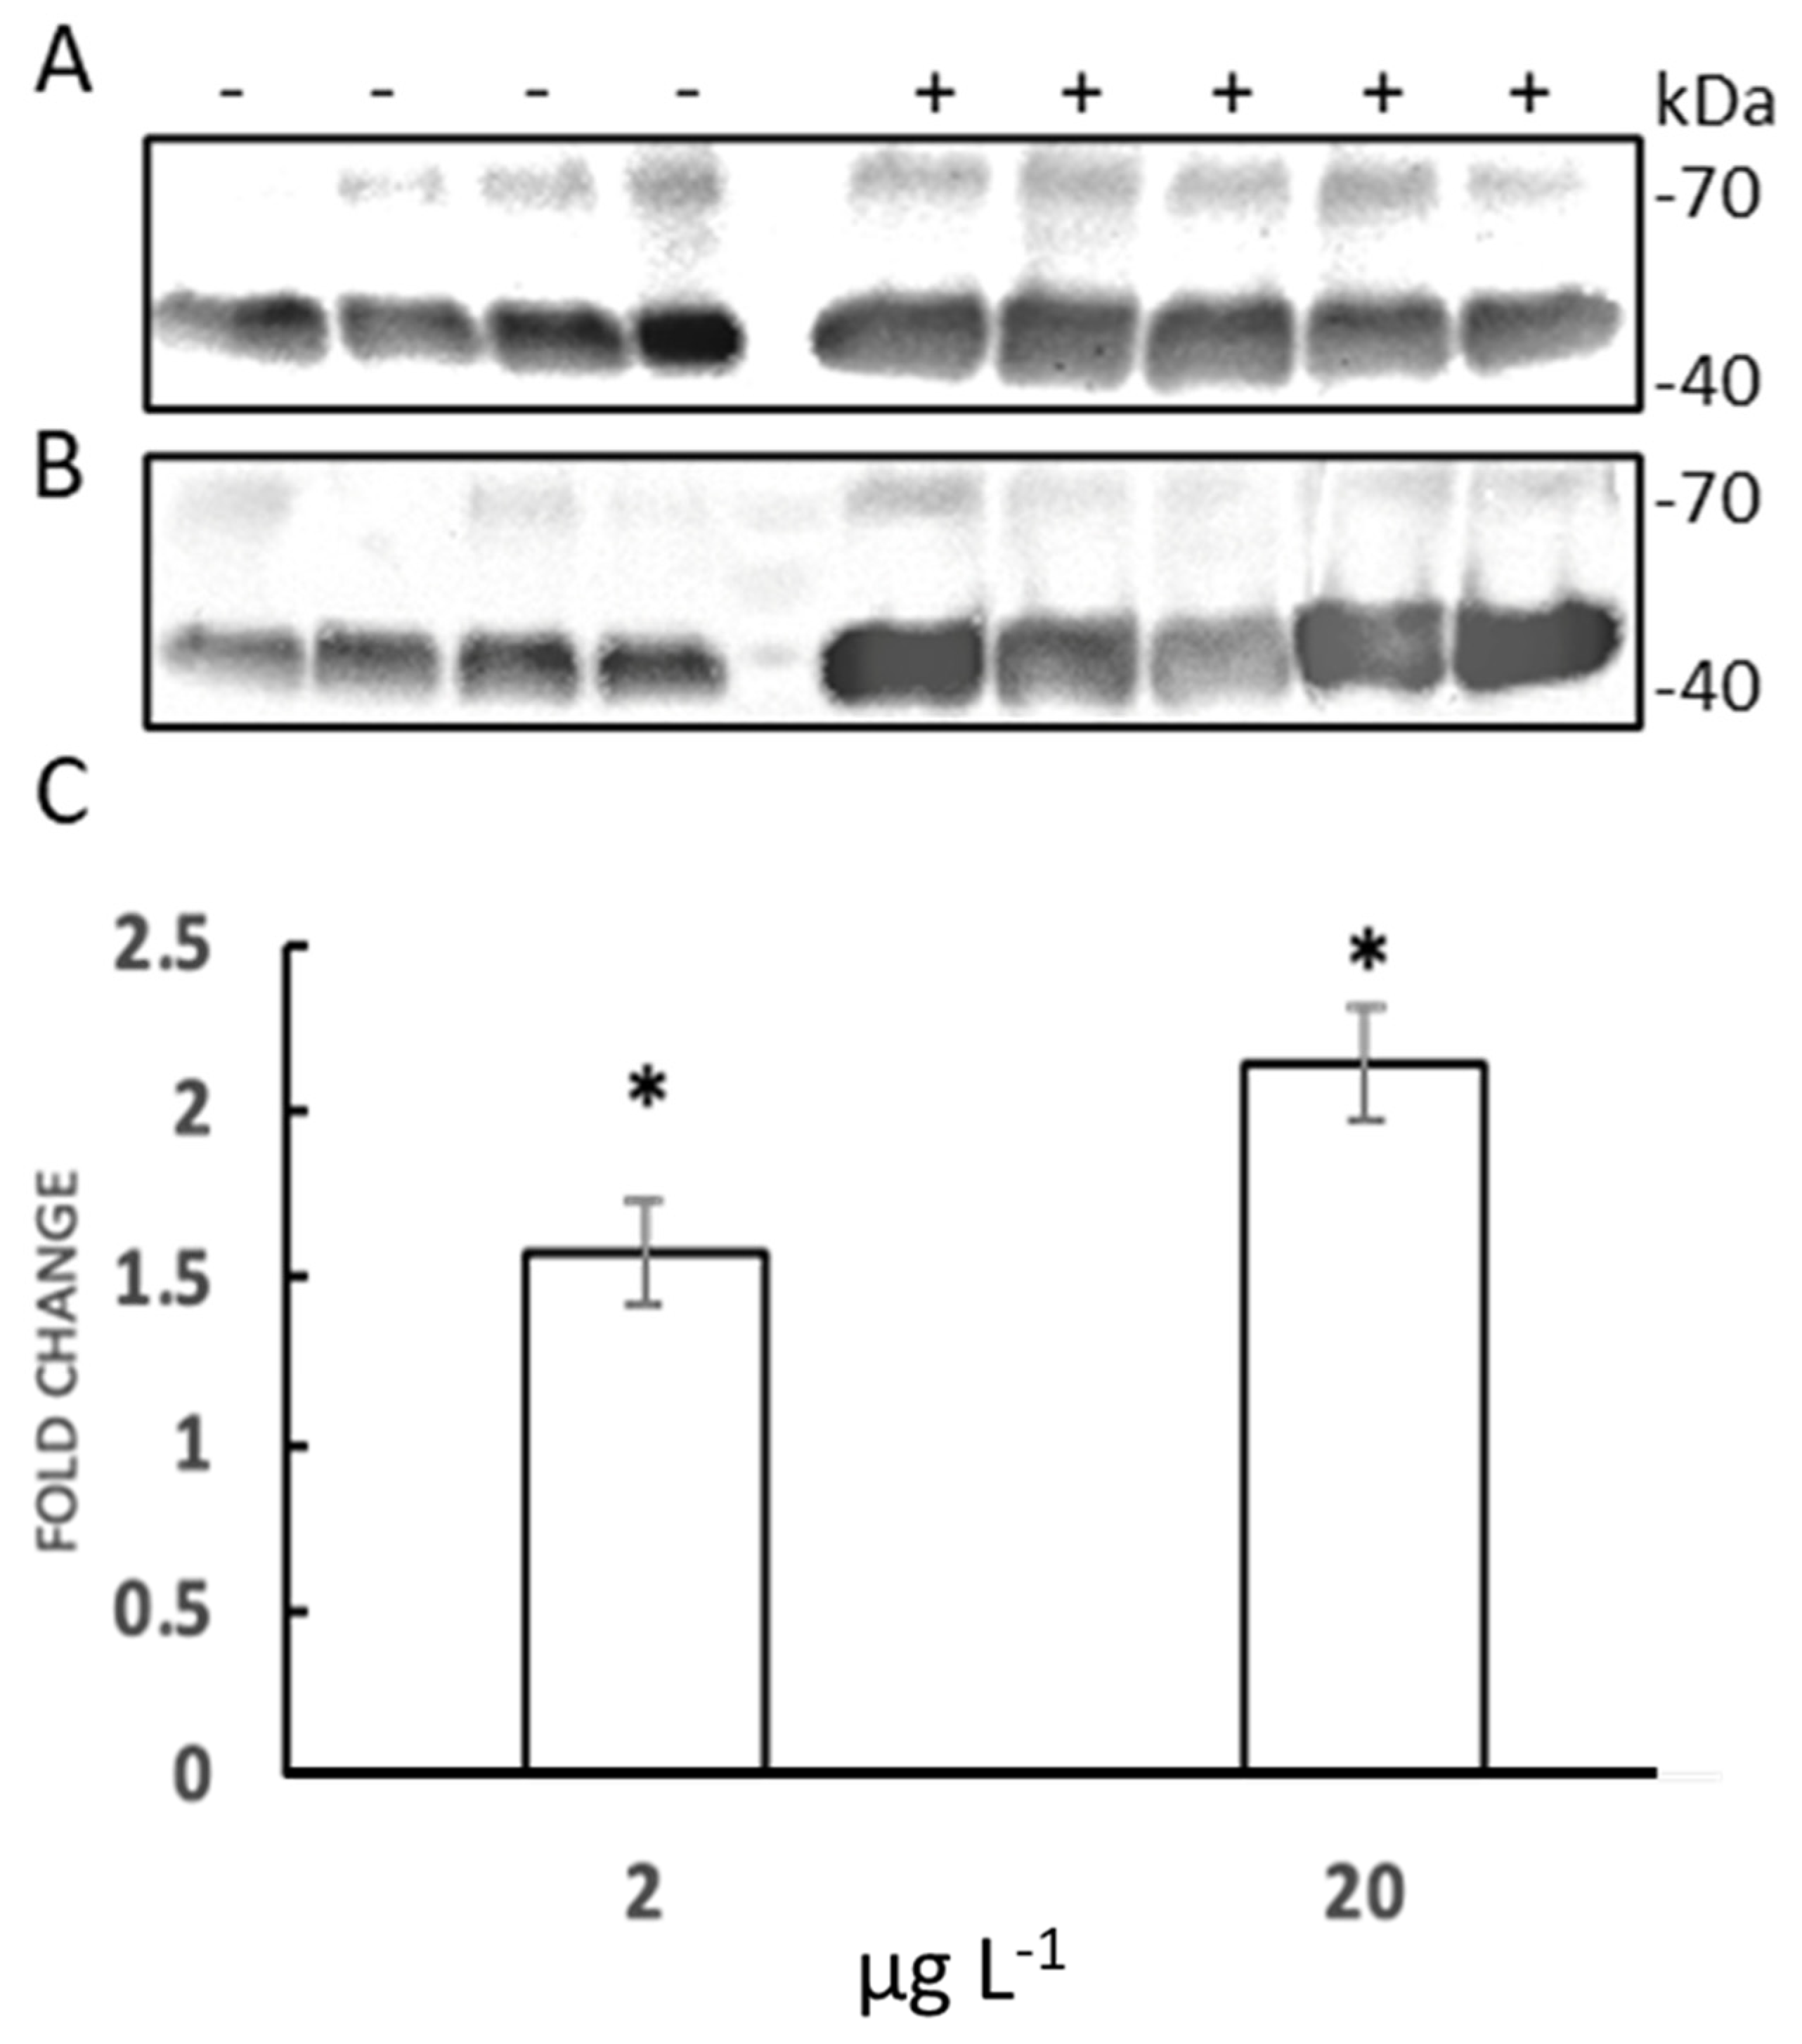
3.3. HSP70 Identification with Western Blot Assay

In this study, we also examined the change in HSP70 content via Western blot using a commercial anti-hsp70 antibody directed against a specific part of the inducible HSP70 gene of Mytilus galloprovincialis (Lam.). A statistically significant increase in HSP70 content was detected in the gills at the two highest silver nitrate exposure levels. The other conditions did not trigger substantial changes (Figure 8).

4. Discussion

To obtain clues of the mode of action of toxicity of silver and AgNPs, we have performed in-gel assays for three major antioxidant enzymes—CAT, SOD, and GPX—in the tissues of marine bivalves, which often serve as bioindicators of marine pollution. The three methods have been shown to be sensitive and robust, making them suitable for routine use in biological monitoring programs in place of classical enzyme kinetics-based assays. These may have some limitations due to the heterogeneous protein fraction and the need for kinetic detection, leading to possible interference with other enzymes and/or nonlinear kinetics, which complicates the evaluation. The use of an electrophoretic approach allows direct detection immediately after the preparation of a protein fraction. We have substantially revised the native gel electrophoresis method originally developed by Davis [46] and Ornstein [47] and recently re-proposed by Weydert and Cullen [44] for the determination of antioxidant protein activity. This method requires a time-consuming procedure with a long duration of pre-electrophoresis and a total time of 6 h using two different running buffers. In our hands, this type of run proved to be insufficient due to sample degradation or sample loss. Therefore, we abandoned the long and ineffective pre-electrophoresis steps and proceeded directly to electrophoresis of proteins in Tris/glycine pH 8.3 in the presence of EDTA for a duration of only 90 min (40 mA, 4 °C) using precast gels. This procedure proved successful for the sufficient separation of multiple molecular weight markers containing cytochrome c, bovine serum albumin, aprotinin, catalase, and carbonic anhydrase (data not shown). In addition, precast gel technology eliminated the high background that interferes with the quantification of enzymatic activity. This error, reported by Weydert and Cullen [44] was due to the interference of the polyacrylamide gel catalyst TEMED with the CAT and GPX reaction mixture. This change in protocol allowed for complete elimination of the background, shortening run times while increasing scalability for a large number of samples. Finally, we also increased the hydrogen peroxide concentration from 0.003% to 0.01%, which allowed a better definition of the CAT band in the gel without a loss of linearity and with a significant increase in sensitivity.
The design of the protocol for GPX was based on the native method described by Lin et al. [43]. The main improvement was the use of cumene hydroperoxide at a concentration of 0.008%, which allowed us to determine a specific glutathione-dependent peroxidase activity that cannot be detected with hydrogen peroxide as a substrate. We have shown that this is a specific reaction that does not occur in the absence of GSH. Furthermore, three distinct achromatic bands appear in 12% native PAGE, indicating the presence of multiple enzymes with true glutathione-dependent peroxidase activity.
Nowadays, nano-silver is one of the most widely used metals in consumer products due to its antibacterial activity and good tolerance [48]. Silver NPs are known to enter the aquatic environment in various ways, mainly through incorporation into commercial products, but also during their use. In addition, AgNPs can be spread through air and deposited in aquatic environments, not to mention the NPs generated by the erosion of polluted soils [24,49]. The ocean is the ultimate recipient of nanomaterials and is sometimes considered a sink, as its high salinity tends to destabilize, or in the worst case, dissolve nanomaterials [50,51]. Mussels have been identified as a good indicator of exposure to NPs. Indeed, agglomerate/aggregate particles are taken up by the gills and then partially enter the digestive gland, leading to a series of reactions, lysosomal disorders, changes in the expression of antioxidant- and immune-related genes, and other effects [7]. It is well known that heavy metals can induce oxidative stress in organisms. In particular, ionic silver is one of the most toxic metals for aquatic organisms, it is persistent and accumulates in aquatic systems, water, sediments, soil, and organisms, and causes ecological damage in the environment [48].
In this study, we determined the activities of antioxidant enzymes and the relative abundances of HSP70 in response to 28-day exposure to silver nitrate and silver nanoparticles in two of the most responsive tissues of marine mussels. The concentration range of silver used in the current work (0.2–20 μgL−1) is from a previous work in which we evaluated the ecotoxicological range of silver nitrate and silver nanoparticles for acute and chronic effects. All concentrations are completely sublethal, but in the case of silver nitrate, the highest two concentrations (20 and 2 μgL−1) are within the range of an effective concentration for the inhibition of byssus synthesis (below EC50) [39]. Our data (this work) show that silver nitrate is capable of eliciting biochemical effects even at lower doses (e.g., 0.2 μgL−1), as noted for CAT and SOD activities in both gills and digestive glands. The two patterns were very similar (Figure 5 and Figure 6), showing a dose-dependent effect or a threshold-like effect in the gills or digestive glands. GPX also responded to silver nitrate, but only in the gills and at the highest exposure concentration. On the other hand, silver nitrate nanoparticles had no significant effect on any of the biochemical variables tested. It should be mentioned that previous data from our research group have shown that silver nitrate and silver nanoparticles target different organs in terms of bioaccumulation. In fact, the nitrate form is preferentially taken up in the gills, probably due to the stability of complex ionic silver forms in seawater [52]. On the other hand, particulate silver, i.e., nanoparticles, are also found in the digestive gland, probably following the feeding pathway after having undergone an increase in size in seawater due to the loss of zeta-potential. Our best explanation for this difference between the two metal forms—in terms of biochemical effects—is based on the higher reactivity and bioavailability of silver nitrate compared to silver nanoparticles, which, as mentioned, tend to be more unstable in seawater [39]. Indeed, silver nanoparticles tend to form aggregates when the surface potential suddenly changes due to pH and ionic strength [48].
In addition, it should be considered that a long exposure time (28 days) may have allowed a compensatory response of the antioxidant enzyme system, which could have occurred earlier with nanoparticle exposure essentially because of the overall lower dose, due to the aggregation and precipitation of nanoparticles [39]. Previously published data on the effects of 3–15-day exposure of silver NP in marine mollusks showed that CAT, SOD, and GPX activity in the gills increased linearly with time [27], but in another study using similar concentrations of a silver NP for 94 h, no effects were reported for CAT and very little change for GST, another common antioxidant system [9].
Regarding ionic silver, Gomes et al. [27] reported a significant induction effect of CAT activity in the digestive gland on the fifteenth day, a decrease in GPX in the gills, and no effects for SOD. Boukadida et al. [53] also reported increased CAT activity in larvae of M. galloprovincialis exposed to ionic silver. In the soft tissues of other marine bivalves, such as the endobenthic S. plana, aqueous nano- or ionic silver affected CAT activity at day fourteen, but not SOD and several other biochemical markers (GST, MT, LDH) [54].
When we compare these data with our results in detail, we cannot ignore the fact that the exposure time is shorter in almost all these papers and therefore a complete comparison is not possible. In fact, the observed differences should reflect the different stages of a dynamic process of adaptation to stress conditions. Therefore, the results observed in the digestive gland for our silver NPs are not controversial and still seem to indicate a different mode of action or the way the particles are presented to the cell; however, mechanistic studies are needed. As a corollary, in this work, we also examined HSP70 protein expression in response to silver. As expected, a significant increase in an inducible HSP70 band migrating with an apparent molecular mass of 45 kDa was observed upon exposure to silver nitrate, only in the gills at the two higher concentrations tested (2 and 20 μg L−1). This band is a candidate for stress-induced HSP68 as proposed by Hofmann and Somero [55] in Mytilus trossulus. However, it should be noted that authors have also reported HSP70 degradation products appearing near this mass in Western blot analysis [56,57].

5. Conclusions

In this work, we developed three different in-gel assays to evaluate CAT, SOD, and GPX activity in Mytilus galloprovincialis (Lam.). We have shown these methods can be successfully used to evaluate the antioxidant response in samples exposed to silver, which is now back in vogue because this metal is widely used in the form of nanoparticles. However, based on equal amounts in mass, it was shown that the effects were negligible after 28 days in the case of colloidal silver, while in the case of silver nitrate, all antioxidant variables and the expression of HSP70 showed a significant response.
These data suggest a low risk of environmental impacts of colloidal silver, i.e., nanoparticles, in the marine environment.

Author Contributions

Conceptualization, F.D. and G.S.; methodology, A.C.; validation, F.D., A.C. and C.L.; formal analysis, F.D.; investigation, C.L.; resources, F.D.; data curation, F.D.; writing—original draft preparation, A.C.; writing—review and editing, F.D.; visualization, A.C.; supervision, F.D.; project administration, F.D.; funding acquisition, F.D. All authors have read and agreed to the published version of the manuscript.

Funding

This work was financially supported by NanoFATE, Project CP-FP 247739 (2010e2014) under the 7th Framework Programme of the European Commission (FP7-NMP-ENV-2009, Theme 4).

Institutional Review Board Statement

This study did not require ethical approve according to the legislation in force Europe DIRECTIVE 2010/63/EU OF THE EUROPEAN PARLIAMENT AND OF THE COUNCIL.

Informed Consent Statement

Not applicable.

Conflicts of Interest

The authors declare no conflict of interest.

References

  1. Maanan, M.; Saddik, M.; Maanan, M.; Chaibi, M.; Assobhei, O.; Zourarah, B. Environmental and ecological risk assessment of heavy metals in sediments of Nador lagoon, Morocco. Ecol. Indic. 2005, 48, 616–626. [Google Scholar] [CrossRef]
  2. El Zrelli, R.; Rabaoui, L.; Alaya, M.B.; Daghbouj, N.; Castet, S.; Besson, P.; Michel, S.; Bejaoui, N.; Courjault-Radé, P. Seawater quality assessment and identification of pollution sources along the central area of Gabes Gulf (SE Tunisia): Evidence of industrial impact and implication for marine environment protection. Mar. Pollut. Bull. 2018, 127, 445–452. [Google Scholar] [CrossRef] [PubMed]
  3. Dondero, F.; Calisi, A. Evaluation of Pollution Effects in Marine Organisms: “Old” and “New Generation” Biomarkers. In Coastal Ecosystems: Experiences and Recommendations for Environmental Monitoring Programs; Sebastià, M.T., Ed.; Nova Science Publishers: New York, NY, USA, 2015; pp. 143–192. [Google Scholar]
  4. Villarubia-Gómez, P.; Cornell, S.; Fabres, J. Marine plastic pollultion as a planetary boundary threat—The drifting piece in the sustainability puzzle. Mar. Policy 2018, 96, 213–220. [Google Scholar] [CrossRef]
  5. Pinto, M.M.; Ledet, J.; Crowe, T.P.; Johnstone, E.L. Sublethal effects of contaminants on marine habitat-forming species: A review and meta-analysis. Biol. Rev. Cambrigde Philos. 2020, 95, 1554–1573. [Google Scholar] [CrossRef] [PubMed]
  6. Landrigan, P.J.; Stegeman, J.J.; Fleming, L.E.; Allemand, D.; Anderson, D.M.; Backer, L.C.; Brucker-Davis, F.; Chevalier, N.; Corra, L.; Czerucka, D.; et al. Human Health and Ocean Pollution. Ann. Glob. Health 2020, 86, 151. [Google Scholar] [CrossRef] [PubMed]
  7. Corsi, I.; Cherr, G.N.; Lenihan, H.S.; Labille, J.; Hassellov, M.; Canesi, L.; Dondero, F.; Frenzilli, G.; Hristozov, D.; Puntes, V.; et al. Common strategies and technologies for ecosafety assesment and design of nanomaterials. Entering. The marine environment. ACS Nano 2014, 8, 9694–9709. [Google Scholar]
  8. Ale, A.; Rossi, A.S.; Bacchetta, C.; Gervasio, S.; de la Torre, F.R.; Cazenave, J. Integrative assessment of silver nanoparticles toxicity in Prochilodus lineatus fish. Ecol. Indic. 2018, 93, 1190–1198. [Google Scholar] [CrossRef]
  9. Ale, A.; Liberatori, G.; Vannuccini, M.L.; Bergami, E.; Ancora, S.; Mariotti, G.; Bianchi, N.; Galdopórpora, J.M.; Desimone, M.F.; Cazenave, J.; et al. Exposure to a nanosilver-enabled consumer product results in similar accumulation and toxicity of silver nanoparticles in the marine mussel Mytilus galloprovincialis. Aquat. Toxicol. 2019, 211, 46–56. [Google Scholar] [CrossRef]
  10. Roma, J.; Matos, A.R.; Vinagre, C.; Duarte, B. Engineered metal nanoparticles in the marine environment: A review of the effects on marine fauna. Mar. Environ. Res. 2020, 161, 105110. [Google Scholar] [CrossRef]
  11. Palmberg, C.; Dernis, H.; Miguet, C. Nanotechnology: An Overview Based on Indicators and Statistics; OECD Science, Technology and Industry Working Papers, No. 2009/07; OECD Publishing: Paris, France, 2009; p. 112. [Google Scholar]
  12. Braunschweig, J.; Bosch, J.; Meckenstock, R.U. Iron oxide nanoparticles in geomicrobiology: From biogeochemistry to bioremediation. New Biotechnol. 2013, 30, 793–802. [Google Scholar] [CrossRef]
  13. Hofacker, A.F.; Voegelin, A.; Kaegi, R.; Weber, F.A.; Kretzschmar, R. Temperature-dependent formation of metallic copper and metal sulfide nanoparticles during flooding of a contaminated soil. Geochim. Cosmochim. Acta 2013, 103, 316–332. [Google Scholar] [CrossRef]
  14. Mendez, J.C.; Hiemstra, T.; Koopmans, G.F. Assessing the Reactive Surface Area of Soils and the Association of Soil Organic Carbon with Natural Oxide Nanoparticles Using Ferrihydrite as Proxy. Environ. Sci. Technol. 2020, 54, 11990–12000. [Google Scholar] [CrossRef] [PubMed]
  15. Marambio-Jones, C.; Hoek, E.M.V. A rewiew of the antibacterial effects of silver nanomaterials and potential implications for human health and the environment. J. Nanopart. Res. 2010, 12, 1531–1551. [Google Scholar] [CrossRef]
  16. Akmaz, S.; Adigüzel, E.D.; Yasar, M.; Erguven, O. The effect of Ag content of the Chitosan-silver nanoparticle composite material on the structure and antibacterial activity. Adv. Mater. Sci. Eng. 2013, 2013, 6. [Google Scholar] [CrossRef] [Green Version]
  17. Le Ouay, B.; Stellacci, F. Antibacterial activity of silver nanoparticles: A surface science insight. Nano Today 2015, 10, 339–354. [Google Scholar] [CrossRef] [Green Version]
  18. Slavin, Y.N.; Asnis, J.; Häfeli, U.O.; Bach, H. Metal nanoparticles: Understanding the mechanism behind antibacterial activity. J. Nanobiotechnol. 2017, 15, 65. [Google Scholar] [CrossRef]
  19. Rineesh, N.R.; Neelakandan, M.S.; Sabu, T. Applications of Silver Nanoparticles for Medicinal Purpose. JSM Nanotechnol. Nanomed. 2018, 6, 1063. [Google Scholar]
  20. Krutyakov, Y.A.; Kudrinskiy, A.A.; Olenin, A.Y.; Lisichkin, G.V. Synthesis and properties of silver nanoparticles: Advances and prospects. Russ. Chem. Rev. 2008, 77, 233. [Google Scholar] [CrossRef]
  21. Lesser, M.P. Oxidative stress in marine environments: Biochemistry and Physiological Ecology. Ann. Rev. Physiol. 2006, 68, 253–278. [Google Scholar] [CrossRef] [Green Version]
  22. Lushchak, V.I. Environmentally induced oxidative stress in acquatic animals. Aquat. Toxicol. 2011, 101, 13–30. [Google Scholar] [CrossRef]
  23. Walters, C.; Pool, E.; Somerset, V. Nanotoxicity in aquatic invertebrates. In Invertebrates—Experimental Models in Toxicity Screening; Larramendy, M.L., Soloneski, S., Eds.; Intech Open: London, UK, 2016; p. 22. [Google Scholar]
  24. Bouallegui, Y.; Younes, R.B.; Turki, F.; Oueslati, R. Impact of exposure time, particle size and uptake patway on silver nanoparticle effects on circulating immune cells in Mytilus galloprovincialis. J. Immunol. 2017, 14, 116–124. [Google Scholar]
  25. Birnie-Gauvin, K.; Costantini, D.; Cooke, S.J. A comparative and evolutionary approach toon oxidative stress in fish: A review. Fish Fish. 2017, 18, 928–942. [Google Scholar] [CrossRef]
  26. Choi, J.C.; Xu, Z.; Wu, H.-Y.; Liu, G.L.; Cunningham, B.T. Surface-enhanced Raman nanodomes. Nanotecnology 2010, 21, 41. [Google Scholar] [CrossRef] [PubMed]
  27. Gomes, T.; Pereira, C.G.; Cardoso, C.; Sousa, V.S.; Teixeira, M.R.; Pinheiro, J.P.; Bebianno, M.J. Effect of silver nanoparticles exposure in the mussel Mytilus galloprovincialis. Mar. Environ. Res. 2014, 101, 208–214. [Google Scholar] [CrossRef]
  28. Bouallegui, Y.; Younes, R.B.; Oueslati, R.; Sheehan, D. Role of endocytotic uptake routes in impacting the ros-related toxicity of silver nanoparticles to Mytilus galloprovincialis: A redox proteomic investigation. Aquat. Toxicol. 2018, 200, 21–27. [Google Scholar] [CrossRef]
  29. Baun, A.; Hartmann, N.B.; Grieger, K. Ecotoxicology of engineered nanoparticles to aquatic invertebrates: A brief review and recommendations for future toxicity testing. Ecotoxicology 2008, 17, 387–395. [Google Scholar] [CrossRef]
  30. Canesi, L.; Ciacci, C.; Fabbri, R.; Marcomini, A.; Pojana, G.; Gallo, G. Bivalve mollusks as a unique target group for nanoparticle toxicity. Mar. Environ. Res. 2012, 76, 16–21. [Google Scholar] [CrossRef]
  31. Rocha, T.L.; Gomes, T.; Sousa, V.S.; Mestre, N.C.; Bebianno, M.J. Ecotoxicological impact of engineered nanomaterials in bivalve mollusks: An overview. Mar. Environ. Res. 2015, 111, 74–88. [Google Scholar] [CrossRef]
  32. Moore, M.N. Do nanoparticles present ecotoxicological risks for the health of aquatic environment? Environ. Int. 2006, 32, 967–976. [Google Scholar] [CrossRef]
  33. Dagnino, A.; Allen, J.I.; Moore, M.N.; Broeg, K.; Canesi, L.; Viarengo, A. Development of an expert system for the integration of biomarker responses in mussels into an animal health index. Biomarkers 2007, 12, 155–172. [Google Scholar] [CrossRef]
  34. Banni, M.; Dondero, F.; Jebali, J.; Guerbej, H.; Boussetta, H.; Viarengo, A. Assessment of heavy metal contamination using real-time PCR analysis of mussel metallothionein mt10 and mt20 expression: A validation along the Tunisian coast. Biomarkers 2006, 12, 369–383. [Google Scholar] [CrossRef] [PubMed]
  35. Taze, C.; Panetas, I.; Kalogiannis, S.; Feidantsis, K.; Gallios, G.P.; Kastrinaki, G.; Konstandopoulos, A.G.; Václavíková, M.; Ivanicova, L.; Kaloyianni, M. Toxicity assessment and comparison between two type of iron oxide nanoparticles in Mytilus galloprovincialis. Aquat. Toxicol. 2016, 172, 9–20. [Google Scholar] [CrossRef] [PubMed]
  36. Beyer, J.; Green, N.W.; Brooks, S.; Allan, I.J.; Andres, R.; Gomes, T.; Bråte, I.L.N.; Schøyen, M. Blue mussel (Mytilus edulis spp.) as sentinel organisms in coastal pollution monitoring: A review. Mar. Environ. Res. 2017, 130, 338–365. [Google Scholar] [CrossRef] [PubMed]
  37. Azizi, G.; Akodad, M.; Baghour, M.; Layachi, M.; Moumen, A. The use of Mytilus spp. Mussels as bioindicators of heavy metal pollution in the coastal environment. A review. J. Mater. Environ. Sci. 2018, 9, 1170–1181. [Google Scholar]
  38. Ribeiro, F.; Gallego-Urrea, J.A.; Jurkschat, K.; Loureiro, S. Silver nanoparticles and silver nitrate induce high toxicity to Pseudokirchneriella subcapitata, Daphnia magna and Danio rerio. Sci. Total Environ. 2014, 466–467, 232–241. [Google Scholar] [CrossRef] [PubMed]
  39. Calisi, A.; Lorusso, C.; Gallego-Urrea, J.A.; Hasselov, M.; Dondero, F. Ecotoxicological effects of silver nanoparticles in marine mussels. bioRxiv 2021. [Google Scholar] [CrossRef]
  40. Bradford, M.M. A rapid and sensitive method for the quantitation of microgram quantities of protein utilizing the principle of protein-dye binding. Anal. Biochem. 1976, 72, 248–254. [Google Scholar] [CrossRef]
  41. Woodbury, W.; Spencer, A.K.; Stahman, M.A. An improved procedure using ferricyanide for detecting catalase isozymes. Anal. Biochem. 1971, 44, 301–305. [Google Scholar] [CrossRef]
  42. Beauchamp, C.; Fridovich, I. Superoxide Dismutase: Improved Assays and an Assay Applicable to Acrylamide Gels. Anal. Biochem. 1971, 44, 276–287. [Google Scholar] [CrossRef]
  43. Lin, C.-L.; Chen, H.-J.; Hou, W.-C. Activity staining of glutathione peroxidase after electrophoresis on native and sodium dodecyl sulfate polyacrilamide gels. Electrophoresis 2002, 23, 513–516. [Google Scholar] [CrossRef]
  44. Weydert, C.J.; Cullen, J.J. Measurement of superoxide dismutase, catalase, and glutathione peroxidase in cultured cells and tissue. Nat. Protoc. 2010, 5, 51–66. [Google Scholar] [CrossRef] [PubMed] [Green Version]
  45. Livingstone, D.R.; Lips, F.; Martinez, P.G.; Pipe, R.K. Antioxidant enzymes in the digestive gland of the common mussel Mytilus edulis. Mar. Biol. 1992, 112, 265–276. [Google Scholar] [CrossRef]
  46. Davis, B.J. Disc electrophoresis. II. Method and application to human serum proteins. Ann. N. Y. Acad. Sci. 1964, 121, 404–427. [Google Scholar] [CrossRef] [PubMed]
  47. Ornstein, L. Disc Electrophoresis. I. Background and Theory. Ann. N. Y. Acad. Sci. 1964, 121, 321–349. [Google Scholar] [CrossRef]
  48. Luoma, S.N. Silver Nanotechnologies and the Environment: Old Problems or New Challenges? Project on Emerging Nanotechnologies; Woodrow Wilson International Center for Scholars: Washington, DC, USA, 2008; pp. 1–72. [Google Scholar]
  49. Benn, T.M.; Westerhoff, P. Nanoparticle silver released into water from commercially available sock fabrics. Environ. Sci. Technol. 2008, 42, 4133–4139. [Google Scholar] [CrossRef] [PubMed]
  50. Toncelli, C.; Mylona, K.; Kalantzi, I.; Tsiola, A.; Pitta, P.; Tsapakis, M.; Pergantis, S.A. Silver nanoparticles in seawater: A dynamic mass balance at part per trillion silver concentrations. Sci. Total Environ. 2017, 601–602, 15–21. [Google Scholar] [CrossRef]
  51. Gondikas, A.; Gallego-Urrea, J.; Halbach, M.; Derrien, N.; Hassellöv, M. Nanomaterial fate in seawater: A rapid sink or intermittent stabilization? Front. Environ. Sci. 2020, 8, 151. [Google Scholar] [CrossRef]
  52. Luoma, S.N.; Ho, Y.B.; Bryan, G. Fate, bioavailability and toxicity of silver in estuarine environment. Mar. Pollut. Bull. 1995, 31, 44–54. [Google Scholar] [CrossRef]
  53. Boukadida, K.; Cachot, J.; Clérandeaux, C.; Gourves, P.Y. Early and efficient induction of antioxidant defense system in Mytilus galloprovincialis embryos exposed to metal and heat stress. Ecotoxicol. Environ. Saf. 2017, 138, 105–112. [Google Scholar] [CrossRef]
  54. Buffet, P.E.; Pan, J.F.; Poirier, L.; Amiard-Triquet, C.; Amiard, J.C.; Gaudin, P.; Risso-de Faverney, C.; Guibbolini, M.; Gilliland, D.; Valsami-Jones, E.; et al. Biochemical and behavioural responses of the endobenthic bivalve Scrobicularia plana to silver nanoparticles in seawater and microalgal food. Ecotoxicol. Environ. Saf. 2013, 89, 117–124. [Google Scholar] [CrossRef]
  55. Hofmann, G.; Somero, G. Evidence for protein damage at environmental temperatures: Seasonal changes in levels of ubiquitin conjugates and hsp70 in the intertidal mussel Mytilus trossulus. J. Exp. Biol. 1995, 198, 1509–1518. [Google Scholar] [CrossRef] [PubMed]
  56. Grösvik, B.E.; Goksöyr, A. Biomarker protein expression in primary cultures of salmon (Salmo salar L.) hepatocytes exposed to environmental pollutants. Biomarkers 1996, 1, 45–53. [Google Scholar] [CrossRef] [PubMed]
  57. Minier, C.; Borghi, V.; Moore, M.N.; Porte, C. Seasonal variation of MXR and stress proteins in the common mussel, Mytilus galloprovincialis. Aquat. Toxicol. 2000, 50, 167–176. [Google Scholar] [CrossRef]
Figure 1. In-gel anti-oxidant assay in Mytilus tissue protein extracts. (A,B) Representative native PAGE gels stained for the in-gel activity of CAT in the 20,000 g supernatant (A) and pellet (B), obtained from digestive gland. Mussel CAT is visible much above the bovine liver commercial standard. (C) Representative in-gel assay for SOD. Two bands are always visible. (D) Representative in-gel assay for GPX. Mussel GPX is visible just above the bovine erythrocyte GPX commercial standard. Legend: M, commercial marker; B, blank; S, mussel protein extract (digestive gland) showing some interindividual variability.
Applsci 12 02760 g001
Figure 2. In-gel CAT assay. (A) Representative picture of a 7.5% native polyacrylamide gel revealing CAT achromatic bands due to competition for hydrogen peroxide between the enzyme and Prussian blue. Samples in lanes 1–4 represent 0.75, 1.75, 3.5, 7 standard catalase units (U). (B) Dynamic detection range (linear regression). Shown are the integrated density values (arbitrary unit) vs. standard bovine CAT activity obtained from three independent experiments.
Applsci 12 02760 g002
Figure 3. Optimization of in-gel GPX assay. (A) GPX reaction mixture with 0.008% cumene hydroperoxide and without GSH showing no achromatic bands. (B) As in A, in the presence of 10 mM sodium azide. (C) GPX reaction with 1 mM GSH, 0.01% hydrogen peroxide, showing high activity in all samples except lane 1, bovine GPX standard. (D) same as (C) in the presence of sodium azide, confirming that the activity in C is almost entirely due to catalase. (E) GPX reaction with CHP showing intrinsic GPX activity also for the standard bovine catalase. (F) Same as E with sodium azide showing residual activity in all samples. The dark bands represent artifacts of the staining procedure that do not interfere in the analyses. Legend: Lane 1, commercial bovine liver GPX standard (150 mU); 2, gill SN20 (100 µg); 3, 4 digestive gland SN20 (100 µg); 5, commercial bovine liver catalase standard (10 U).
Applsci 12 02760 g003
Figure 4. In-gel GPX assay linearity (standard curve). (A) Representative picture of a 12% native polyacrylamide gel revealing GPX achromatic bands due to competition for cumene hydroperoxide between the enzyme and Prussian blue. Lane 1–6 represent, respectively, 7.05, 14.1, 23.82, 56.4, 112.5, and 225 milliunits (mU) of standard bovine erythrocyte GPX. (B) Dynamic detection range (second-grade polynomial regression). Values of integrated density (arbitrary units) vs. GPX mU obtained from three independent experiments. The polynomial regression allowed a larger dynamic range of quantification.
Applsci 12 02760 g004
Figure 5. Effects of silver on CAT activity. Semiquantitative analysis of enzyme activity as evaluated by densitometric analysis of achromatic bands in the gel assay (boxplot). Data (arbitrary units) are only comparable within each individual panel. Values between the inner and outer fences are plotted with asterisks. Values beyond the outer fences, called far outside values, are plotted with empty circles. (A) Digestive gland, silver nitrate exposure; (B) digestive gland, silver nanoparticle exposure; (C) gills, silver nitrate exposure; (D) gills, silver nanoparticle exposure. ° statistically different from control reference (0), p < 0.05; two-sample Kruskal–Wallis, n = 40. Data for 0.2 μg L−1 silver nanoparticles were not available.
Applsci 12 02760 g005
Figure 6. Effects of silver on SOD activity. Semiquantitative analysis of enzyme activity as evaluated by densitometric analysis of achromatic bands in the gel assay (boxplot). Data (arbitrary units) are only comparable within each individual panel. Values between the inner and outer fences are plotted with asterisks. Values beyond the outer fences, called far outside values, are plotted with empty circles. (A) Digestive gland, silver nitrate exposure; (B) digestive gland, silver nanoparticle exposure; (C) gills, silver nitrate exposure; (D) gills, silver nanoparticle exposure. §§§ statistically different from control reference (0), p < 0.001; §§, p < 0.01; § p < 0.05; two-sample Kruskal–Wallis, n = 40. Data for 0.2 μg L−1 silver nanoparticles were not available.
Applsci 12 02760 g006
Figure 7. Effect of silver nitrate on total GPX activity in gills. (A) Representative native PAGE stained for the in-gel activity of GPX. Arrows show position of the GPX achromatic bands. (B) Semiquantitative evaluation of total GPX activity in gill extracts obtained from mussels treated with 20 µg L−1 AgNO3 (black box) vs. control reference (open box). In this analysis, the integrated intensity (INTD) of all visible achromatic bands was considered. * statistically different from control, p < 0.05, two-sample Kruskal–Wallis, n = 12.
Applsci 12 02760 g007
Figure 8. Effect of silver nitrate on HSP70 expression in gills. (A) Representative HSP70 Western blot analysis of gill SN20 extracts (30 µg) from silver nitrate exposure (2 µg L−1). (B) Same as for A but 20 µg L−1 exposure level. Legend: (-) control reference; (+) silver nitrate exposed. (C) Densitometric analysis of HSP70 bands, average fold change +- SEM with respect to reference not exposed control specimens. * Mann–Whitney U-test, p < 0.01, n = 18.
Applsci 12 02760 g008
Publisher’s Note: MDPI stays neutral with regard to jurisdictional claims in published maps and institutional affiliations.

