1. Introduction
For daily exercises, many people tend to focus dominantly or solely on cardiovascular exercises to burn calories. Lower-body strength, however, is also important not only for achieving perfect physical condition but also for maintaining total body health. Moreover, by strengthening the lower-body, one can improve one’s agility and balance, helping to avoid falls and injuries during both daily activities and workouts. In addition, many studies [
1,
2] have found that lower-body strength and power are correlated and required for performing high-intensity, short-duration activities, such as jumping, sprinting, or carrying a load. Nevertheless, proper exercises should be performed to minimize the risk of injury from strengthening the lower-body. To prevent falls and injuries from these activities, the ability to detect the lower-body is crucial for monitoring the postures of participants during workouts.
With advances in computer technology, human body detection has become crucial in diverse applications such as surveillance systems, vehicle navigation, and posture recognition. Human body detection can also be applied to study human behavior and activities of daily living (ADLs) [
3]. Thus, this human body detection can observe unusual signs in an activity sequence [
4]. Moreover, it is a valuable indicator and threshold for monitoring systems in a workplace to identify inappropriate tasks and enhance injury prevention [
5]. It is even used to automatically control home devices such as light sources and air conditioning to maintain suitable living conditions [
6]. However, variations in human pose, clothing, and uncontrollable environmental characteristics can decrease the accuracy of human body detection [
7].
There are two main types of methods for human body detection, namely, methods using wearable or non-wearable sensors. Methods of the first type rely on one or multiple sensors attached to the human body. These sensors can directly detect changes in a person’s orientation. The main benefits of wearable sensors are their speed and high accuracy. They do not require specific environmental conditions, but they might need a long time to set up and cause inconvenience to people wearing them. Furthermore, sensor placement and dislocation can be problematic [
8]. Another problem is associated to an absence of interoperability among a variety of sensor deployments [
9]. Methods of the second type rely on non-wearable sensors consisting of one or multiple cameras to detect the human body. These methods need only low-cost equipment that is easy to set up to monitor the human body. However, without control over specific conditions such as illumination and shadows, their detection accuracy may be reduced [
10,
11,
12,
13]. If the distance between the camera and an individual is inappropriate, the image information might be distorted owing to motion blur [
14].
Based on non-wearable sensors, there are two main popular classes of methods in computer vision for detecting people in an image [
10,
11,
12,
13,
14,
15]. The methods in the first class are referred to as traditional methods. A feature vector is extracted from the input image using techniques such as object-based approaches. Then, this feature vector is used to train a classification model. The second class of methods is based on deep learning [
16]. In the last few years, deep learning has become a very popular machine learning approach for detecting objects and monitoring human poses and activities [
17]. Deep learning has the ability to learn local and global features from an image by means of convolutional neural networks for human detection [
16]. These features are also customized by using mapping, fusion, and selection techniques to significant success in human posture recognition [
18].
In the case of occlusion [
19], it might be either intra-class occlusion or inter-class occlusion. The intra-class occlusion happens when the interesting object is hidden by the same category of object such as crowded people. The inter-class occlusion refers to the object which is occluded by an object of another category such as the vehicle in pedestrian detection. Consequently, computer vision techniques might be troublesome for detection because the object to be detected may not appear similar to the objects in the training data set. To deal with the occlusion [
20], it can be the generated de-occluded image using the generative adversarial network (GAN) to reconstruct the occluded object in the image. However, this method requires of a large various of object categories and labeling a dataset with feasible occlusions of every category. In term of occluded human image, if the computer vision techniques [
10,
11,
12] can detect some parts of the body of human such as hand or face, these body parts may be possible to determine the position of the lower-body from the locations of the detected body parts by referencing anthropometric data [
21].
Anthropometrics is the study of measurements of the human body taken from diverse populations such as age, gender or nationality. Applications of using the anthropometric consist of a suitable design of clothing [
22] and workstation [
23] from this human body reference. Anthropometric data involves human body measurements such as weight, height, and length. For human body detection, measurements of physical limb and body proportions can be used to investigate various associations with the height and width of the lower-body in an image [
24,
25]. Anthropometric data include age, gender, nationality and human body measurements such as weight, height, and girth. These data are useful for applications such as the suitable design of clothing, machines, and workspaces based on human body references. Moreover, These data can be beneficial to examine differences in the anthropometric characteristics and physical capacity in padel players concerning their competing level [
26].
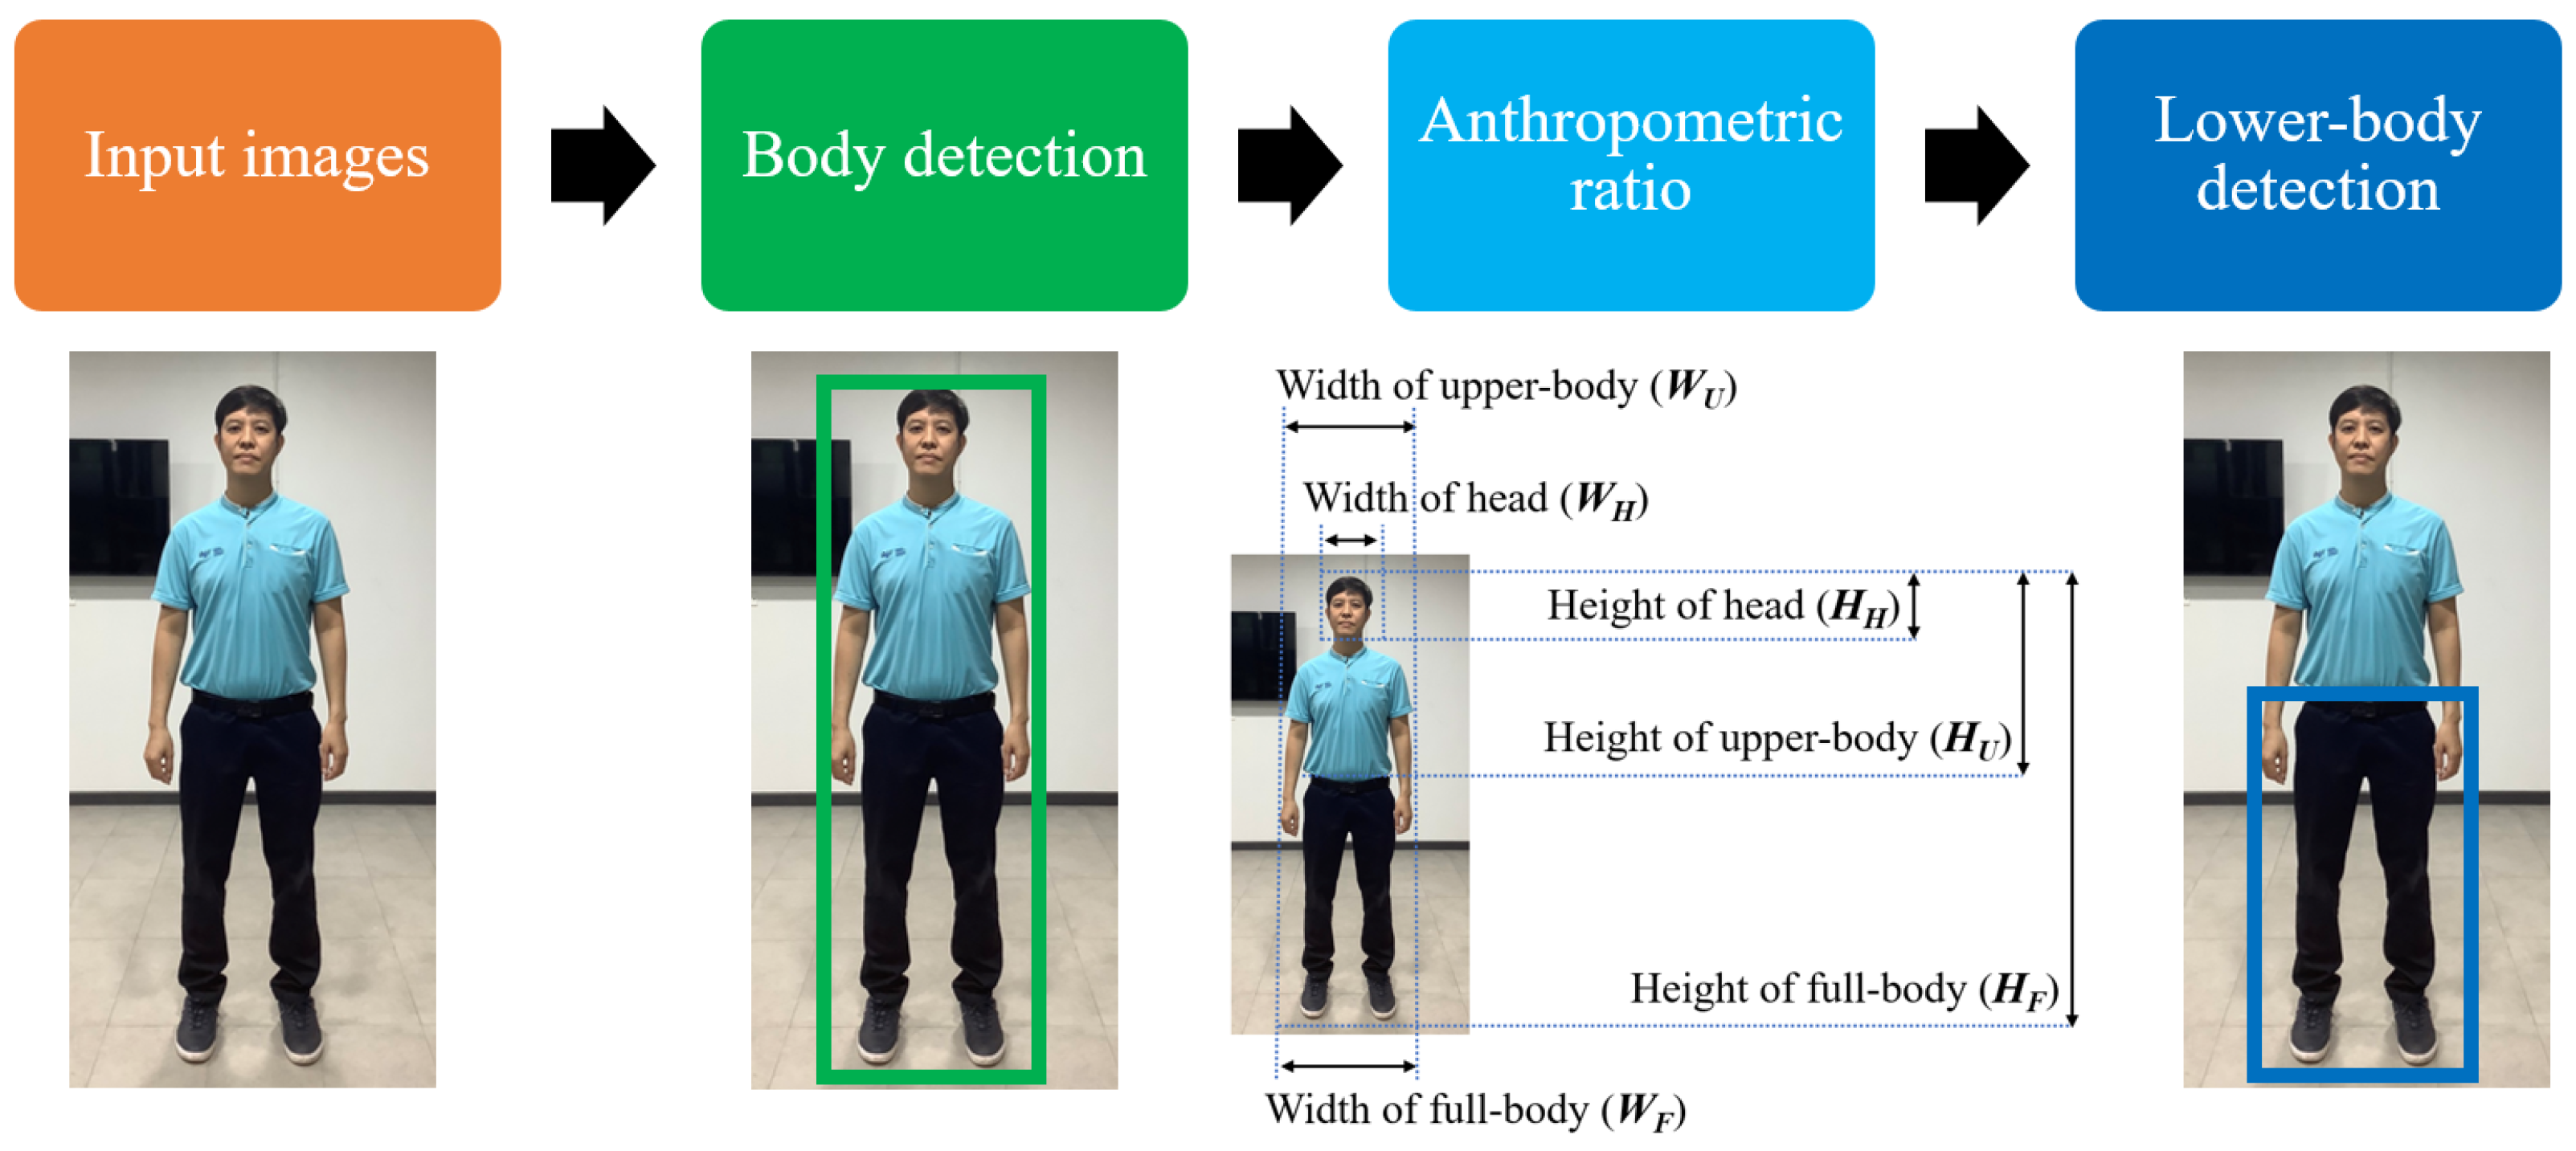
This paper presents novel anthropometric ratios that can be used in combination with both deep learning and traditional methods for lower-body detection. The proposed ratios can be applied to human images to detect either certain parts of the body or the full human body. The detected lower-body will then be indicated on the output image, as shown in
Figure 1.
The rest of this paper is organized as follows:
Section 2 briefly describes the related work in the literature. The proposed method is introduced in
Section 3. Experimental results are reported in
Section 4 and discussed in
Section 5. Finally, the conclusion is presented in
Section 6.
3. Materials and Methods
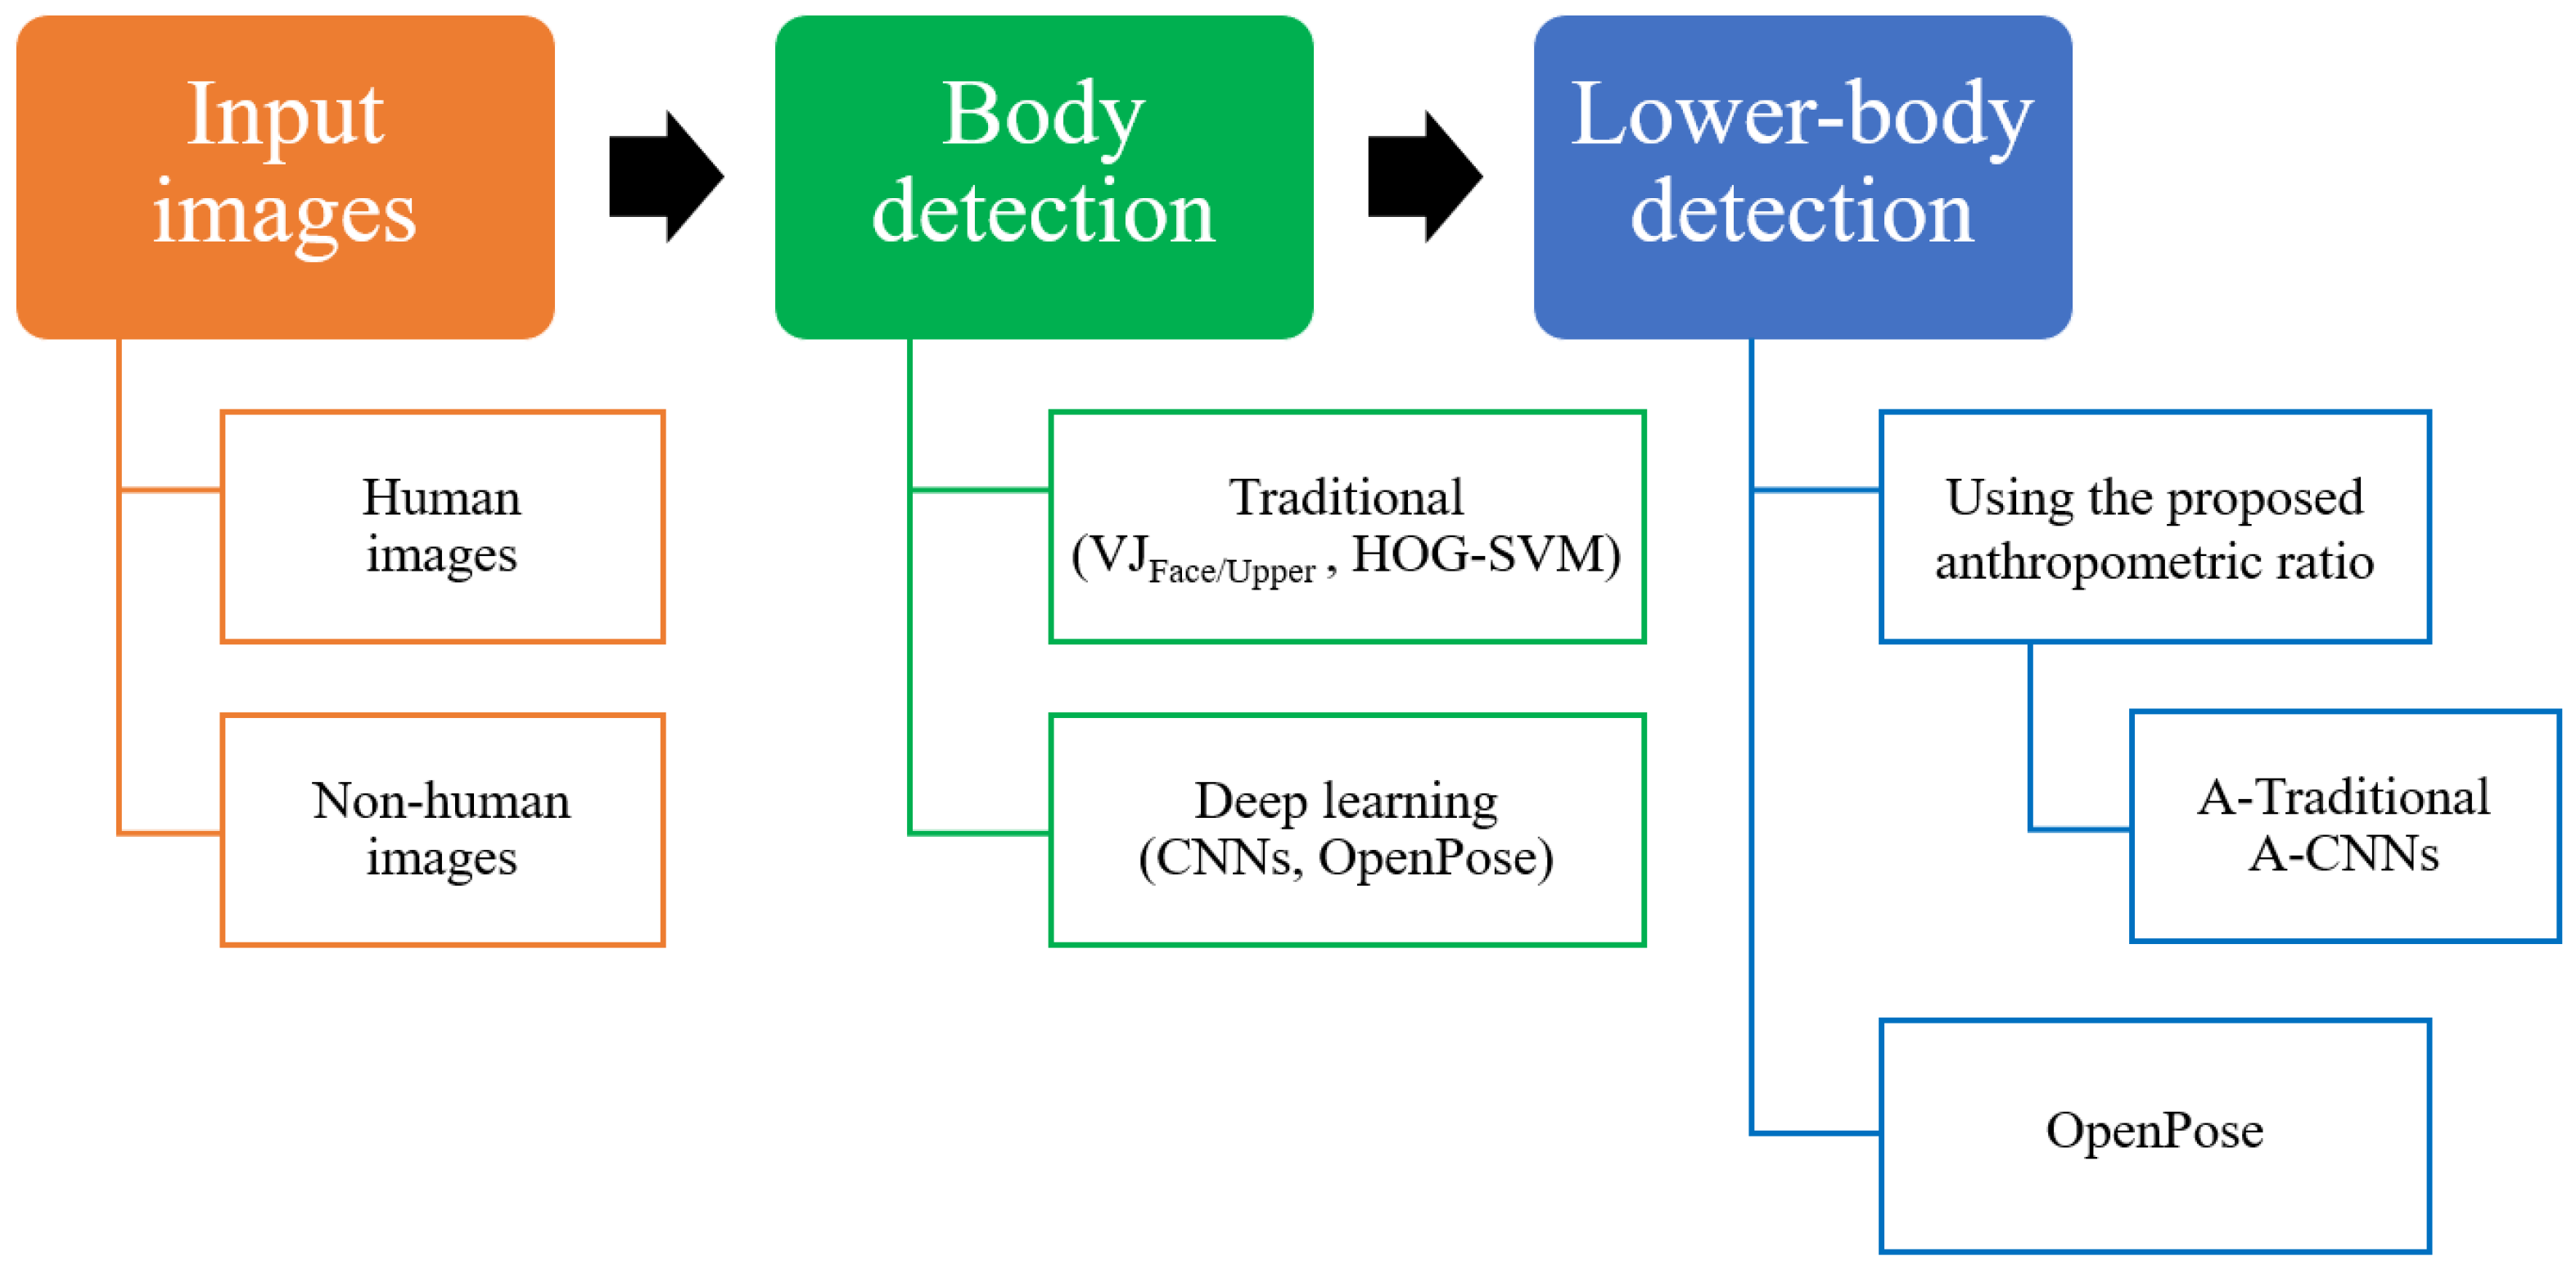
This section describes the data set used in this study, the feature extraction processes with conventional and deep learning methods, the classifiers used, and our experimental evaluations. The experimental framework is illustrated in
Figure 2. There are three main phases: image input, feature extraction, and classification.
This paper presents a framework for lower-body detection using proposed anthropometric ratios, as illustrated in
Figure 2. A person is captured or recorded by a camera, producing the input image. Then, the human body is detected and scaled using the proposed anthropometric ratios in combination with either traditional techniques (A-Traditional), such as the VJ and HOG-SVM algorithms, or the CNNs technique (A-CNNs). Finally, the lower-body area in the image is detected.
For human body detection, there are two popular methods based on sliding windows for overall positioning and scaling in images [
11,
12,
16]: traditional methods and deep learning methods.
3.1. Traditional Methods
As the basis for the application of the proposed anthropometric ratios, two traditional methods are used in this study to detect the human body: the VJ algorithm and the HOG-SVM algorithm. The VJ algorithm is used to perform frontal face or upper-body detection. The HOG algorithm is also used for frontal full-body detection.
3.1.1. Viola-Jones Algorithm (VJ)
The VJ algorithm [
12,
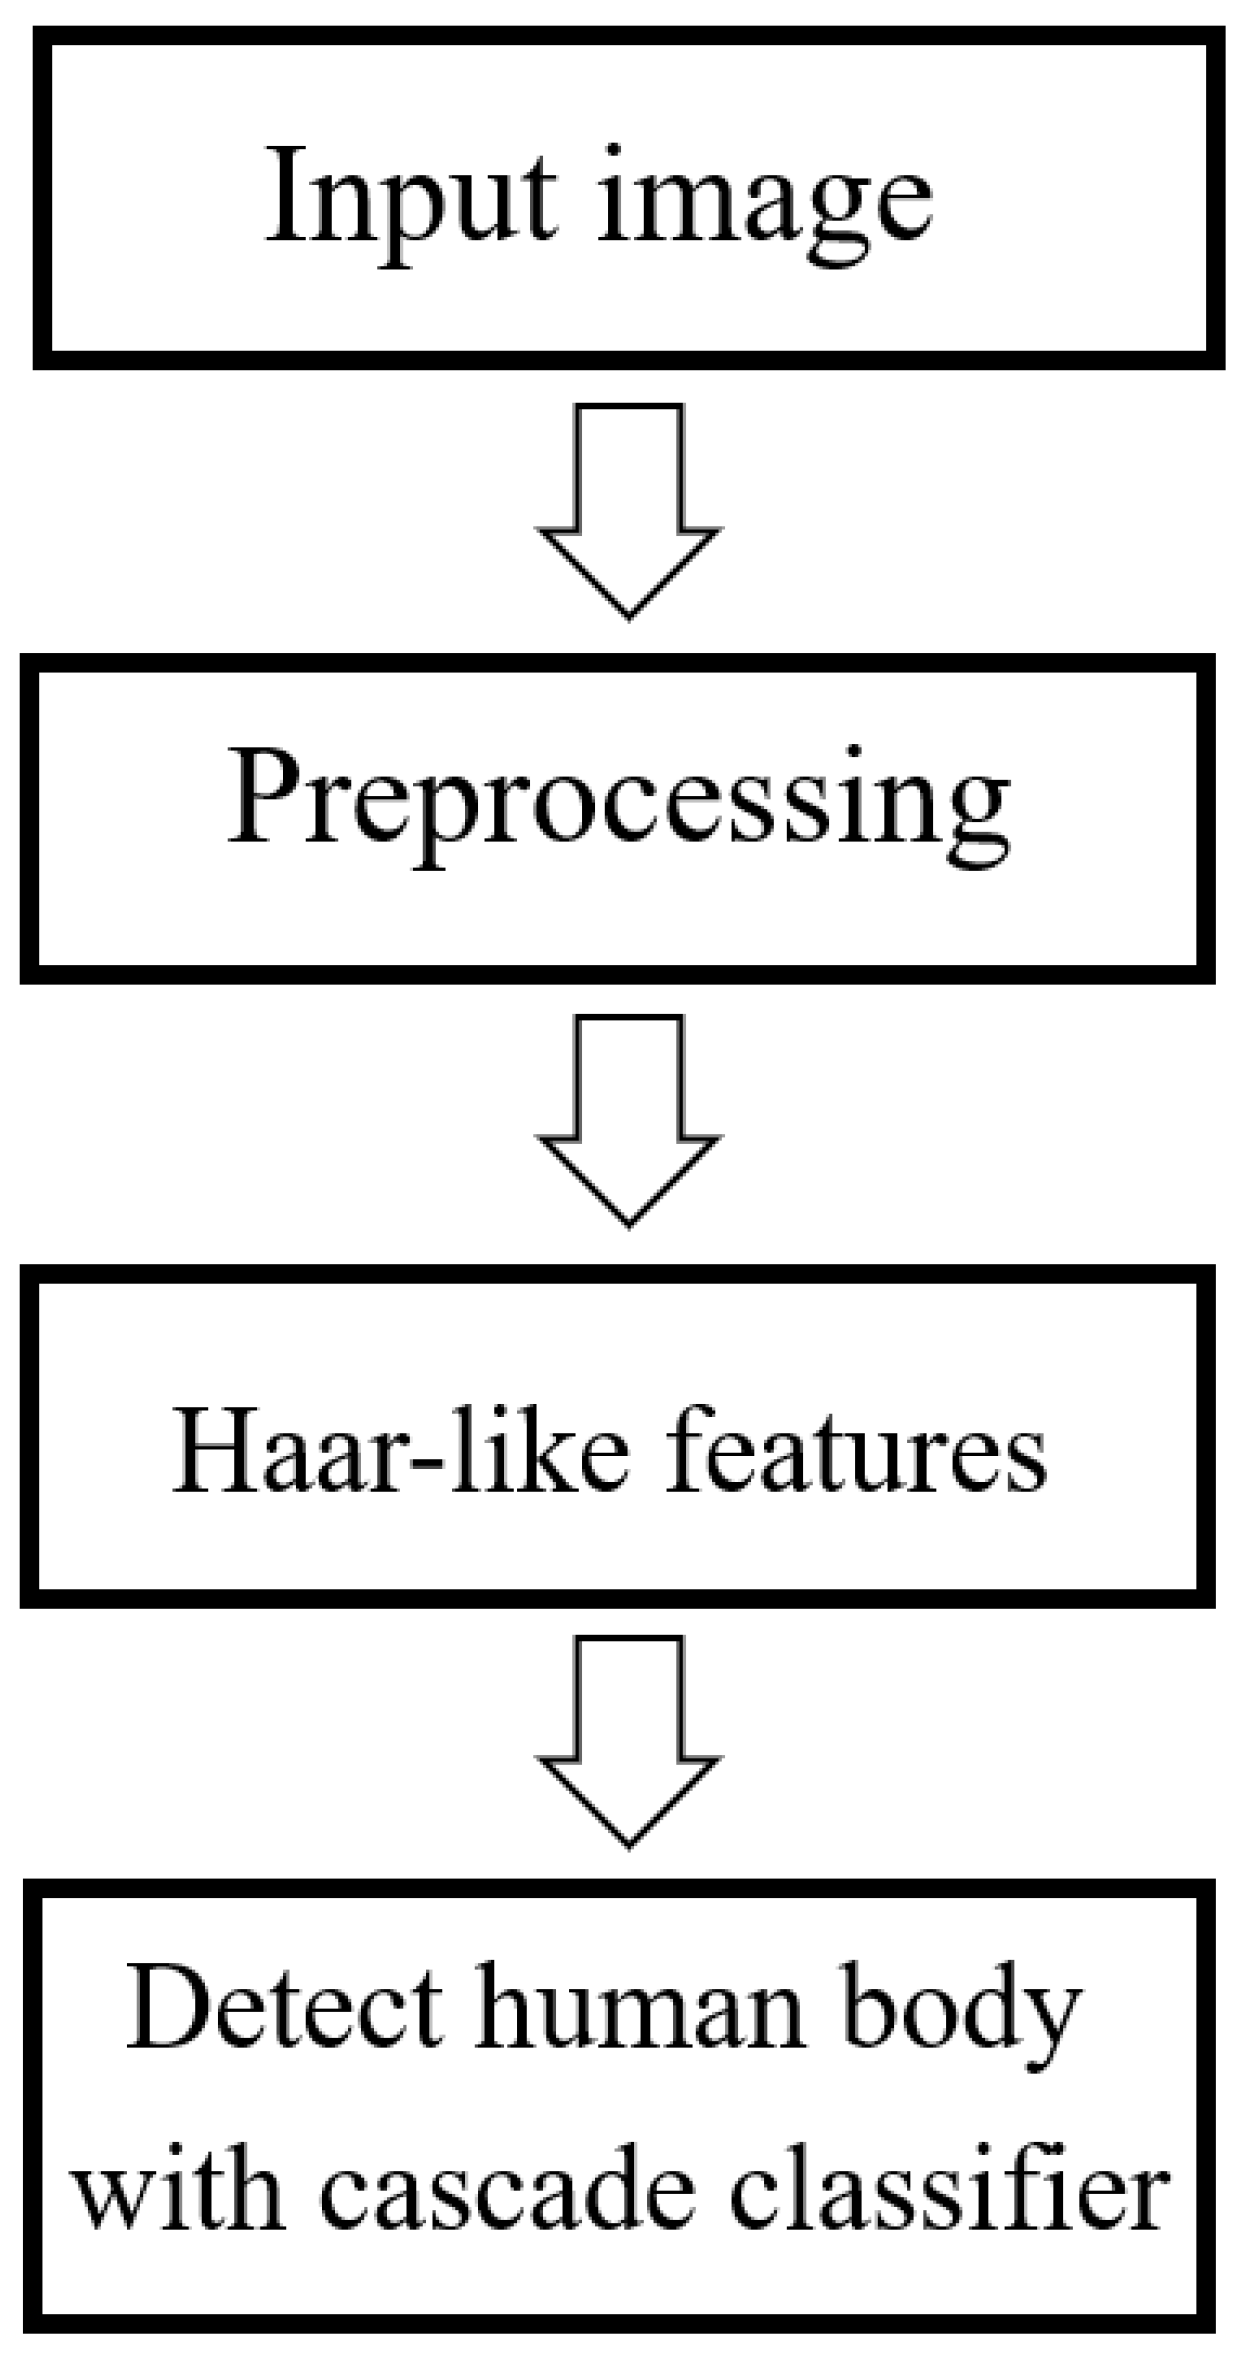
38] extracts simple features based on the notion of cascaded classifiers. Some instances of contrast detection are performed in cells in specific locations in an image, such as the human eye. The VJ algorithm solves the complex learning problem by using an enormous number of positive and negative training images together with a cascade of simple classifiers. The corresponding process is summarized in
Figure 3.
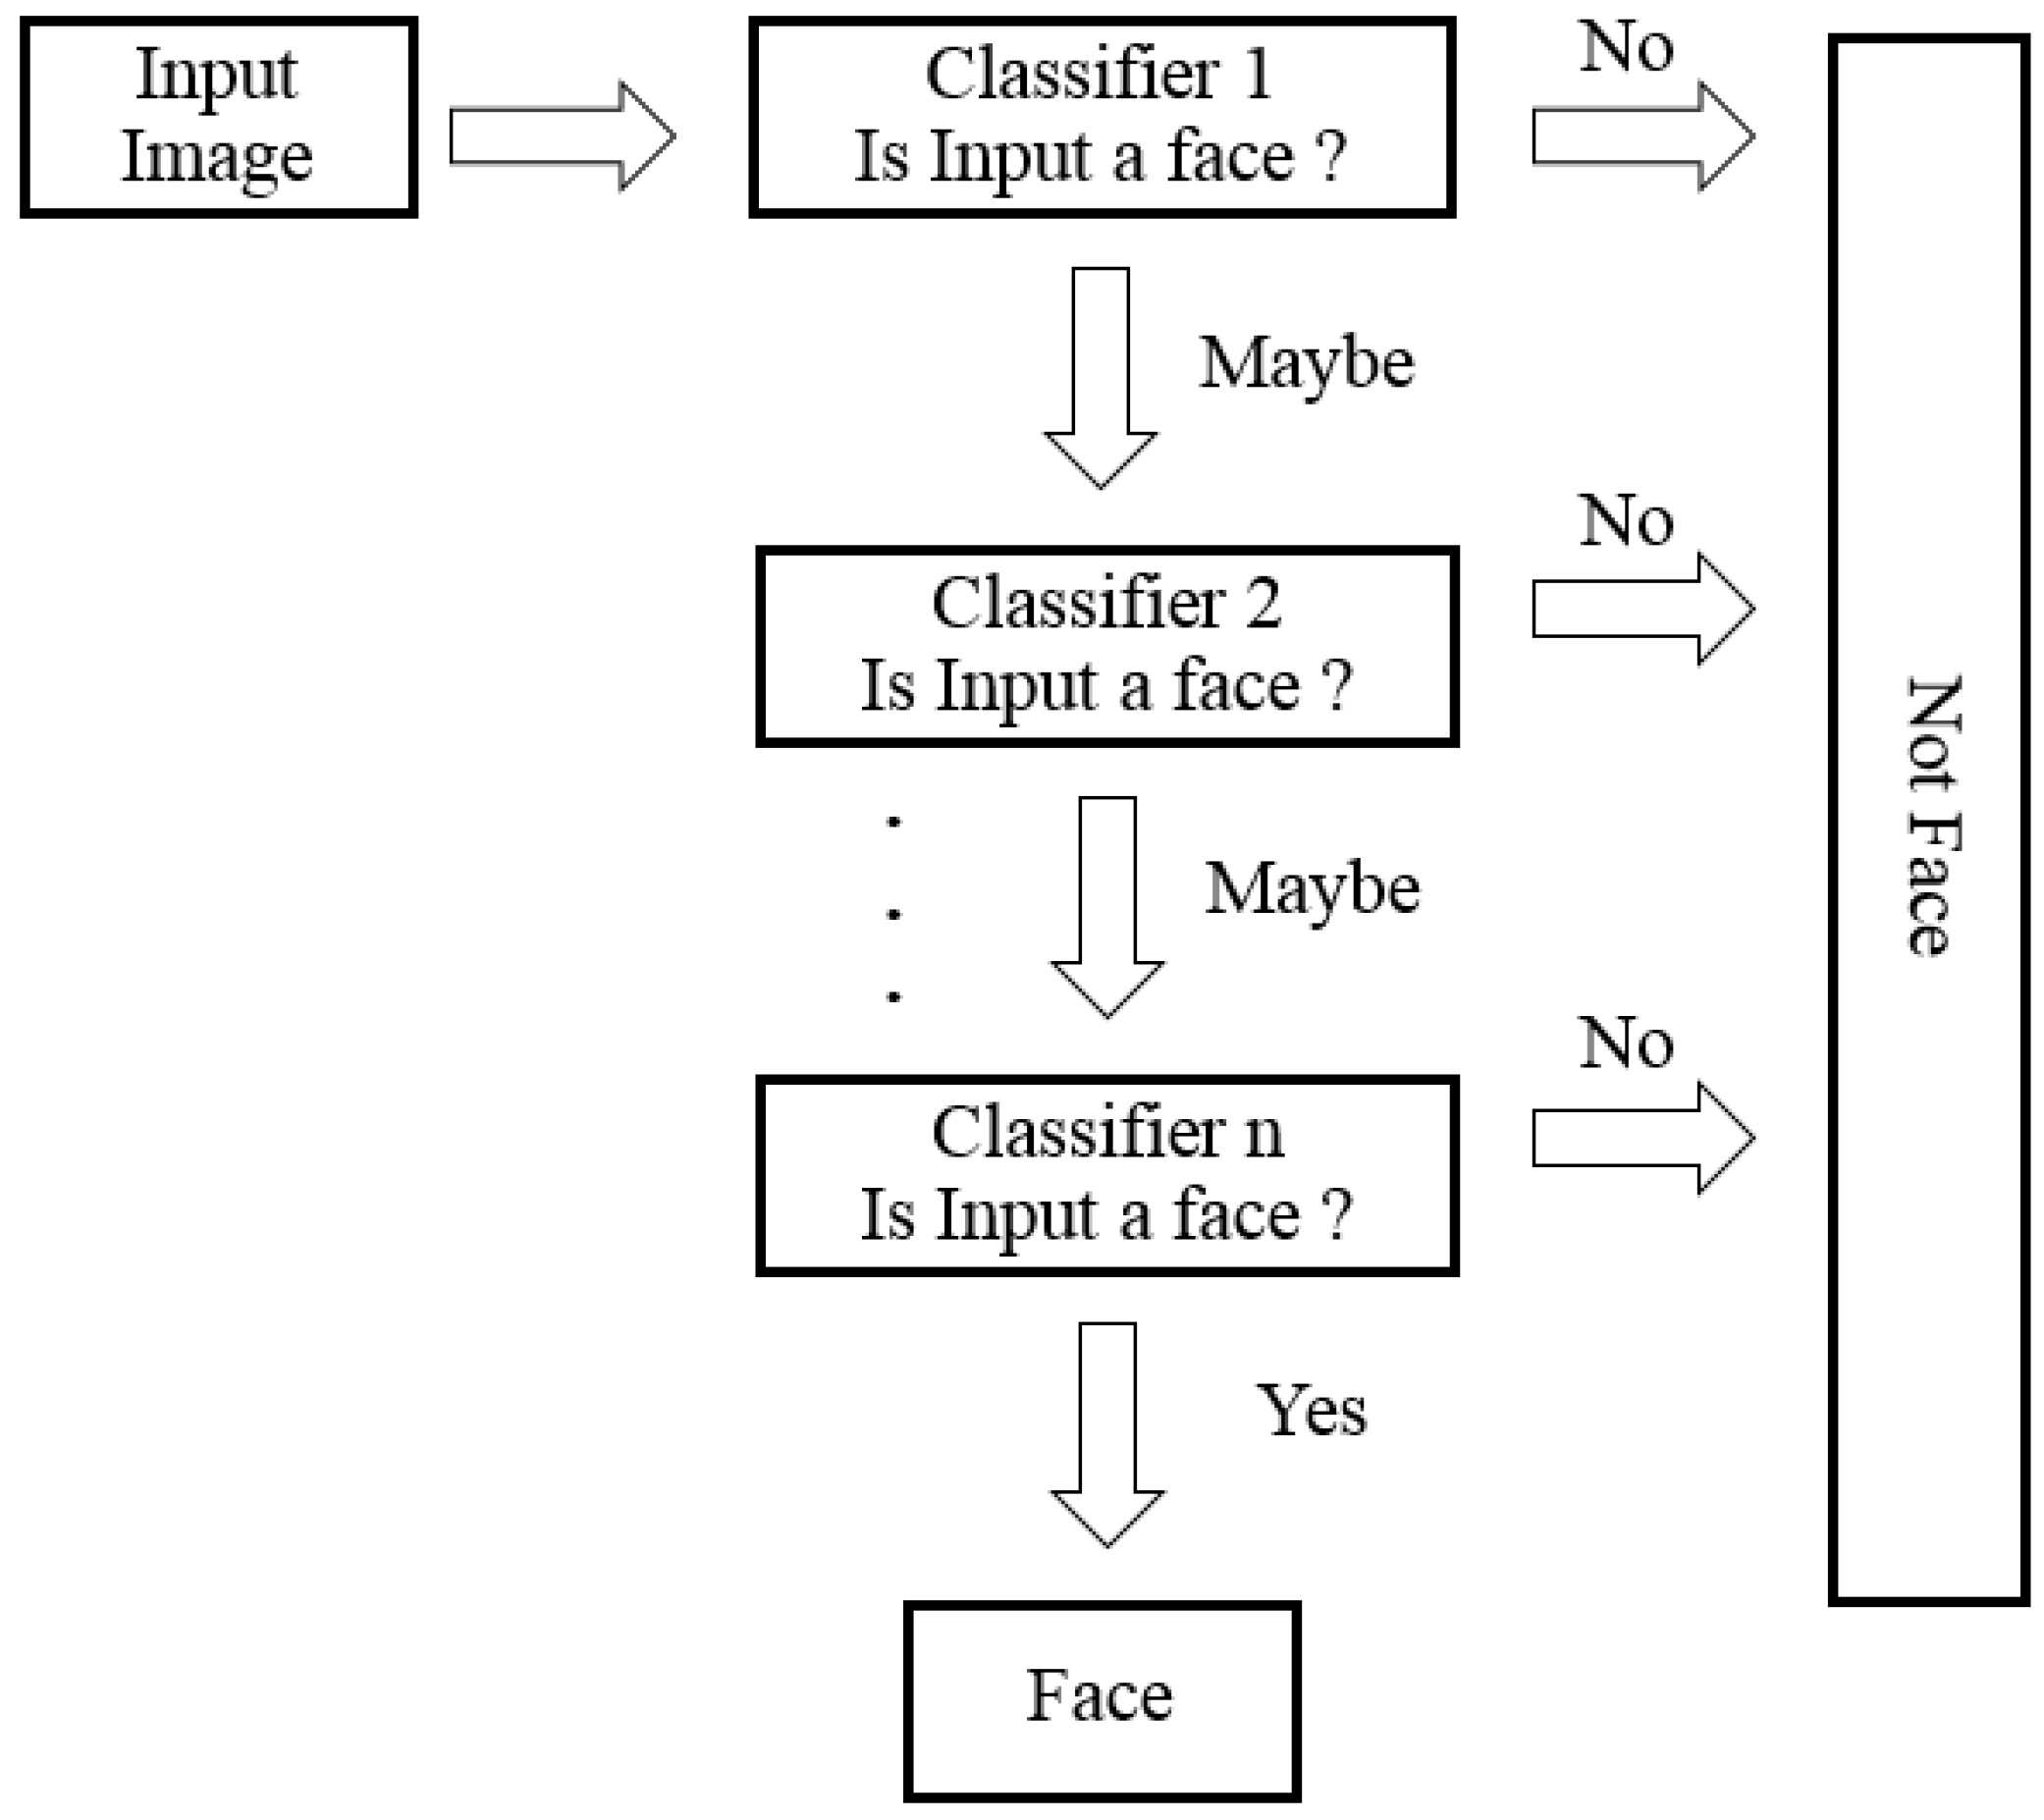
As shown in
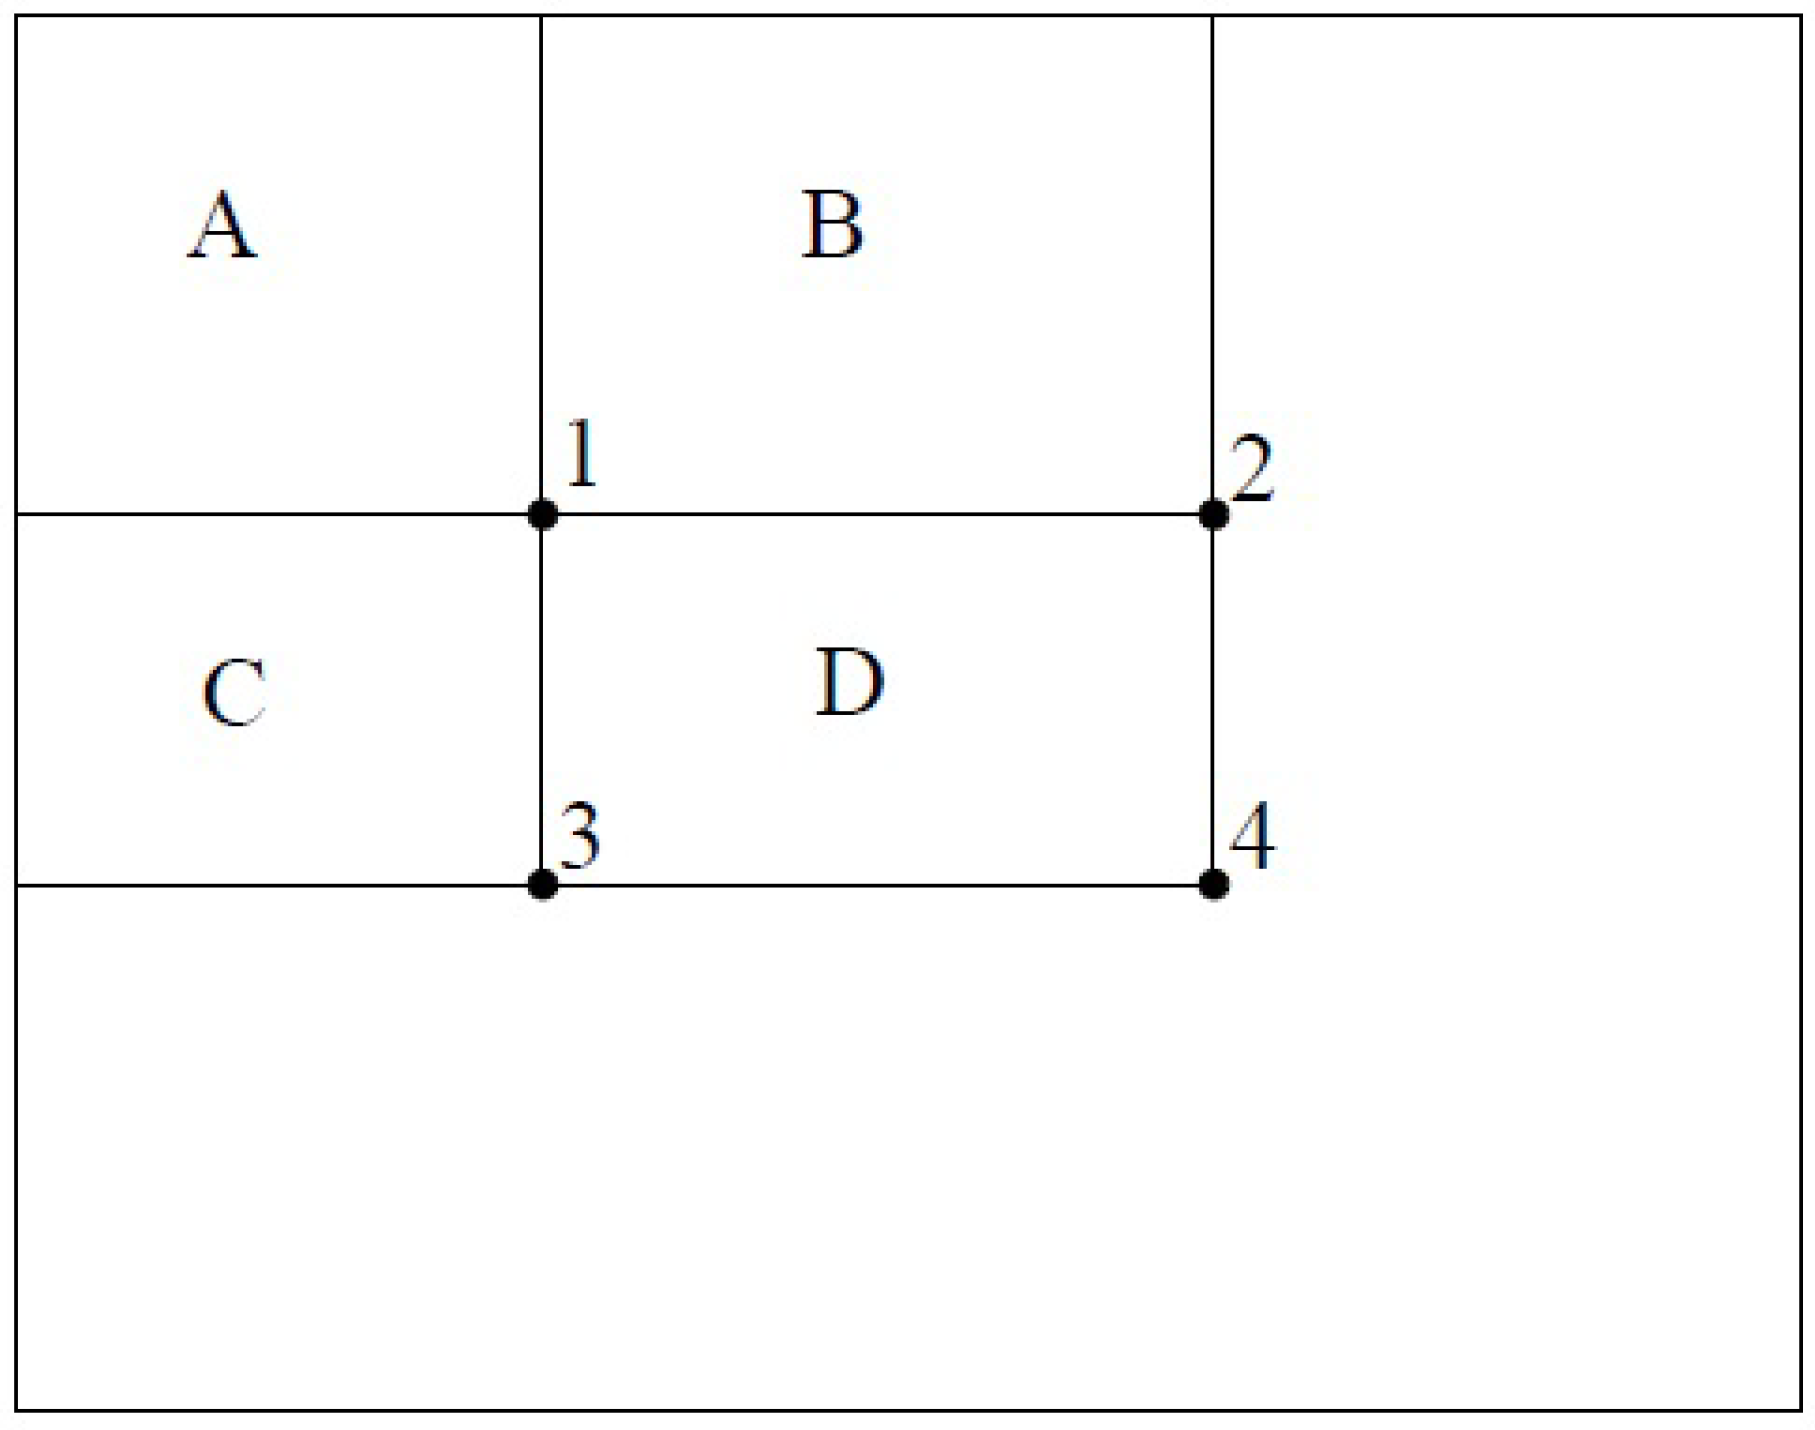
Figure 3, the first step of the VJ Algorithm 1 for face detection is to convert the input image into a greyscale image. Next, the integral image representation is rapidly generated by calculating the value at pixel (
) as the sum of the pixels above and to the left of (
). Then, the sum of the values of all pixels in rectangle D, as shown in
Figure 4, can be computed as
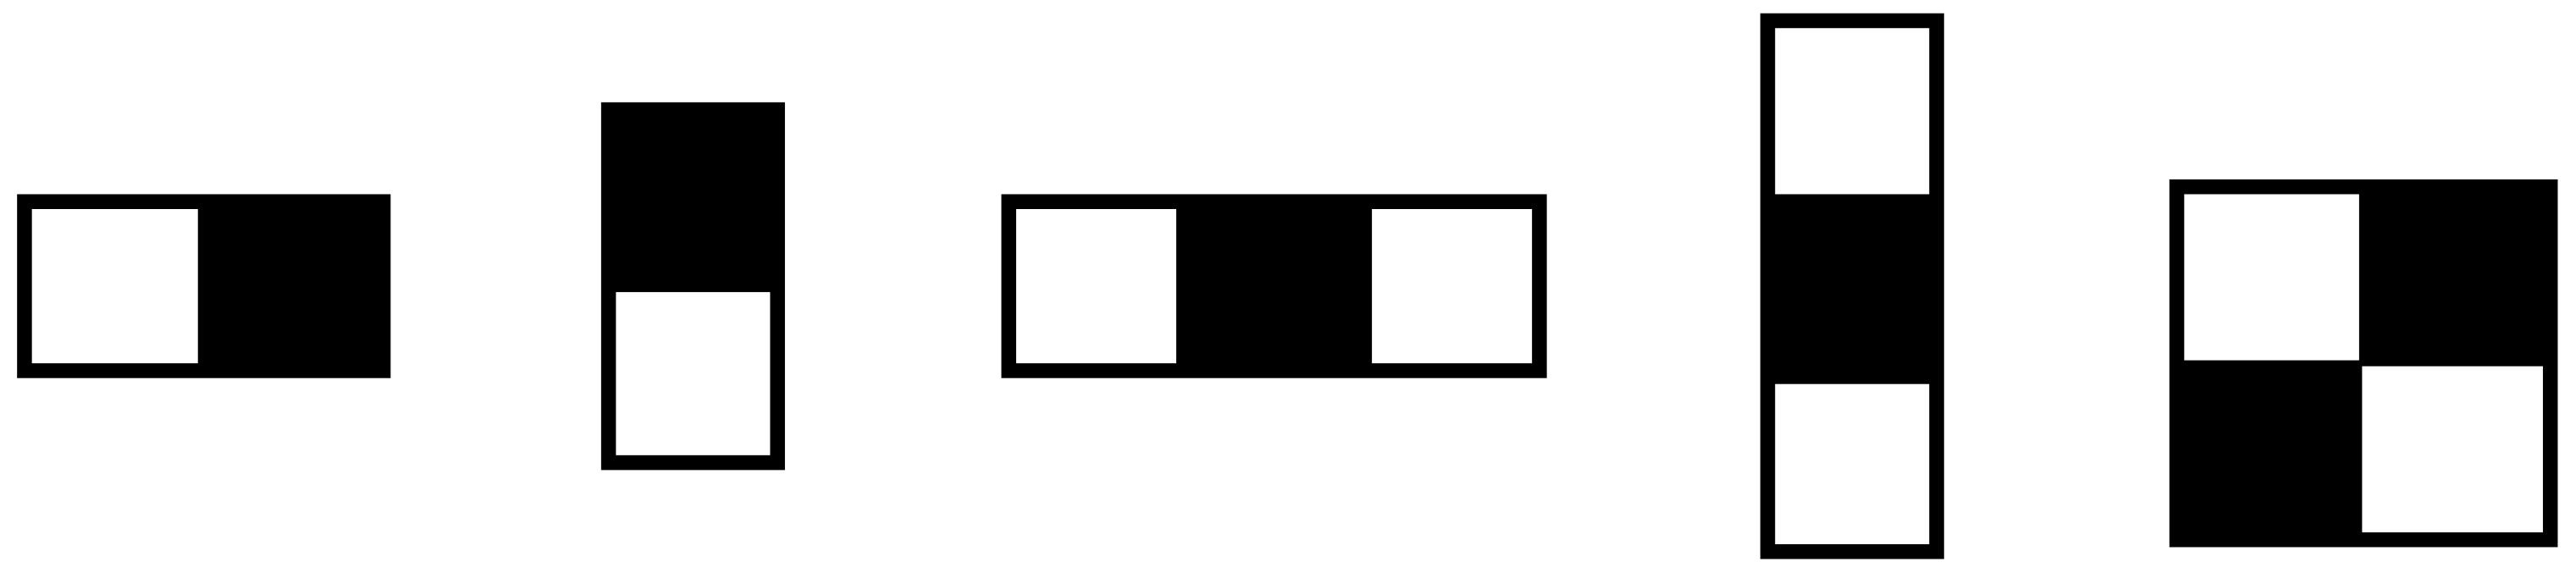
. Subsequently, the entire image is scanned to calculate Haar-like features by subtracting the sum of the pixels under white rectangles from the sum of the pixels under black rectangles in patterns similar to those shown in
Figure 5. Adaptive boosting (AdaBoost) is then used as a machine learning algorithm to find the best such rectangle features among the approximately 160,000 possible features in a window of
pixels in order to construct a linear combination of corresponding classifiers. In the final phase of the VJ algorithm, the input image is fed into these cascaded classifiers; if the input image passes all stages of the classifier cascade, the input image is identified as a human face image, whereas if the image does not pass any stages, it is not a human face image, as shown in
Figure 6.
| Algorithm 1: Viola-Jones for face detection algorithms. |
![Applsci 12 02678 i001]() |
3.1.2. Support Vector Machine Classification Based on Histograms of Oriented Gradients (HOG-SVM)
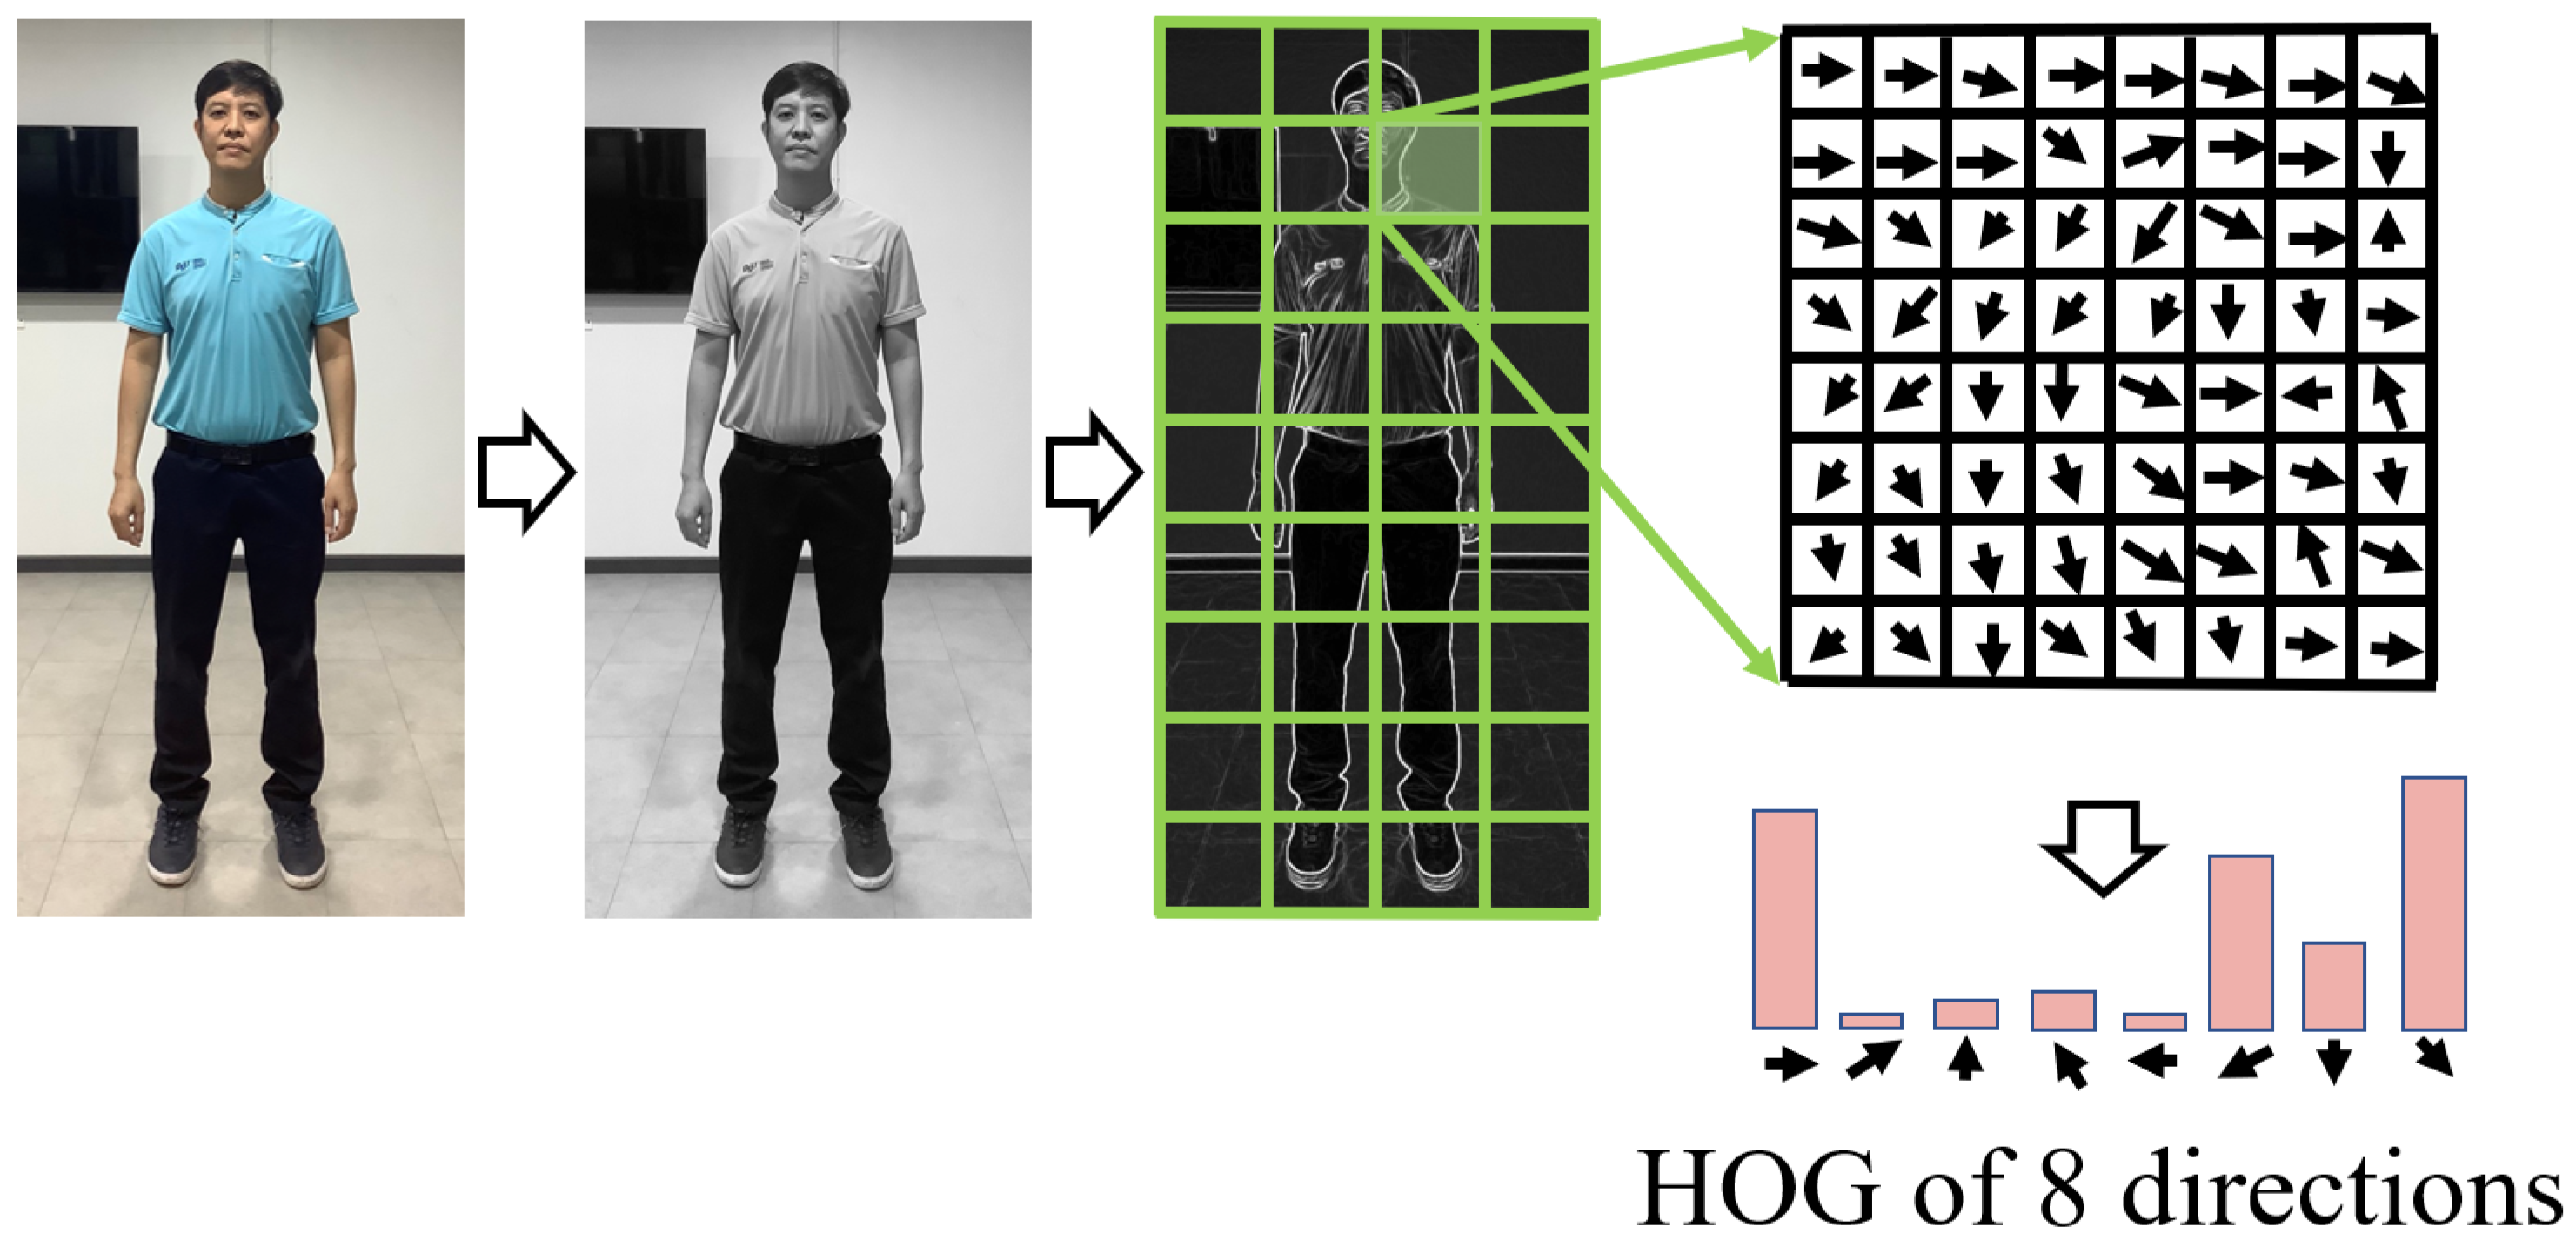
Dalal and Triggs [
11] proposed the HOG method for human detection, as demonstrated in
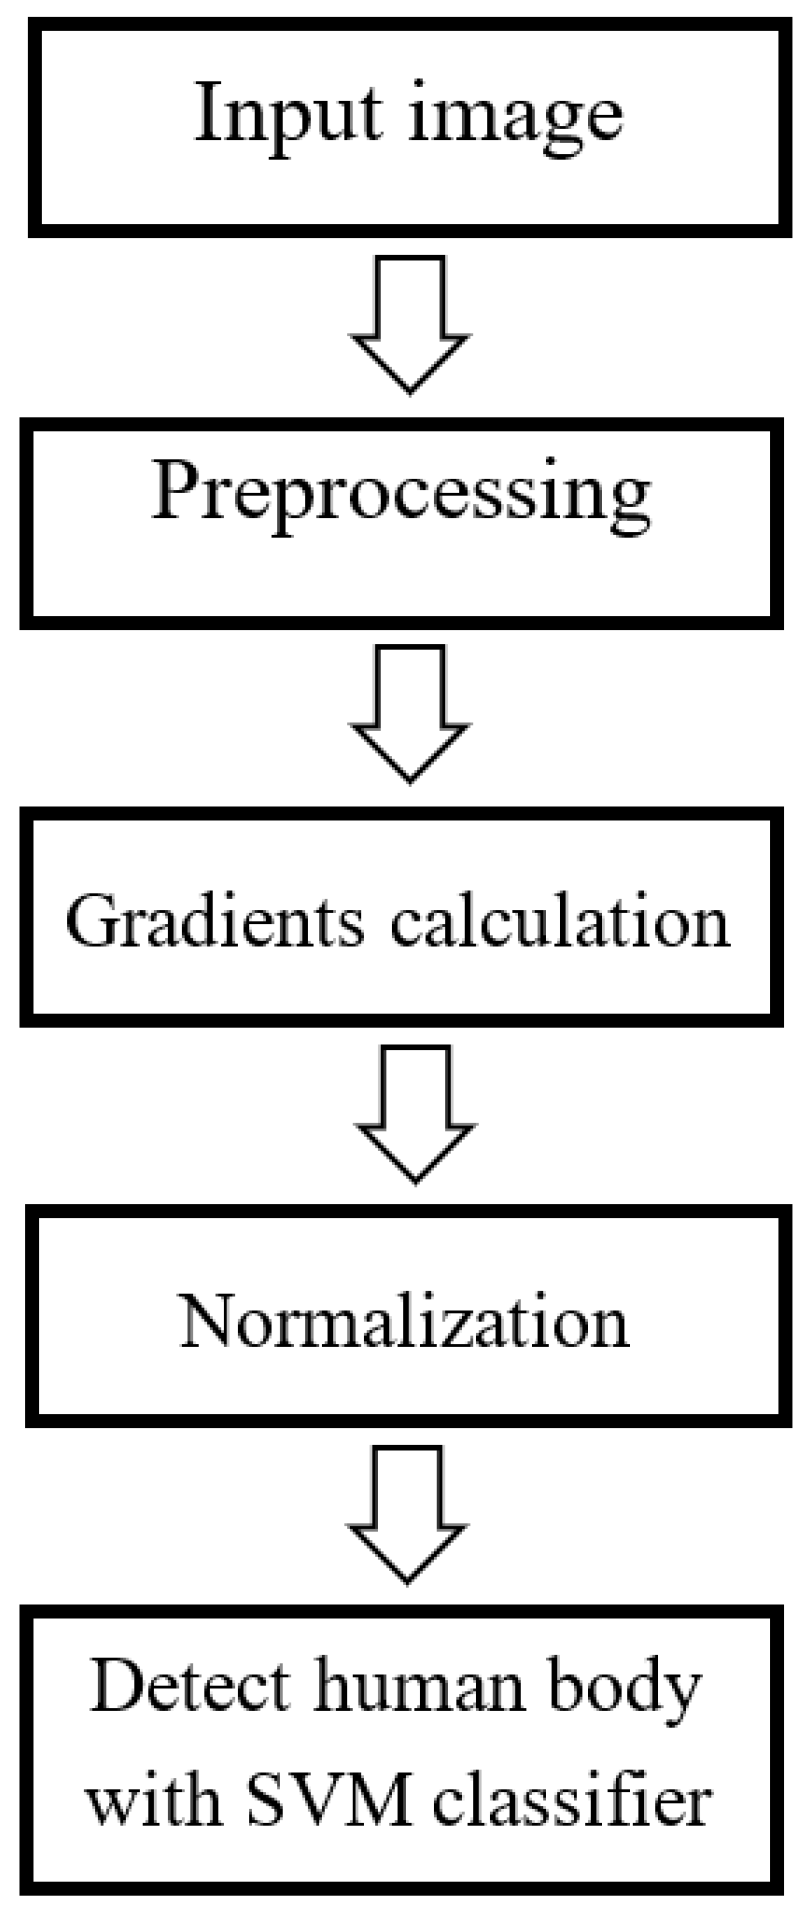
Figure 7. In this method, the HOG features of both positive images (human images) and negative images (non-human images) are extracted and used to fine-tune a pre-trained linear SVM classifier for human detection. The overall process of HOG-SVM detection is summarized in
Figure 8.
The HOG-SVM algorithm for human detection is presented in Algorithm 2. The HOG-SVM process is initialized with configuration parameters such as the sizes of cells, blocks, and bins of a sliding window. The image is then converted to greyscale. The sliding window is calculated as the HOG feature for whole the image.
For the sliding window, the gradients on the
x-axis and
y-axis are calculated using Equations (
1) and (
2), and the edge angles are computed using Equation (
3).
where
is the gradients of
x-axis and
is the pixel value of gray scale image at
coordinates.
where
is the gradients of
y-axis and
is the pixel value of gray scale image at
coordinates.
where
is the angle of gradients at
coordinates. The magnitude of the gradients is presented in Equation (
4).
where
is the magnitude of gradients at
coordinates. The edge histogram is created by gradient voting as shown in Equation (
5)–(
7).
where
is the weight of gradient vote,
is the number of bins, and
is the angle of gradients by Equation (
3).
where
is the magnitude of gradient vote at the
n bin,
is the weight of gradient vote by Equation (
5), and
is the angle of gradients by Equation (
4).
where
is the magnitude of gradient vote which is near the
n bin,
is the weight of gradient vote by Equation (
5), and
is the angle of gradients by Equation (
4).
| Algorithm 2: Support vector machine classification based on histograms of oriented gradients. |
![Applsci 12 02678 i002]() |
Subsequently, the HOG features are normalized as shown in Equation (
8) to be suitable for a variety of lighting conditions [
11].
where
is the normalized magnitude of gradient vote at
i bin when
to
K,
K is the number of cell in one block multiplied by the number of bins (
)and
e is a small constant value.
The 2D features of the sliding window extracted in this way are converted into a single vector of features. Finally, this vector of features is tested in a SVM classifier. If the sliding window passes the threshold, it is detected as a human.
3.2. Deep Learning
Deep learning [
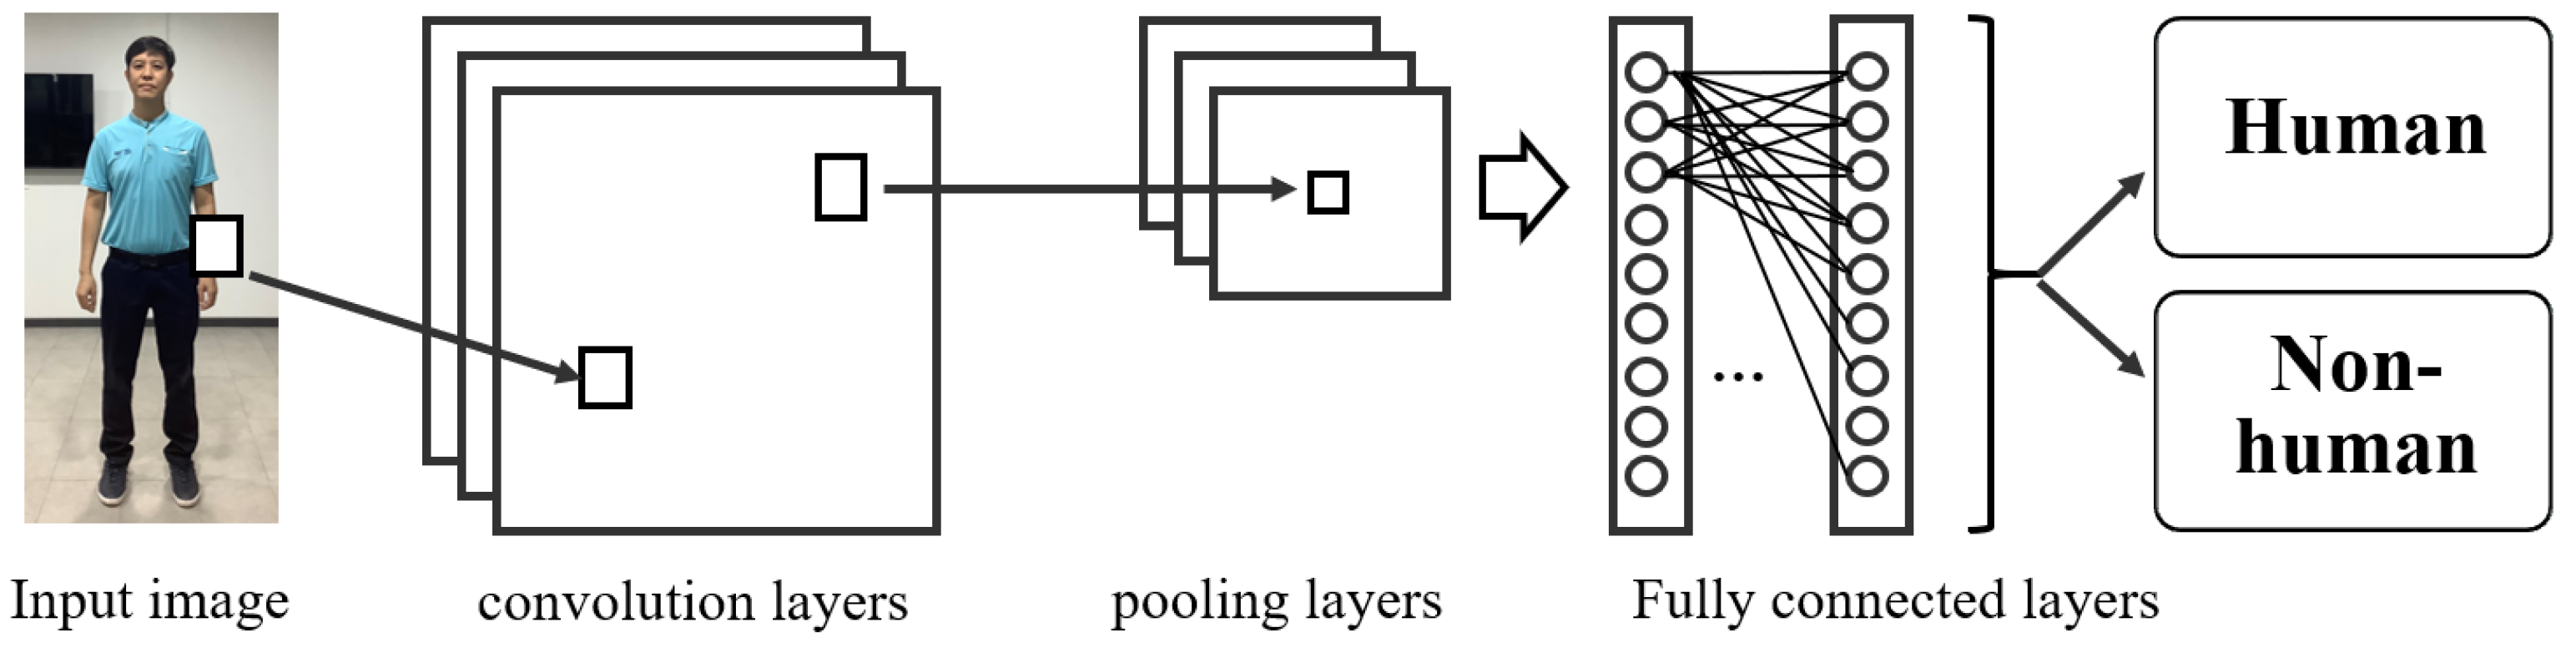
16] is a technique for machine learning that can consider both the low-level and high-level information in a large data set. A deep learning architecture is generally similar to that of an artificial neural network but has greater numbers of hidden layers and nodes. In this study, a CNN is used for frontal full-body detection. A CNN model typically consists of convolutional layers, pooling layers, and fully connected layers, as shown in
Figure 9:
Convolutional layers: These layers are the core of the model, consisting of filters or kernels to calculate image features such as lines, edges, and corners. Generally, a filter consists of a mask matrix of numbers moved over the input image to calculate specific features. The convolution operations of filters consist of dot products and summations between the filters and the input image. The output of these operations is usually passed through an activation function designed for a particular purpose, such as the rectified linear unit (ReLU) activation function for non-linear input.
Pooling layers: These layers generally reduce the dimensionality of the features. They represent pooled feature maps or new sets of features, moving from the local scale to the global scale. There are several possible pooling operations, including taking the maximum, average, or summation of each corresponding cluster of data from the previous layer.
Fully connected layers: A fully connected layer, in which every neuron in the previous layer is connected to every neuron in the current layer, is typically used as a final layer. The softmax activation function is commonly used in a fully connected output layer to classify the input image into one of several classes based on the training images.
Moreover, the experiment was compared with OpenPose method [
45] which is a pre-trained model for human detection based on the PAFs relating to human body joints. In the OpenPose technique, there are three main procedures for human detection:
Keypoints localization: The input image is located and predicted all the possible keypoints as human body joints based on a confidence map. This map is also beneficial of one person pose estimation.
Part Affinity Fields: The keypoints are mapped to the 2-dimensional vector field for location and orientation of the associated human limbs.
Greedy Inference: The 2-dimensional vector field is generated the pose keypoints for all the people in the image.
To maintain runtime performance, the OpenPose method [
45] is the limited computation to a maximum of 6 stages, allocated differently procedures across the part affinity fields and keypoints localization.
3.3. Proposed Lower-Body Detection Framework Using Anthropometric Data
In this section, anthropometric data [
21,
25,
47] representing scaling relations for the human body are introduced. This section also illustrates a method of using anthropometric data to transform three regions of interest (ROIs) of the human body, namely, the full-body, the upper-body, and the face, into the lower-body ROI.
3.3.1. Anthropometric Data
In this section, anthropometric data [
48] representing human body information are introduced. A survey of anthropometric data is generally related to the size, motion, and mass of the human body. Such survey data can be applied to design suitable clothing, ergonomic devices, or workspaces. In this study, human body size data from the NASA Anthropometry and Biomechanics Facility [
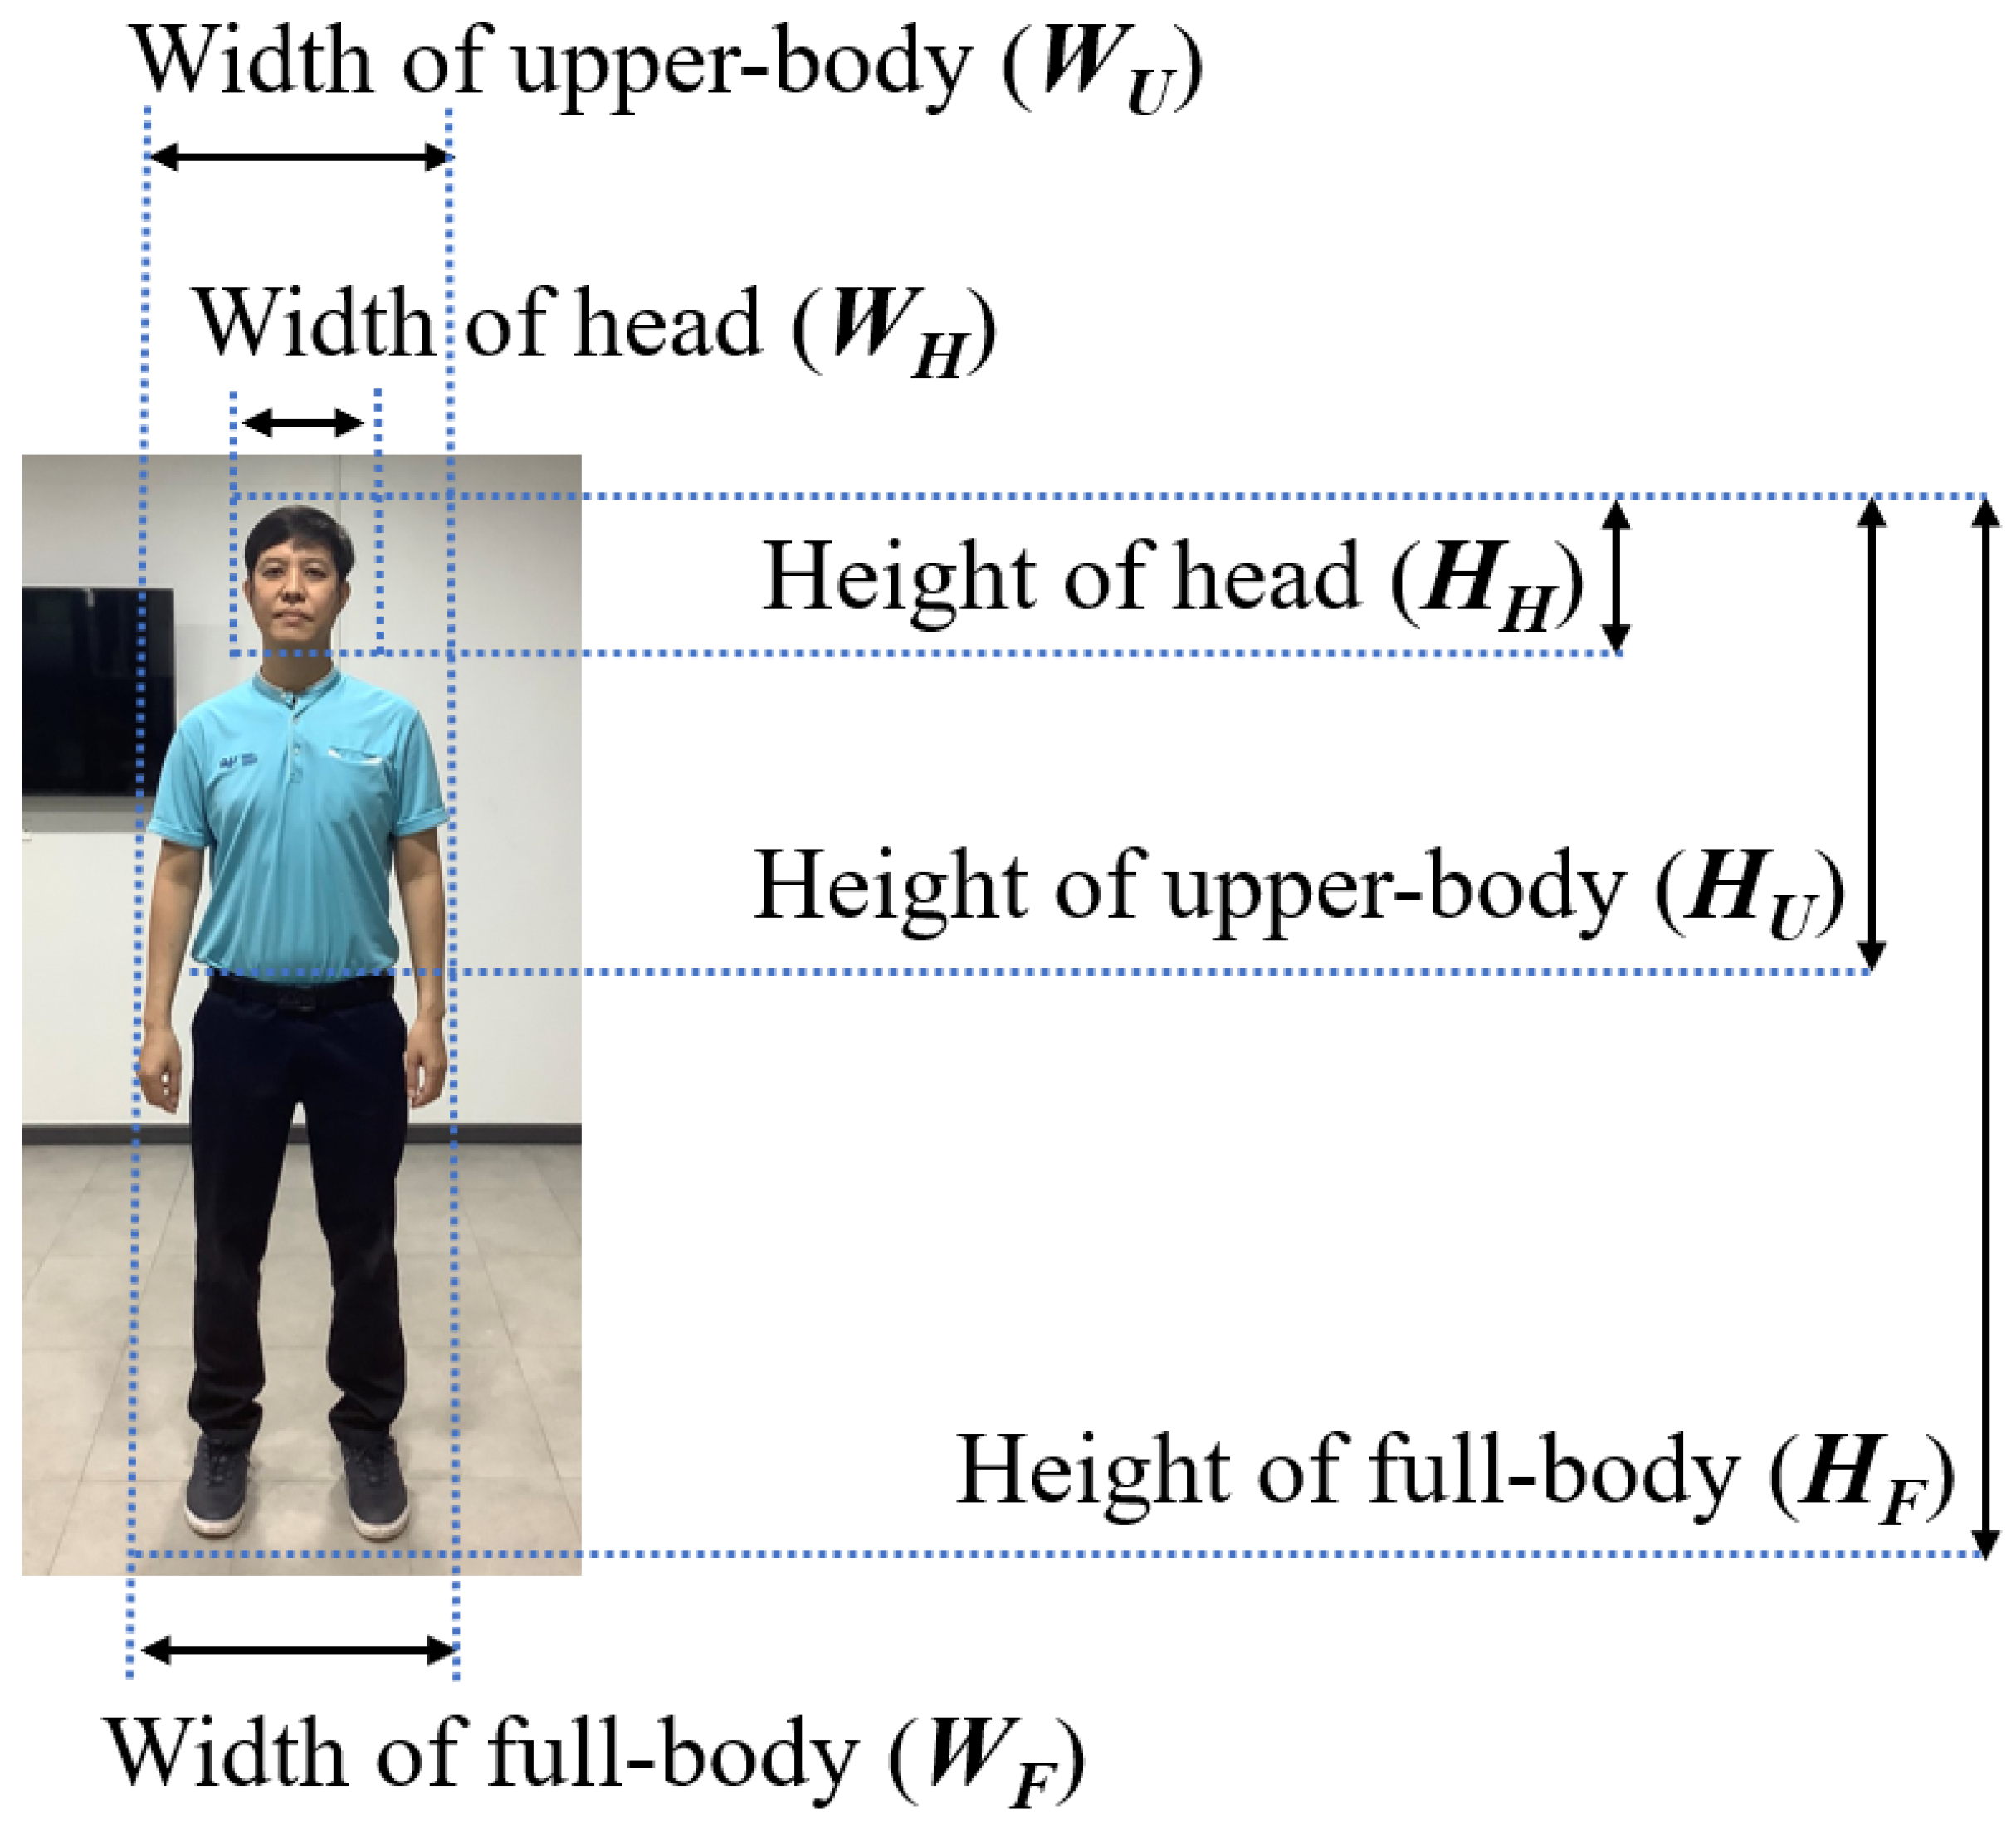
21] are selected to provide information on the height and width of various body parts in a standing posture from the frontal view. This information was collected from healthy adults with an average age of approximately 40 years and from a wide range of ethnic and racial backgrounds. The example of anthropometric dimensional data is shown in
Figure 10. There are three dominant parts of the human body considering in this experiment:
Full-body: the width of the full-body is similar to the width of the upper-body, and the height of the full-body is measured from the foot to the top of the head.
Upper-body: the width of the upper-body is recorded from the edge of the left hand to the edge of the right hand with the hands resting on the body, and the height of the upper-body is measured from the waist to the top of the head.
Head: the width of the head is measured from the left ear to the right ear, and the height of the head is measured from the chin to the top of the head.
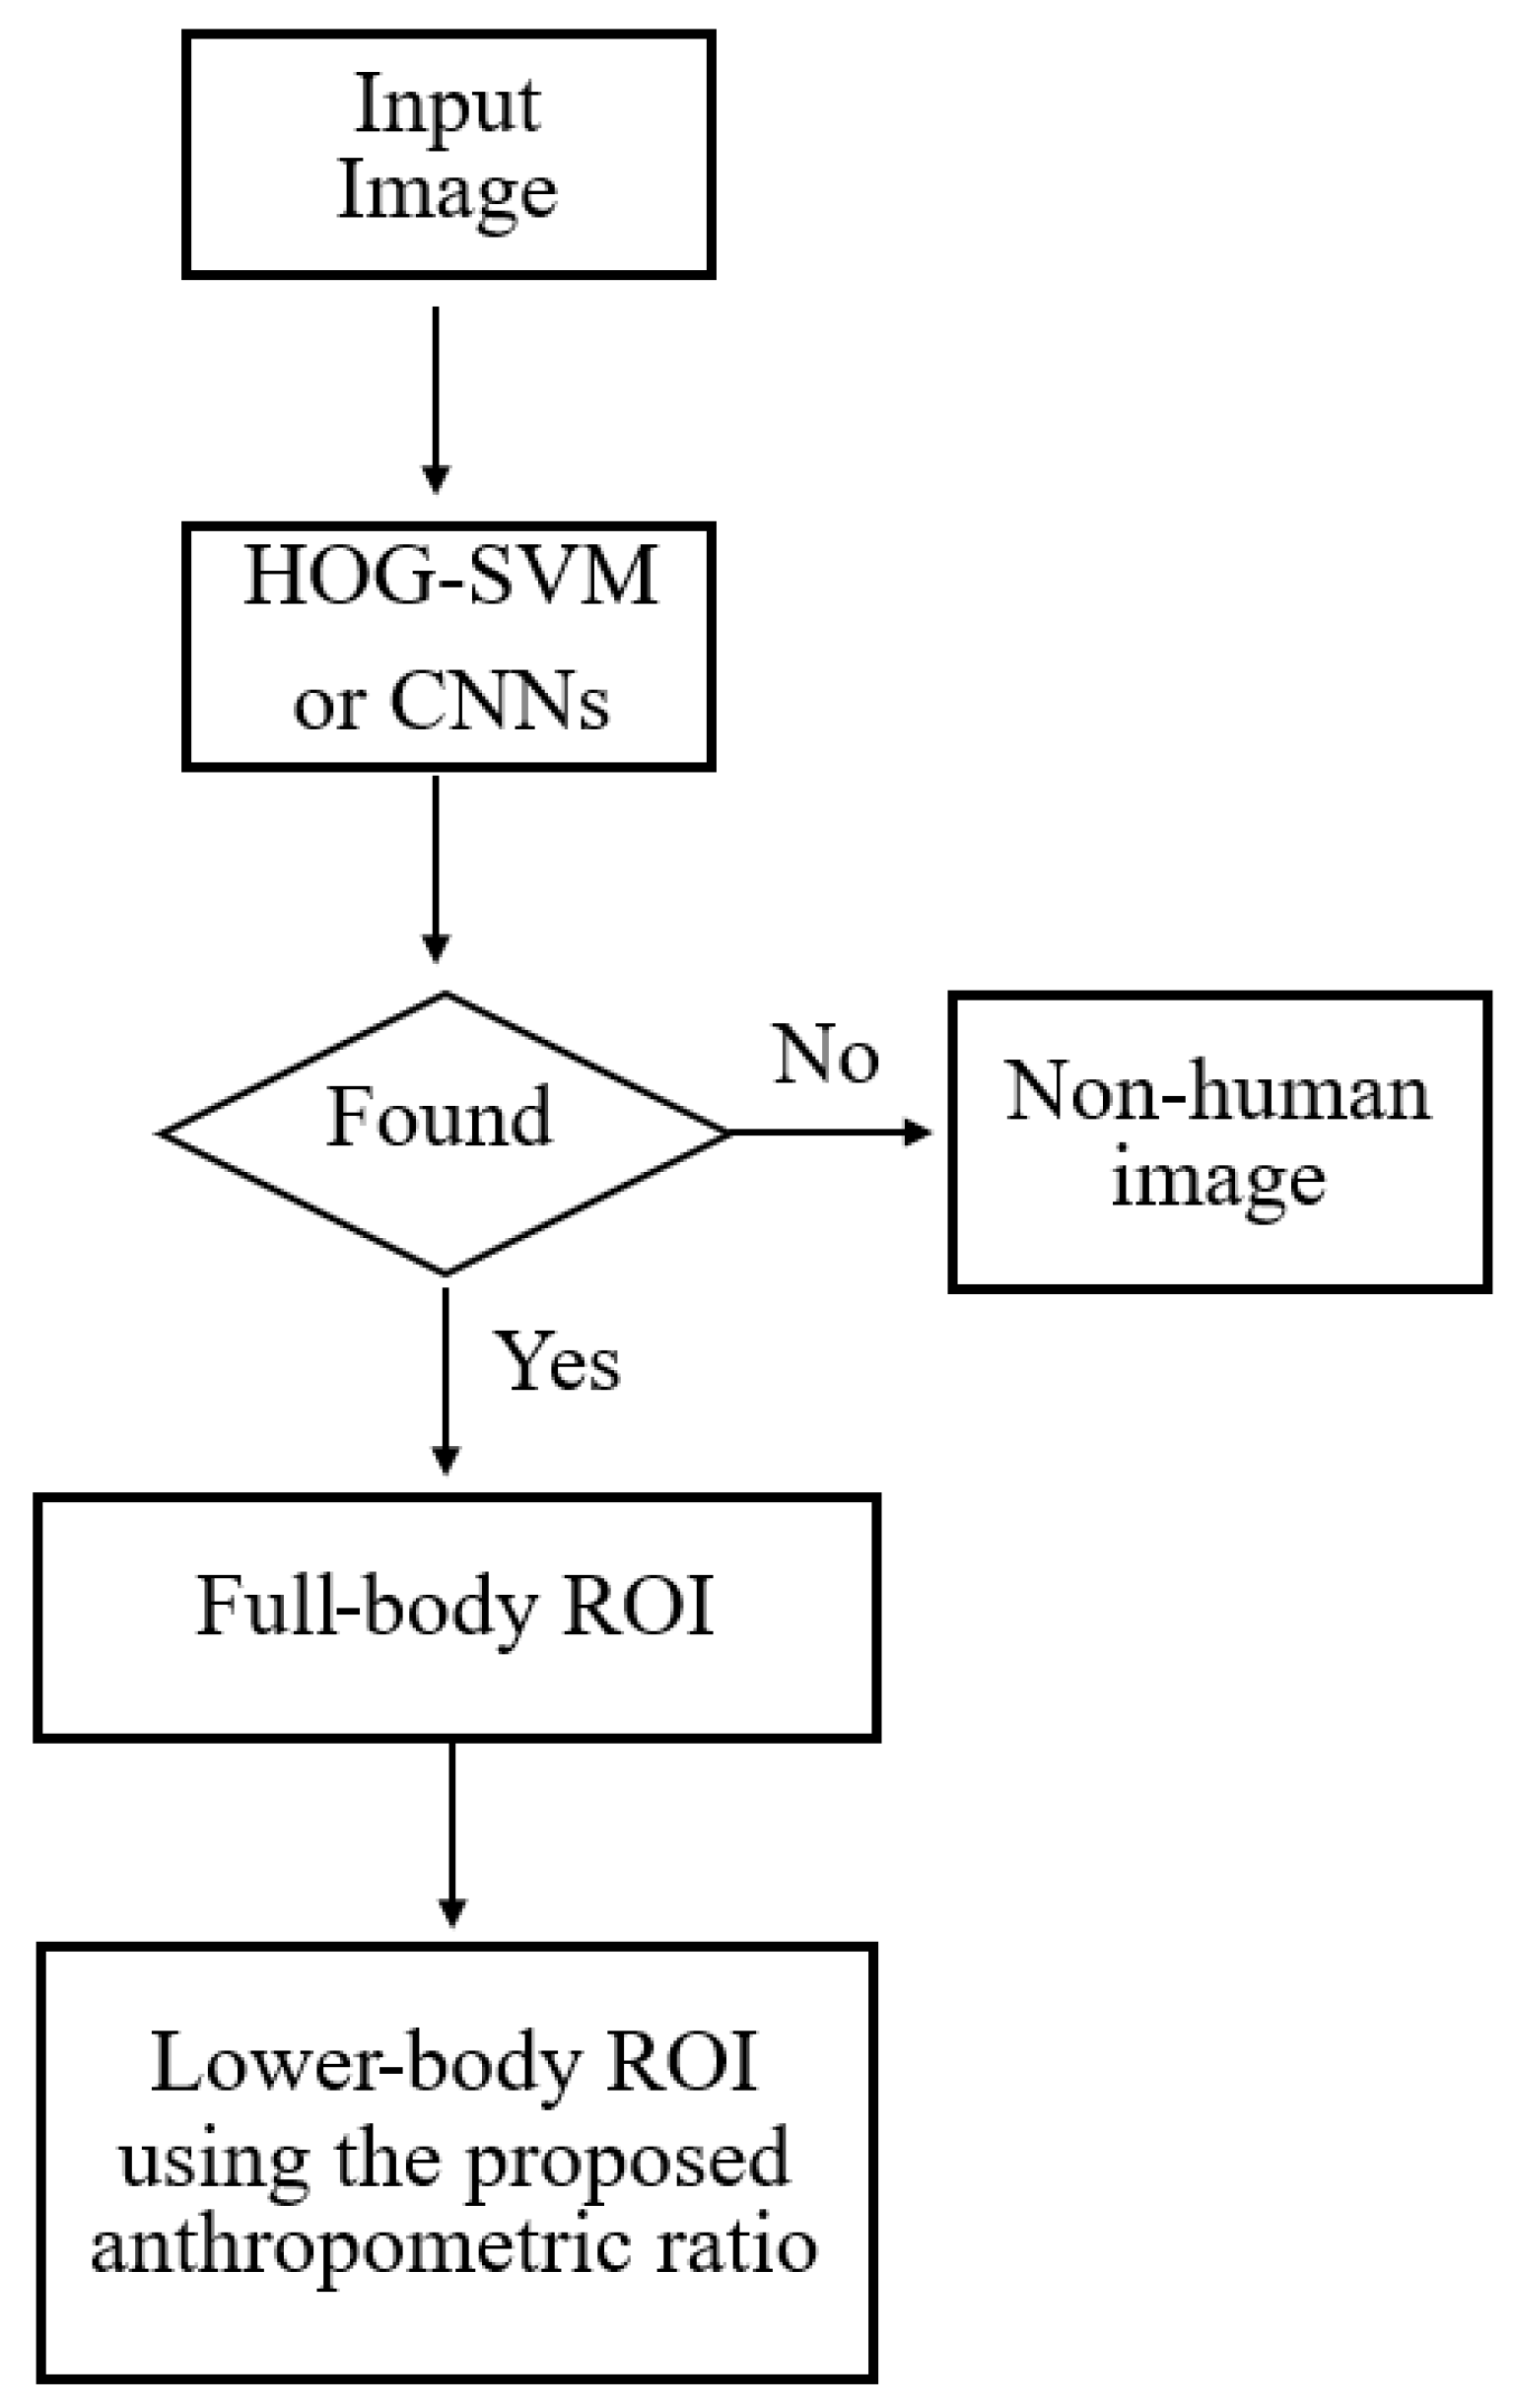
To address occlusion problems affecting the lower-body, this research aims to detect the lower-body indirectly by using anthropometric data. To apply anthropometric data for lower-body detection, a suitable human ROI ratio can be used to transform an ROI corresponding to any other part of the body into the lower-body ROI. In this study, three main ROIs are considered for transformation to the lower-body:
Full-body: the HOG-SVM or CNNs algorithm is used to detect the full-body of the target, as shown in
Figure 11.
Upper-body: the VJ algorithm for upper-body detection (
) is applied to detect the upper-body of the target, as illustrated in
Figure 12.
Head: the head of the target is detected by using the VJ algorithm for face detection (
), under the assumption that the head ROI is close to the face ROI, as demonstrated in
Figure 13.
The anthropometric data ratios are constructed from the median scaled sizes of the head, upper-body, lower-body, and full-body in a standing posture, as shown in
Table 1 and
Table 2. However, the anthropometric data collected from female subjects are not sufficiently comprehensive; therefore, in this study, only male anthropometric data are selected for lower-body detection.
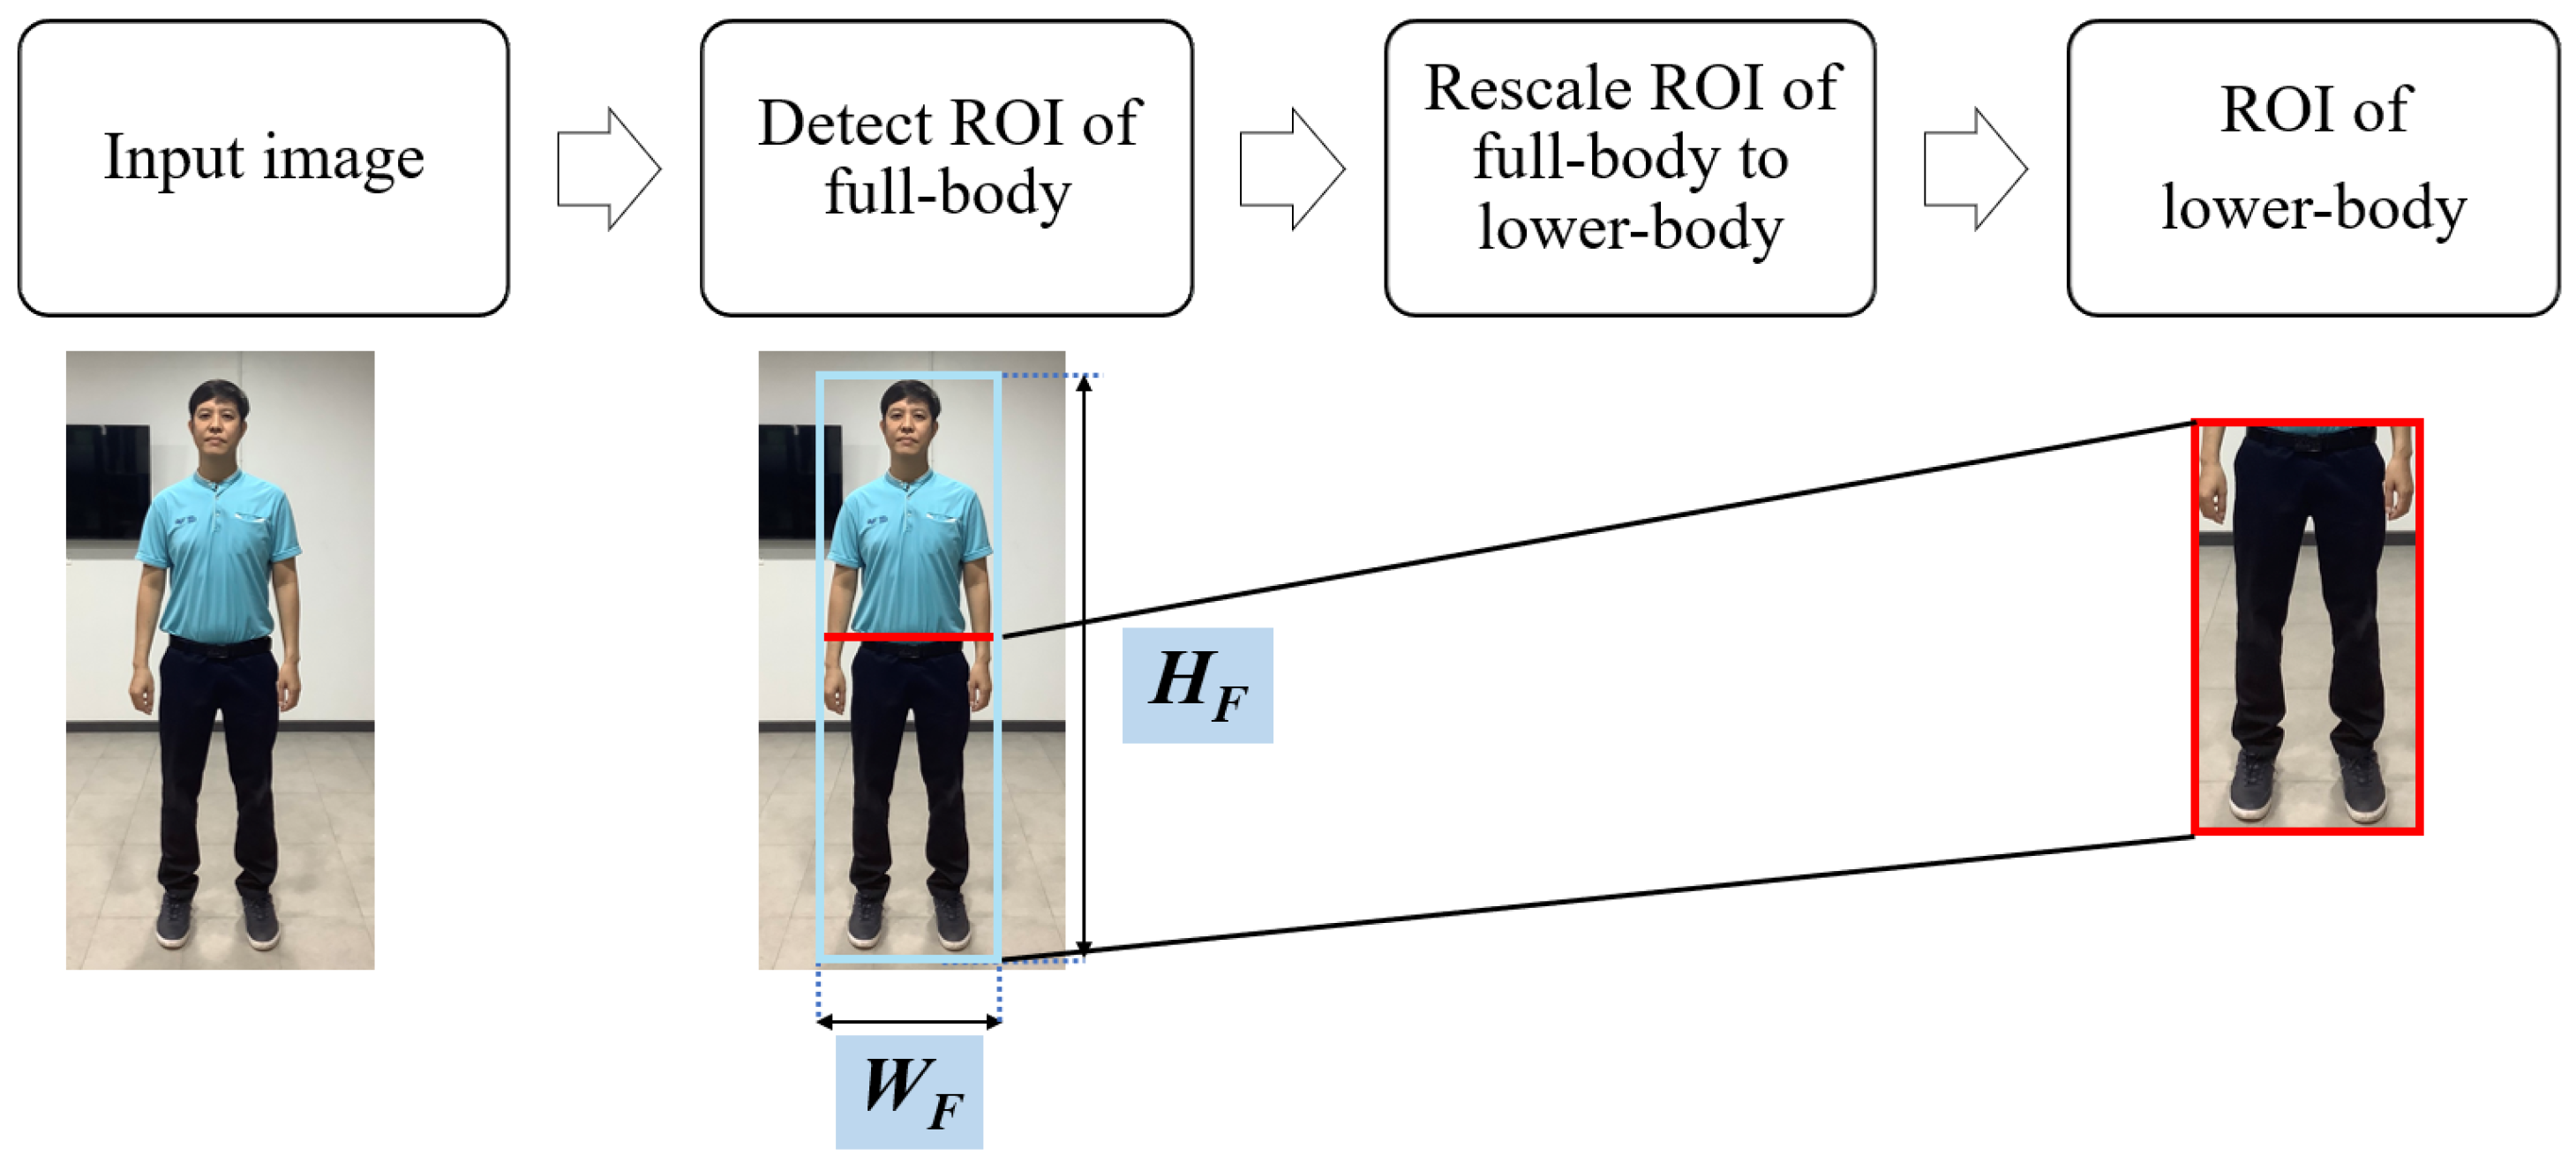
3.3.2. Transformation of the Full-Body ROI into the Lower-Body ROI
The HOG-SVM or CNNs algorithm can be used to directly detect the full-body ROI of a human in an image. This full-body ROI can then be cropped to obtain the lower-body ROI as shown in Equations (
9)–(
11). This process is also illustrated in
Figure 14. In addition, the information of the anthropometric data of upper-body is shown in
Table 1.
where
is the ratio height of upper-body per full-body,
is the height of upper-body, and
is the height of full-body.
where
is the length of lower-body ROI,
is the length of full-body ROI, and
is the ratio height of upper-body per full-body as shown in
Table 1.
where
is the width of lower-body ROI and
is the width of full-body ROI.
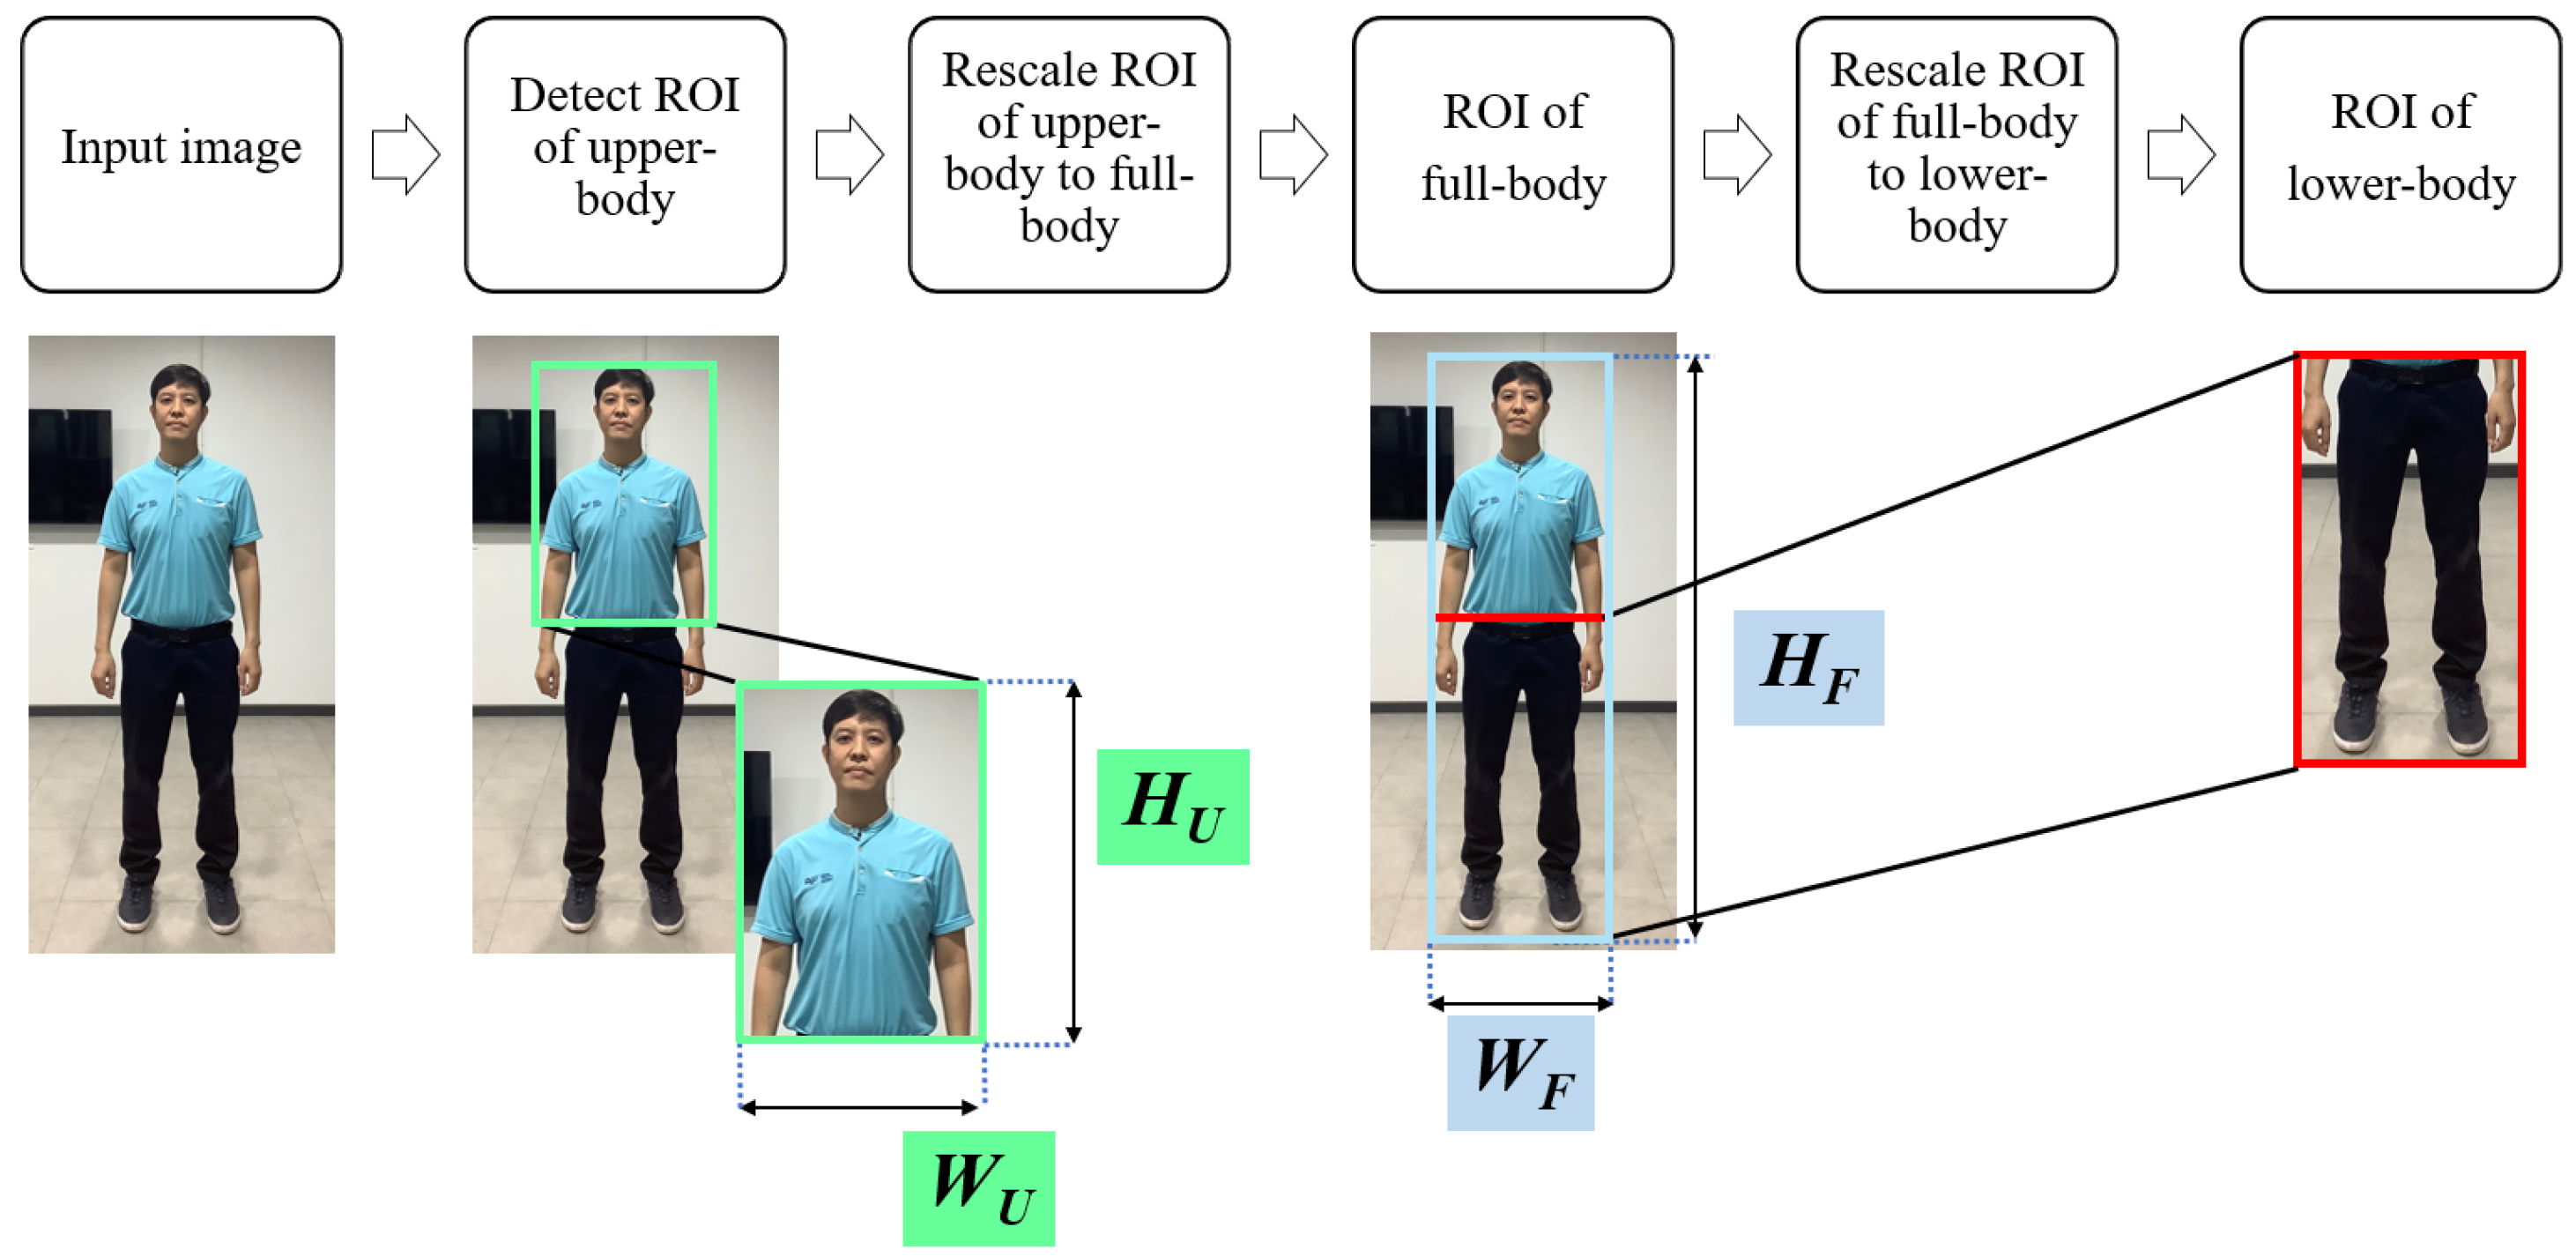
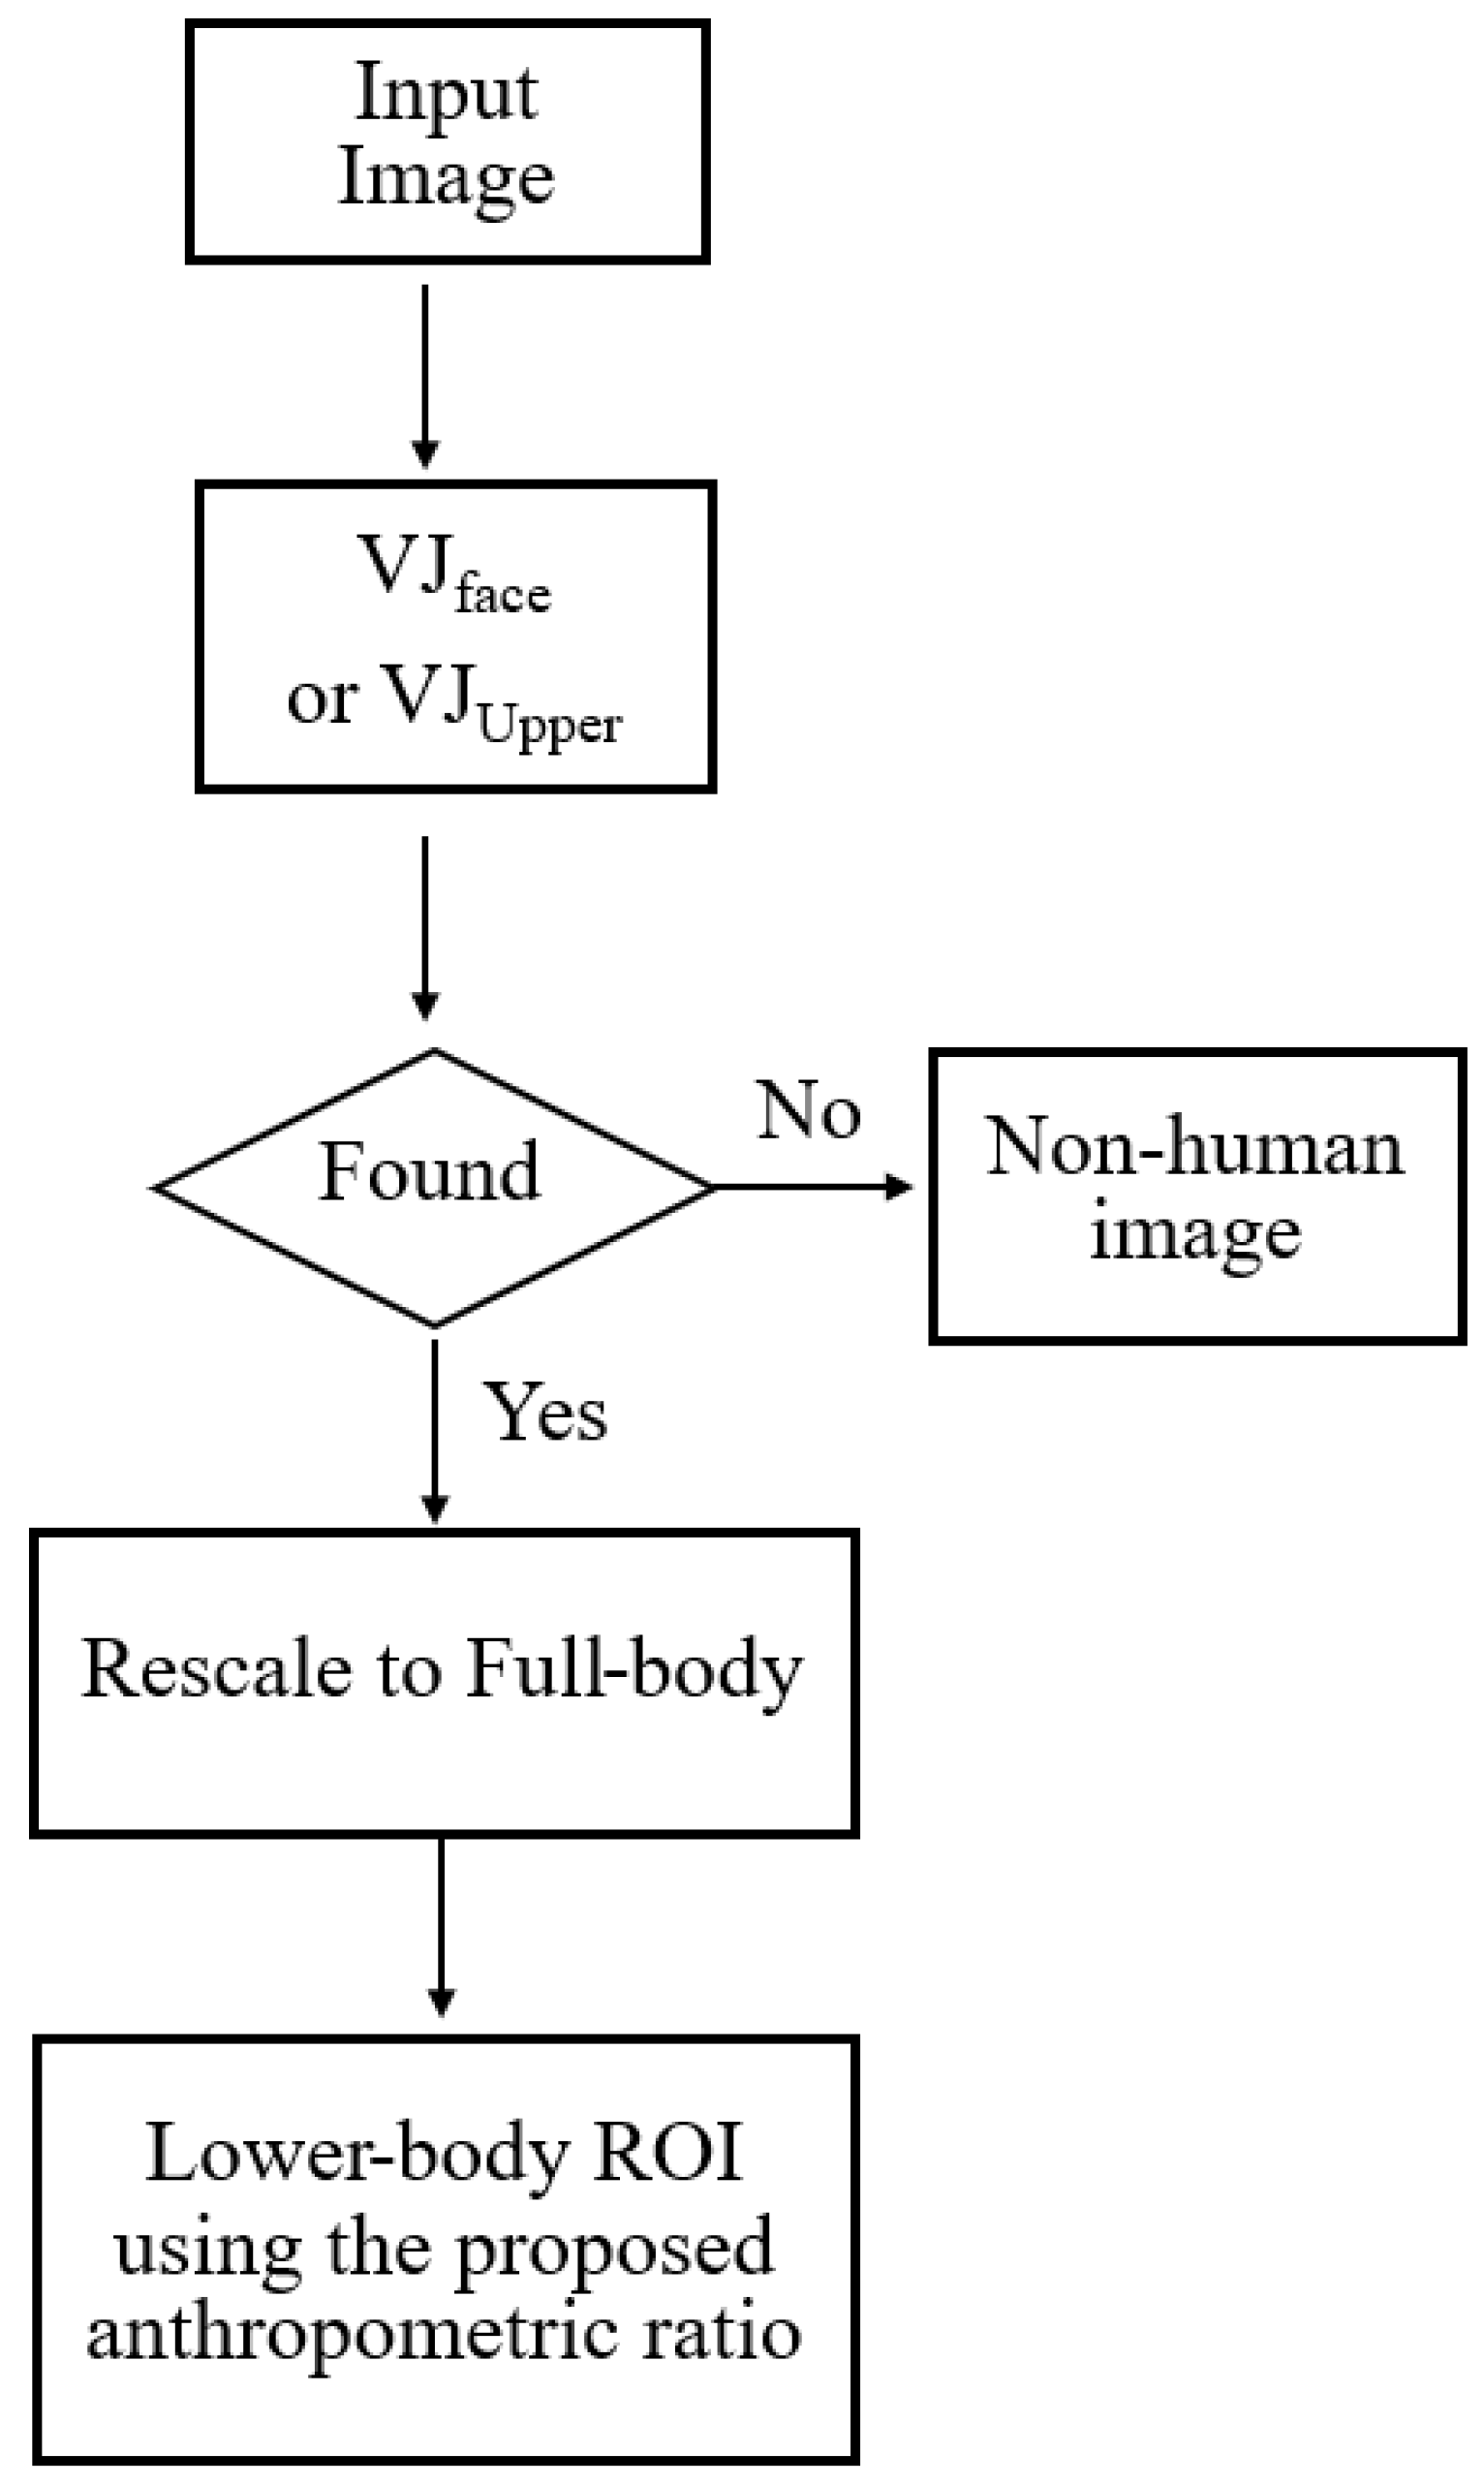
3.3.3. Transformation of the Upper-Body ROI into the Lower-Body ROI
As illustrated in
Figure 15,
is used to detect the ROI of the upper-body; then, this ROI is converted into the full-body ROI by using
and
as shown in Equations (
9), (
12)–(
14).
where
is the height of full-body ROI and
is the height of upper-body detection ROI by VJ algorithm and
is the ratio height of upper-body per full-body as shown in
Table 1.
where
is the ratio width of upper-body per full-body,
is the width of upper-body, and
is the width of full-body.
where
is the width of full-body ROI and
is the width of upper-body detection ROI by VJ algorithm and
is the ratio width of upper-body per full-body as shown in
Table 1.
Subsequently, the estimated full-body ROI is cropped to obtain the lower-body ROI as shown in Equations (
10) and (
11).
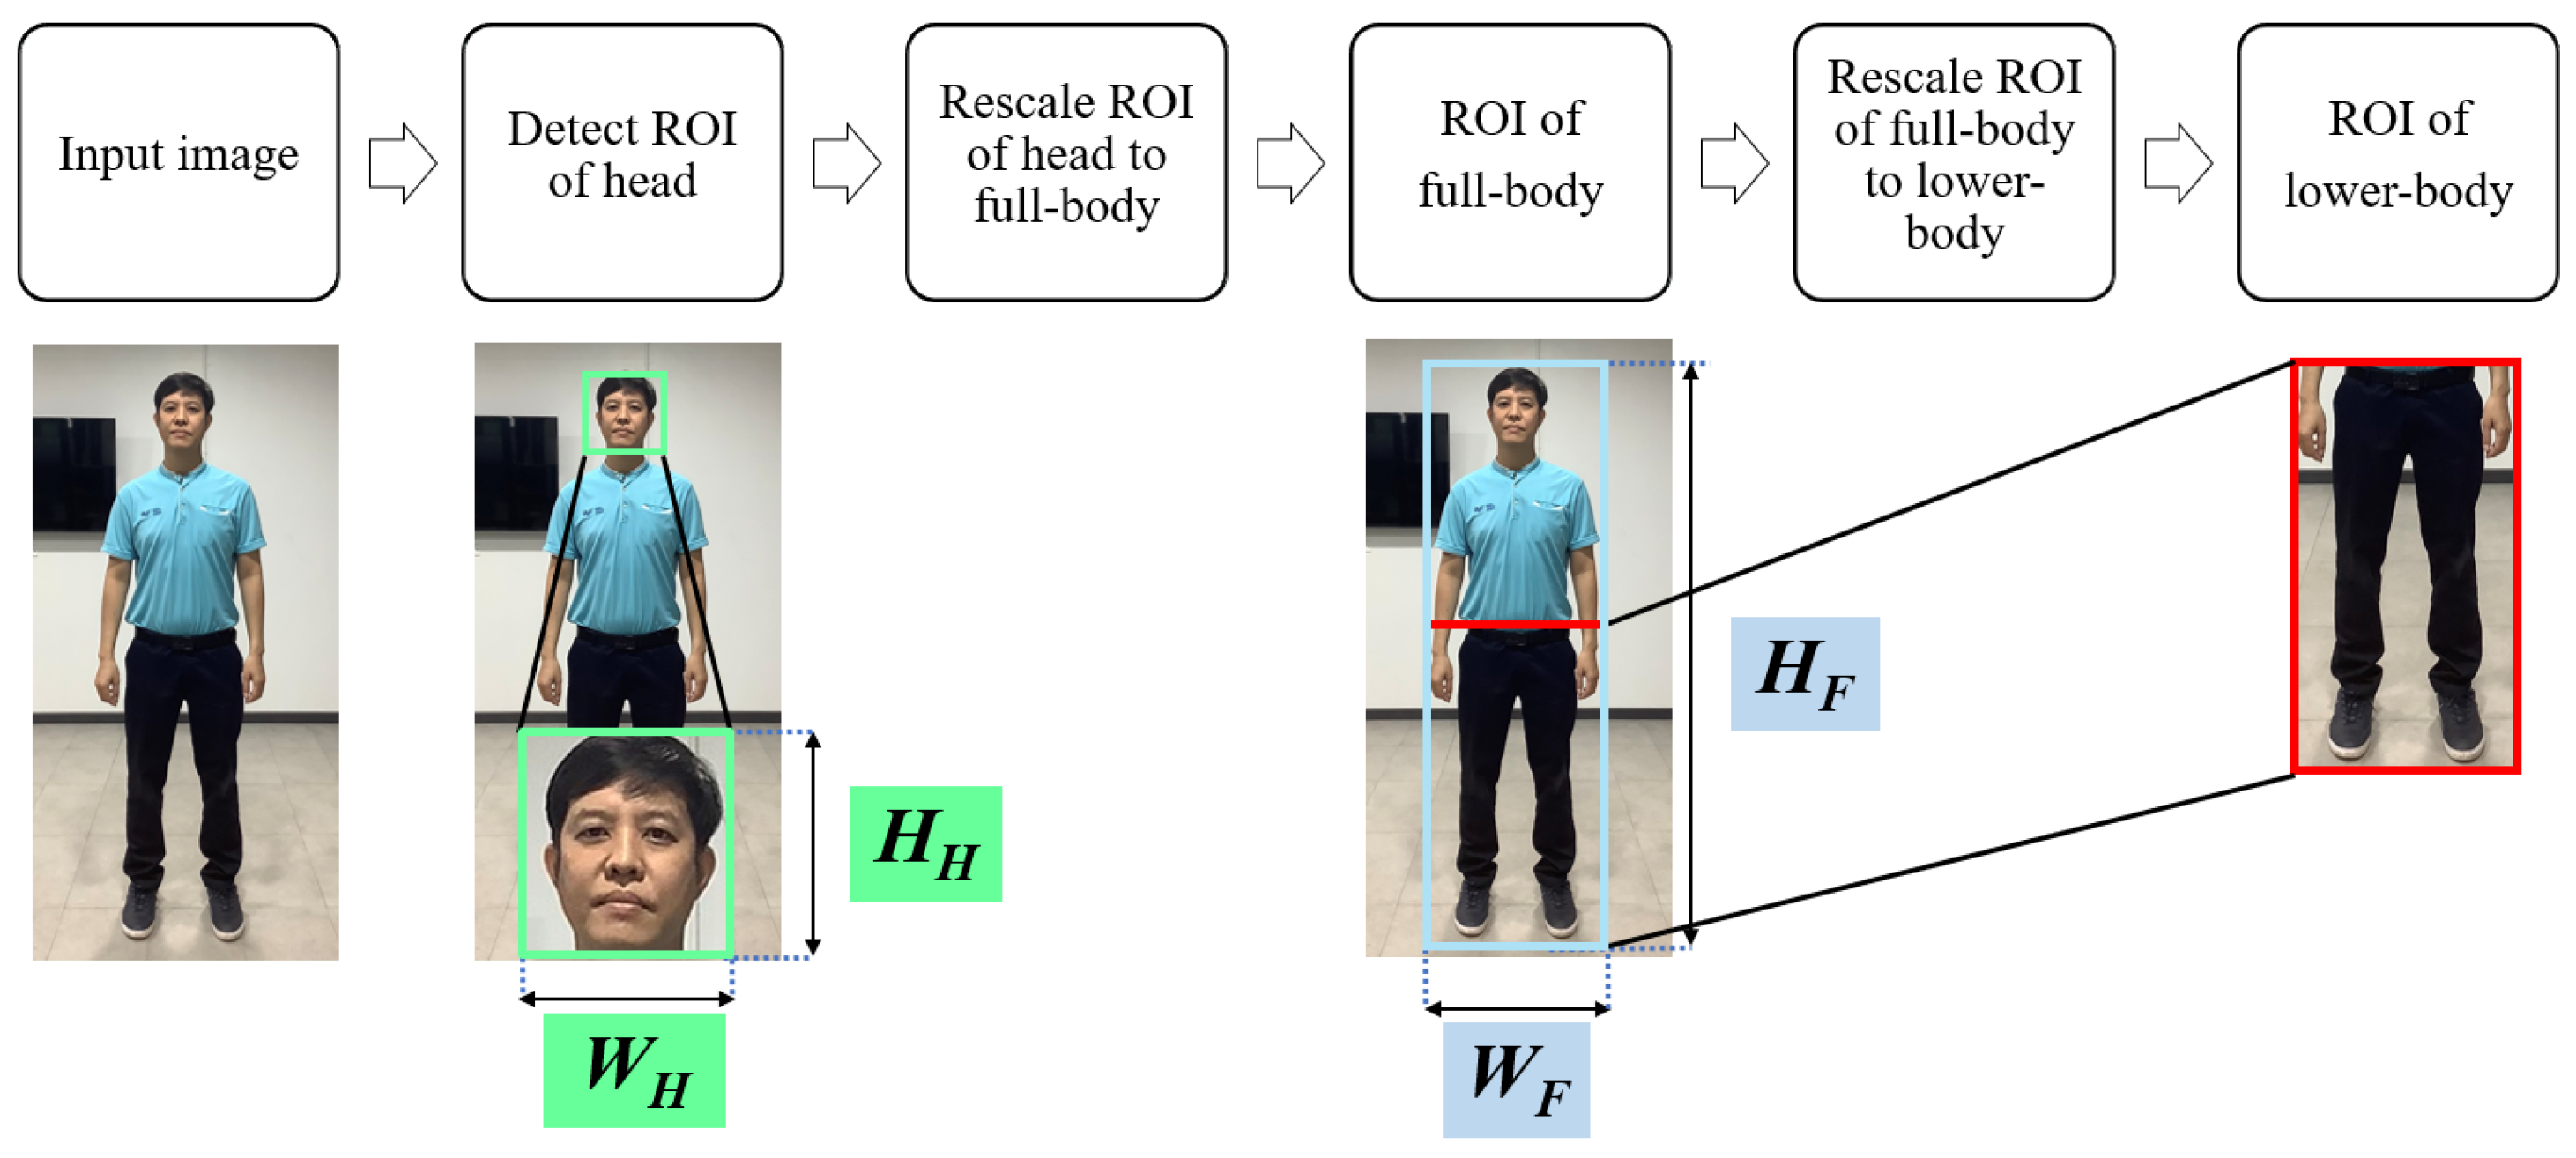
3.3.4. Transformation of the Face ROI into the Lower-Body ROI
In case of using
to find the ROI of the human face, as demonstrated in
Figure 15, the face ROI is converted into the full-body ROI by means of
and
as shown in Equation (
15)–(
18). Moreover, the information of the anthropometric data of head is shown in
Table 2.
where
is the ratio height of head per full-body,
is the height of head, and
is the height of full-body.
where
is the ratio width of head per full-body,
is the width of head, and
is the width of full-body.
where
is the height of full-body ROI and
is the height of face detection ROI by VJ algorithm and
ratio is the ratio height of head per full-body as shown in
Table 2.
where
is the width of full-body ROI and
is the width of face detection ROI by VJ algorithm and
is the ratio width of head per full-body as shown in
Table 2.
Then, this full-body ROI is cropped to obtain the lower-body ROI as shown in Equations (
10) and (
11). To summarize, diagrams of the frameworks for using the HOG-SVM or CNNs algorithm and the
or
algorithm for lower-body detection are shown in
Figure 14 and
Figure 15, respectively.
3.4. Dataset
Experiments were conducted using the INRIA Person Dataset [
11], which consists of upright human images (positive images) and general background images (negative images). This data set is challenging for lower-body detection methods because it consists of images captured under various lighting conditions and containing occluding objects, such as vehicles and furniture, close to the human targets of interest.
In these experiments, 2416 positive images and 1218 negative images were used for training, where the negative images were obtained by randomly cropping the background images. Similarly, the data set used for testing included 1126 positive images and 453 randomly cropped negative images.
To analyse the results under different image conditions, five cases of human detection were investigated and analysed. Example images for cases 1–5 are shown in
Figure 16,
Figure 17,
Figure 18,
Figure 19 and
Figure 20, respectively. Five cases of scenario [
49,
50,
51,
52,
53] are described as:
Case of challenging lighting conditions: The light level in an image may not be sufficient to clearly reveal the presence of humans [
49,
51]. In particular, this may occur in indoor and night-time scenes, resulting in low image quality.
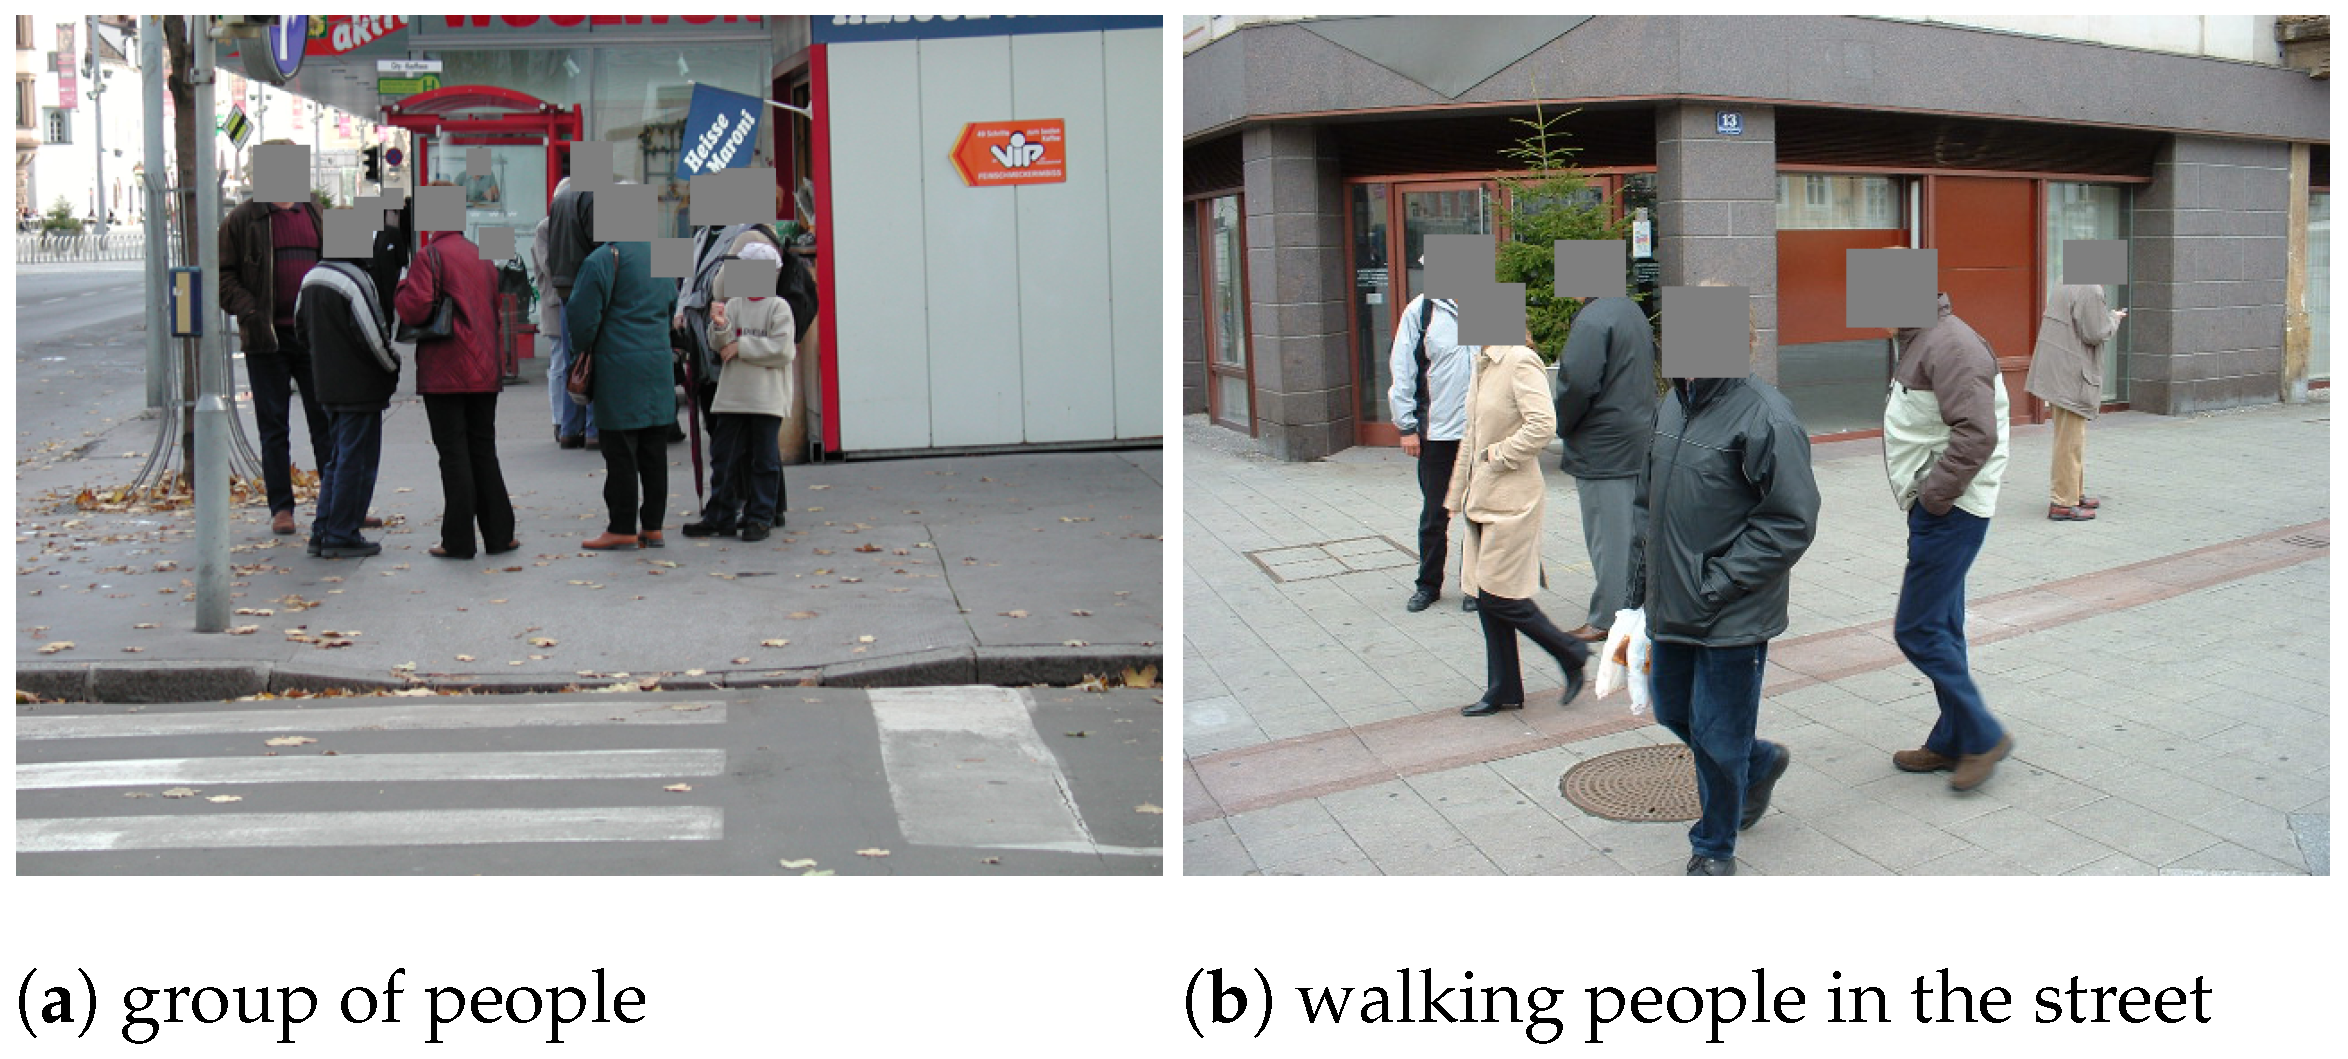
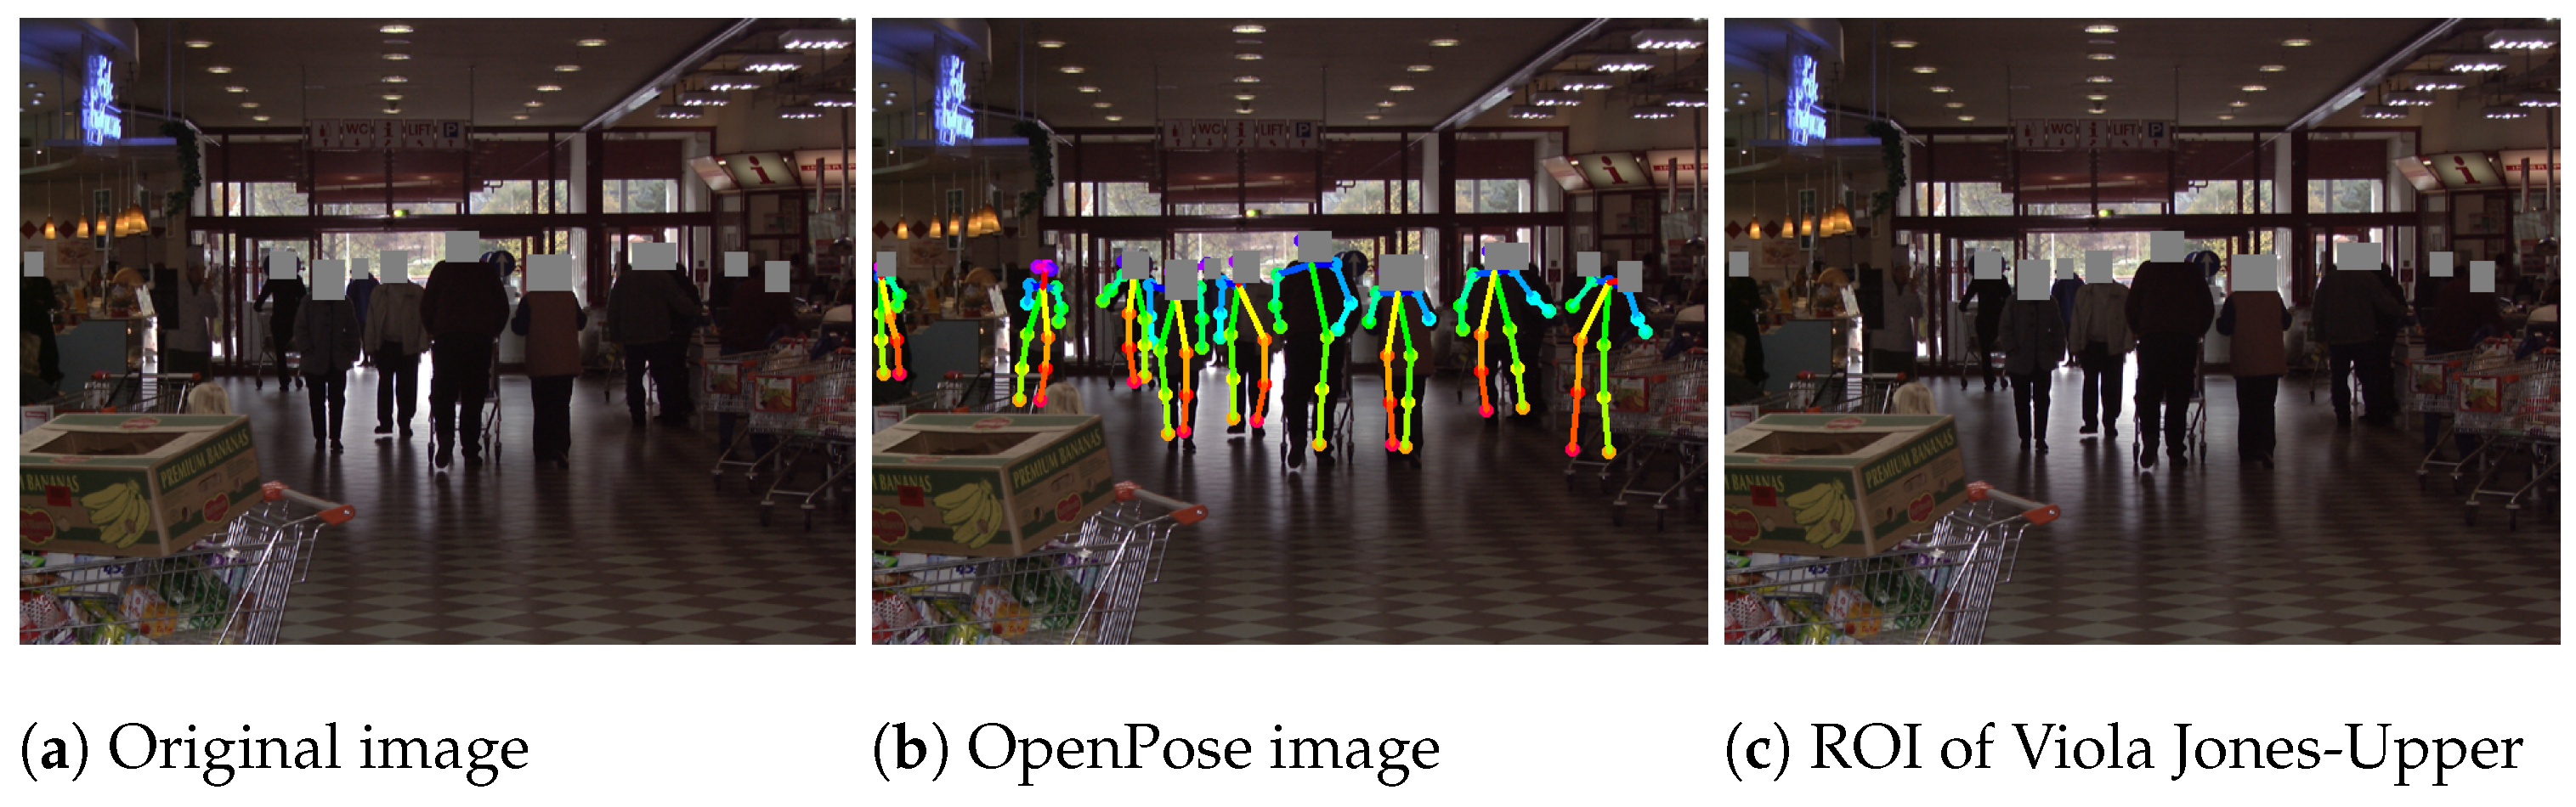
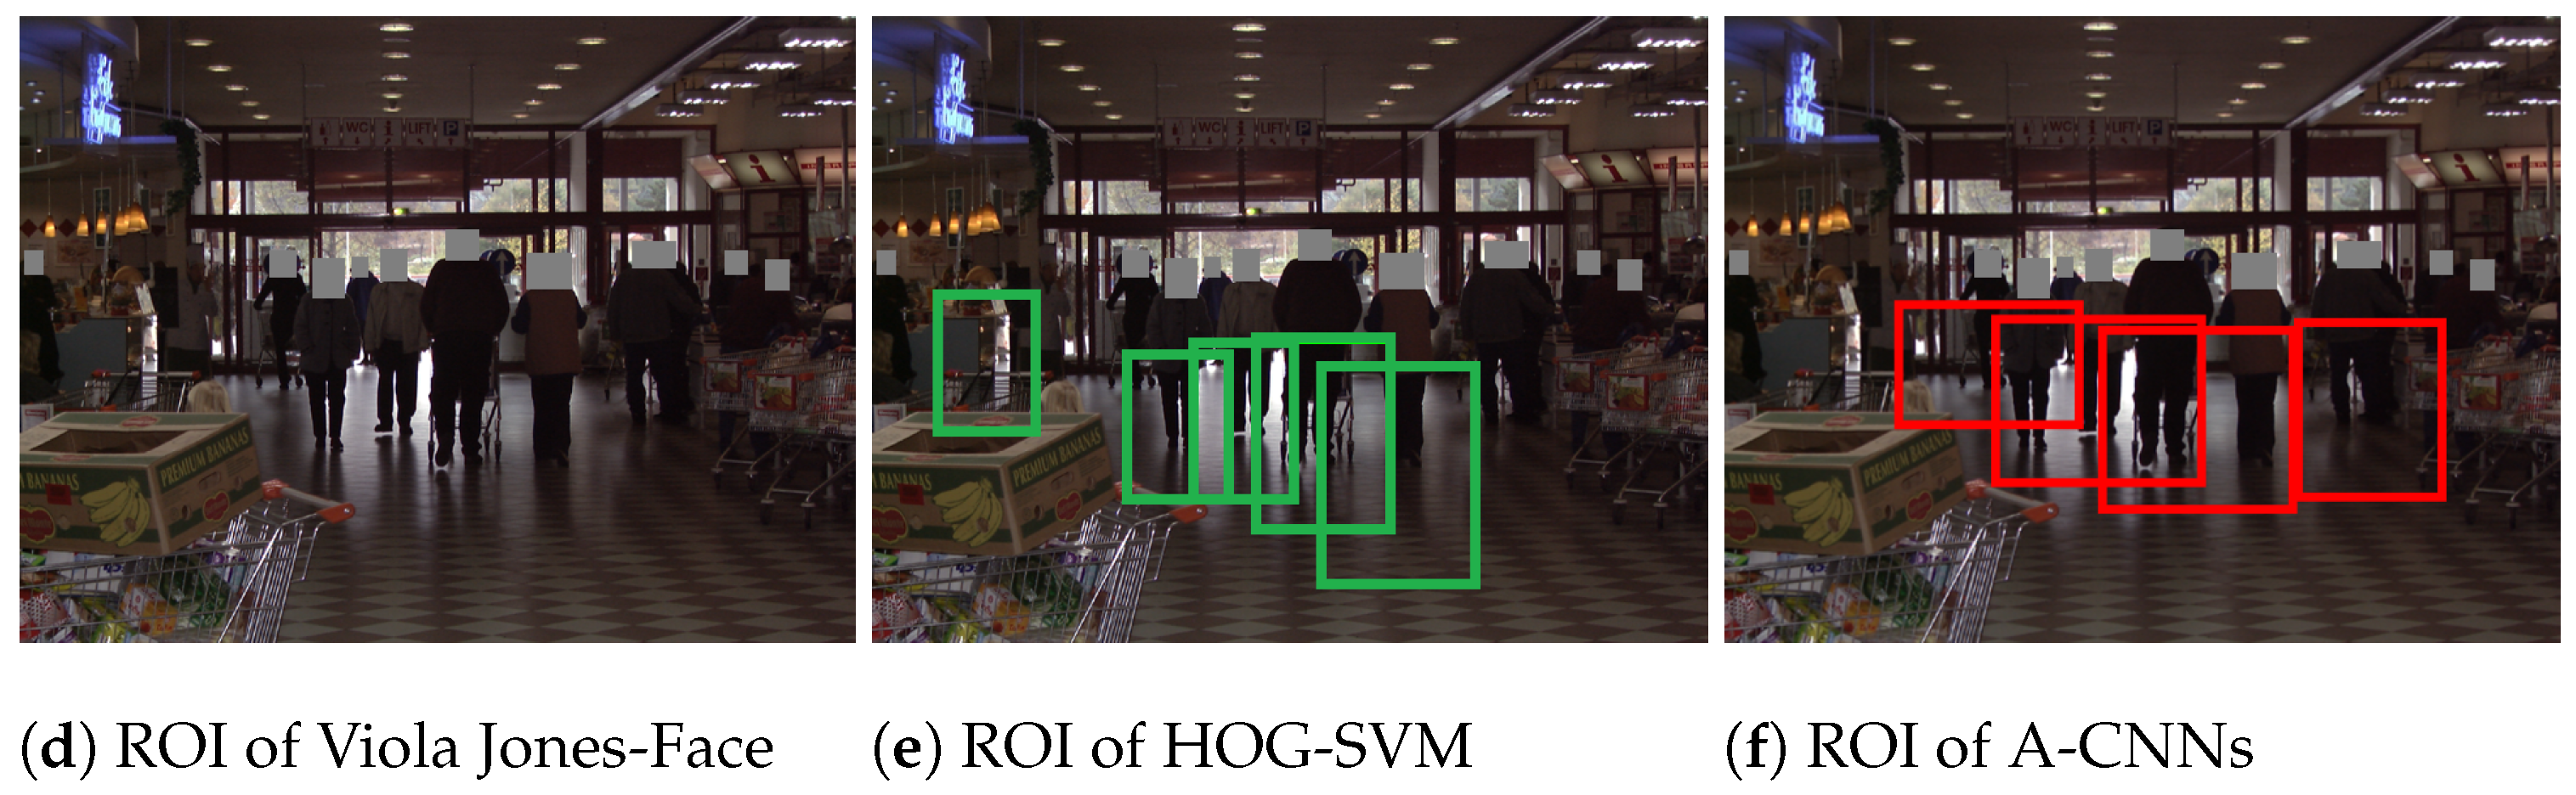
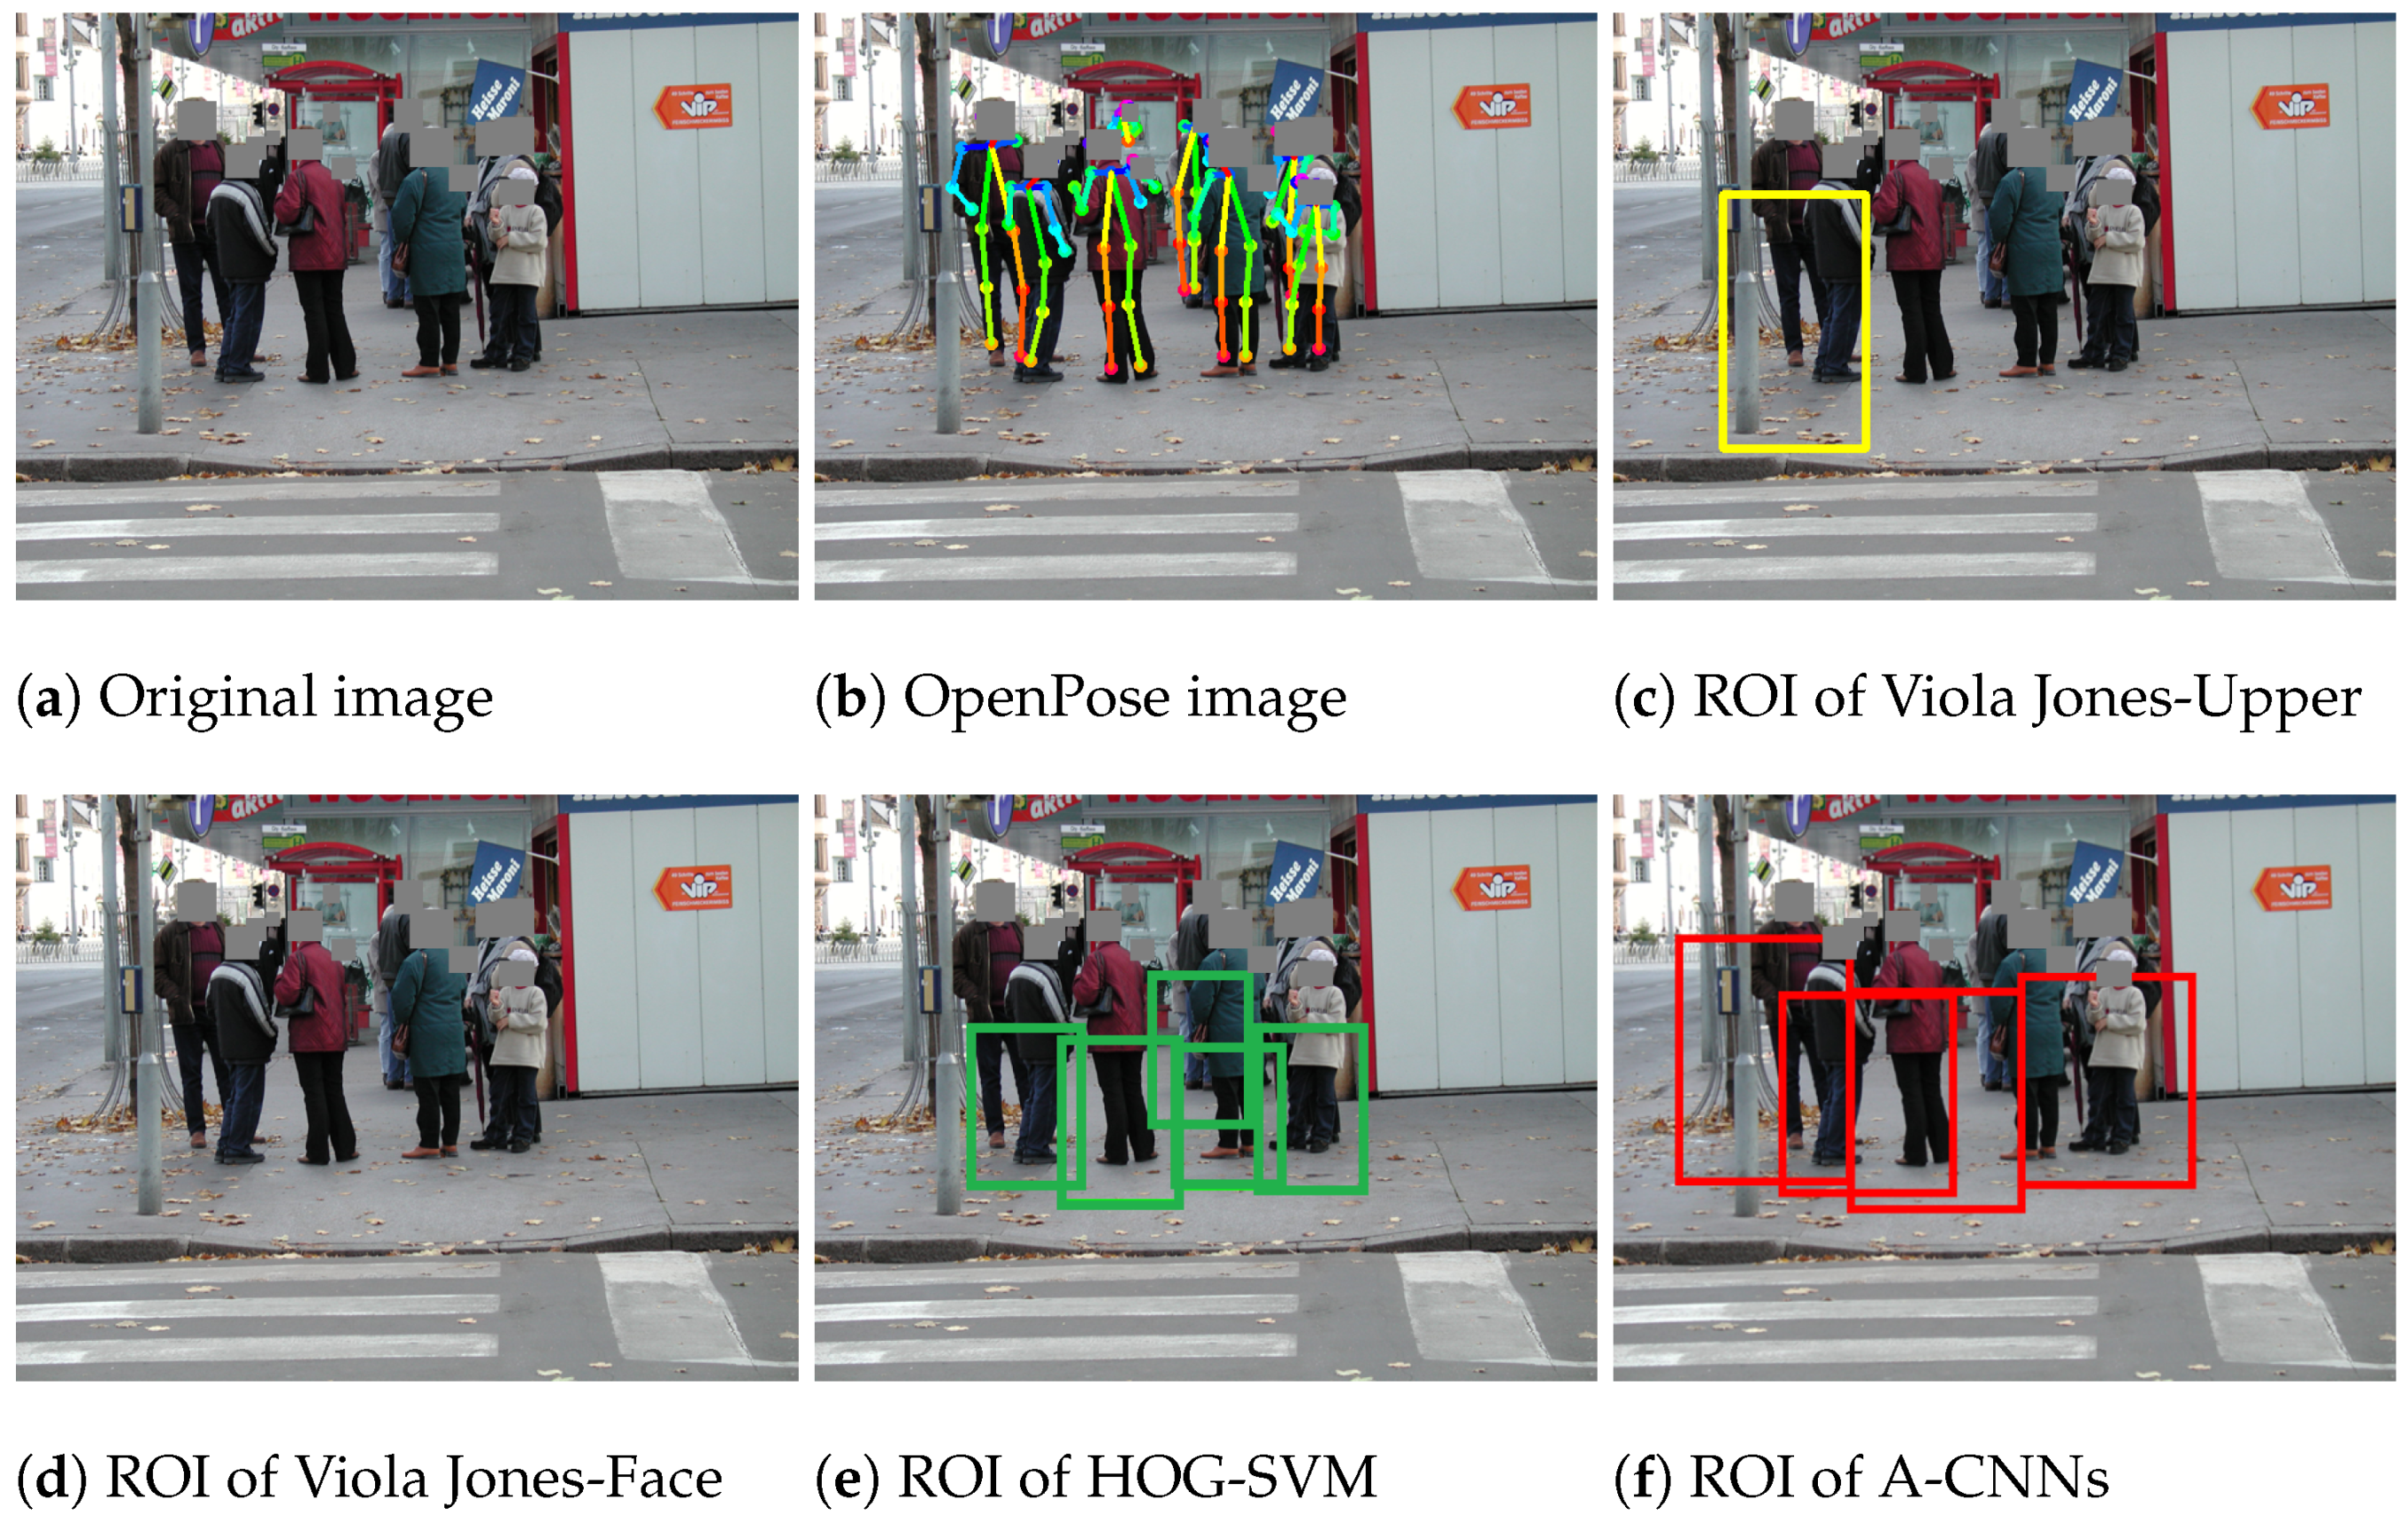
Case of occlusion: Occlusion refers to overlapping either between a human and another human or between a human and another object in the image [
49,
50,
51]. This can affect the ability to identify complete human shapes, such as in the case of a group of standing people.
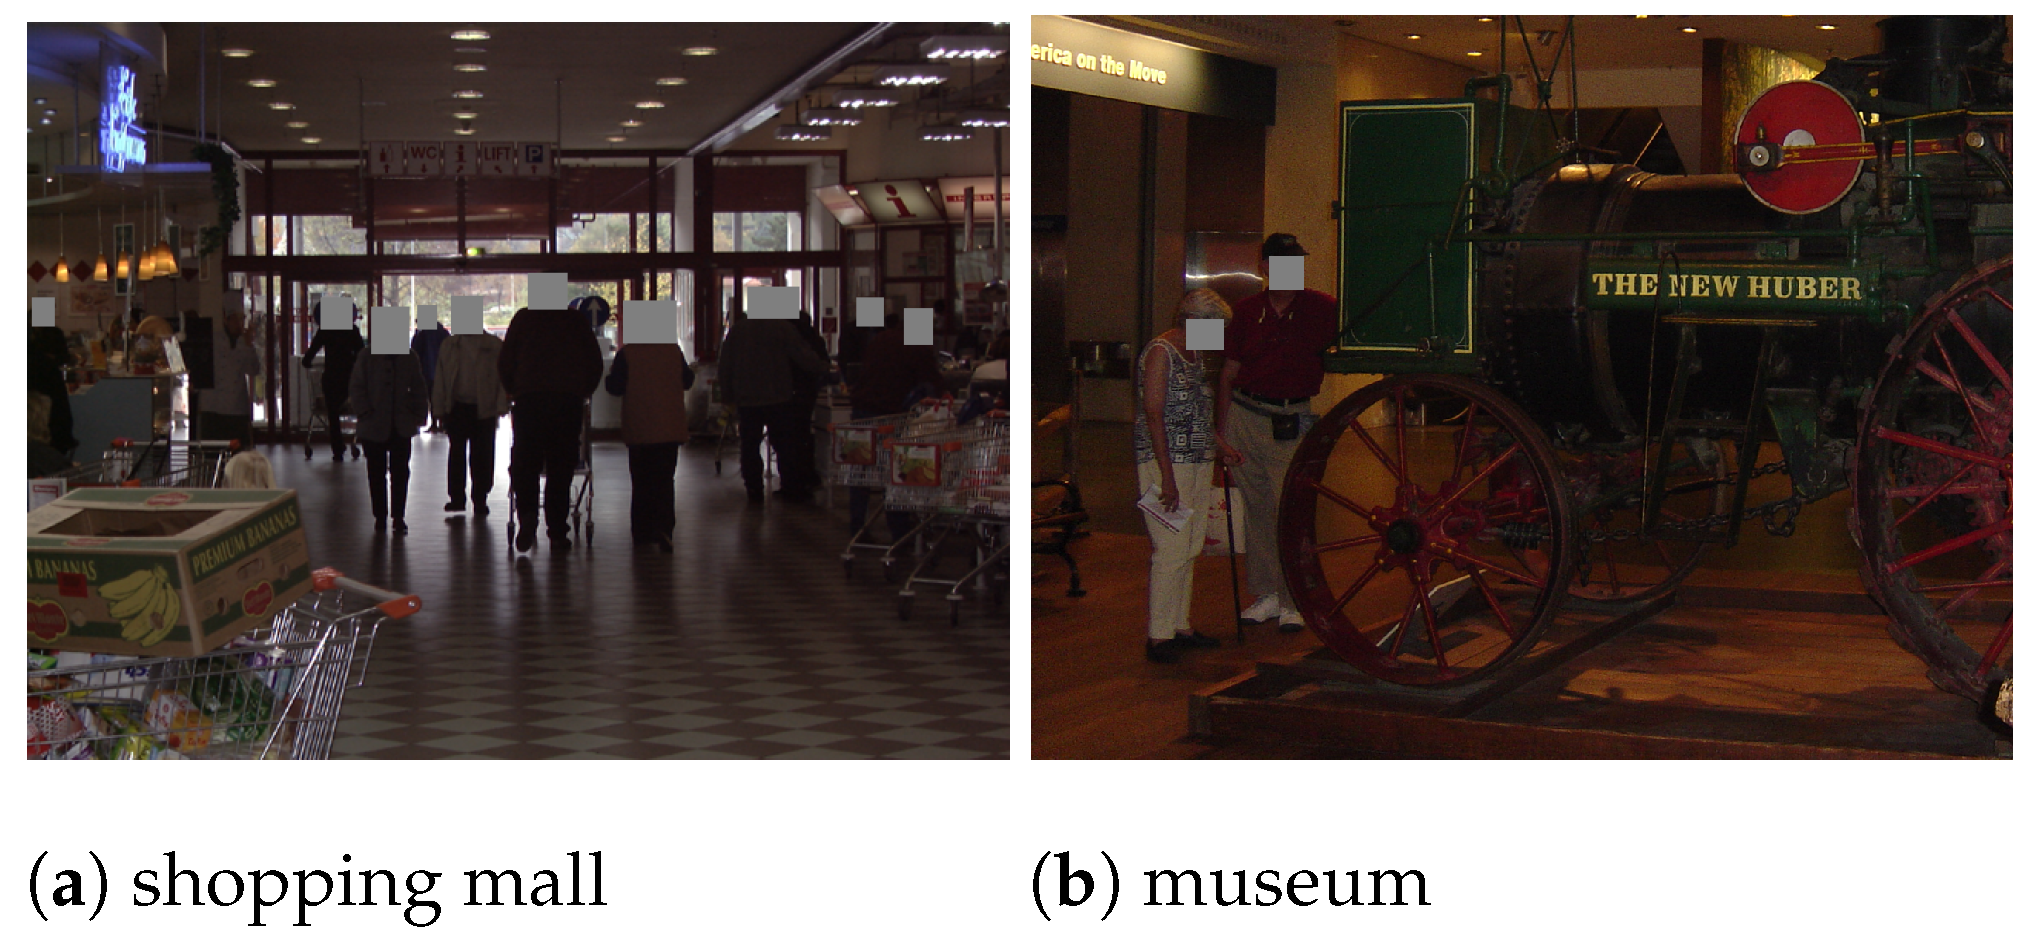
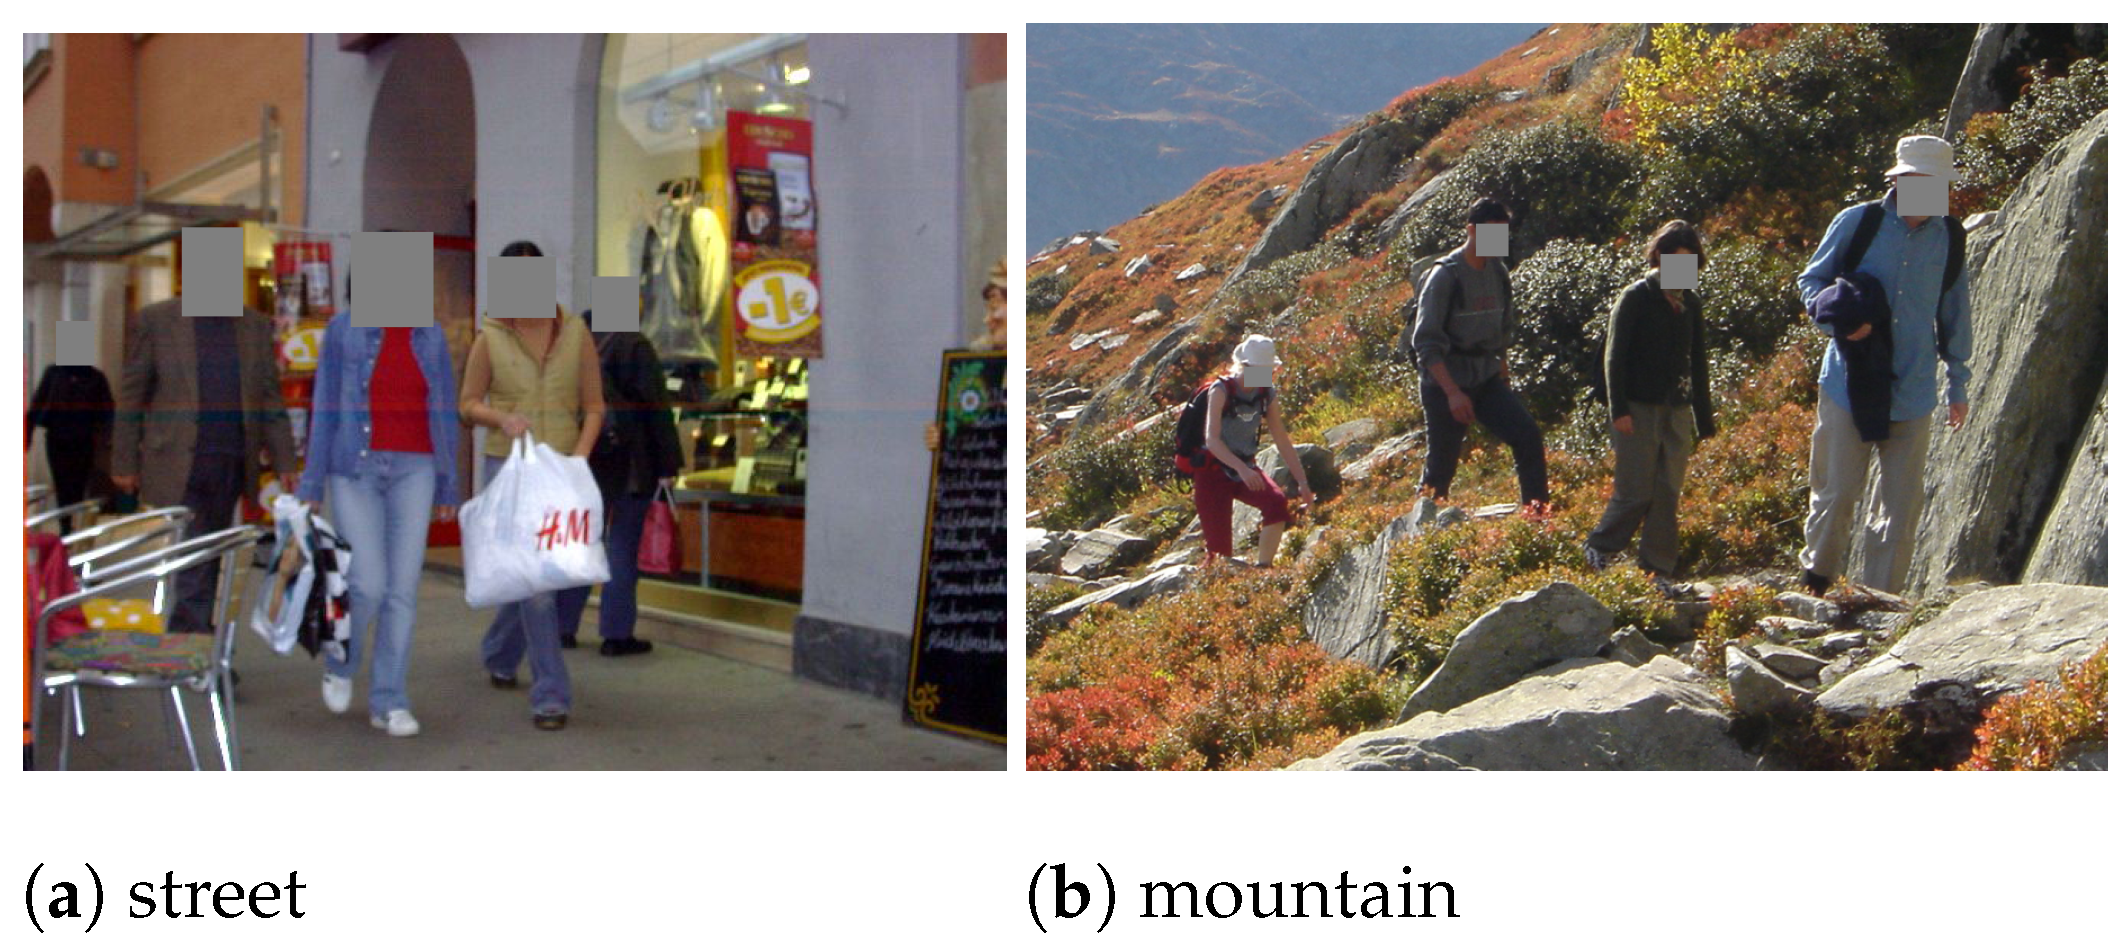
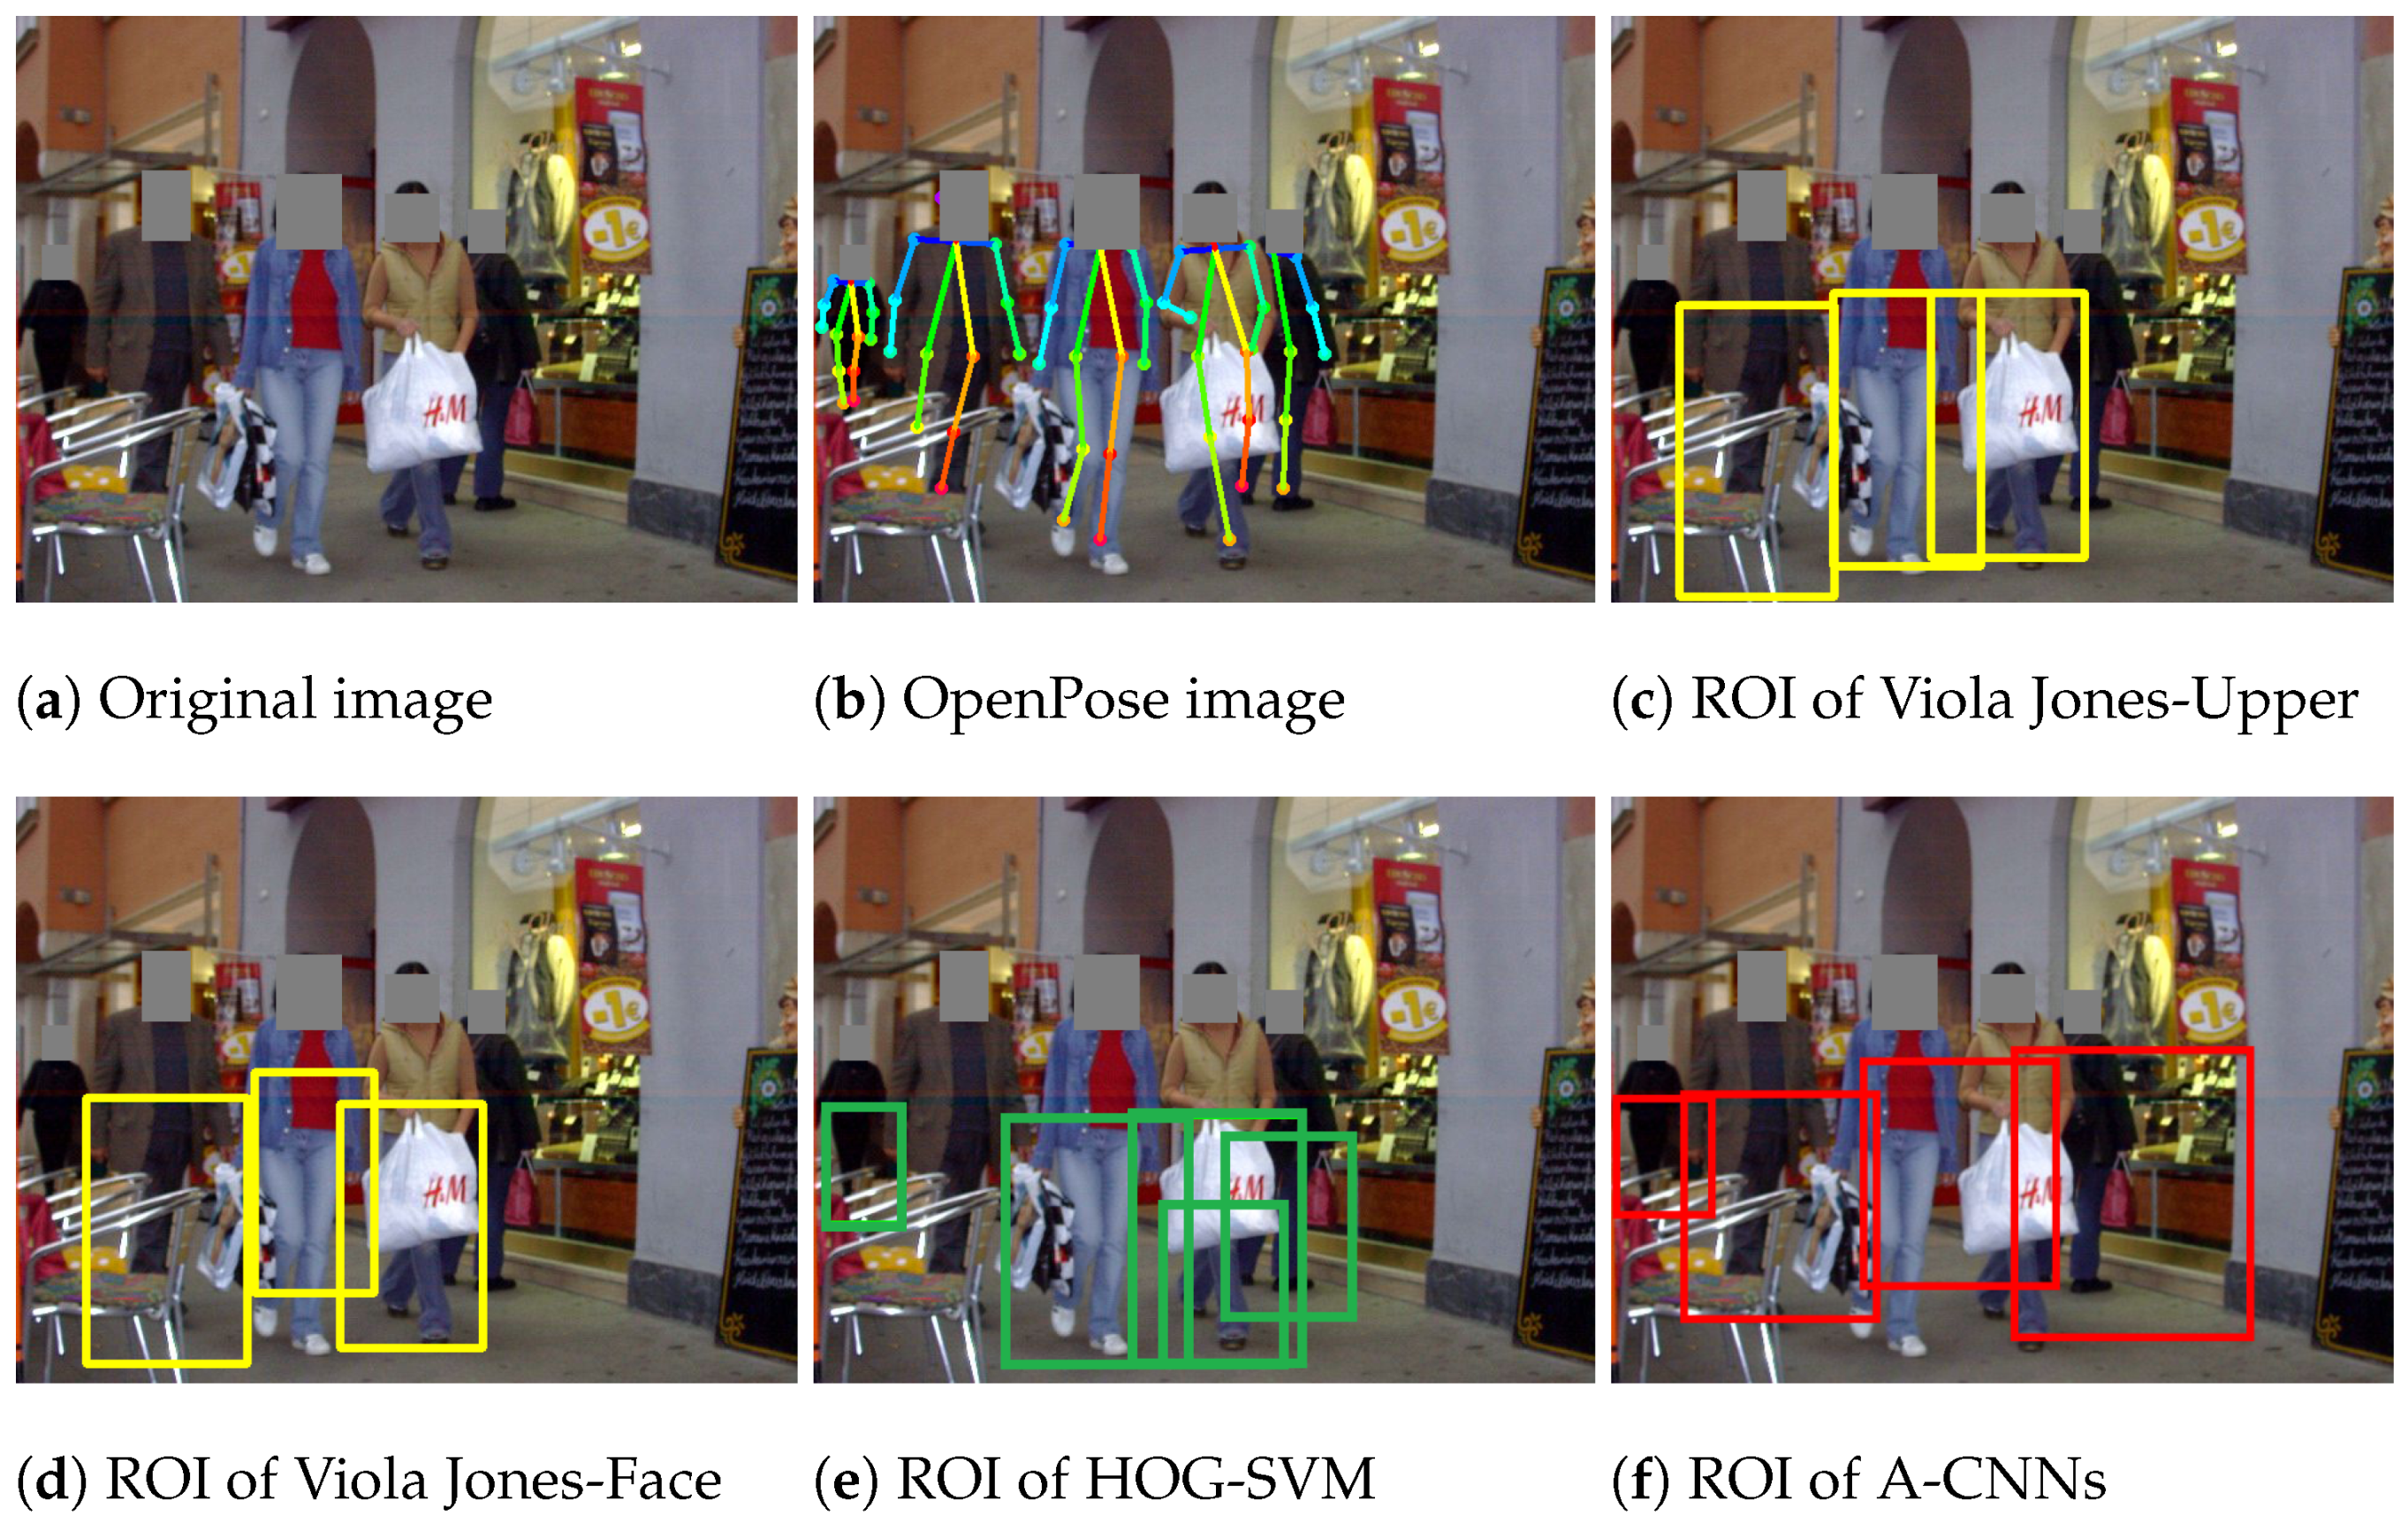
Case of multiple people: There may be more than one person in an image [
49,
51], such as in public sightseeing images or shopping mall images. Some algorithms can support multiple detection [
11,
12].
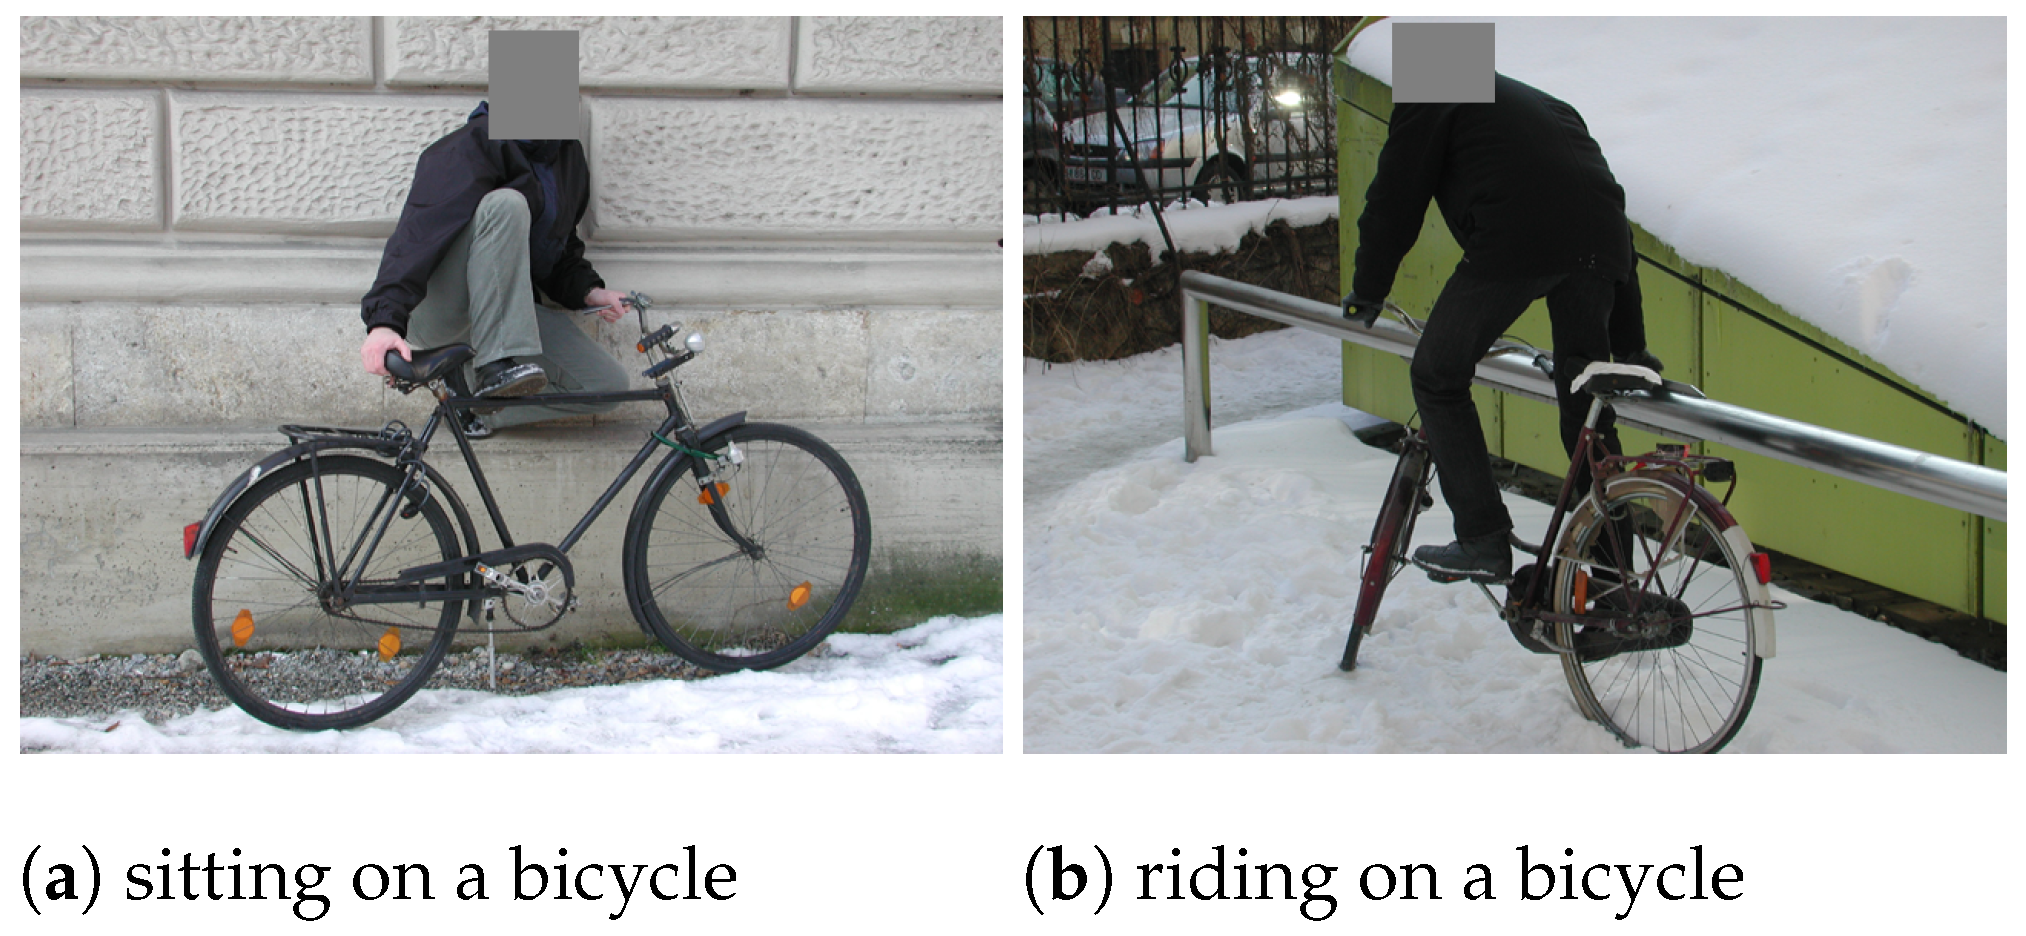
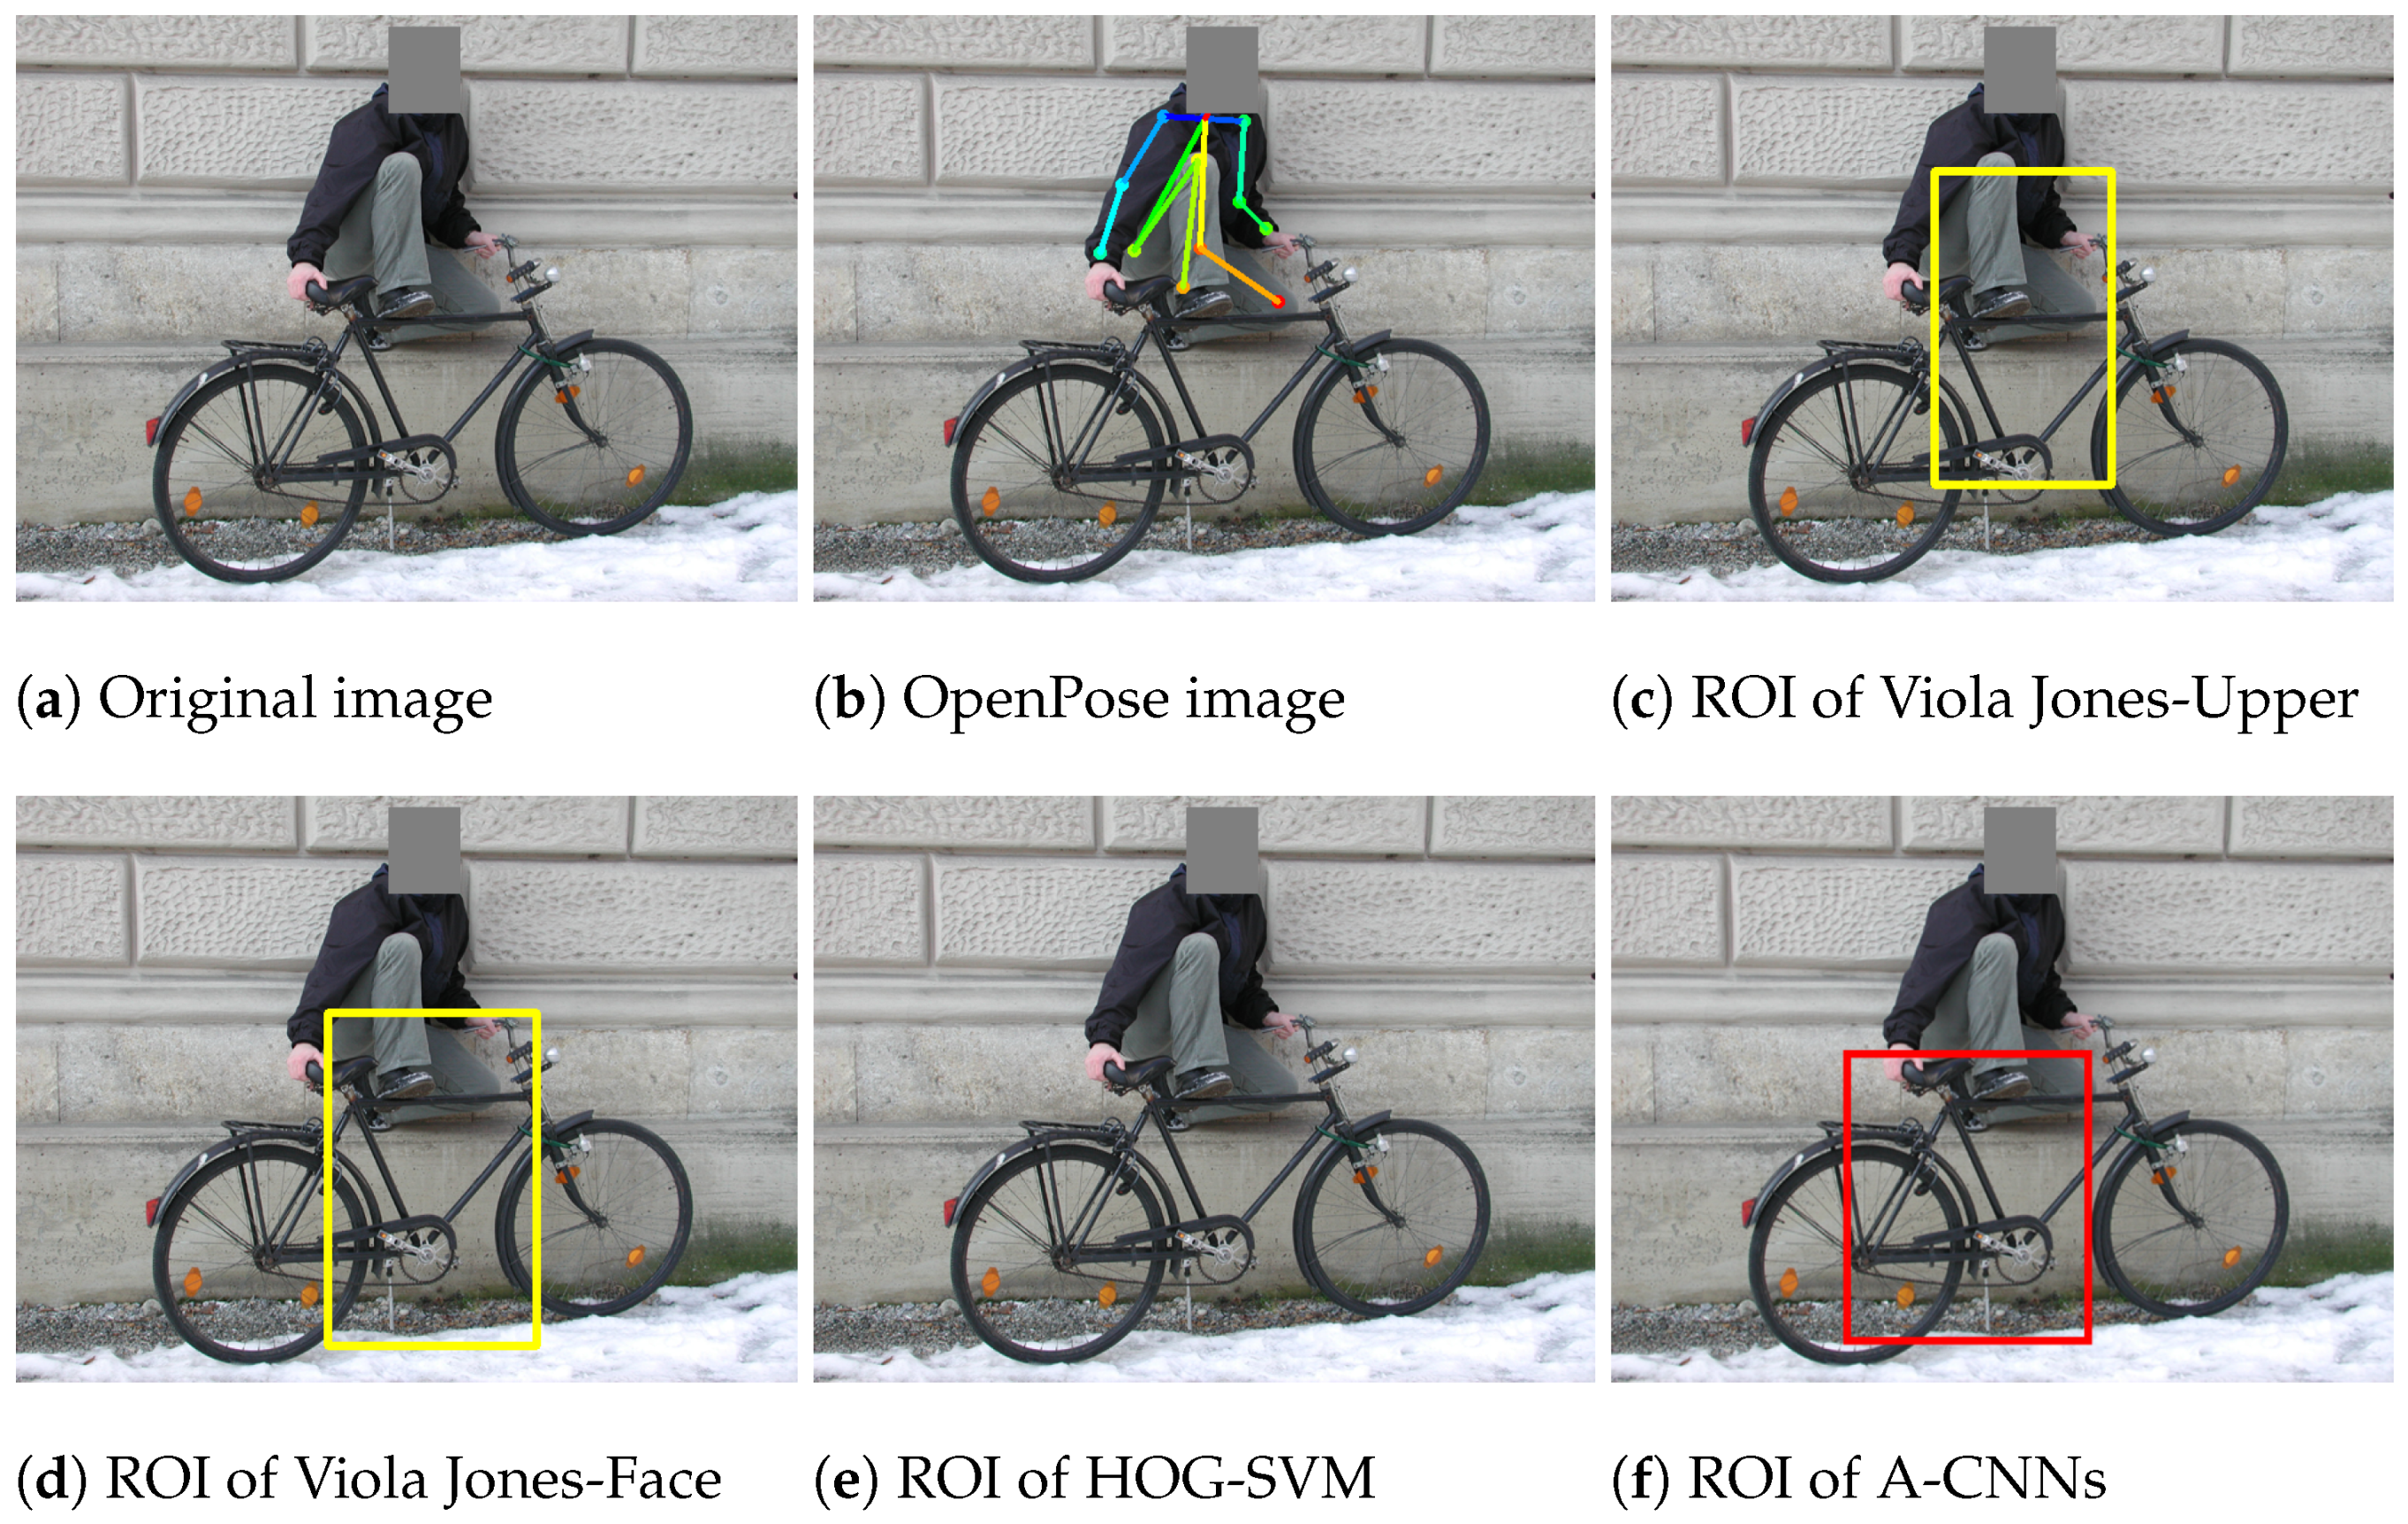
Case of a difference in pose between the training and test images: A pose refers to the gesture or posture of a human in an image. For a test image depicting a person in a pose that does not appear in the training images [
52], it may be difficult to detect whether the ROI is human or not human because it is not sufficiently similar to the training images [
11].
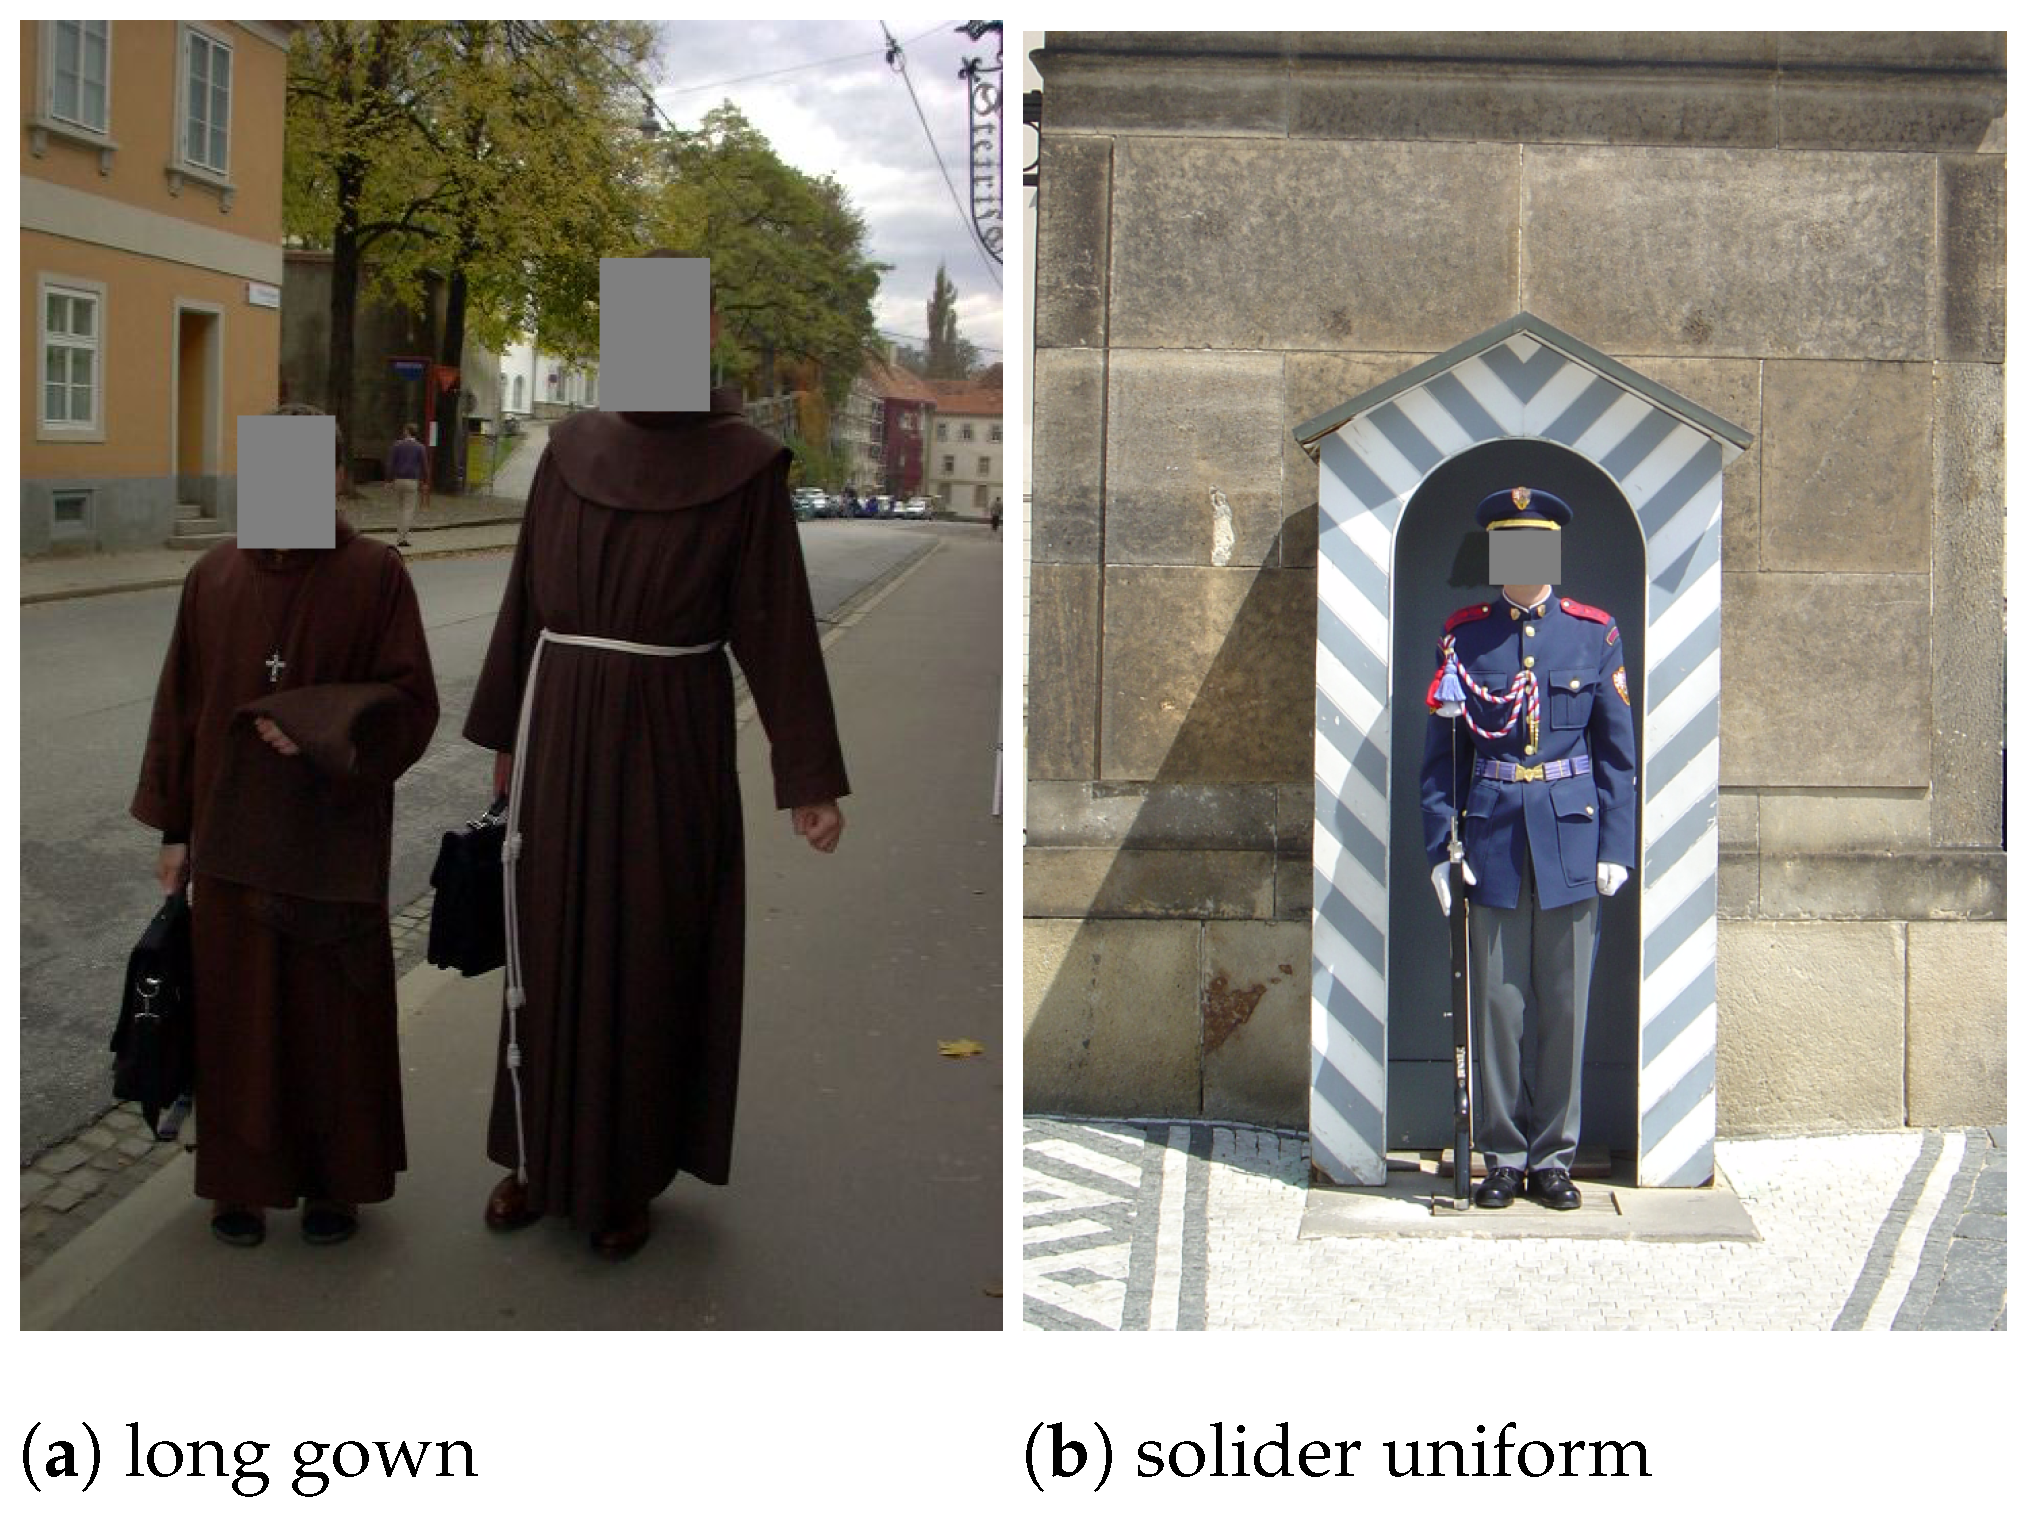
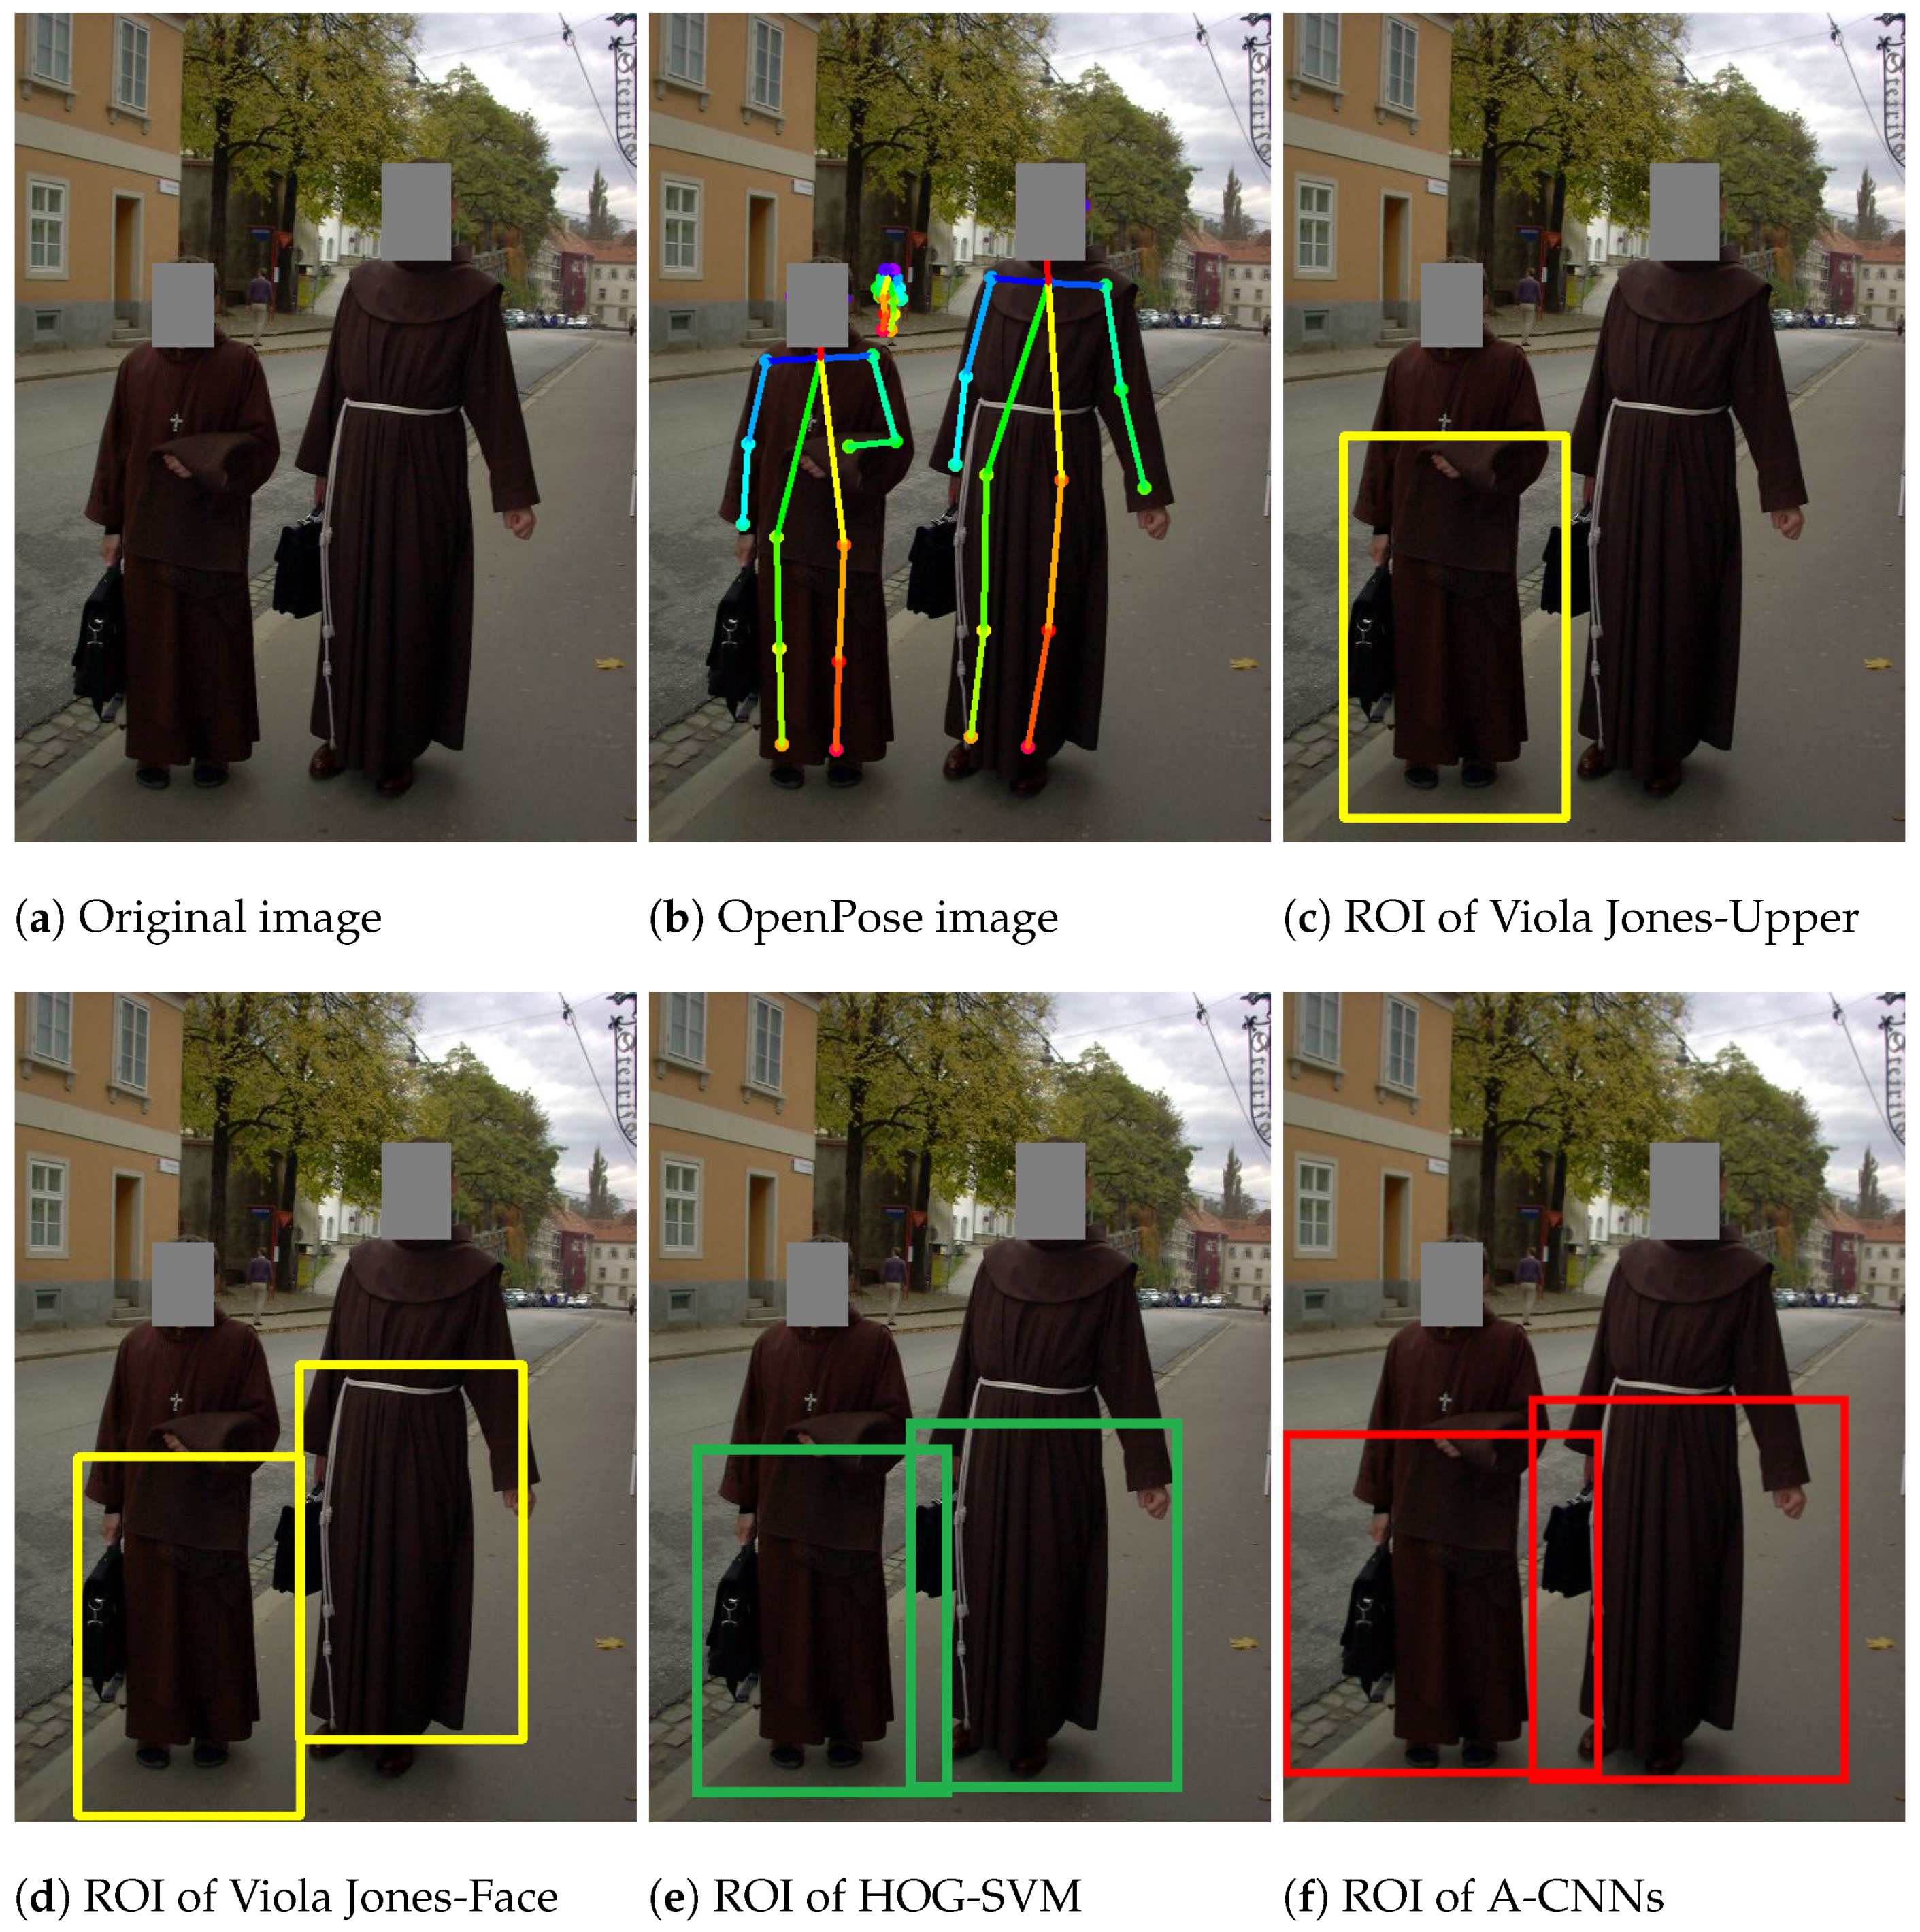
Case of different clothes: People in images may wear clothes of many different colors, sizes, and styles as well as different accessories [
53]. Sometimes, certain clothing characteristics may make it difficult to identify a human shape.
3.5. Evaluation
To evaluate the lower-body detection performance of the frameworks, the confusion matrix [
54,
55] and complexity were used as performance measures. The difference image cases listed above were also analysed to investigate their influence on the detection ability.
Table 3 presents the confusion matrix used for the evaluation of the frameworks. The columns represent a framework’s detection results, and the rows represent the actual class. The entries in
Table 3 are defined as follows:
denotes the number of images in the human data set that are correctly detected to contain at least one lower-body ROI.
denotes the number of images falsely identified as non-human images in the human data set.
denotes the number of images in the non-human data set that are falsely detected to contain at least one lower-body ROI.
denotes the number of images correctly identified as non-human images in the non-human data set.
The performance of a framework on detection problems can be measured based on the confusion matrix. This paper focuses on three measures: sensitivity, specificity, and accuracy. Their equations are given in
Table 4. The first common measure of detection performance is the accuracy. It can be used to evaluate the overall efficiency of a framework. Meanwhile, the sensitivity measures the accuracy of human detection in human images (positive images), whereas the specificity measures the accuracy of non-human detection (negative images).
The complexity of each framework, reflecting the complexity of the algorithm used for detection, was also investigated.
The parameters used for VJ detection in these experiments were in the same scale range as in a previous experiment [
12]. For face detection, the minimum window size was
pixels, and for upper-body detection, the minimum window size was
pixels. For the extraction of HOG features, the window size was
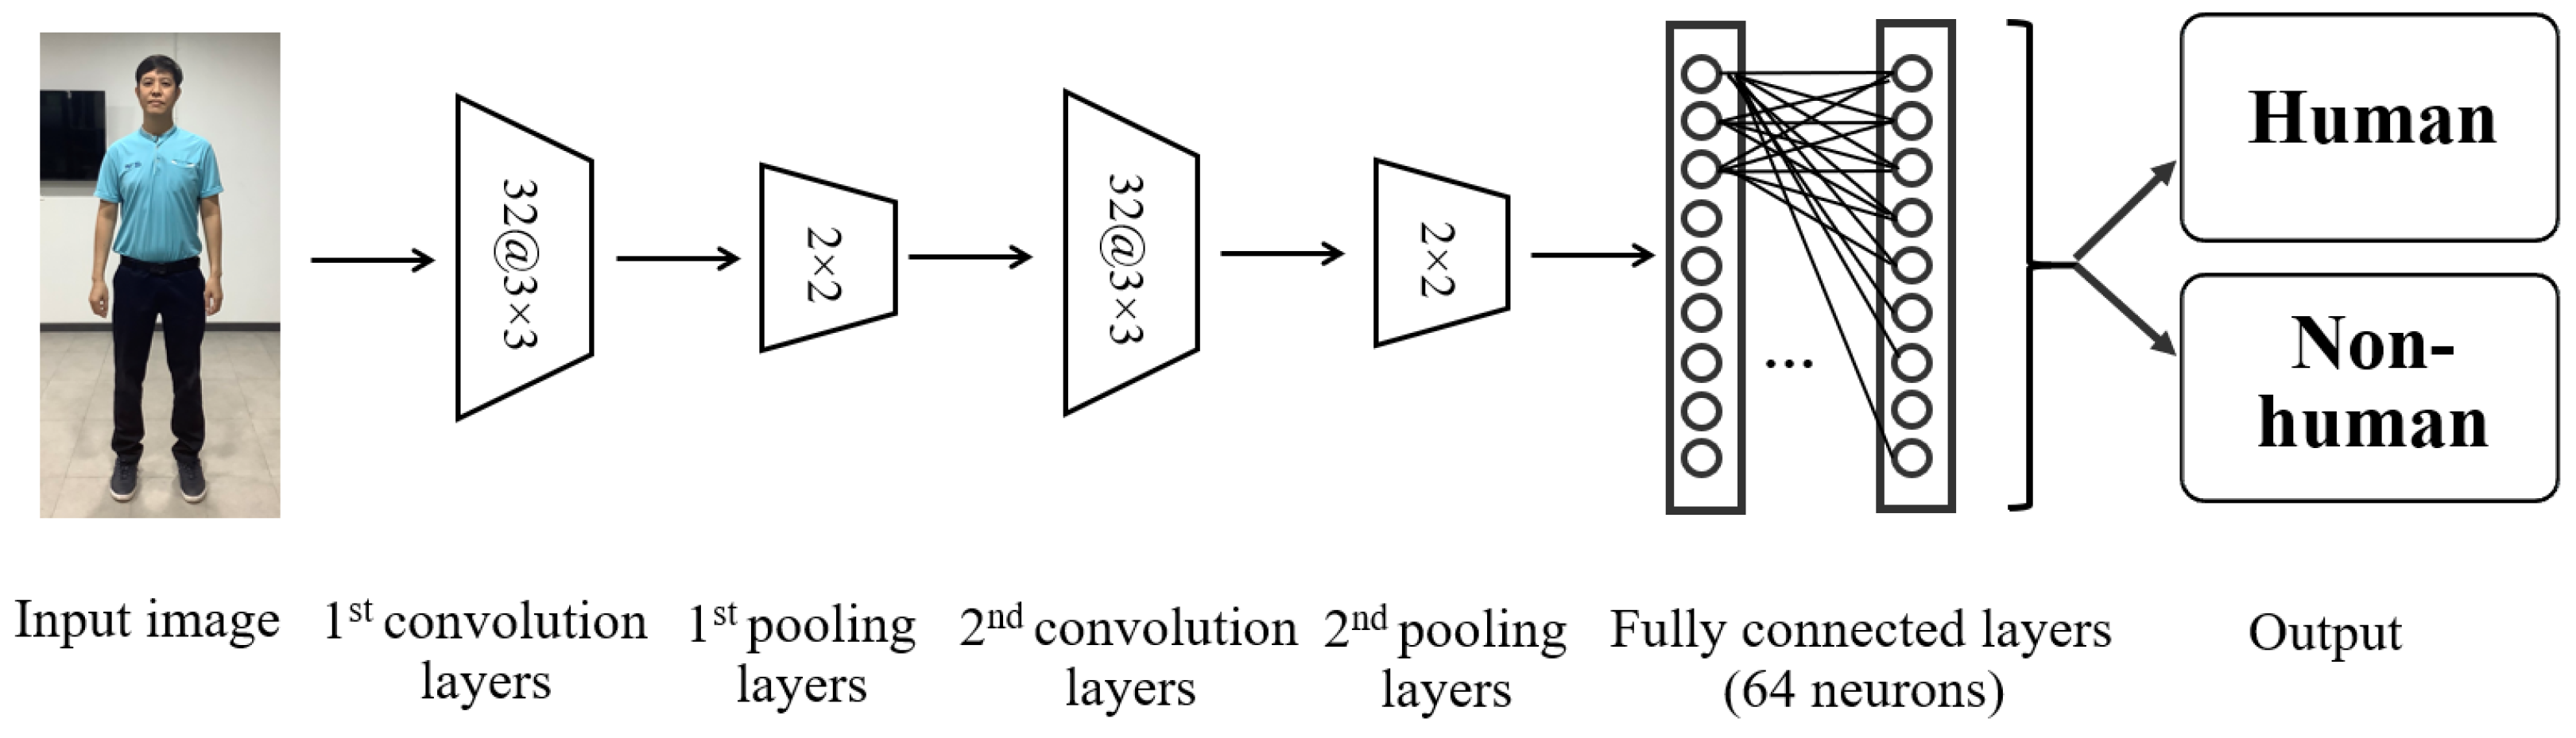
pixels. The CNNs model was modified from Chakrabarty and Chatterjee experiment [
56]. The customized model comprised two pairs of convolutional and pooling layers, each with 32 filters with dimensions of
. A final fully connected layer with 64 neurons was used to classify each input image as human or non-human based on the softmax function, as illustrated in
Figure 21. In the case of the OpenPose, a pre-trained model was deployed to human pose estimation with six stages as in a previous experiment [
45].
5. Discussion
In this section, lower-body detection with the proposed anthropometric ratios is discussed from three perspectives: accuracy, complexity, and different image conditions.
According to the results in
Table 5, the proposed anthropometric ratios can be used to scale other detected parts of the human body to obtain lower-body ROIs. In addition, the A-CNNs, OpenPose and HOG-SVM methods achieve success in lower-body detection with high sensitivities of more than
because they can successfully detect and transform human shapes under various lighting and occlusion conditions. Regarding specificity, the
algorithm provides higher specificity than the other methods for detection on the non-human data set because most background images consist of scenes such as sightseeing locations and mountains; therefore, the Haar-like rectangular templates rarely match these backgrounds. Regarding the performance of A-CNNs, it is sometimes not fair to use such background data sets in deep learning unless the background images are further categorized into subclasses, such as trees, appliances and buildings. To enhance the detection performance, a similar problem has been solved by using a one-class classifier based on a CNNs [
57]. OpenPose was trained on the COCO data set [
58], which contains images of two hundred fifty thousand people with keypoints [
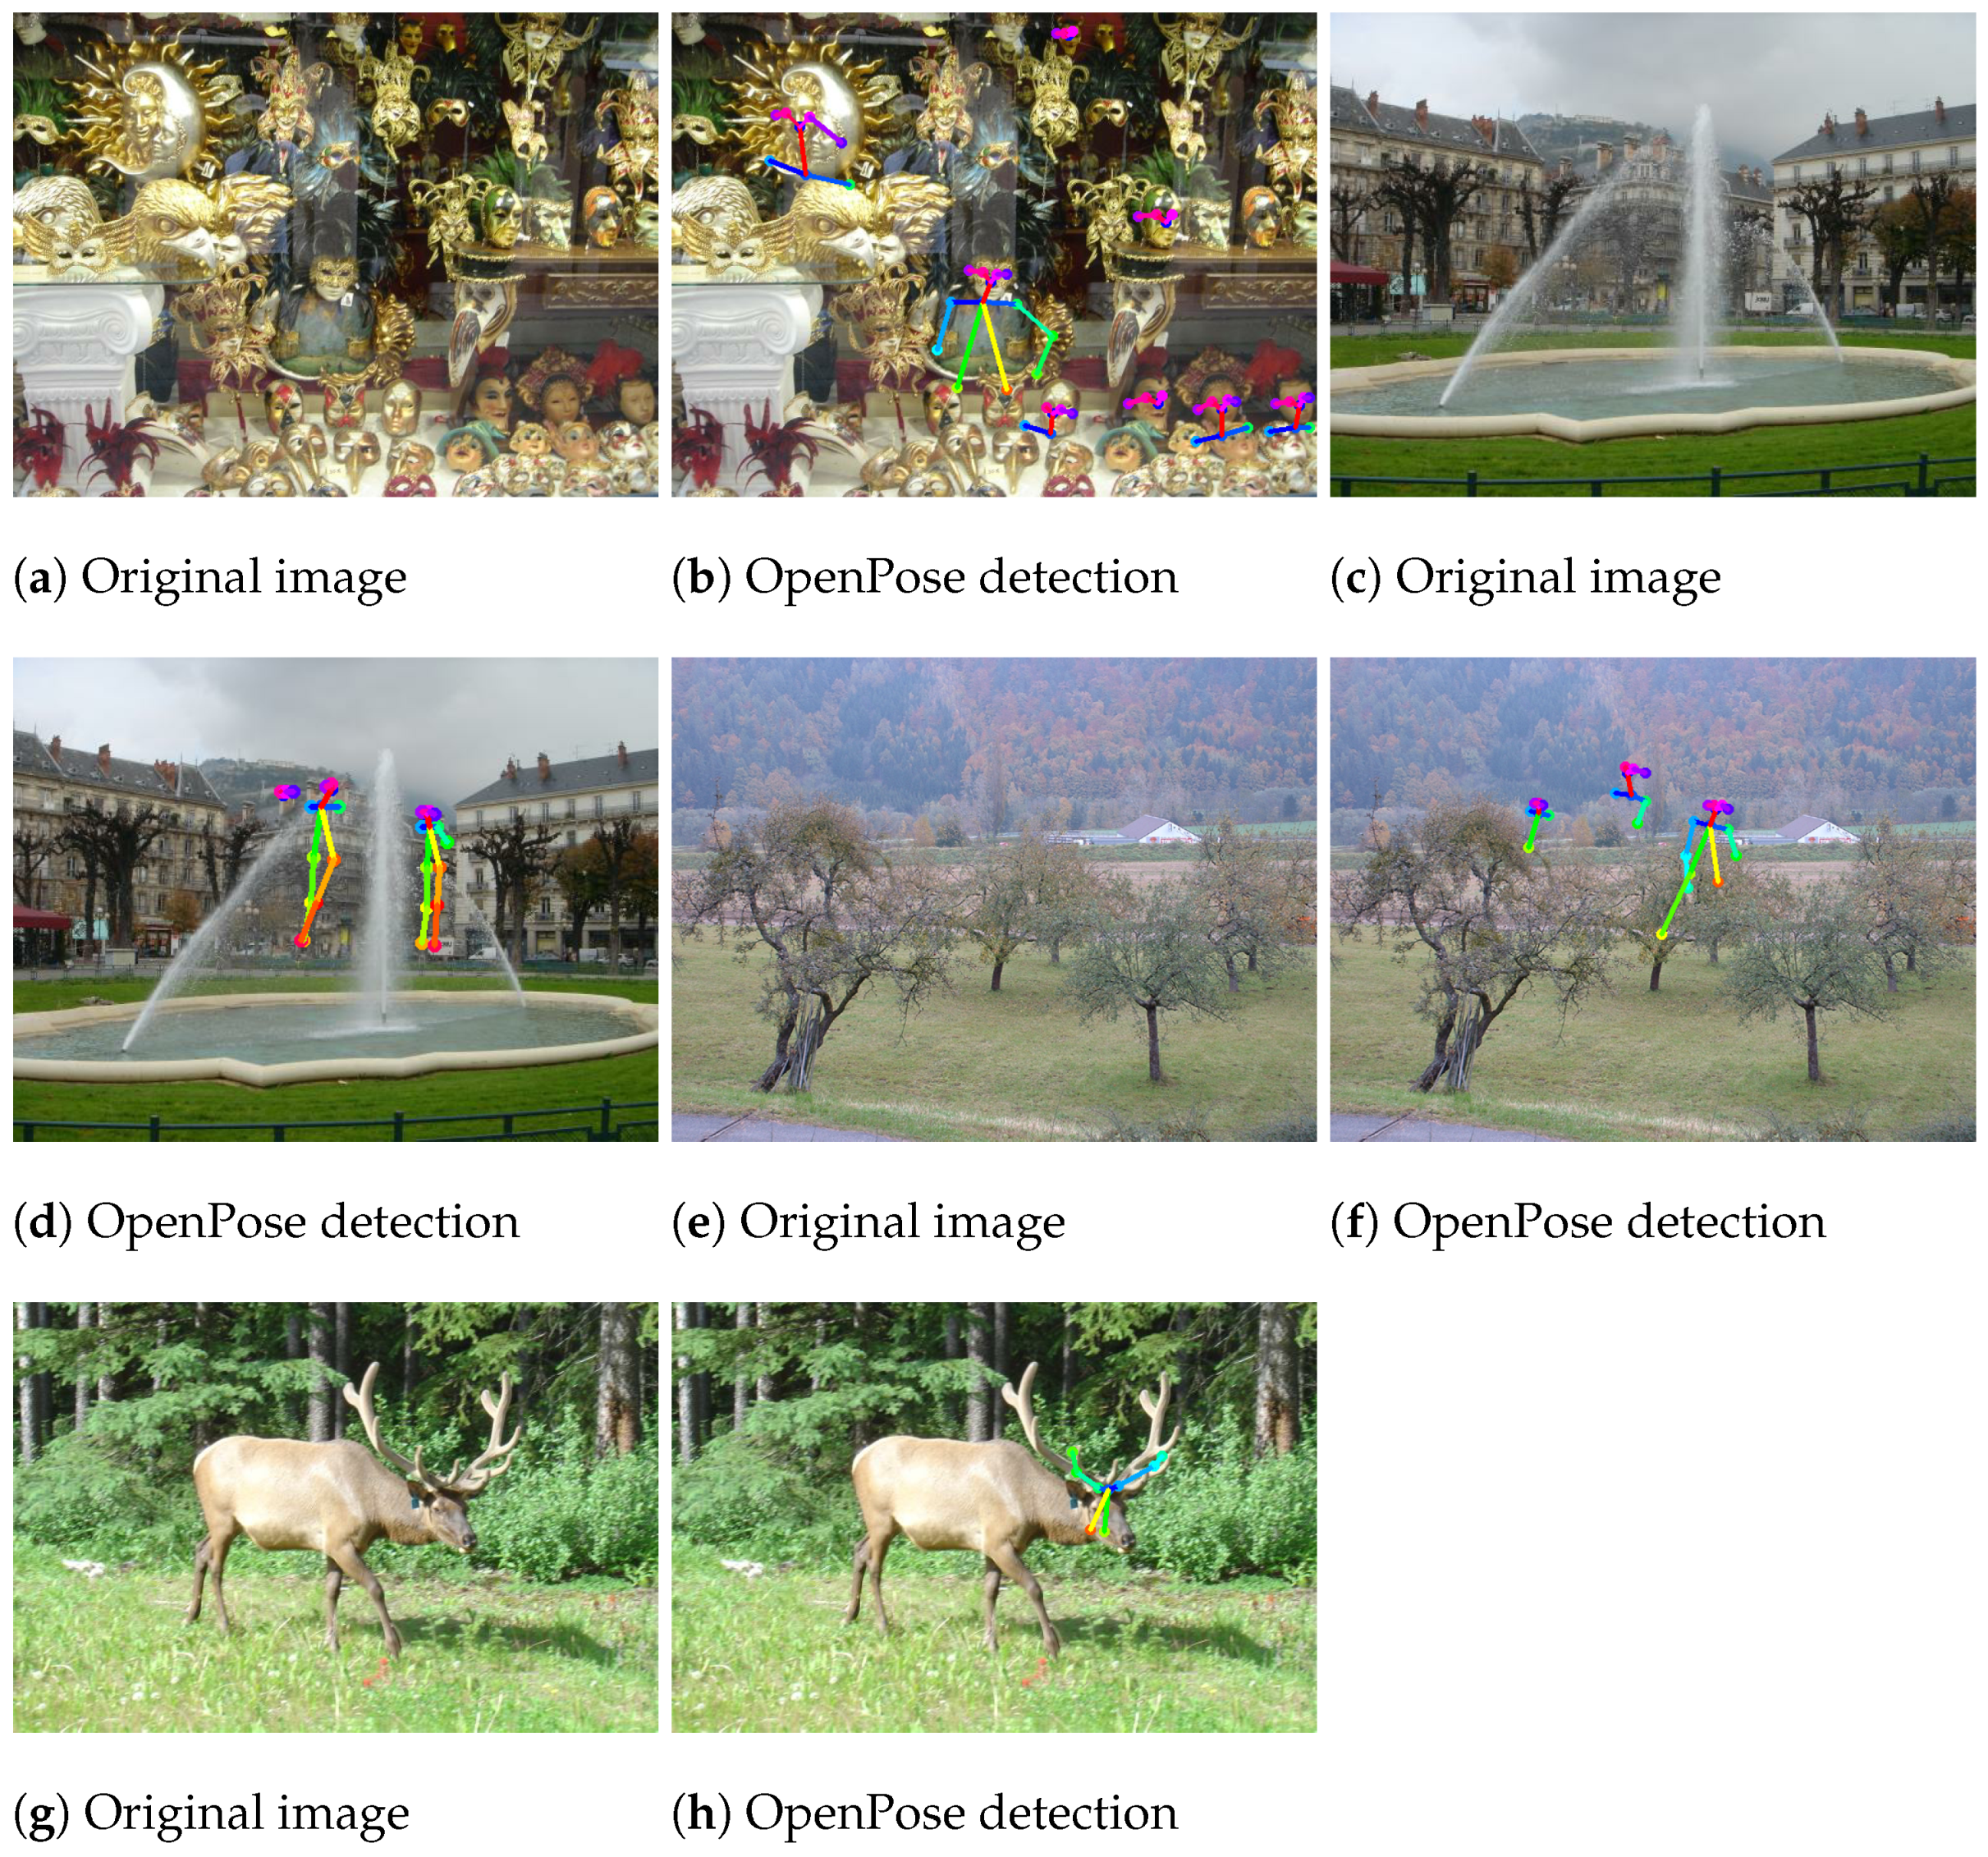
45]. Consequently, it seemed to provide the highest detection accuracy on the INRIA data set in this experiment. However, our A-CNNs model, which was trained on human body ROIs, could achieve higher specificity than OpenPose, which was trained on keypoints. According to
Figure 22, OpenPose seems to be more suitable for human detection in a plain room than for application in an outdoor environment for exercise monitoring. For the purpose of lower-body detection, lower-body ROIs are based on the proposed anthropometric ratios, while OpenPose focuses on body keypoints, which need more optimization than lower-body ROIs based on the NASA Anthropometry and Biomechanics data [
21]. Moreover, the proposed anthropometric ratios can also be modified for use in locating different parts of the body, such as the thigh, leg, and foot, to monitor lower-body activities without any need to retrain the A-CNNs model. In contrast, OpenPose would need to be retrained on a data set containing new keypoints for the detection of different body parts.
According to the results in
Table 6, the
and
algorithms have relatively low complexity because they can reduce the complexity of the general algorithm from
to
based on the integral image calculation. Then, the complexity of the cascaded classifiers (with M filters and T thresholds) is
. Therefore, the final complexity of the VJ algorithm is
. In the case of HOG-SVM, the complexity of the HOG feature calculation is
, which is multiplied by
(the number of features). The
complexity of the HOG calculation is high because of the iterations over
,
and
. If the dimensionality of the HOG features is not minimized to reduce the scale of
, this algorithm might be too complex to be suitable for on-line detection. Subsequently, the complexity of the linear SVM is
. Hence, the total complexity of HOG-SVM is
. The A-CNNs method has a high classifier complexity, which depends on the number of convolutions. It also requires customizing a model to achieve high accuracy. The OpenPose method uses a CNNs model in its three main procedures for human detection. Moreover, the number of stages of each procedure influences the complexity of OpenPose. The number of stages should be optimized to achieve a suitable trade-off between accuracy and complexity [
59].
In the case of different image conditions, although the proposed anthropometric ratios can be used to crop the lower-body regions of human images, this approach is limited to images of humans in a standing posture. In addition, five cases of human detection were discussed as:
Case of challenging lighting conditions: HOG-SVM, A-CNNs and OpenPose yield better detection results than and . The former methods are not sensitive to lighting conditions when the features are in dark images.
Case of occlusion: The HOG-SVM, A-CNNs and OpenPose methods can detect overlapping humans in images. is able to detect some of the human targets in the image considered in this example, but is not because the faces of the humans in this image are rotated around the vertical axis.
Case of multiple people: Most methods can detect the lower bodies of the people in this image because the other characteristics of this image are beneficial, such as good lighting, full visibility of the upper bodies and a frontal view of the faces.
Case of a difference in pose between the training and test images: HOG-SVM cannot detect the lower-body of the person in this image because it depicts a human sitting on a bicycle and thus is not similar to the positive training images, i.e., standing human images. The A-CNNs uses the softmax function for classification, so the result is expressed in the form of a probability value expressing how close the input image is to the training images, whereas the OpenPose still can detect human keypoints because of the variety of postures used for training from the COCO data set [
58].
Case of challenging clothes: The HOG-SVM, A-CNNs and OpenPose methods can detect the lower bodies of the people in this image because they still have human-looking shapes. can also detect the lower-body regions because there is no occlusion of the faces, while can detect one of the two humans in the image.
6. Conclusions
This paper proposes anthropometric ratios for use in combination with either deep learning or traditional methods for lower-body detection in images captured under various environmental conditions. As seen from the results, the proposed framework can be beneficial for transforming some parts of the human body into corresponding lower-body ROIs; however, it is limited to images of humans in a standing posture captured from a frontal view only. Furthermore, in the deep learning methods, A-CNNs () and OpenPose () achieve higher accuracy than the averaged A-Traditional methods () despite challenging illumination and occlusion conditions. However, the complexity of OpenPose, which depends on the number of nodes, layers, and stages, is higher than A-CNNs. In future work, anthropometric ratios suitable for various human postures will be studied. The specific data set provides the image conditions such as illumination conditions, occlusion, multiple people, the difference in posture, and a variety of clothes that will be tested. Furthermore, the A-CNNs model will be optimized its parameters for human body detection in a wide variety of scenarios. Additionally, the detection framework will be combined with a tracking system for faster monitoring of lower-body activities.


