Article

The Effects of Photobioreactor Type on Biomass and Lipid Production of the Green Microalga Monoraphidium pusillum in Laboratory Scale

1
Department of Hydrobiology, University of Debrecen, H-4032 Debrecen, Hungary
2
Egis Pharmaceuticals PLC, H-9900 Körmend, Hungary
3
Functional Algology Research Group, Department of Tisza Research, Institute of Aquatic Ecology, Centre for Ecological Research, H-4026 Debrecen, Hungary
4
Department of Botany, University of Debrecen, H-4032 Debrecen, Hungary
*
Author to whom correspondence should be addressed.
Appl. Sci. 2022, 12(4), 2196; https://doi.org/10.3390/app12042196
Submission received: 19 January 2022 / Revised: 14 February 2022 / Accepted: 18 February 2022 / Published: 20 February 2022

Abstract

:
Mass production of microorganisms, algae among them, for new bioactive compounds and renewable innovative products is a current issue in biotechnology. The greatest challenge of basic research on this topic is to find the best solution for both physiology and scalability. In this study, the main goal was to highlight the contradictions of physiological and technological optimization in the same, relatively small, laboratory scale. The green alga Monoraphidium pusillum (Printz) Komárková-Legnorová was cultured in a conventional Erlenmeyer flask (as air bubbled in a tank-type photobioreactor) and in a hybrid (fermenter type + helical tubular type) photobioreactor of the same volume (2.8 L). Higher cell numbers from 1.7–2.3-fold, 2–2.8-fold higher dry masses, and 1.9–2.6-fold higher total lipid contents (mg·L−1) were measured in the tank reactor than in the hybrid reactor. Cultures in the conventional tank reactor were characterized with better nutrient utilization (42.8–77.7% higher phosphate uptake) and more diverse lipid composition than in the hybrid reactor. The study highlights that well-scalable arrangements and settings could be not optimal (or unsuitable in some cases) from a physiological point of view. The results suggest certain developmental directions for complex, well-scalable devices and highlight the importance of testing the gained physiological optima on these systems.

1. Introduction

Cyanobacteria and eukaryotic microalgae produce an extremely large number of currently largely unknown metabolites that could be potentially useful in some fields of biotechnology. Only about 10% of known cyanobacteria and eukaryotic microalgae have been isolated and cultured in the laboratory, and the biomass or metabolites of only about 10 species were commercially available to the end of the 20th century [1]. Since then, the demand for new bioactive compounds and innovative products is constantly increasing.
Microalgae for human and animal consumption have long been obtained from natural sources, and this method is still used by some commercial and healthcare companies. In this case, although there is no cost of culturing, adequate productivity and product quality are not ensured [1,2]. These problems can be eliminated by mass production in artificial systems. Obviously, the more complex the artificial system, the higher the production costs, and thus, the market price of the product.
The main problem in the cultivation of photosynthesizing microorganisms, including algae, is providing the right amount of light energy since in photoautotrophic cultures, the other necessary factors (carbon source, nutrients, temperature) are more readily available in a controlled environment [1]. Algae cells can absorb light very efficiently, so light can be absorbed completely within a few mm in the culture, even at very low densities. Therefore, during the design of culturing systems, the main goal is keeping the thickness of the medium to a minimum and the surface area to a maximum [1,3,4].
Products from microalgae cultured in open ponds can usually only be used as dietary or feed supplements/additives since the exclusive presence of the algae strain, and the purity of the desired product cannot be guaranteed. This excludes biomass and products from markets where high purity is essential [5]. The application of open ponds for production is also hampered by the fact that in order to maintain the monoculture, usually extreme conditions (e.g., high salinity, unusual nutrient conditions) have to be established, which significantly reduces the number of microalgae species that can be taken into account. The need to culture microalgae living under average conditions in monoculture has led to the development of closed photobioreactors [6]. Photobioreactors can be most simply described as illuminated, closed vessels in which biomass is produced under controlled conditions. Algae are not in direct contact with the environment, so there is no possibility of unwanted gas exchange, contamination, or evaporation of the culturing medium [2].
The most important factor to consider during a photobioreactor design is the introduction of sufficient light and proper mixing, preferably in all parts of the device [7]. Two secondary problems also arise from the primary one: scaling up and sterility. Scaling up requires keeping a small layer thickness and a large surface area to receive sufficient light for the algae. Besides this, adequate mixing, sufficient gas supply, sterilizability, and adequate productivity should be maintained. Despite these difficulties, there are many experimental and a few industrially applied designs [8,9].
Nowadays the most common and most widely used types are tubular photobioreactors. Basically, these tubes are made of transparent material (glass or plastic) installed with a wide range of complementary equipment [10,11]. They have good light distribution [12] and are considered particularly suitable for outdoor mass production [11]. The tubes can be placed horizontally, vertically, tilted, or coiled in some form (cylinder, cone; [10,11,13,14,15,16,17]). The diameter of the tubes is usually up to 0.1 m due to the limited light transmission of dense cultures [10,11], and their length does not exceed 80 m in the presence of a degasser. The longer the tube, the more difficult the gas exchange, resulting in the loss of productivity [18].
Fermenter-type reactors are modifications of well-known bioreactors developed for heterotrophic organisms. Because the development started from the fermenter, in which the control of the processes is well designed, all growth parameters can be controlled with high accuracy. Nowadays, these types are mainly used in optimization processes, and in the case of scaling up, the limiting factor is the relatively poor area-to-volume ratio. Stirring is usually accomplished with a stirring paddle or magnetic stirrer. There are a wide variety of devices within this type, with the usual goal to improve the area-to-volume ratio [19].
Hybrid photobioreactors are devices that combine two or more photobioreactor configurations to take advantage of each selected ones and minimize or even eliminate the disadvantages of each arrangement [2,8]. Hybrid reactors are often a combination of a conventional tank-type reactor and a tubular part. The conventional part is for control over culture variables: it makes it possible to integrate probes to finely regulate culturing circumstances. On the other hand, this part also acts as a degassing system. The tubular part acts as a light-harvesting unit since it provides a high surface area to volume ratio [2,8]. The conventional part usually is an airlift or bubble column reactor [8], while the tubular part can be horizontal parallel sets of tubes [20] or a loop-like structure [21,22]. On a laboratory scale, hybrid reactors are also constructed from an airlift, bubble column or fermenter, and a (generally helical) tubular part; several configurations are available in the commercial market. Although both parts of these hybrid reactors have their limitations in scalability, they are applied on an industrial scale [8].
Developments of photobioreactors are mainly related to the industrial sector (companies); 43% of the patents are linked to this sector. The participation of single contributors is very significant; 22% of registered patents are the result of individual development. The participation of research institutes in technological development is about 15%. There is little overlap between sectors: 12% of research institute patents have been filed with firms, other joint applications are even rarer [23]. Collaborations, proper communication, and scientifically demanding analyses of the effectiveness of different reactor types would be essential to develop increasingly economical production systems.
Species of the green algae family Selenestraceae are now among the most promising groups of algae from a biotechnological point of view. Although various isolates of other species, such as the genera Spirulina or Chlorella, preceded the industrial use of Selenestraceae species for decades, more promising results are being obtained about them today [24]. Monoraphidium braunii, recently referred to as Chlorolobion braunii [25], has been one of the “most popular” since the 1990s. Research focuses on transport systems that are responsible for CO2 and, in this context, nitrate uptake, as they play one of the most significant roles in biotechnology applications [26,27,28,29]. In addition, enzymes with different functions also reveal a lot of information about the function and physiology of microorganisms of similar structures [30,31,32,33,34]. An important area related to the use of Monoraphidium species is their sensitivity to metals, their possible role in bioindication, and/or bioremediation [35,36,37,38]. In addition, their resistance to other substances also makes the Monoraphidium species promising in phytoremediation [39]. In addition to their potential contaminant removing ability, their metabolic products also attract interest to Monoraphidium species [24,40].
In the present study, the goal was to compare the effects of the bioreactor type on biomass and lipid production of a Monoraphidium pusillum (Printz) Komárková-Legnorová strain. The green alga was cultured in the same volumes in conventional Erlenmeyer flasks (as air bubbled or sparged tank-type photobioreactor) and in a hybrid (fermenter-type + helical tubular type) photobioreactor on a laboratory scale. The main goal was to examine possible contradictions of physiologically and technologically optimal conditions in the same relatively small, laboratory-scale (basic research state). We aimed to answer the following questions:
  • Are there significant changes of the main physical and chemical parameters in the two different types of photobioreactors in the same (laboratory) scale;
  • Does culturing in a hybrid-type reactor result in the production of more biomass than using a conventional culturing method at the same (laboratory) scale;
  • What is the efficiency of nutrient uptake in different types of photobioreactors in the same (laboratory) scale;
  • How is the lipid composition of biomass influenced by the reactor type;
  • Which technological parameters are the most important to ensure more efficient biomass and lipid production?

2. Materials and Methods

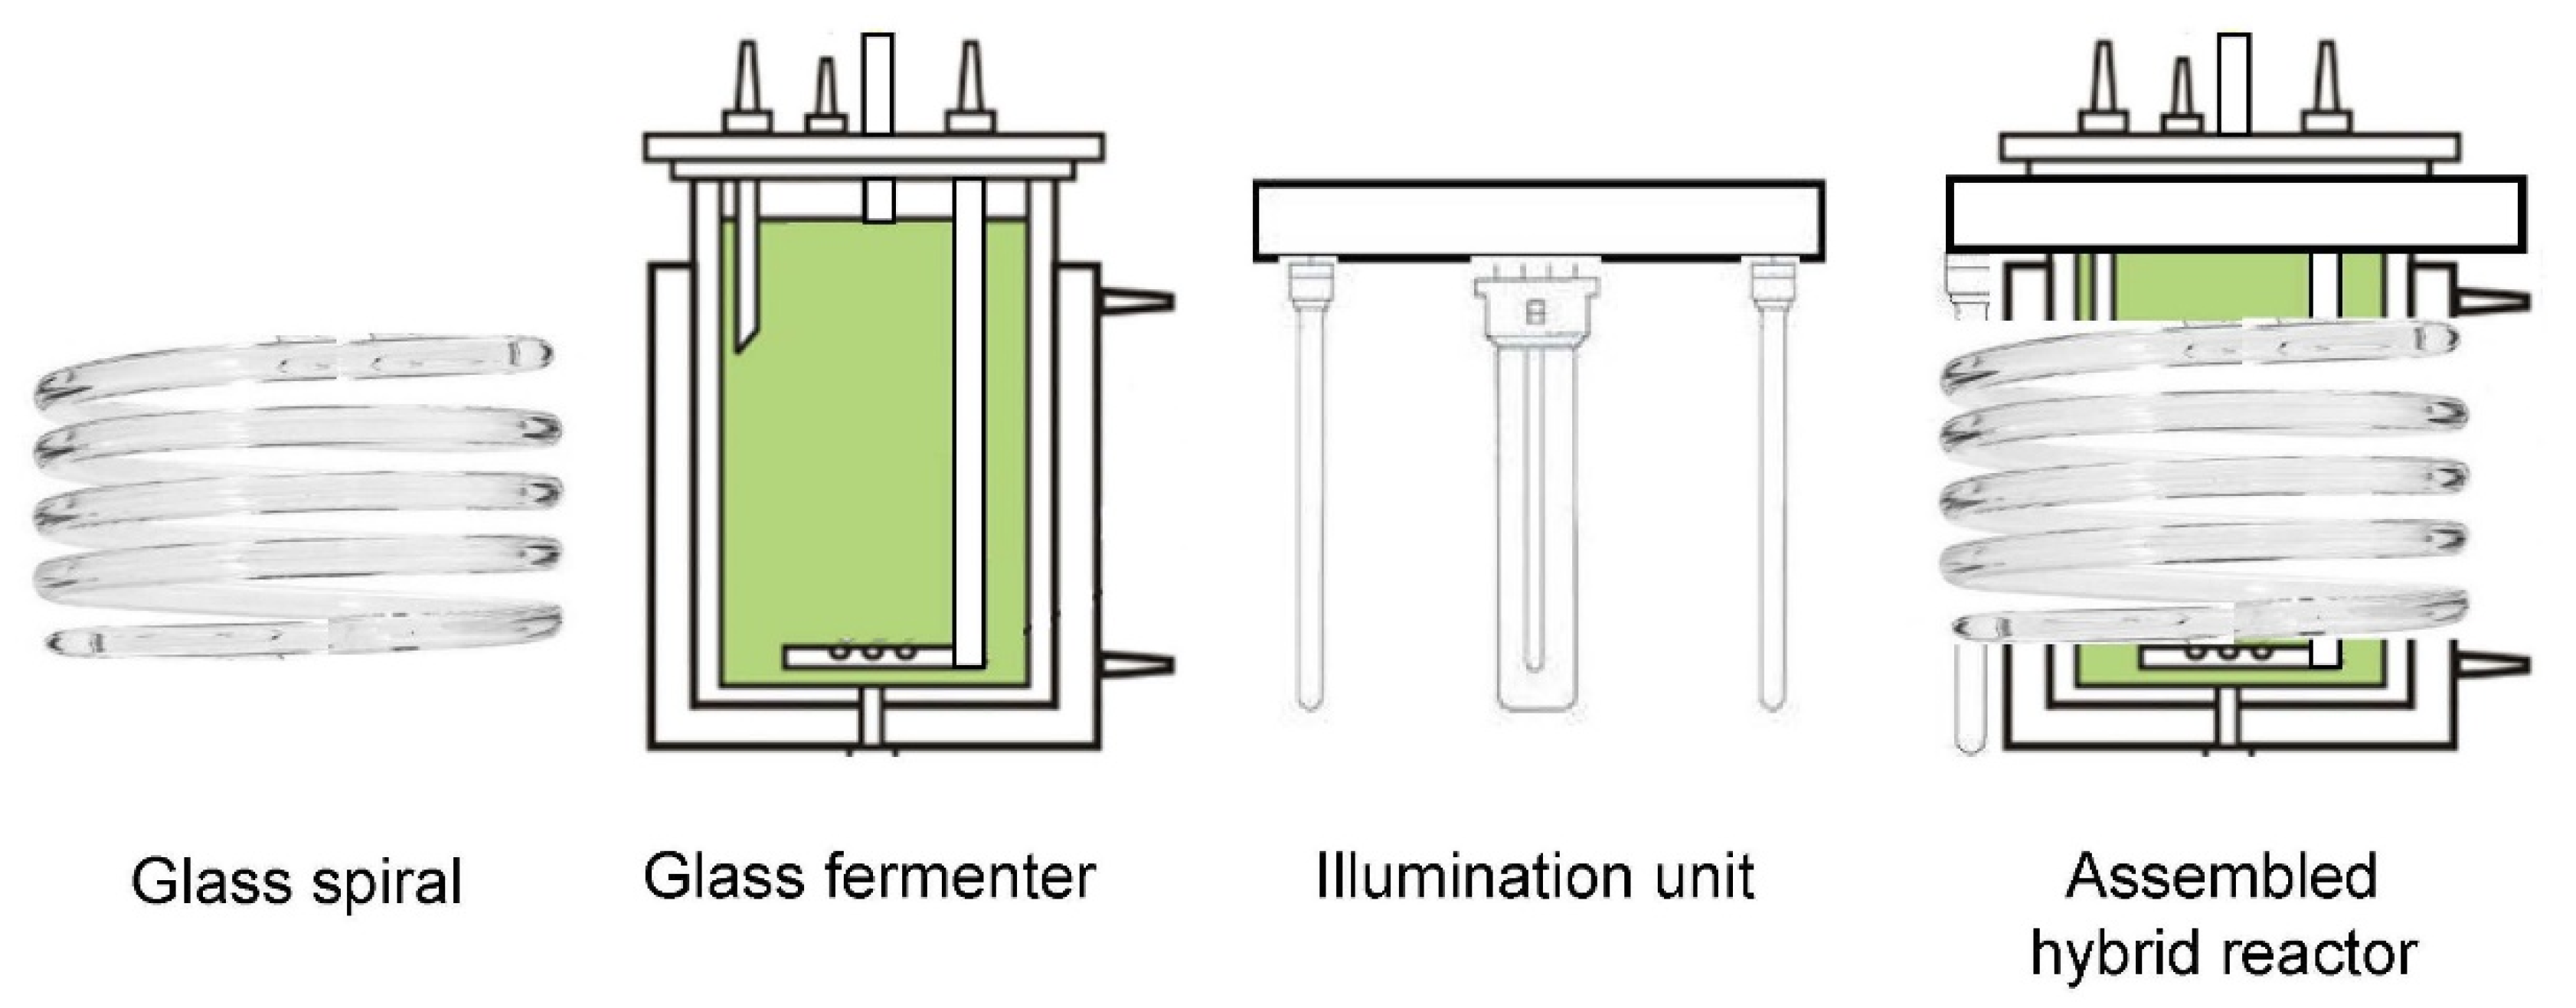
2.1. Algal Strain and Experimental Setup

The experiments were performed with the green alga Monoraphidium pusillum (Chlorophyceae, Sphaeropleales) available in the Algal Culture Collection of the Department of Hydrobiology, University of Debrecen (ACCDH-UD0911).
The algae were cultured in a hybrid-type photobioreactor with 2800 mL full volume and a 4000 mL Erlenmeyer flask in the same final volume as the hybrid photobioreactor (2800 mL).
The applied hybrid-type photobioreactor was the combination of a fermenter and a helical-tubular reactor. The central part was a conventional fermenter-type reactor body made of glass (1 L in volume). A glass spiral (i.e. a helical tubular reactor) with 20 mm inner and 24 mm outer diameter and ~2 L in volume was placed around the central reactor body (Figure 1). Mixing was provided by a sparger in the central reactor body, responsible for gas supply. The stirring motor was not installed. The whole culture was circulated in the glass spiral by a peristaltic pump (ISMATEC ECOLINE VC-380, Cole-Parmer GmbH, Wertheim, Germany). Illumination was provided by a removable illumination unit: 8 fluorescent lamps (18 W) with 1200 lm luminous flux per lamp in the unit, which was mounted between the central fermenter body and the glass spiral. (Figure 1). The default settings allowed only continuous illumination. The hybrid reactor had a built-in turbidity measuring system. The sensor used light ranging from 840 to 910 nm. The measured values are provided as Absorbance Units (AU). The measurement range is 0–6 AU. The default settings automatically increased the irradiation (given in % of lamp performance) in parallel with the increasing turbidity. The culture temperature was 24 °C.
The Erlenmeyer flask was considered a column or tank-type photobioreactor, and the culture was bubbled with sterile air (it served as carbon source and mixing) and kept under continuous irradiation (40 µmol photons m−2 s−1; Osram Lumilux T8 L 36W/865 Cool Daylight and 36 W/830 Warm White fluorescent lamps) at 24 °C.
Cultures were maintained in Jaworski’s medium [41]. Biomass and lipid production was studied in control and in nitrogen depleted cultures (with 75, 50, and 25% nitrate contents considering 100% the nitrate content of the control culture) in both reactor types. The duration for each experiment was 7 days.

2.2. Measurement of Culture Growth

Samples of 10 mL were taken daily from the cultures. The oxygen saturation and the pH were read in the case of the photobioreactor and measured with a HACH HQ30d flexi multimeter (Hach Lange GmbH, Düsseldorf, Germany) in the case of both reactor type for better comparability. Cell number was counted in the Bürker chamber using an Olympus BX50 microscope (Olympus Optical Co., Ltd., Tokyo, Japan) at 400× magnification. To monitor changes in dry biomass, 5 mL of the 10 mL samples were centrifuged (5 min, 13,000 rpm, Thermo Scientific Heraeus Fresco 17 centrifuge, Thermo Fisher Scientific Inc., Waltham, MA, USA) in pre-weighed Eppendorf tubes. An Ohaus Adventurer ™ Pro analytical scale (Ohaus Corporation, Parsippany, NJ, USA) was used for mass measurements. Samples were stored at −20 °C until lyophilization. Samples were lyophilized in a Christ Alpha 1–2 LD plus freeze dryer equipment (Martin Christ Gefriertrocknungsanlagen GmbH, Osterode am Harz, Germany), followed by another weight measurement and dry weight calculations. To monitor the change in chlorophyll content of the cultures, the daily collected, lyophilized, and weighed samples were used. The chlorophyll content was measured by the hot methanol extraction method [42].

2.3. Following of Nitrate and Phosphate Contents of the Cultures

Nitrate and phosphate contents were measured spectrophotometrically with a Spectroquant Pharo 300 one-way UV-VIS spectrophotometer (Merck KGaA, Darmstadt, Germany). The nitrate measurement was based on the reaction in which nitrate ions form a yellow compound with salicylic acid (nitrosalicylic acid) in an alkaline medium, with an absorption maximum of 410 nm. The color intensity is proportional to the concentration of nitrate ions [43]. The chemical background of free reactive phosphate measurement shows that orthophosphate ions react with molybdenate ions to form a phosphorus-molybdenate complex, which reduces to a blue compound in sulfuric acid. The reducing agent was ascorbic acid, and the catalyst for the reaction was potassium antimonyl tartrate. The color intensity of the solution can be measured at 885 nm, and it is proportional to the concentration of orthophosphate ions [44]. Both methods were reduced in volume and were carried out in Eppendorf tubes, to minimize sample requirements.

2.4. Detection and Basic Analysis of Lipid-Content

Algal cells were stained with Nile-red fluorescent dye on days 0, 3, and 7 of the experiments. The staining procedure as described by Chen et al. (2009) [45] was used with modifications: The optical densities of the samples were adjusted to 0.400 in a final volume of 1 mL, and then, dimethyl-sulfoxide (DMSO) solution was added to reach 20% final concentration. The samples were then allowed to stand for 10 minutes at 24 °C, and then, Nile red dye solution was added to a final concentration of 8 µg mL−1. The staining time was 30 minutes, and the staining temperature was 40 °C. The incubation was done in a Memmert UF 55 drying oven (Memmert GmbH + Co.KG, Büchenbach, Germany). At the end of the staining time, the cells were examined with an Olympus BX50 fluorescence microscope, and photos were taken by a DP-80 fluorescent digital camera (Olympus Optical Co., Ltd., Tokyo, Japan).
At the end of the experiments, the biomass was collected with a Beckman Avanti J-25 (Beckman Industries Inc., Fullerton, CA, USA) centrifuge (5 min, 5000 rpm), and dry weight was measured in the same way as in the case of the daily samples. To measure the total lipid content, 5 mL chloroform-methanol mixture in a 2:1 volume ratio was added to 0.1 g of freeze-dried homogenized sample, and the samples were stirred on a magnetic stirrer (IKA Combimag RCH, IKA®-Werke GmbH & Co. KG, Staufen, Germany) for 2 h at 24 °C in the dark. The mixture was centrifuged (5 min, 13,000 rpm Thermo Scientific Heraeus Fresco 17 centrifuge), and the solvent was evaporated on a Rotadest Type 2118 (KUTESZ Ltd., Budapest, Hungary) vacuum evaporator at 40 °C. The evaporated material was weighed on an analytical scale (Ohaus Adventurer™ Pro, Ohaus Corporation, Parsippany, NJ, USA).
The preliminary qualitative analysis of lipids was performed by thin layer chromatography [46]. Samples with ~20 µg dry extract mL−1 dry weight concentrations were applied, and 20 µL aliquots were carried to the thin layers as bands. Tripalmityl glycerate (triglyceride containing saturated palmitic acid only) and trioleyl glycerate (triglyceride containing unsaturated oleic acid only) were used as standards (Sigma-Aldrich, St. Louis, MO, USA). The mobile phase was a 100:6 mixture of petroleum ether (40–60 °C) and acetone, which could not elute the more polar lipid-like molecules (pigments, mono- and diglycerides) over long distances in the layer, so the bands between the running heights of the two standards could be differently saturated triglycerides. The run was performed on silica gel impregnated with 2% AgNO3 (silica gel 60 G, 10 × 10 cm, 200 μm thick, Merck, Darmstadt, Germany). Silver reacts with double bonds so that triglycerides containing saturated side chains migrate farther from the start line, while triglycerides containing unsaturated side chains are retained better and move slower. A 10% solution of phosphorous-molybdic acid in ethanol (10 g of phosphorous-molybdic acid in 100 mL of 96% ethanol) was used for development. After sprinkling, the plates were dried at 120 °C for 10 minutes in a drying oven (Memmert UF 55, Memmert GmbH + Co.KG, Büchenbach, Germany). CpAtlas 2.0 (Lazarsoftware, Debrecen, Hungary) software was used for the evaluation of the digital photos taken of the thin layers.

2.5. Statistical Analysis

All experiments were done in triplicate. The data of culture growth, nutrient contents of the culturing media, and lipid contents of the collected biomasses were analyzed by two-way ANOVA and Tukey’s HS D post-hoc test. The method provides information on whether there were significant differences between the individual treatments at each time point and between sampling times within a given treatment. Information of whether there was a significant interaction between time and treatments or if the two factors (time and treatment) were independent from each other was obtained. SigmaStat (4.0) (Systat Software Inc., Chicago, IL, USA) software was used for statistical evaluations.

3. Results

3.1. Illumination Changes of the Hybrid Reactor

As described in Section 2.1, the hybrid reactor has a built-in turbidity measuring system. The default settings automatically increase the irradiation (given in % of lamp performance) in parallel with increasing turbidity. The starting light intensity after inoculation was ~11.5%, and the measured illuminance was 2.85 klux. According to Thimijan and Heiss [47], this corresponds to ~38.5 µmol m2 s−1 in the case of cool white fluorescent lamps, so starting light intensities correspond to the light intensity applied in the algal room for the tank reactor. After 7 days, the intensity reached ~25%, and the measured illuminance was 6.25 klux (corresponding to ~84.5 µmol m2 s−1). In the case of cultures with 75% nitrate content, the best growth was observed (see in Section 3.3). In other cultures, the light intensity increased slightly, even in those cases where the cell number decreased.

3.2. Changes of Oxygen Saturation and pH

During the experiments, the changes in oxygen content and pH in both devices were monitored for each treatment (Figure 2). Oxygen content increased significantly in almost all treatments in both reactor types during one week of the experiment, at least compared to day zero (p < 0.05; Figure 2a,b). In the hybrid reactor, a higher oxygen level was measured at the start of the experiments in 25%-N treatment, and the oxygen level remained higher throughout the whole week (Figure 2a). A similar phenomenon could be observed in the tank reactor (Figure 2b). Comparing the oxygen content of the same treatments in the different reactors, it can be stated that there were significantly higher oxygen levels in the tank reactor in control cultures and 50%-N treated cultures on certain days than in the hybrid reactor in the same cultures (p < 0.05).
The pH was balanced in the hybrid reactor (Figure 2c), while it increased in the tank reactor from day zero (Figure 2d), the increases were significant in some cases (p < 0.05; Figure 2d).

3.3. Growth of the Cultures

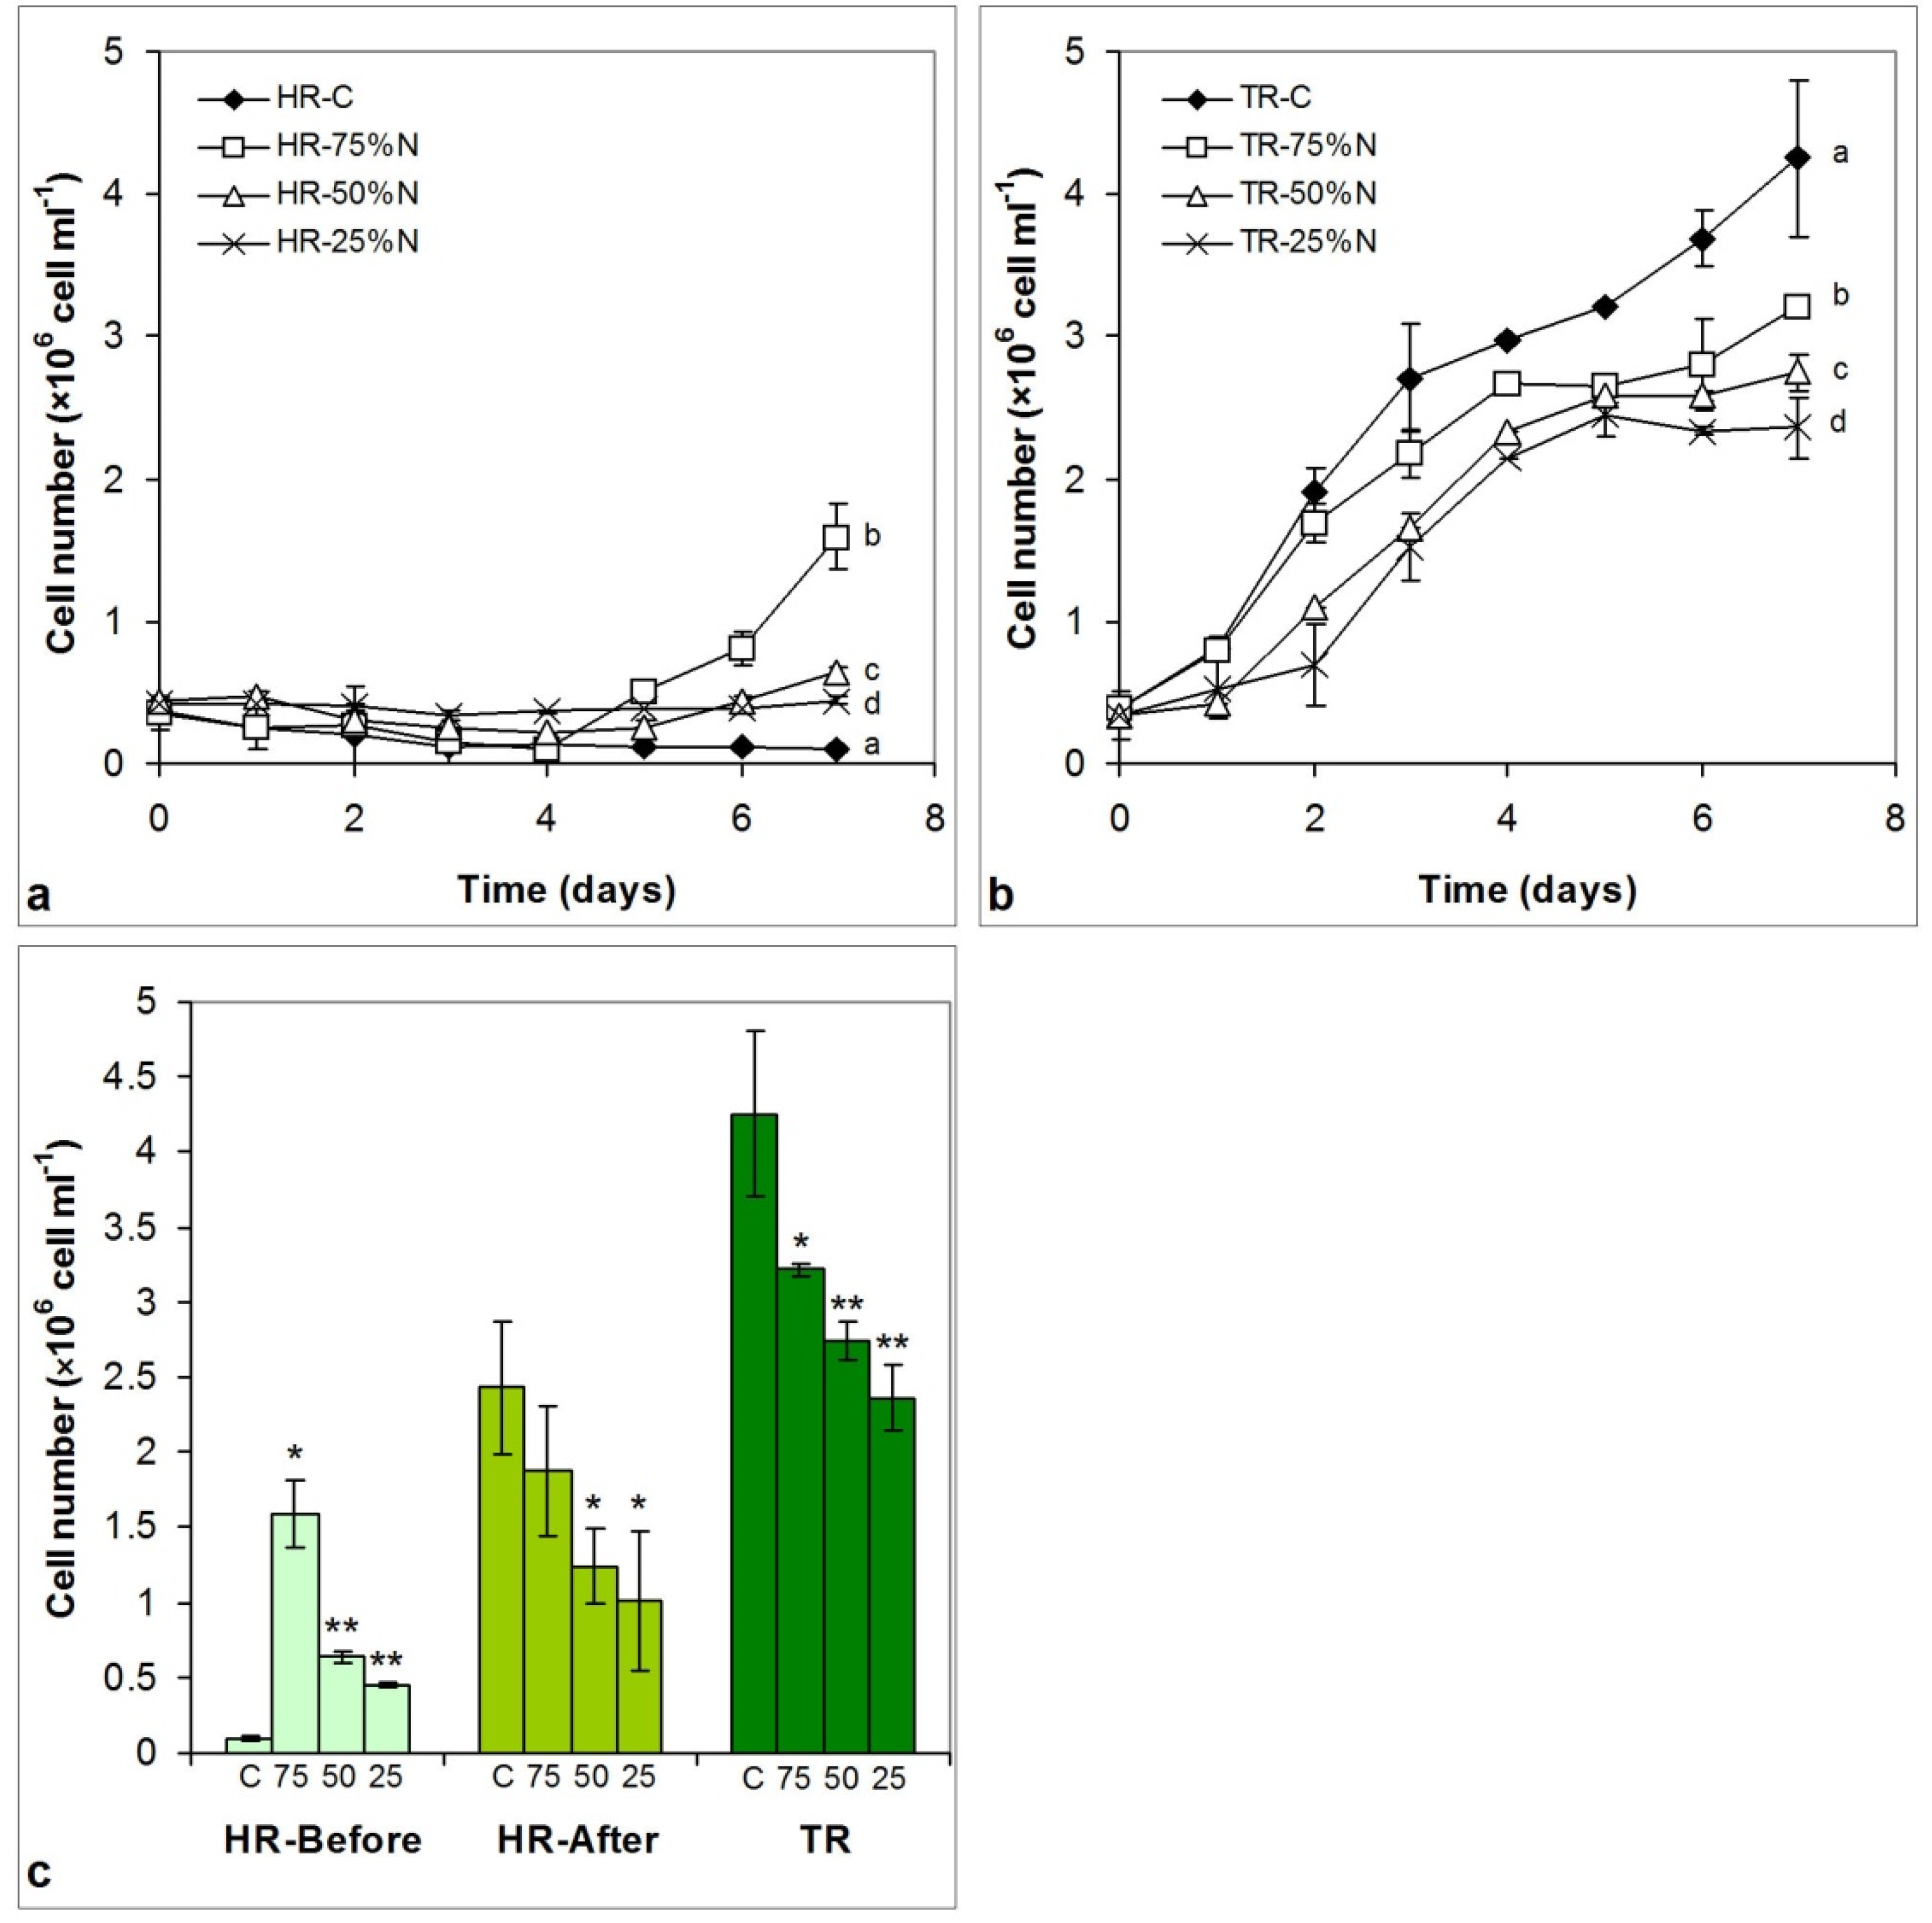
3.3.1. Cell Number Changes

In the hybrid reactor, the control culture showed a decrease in cell number, and this decrease was significant (p < 0.05) from the 3rd day compared to day zero (Figure 3a). Nevertheless, the growth of the culture was clearly visible (based on the increasing green coating in the glass spiral), but the adhesion of the cells prevented representative sampling. The highest floating cell number was observed in the 75%-N culture. Floating cell numbers were also significantly higher (p < 0.05) in the 50%-N and 25%-N cultures in the second half of the experiment than in the control (Figure 3a). Total cell numbers showed a different picture (see below).
Continuous, significant growth was observed in the tank reactor in the case of all treatments, but the stationary phase appeared sooner in media with lower nitrate contents (Figure 3b). Compared to the control, the cell number was 20% lower by day 3 in the 75%-N culture, and only 44% of the control cell number was present on day 3 in the 25%-N culture. On the last day, 24% inhibition was observed in the 75%-N culture and nearly 50% in the 25%-N culture compared to the control (Figure 3b).
The cell number of the biomass collected from the hybrid reactor was also counted on the last day of the experiment (Figure 3c). A much higher value could be expected after the total biomass was collected—i.e., it can be verified that there was culture growth, but representative sampling was not possible due to cell adhesion. It should be noted, however, that the cell numbers observed in the hybrid reactor were still below those counted in the tank reactor (Figure 3c).

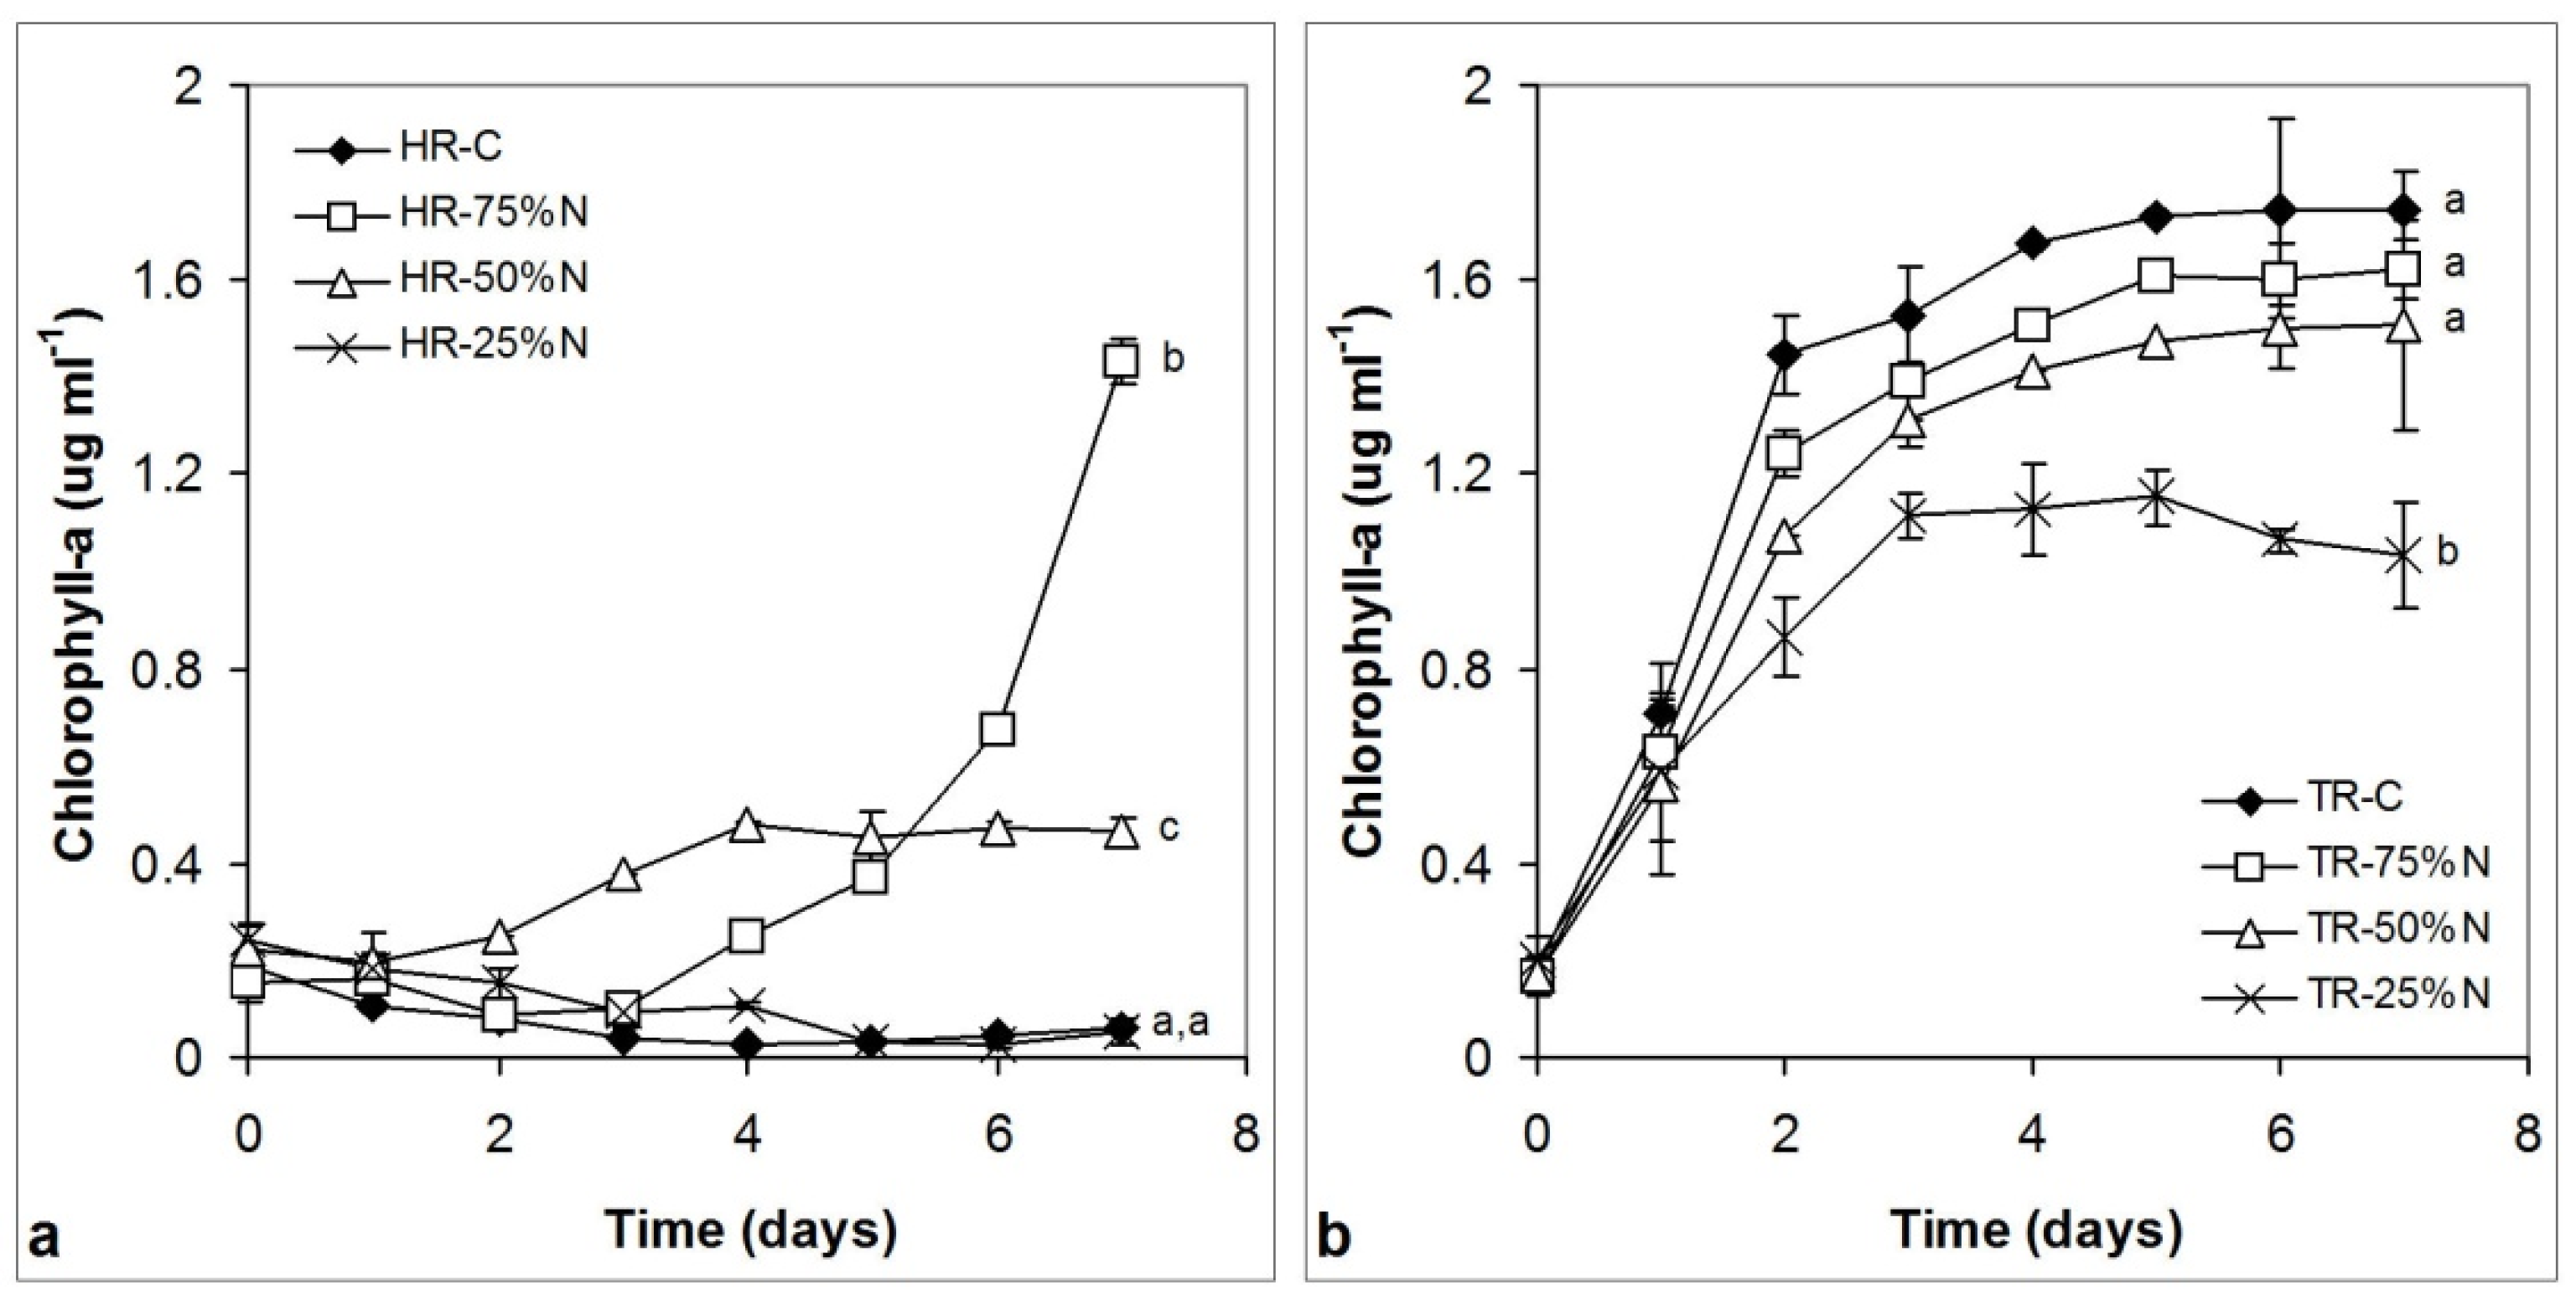
3.3.2. Chlorophyll Content Changes

The phenomena experienced in cell number changes were also observed in the case of chlorophyll values (Figure 4). Representative sampling was not possible from the hybrid reactor due to cell adhesion (as described above), and therefore, a decreasing chlorophyll content was detected in the control culture (Figure 4a). Chlorophyll was detectable in significantly higher concentrations in cultures containing lower but still sufficient amounts of nitrate (75% and 50%-N cultures) than in the control, probably due to the lower adhesion of the cells (p < 0.05; Figure 4a). Chlorophyll content was significantly higher (p < 0.01) in these cultures on the last days of the experiments than on previous days. However, less chlorophyll was measurable in the 25%-N cultures due to the lower nitrate content (Figure 4a).
In the tank reactor, all cultures showed significant growth during the seven days of the experiment, but significantly less and less chlorophyll content was detected in line with the decreasing nitrate concentration (p < 0.05; Figure 4b).

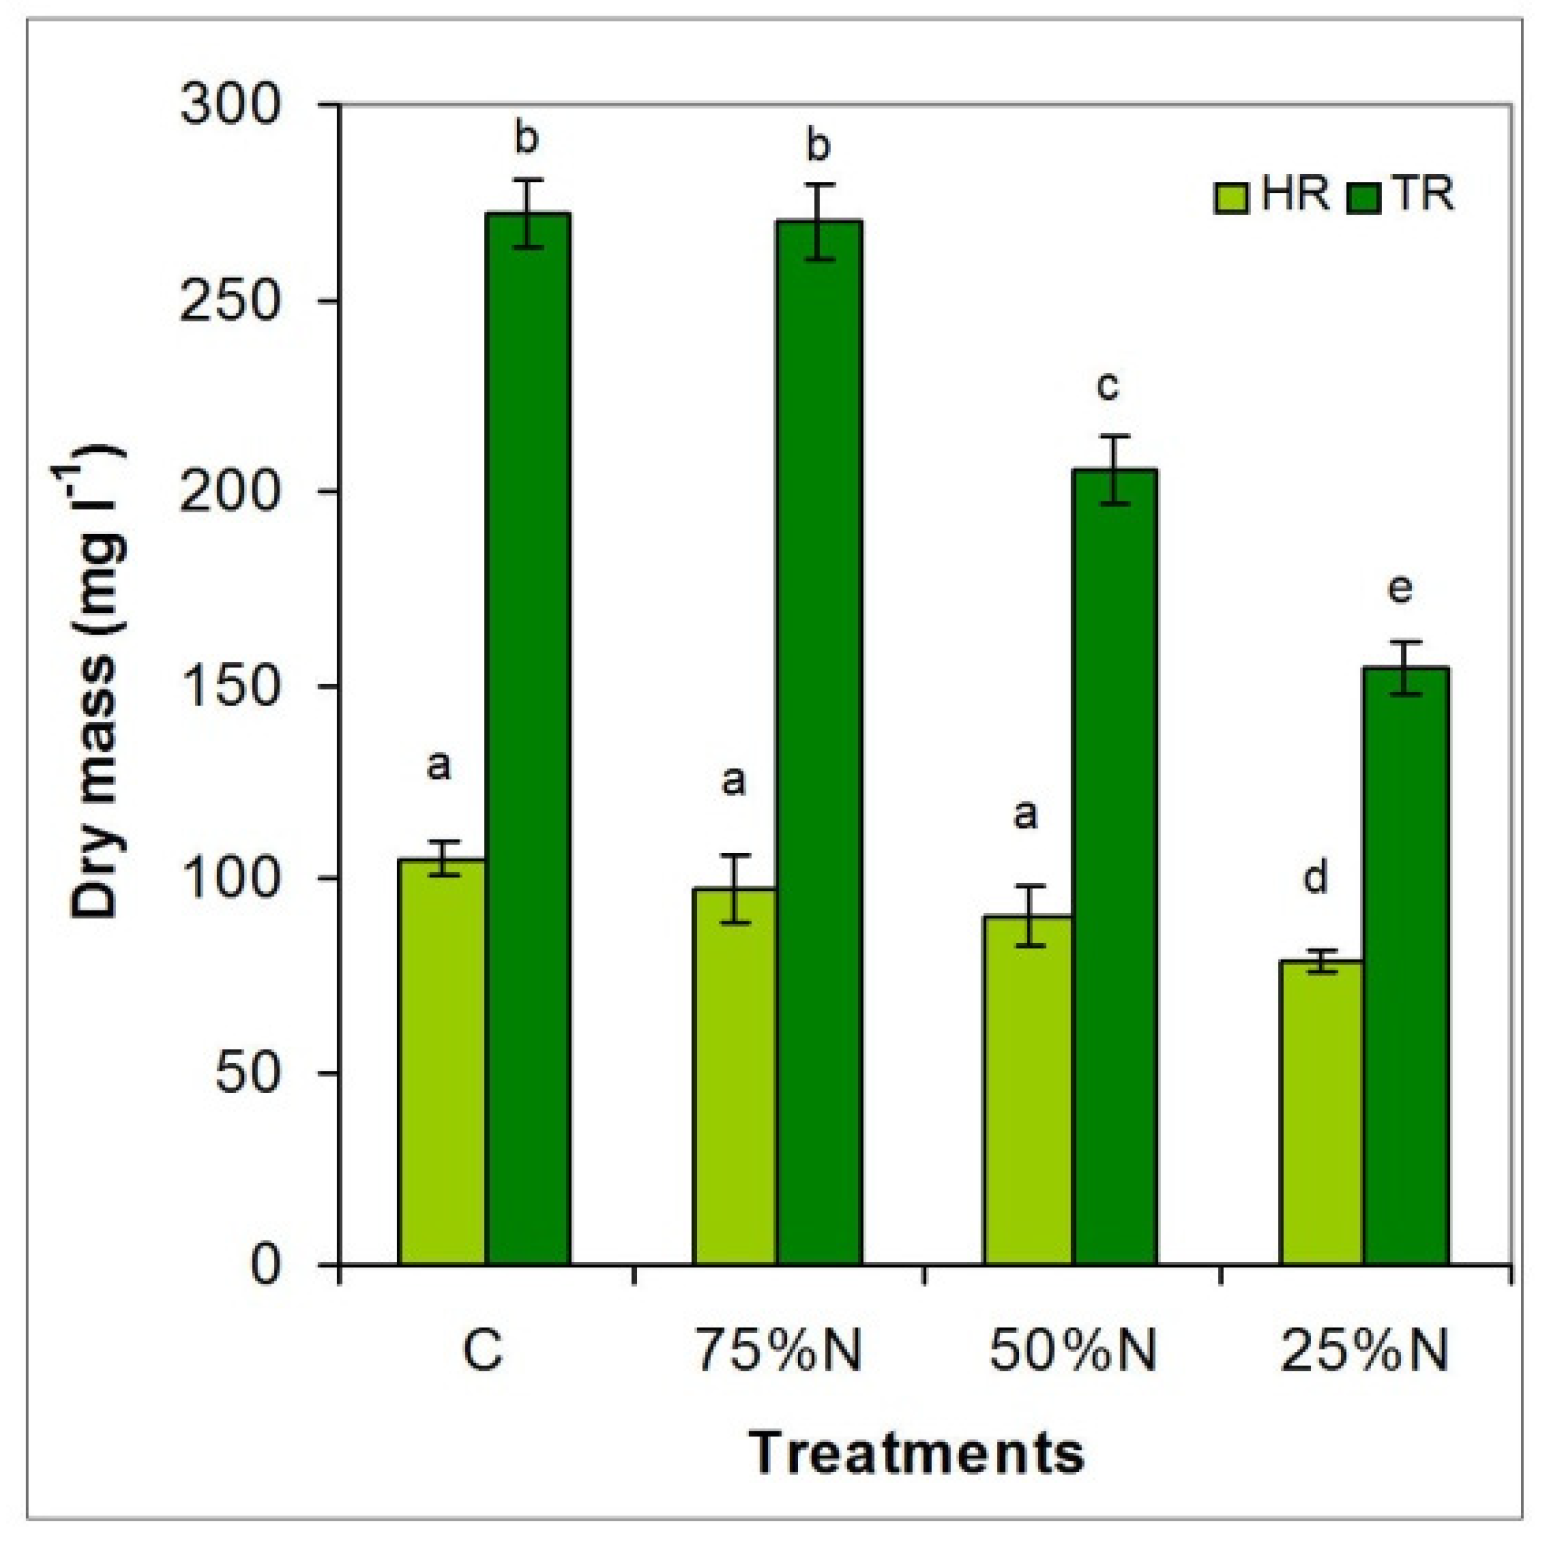
3.3.3. Differences in Net Dry Biomass Production

At the end of each experiment, total biomass was collected and its dry weight was measured. As expected, lower nitrate content in the culturing medium allowed for a lower increase in biomass. These differences were significant only in the case of the 25%-N culture compared to the control in the hybrid reactor, while there were significantly lower biomasses in 50 and 25%-N treatments compared to control and 75%-N culture in the tank reactor (p < 0.005; Figure 5). In addition, it is clear from the results that the dry biomass produced in the hybrid reactor under the applied conditions was always significantly lower than the measurable amount in the tank reactor: 2.6, 2.8, 2.3, and 1.9-fold higher dry biomasses were produced in the control; 75, 50, and 25%-N more cultures in the tank reactor than in the hybrid reactor (p < 0.001; Figure 5).

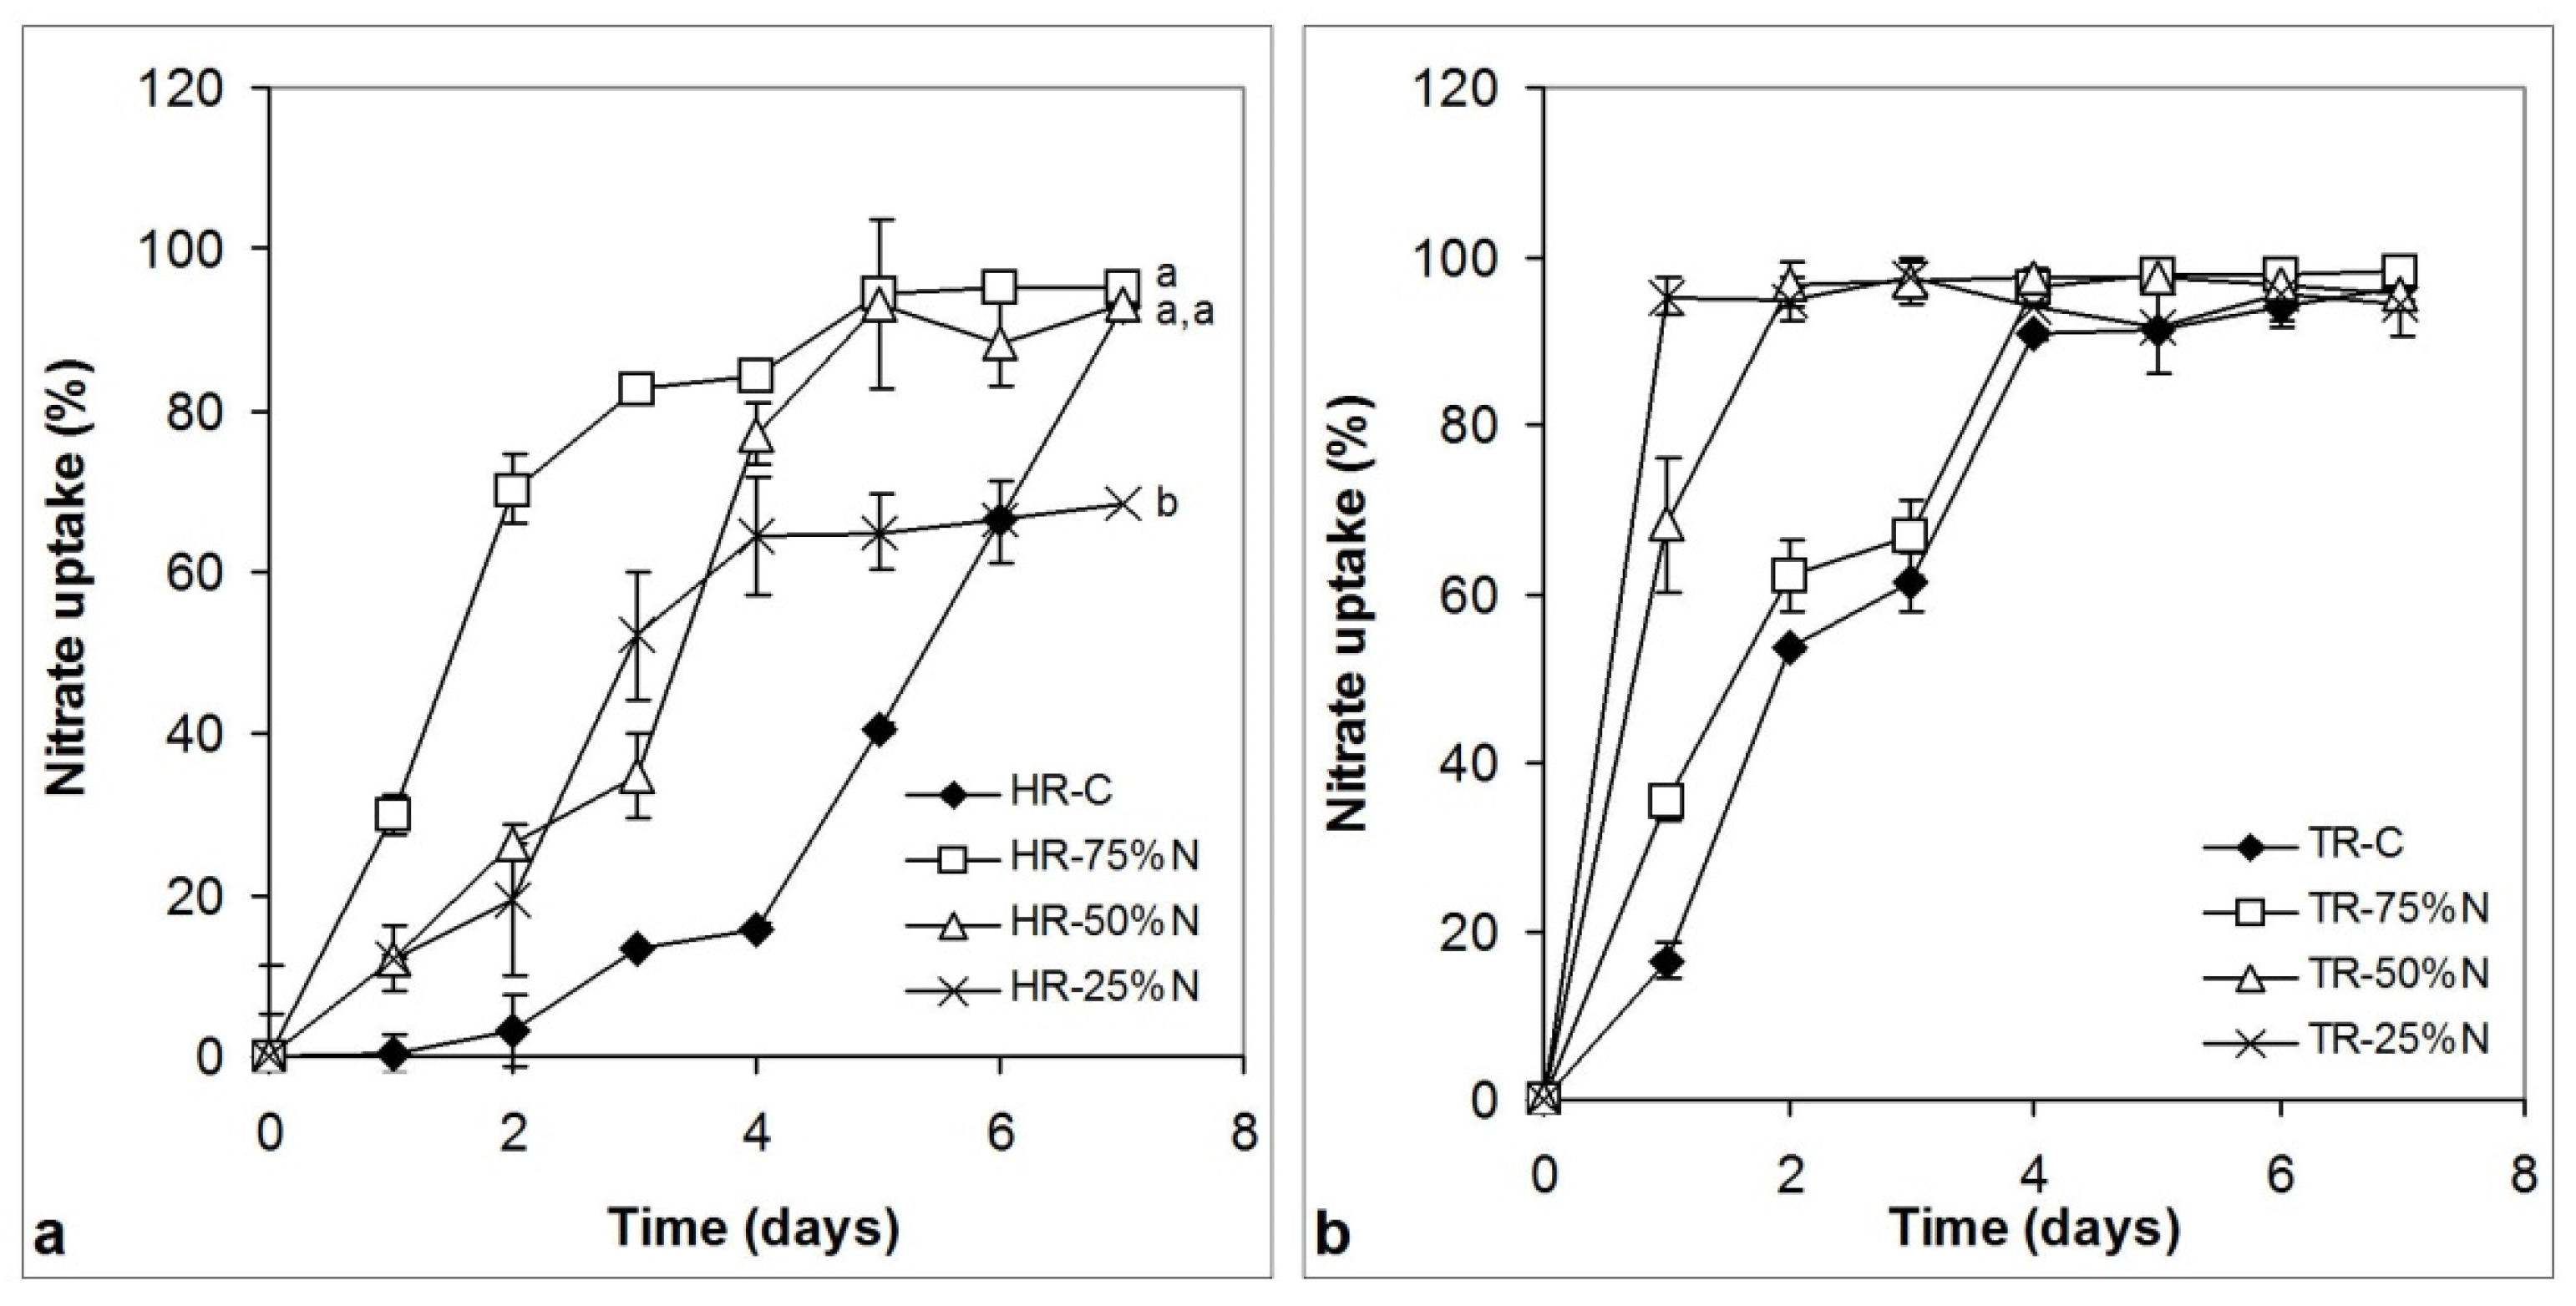
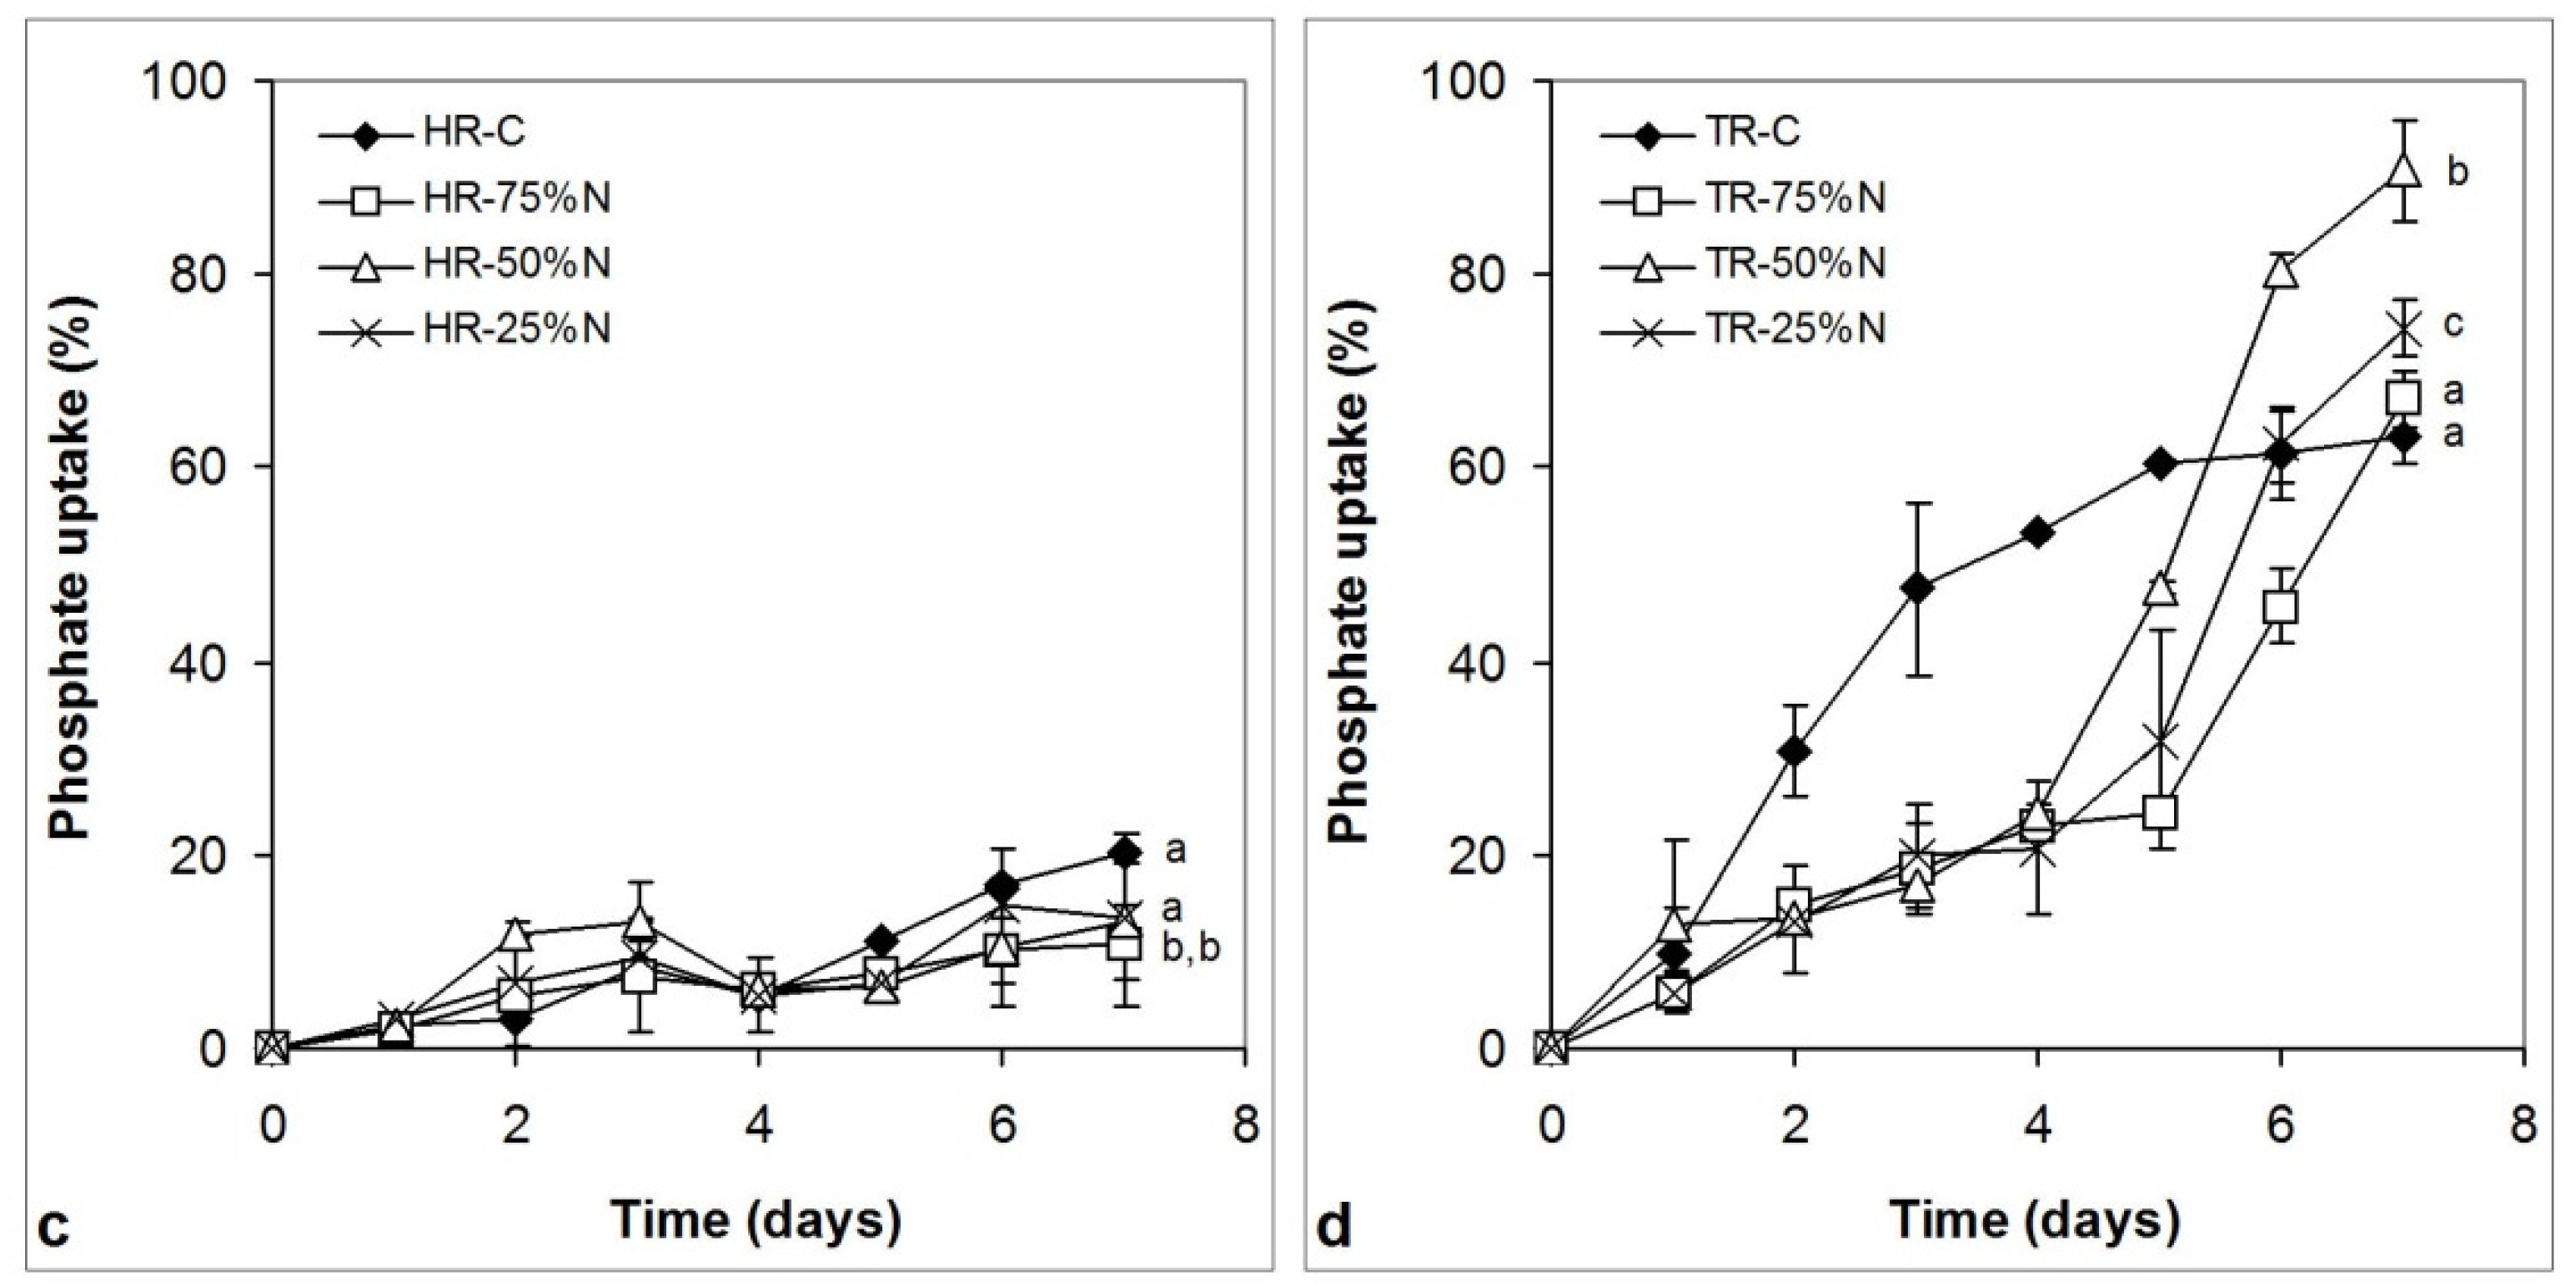
3.4. Nitrate and Phosphate Uptake

Considering initial nitrate content as 100%, almost the total amount of nitrate was taken up in the control, 75%-N, and 50%-N cultures by the end of the experiment in the hybrid reactor (Figure 6a). The dynamic of nitrate uptake was in accordance with growth or at least with the total biomass measured on the 7th day of the experiment: A slow nitrate uptake was observed in the first four days in control culture, then more than 95% of nitrate was taken up by the 7th day. There was faster nitrate uptake in the nitrate-depleted cultures: more than 80% of the initial nitrate content was taken up in the first four days in 75%-N culture. There was slower, but still accelerated nitrate uptake in the 50 and 25%-N cultures than in others. Interestingly, only ~70% of initial nitrate content was taken up in the 25%-N culture (Figure 6a).
Trends in nitrate uptake were much more in line with expectations in the tank reactor: a significantly higher proportion of initial nitrate content (p < 0.001) was taken up on the first two days in nitrate-depleted cultures, than in the control (Figure 6b). From the 3rd day, nitrate uptake trends were similar in the control and 75%-N, and in 50%-N and 25%-N cultures, respectively (Figure 6b). Generally, 95% of nitrate was taken up in all cultures by the end of the experiment.
In comparing nitrate uptake in the different reactor types of the same treatments, a significantly higher proportion of initial nitrate content was taken up in the tank reactor than in the hybrid reactor (p < 0.05).
There were no significant differences in phosphate uptake between the cultures exposed to different treatments in the hybrid reactor. It should be noted that only 20% of the initial phosphate content was taken up in the control, and only 10–13% in nitrate-depleted cultures (Figure 6c).
A significantly higher proportion of the initial phosphate content was taken up in control cultures than in nitrate-depleted ones in the tank reactor between the 2nd–5th days of the experiment (p < 0.001; Figure 6d). A slow phosphate uptake could be observed in nitrate-depleted cultures in the first four days, an increasing trend occurred afterward with significant differences on the last three days, but there seemed to be no connection between the extent of phosphate uptake and nitrate depletion (p < 0.05; Figure 6d). A 63–90% of the initial phosphate content was taken up by the end of the experiments in the tank reactor.
Comparing phosphate uptake in the different reactor types of the same treatments, similarly to nitrate uptake, a significantly higher proportion of initial phosphate content was taken up in the tank reactor than in the hybrid reactor (p < 0.05).

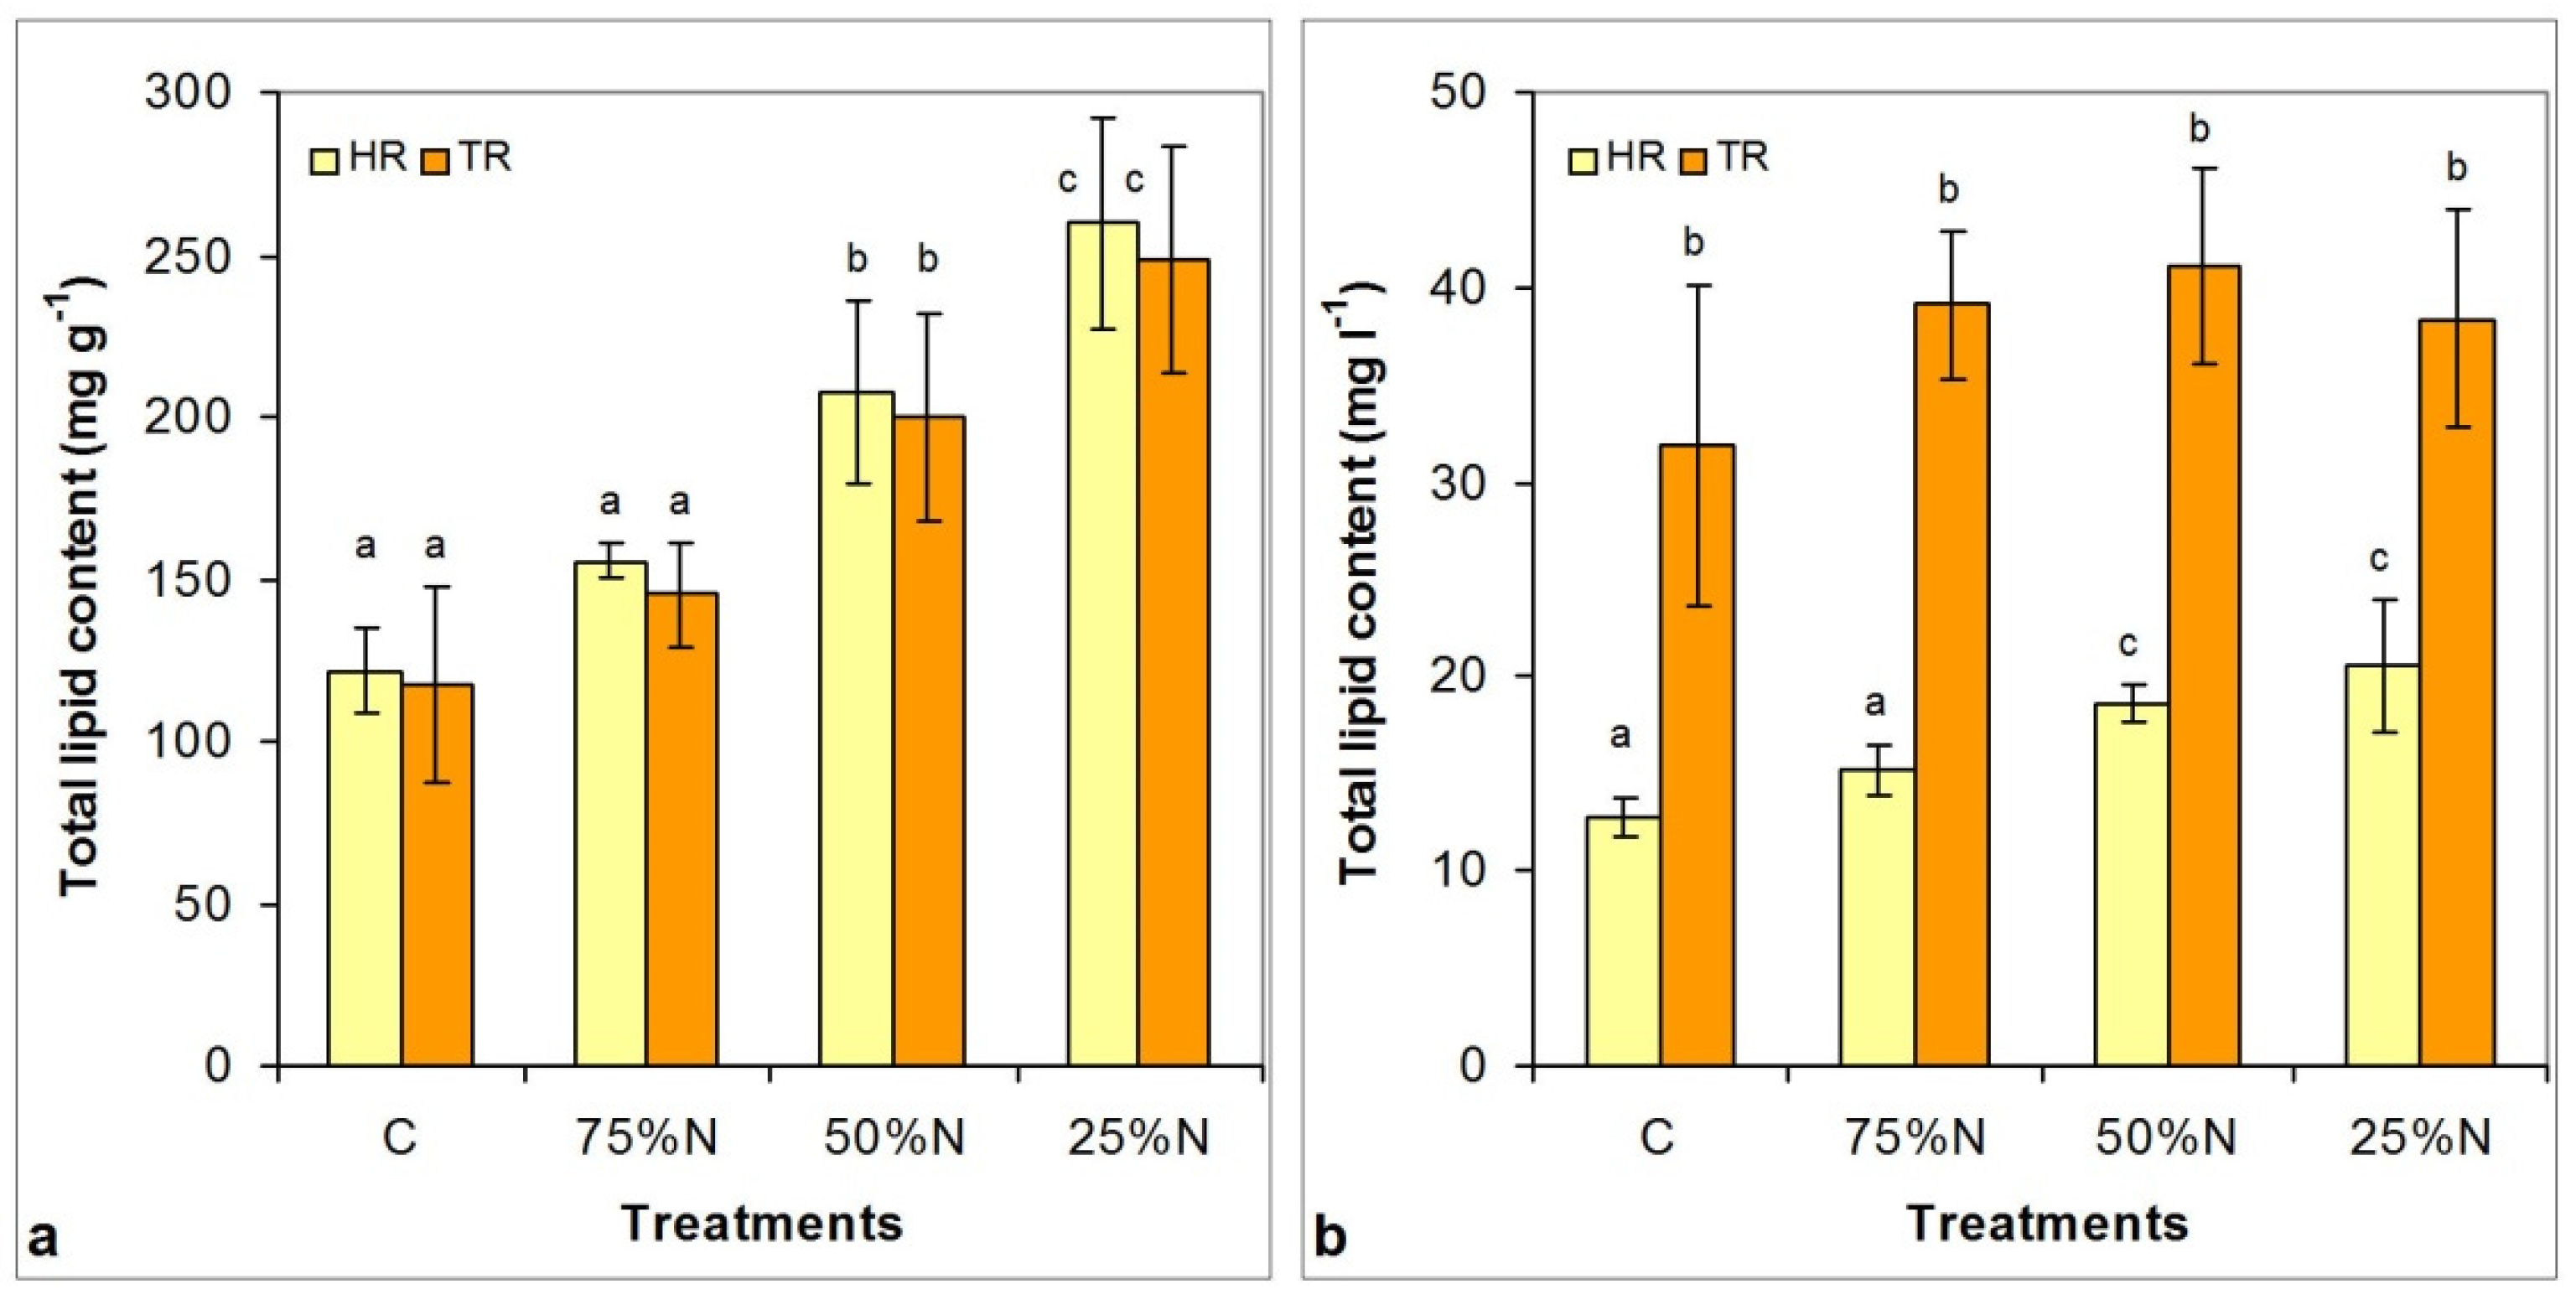
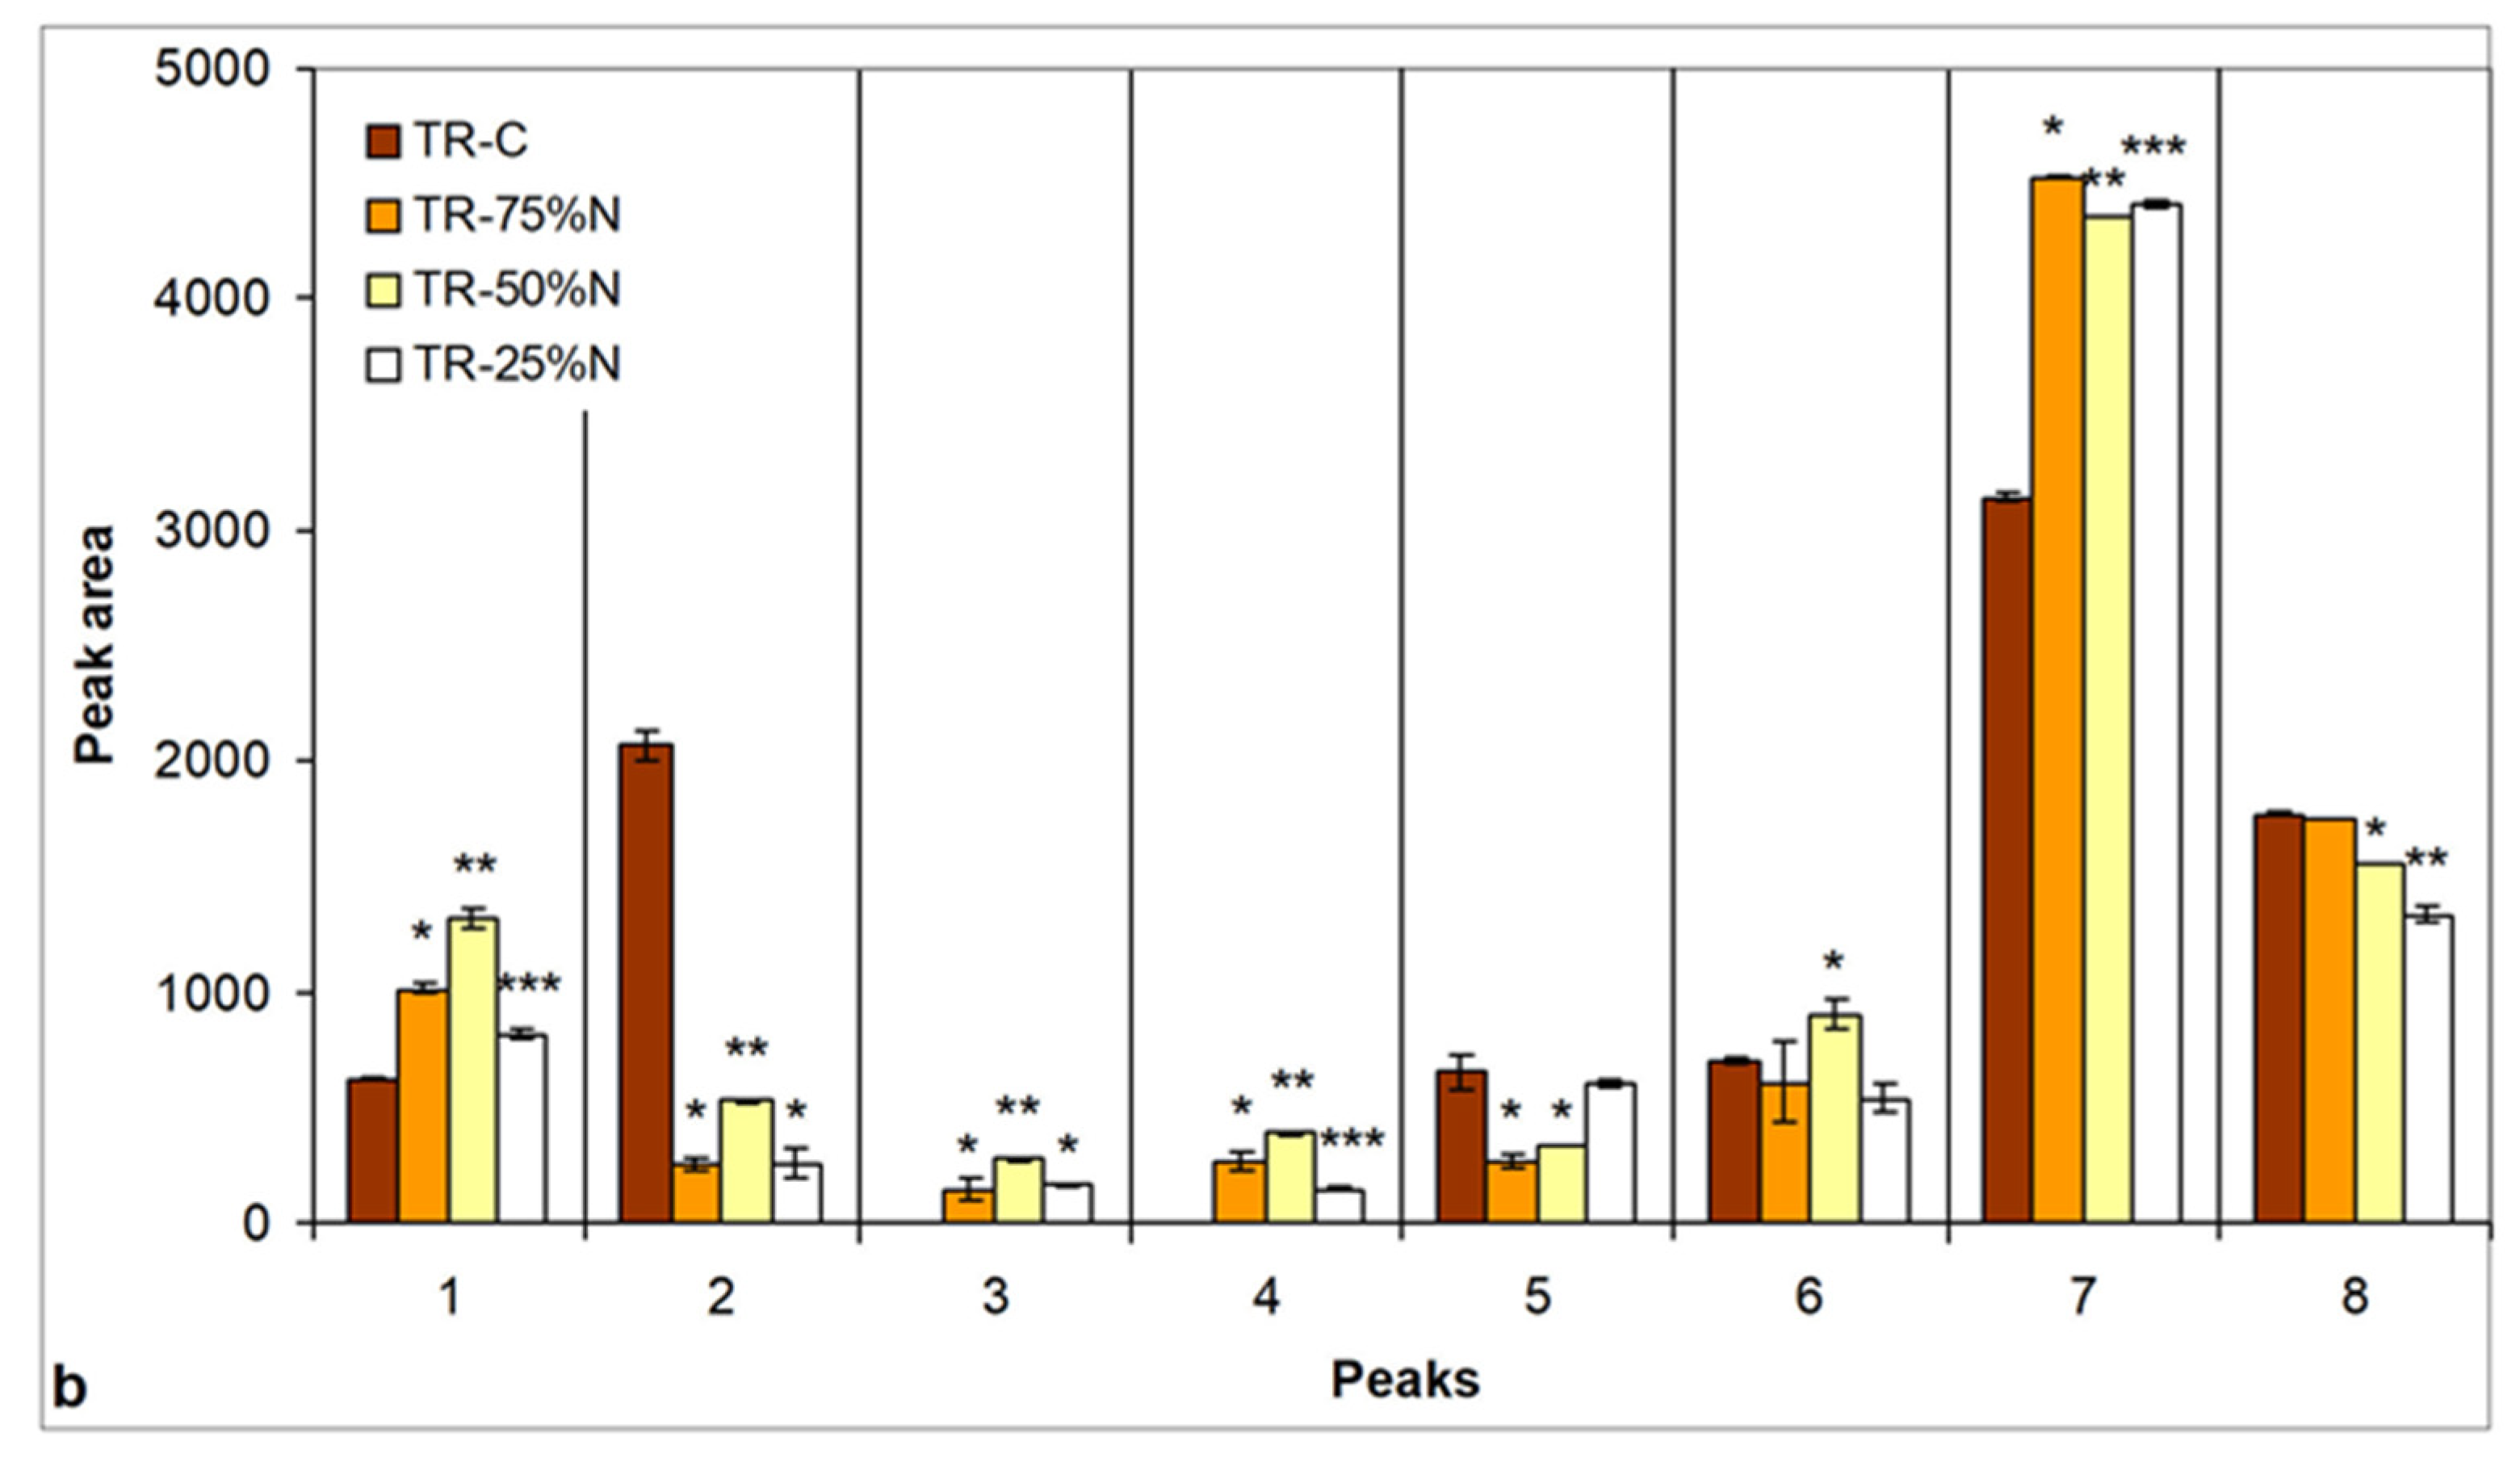
3.5. Changes in Lipid Content and Neutral Lipid Composition

Nile red fluorescent staining proved the increasing appearance of neutral lipid droplets in nitrogen depleted cultures in both reactor types (Figure S1). Besides the greater extent of a cluster formation of cells in the hybrid reactor, other morphological differences between the cells from the two reactor types were not observed.
Regarding the changes in the total lipid content of the cultures, it can be stated that the lipid content of the cells in both the hybrid reactor and the tank reactor increased as the amount of nitrate decreased (Figure 7). The lipid contents were significantly higher in 50%-N and 25%-N cultures than in the control and 75%-N cultures in both reactor types on a dry mass basis (p < 0.05; Figure 7a), but the total lipid contents of the same treatments did not differ significantly in the two reactor types (Figure 7a). There was significantly higher lipid content in the 50%-N and 25%-N cultures than in the control and 75%-N cultures in the hybrid reactor (p < 0.05; Figure 7b). However, under the applied conditions, a significantly higher amount of lipid can be produced in the tank reactor in a given volume than in the hybrid reactor (p < 0.001; Figure 7b).
During preliminary TLC analysis of the lipid composition, altogether, eight bands, i.e., eight different types of lipids, were separated (Figures S2 and S3). As it is described in the Materials and Methods section, the run was performed on silica gel impregnated with 2% AgNO3, the role of which in the reaction is to form stronger bonds with the lipids containing more double bonds, so they are retained better in the layer so that they can be separated from the more saturated ones. The results showed that the most unsaturated peak, 1, and the most saturated peaks, 7 and 8, dominate all treatments in both reactor types (complemented with peak 2 in control cultures from the tank reactor). The results also show that the lower the nitrate content in the culturing medium, the higher the number of bands (identifiable peaks), i.e., the number of different types of lipids (Figures S2 and S3; Figure 8). Although the method applied in the present form was not suitable for identifying the different lipids, it clearly showed that new forms in different amounts appeared in nitrate-depleted cultures. The differences were more pronounced in the case of the hybrid reactor: there were no detectable lipids in the control, four peaks appeared in the 75 and 50%-N cultures, and seven peaks were detectable in the 25%-N culture (Figure S2). Peak areas of peaks 1 and 6 were significantly higher, while the peak area of peak 7 was significantly lower in the 75 and 50%-N cultures than in the 25%-N culture (p < 0.001; Figure 8a).
There were six identifiable peaks in the control culture from the tank reactor, and two new peaks (peak 3 and 4) appeared in the nitrate-depleted cultures (Figure S3). Peak areas of peaks 1, 6 (except control vs 75%-N), and 7 were significantly higher; 2 and 5 (except control vs 25%-N) were significantly lower (p < 0.001) in nitrate-depleted cultures than in the control (p < 0.001; Figure S3 and Figure 8b).
Comparing the preliminary lipid profiles of the same cultures from different reactors, it can be concluded that more unsaturated lipids were present in higher amounts in the biomasses from hybrid reactors (especially peak 1 with significantly higher peak area; p < 0.05, except 25%-N treatment), while more saturated ones were present in higher amounts in biomasses from the tank reactor (mainly peak 7 and 8 with significantly higher peak areas; p < 0.05, except 25%-N treatment).

4. Discussion

4.1. Oxygen Saturation and pH

During light and dark cycles, oxygen concentrations in a photobioreactor shows a diurnal pattern [48,49,50]. Since our experiments were carried out under continuous irradiation, the diurnal pattern of oxygen content changes was not observed. Lower than average initial oxygen levels in the hybrid reactor could be explained by the much more complex geometry, which requires a longer time for the even gas distribution in the reactor than in the case of the tank reactor. The higher oxygen levels in the 25%-N cultures in both types of reactors are probably the result of the lower salt content: the lack of nitrate made it possible to dissolve more oxygen within these cultures. The significantly higher oxygen levels in the tank reactor in control cultures and the 50%-N treated cultures on certain days than in the hybrid reactor in the same cultures is not easy to explain. Cell density differences or geometry differences do not explain why the oxygen contents of these cultures differed significantly from each other and the others not. Although photosynthetic activity calculations were not done, the moderate increase of oxygen levels can be explained by the photosynthetic activity of the cultures in the tank reactor. In the hybrid reactor, increased oxygen levels could be the result of the insufficient aeration of the tubular part of the reactor, as it was observed by Gluszcz et al. [51] in a similar device. In summary, the results suggest that the gas supply of the tank reactor is more even in the applied volume than in the hybrid reactor with a complex geometry. The literature also reported more uneven gas distribution in tubular reactors [52] and a more balanced gas supply in column reactors [53,54]. At the same time, it also has to be taken into account that scalability of tubular reactors is considered much higher than that of column reactors [4].
The changes in pH are also strongly related to reactor geometry, proper mixing, and the physiological processes of algal cells. Jaworski’s Medium contains H2PO4 and HPO42− ions, which can work as a buffer system. However, these ions are also a phosphorous source for the algae, so their uptake can decrease the buffer capacity of the medium. As shown in the Results section, intensive phosphate uptake was observed in all cultures in the tank reactor, which could explain the increase of pH in these cultures. Another reason for the increasing pH is the photosynthetic carbon consumption [48,49]. Furthermore, pH increases could also be caused by the consumption of the nitrogen source, nitrate ions, because of the parallel excretion of OH ions [55]. During dark and light cycles, pH shows changes “adjusted” to the dark and light periods because of the alternation of the ratio of photosynthesis and respiration [48,49]. Since our cultures were kept under continuous irradiation, the resulting photosynthesis / respiration ratio did not allow for a decrease in pH. Although microalgal cultures could be considered carbon limited at the measured pH values due to the dissolution properties of CO2 [48,49], growth characteristics did not show this limitation in the tank reactor (also suggesting that light limitation due to increasing culture density did not occur significantly during the experiment). The pH remained more stable and at lower values in the hybrid reactor, probably because of the lower metabolic activity due to lower cell density.

4.2. Growth of the Cultures

Maintaining high (optimal) performance in a photobioreactor depends on many factors. One of the main important factors is light quantity and quality and its distribution in the reactor. Light attenuation inside the reactor also depends on many factors, with the thickness of the culture among the most important [9]. This is the reason for the design of the hybrid reactor: on the one hand, the diameter of the glass tube forming the spiral is theoretically optimal to avoid the culture from self-shading [53], but on the other hand, there is an automated light intensity adjuster, increasing light intensity in parallel with the increasing culture density. In our opinion, these two factors could have significantly contributed to the weaker growth in the hybrid reactor. The observations suggest that light intensity control based on optical density changes has its limitations. On the one hand, optical density could increase due to increasing cell number, cell debris, or possible precipitation processes. On the other hand, the moderate cell number increases resulted in doubling the light intensity (see in Section 3.3). Although the measured highest light intensities cannot be considered as extremely high, it may have caused photoinhibition of the growth of the applied M. pusillum strain. The close placement of the fluorescent lamps to the glass tube, the short light path in the tube, or the so-called “lens” effect due to the helical arrangement of the tubular part [56] all could be potential reasons for the weak growth in the hybrid reactor. It can be assumed that the so-called kinetic regime [57] occurs in the helical part of the hybrid reactor: part of the illuminating light is not absorbed in the culture volume, but it is transmitted, leading to oversaturation or even photoinhibition, damaging the photosynthetic apparatus of the microalgae and significantly reducing the performance of the hybrid reactor. Gluszcz et al. [51] had similar observations in the same reactor type culturing the cyanobacterium Synechococcus sp. PCC 6715: Growth of the cultures was limited to over 40% lamp performance. It is also worth mentioning that the growth of the Synechococcus strain was much better in light and dark cycles than in continuous light. So to attain the diurnal cycle with a simple mechanical or electronic timer switching off and on the external power supply of the photosynthetic module is promising.
Another key reason for low growth is the unexpected adhesion of the cells on the surfaces, especially on the outer arc of the glass spiral of the hybrid reactor. The adhesion feature of the cells depends in part on the size and shape of the microalgae: the elongated, spindle-like shape of M. pusillum cells are prone to attach on surfaces, especially due to the centrifugal force caused by the flow. Attachment of a relevant proportion of the population could lead high inequalities in oxygen levels and light availability, resulting insufficient growth of the cultures. Gluszcz et al. [51] did not report on the significant adhesion of Synechococcus cells. This suggests that adhesion could appear to a smaller extent even in the case of elongated cell shapes if the cells are small. There is the possibility that adhesion occur to a lower extent in the case of spherical (coccoid) planktic algal species. Proof of this requires further investigation.
Since the 1950s, it has been known that mixing microalgae cultures promotes culture growth [58]. It was shown during preliminary experiments that bubble stirring alone was not enough in the tested hybrid reactor for the adequate growth of M. pusillum cultures. To improve the stirring, a stirring rod was placed in the fermenter tank, and a VELP 100-240V / 12V type magnetic stirrer (VELP Scientifica Srl, Usmate (MB), Italy) was placed under the fermenter tank. Based on the results presented, proper mixing, and thus, representative sampling had a higher standard deviation due to impaired homogeneity. Based on these observations, it is recommended to install a stirrer motor, as it is used for heterotrophic fermentation. The peristaltic pump did not allow fine control of culture circulation in the tube spiral. Low pump velocities resulted in sedimentation and bubble formation in the tubes, and higher velocities enhanced the centrifugal force resulting in even more intense adhesion. A finely controllable centrifugal pump designed for helical tubular reactors may solve these problems even in small laboratory scales.

4.3. Nutrient Uptake

Culturing media with lower nitrate contents obviously have a lower N:P ratio. It is known that lower nitrate content can easily result in the complete removal of nitrate, but the N:P ratio has no strong effect on the extent of nitrate uptake [59,60]. The differences between nitrate uptake tendencies in the two types of reactors can be explained with cell number differences. The results highlight that the used M. pusillum strain can be characterized with significant luxury uptake abilities since almost the total amount of nitrate was taken up even in control cultures in the hybrid reactor with very low cell density.
Literature data show in the case of several green algae species that high N:P ratios are favorable for phosphate uptake [59,60,61,62,63,64]. Similarly, the used M. pusillum strain took up more phosphate in control cultures (with a higher N:P ratio) than in nitrate-depleted cultures in the case of the tank reactor. To explain the background of the higher phosphate uptake on the last two days in nitrate-depleted cultures requires further investigation. Surprisingly, the proportion of phosphate uptake was very low in the hybrid reactor. This can be partly explained by the low cell density, and the unfavorable conditions as an attachment on reactor surfaces and light stress in the helical tubular part of the reactor also could contribute to the observed low phosphate uptake.

4.4. Lipid Content

Many microalgae respond to nitrogen starvation by accumulating lipids [24], and the phenomenon is also known among Monoraphidium species [65,66]. The examined M. pusillum strain reacted to nitrogen starvation similarly in both reactor types from the point of view of total lipid content, although the lower biomass productivity in the hybrid reactor was observable also in lipid content on a volume basis. Although the applied TLC method was not suitable for identifying the different lipids, as a preliminary analysis it clearly showed that new forms in different amounts appeared in nitrate-depleted cultures in both reactor types. Simultaneously, there were significant compositional differences between the same cultures from different reactors. The background of these differences could be the adhesion of the cells in the hybrid reactor, especially in the helical tubular part. This is also suggested by the more similar TLC profiles of 25%-N cultures, for which less adhesion was observed in the hybrid reactor. Cell adhesion results lower culture density, which means that individual cells get higher light intensity. This could lead to the above mentioned oversaturation and photoinhibition. Although high light intensity was reported to cause the increase of neutral lipid content, the transformation of polar lipids to neutral ones, and the reduction of thylakoid membrane-associated unsaturated fatty acids [67], opposite observations were also reported among algae from the family Selenestraceae [68]. To find the exact reason for the observed significantly different lipid profile requires further, more exact analyses. However, cell adhesion and the related physical (light climate) and physiological (changed photosynthesis and other metabolic activities) processes seem to have key roles in the phenomena.

5. Conclusions

Based on the results, the following conclusions can be drawn: The hybrid reactor has the undeniable advantage of having an online monitoring system. At the same time, the tested basic device needs to be supplemented in order to be suitable for laboratory optimization experiments and to be economically feasible during scaling up. The necessary additions are well exemplified by the fact that we had to solve the mixing at the very beginning of the experiments due to the unexpected large-scale sedimentation and adhesion of the cells. As a temporary solution, we placed a table-top magnetic stirrer under the fermenter tank, but in our opinion, incorporating a stirrer motor should be considered, as in the case of a conventional fermenter. In addition, even on a laboratory scale, optimization experiments could benefit from more finely adjustable mixing and circulation of the culture than it is available with peristaltic pump performance to improve control and avoid unexpected adhesion phenomena.
In accordance with the literature, continuous operation of a helical tubular hybrid reactor would be much more beneficial, since the batch mode allows for significantly less efficient biomass production for the tested algal species than conventional flask cultivation (as an air bubbled column or tank reactor) in the studied volume.
Automatic setting of light intensity in parallel with culture density was not found to be useful because this design does not allow the optimization of light intensity either in the case of young cultures or in the case of different algae species requiring lower or higher light intensity than the intensity provided by the default setting.
This study highlights that reactor geometry and complexity plays a crucial role in the obtained results. Some default designs which have certainly been developed considering scalability requirements, are not optimal (or sometimes not suitable) for optimization experiments in certain laboratory volumes. On the other hand, the results also highlight that conventional laboratory methods (such as Erlenmeyer flasks considered as air bubbled column or tank reactors) are very useful for the physiological optimization of algae cultivation for a certain purpose, but may be not appropriate from the point of view of scalability.

Supplementary Materials

The following supporting information can be downloaded at: https://www.mdpi.com/article/10.3390/app12042196/s1, Figure S1: Schematic representation of the main parts of the hybrid photobioreactor and the assembled device. A control unit for the illumination and for the whole system and a peristaltic pump for culture circulation are also parts of the equipment; Figure S2: Monoraphidium pusillum cells (a) in inoculum, without staining; (b) in inoculum, with Nile red fluorescent staining; further photographs were taken on the 3rd and the 7th day with Nile red fluorescent staining (c,d) in control cultures; (e,f) in 75% nitrate containing cultures; (g,h) in 50% nitrate containing cultures and (j,k) in 25% nitrate containing cultures. Golden yellow spots represent neutral lipid drops; Figure S3: Preliminary analysis of the lipid content of Monoraphidium pusillum control (C) and nitrate-depleted (75–25%-N) cultures from the hybrid reactor by thin layer chromatography. (a) the TLC plate after the run; (b) the TLC plate after development; (c) the negative image of the developed TLC plate for pattern analysis; (d) the peaks found by using CpAtlas 2.0 software. 1–8: the separated bands (peaks); TOG: trioleil glycerol and TPG: tripalmitoyl glicerol standards; Figure S4: Preliminary analysis of the lipid content of Monoraphidium pusillum control (C) and nitrate-depleted (75–25%-N) cultures from the tank reactor by thin layer chromatography. (a) the TLC plate after the run; (b) the TLC plate after development; (c) the negative image of the developed TLC plate for pattern analysis; (d) the peaks found by using CpAtlas 2.0 software. 1–8: the separated bands (peaks); TOG: trioleil glycerol and TPG: tripalmitoyl glicerol standards.

Author Contributions

Conceptualization, I.B. and F.T.; methodology, I.B. and S.G.; formal analysis, F.T., K.M., I.B. and S.G.; investigation, F.T., V.B.-B. and I.B.; resources, I.B.; data curation, I.B., K.M. and F.T.; writing—original draft preparation, I.B. and F.T. writing—review and editing, S.G. and V.B.-B.; visualization, I.B., F.T. and V.B.-B.; supervision, I.B. and S.G.; project administration, I.B.; funding acquisition, I.B. All authors have read and agreed to the published version of the manuscript.

Funding

This research was funded by the National Research Development and Innovation Office NKFIH FK 131 917 Grant (I.B.). Project no. TKP2021-NKTA-32 has been implemented with the support provided from the National Research, Development and Innovation Fund of Hungary, financed under the TKP2021-NKTA funding scheme.

Institutional Review Board Statement

Not applicable.

Informed Consent Statement

Not applicable.

Data Availability Statement

The data that support the findings of this study are available from the corresponding author upon reasonable request.

Acknowledgments

We are thankful to the Department of Botany, University of Debrecen for the possibility of biomass collection and lyophilization.

Conflicts of Interest

The authors declare no conflict of interest. The funders had no role in the design of the study; in the collection, analyses, or interpretation of data; in the writing of the manuscript, or in the decision to publish the results.

References

  1. Walter, C.; Steinau, T.; Gerbsch, N.; Buchholz, R. Monoseptic cultivation of phototrophic microorganisms–development and scale-up of a photobioreactor system with thermal sterilization. Biomol. Eng. 2003, 20, 261–271. [Google Scholar] [CrossRef]
  2. Singh, R.N.; Sharma, S. Development of suitable photobioreactor for algae production–A review. Renew. Sust. Energ. Rev. 2012, 16, 2347–2353. [Google Scholar] [CrossRef]
  3. Gupta, P.L.; Lee, S.M.; Choi, H.J. A mini review: Photobioreactors for large scale algal cultivation. World J. Microbiol. Biotechnol. 2015, 31, 1409–1417. [Google Scholar] [CrossRef] [PubMed]
  4. Assunção, J.; Malcata, F.X. Enclosed “non-conventional” photobioreactors for microalga production: A review. Algal Res. 2020, 52, 102107. [Google Scholar] [CrossRef]
  5. Lee, Y.K. Microalgal mass culture systems and methods: Their limitation and potential. J. Appl. Phycol. 2001, 13, 307–315. [Google Scholar] [CrossRef]
  6. Lee, Y.K. Enclosed bioreactors for the mass cultivation of photosynthetic microorganisms: The future trend. Trends. Biotechnol. 1986, 4, 186–189. [Google Scholar] [CrossRef]
  7. Tsoglin, L.N.; Gabel, B.V.; Fal’kovich, T.N.; Semenenko, V.E. Closed photobioreactors for microalgal production. Russ. J. Plant Physiol. 1996, 43, 131–136. [Google Scholar]
  8. Acién Fernández, F.G.; Fernández Sevilla, J.M.; Molina Grima, E. Photobioreactors for the production of microalgae. Rev. Environ. Sci. Bio. 2013, 12, 131–151. [Google Scholar] [CrossRef]
  9. Legrand, J.; Artu, A.; Pruvost, J. A review on photobioreactor design and modelling for microalgae production. React. Chem. Eng. 2021, 6, 1134–1151. [Google Scholar] [CrossRef]
  10. Chisti, Y. Biodiesel from microalgae. Biotechnol. Adv. 2007, 25, 294–306. [Google Scholar] [CrossRef]
  11. Brennan, L.; Owende, P. Biofuels from microalgae–A review of technologies for production, processing, and extractions of biofuels and co-products. Renew. Sust. Energ. Rev. 2010, 14, 557–577. [Google Scholar] [CrossRef]
  12. Pulz, O. Photobioreactors: Production systems for phototrophic microorganisms. Appl. Microbiol. Biot. 2001, 57, 287–293. [Google Scholar]
  13. Watanabe, Y.; Saiki, H. Development of a photobioreactor incorporating Chlorella sp. for removal of CO2 in stack gas. Energ. Convers. Manag. 1997, 38, S499–S503. [Google Scholar] [CrossRef]
  14. Mirón, A.S.; Gómez, A.C.; Camacho, F.G.; Grima, E.M.; Chisti, Y. Comparative evaluation of compact photobioreactors for large-scale monoculture of microalgae. Prog. Ind. Microbiol. 1999, 35, 249–270. [Google Scholar]
  15. Molina, E.; Fernández, J.; Acién, F.G.; Chisti, Y. Tubular photobioreactor design for algal cultures. J. Biotechnol. 2001, 92, 113–131. [Google Scholar] [CrossRef]
  16. Ugwu, C.; Ogbonna, J.; Tanaka, H. Improvement of mass transfer characteristics and productivities of inclined tubular photobioreactors by installation of internal static mixers. Appl. Microbiol. Biotechnol. 2002, 58, 600–607. [Google Scholar] [CrossRef] [PubMed]
  17. Harun, R.; Singh, M.; Forde, G.M.; Danquah, M.K. Bioprocess engineering of microalgae to produce a variety of consumer products. Renew. Sust. Energ. Rev. 2010, 14, 1037–1047. [Google Scholar] [CrossRef]
  18. Norsker, N.H.; Barbosa, M.J.; Vermuë, M.H.; Wijffels, R.H. Microalgal production—A close look at the economics. Biotechnol. Adv. 2011, 29, 24–27. [Google Scholar] [CrossRef]
  19. Dasgupta, C.N.; Gilbert, J.J.; Lindblad, P.; Heidorn, T.; Borgvang, S.A.; Skjanes, K.; Das, D. Recent trends on the development of photobiological processes and photobioreactors for the improvement of hydrogen production. Int. J. Hydrogen Energ. 2010, 35, 10218–10238. [Google Scholar] [CrossRef]
  20. Grima, E.M.; Camacho, F.G.; Perez, J.A.S.; Sevilla, J.M.F.; Fernandez, F.G.A.; Gomez, A.C. A mathematical model of microalgal growth in light-limited chemostat culture. J. Chem. Technol. Biotechnol. 1994, 61, 167–173. [Google Scholar] [CrossRef]
  21. Richmond, A.; Boussiba, S.; Vonshak, A.; Kopel, R. A new tubular reactor for mass production of microalgae outdoors. J. Appl. Phycol. 1993, 5, 327–332. [Google Scholar] [CrossRef]
  22. Fernandez, F.G.A.; Sevilla, J.M.F.; Perez, J.A.S.; Grima, E.M.; Chisti, Y. Airlift driven external loop tubular photobioreactors for outdoor production of microalgae: Assessment of design and performance. Chem. Eng. Sci. 2001, 56, 2721–2732. [Google Scholar] [CrossRef] [Green Version]
  23. Kirnev, P.C.S.; Carvalho, J.C.; Vandenberghe, L.P.S.; Karp, S.G.; Soccol, C.R. Technological mapping and trends in photobioreactors for the production of microalgae. World J. Microb. Biot. 2020, 36, 42. [Google Scholar] [CrossRef]
  24. Yee, W. Microalgae from the Selenastraceae as emerging candidates for biodiesel production: A mini review. World J. Microb. Biot. 2016, 32, 64. [Google Scholar] [CrossRef]
  25. Guiry, M.D. AlgaeBase; Guiry, M.D., Guiry, G.M., Eds.; World-wide Electronic Publication, National University of Ireland: Galway, Ireland, 2020; Available online: https://www.algaebase.org (accessed on 15 January 2022).
  26. Aparicio, P.J.; Witt, F.G.; Ramírez, J.M.; Quiñones, M.A.; Balandín, T. Blue-light-induced pH changes associated with NO3, NO2 and Cl uptake by the green alga Monoraphidium braunii. Plant. Cell Environ. 1994, 17, 1323–1330. [Google Scholar] [CrossRef]
  27. Alhama, J.; López-Ruiz, A.; Diez, J.; García-Fernández, J.M. Effect of carbon and nitrogen availability on intracellular amino acids and ammonium pools in the green alga Monoraphidium braunii. J. Plant. Physiol. 1998, 153, 529–533. [Google Scholar] [CrossRef]
  28. Giráldez, N.; Aparicio, P.J.; Quiñones, M.A. Limiting CO2 levels induce a blue light-dependent HCO3 uptake system in Monoraphidium braunii. J. Exp. Bot. 2000, 51, 807–815. [Google Scholar] [CrossRef] [PubMed]
  29. Mora, C.; Witt, F.G.; Aparicio, P.J.; Quiñones, M.A. Independent induction of two blue light-dependent monovalent anion transport systems in the plasma membrane of Monoraphidium braunii. J. Exp. Bot. 2002, 53, 1909–1918. [Google Scholar] [CrossRef] [Green Version]
  30. Corzo, A.; Plasa, R.; Ullrich, W.R. Extracellular ferricyanide reduction and nitrate reductase activity in the green alga Monoraphidium braunii. Plant. Sci. 1991, 75, 221–228. [Google Scholar] [CrossRef]
  31. Navarro, J.A.; Roncel, M.; De la Rosa, M.A. On the reaction mechanism of flavin-sensitized photoregulation of Monoraphidium braunii nitrate reductase. J. Photochem. Photobiol. B Biol. 1991, 10, 211–220. [Google Scholar] [CrossRef]
  32. Vigara, A.J.; GarciaSanchez, M.I.; Gotor, C.; Vega, J.M. Interaction between glutamate synthase and ferredoxin from Monoraphidium braunii. Chemical modifications and cross-linking studies. Plant. Physiol. Biochem. 1996, 34, 707–711. [Google Scholar]
  33. García-Fernández, J.M.; López-Ruiz, A.; Humanes, L.; Dapena, J.D. Purification and characterization of glutamine synthetase from green alga Monoraphidium braunii. Plant. Sci. 1997, 123, 77–84. [Google Scholar] [CrossRef]
  34. González-Arroyo, J.G.; Vega, J.M.; Pérez-Castiñeira, J.R. Regulation of the O-acetyl-L-serine(thiol)lyase activity in Monoraphidium braunii. J. Physiol. Biochem. 1998, 54, 141–148. [Google Scholar]
  35. Hörnström, E.; Harbom, A.; Edberg, F.; Andrén, C. The influence of ph on aluminium toxicity in the phytoplakton species Monoraphidium dybowskii and M. griffithii. Water Air Soil Poll. 1995, 85, 817–822. [Google Scholar] [CrossRef]
  36. Takami, R.; Almeida, J.V.; Vardaris, C.V.; Colepicolo, P.; Barros, M.P. The interplay between thiol-compounds against chromium (VI) in the freshwater green alga Monoraphidium convolutum: Toxicology, photosynthesis, and oxidative stress at a glance. Aquat. Toxicol. 2012, 118, 80–87. [Google Scholar] [CrossRef]
  37. Bácsi, I.; Novák, Z.; Jánószky, M.; B-Béres, V.; Grigorszky, I.; Nagy, S.A. The sensitivity of two Monoraphidium species to zinc—Their possible future role in bioremediation. Int. J. Environ. Sci. Tech. 2015, 12, 2455–2466. [Google Scholar] [CrossRef] [Green Version]
  38. Novák, Z.; Harangi, S.; Baranyai, E.; Gonda, S.; B-Béres, V.; Bácsi, I. Effects of metal quantity and quality to the removal of zinc and copper by two common green microalgae (Chlorophyceae) species. Phycol. Res. 2020, 68, 227–235. [Google Scholar] [CrossRef]
  39. Levy, J.L.; Stauber, J.L.; Adams, M.S.; Maher, W.A.; Kirby, J.K.; Jolley, D.F. Toxicity, biotransformation, and mode of action of arsenic in two freshwater microalgae (Chlorella sp. and Monoraphidium arcuatum). Environ. Toxicol. Chem. 2005, 24, 2630–2639. [Google Scholar] [CrossRef]
  40. Fujii, K.; Nakashima, H.; Hashidzume, Y.; Uchiyama, T.; Mishiro, K.; Kadota, Y. Potential use of the astaxathin-producing microalga, Monoraphidium sp. GK12, as a functional aquafeed for prawns. J. Appl. Phycol. 2010, 22, 363–369. [Google Scholar] [CrossRef]
  41. Culture Collection of Algae and Protozoa. CCAP Media Recipes B. Available online: https://www.ccap.ac.uk/wp-content/uploads/MR_JM.pdf (accessed on 15 January 2022).
  42. Felföldy, L. Biological Water Qualification; Vízgazdálkodási Intézet (Institute of Water Management): Budapest, Hungary, 1987. [Google Scholar]
  43. Hungarian Standard MSZ 1484-13:2009; Water Quality. Part 13: Determination of Nitrate and Nitrite Content by Spectrophotometric Method. Hungarian Standards Institution: Budapest, Hungary, 2009. Available online: http://www.mszt.hu/web/guest/webaruhaz (accessed on 15 January 2022).
  44. ISO 6878:2004; Water Quality. Determination of Phosphorus. Ammonium Molybdate Spectrometric Method. International Organization for Standardization: Geneva, Switzerland, 2004. Available online: https://www.iso.org/standard/36917.html (accessed on 15 January 2022).
  45. Chen, W.; Zhang, C.; Song, L.; Sommerfeld, M.; Hu, Q. A high throughput Nile red method for quantitative measurement of neutral lipids in microalgae. J. Microbiol. Methods 2009, 77, 41–47. [Google Scholar] [CrossRef]
  46. Tarandjiiska, R.B.; Marekov, I.N. Precise classification of virgin olive oils with various linoleic acid contents based on triacylglycerol analysis. Anal. Chim. Acta 1998, 364, 83–91. [Google Scholar] [CrossRef]
  47. Thimijan, R.W.; Heins, R.D. Photometric, radiometric, and quantum light units of measure: A review of procedures for interconversion. HortScience 1983, 18, 818–822. [Google Scholar]
  48. Tamburic, B.; Evenhuis, C.R.; Sugget, D.J.; Larkum, A.W.D.; Raven, J.A.; Ralph, P.J. Gas transfer controls carbon limitation during biomass production by marine microalgae. ChemSusChem 2015, 8, 2727–2736. [Google Scholar] [CrossRef]
  49. Tamburic, B.; Evenhuis, C.R.; Crosswell, J.R.; Ralph, P.J. An empirical process model to predict microalgal carbon fixation rates in photobioreactors. Algal Res. 2018, 31, 334–346. [Google Scholar] [CrossRef]
  50. Zavřel, T.; Szabó, M.; Tamburic, B.; Evenhuis, C.R.; Kuzhiumparambil, U.; Literáková, P.; Larkum, A.W.D.; Raven, J.A.; Červený, J.; Ralph, P.J. Effect of carbon limitation on photosynthetic electron transport in Nannochloropsis oculata. J. Photochem. Photobiol. B Biol. 2018, 181, 31–43. [Google Scholar] [CrossRef] [Green Version]
  51. Gluszcz, P.; Klepacz-Smółka, A.; Ledakowicz, S. Experimental evaluation of a helical laboratory photobioreactor for cultivation of thermophilic cyanobacteria—Hydrodynamics and mass transfer studies. Chem. Process. Eng. 2018, 39, 457–473. [Google Scholar]
  52. Eriksen, N.T. The technology of microalgal culturing. Biotechnol. Lett. 2008, 30, 1525–1536. [Google Scholar] [CrossRef]
  53. Posten, C. Design principles of photo-bioreactors for cultivation of microalgae. Eng. Life Sci. 2009, 9, 165–177. [Google Scholar] [CrossRef]
  54. Wang, B.; Lan, C.Q.; Horsman, M. Closed photobioreactors for production of microalgal biomasses. Biotechnol. Adv. 2012, 30, 904–912. [Google Scholar] [CrossRef]
  55. Brewer, P.G.; Goldman, J.C. Alkalinity changes generated by phytoplankton growth. Limnol. Oceanogr. 1976, 21, 108–117. [Google Scholar] [CrossRef]
  56. Jacobi, A.; Ivanova, D.; Posten, C. Photobioreactors: Hydrodynamics and mass transfer. In Proceedings of the 11th International Symposium on Computer Applications in Biotechnology, Leuven, Belgium, 7–9 July 2010. [Google Scholar] [CrossRef]
  57. Pruvost, J.; Cornet, J.F. Knowledge models for the engineering and optimization of photobioreactors. In Microalgal Biotechnology: Potential and Production; Posten, C., Walter, C., Eds.; Walter de Gruyter: Berlin, Germany, 2012; pp. 181–224. [Google Scholar]
  58. Richmond, A.; Hu, Q. Handbook of Microalgal Culture Applied Phycology and Biotechnology, 2nd ed.; Wiley Blackwell: Chichester, UK, 2013. [Google Scholar]
  59. Shriwastav, A.; Gupta, S.K.; Ansari, F.A.; Rawat, I.; Bux, F. Adaptability of growth and nutrient uptake potential of Chlorella sorokiniana with variable nutrient loading. Bioresour. Technol. 2014, 174, 60–66. [Google Scholar] [CrossRef] [PubMed]
  60. Choi, H.J.; Lee, S.M. Effect of the N/P ratio on biomass productivity and nutrient removal from municipal wastewater. Bioproc. Biosyst. Eng. 2015, 38, 761–766. [Google Scholar] [CrossRef] [PubMed]
  61. Liu, J.; Vyverman, W. Differences in nutrient uptake capacity of the benthic filamentous algae Cladophora sp., Klebsormidium sp. and Pseudanabaena sp. under varying N/P conditions. Bioresour. Technol. 2015, 179, 234–242. [Google Scholar] [CrossRef]
  62. Alketife, A.M.; Judd, S.; Znad, H. Synergistic effects and optimization of nitrogen and phosphorus concentrations on the growth and nutrient uptake of a freshwater Chlorella vulgaris. Environ Technol. 2017, 38, 94–102. [Google Scholar] [CrossRef]
  63. Arora, N.; Laurens, L.M.L.; Sweeney, N.; Pruthi, V.; Poluri, K.M.; Pienkos, P.T. Elucidating the unique physiological responses of halotolerant Scenedesmus sp. cultivated in sea water for biofuel production. Algal Res. 2019, 37, 260–268. [Google Scholar] [CrossRef]
  64. Figler, A.; Márton, K.; B-Béres, V.; Bácsi, I. Effects of nutrient content and nitrogen to phosphorus ratio on the growth, nutrient removal and desalination properties of the green alga Coelastrum morus on a laboratory scale. Energies 2021, 14, 2112. [Google Scholar] [CrossRef]
  65. Bogen, C.; Al-Dilaimi, A.; Albersmeier, A.; Wichmann, J.; Grundmann, M.; Rupp, O.; Lauersen, K.J.; Bilfernez-Klassen, O.; Kalinowski, J.; Goesmann, A.; et al. Reconstruction of the lipid metabolism for the microalga Monoraphidium neglectum from its genome sequence reveals characteristics suitable for biofuel production. BMC Genom. 2013, 14, 926. [Google Scholar] [CrossRef] [Green Version]
  66. Dhup, S.; Dhawan, V. Effect of nitrogen contentration on lipid productivity and fatty acid composition of Monoraphidium sp. Bioresour. Technol. 2014, 152, 572–575. [Google Scholar] [CrossRef] [PubMed]
  67. He, Q.; Yang, H.; Wu, L.; Hu, C. Effect of light intensity on physiological changes, carbon allocation and neutral lipid accumulation in oleaginous microalgae. Bioresour. Technol. 2015, 191, 219–228. [Google Scholar] [CrossRef] [PubMed]
  68. George, B.; Pancha, I.; Desai, C.; Chokshi, K.; Paliwal, C.; Ghosh, T.; Mishra, S. Effect of different media composition, light intensity and photoperiod on morphology and physiology of freshwater microalgae Ankistrodesmus falcatus—A pontential strain for bio-fuel production. Bioresour. Technol. 2014, 171, 367–374. [Google Scholar] [CrossRef]
Figure 1. Schematic representation of the main parts of the hybrid photobioreactor and the assembled device. A control unit for the illumination and for the whole system and a peristaltic pump for culture circulation are also parts of the equipment.
Applsci 12 02196 g001
Figure 2. Changes in oxygen saturation (a,b) and pH (c,d) in control (C) and nitrogen depleted (75, 50, 25%-N) Monoraphidium pusillum cultures in the hybrid reactor (HR) and in the tank reactor (TR). Means (n = 3) and standard deviations are plotted. Different lowercase letters at curves mean significant differences among the last day values (p < 0.05).
Applsci 12 02196 g002
Figure 3. Cell numbers in the control (C) and nitrogen depleted (75, 50 and 25%-N) Monoraphidium pusillum cultures (a) in the hybrid reactor (HR) and (b) in the tank reactor (TR). (c) Cell numbers on the last (7th) day of the experiments in the tank reactor and in the hybrid reactor before collecting the whole biomass (HR-Before) and after collecting the whole biomass (HR-After). Means (n = 3) and standard deviations are plotted. Different lowercase letters at curves mean significant differences among the last day values; asterisks mean significant differences among treatments (p < 0.05).
Applsci 12 02196 g003
Figure 4. Chlorophyll concentrations in the control (C) and nitrogen depleted (75, 50 and 25%-N) Monoraphidium pusillum cultures (a) in the hybrid reactor (HR) and (b) in the tank reactor (TR). Means (n = 3) and standard deviations are plotted. Different lowercase letters at curves mean significant differences among the last day values (p < 0.05).
Applsci 12 02196 g004
Figure 5. Dry masses on the last (7th) day of the experiment in the control (C) and nitrogen depleted (75, 50, and 25%-N) Monoraphidium pusillum cultures in the hybrid reactor (HR) and in the tank reactor (TR). Means (n = 3) and standard deviations are plotted. Different lowercase letters represent significant differences (p < 0.05).
Applsci 12 02196 g005
Figure 6. Nitrate (a,b) and phosphate (c,d) uptake in control (C) and nitrogen depleted (75, 50, 25%-N) Monoraphidium pusillum cultures in the hybrid reactor (HR) and in the tank reactor (TR). Means (n = 3) and standard deviations are plotted. Different lowercase letters at curves mean significant differences among the last day values (p < 0.05).
Applsci 12 02196 g006aApplsci 12 02196 g006b
Figure 7. Total lipid contents (a) per unit of dry mass and (b) per unit of culture volume on the last (7th) day of the experiment in the control (C) and nitrogen depleted (75, 50, and 25%-N) Monoraphidium pusillum cultures in the hybrid reactor (HR) and in the tank reactor (TR). Different lowercase letters represent significant differences. Means (n = 3) and standard deviations are plotted.
Applsci 12 02196 g007
Figure 8. Preliminary analysis of lipid composition by thin layer chromatography of biomasses from control (C) and nitrogen depleted (75, 50 and 25%-N) Monoraphidium pusillum cultures (a) in the hybrid reactor (HR) and (b) in the tank reactor (TR). Means (n = 3) and standard deviations are plotted. Asterisks represents significant differences of the same peak among different treatments.
Applsci 12 02196 g008aApplsci 12 02196 g008b
Publisher’s Note: MDPI stays neutral with regard to jurisdictional claims in published maps and institutional affiliations.

