1. Introduction
Freshwater is one of the most important components to maintain human survival. The reliability and sustainability of water distribution infrastructure (WDI) are always the fundamental issues determining the livability of cities. The WDIs established in the past are now facing an aging problem. The number of leakages and bursts has been ever-escalating year-by-year. This results in not only economic losses but also the dissipation of natural resources. Half of the freshwater is wasted worldwide due to leaking pipelines [
1]. In the United States, over 200,000 water bursts are recorded, yielding USD 2 billion of economic loss every year [
2]. In Europe, WDIs in England, France, and Italy are leaking around 25% of freshwater annually [
2]. It is also highlighted that 15% of the freshwater is wasted due to leaking pipelines in Hong Kong [
3]. To combat this problem, current research on water leak detection technologies with high detection accuracy shows great effectiveness in protecting water resources and mitigating economic loss.
A variety of water leak detection approaches for WDIs were developed by researchers. One of the most common leak detection methods is manual listening through portable detection devices [
4]. These devices are usually placed on the surface of the pipelines, and the leaking point is determined by listening for changes in sound or vibration produced by leaky pipes. Paper [
5] proposed an effective detection scheme based on acoustic emission and pattern recognition. Paper [
6] proved the leak detection efficiency via laboratory validation experiments with ground penetrating radar. Other detection approaches based on portable devices have been developed [
7,
8,
9].
However, low penetration capability and ambient noise are two critical challenges for external portable detection. Moreover, lack of autonomy is another disadvantage for external portable detection. As a result, internal automatic leak detection methods are being explored. An automatic leak detection system integrates internal-sensor water network and automatic leak detection algorithms, which enable capacities in real-time motoring and early detection. In an internal-sensor water network, wireless sensors (e.g., flow meters, pressure sensors) are embedded into pipelines for remote data measurement and collection. Based on the data from internal sensors in the water distribution network, automatic leak detection algorithms have been developed to analyze variations in hydraulic behavior, indicate pipe status, and produce early alarms. Given their high efficiency, internal automatic leak detection systems have been reported extensively in the literature [
10,
11,
12,
13]. The paper [
11] proposed a small-town water system combining water balance and minimum night flow approaches to detect water leakage efficiently. However, only the influence on water flow was considered. The detection accuracy can be improved by integrating other types of sensors (e.g., pressure sensors). In paper [
13], an accelerometer-based automatic leak detection system was developed for early detection of single-event leaks in water pipelines with high accuracy; however, it shows relative low efficiency in the detection of multiple leak. To reduce the computational complexity, in [
14] a model reduced by integrating multiple pipe branches into a single node was proposed to convert complicated WDI into a network. In terms of the practicability of internal automatic leak detection, various automatic leak detection algorithms have been developed, including state estimation algorithms [
15,
16], signal analysis algorithms [
2,
17], machine learning algorithms [
12,
18,
19], etc. The paper [
15] proposed a burst detection approach that utilizes an adaptive Kalman filter to perform hydraulic measurement of flow and pressure in a district metered area (DMA). In research [
17], a burst detection scheme using principal component analysis was proposed, which enables a sensitive and quick analysis of water flow in DMAs with low computational complexity. By integrating CNN-SVM and graph-based localization algorithms, the proposed leakage detection scheme in paper [
18] achieved more than 90% detection accuracy and positioning accuracy within less than 3 m.
Most of the aforementioned leakage detection schemes and algorithms showed relatively high detection accuracy in experimental settings or a certain part of WDI. Nevertheless, these methodologies would reveal certain limitations in flexibility and adaptiveness whenever water distribution infrastructure is modified or expanded. In general, WDIs inevitably undergo modification or expansion due to urban reconstruction or pipeline system optimization. When a new pipe branch is added to the existing system, most of the above detection algorithms need to be reconfigured to apply to the new pipeline architecture, which increases the complexity of operation. In addition, different hydraulic behaviors in various pipeline conditions are not considered in these algorithms. These hydraulic behaviors greatly impact the accuracy of detection. For instance, water pressure decreases gradually as the distance from the water pump increases. The corresponding water pressure due to leakage would also drop. Hence, it is necessary to assign different levels of importance to different hydraulic behaviors to ensure leak detection accuracy for each pipeline. Further, whether these detection methods are applicable to multiple leaks remains to be investigated.
This paper aims at developing a multi-leak identification (MLI) system for WDI. At this point in time, the real challenges in leak detection and the related research consist of the following: (i) lack of systematic design for automated leak detection systems; (ii) low practicability limited by inhomogeneous operating environments, i.e., the MLI system might perform differently in different parts of WDI; and (iii) lack of adaptiveness to modifications of WDI (referred to as the addition/removal/repair/replacement of pipelines).
In view of the need for an MLI system, a multi-classification MLI system (MC-MLI) for WDI is developed in this paper. An adaptive kernel (AK), which is the core of classification, is designed to incorporate the weighting vector into the extracted feature vector. The weighting vector revealing the features’ importance levels will improve the overall detection performance. The problem of inhomogeneous working environments is always critical, and now it will be solved by the proposed multi-classification (MC) scheme. The MC scheme is composed of multiple unique classifiers assigned to the specific pipe sections. The classifiers are configured by different classifier scenarios, which are subject to feature combinations, feature weighting vector, and performance weighting vector. Every scenario has different detection performance, and will be chosen to meet certain requirements (e.g., sensitivity > detection time > cost). Thus, the proposed MC scheme can adapt to inhomogeneous working environments and system requirements. High system flexibility to the modification of WDI is another crucial advantage attributed to the MC scheme. When WDI is modified, only several affected classifiers will be re-trained, or new classifiers will be trained for new pipe sections. This mechanism significantly improves system feasibility.
The novelty of this study is as follows. A new multi-leak detection scheme, namely multi-classification-based multi-leak identification (MC-MLI), is developed for WDI. In this scheme, an adaptive kernel (AK) and a multi-classification (MC) algorithm are developed to adapt to inhomogeneous working environments and maintain high detection accuracy.
2. Methodology of the Multi-Classification Multi-Leak Identification (MC-MLI) Scheme
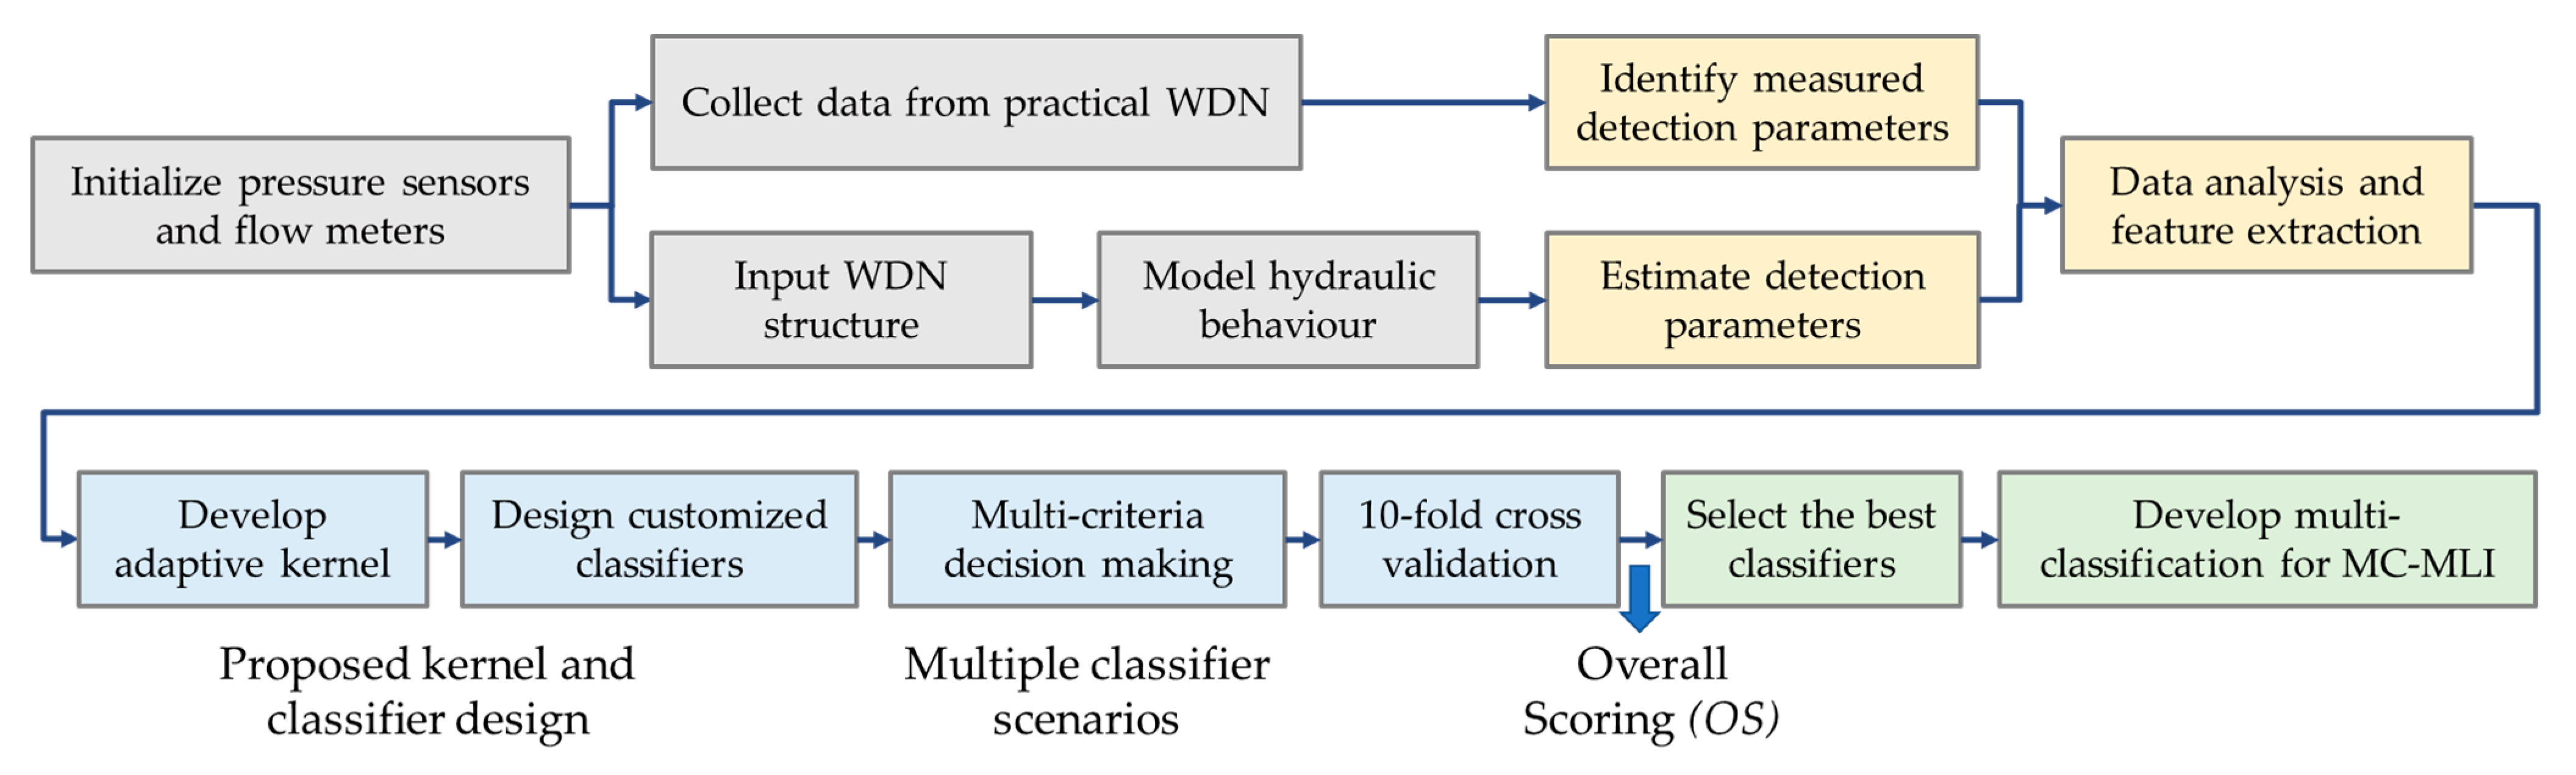
In this paper, an MC-MLI for WDI is proposed, and its development flow is illustrated in
Figure 1. First, pressure sensors and flow meters are deployed and initialized in WDI. Data collection from practical WDI is then performed. The measured detection parameters, such as mean value, peak-to-peak value, and the variance in flow rates and pressures, are collected. Furthermore, the water behavior of the WDI determined by the WDI structure, the pipe properties and sensor locations, etc., are modeled as a hydraulic model. The estimated detection parameters can then be obtained based on the hydraulic model. Afterward, data analysis and feature extraction are performed to design the adaptive kernel, which is the core of classification. It is worthwhile to point out that the proposed multi-classification is a parallel structure in which the status of each pipe section is identified by a unique classifier. Feature combination will influence the design of the adaptive kernel and the detection performance. The proposed scheme is adaptive in that various classifiers might have different feature combinations and kernels to accomplish the desired detection performance. For instance, sensitivity and detection time take priority over accuracy and specificity for an important pipe section. Multiple classifier scenarios with varying feature combinations are created and evaluated by multi-criteria decision-making (MCDM). Afterward, the overall scoring of each classifier scenario is obtained and becomes the reference to select the best classifier under certain system requirements. Finally, MLI is obtained by integrating all selected classifiers in a parallel structure.
2.1. Hydraulic Model Analysis
A hydraulic model is a mathematical model to represent the water behavior in a given hydraulic system. The model facilitates the analysis of general WDIs. In this paper, the model revealing hydraulic behavior in the pipeline system is used to estimate the identification parameters for feature vector construction.
Obviously, there is no ideal (frictionless) fluid in a practical situation. Energy is required to push fluid moving along a pipe against the friction due to the fluid viscosity. The energy, also known as the loss in pressure energy, is defined as the hydraulic head loss in a pipe. The factors affecting hydraulic head loss include flow rate, the friction of the inner wall related to pipe material, and pipe diameter.
The Hazen–William equation is an empirical formulation to describe the water flow inside the pipeline with practical considerations such as pipe material, pipe diameter, pressure drop due to friction, etc. It has lower complexity compared to other hydraulic models, and therefore, it is suitable for low-cost and real-time applications. According to the Hazen–Williams equation, the water flow rate
(m
3/s) in a pipe is expressed as follows [
20]:
where
is the Hazen–Williams friction coefficient dependent on the pipe material [
21].
is the pipe diameter in meters, and
represents the energy slope, which is also known as the head loss per pipe length.
The proposed scheme considers not only the water flow rate but also pressure drop. Similarly, pressure drop
(kPa/m) as defined in the Hazen–Williams equation is expressed as follows [
20]:
where
,
, and
are consistent with previous definitions.
is the specific gravity of the liquid, and the
of water equals 1.
Note that the Hazen–Williams equation is generally accurate under the conditions of >50 mm pipe diameter, 5–25 °C water temperature, and <1.2 MPa of inner pressure. Otherwise, a large error will occur, and a more complicated hydraulic model, namely the D’Arcy–Weisbach formula, should be considered.
2.2. Feature Extraction for the MC-MLI
The features are defined as the parameters that can be commonly found in all situations but demonstrate distinctive characteristics. Based on the data analysis, ten (10) features are extracted for pattern recognition and classification. They are listed in
Table 1.
The feature vector
with features entry
for
, is formulated as follows:
where
denotes the number of features and is equal to 10 in this case.
Note that the extracted features will be further analyzed and weighted at the stage of designing an adaptive kernel. Further, the proposed MC-MLI is said to be adaptive because it combines multiple unique classifiers that are customized to the assigned pipe sections. Eventually, the overall detection performance will be enhanced. The variation of data quality among different pipes will influence detection performance. For example, the pressure in a pipe at a faraway location might remain at a low level. False alarms might frequently occur if all classifiers utilize the same feature vector. In this paper, the customization of the feature vector for each pipe section will overcome the captioned challenge and thus improve overall detection performance.
2.3. The Adaptive Kernel Design for MC-MLI
The proposed MC-MLI scheme involves a classification problem to identify multiple leak points. As such, a support vector machine (SVM), recognized for its low computational cost and good classification performance, is suitable for MLI in WDI. Therefore, SVM-based multi-classification is designed and customized with a newly designed adaptive kernel.
In most practical problems, data are not linearly separable. Non-linear hyperplanes separating the data of different classes will significantly increase computational cost, which is not practical. Kernel trick is a solution to model linear hyperplanes through mapping the input feature vector into a high-dimension feature space.
Conventionally, all features share the same weighting in the kernel trick method. However, the feature importance should not be equal in reality. This means that various features should contribute to the classification to different degrees. The kernel function is not able to discover the feature importance levels. Therefore, an adaptive kernel is designed via incorporating a weighting vector and the feature vector. Correlation is performed on the features to determine their importance levels and weighting values. A higher correlation coefficient value for a feature indicates that it has a higher impact on the classification output. Therefore, a larger weighting value is assigned to that feature.
The designed adaptive kernel
is formulated as:
where
and
denote the feature vectors of
i-th and
j-th data samples, respectively.
is the radial basis function (RBF) kernel with respect to the
n-th feature entry, for
of the feature vector.
represents the weighting of the
n-th feature entry of the feature vector, and it is calculated by:
where (¯) denotes taking the mean value and
is the class label.
is the total number of training data samples. Note that the number of training samples of normal cases and leak cases are equal to avoid the classifier being biased.
The data for different classes can be linearly separated by hyperplanes after the feature vectors are transformed into high-dimensional feature space using a kernel trick. The feature vectors lying on the hyperplanes are defined as support vectors. The gap between the support vectors is defined as a margin. A larger separation distance of the margin will increase classification accuracy because the data for other classes are less likely to cross the large-distance margin. The high leak identification accuracy will be achieved by solving the maximizing margin problem. The customized optimization problem is formulated as follows:
where
denotes the Lagrange multiplier and
is the designed adaptive kernel.
2.4. The Development of Multi-Classification for MLI
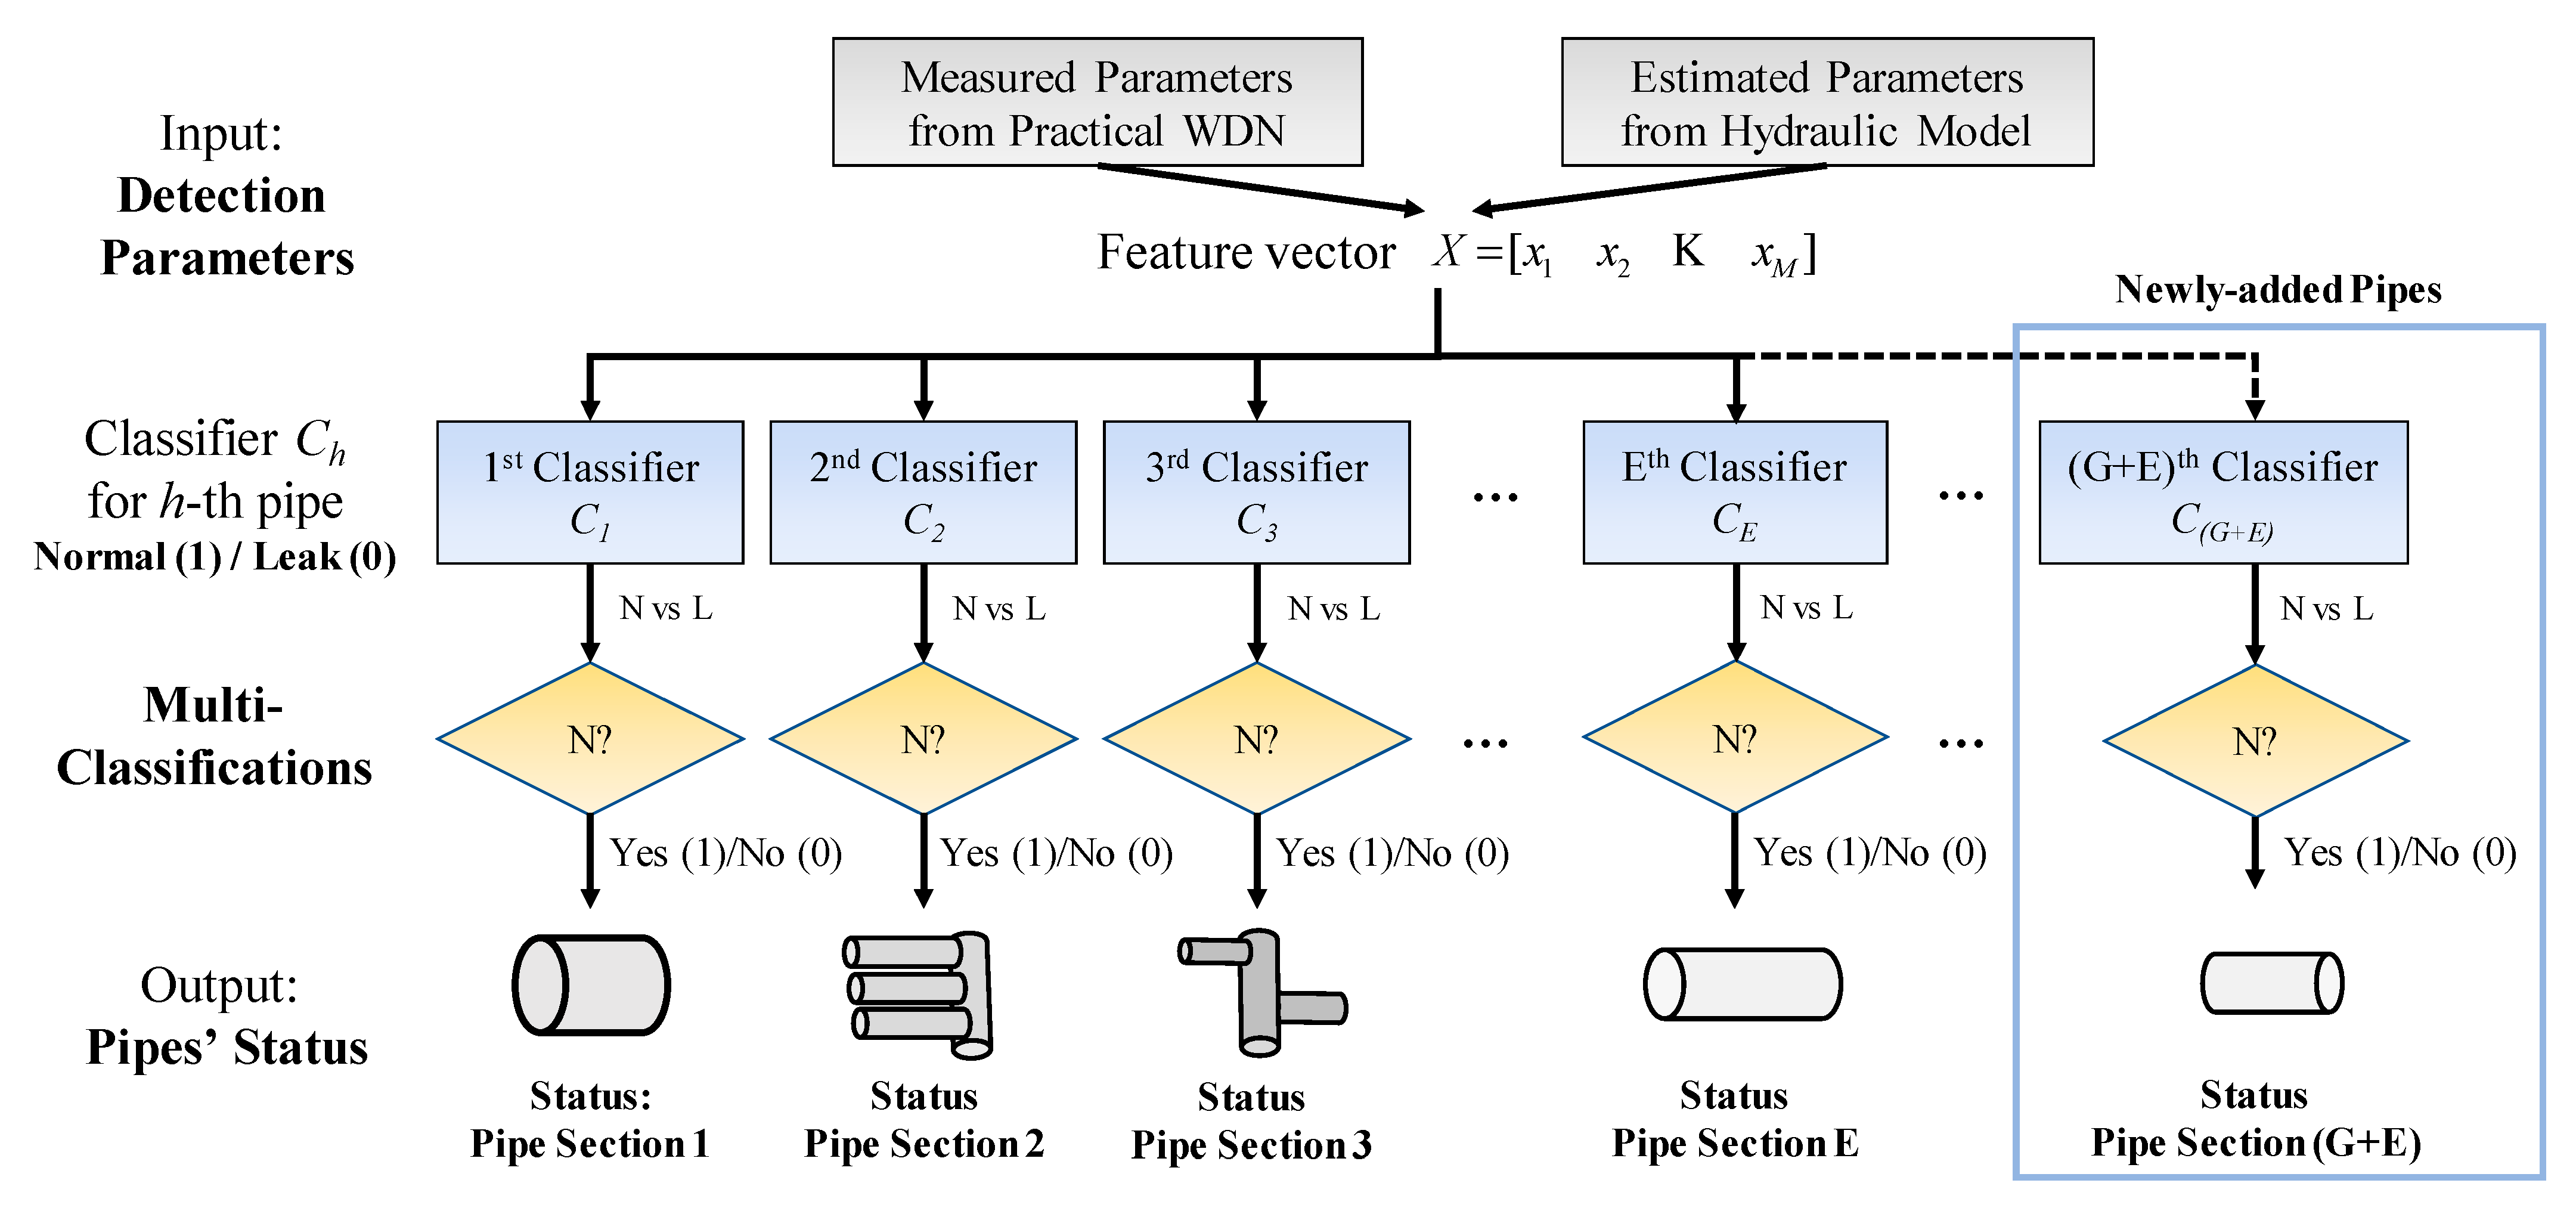
Inspired by biometric authentication, each pipe section is assigned with a unique classifier to identify the pipe status.
Figure 2 shows the parallel detection structure of the proposed MC-MLI. The input of MC-MLI is the feature vector composed of the measured parameters from practical WDI and the estimated parameters from the hydraulic model. For a classifier
Ch of the
h-th pipe section, the output “1” means the pipe section operates normally, where the output “0” means leakage exists in the pipe section. Each pipe status is identified by a unique classifier. It is worthwhile to point out that the parallel structure facilitates the expansion of WDI. For example, when a new pipe section (e.g., (
G +
E)th pipe section) is connected to the WDI, a new classifier
C(G+E) will be trained for the newly added pipe section. Other existing classifiers do not need to be re-trained unless the new pipe section influences the hydraulic behaviors of other pipe sections. The advantages of the proposed multi-classification structure are summarized as:
where
is the value of Acc, Se, Sp, and T.
is the number of classifier scenarios.
The overall scoring
of classifier
in the b-th scenario is computed as:
where
is the weighting of the
a-th criterion obtained from AHP (with pairwise comparison [
22]).
The overall scoring obtained from MCDM is a good indicator to evaluate classifier performance. The values of the four criteria are obtained from 10-fold cross-validation. Ten-fold cross-validation is a commonly adopted method for training and validating classifiers.
The proposed MC-MLI was implemented experimentally and evaluated practically. Around 500,000 pieces of data were collected and analyzed. The huge amount of data was sufficient to develop and validate the proposed MC-MLI.
3. Performance Evaluation of Different Classifier Scenarios
3.1. Experimental Setup for Evaluating MC-MLI
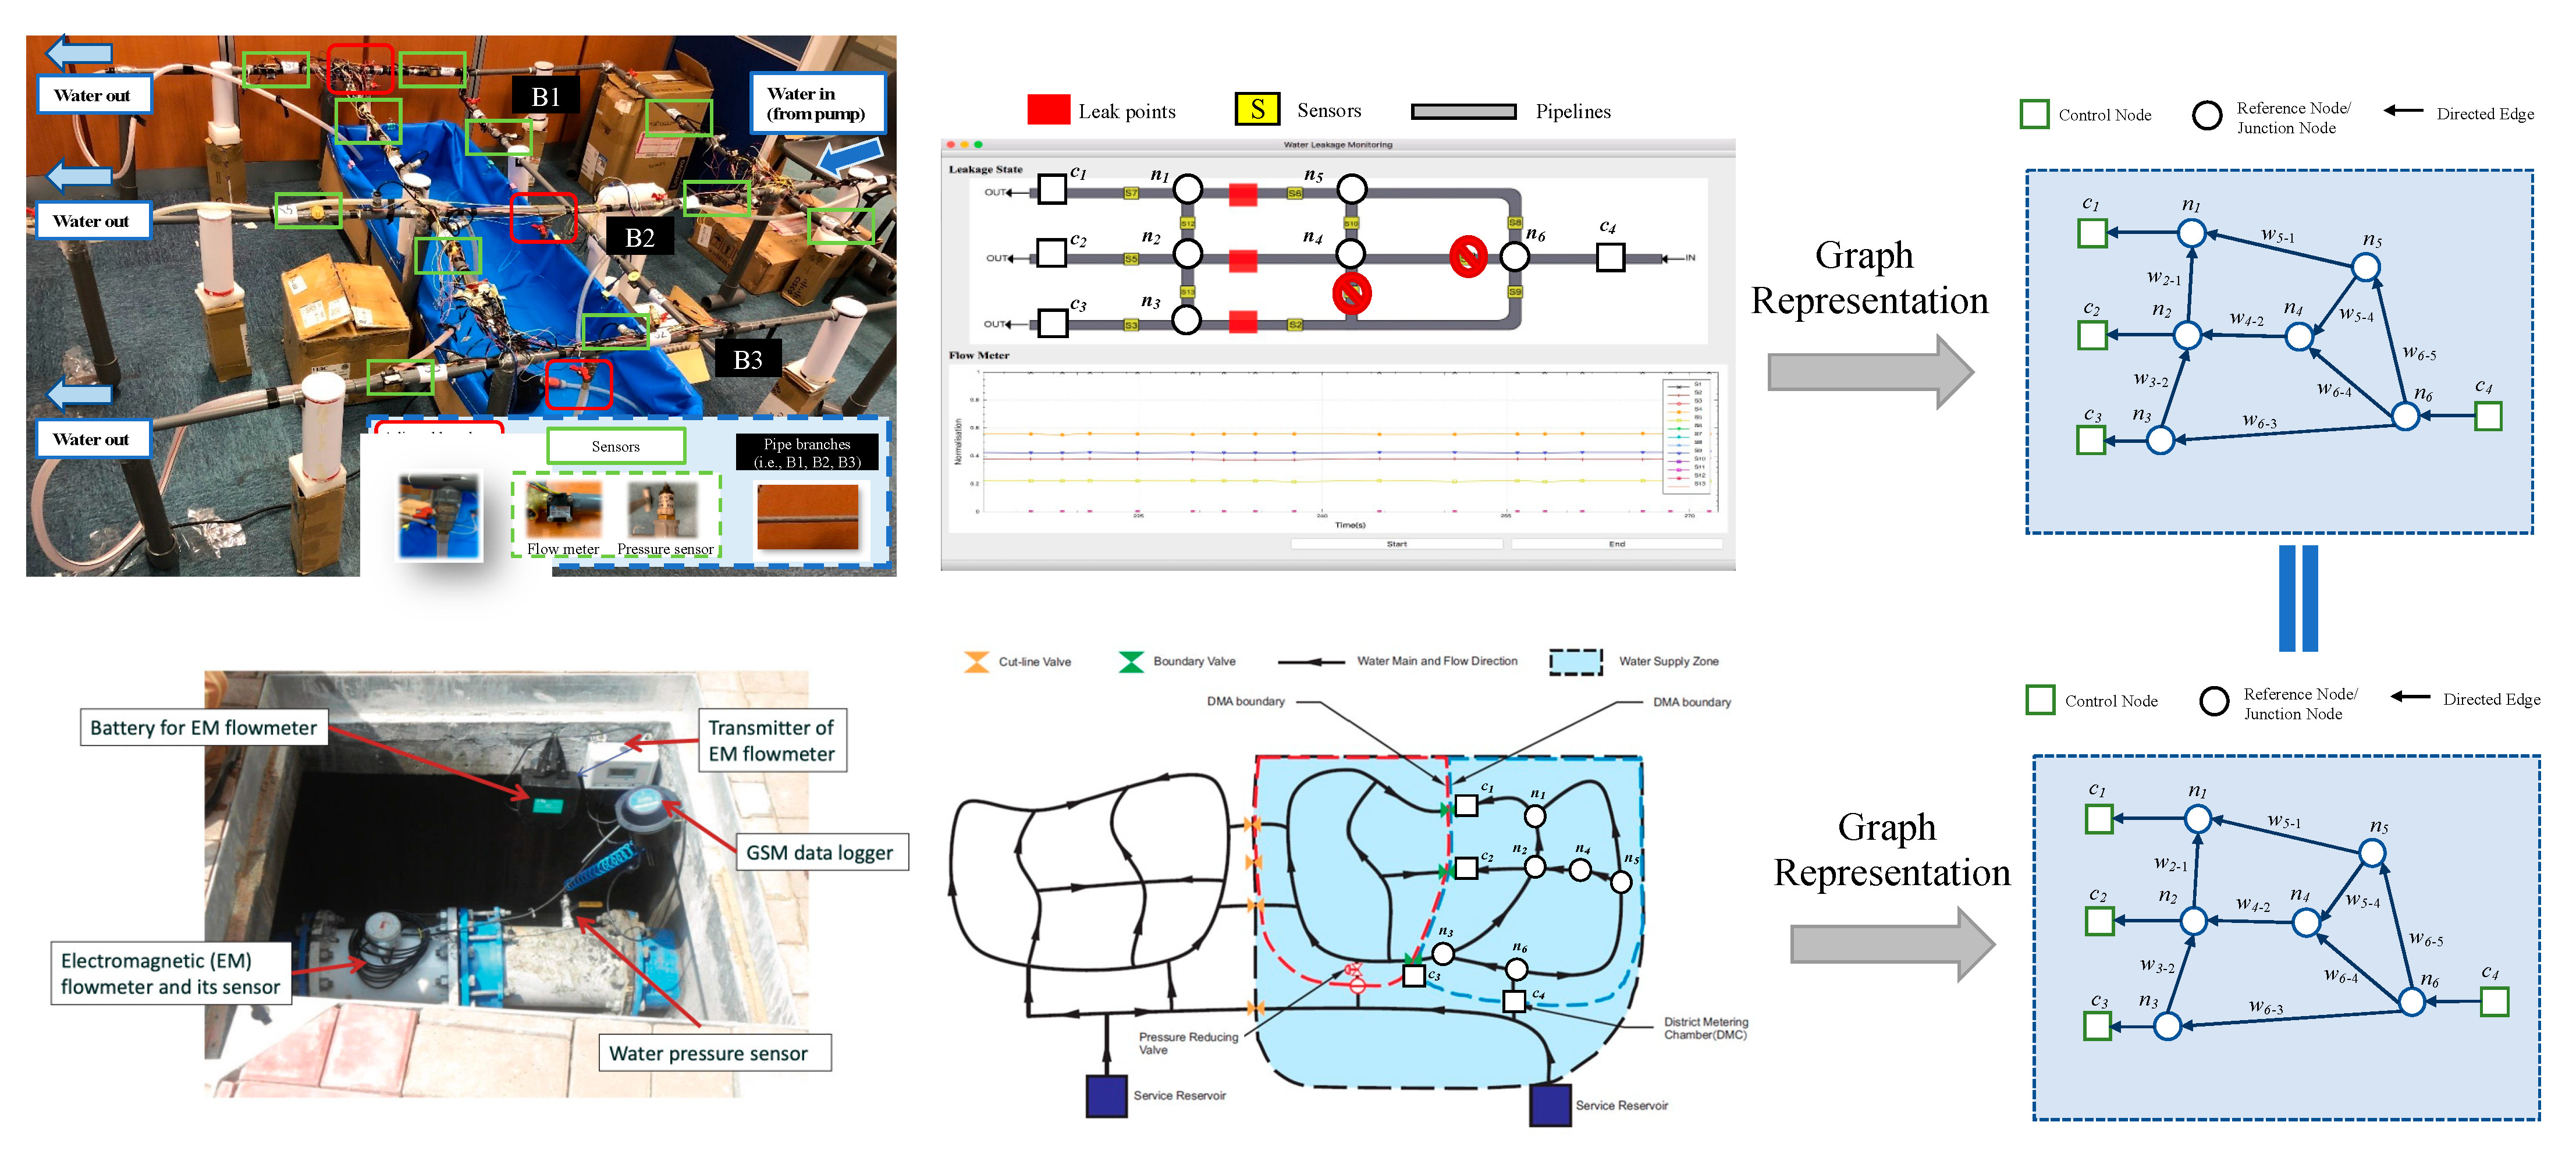
In real WDI, the underground pipeline network consists of multiple branches for water distribution. In this paper, a multi-leak scenario is considered, and thus a multi-branch pipe network is established. Recently, plastic pipe has been more common in practical WDIs due to its low-cost, light-weight, chemically and electrically neutral, anti-rusting and anti-corrosion properties. Therefore, the pipes utilized in the experimental setup are made of PVC. The proposed scheme is applicable to other WDIs using pipes made of other materials by adjusting several parameters in the hydraulic model. The experimental setup of the multi-branch pipe network (i.e., 3 branches: B1, B2, B3) is shown in
Figure 3. Each sensor group contains a flow meter (Q) and a pressure sensor (P). All sensors are connected to Arduino broad for data transmission. In the middle of each branch, one adjustable valve is installed to act as a leak point (L). This facilitates the evaluation of different leak sizes/rates by controlling the degree of valve opening.
Graph theory is the best candidate to represent pairwise linkages between entities. In this paper, the WDI is transformed into a directed graph using graph theory, thus identifying the behavior of WDI and exploring the correlation between a real-world model and small-scale model. An example of transforming a realistic WDI model and the developed small-scale WDI model is shown in
Figure 3. Water supply zones can be clustered by deploying cut-line valves and boundary valves. The valves control the amount of water flowing into the zones, and thus they can be transformed into control nodes
in the directed graph. Denoted
and
are the
i-th node and the edge between the
i-th and
j-th nodes in the directed graph, respectively. The node
n represents the reference and/or conjunction point in a realistic WDI, whereas the edge represents the pipe connecting two points. The pairwise relations between nodes can be formulated as an adjacent matrix, i.e.,
where the entry
represents the directed connection from the
i-th node to the
j-th node. If there is a connection between the
i-th node and the
j-th node,
equals 1. Otherwise, there is no connection between them, and
equals 0.
The essential metrics in graph theory include average node degree K, average node betweenness NB, edge betweenness EB, and the distribution of edge weighting. In order to compare these metrics between realistic a WDI and the small-scale WDI, the developed small-scale model is transformed into a graph representation, as shown in
Figure 3. The transformed small-scale model is configured the same as one of the water supply zones. The correlation between the two transformed models is evaluated as follows.
where
n denotes the amount of data,
denotes the
m-th metric of the transformed realistic WDI model, and
denotes the
m-th metric of the transformed small-scale model.
The results reveal that the transformed realistic WDI model is highly correlated to the transformed small-scale WDI model, reflected on the resultant coefficient of correlation (close to 1).
3.2. Performance Evaluation of the MC-MLI
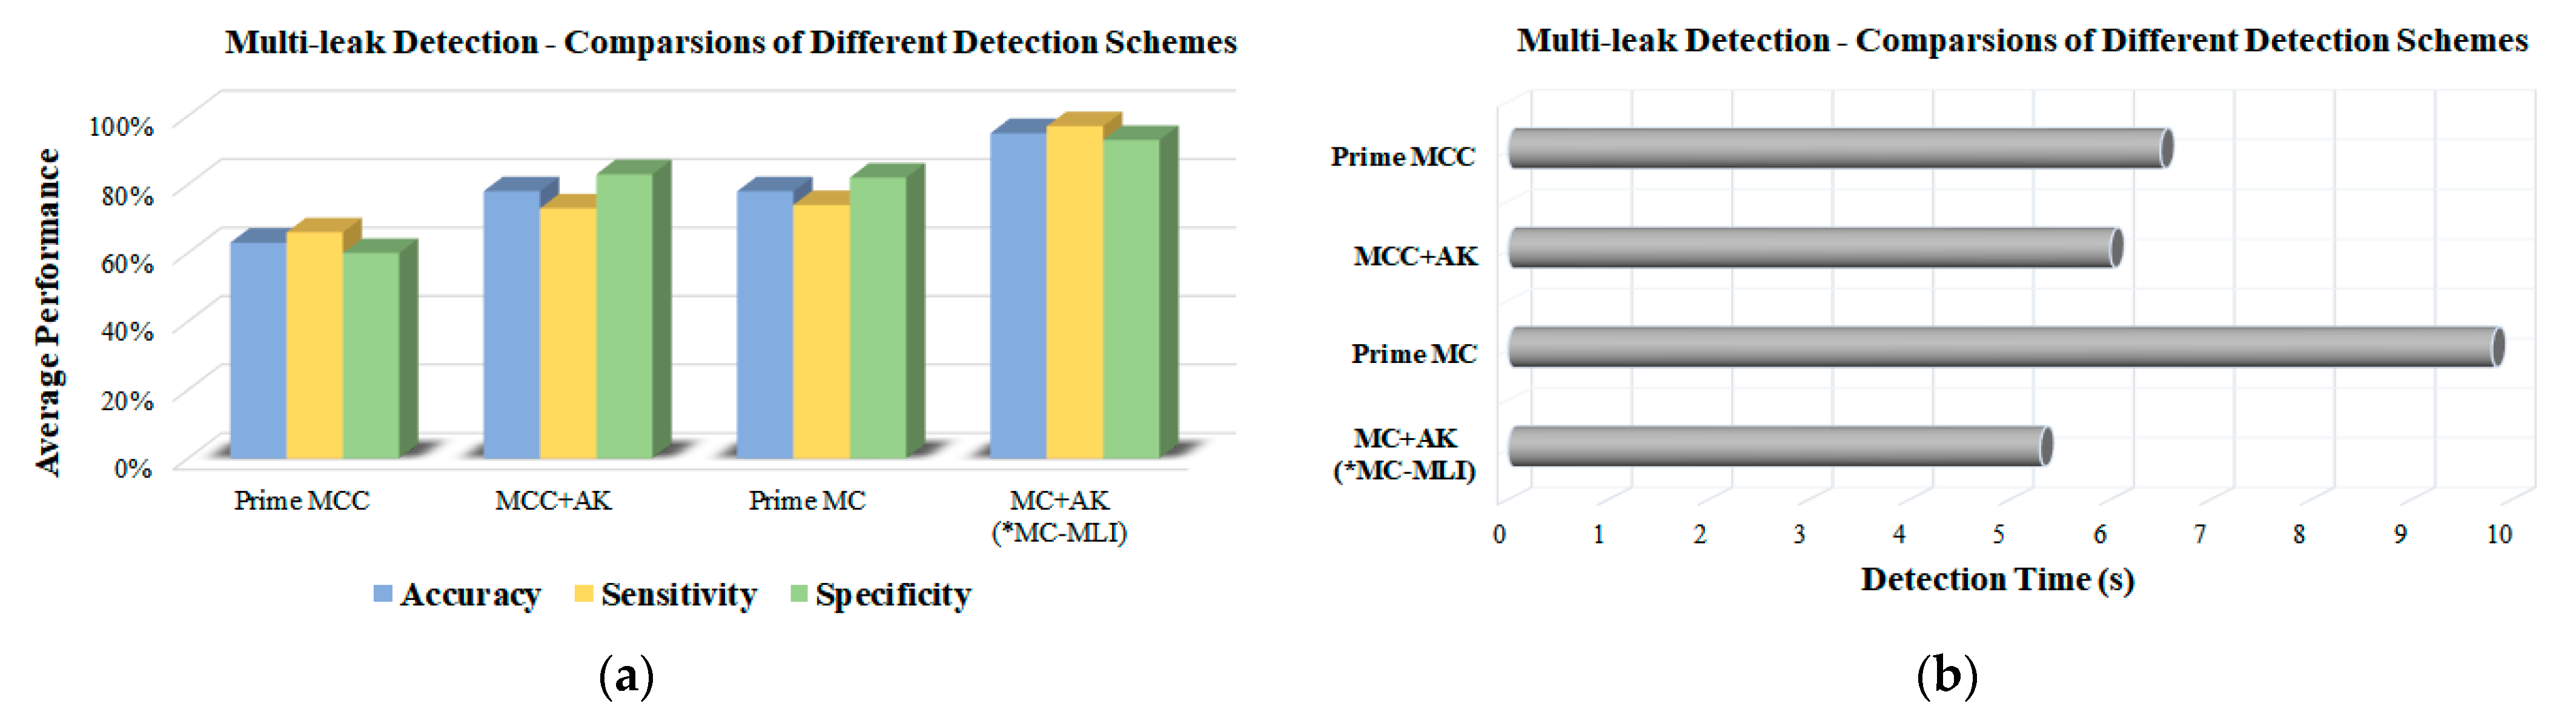
The performance of the proposed MC-MLI is evaluated in terms of average accuracy, sensitivity, specificity, and detection time. In this experiment, all classification schemes are evaluated under the same scenario, i.e., the same training data, same testing data, and the same leak scenario. Three (3) schemes are compared, namely prime multi-class classification (prime MCC), multi-class classification with the adaptive kernel (MCC + AK), prime multi-classification (prime MC), and multi-classification with the adaptive kernel (MC + AK) (the proposed MC-MLI). The multi-class classification refers to one multi-class classifier. The multi-classification refers to multiple binary classifiers. The prime classification means the classifier does not comprise any adaptive kernel or MCDM.
As shown in
Figure 4, the proposed MC-MLI achieves the best performances: 96.1% accuracy, 96.9% sensitivity, 95.3% specificity, and 5.3 s detection time. The comparison of prime MCC and MCC + AK reveals that the adaptive kernel significantly improves detection accuracy, sensitivity and specificity by >15%. The main drawback of multi-class classification is low accuracy, and thus the performance of MCC + AK is limited. The performance of multi-class classification degrades with the increasing number of classes. This renders serious challenges for multi-leak detection. For instance, if there are 10 pipe sections and 10 potential leak points, the number of leak combinations will be 1023, and thus 1023 classes will be needed for the multi-class classifier. Furthermore, multi-class approaches are inflexible in that the entire detection system need to be re-trained when a new pipe section is connected.
Multi-classification is proposed to overcome the captioned challenges. The multi-classification can break down an entire pipeline system into numerous pipe sections. A unique classifier is assigned to each pipe section. This facilitates classifier customization for every pipe. Furthermore, it is not necessary to re-train the entire detection system when the new pipe section is connected. A new classifier will be assigned and customized to the new pipe section. This facilitates the management of WDI. The result demonstrates that prime MC achieves higher accuracy, sensitivity and specificity than that of prime MCC. The performance of the prime MC is close to MCC + AK. This proves that multi-classification accomplishes better identification performances than multi-class classification. However, the detection time of prime MC is much longer than that of other schemes due to the complex feature vector. The proposed MC-MLI solves the problem by determining the best feature combination for every classifier by MCDM. Owing to weighting assignment for feature importance levels, MC-MLI using adaptive kernel improves accuracy, sensitivity and specificity by >15% compared to the prime MC.
3.3. Performance Evaluation of Different Classifier Scenarios
The proposed MC-MLI customizes every classifier for the assigned pipe sections. The hydraulic behavior of each pipe section can be different. It depends on various factors, such as pipe locations, user behaviors, pipe properties, network structure, etc. The classifier customization will improve not only detection performance but also operating efficiency by selecting a proper feature combination. In addition, the classifier customization facilitates meeting certain performance requirements. For example, the classifier scenario with short detection time and high sensitivity will be chosen for the important pipe sections. The classifier scenario with high specificity will be chosen for the pipes with a lower importance level. This reduces the probability of false alarms as well as unnecessary inspection costs.
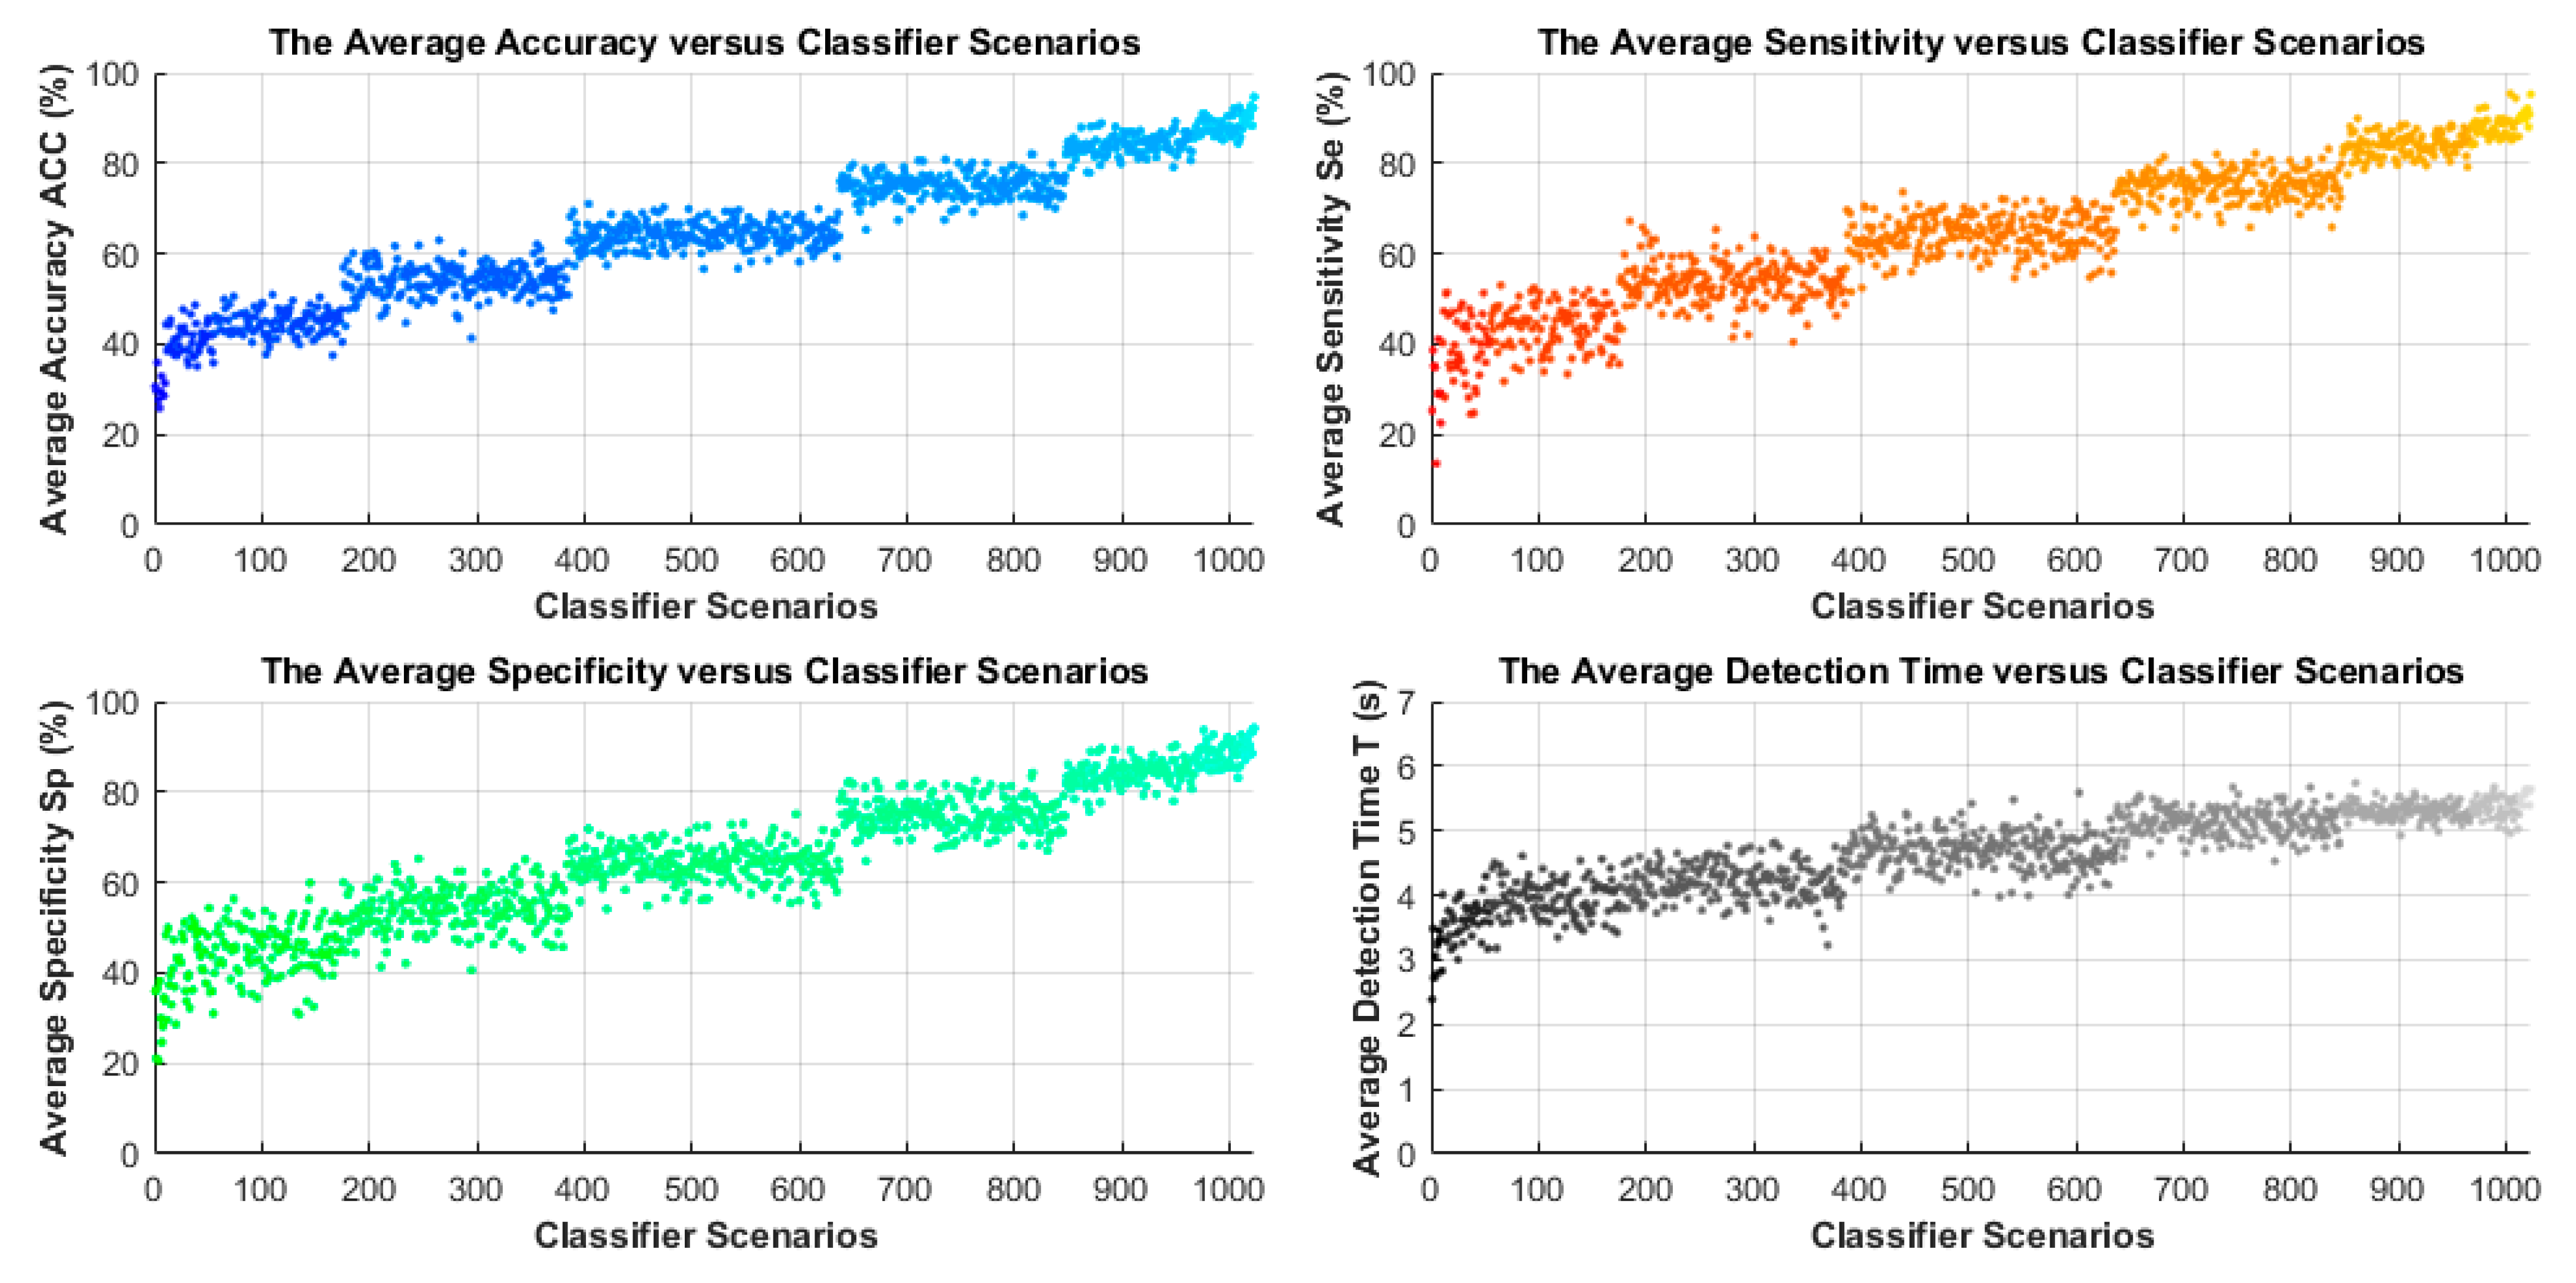
The performance of different classifier scenarios of MC-MLI is shown in
Figure 5. The y-axis denotes average accuracy, average sensitivity, average specificity, and average detection, respectively. The x-axis denotes the classifier scenarios. Each classifier scenario refers to a feature combination. The number of feature combinations is calculated as:
Note that there are 10 features for classifier development, and thus M equals 10. The total number of classifier scenarios is 1023. The 1st to 10th classifier scenarios refer to the 1st to 10th feature combinations comprising one feature. The 11th to 55th classifier scenarios refer to the 11th to 55th feature combinations comprising two features, and so on. The result reveals that the accuracy, sensitivity, and specificity are generally improved with the increasing number of features. Meanwhile, the detection time becomes longer. The result is consistent with the previous discussion that increasing feature dimensions (i.e., the number of feature elements) usually improves the detection performance, but it leads to longer detection time. In brief, the classifier scenarios with the feature vectors made of >7 features (i.e., >967th classifier scenarios) achieve over 85% accuracy, over 80% sensitivity and over 80% specificity. The detection time is about 5 s. The classifier performances can be converted to overall scoring using the weighted sum of the performance indicators. To summarize, the customization in MC-MLI provides high adaptiveness to meet various system requirements. The best classifier for each pipe section can be evaluated using overall scoring.
3.4. The Performance of MC-MLI under Different Leak Rates
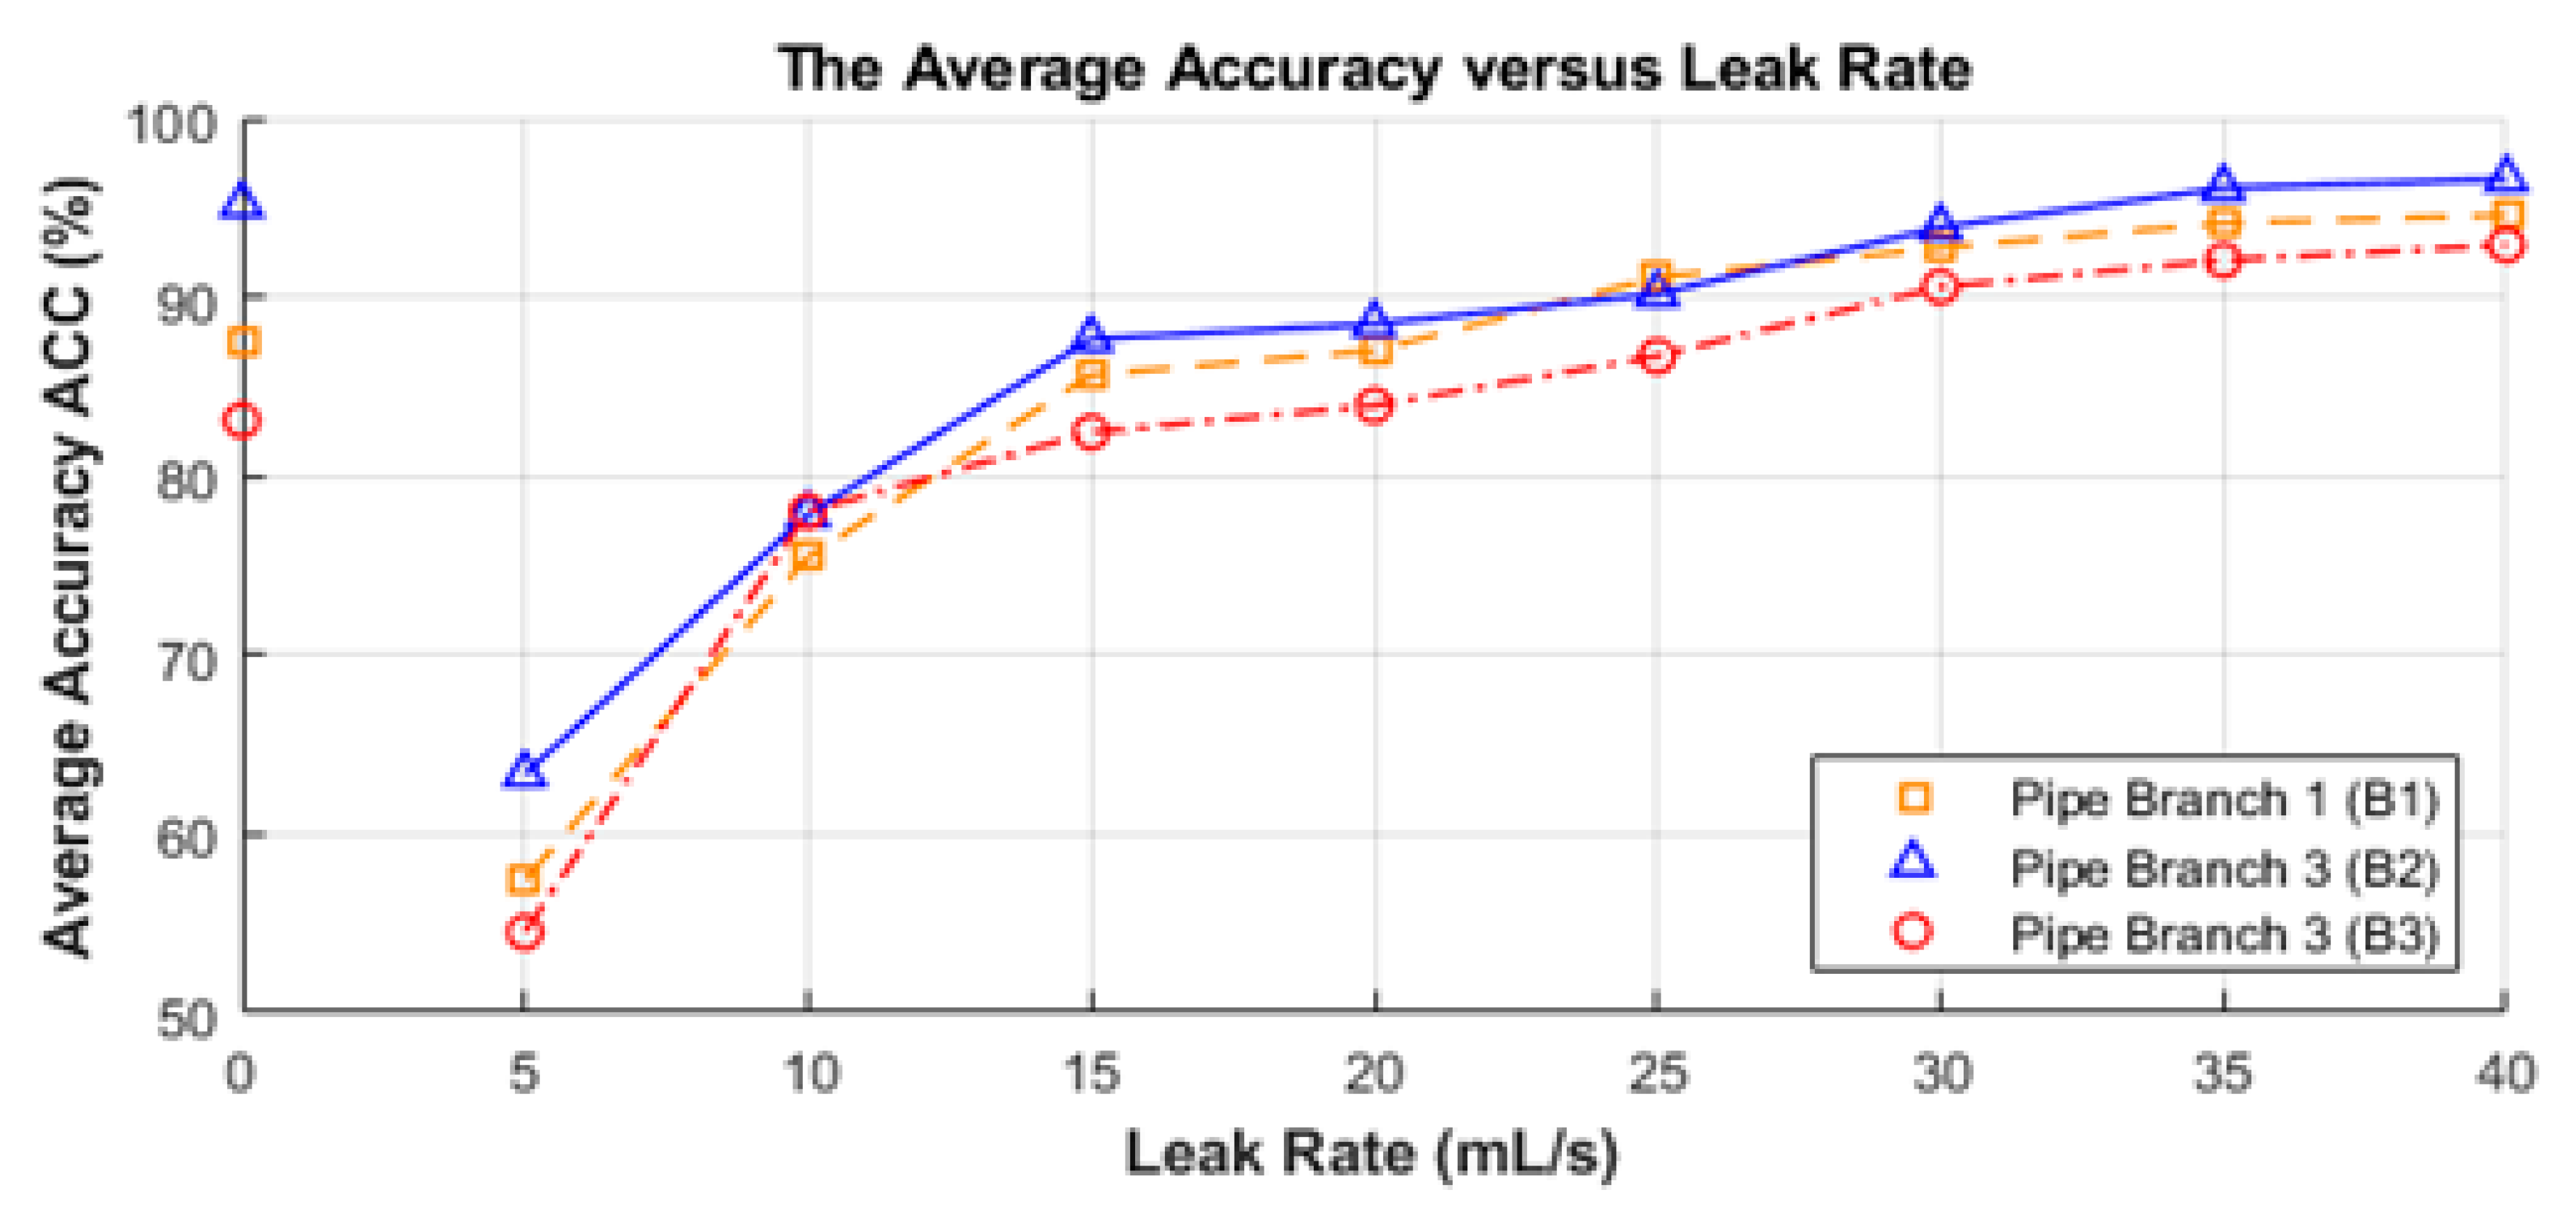
During the experiment, various leak scenarios were considered. The leak scenarios refer to different leak rates and leak locations. There are three adjustable valves to act as leak points. The leak rate is adjusted by controlling the valve openness. The leak rates vary from 0 mL/s to 40 mL/s with an interval of 5 mL/s. The number of leaks in the scenarios can be either a single leak or multiple leaks.
The result, as shown in
Figure 6, is averaged from all leak scenarios (i.e., both single leak and multiple leaks are involved). The detection accuracies of three pipe branches B1, B2, and B3 are represented by three curves, respectively. Note that the curves of sensitivity and specificity are similar to the accuracy curve. The result demonstrates that the identification accuracy of MC-MLI is directly proportional to the leak rate. This is because a higher leak rate will show more significant changes in feature values, and thus a higher probability of correct classification. In the normal cases (0 mL/s leak rate), the average accuracies of all three classifiers are higher than 80%. Furthermore, the average accuracies of all classifiers are >80% under >15 mL/s leak rate, and >90% under >30 mL/s leak rate. Several factors lead to unsatisfactory accuracies at a low leak rate, including sensor sensitivity and network structure. For instance, if the noise level of a sensor is sufficiently high to interrupt measured data, a large error will occur.
4. Conclusions
Aged water distribution infrastructure (WDI) is a global issue for water wastage due to leakage. It is necessary to develop automated leak detection to avoid economic loss and save freshwater resources. In this paper, a new multi-classification-based multi-leak identification (MC-MLI) scheme was proposed. After the data analysis, ten (10) features were extracted to develop classifiers. A new adaptive kernel was developed to transform the input features into high dimensional feature space. The features were weighted in the adaptive kernel with respect to their importance levels to improve identification performances. Moreover, a multi-classification with a parallel structure was designed to integrate multiple binary classifiers. Each pipe section was monitored by a unique binary classifier. Owing to the parallel structure of multi-classification, single/multiple detection(s) can be performed without activating all classifiers. Additionally, it facilitates the integration of a newly added pipe section. An extra classifier is trained for the newly added pipe section without reconfiguration of the whole identification system. Multiple classifier scenarios were designed to adapt to various performance requirements (e.g., accuracy, detection time, etc.). All scenarios had different performances in terms of accuracies, sensitivities, specificities and detection times. The performance requirements can be varied according to the pipes’ importance levels. Therefore, the proposed MC-MLI has high detection efficiency, high system flexibility, and high system adaptiveness. An experiment involving multiple leak scenarios was performed to evaluate the proposed MC-MLI. The results demonstrate that MC-MLI achieves 96% accuracy, 96% sensitivity, and 95% specificity. The average detection time was about 5 s. The improvement in identification performance was in the range of 15% to 30% compared to prime classification schemes.
In the experiment, the same types of flow sensors and same types of pressure sensors were adopted. They had the same connection interface (i.e., serial port) and showed similar measurement precision. In reality, different types of sensors from different manufacturers may be utilized, which may pose difficulty when replacing sensors in the detection system. Considering this situation, the interoperability of different sensors based on the IEEE P2668 standard will be studied in future work to make sensors “plug-and-play”. Besides that, the accuracy of sensor data needs to be guaranteed. By evaluating the accuracy of sensor data based on the IEEE P2668 standard, the reliability of the detection system will be further improved.


