Article

Atomization of Microfibrillated Cellulose and Its Incorporation into Poly(3-hydroxybutyrate-co-3-hydroxyvalerate) by Reactive Extrusion

1
Research Institute of Food Engineering for Development (IIAD), Universtitat Politècnica de València (UPV), 46022 Valencia, Spain
2
Biorefineries Department, AINIA, 46980 Paterna, Spain
3
Microencapsulation Technologies Department, AINIA, 46980 Paterna, Spain
*
Author to whom correspondence should be addressed.
Appl. Sci. 2022, 12(4), 2111; https://doi.org/10.3390/app12042111
Submission received: 19 January 2022 / Revised: 10 February 2022 / Accepted: 14 February 2022 / Published: 17 February 2022
(This article belongs to the Special Issue Sustainable Polymer Technologies for a Circular Economy)

Abstract

:

Featured Application

The sensitivity of our society has increased by the effect of petrochemical plastics on the environment, which has fostered the development of biodegradable materials derived from natural resources. This study puts forth the potential use of the atomization process to microdisperse cellulose structures that can be later incorporated into biopolyester films through a process of reactive extrusion, without altering the optical properties, and improving their performance.

Abstract

The present study focuses on the preparation and characterization of poly(3-hydroxybutyrate-co-3-hydroxyvalerate) (PHBV) films that were reinforced with cellulose microstructures to obtain new green composite materials for sustainable food packaging applications. The atomization of suspensions of microfibrillated cellulose (MFC) successfully allowed the formation of ultrathin cellulose structures of nearly 3 µm that were, thereafter, melt-mixed at 2.5, 5, and 10 wt % with PHBV and subsequently processed into films by thermo-compression. The most optimal results were attained for the intermediate MFC content of 5 wt %, however, the cellulose microstructures showed a low interfacial adhesion with the biopolyester matrix. Thus, two reactive compatibilizers were explored in order to improve the properties of the green composites, namely the multi-functional epoxy-based styrene-acrylic oligomer (ESAO) and the combination of triglycidyl isocyanurate (TGIC) with dicumyl peroxide (DCP). The chemical, optical, morphological, thermal, mechanical, and barrier properties against water and aroma vapors and oxygen were analyzed in order to determine the potential application of these green composite films in food packaging. The results showed that the incorporation of MFC yielded contact transparent films, whereas the reactive extrusion with TGIC and DCP led to green composites with enhanced thermal stability, mechanical strength and ductility, and barrier performance to aroma vapor and oxygen. In particular, this compatibilized green composite film was thermally stable up to ~280 °C, whereas it showed an elastic modulus (E) of above 3 GPa and a deformation at break (ɛb) of 1.4%. Moreover, compared with neat PHBV, its barrier performance to limonene vapor and oxygen was nearly improved by nine and two times, respectively.

1. Introduction

In recent years, there has been a growing interest in the development of sustainable alternative materials for food packaging due to the environmental impacts related to the high disposal of petrochemical polymers. Recycling of single-use plastics currently represents the best option to reduce plastic waste, however, after reprocessing, recycled plastics show a significant performance reduction and associate food safety risks due to chemical migration issues [1]. A possible solution, which is also compatible with the recycling technologies, is the replacement of polymers that are derived from petroleum with biopolymers that are biodegradable [2]. These materials are macromolecules that are obtained from natural sources, are biodegradable, or show both features, which can be composted in industrial facilities and, in some cases, in domestic composting conditions and natural environments [3]. In addition, biopolymers present an improved sustainability profile since they can be produced with lower energy consumption and a reduced carbon footprint [4]. Among the currently available biopolymers, carbohydrates, such as starch [5], pectin [6], chitosan [7,8], and cellulose derivatives [9,10,11], or proteins, such as casein derivatives [12] and wheat gluten [13,14], have been widely explored as sustainable candidates in biodegradable food packaging applications.
Polyhydroxyalkanoates (PHAs) are semi-crystalline aliphatic polymers that are sustainable candidates to replace classical polyolefins of fossil origin for food packaging applications. In particular, PHAs are renewable polymers since these can be synthesized by bacteria, and other microorganisms, using sugars as the production source [15]. Moreover, PHAs are biodegradable in composting facilities and also in the environment avoiding the “white pollution” that is manifested, for example, as marine debris and microplastics [16]. Poly(3-hydroxybutyrate) (PHB) is the most common type of PHA and this homopolyester has been explored to be used as a biodegradable thermoplastic material since it has properties similar to those of polypropylene (PP) [17]. However, the use of PHB results in rigid and brittle materials due to its high crystallinity, whereas it is also difficult to process due to its relatively low thermal stability [18]. In order to overcome these limitations, its copolymer with 3-hydroxyvalerate (3HV), that is, poly(3-hydroxybutyrate-co-3-hydroxyvalerate) (PHBV), offers higher ductility and reduced crystallinity [19,20]. Thus, by increasing the percentage of 3HV units, materials with greater flexibility and lower melting point can be obtained, improving the performance and processing window [21].
Furthermore, different strategies have been developed for the incorporation of micro- and nanostructured cellulose reinforcements to give rise to new green composites with improved properties. The term ‘green composite’ refers to a material that is composed of a biopolymer and a natural fiber or particle and, in this latter case, cellulose nanomaterials are excellent candidates as reinforcing elements since they are cost effective, renewable, and biodegradable [22]. There are different types of ultrathin celluloses, that is, cellulose nanofibers (CNFs), cellulose microfibers (CMFs), also called microfibrillated cellulose (MFC), and nanocrystals of hydrolytically extracted cellulose (cellulose nanocrystals, CNCs) depending on the size and the presence of amorphous and crystalline parts [23,24]. Another type of nanocellulose is bacterial cellulose (BC), whose morphology can be modified by controlling its biosynthesis process [25]. Among nanocellulose materials, MFC has recently been used as a reinforcing filler in petrochemical thermoplastics [26].
The use of MFC in green composites can be particularly advantageous in order to achieve significant improvements in the mechanical and oxygen barrier performance, which are the most limiting factors of biopolymers. However, when ultrafine cellulose structures are used as a mixing element to reinforce polymer matrices, there are two main technological challenges to consider. On the one hand, ultrafine cellulose structures are mostly prepared in the form of aqueous suspensions that are usually not practical in terms of processability and industrial use. During the drying or dewatering process, these tend to form aggregates due to the high hydrophilic nature of cellulose, which has a surface that is very rich in hydroxyl groups (–OH) that are prone to form strong intermolecular hydrogen bonds. This effect is amplified in the case of nanostructured materials due to its large surface-to-volume aspect ratio and high surface energy [27]. For example, it has been observed that during the spray-drying process, cellulose nanoparticles agglomerate by a capillarity effect and the formation of hydrogen bonds and van der Waals forces [28]. Alternatively, lyophilization or freeze drying led to ice crystal growth, which tends to favor the agglomeration of nanocelluloses [29]. On the other hand, the presence of a large number of -OH groups on the cellulose surface results in a polar fiber surface with a relatively low compatibility with the polymer matrices. This habitually results in a non-uniform dispersion and distribution of microfibers during the melt-transformation processes by which nanocelluloses are incorporated into polymers, which leads to a significant loss of performance in the composites [30]. Different strategies have been carried out in order to improve the interfacial adhesion of green composites based on MFC or CNC, mainly by means of chemical pre-treatments and compatibilizing agents or coupling agents [31]. For example, some studies have focused on modifications on the surface of the cellulose through chemical or physical pre-treatments to reduce its hydrophilicity [32]. However, although these methods can positively result in a decrease in moisture absorption and an increase in the mechanical properties, they are usually expensive and involve the use of additional processing steps or toxic chemicals that could be an impediment to the subsequent use of the resulting composites [27]. Other recent studies have reported the use of compatibilizers such as polymers grafted with maleic anhydride (MAH) [33] or multi-functional additives based on epoxy groups [34] and isocyanates [35].
This research reports a novel and potentially scalable technique to prepare green composites of PHBV and MFC based on two steps. Initially, an aqueous MFC suspension was atomized to yield micron-sized droplets containing the dry cellulose microstructures that evaporated upon deposition, leaving no water residues. Secondly, the resultant spray-dried cellulose ultrathin structures were incorporated at different contents, that is, 2.5, 5, and 10 wt %, into PHBV by melt-mixing and their processing and properties were analyzed. Finally, the green composite with the optimal MFC content was compatibilized with two different reactive additives in order to enhance the performance of the films for potential uses in food packaging applications.

2. Materials and Methods

2.1. Materials

Commercial PHBV with food-grade status was supplied as ENMAT Y1000P in the form of pellets by Tianan Biologic Materials (Ningbo, China). The biopolymer presents a density of 1.23 g/cm3 and a melt flow index (MFI) of 5–10 g/10 min (190 °C, 2.16 kg). The 3HV fraction in the copolyester is ~2 mol% and the molecular weight (MW) is ~2.8 × 10⁵ g/mol. The aqueous suspension, Exilva F01-V grade MFC, was provided by Borregaard ChemCell AS (Sarpsborg, Norway) in a paste form with a solid content of 10 wt %.
Joncryl® ADR 4368C was provided by BASF S.A. (Barcelona, Spain) in the form of solid flakes. It is a proprietary epoxy-based styrene-acrylic oligomer (ESAO) with an average functionality of (f) > 4, where the styrene and acrylate blocks are each present between 1 and 20. MW is 6800 g/mol, the glass transition temperature (Tg) is 54 °C, and the epoxide equivalent weight (EEW) is 285 g/mol. Recommended dosage by the manufacturer is 0.1–1 wt % for proper processability without impairing compostability and food contact status. Triglycidyl isocyanurate (TGIC, reference 379506), with a MW of 297.26 g/mol, and dicumyl peroxide (DCP, reference 329541), with a MW of 270.37 g/mol and 98% purity, were both purchased from Sigma-Aldrich S.A. (Madrid, Spain). Magnesium nitrate (Mg(NO3)2) and D-limonene were all obtained from Panreac Quimica S.L.U. (Castellar del Vallés, Barcelona, Spain). Phosphorus pentoxide (P2O5), 99% purity, reference 214701, was obtained from Sigma-Aldrich S.A.

2.2. Atomization of Cellulose Suspension

Prior to the atomization process, the as-received cellulose suspension was diluted in water to a concentration of 1.8 wt % to reduce viscosity and facilitate product handling. To carry out the dehydration process, a laboratory spray-drying equipment (Minispray Dryer Büchi B-290 Advanced, BUCHI Ibérica S.L.U., Barcelona, Spain) was used. This equipment has an air inlet of up to 220 °C, an evaporation flow-rate of water of up to 1 L/h, a nozzle of 0.7 mm, and a drying flow-rate of air of up to 38 m3/h. The calorific power is 2300 w. The gas used for atomization was compressed air with a variable flow-rate between 200 and 1000 L/h and operating at a variable working pressure between 3 and 7 bar. The drying conditions of the MFC suspension were set as follows: inlet temperature of 110 °C and outlet temperature ranging between 55 and 60 °C. Figure 1 shows an image of the equipment (Figure 1a) and a diagram of the process carried out to atomize the cellulose suspension (Figure 1b).

2.3. Preparation of Green Composite Films

2.3.1. Melt Mixing

The PHBV pellets were dried in a vacuum oven (vacuum TEM-TJP Selecta, S.A., Barcelona, Spain) at 60 °C for 4 h. Thereafter, the dried pellets and the atomized cellulose powder were placed in a desiccator containing P2O5 at 25 °C for one week to remove the remaining water.
The PHBV pellets were melt-mixed with MFC at contents of 2.5, 5, and 10 wt %. The melt-blending process was carried out in an internal mixer (HAAKE™ PolyLab™ QC, Thermo Fisher Scientific, Herzogenaurach, Germany) at a temperature of 170 °C with a rotor speed of 50 rpm. The mixing time was set at 5 min after analyzing the stability of neat PHBV during melt mixing. The processed amount of each composition was approximately 50 g. PHBV samples with different MFC contents and compatibilizers were used to produce the green composites. Samples without MFC and compatibilizers were also prepared as control materials. Table 1 shows the set of compositions prepared.
Subsequently, the samples obtained from the mixer were cold-milled in order to have the product in a more easy-to-handle format for subsequent processing into films. For this, each dough was ground at 2 pulses of 30 s in a milling machine (Model M20, IKA, Staufen, Germany). The powder-like material resulting from the milling process was stored in a desiccator at 25 °C and 0% relative humidity (RH) with P2O5 for one week.

2.3.2. Thermo-Compression

Thermo-compression was carried out using a hydraulic press (Model LP20, Labtech Engineering, Bangpoo, Thailand). An amount of 2.5 g of the obtained doughs was thermo-compressed as follows: preheated for 3 min at 200 °C, compressed at ~100 bar and 200 °C for 4 min and, finally, cooled for 3 min until reaching a temperature of ~80 °C. The resultant films, sizing 10 cm × 10 cm and with a thickness of 120−140 µm, were stored in a desiccator with P2O5 (0% RH) at 25 ± 2 °C for a minimum period of 15 days to eliminate the remaining humidity and also reduce the effect of physical aging on PHBV.

2.4. Material Characterization

2.4.1. Microscopy

Film thickness was determined at 10 random positions with a digital electronic micrometer, having ±0.001 mm accuracy (Palmer model COMECTA, Barcelona, Spain).
Atomic force microscopy (AFM) was carried out in a Bruker Multimode 8 microscope (ELECMI, Zaragoza, Spain) to determine the topography of MFC at the nanoscale. To this end, a drop of the cellulose suspension was placed on the scanning probe and scanned with an image area of 10 µm × 10 µm and 5 µm × 5 µm in “tapping” mode using a cantilever of silicon nitride at a nominal resonance frequency of 0.6 Hz.
The morphology of the atomized cellulose microstructures and the fracture surfaces of the films were studied by means of field emission scanning electron microscopy (FESEM) (JEOL, model JSM-5410, Tokyo, Japan) equipped with focused ion gun (AURIGA Compact, Zeiss, Oxford Instruments, Abingdon, UK). To obtain the cross-sections of the composites, the films were cryo-fractured by immersion in liquid nitrogen. The samples were mounted on the sample holder using double-sided carbon tape, coated with a platinum layer (EM MED020 sputter coater, Leica Biosystems, Barcelona, Spain), and observed using an accelerated voltage of 2 kV. The SmartTiff program (version 2, Zeiss, Oxford Instruments) was used to measure the cellulose fiber diameters. To this end, at least 20 micrographs of each formulation were analyzed.

2.4.2. Infrared Spectroscopy

Attenuated total reflection-Fourier transform infrared (ATR-FTIR) spectroscopy chemical analysis was performed on the film surfaces. Spectra were recorded with a Vector 22 from Bruker S.A. (Madrid, Spain) coupling a PIKE MIRacle™ ATR accessory from PIKE Technologies (Madison, WI, USA). Ten scans were averaged from 4000 to 400 cm−1 at a resolution of 4 cm−1.

2.4.3. Optical Evaluation

Optical properties of the films were obtained by determining the film reflection spectra (R) using the black (R0) and white (Rg) backgrounds according the Kubelka–Munk theory of multiple scattering. The internal transmittance (Ti) of the films, ranging from 400 to 700 nm, was determined using Equation (1). The film lightness (L*) and the color coordinates a* (redness-greenness) and b* (yellowness-blueness) were determined using Equations (2) and (3). The colorimetric and transparency properties of the films were also evaluated in terms of the hue angle (hab*) and chroma (Cab*) following Equations (4) and (5).
T i = ( a + R 0 ) 2 b 2
a = 1 2   [ R + ( R 0 R + R g R 0 × R g ) ]
b = a 2 1
h a b = a r c t g ( b a )
C a b = a 2 + b 2
Color difference (∆E*) between the neat PHBV film and the films of PHBV containing MFC, or those processed with the compatibilizers, was evaluated using Equation (6).
E = ( L ) 2 + ( a ) 2 + ( b ) 2
where L = ( L L 0 ) ; a = ( a a 0 ) ; b = ( b b 0 ) ; and L 0 , a 0 , and b 0 are the color coordinates of the neat PHBV film. The color differences were evaluated according to the following criteria [36]: ∆E* < 1 indicates unnoticeable color change; 1 ≤ ∆E* < 2 suggests that only an experienced observer can notice the difference; 2 ≤ ∆E* < 3.5 means that an inexperienced observer notices the difference; 3.5 ≤ ∆E* < 5 indicates a clear noticeable difference; and ∆E* ≥ 5 suggests that the observer notices different colors. All measurements were performed in triplicate.

2.4.4. Thermal Analysis

Differential scanning calorimeter (DSC) was used to determine the phase transitions of the PHBV samples. Measurements were performed in a DSC 1 Stare System analyzer (Mettler-Toledo GmbH, Greifensee, Switzerland) operating under a nitrogen atmosphere (20 mL/min). To this end, 5–7 mg of each sample was weighted in aluminum pans and heated from −40 to 200 °C to remove the thermal history, cooled to −40 °C to determine the crystallization temperature (Tc), and then heated (second heating step) to 200 °C for determining the glass transition temperature (Tg) and melting temperature (Tm). The heating and cooling rates were set at 10 and 50 °C/min, respectively. The degree of crystallinity ( X C ) was measured using the second heating scans and following Equation (7):
X C = [ H m H cc H m 0 · ( 1 w ) ] · 100
where H m (J/g) is the melting enthalpy, H cc (J/g) is the enthalpy of cold crystallization, H m 0 (J/g) represents the theoretical enthalpy of a fully crystalline sample of PHBV with a value of 146.6 J/g [37], and the term 1 − w represents the weight fraction of PHBV.
Thermal degradation of the PHBV films was assessed by thermogravimetric analysis (TGA) in a thermogravimetric analyzer (TGA 1 Stare System analyzer, Mettler-Toledo GmbH). Film samples, with a weight of 3–5 mg, were subjected to a heating program from 25 to 700 °C at a heating rate of 10 °C/min under a nitrogen atmosphere (10 mL/min). The initial or onset temperature (Tonset), corresponding to the temperature yielding a mass loss of 5%, the temperature at the maximum degradation rate (Tdeg), and the residual mass at 700 °C were determined by analyzing the TGA curves and their first derivative thermogravimetry (DTG) curves. All thermal tests were performed in triplicate.

2.4.5. Mechanical Characterization

The tensile properties of the films were measured in a universal testing machine (Stable Micro Systems, TA.XT plus, Stable Micro Systems, Godalming, UK) following the guidelines of the ASTM D882. Rectangular film samples sizing 25 mm × 10 mm were grabbed by two grips initially separated by 50 mm and stretched at a cross-head speed of 12.5 mm/min to determine the values of elastic modulus (E), tensile stress at yield (σy), and elongation at break (εb). Eight film samples were evaluated for each formulation.

2.4.6. Barrier Measurements

Water vapor permeability (WVP) of the films was determined using the ASTM 2011 gravimetric method. To this end, 5 mL of distilled water was placed inside Payne permeability cups (Ø = 3.5 cm, Elcometer Sprl (Hermalle-sous-Argenteau, Belgium) and the films were placed in the cups so that on one side they were exposed to water (100% RH), avoiding direct contact with water. Thus, the cups containing the films were secured with silicon rings and stored in desiccators containing Mg(NO3)2 over-saturated solution (53% RH) in a chamber with temperature control at 25 °C. Identical cups with aluminum films were used as control samples to estimate the vapor loss through the sealing. The cups were weighed periodically using an analytical balance of ±0.0001 g accuracy (ME36S, Sartorius, Fisher Scientific, Hampton, NH, USA). The water vapor permeance was calculated considering the water vapor transmission rate (WVTR), which was determined from the steady-state permeation slope obtained from the regression analysis of weight loss data per unit area versus time, where the weight loss was calculated as the total cell loss minus the loss through the sealing. The water vapor permeance was corrected for permeant partial pressure and the film thickness to obtain the WVP values.
Limonene permeability (LP) was measured following the same procedure described above for water vapor, replacing water with 5 mL of D-limonene inside the Payne permeability cups. The permeability cups containing the films were placed at the controlled conditions of 25 °C and 53% RH and cups with aluminum films were used as control samples to estimate solvent loss through the sealing. Limonene permeation rate (LPR) was obtained from the steady-state permeation slopes and weight loss was calculated as the total cell loss minus the loss through the sealing, which was thereafter corrected for permeant partial pressure and the film thickness to yield LP. Both vapor permeability measurements were performed in triplicate.
Oxygen permeability (OP) of the films was determined using an oxygen permeation analyzer (OxySense® Model 8101e, Systech Illinois, Thame, UK) at 25 °C and 53% of RH, according to ASTM D3985-05. The exposed area of the films was 50 cm2 and the oxygen transmission rate (OTR) was obtained every 15 min until equilibrium was reached. The gas permeability measurements were carried out in duplicate.

2.5. Statistical Analysis

The experimental data were submitted to analysis of variance (ANOVA) at a confidence level of 95% using Minitab statistical program (version 17). Fisher’s least significant difference (LSD) was used to determine whether there were significant differences among the formulations, using the least significant difference (α) of 5% (p < 0.05).

3. Results and Discussion

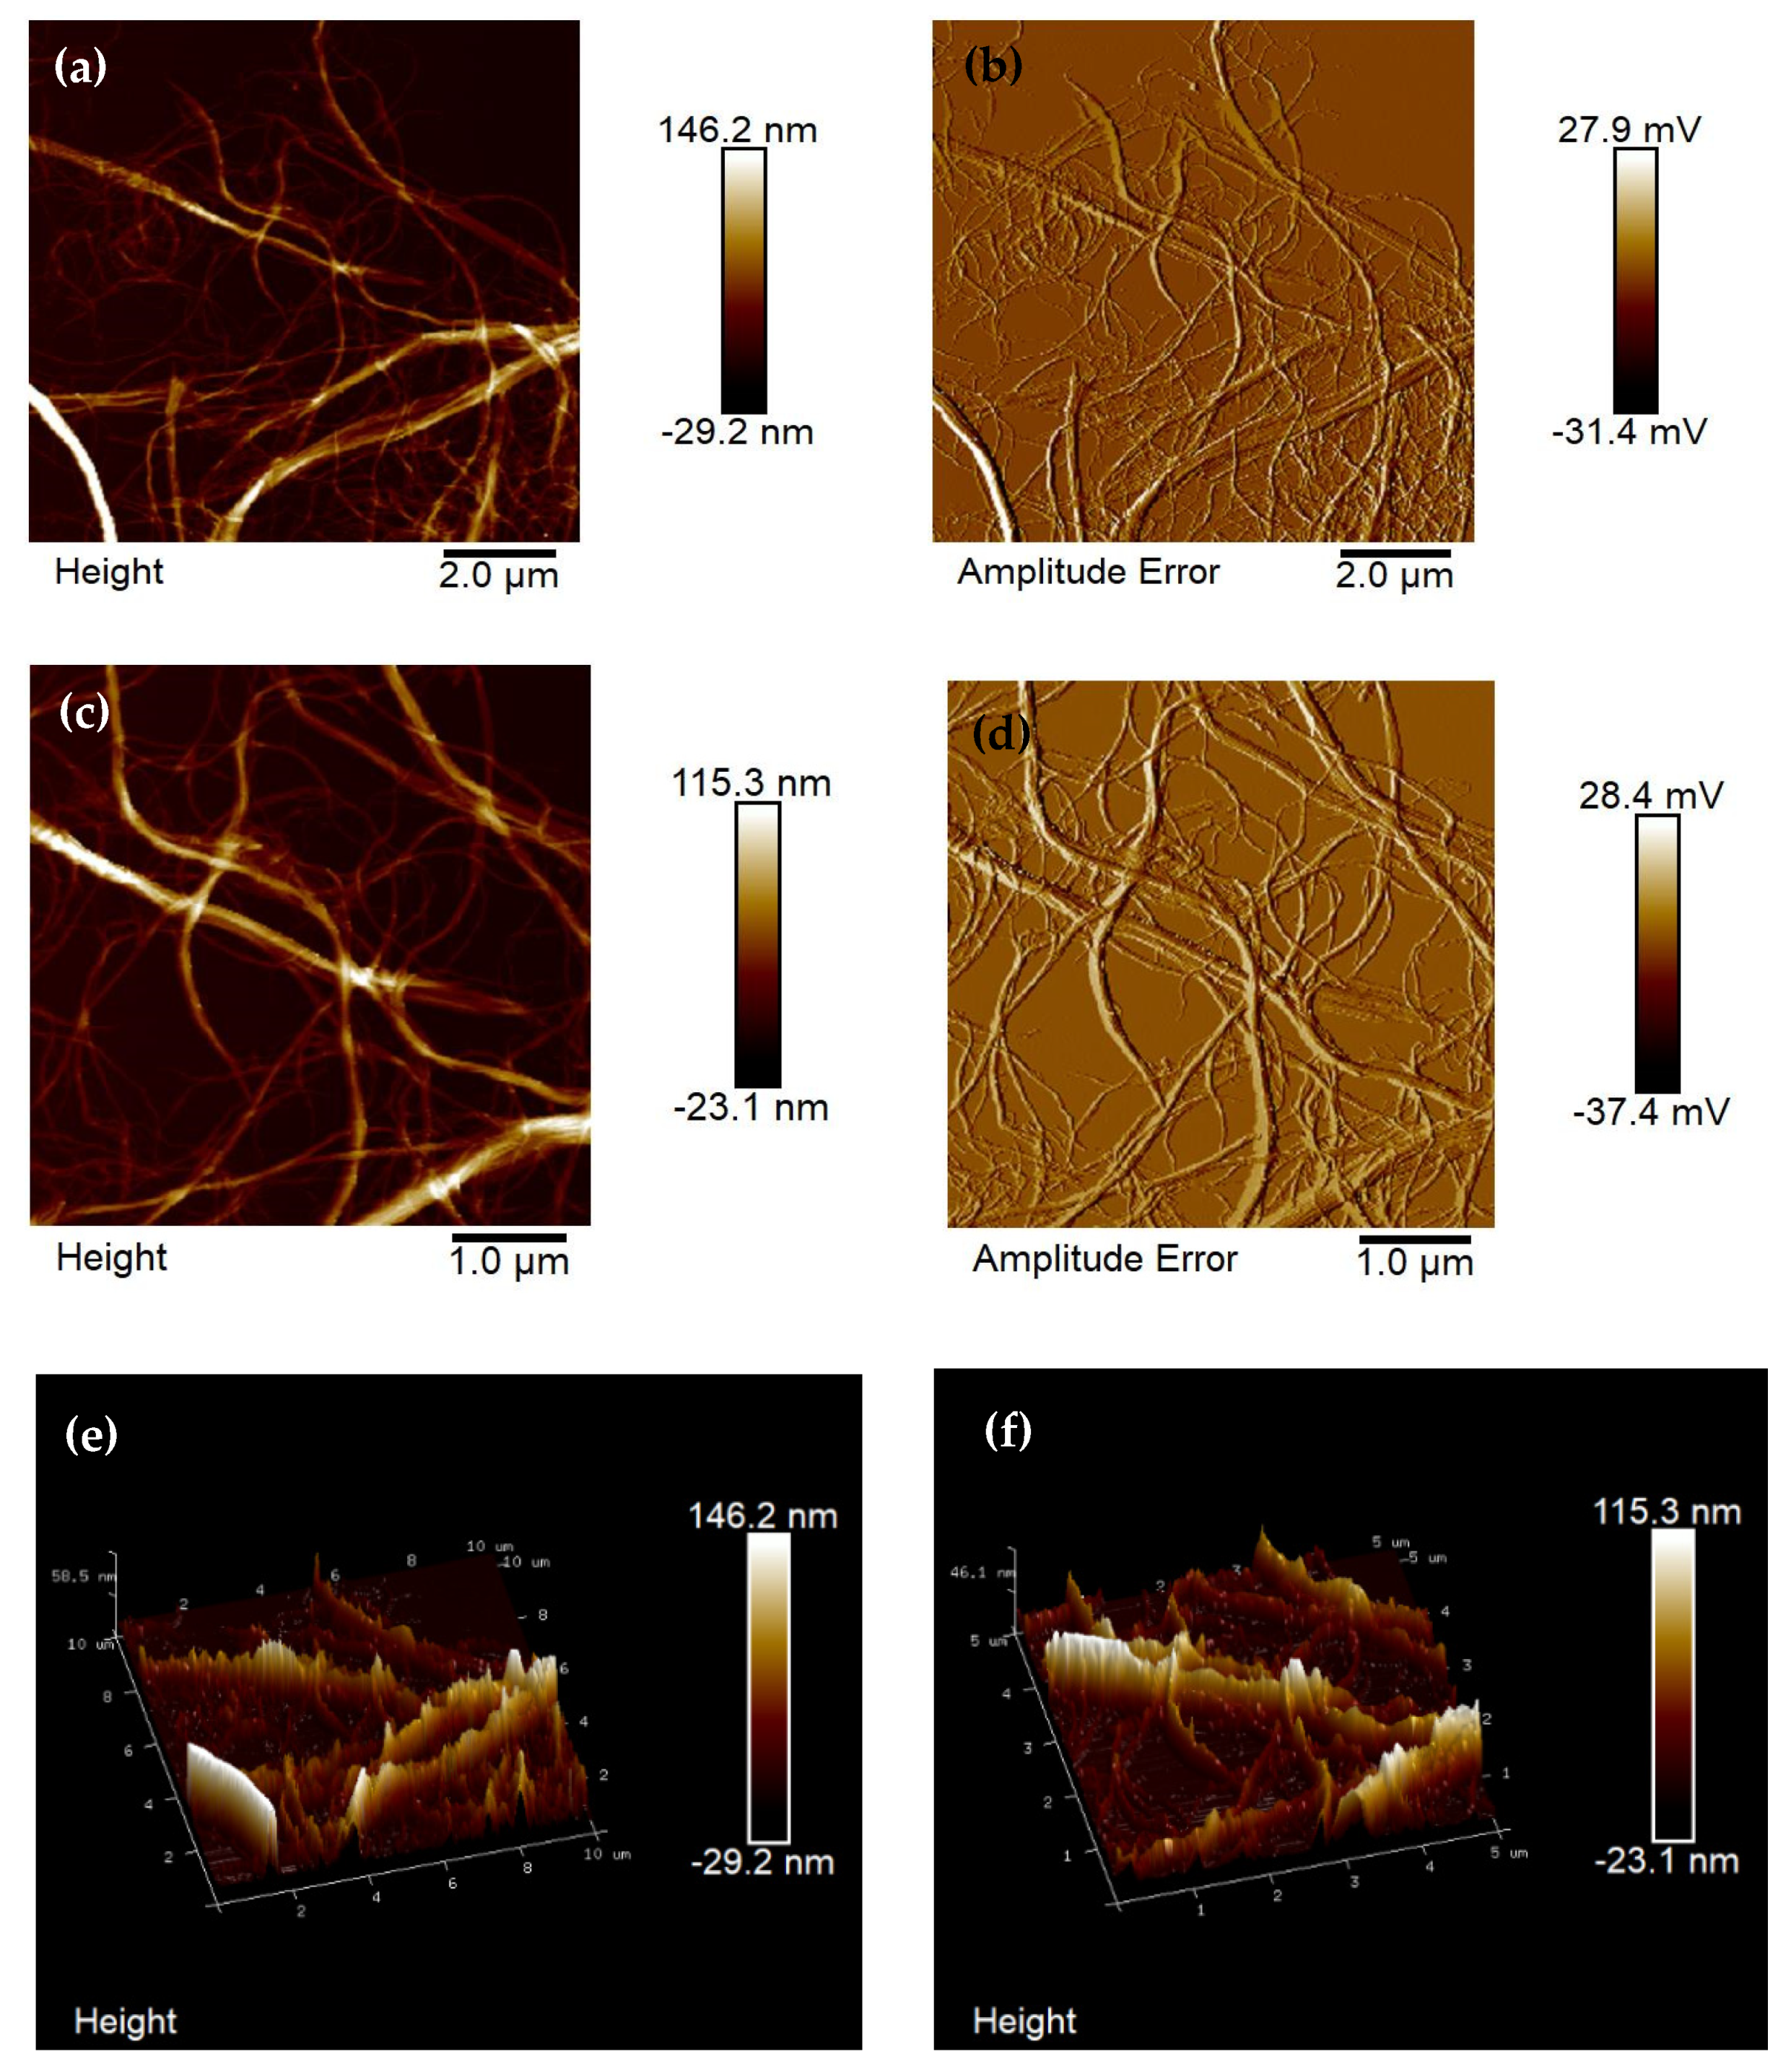
3.1. Atomization of Cellulose Suspension

The morphology of the suspended cellulose before atomization was observed using by AFM. This technique consists of a mechano-optical instrument that is capable of resolving the topography of a material by means of a nanometer-scale probe at high magnification. Figure 2 shows two AFM images that were obtained from the dilute resuspension of the as-received sample in water for the scanned areas of 10 µm × 10 µm (Figure 2a,b) and 5 µm × 5 µm (Figure 2c,d). It can be observed that samples are formed by a complex entangled network of micro- and nanofibers with mean diameter dimensions ranging from 10 nm, for individual nanofibrils, to 146.2 nm for bundles of these nanofibrils. In Figure 2e,f, corresponding to the 3D phase representation of each scanned area, one can see that the highest topography of these figures corresponds to the bundles of nanofibrils, whereas the lowest valleys are related to the smaller nanofibril bundles or individual ones.
The morphology of the resultant atomized cellulose powder obtained from the diluted cellulose suspension in water was observed by FESEM and its micrographs, at different magnifications, are shown in Figure 3. As it can be seen in Figure 3a, atomization gave rise to micrometer aggregates of cellulose sizing approximately 3 ± 1 µm. The FESEM image that was taken at higher magnification, shown in Figure 3b, evidences the formation of microparticles with a rod-like morphology and an aspect ratio of nearly four. Figure 3c, showing the magnification of the microaggregate surface, reveals that these structures were formed by the so-called MFC, originally present in the suspended cellulose with fibers with thicknesses in the nano-range. Therefore, atomization was able to successfully yield microparticles of cellulose, in the powder form and with a low aspect ratio, being constituted by MFC. Similar results have been recently obtained by Shariatnia et al. [38] during the atomization of 0.5–1 wt % CNC suspensions by spraying techniques at high pressure (244.8 kPa). The authors reported that the morphology of the nanocrystals was maintained, although they also tended to form micrometric agglomerates due to the high attractive forces and their high aspect ratio.

3.2. Melt Processing of Green Composites

Figure 4 shows the torque vs. time curves of the different PHBV formulations with MFC and/or the different compatibilizing agents during melt-mixing at 50 rpm and 170 °C. Figure 4a shows the torque evolution for a processing time of 25 min for the neat PHBV sample, which was conducted to ascertain the stability of the biopolyester in terms of melt shear-thinning strength at high temperatures. One can observe that, during processing, the torque sharply increased for about 30 s until the biopolymer pellets were plasticized and then it decreased, showing a peak centered at approximately 1.2 min. The latter peak can be related to the complete melting of the PHBV crystals and spanned up to 2 min. Thereafter, the torque of the liquid PHBV mass progressively reduced, this effect was more noticeable from the processing times that were longer than 5 min. Finally, a plateau was nearly reached after approximately 20 min. The lower torque values indicate that a progressive decrease in viscosity was achieved in the samples, which can be ascribed to thermo-mechanical degradation of PHBV due to chain scission and resultant MW reduction, confirming the low processing window of this biopolyester. Indeed, the inherently poor thermal stability of PHB, and also of PHBV with low 3HV contents, is a major concern since thermal decomposition by chain scission starts at temperatures close to the melting point, making its processing in the melt state a considerable challenge [39]. However, a minimum residence time would be needed to both facilitate a correct mixing and dispersion of the microparticles in the PHBV matrix during melt compounding [40] as well as to achieve or promote the reactivity of the compatibilizing agents [41]. In particular, the dispersion of the cellulose microfibrils depends on time and shear force that will open the physical entanglements. According to this result, a residence time of 5 min was selected to process all of the formulations as a trade-off solution between stability and mixing.
Thus, Figure 4b–d show the curves of torque vs. mixing time for all of the formulations, which were processed at 50 rpm and 170 °C for 5 min. As can be seen in the curves for the uncompatibilized green composite samples, shown in Figure 4b, the incorporation of the microstructures of cellulose yielded very similar curves to the neat PHBV sample, with a progressive increase in the torque during the first ~2 min. This effect can be ascribed to the mechanical friction increase due to the MFC presence in the mixer prior to melting since the dispersion and disaggregation of particles in the biopolymer matrix mainly occurred during this period. In the case of the unfilled compatibilized PHBV samples, included in Figure 4c, one can observe that these samples presented a second increase in torque, approximately after 1–1.5 min, which corresponds to the increase in viscosity associated with the chemical reaction of the compatibilizing agents. In the case of the PHBV sample that was processed with TGIC, this reaction took place at a slightly shorter time than for ESAO, which may be associated with the presence of the highly reactive DCP. Finally, Figure 4d shows the composite samples that were prepared with the compatibilizing agents, where a much higher viscosity increase can be observed than in the rest of the samples, especially noticeable in the PHBV/MFC composite samples that were processed with TGIC. This viscosity increase can be ascribed to the formation of new bonds in the PHBV chains or between PHBV and MFC. In particular, the generation of these molecular entanglements could result in an increase in torque with time due to the formation of macromolecular structures with higher melt strength.
In this regard, one should consider that these compatibilizing agents are chemical substances that are able to establish covalent bonds with different groups of the biopolyester and, in the case of composites, give rise to grafting processes between the functional groups on the surface of the lignocellulose with the terminal groups of the biopolymer. This process is called “reactive extrusion” and it is observed in the processing curves by an increase in torque with time, that is, the molten biopolymer shows a greater resistance to flow after the melting of the biopolymer. Thus, the use of reactive compatibilizing agents produced an increase in viscosity, that is, a melt with a higher torque during mixing, either by an effect of extension or linear growth of the chains (“chain extension”), branching, or cross-linking [42]. Finally, one can also observe that, in terms of comparison performance, similar increases in torque were attained for the unfilled PHBV and PHBV/MFC samples with TGIC and DCP and the composite with ESAO. In the case of the isocyanurate, it exhibited higher reactivity with PHBV, while both exerted a large effect on the grafting of MFC onto PHBV. Also, it is noteworthy that the torque increase was seen to take place 20 s faster for TGIC and DCP than ESAO, which can be ascribed to the presence of the peroxide, offering the benefit to facilitate its processability at a larger extrusion equipment.

3.3. Chemical Analysis of Green Composites

ATR-FTIR was performed in order to evaluate the chemical interactions between PHBV, MFC, and the reactive compatibilizers, that is, ESAO and TGIC, and spectra of the films are gathered in Figure 5. One can observe in Figure 5a that all of the film samples showed the peaks of the characteristic FTIR spectrum of PHBV without noticeable changes [41], which can be due to the relatively low MFC contents. The strongest band was observed at 1718 cm−1, which has been assigned to the stretching vibration of the carbonyl group (C=O) in PHA copolyesters and it corresponds to the intramolecular bonding of their crystalline state [43]. The complex and multiple peaks that were observed in the 1000–1200 cm−1 region arise mainly from the C–O stretching vibration in the ester groups of polyesters [44]. Finally, the peaks centered at ~2975 and ~2935 cm−1 have been ascribed to asymmetric stretching vibrations of methyl (–CH3) and methylene (–CH2–) groups, respectively, which also produced smaller symmetric stretching intensities at ~2875 and ~2850 cm−1. Figure 5b compared the FTIR spectra of the uncompatibilized PHBV film with 5 wt % MFC and the green composite films compatibilized with ESAO and TGIC. It can be observed that the crystalline C–O stretching vibration was kept at 1718 cm−1. However, the carbonyl peak was slightly broadened in the spectra corresponding to the compatibilized films and also generated a shoulder at approximately 1685 cm−1. This band change, which was more noticeable in the green composite sample that was processed with ESAO, has been ascribed to an alteration of the hydrogen bonding in the molecular arrangement of PHAs [34]. This suggests that a stronger intramolecular disruption of the biopolymer chains by the presence of cellulose was achieved in the green composites that were processed with the compatibilizers, indicating a higher interaction of MFC with PHBV. Other authors have reported shifts in this peak due to the reaction between the epoxy groups of chain extenders and the carboxyl groups (–COO) in polyesters [45]. For both of the compatibilizers, and particularly more noticeable in the case of ESAO, all of the peak intensities increased in the 1500–800 cm−1 region. These intensity increases were seen to be more intense for the –O–C–O– stretching modes of the carboxyl group, particularly for the band arising at ~1184 cm−1 and other ester-related bands that were observed at ~1055 cm−1 and ~1043 cm−1 [46]. Therefore, these band signal increases suggest the formation of new ester groups in the compatibilized composite films of PHBV. However, one should further consider that the bands in this region are also due to the C–H bending modes [47] and, thus, the band assignments in this region are not straightforward. Additionally, the intensity of the latter bands can also be increased due to their close proximity to the bands that were ascribed to the newly formed OH-related bonds, which correspond to the –OH side groups that were produced during esterification reaction.
In relation to the chemical changes observed above, it has been described that in the case of ESAO, this compatibilizing agent presents multiple epoxide groups in the styrene chains of the oligomer that are capable of forming new ester groups with the terminal nucleophilic groups of the biopolyester, that is, with its alcohol groups (R–OH) and, fundamentally, acid groups (R–COOH) present at the termination of the polyester chains [48]. On the other hand, it has been shown that part of the other epoxide groups in the ESAO structure, which do not react with the biopolyester, can also react with the –OH groups that are present on the surface of the cellulose, or even with silanol groups (Si–OH) of certain minerals, giving rise to covalent chemical bonding or “grafting” that subsequently achieves a better compatibility of the biopolymer composite [34]. Similarly, reactive extrusion by means of isocyanurates, as is the case for TGIC, which is usually initiated by organic radicals from peroxides, such as DCP, have managed to achieve the referred grafting compatibilization [35]. This reaction is accomplished by means of the reaction of the –OH groups that are present both in the terminal groups of the biopolyester molecular chains and on the cellulose surface with the multiple epoxide groups present in TGIC [49]. Therefore, ester bonds are formed with the PHA chains by an esterification reaction with the glycidyl terminal groups of the carboxylic acid, which precedes the etherification of the –OH terminal group [34]. The second reaction generates C–O–C type bonds with subsequent formation of –OH side groups on the cellulose surface [50]. For DCP, Wei et al. [51] described the mechanism of cellulose coupling or grafting onto PHB and PHBV. Briefly, when the peroxide is exposed to heat during the extrusion process, it decomposes into free radicals, with high reactivity, which tend to abstract hydrogens (H′) from the molecular chains of the biopolymer and cellulose to subsequently initiate the referred grafting process between the two phases of the composites. The authors postulated that, specifically, grafted copolymers are formed at the interfaces of the cellulose and the biopolyester matrix.

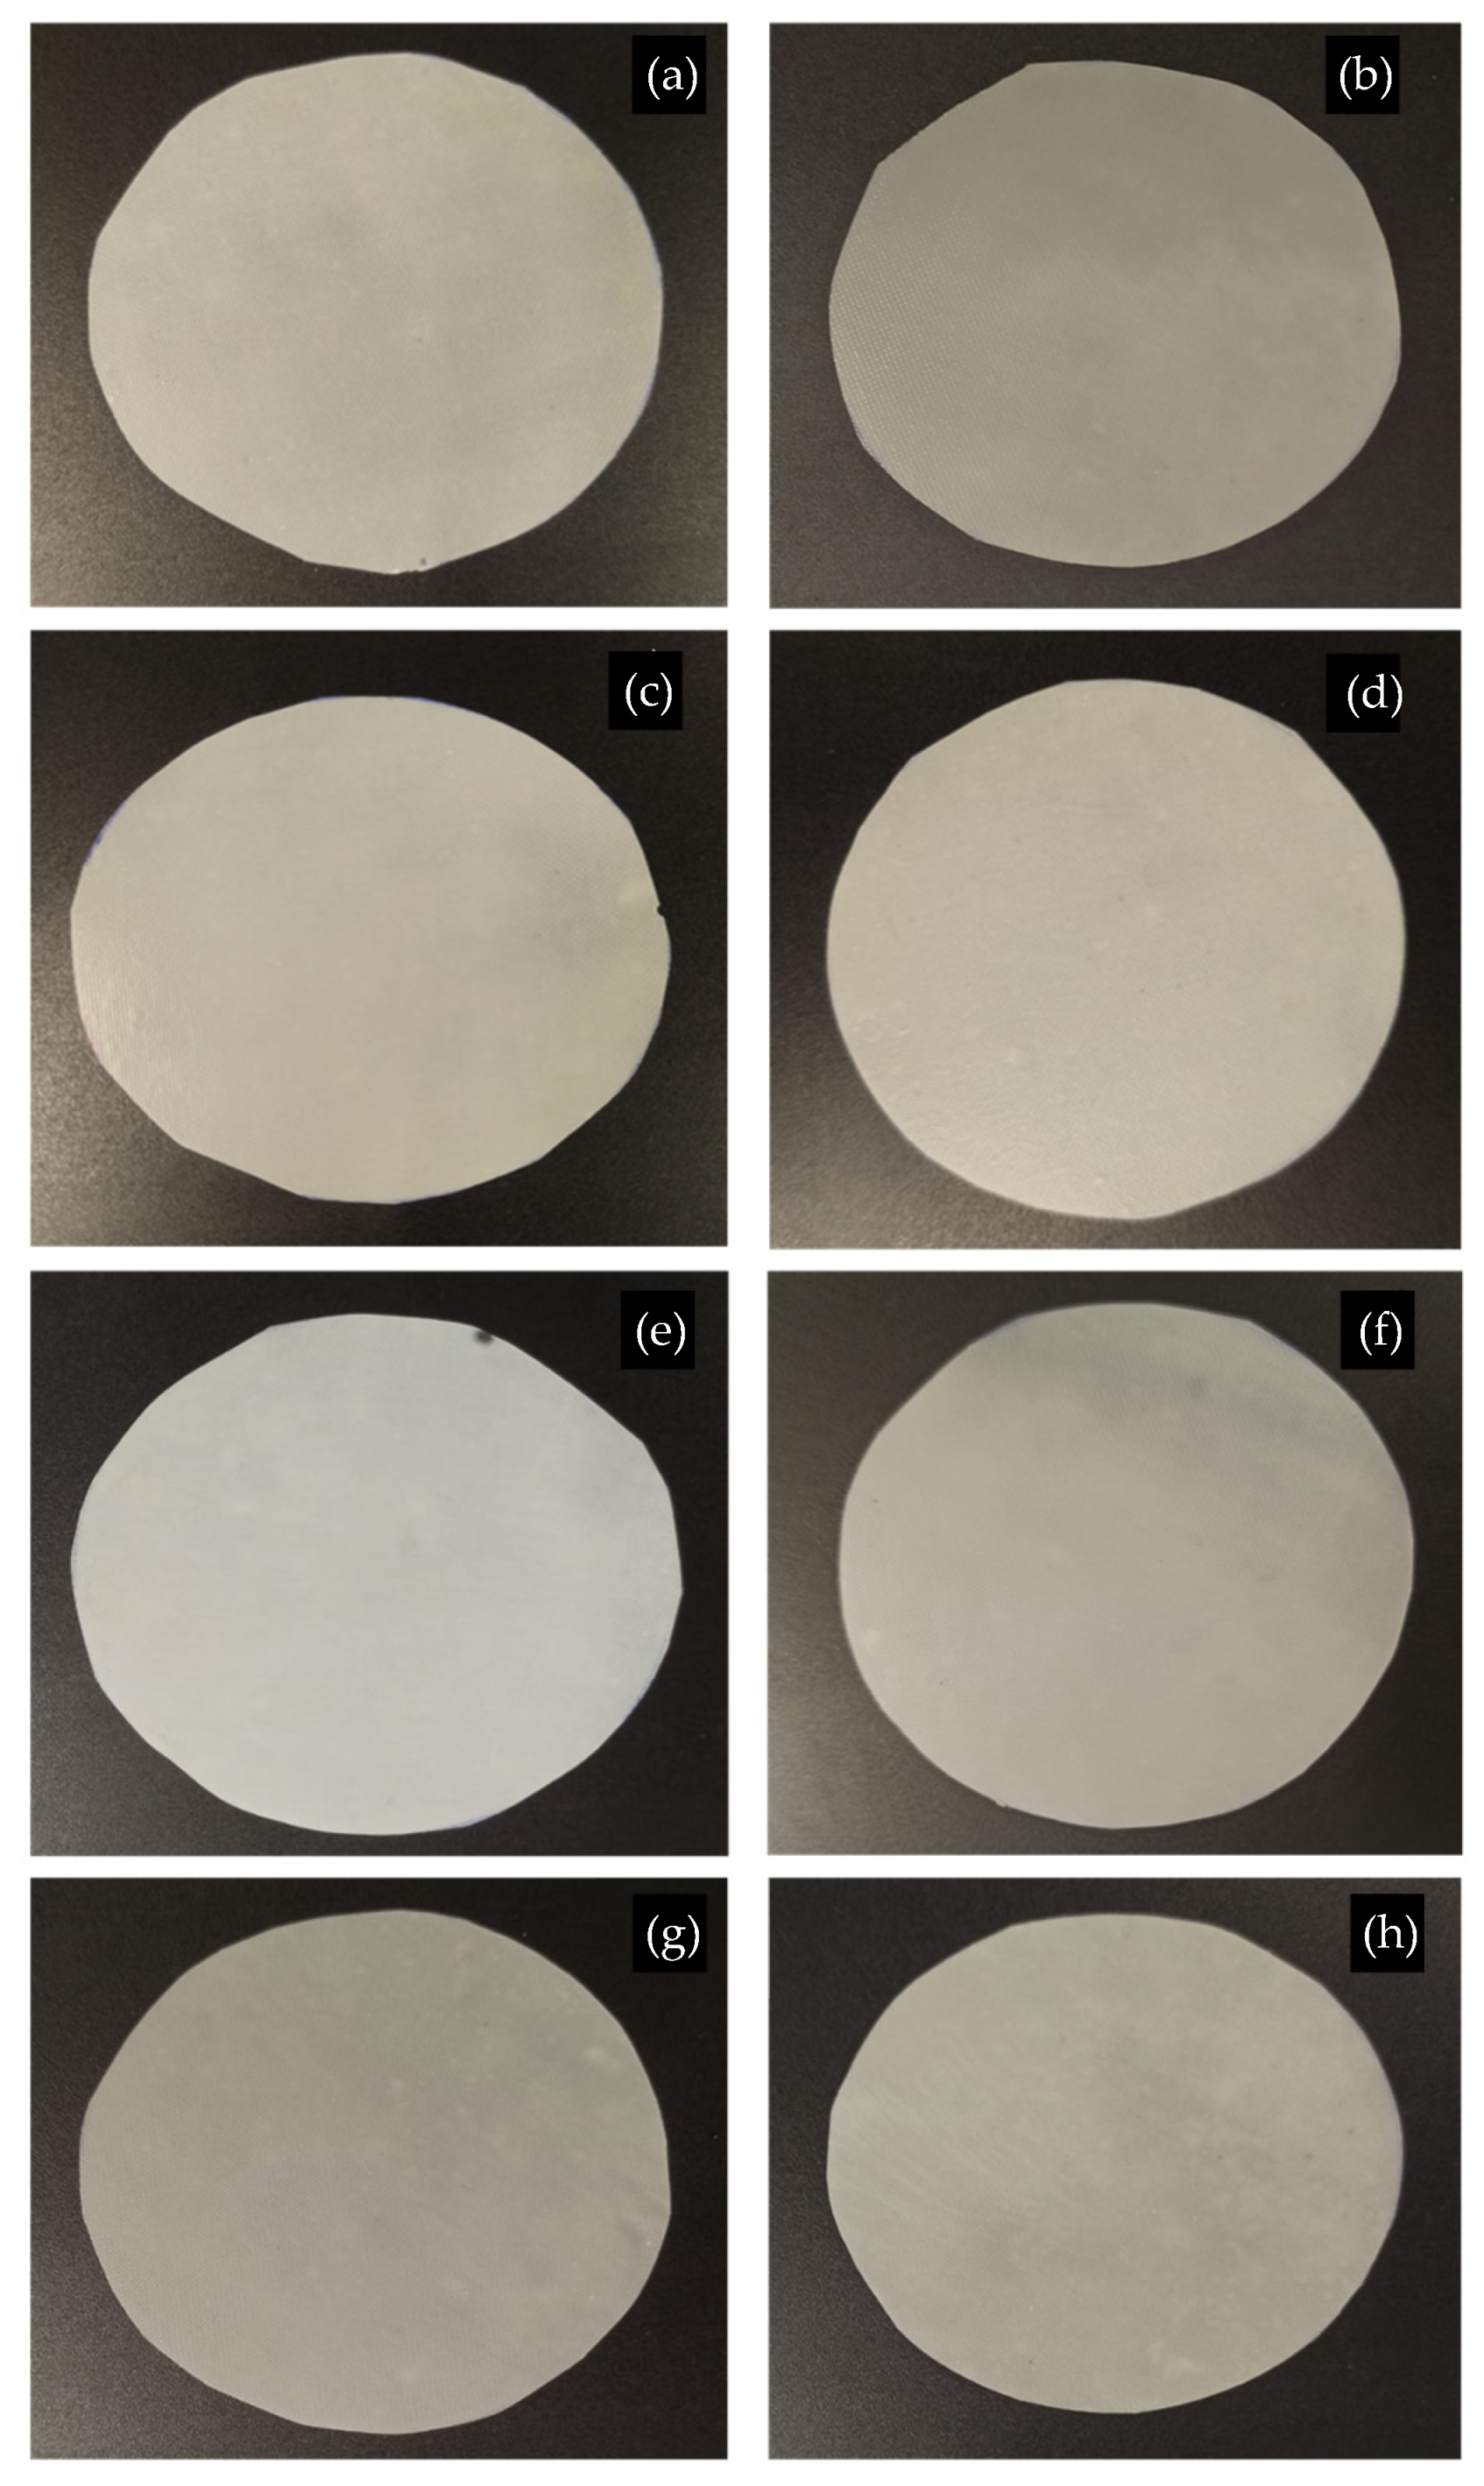
3.4. Optical Properties of Green Composites

Figure 6 gathers the visual images of the PHBV and its composite films with different contents of MFC and/or the compatibilizers ESAO and TGIC with DCP. The films were obtained by thermo-compression at 200 °C for 4 min using the doughs resulting from the melt-mixing process. One can observe from the images that the optical properties that the neat PHBV sample, shown as a control in Figure 6a, presented very similar characteristics in terms of transparency or color to the PHBV film samples with MFC without compatibilizers (Figure 6b–d), with compatibilizers without MFC (Figure 6e,f), or with MFC and compatibilizers (Figure 6g,h). In all cases, thermo-compression yielded homogeneous PHBV films, of about 130 µm thickness, with high opacity due to the inherent crystallinity of PHBV [18]. It is also worth mentioning that, by simple visual observation, it was not possible to determine the presence of MFC due to their micrometer-scale size, as demonstrated previously in Figure 2.
In order to quantify the visual appearance of the PHBV/MFC composite films, Figure 7 represents their spectral distribution curves in terms of the percentage of Ti as a function of wavelength (λ). High Ti values are related to a higher ability of the sample to transmit light and, therefore, correspond to more transparent film samples, while low Ti values indicates higher opacity and a decrease in light passing through the film [52]. In this case, it can be observed that the films presented very similar Ti values throughout the spectral range, showing low-to-intermediate values. It is also worth noting that a slight reduction was observed for the samples with MFC contents of 5 wt % and, more noticeably, 10 wt %, due to the presence of the cellulose microparticles. In this regard, one of the desired characteristics of packaging materials is that they should protect food from the effects of light, especially ultraviolet radiation [53], for which the presence of MFC can be advantageous.
As can be observed in Table 2, the green composite films showed very similar values of brightness as PHBV, measured as L*, in the range of 87–89, showing no significant differences (p > 0.05). Regarding the color coordinates a* and b*, the values that were obtained from all of the samples in the CIE-L*a*b* space indicated the color of the films as yellow (b* ≃ 8–12) with a slight green hue (a* ≃ −1). This corresponds to a hab* angle ≃ 95–99, that is, of a yellow color with a very slightly green hue. On the other hand, the chroma or color saturation was very similar in all of the samples, with Cab* values ranging between 8 and 12. In relation to the color difference between PHBV and its composites with MFC, these can be only appreciable by an experienced observer (∆Eab* ≥ 1 and <2). The color differences were very similar in all cases, showing no significant differences (p > 0.05) and being slightly lower for the compabilized films. These values confirmed that the presence of the cellulose microstructures did not successfully alter the optical properties of PHBV.

3.5. Morphological Properties of Green Composites

Figure 8 shows the surface fractures of the PHBV films observed by FESEM. As can be seen in Figure 8a, the neat PHBV film showed a fracture surface corresponding to that of a brittle material, although it should be noted that the sample was cryo-fractured with liquid nitrogen, below the Tg of PHBV, that is, around −5 °C [41]. In this FESEM micrograph, some inorganic microparticles can be observed, which can correspond to boron nitride that is used by the manufacturer as a nucleating agent during the fabrication of commercial PHA [54].
In general, all of the composite films presented a very similar fracture surface, mainly determined by the high intrinsic brittleness of PHBV. In Figure 8b–d, corresponding to the cross-sections of the PHBV/MFC composite films without compatibilizers, the presence of the cellulose microstructures can be observed as isolated particles, especially in the samples with the highest contents. The formation of voids (“gaps”) between the microparticles and the PHBV matrix was also noticeable as well as the presence of pores or holes corresponding to the separation of the microparticles during the fracture process, being both indicated by the arrows. The presence of a large interface, or pores, is representative of a poor filler-polymer adhesion and it is associated with a consequent loss in the mechanical properties of the composite [18]. Due to the lack of an adequate stress transmission between the filler and the matrix, MFC can act as mere filler elements, without offering increases in mechanical strength, or even as stress points that facilitate breakage. On the other hand, in Figure 8e,f, one can observe that the presence of the reactive compatibilizing agents improved the ductility of the PHBV matrix since some visible plastic deformation was evidenced by the presence of PHBV fibrils or threads generated by stretching during fracture. Finally, Figure 8g,h showed that a decrease, or complete elimination, of the gap between the microparticles and the biopolymer was attained, annotated by the circles, which was evident in the two compatibilized green composite samples.

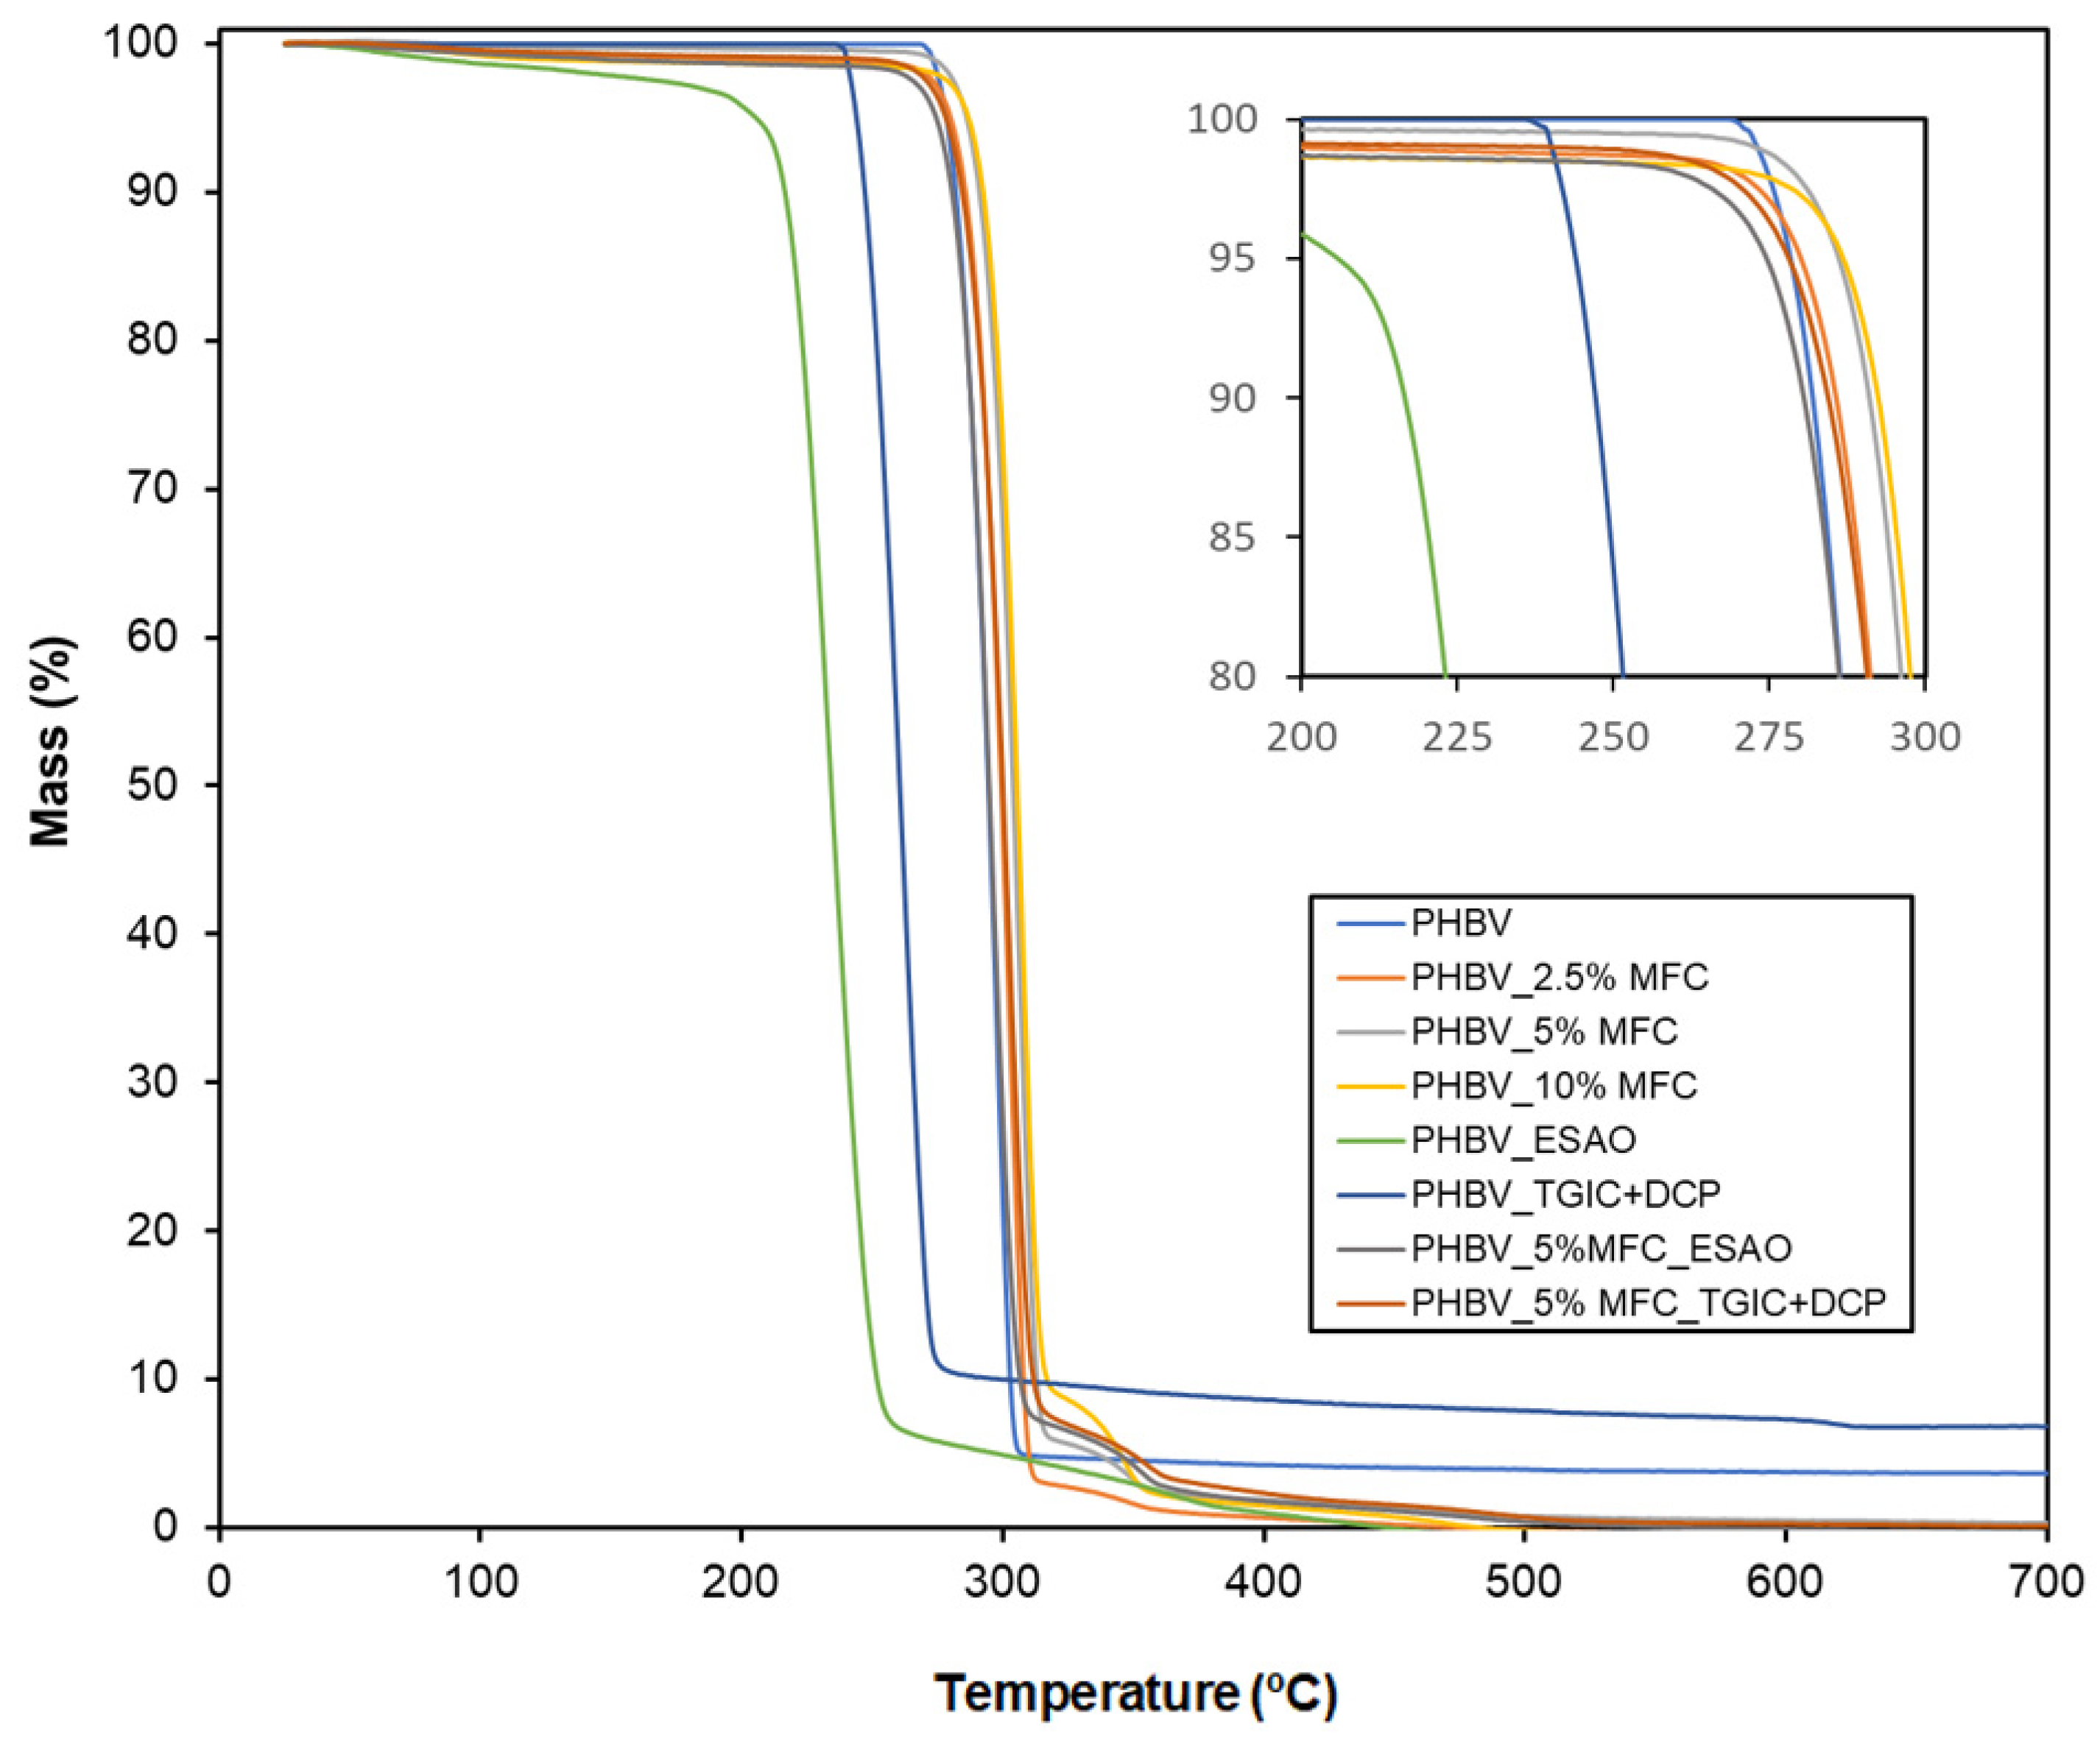
3.6. Thermal Properties of Green Composites

Figure 9 shows the DSC curves of the analyzed PHBV films and their green composites that were compatibilized with ESAO and with TGIC and DCP. Table 3 gathers the thermal properties that were obtained from the curves. As it can be seen in Figure 9a, PHBV crystallized during cooling, showing a Tc of approximately 79 °C. Both the incorporation of MFC, as well as the two reactive compatibilizing agents, slightly affected the crystallization of the biopolymer chains. In particular, an increase in the crystallization process was observed in the composite films of PHBV with 2.5 wt % of MFC and with 5 wt % of MFC compatibilized with TGIC and DCP, reaching values close to 82 °C and 80 °C, respectively. A similar effect was reported in the study of Jun et al. [55], indicating that the presence of ultrathin structures of cellulose may favor the crystallization of PHBV by reducing the energy barrier during crystal formation. Thus, for these two film samples, it seems that the cellulose microstructures could serve as nucleating agents of the biopolymer crystals, favoring heterogeneous crystallization. In the rest of the samples, the Tc values were found to be very similar to that of PHBV, although somewhat in a lower range, that is, between 73 and 78 °C. This effect was significantly noticeable (p < 0.05) for the green composite sample filled with 10 wt % MFC and in the unfilled PHBV film samples that were compatibilized with TGIC and DCP and, more remarkably, ESAO. In particular, the latter sample reached the lowest Tc value, that is, ~73 °C. For the green composite films, this result suggests that the cellulose microparticles tended to agglomerate at the highest content, impairing the biopolymer chain arrangement during crystallization. In the case of the compatibilizing agents, these could facilitate the formation of longer biopolyester chains by a chain-extension effect or, even, a process of branching and cross-linking [42], which resulted in a macromolecular structure with chains of impaired movement. However, in the case of the compatibilized composite film samples, as a consequence of the aforementioned grafting process of the MFCs onto the macromolecular structure of the PHBV described during the FTIR analysis and further supported by the FESEM micrographs, the dispersion of the cellulose microstructures was enlarged and it could favor the formation of crystals. This effect was more noticeable in the case of the green composite film that was processed with TGIC and DCP, suggesting a higher compatibilizing effect.
On the other hand, during the second heating of the samples, represented in Figure 9b, it can be observed that the biopolymer presented a second order change in the −5 to 5 °C range, which corresponds to the glass transition of PHBV. In the case of the neat PHBV, the Tg value was observed at approximately −1.7 °C, having no significant differences (p < 0.05) among the samples. Glass transition is a region where the biopolymer passes from a glassy state, without molecular mobility, towards a rubbery state, with greater molecular mobility and, therefore, greater toughness. Finally, it can be observed that the PHBV crystals formed during cooling melted at a temperature close to 171 °C. In general, all of the PHBV samples with MFC and/or compatibilizers presented values that were very similar to those of PHBV, although somewhat lower, in the range of 166–170 °C. This reduction in the melting point values can be related to certain crystal imperfections or a lower lamellar thickness growth of the PHBV crystals [56]. This observation suggests that both the presence of MFC and the effect of the compatibilizers on the molecular structure of the biopolymer affected the growth of the PHBV crystals. In terms of crystallinity, small differences were observed in most cases, but still significant (p < 0.05), being more noticeable in the green composite filled with 5 wt % MFC and the unfilled PHBV film samples that were processed with the compatibilizers. Thus, the percentage of crystallinity, that is χc, reached a value of approximately 65% in the neat PHBV sample. The presence of the cellulose microstructures slightly increased crystallinity due to their above-described nucleating agent, reaching values of up to ~68%. In the case of compatibilizers, the aforementioned increase in the molecular PHBV chains could slightly reduce the crystallinity, showing values in the range of 62–64%.
Furthermore, the TGA curves of the different PHBV films with MFC and/or the compatibilizing agents are shown in Figure 10. In these curves one can see that the biopolymer was stable up to temperatures close to 280–290 °C. In particular, thermal degradation occurred through a single and rapid degradation step that took place in the thermal range from 290 °C to 310 °C. As shown in Table 4, where the thermal stability data that was obtained from the TGA curves gathers, the PHBV sample showed Tonset and Tdeg values of 277.5 °C and 296.3 °C, respectively. It has been described in the literature that the thermal degradation of PHAs generally follows a random chain scission model of the ester bond, involving a cis-type elimination reaction of –CH and a six-membered ring transition to form crotonic acid and its oligomers [57]. It can be observed from the TGA curves of the respective PHBV films with the compatibilizing agents that they exhibited a significant drop in thermal resistance, with Tonset values of 227.1 °C and 256.3 °C for the PHBV film samples that were compatibilized with ESAO and with TGIC and DCP, respectively. In the case of Tdeg, these samples showed values in the range of 255–285 °C. These results thus indicate that the presence of the reactive compatibilizers resulted in the formation of macromolecular structures of lower thermal resistance. In this regard, it should also be noted that traces of these chemical agents, which could remain unreacted in excess, can catalyze the thermal degradation of PHBV. Regarding the PHBV/MFC composites and their respective composites compatibilized with ESAO and TGIC with DCP, it can be seen that the thermal stability of these films was similar to, or even in some cases higher than, that of the neat copolyester. The highest thermal properties were obtained for the PHBV composite with 10 wt % of MFC, reaching Tonset and Tdeg values of 288.8 °C and 305.9 °C, respectively. This result is quite positive when comparing the present green composites to others based on lignocellulosic materials since these tend to show significantly lower thermal stability than that of unfilled biopolyesters and usually induce thermal decomposition [31]. This difference can be ascribed to the fact that MFC is based on pure alpha (α)-cellulose, without hemicellulose, and then with a higher thermal stability. Furthermore, it is also noteworthy that the presence of the compatibilizers in the PHBV/MFC composite samples did not contribute to a significant improvement of the thermal stability properties, presenting very similar values to that of the uncompatibilized PHBV composite with a 5 wt % MFC, but still significantly higher (p < 0.05) than that of the unfilled PHBV processed with the reactive agents. Therefore, this suggests that during the melt-mixing process of the green composites, by which the chemical anchoring of the cellulose microstructures on the PHBV structure was achieved, the reactive agents were successfully consumed, whereas these did not react completely in the case of the biopolymer samples without MFC. Finally, all of the PHBV films showed residual mass values of around 2%, with no significant differences (p > 0.05) among the film samples.

3.7. Mechanical Properties of Green Composites

Figure 11 shows the mechanical tensile stress (σ) versus strain (ɛ) curves, obtained at room temperature, of the PHBV films with MFCs and/or the compatibilizing agents. Table 5 summarizes the values of E, σy, and εb. As can be seen from the mechanical curve of the PHBV sample, the neat biopolymer film showed a mechanical behavior typical of a brittle material, with an E value of approximately 2.6 GPa and σy and εb values of 27.4 MPa and 1.4%. This mechanical curve showed nearly no plastic deformation since, after elastic deformation, the film broke with little or no deformation upon exceeding the yield point. The high brittleness of the PHB-based materials, as well as those of PHBV copolymers with low 3HV contents, that is, below 20 mol%, is due to their high crystallinity, which takes place mainly due to a secondary crystallization, and/or the physical aging of the amorphous region. In the first case, during the crystallization of PHB, the formation of large spherulites occurs due to the low nucleation density, together with the high degree of crystallinity and the slow crystallization rate [58]. Inside the spherulites, due to the difference between the radial and circumferential coefficient of thermal expansion, circular and radial cracks can form [59], which can act as stress concentration points and promote brittleness of the PHBV [60]. In terms of the physical aging process of PHB, produced during storage at room temperature, it implies a progressive restriction in the movement of interlamellar amorphous chains [61]. As a result of this, an increase of the rigid amorphous fraction is habitually observed during two weeks of storage at room temperature, that is, 25 °C [62]. In this regard, it should be noted that all of the PHBV films were allowed to age for at least 15 days, so this embrittlement effect was already reflected in the mechanical results of the biopolymer films.
As can be observed in Table 5, the incorporation of MFC resulted in a progressive increase in the values of E. In particular, the film samples of PHBV filled with 2.5, 5, and 10 wt % of MFC presented values of 2685 MPa, 2747 MPa, and 2873 MPa, respectively. However, because of their low compatibility with the PHBV matrix, as evidenced earlier during the morphological analysis of the film composites, both σy and ɛb were reduced to values within the range of 20–23 MPa and 0.8–1.1%. In the case of PHBV films without MFC, but processed with the compatibilizers, their tensile mechanical properties were similar to those of PHBV, with a slight but significant increase (p < 0.05) in E, having values of approximately 2.7 GPa. In the case of the σy and ɛb parameters, the values were similar to those of the PHBV film, in the range of 26–28 MPa and 1.2–1.4%, with no significant differences between them (p > 0.05). However, a significant improvement (p < 0.05) in terms of both mechanical strength and ductility was achieved in the film samples of PHBV/MFC that were compatibilized with ESAO and, more remarkable, with TGIC and DCP. In particular, for these composite films, the E values increased to 2863 MPa and 3071 MPa, respectively. A slight increase in the mechanical strength was also observed, reaching σy values of 27.8 MPa and 29.3 MPa. Furthermore, in the case of ductility, the composite films that were processed with ESAO and with TGIC and DCP yielded values of 0.9% and 1.4%, being the latter significantly higher (p < 0.05) than that of the uncompatibilized PHBV/MFC composite. Moreover, for the PHBV composite samples that were processed with TGIC and DCP, the samples were slightly more deformable than the neat PHBV film, but still not significant (p > 0.05). The results attained herein confirm the improvement that was achieved in the PHA composite samples with MFC compatibilized by means of these two multi-functional agents, that is, with multiple reactive groups in their chemical structure that are capable of interacting through covalent bonds favoring the grafting of reinforcing fillers onto the biopolymer matrix [34,35]. The positive effect on the mechanical strength provided by the cellulose microstructures obtained by atomization is also noteworthy, even without the use of compatibilizers. Thus, the incorporation of MFC provided higher mechanical strength to PHBV, with a relatively low impairment in ductility, due to their high degree of dispersion and micrometric size.

3.8. Barrier Properties of Green Composites

Table 6 shows the barrier properties against water and limonene vapors and oxygen of the PHBV films with MFC and compatibilizers. In the food packaging field, among other applications, the barrier performance is one the main parameters to consider, especially for the shelf-life extension of foodstuff [63]. Both water vapor and oxygen barrier properties are important in order to avoid physical and chemical deterioration, whereas limonene transport properties are measured to ascertain the aroma barrier. As can be seen in the table, all of the film samples showed significant differences (p < 0.05) and the neat PHBV films presented values for WVP, LP, and OP of 1.84 × 10⁻¹⁵ kg·m·m−2·Pa−1·s−1, 1.41 × 10⁻¹⁴ kg·m·m−2·Pa−1·s−1, and 2.09 × 10⁻¹⁹ m3·m·m−2·Pa−1·s−1, respectively. These permeability values are very similar to those that have been reported previously for films of PHBV with 2–3 mol% 3HV, also obtained by thermo-compression [41]. In terms of water vapor, one can observe that the incorporation of both MFC and the reactive compatibilizers increased the permeability of PHBV. In this regard, one should consider that PHBV is a medium-to-high barrier material against water vapor, having a slightly better performance than petrochemical PET, that is, 3.01 × 10⁻¹⁵ kg·m·m−2·Pa−1·s−1 [64] and relatively close to those of polyolefins, such as low-density polyethylene (LDPE) (1.20 × 10⁻¹⁵ kg·m·m−2·Pa−1·s−1) and polypropylene (PP) (0.73 × 10⁻¹⁵ kg·m·m−2·Pa−1·s−1) [65]. However, cellulose is a hydrophilic material due to its large number of free –OH groups and the presence of nanocelluloses in PHB-based films has been reported to cause a wettability increase [66]. In the case of the compatibilizers, the lower water-barrier performance can be ascribed to the lower crystallinity attained in these samples, as shown above during DSC analysis, due to development of a macromolecular structure that is composed of longer, branched, and/or cross-linked chains [34,42]. However, it is also worth noting that the green composite film that was compatibilized with TGIC and DCP showed higher barrier performance to water vapor than the uncompatibilized green composite films, but it was still two times more permeable than neat PHBV. This result can be ascribed to the higher dispersion of MFC in this compatibilized sample, by which this presented lower nanofiber aggregates and displays a reduced number of water diffusion paths.
In the case of limonene, as opposed to moisture, this is a strong plasticizing component for PHAs and, additionally, solubility plays a key role in permeability [67]. Thus, the presence of MFC contributed to improve the LP values of PHBV, particularly at a filler content of 5 wt %. However, similar to WVP, the use of the reactive compatibilizers in the unfilled PHBV sample films significantly increased (p < 0.05) their permeability to aroma. Interestingly, the compatibilized green composite films, particularly those that were processed with TGIC and DCP, showed a significant improvement (p < 0.05) in the aroma barrier. The latter film sample showed an LP value of 1.59 × 10⁻¹⁵ kg·m·m−2·Pa−1·s−1, which is nearly one order of magnitude lower than the permeability of neat PHBV. In this regard, one should consider that the aroma barrier performance of nanocellulose is remarkably higher than that of PHB and PHBV [68] so that the presence of highly dispersed MFC in the compatibilized film sample could successfully reduce limonene absorption in the biopolyester matrix. Finally, in terms of oxygen barrier, one can see that permeability values followed a similar trend to the one observed in the case of aroma. Thus, the incorporation of MFC significantly reduced (p < 0.05) the OP values, showing the highest improvement at fillers of 10 wt % with a value of 1.08 × 10⁻¹⁹ m3·m·m−2·Pa−1·s−1. This result agrees with previous studies reporting on the oxygen-barrier enhancements of biopolyesters by the incorporation of nanocellulose materials. For instance, Arrieta et al. [66] incorporated 5 wt % CNC in PLA, attaining a reduction in OTR of about 43%. Similar improvements were achieved by Cao et al. [69], showing 47–64% reductions in the OP values of PLA by the addition of nanocellulose with different aspect ratios and at contents of 1, 3, 5, and 10 wt %. Higher reductions were achieved by Jiang et al. [70], who showed that the addition of 0.7 wt % CNC led to a decrease of 88.9% in PHB-based films. The improvement and contribution mechanism of ultrathin cellulose materials to the gas barrier property of polymers is based on the creation of a tortuous path for the diffusing gas molecules, since these nanomaterials are impervious to gases. Furthermore, the unfilled PHBV films that were processed with the compatibilizers showed similar OP values but were still significantly higher (p < 0.05) than the neat PHBV film, explained in terms of their lower crystallinity. Similarly, the compatibilized green composite sample with TGIC and DCP attained the highest oxygen barrier, having a value of 9.82 × 10⁻²⁰ m3·m·m−2·Pa−1·s−1, which represents a barrier improvement of approximately two times compared with neat PHBV. This permeability value corresponds to a polymer with a medium-oxygen-barrier performance, being around three times lower than PET (3.27 × 10⁻¹⁹ m3·m·m−2·Pa−1·s−1), but still two orders of magnitude higher than poly(ethylene-co-vinyl alcohol) containing 32 mol% of ethylene (EVOH32, 0.77 and 91 × 10−21 m3·m·m−2·Pa−1·s−1 for 0 and 75% RH, respectively) [65].

4. Conclusions

As demonstrated in the present work, atomization allows us to obtain micrometric structures based on ultrathin cellulose fibers. These cellulose microparticles showed a high capacity to improve the physical properties of biopolyesters, mainly in terms of mechanical strength and barrier against aroma and oxygen, without significantly altering their optical properties or reducing their thermal stability. Therefore, the atomization and subsequent incorporation of MFC into biopolyester can successfully represent a novel and sustainable solution to increase the performance and applications of green materials in the development of compostable and/or biodegradable packaging within the framework of the Circular Economy. However, it was also evidenced that the direct incorporation of these cellulose microstructures into biopolyester matrices still present problems of chemical incompatibility, which is mainly reflected in a reduction of the mechanical and barrier performance. In this regard, reactive compatibilizing agents that are based on multiple epoxide groups, such as ESAO and TGIC, have demonstrated their ability to improve the adhesion of cellulose microstructures to PHBV matrices through a reactive grafting mechanism. In particular, the combined use of TGIC with DCP, which facilitates the initiation of the reaction through the generation of free radicals, yielded the most notable improvements, resulting in PHBV/MFC composite films with improved processability and increased mechanical and barrier performances. Future studies will focus on the application of the resultant compatibilized green composite films as rigid packaging articles for food preservation applications, in particular for determining the shelf life of foodstuff whose rapid deterioration represents significant economic losses and whose market price allows the cost of innovation to be absorbed. Moreover, migration studies should also be performed in the resultant green composite films with food simulants in order to corroborate their safety and potential use in food packaging.

Author Contributions

P.A.V.F.: methodology, formal analysis, writing—original draft preparation; H.B.: methodology, writing—original draft preparation; F.V.: methodology, formal analysis; D.R.: methodology, formal analysis; M.V.: supervision, funding acquisition; S.T.-G.: conceptualization, formal analysis, investigation, writing—original draft preparation, writing—review and editing, supervision. All authors have read and agreed to the published version of the manuscript.

Funding

This research was funded by Spanish Ministry of Science and Innovation (MICI), grant numbers PID2019-105207RB-I00 and RTC2019-007268-2.

Institutional Review Board Statement

Not applicable.

Informed Consent Statement

Not applicable.

Data Availability Statement

Data are contained within the article and are also available on request.

Acknowledgments

P.A.V.F. is grateful to Generalitat Valenciana (GVA) for the Grisolia P/2019/115 grant. S.T.-G. acknowledges MICI for his Ramón y Cajal contract (RYC2019-027784-I). The Integrated Employment Service (SIE) of the Universtitat Politècnica de València (UPV) is also acknowledged for the collaboration through its Educational Cooperation Program.

Conflicts of Interest

The authors declare no conflict of interest.

References

  1. Geueke, B.; Groh, K.; Muncke, J. Food packaging in the circular economy: Overview of chemical safety aspects for commonly used materials. J. Clean. Prod. 2018, 193, 491–505. [Google Scholar] [CrossRef]
  2. Hottle, T.A.; Bilec, M.M.; Landis, A.E. Biopolymer production and end of life comparisons using life cycle assessment. Resour. Conserv. Recycl. 2017, 122, 295–306. [Google Scholar] [CrossRef] [Green Version]
  3. Torres-Giner, S.; Figueroa-Lopez, K.J.; Melendez-Rodriguez, B.; Prieto, C.; Pardo-Figuerez, M.; Lagaron, J.M. Emerging Trends in Biopolymers for Food Packaging. In Sustainable Food Packaging Technology; Wiley: Hoboken, NJ, USA, 2021; pp. 1–33. [Google Scholar]
  4. Durkin, A.; Taptygin, I.; Kong, Q.; Gunam Resul, M.F.M.; Rehman, A.; Fernández, A.M.L.; Harvey, A.P.; Shah, N.; Guo, M. Scale-up and Sustainability Evaluation of Biopolymer Production from Citrus Waste Offering Carbon Capture and Utilisation Pathway. ChemistryOpen 2019, 8, 668–688. [Google Scholar] [CrossRef] [PubMed] [Green Version]
  5. Hosseini, S.N.; Pirsa, S.; Farzi, J. Biodegradable nano composite film based on modified starch-albumin/MgO; antibacterial, antioxidant and structural properties. Polym. Test. 2021, 97, 107182. [Google Scholar] [CrossRef]
  6. Sharifi, K.A.; Pirsa, S. Biodegradable film of black mulberry pulp pectin/chlorophyll of black mulberry leaf encapsulated with carboxymethylcellulose/silica nanoparticles: Investigation of physicochemical and antimicrobial properties. Mater. Chem. Phys. 2021, 267, 124580. [Google Scholar] [CrossRef]
  7. Mohammadi, B.; Pirsa, S.; Alizadeh, M. Preparing chitosan–polyaniline nanocomposite film and examining its mechanical, electrical, and antimicrobial properties. Polym. Polym. Compos. 2019, 27, 507–517. [Google Scholar] [CrossRef]
  8. Pirsa, S.; Mohammadi, B. Conducting/biodegradable chitosan-polyaniline film; Antioxidant, color, solubility and water vapor permeability properties. Main Group Chem. 2021, 20, 133–147. [Google Scholar] [CrossRef]
  9. Pirsa, S.; Farshchi, E.; Roufegarinejad, L. Antioxidant/Antimicrobial Film Based on Carboxymethyl Cellulose/Gelatin/TiO2–Ag Nano-Composite. J. Polym. Environ. 2020, 28, 3154–3163. [Google Scholar] [CrossRef]
  10. Pirsa, S.; Chavoshizadeh, S. Design of an optical sensor for ethylene based on nanofiber bacterial cellulose film and its application for determination of banana storage time. Polym. Adv. Technol. 2018, 29, 1385–1393. [Google Scholar] [CrossRef]
  11. Pirsa, S. Nanocomposite base on carboxymethylcellulose hydrogel: Simultaneous absorbent of ethylene and humidity to increase the shelf life of banana fruit. Int. J. Biol. Macromol. 2021, 193, 300–310. [Google Scholar] [CrossRef]
  12. Yorghanlu, R.A.; Hemmati, H.; Pirsa, S.; Makhani, A. Production of biodegradable sodium caseinate film containing titanium oxide nanoparticles and grape seed essence and investigation of physicochemical properties. Polym. Bull. 2021. [Google Scholar] [CrossRef]
  13. Jabraili, A.; Pirsa, S.; Pirouzifard, M.K.; Amiri, S. Biodegradable Nanocomposite Film Based on Gluten/Silica/Calcium Chloride: Physicochemical Properties and Bioactive Compounds Extraction Capacity. J. Polym. Environ. 2021, 29, 2557–2571. [Google Scholar] [CrossRef]
  14. Rezaei, M.; Pirsa, S.; Chavoshizadeh, S. Photocatalytic/Antimicrobial Active Film Based on Wheat Gluten/ZnO Nanoparticles. J. Inorg. Organomet. Polym. Mater. 2019, 30, 2654–2665. [Google Scholar] [CrossRef]
  15. Arcos-Hernández, M.V.; Laycock, B.; Donose, B.C.; Pratt, S.; Halley, P.; Al-Luaibi, S.; Werker, A.; Lant, P.A. Physicochemical and mechanical properties of mixed culture polyhydroxyalkanoate (PHBV). Eur. Polym. J. 2013, 49, 904–913. [Google Scholar] [CrossRef]
  16. Thushari, G.G.N.; Senevirathna, J.D.M. Plastic pollution in the marine environment. Heliyon 2020, 6, e04709. [Google Scholar] [CrossRef]
  17. Bucci, D.Z.; Tavares, L.B.B.; Sell, I. Biodegradation and physical evaluation of PHB packaging. Polym. Test. 2007, 26, 908–915. [Google Scholar] [CrossRef]
  18. Torres-Giner, S.; Montanes, N.; Fombuena, V.; Boronat, T.; Sanchez-Nacher, L. Preparation and characterization of compression-molded green composite sheets made of poly(3-hydroxybutyrate) reinforced with long pita fibers. Adv. Polym. Technol. 2018, 37, 1305–1315. [Google Scholar] [CrossRef] [Green Version]
  19. Ray, S.S.; Bousmina, M. Biodegradable polymers and their layered silicate nanocomposites: In greening the 21st century materials world. Prog. Mater. Sci. 2005, 50, 962–1079. [Google Scholar]
  20. Keshavarz, T.; Roy, I. Polyhydroxyalkanoates: Bioplastics with a green agenda. Curr. Opin. Microbiol. 2010, 13, 321–326. [Google Scholar] [CrossRef]
  21. Laycock, B.; Arcos-Hernandez, M.V.; Langford, A.; Buchanan, J.; Halley, P.J.; Werker, A.; Lant, P.A.; Pratt, S. Thermal properties and crystallization behavior of fractionated blocky and random polyhydroxyalkanoate copolymers from mixed microbial cultures. J. Appl. Polym. Sci. 2014, 131, 40836. [Google Scholar] [CrossRef]
  22. Tajeddin, B. Cellulose-Based Polymers for Packaging Applications. In Lignocellulosic Polymer Composites; Wiley: Hoboken, NJ, USA, 2014; pp. 477–498. [Google Scholar]
  23. Henriksson, M.; Henriksson, G.; Berglund, L.A.; Lindström, T. An environmentally friendly method for enzyme-assisted preparation of microfibrillated cellulose (MFC) nanofibers. Eur. Polym. J. 2007, 43, 3434–3441. [Google Scholar] [CrossRef]
  24. Fortunati, E.; Armentano, I.; Zhou, Q.; Iannoni, A.; Saino, E.; Visai, L.; Berglund, L.A.; Kenny, J.M. Multifunctional bionanocomposite films of poly(lactic acid), cellulose nanocrystals and silver nanoparticles. Carbohydr. Polym. 2012, 87, 1596–1605. [Google Scholar] [CrossRef]
  25. Gatenholm, P.; Klemm, D. Bacterial Nanocellulose as a Renewable Material for Biomedical Applications. MRS Bull. 2010, 35, 208–213. [Google Scholar] [CrossRef]
  26. Suzuki, K.; Sato, A.; Okumura, H.; Hashimoto, T.; Nakagaito, A.N.; Yano, H. Novel high-strength, micro fibrillated cellulose-reinforced polypropylene composites using a cationic polymer as compatibilizer. Cellulose 2014, 21, 507–518. [Google Scholar] [CrossRef]
  27. Miao, C.; Hamad, W.Y. Cellulose reinforced polymer composites and nanocomposites: A critical review. Cellulose 2013, 20, 2221–2262. [Google Scholar] [CrossRef]
  28. Venkatraman, P.; Gohn, A.M.; Rhoades, A.M.; Foster, E.J. Developing high performance PA11/cellulose nanocomposites for industrial-scale melt processing. Compos. Part B Eng. 2019, 174, 106988. [Google Scholar] [CrossRef]
  29. Oksman, K.; Aitomäki, Y.; Mathew, A.P.; Siqueira, G.; Zhou, Q.; Butylina, S.; Tanpichai, S.; Zhou, X.; Hooshmand, S. Review of the recent developments in cellulose nanocomposite processing. Compos. Part A Appl. Sci. Manuf. 2016, 83, 2–18. [Google Scholar] [CrossRef] [Green Version]
  30. Fonseca-Valero, C.; Ochoa-Mendoza, A.; Arranz-Andrés, J.; González-Sánchez, C. Mechanical recycling and composition effects on the properties and structure of hardwood cellulose-reinforced high density polyethylene eco-composites. Compos. Part A Appl. Sci. Manuf. 2015, 69, 94–104. [Google Scholar] [CrossRef]
  31. Agüero, Á.; Garcia-Sanoguera, D.; Lascano, D.; Rojas-Lema, S.; Ivorra-Martinez, J.; Fenollar, O.; Torres-Giner, S. Evaluation of Different Compatibilization Strategies to Improve the Performance of Injection-Molded Green Composite Pieces Made of Polylactide Reinforced with Short Flaxseed Fibers. Polymers 2020, 12, 821. [Google Scholar] [CrossRef] [Green Version]
  32. Pothan, L.A.; Thomas, S. Polarity parameters and dynamic mechanical behaviour of chemically modified banana fiber reinforced polyester composites. Compos. Sci. Technol. 2003, 63, 1231–1240. [Google Scholar] [CrossRef]
  33. Bengtsson, M.; Gatenholm, P.; Oksman, K. The effect of crosslinking on the properties of polyethylene/wood flour composites. Compos. Sci. Technol. 2005, 65, 1468–1479. [Google Scholar] [CrossRef]
  34. Torres-Giner, S.; Montanes, N.; Boronat, T.; Quiles-Carrillo, L.; Balart, R. Melt grafting of sepiolite nanoclay onto poly(3-hydroxybutyrate-co-4-hydroxybutyrate) by reactive extrusion with multi-functional epoxy-based styrene-acrylic oligomer. Eur. Polym. J. 2016, 84, 693–707. [Google Scholar] [CrossRef]
  35. Melendez-Rodriguez, B.; Torres-Giner, S.; Aldureid, A.; Cabedo, L.; Lagaron, J.M. Reactive Melt Mixing of Poly(3-Hydroxybutyrate)/Rice Husk Flour Composites with Purified Biosustainably Produced Poly(3-Hydroxybutyrate-co-3-Hydroxyvalerate). Materials 2019, 12, 2152. [Google Scholar] [CrossRef] [PubMed] [Green Version]
  36. Agüero, A.; Morcillo, M.d.C.; Quiles-Carrillo, L.; Balart, R.; Boronat, T.; Lascano, D.; Torres-Giner, S.; Fenollar, O. Study of the Influence of the Reprocessing Cycles on the Final Properties of Polylactide Pieces Obtained by Injection Molding. Polymers 2019, 11, 1908. [Google Scholar] [CrossRef] [PubMed] [Green Version]
  37. Torres-Giner, S.; Hilliou, L.; Melendez-Rodriguez, B.; Figueroa-Lopez, K.J.; Madalena, D.; Cabedo, L.; Covas, J.A.; Vicente, A.A.; Lagaron, J.M. Melt processability, characterization, and antibacterial activity of compression-molded green composite sheets made of poly(3-hydroxybutyrate-co-3-hydroxyvalerate) reinforced with coconut fibers impregnated with oregano essential oil. Food Packag. Shelf Life 2018, 17, 39–49. [Google Scholar] [CrossRef] [Green Version]
  38. Shariatnia, S.; Veldanda, A.; Obeidat, S.; Jarrahbashi, D.; Asadi, A. Atomization of cellulose nanocrystals aqueous suspensions in fused deposition modeling: A scalable technique to improve the strength of 3D printed polymers. Compos. Part B Eng. 2019, 177, 107291. [Google Scholar] [CrossRef]
  39. Larsson, M.; Markbo, O.; Jannasch, P. Melt processability and thermomechanical properties of blends based on polyhydroxyalkanoates and poly(butylene adipate-co-terephthalate). RSC Adv. 2016, 6, 44354–44363. [Google Scholar] [CrossRef] [Green Version]
  40. Torres-Giner, S. Preparation of conductive carbon black-filled polymer nanocomposites via melt compounding. In Conductive Materials and Composites; Nova Science Publishers, Inc.: Hauppauge, NY, USA, 2016; pp. 117–164. [Google Scholar]
  41. Quiles-Carrillo, L.; Montanes, N.; Lagaron, J.M.; Balart, R.; Torres-Giner, S. In Situ Compatibilization of Biopolymer Ternary Blends by Reactive Extrusion with Low-Functionality Epoxy-Based Styrene–Acrylic Oligomer. J. Polym. Environ. 2019, 27, 84–96. [Google Scholar] [CrossRef]
  42. Quiles-Carrillo, L.; Duart, S.; Montanes, N.; Torres-Giner, S.; Balart, R. Enhancement of the mechanical and thermal properties of injection-molded polylactide parts by the addition of acrylated epoxidized soybean oil. Mater. Des. 2018, 140, 54–63. [Google Scholar] [CrossRef]
  43. Melendez-Rodriguez, B.; Castro-Mayorga, J.L.; Reis, M.A.M.; Sammon, C.; Cabedo, L.; Torres-Giner, S.; Lagaron, J.M. Preparation and Characterization of Electrospun Food Biopackaging Films of Poly(3-hydroxybutyrate-co-3-hydroxyvalerate) Derived From Fruit Pulp Biowaste. Front. Sustain. Food Syst. 2018, 2, 38. [Google Scholar] [CrossRef]
  44. Rojas-Lema, S.; Arevalo, J.; Gomez-Caturla, J.; Garcia-Garcia, D.; Torres-Giner, S. Peroxide-Induced Synthesis of Maleic Anhydride-Grafted Poly(butylene succinate) and Its Compatibilizing Effect on Poly(butylene succinate)/Pistachio Shell Flour Composites. Molecules 2021, 26, 5927. [Google Scholar] [CrossRef] [PubMed]
  45. Sun, Q.; Mekonnen, T.; Misra, M.; Mohanty, A.K. Novel Biodegradable Cast Film from Carbon Dioxide Based Copolymer and Poly(Lactic Acid). J. Polym. Environ. 2016, 24, 23–36. [Google Scholar] [CrossRef] [Green Version]
  46. Invernizzi, C.; Rovetta, T.; Licchelli, M.; Malagodi, M. Mid and Near-Infrared Reflection Spectral Database of Natural Organic Materials in the Cultural Heritage Field. Int. J. Anal. Chem. 2018, 2018, 7823248. [Google Scholar] [CrossRef]
  47. Colthup, N. Introduction to Infrared and Raman Spectroscopy; Elsevier: Amsterdam, The Netherlands, 2012. [Google Scholar]
  48. Villalobos, M.; Awojulu, A.; Greeley, T.; Turco, G.; Deeter, G. Oligomeric chain extenders for economic reprocessing and recycling of condensation plastics. Energy 2006, 31, 3227–3234. [Google Scholar] [CrossRef]
  49. Samaniego, K.; Matos, A.; Sánchez-Safont, E.; Candal, M.V.; Lagaron, J.M.; Cabedo, L.; Famez-Perez, J. Role of Plasticizers on PHB/bio-TPE Blends Compatibilized by Reactive Extrusion. Materials 2022, 15, 1226. [Google Scholar] [CrossRef]
  50. Quiles-Carrillo, L.; Montanes, N.; Lagaron, J.M.; Balart, R.; Torres-Giner, S. On the use of acrylated epoxidized soybean oil as a reactive compatibilizer in injection-molded compostable pieces consisting of polylactide filled with orange peel flour. Polym. Int. 2018, 67, 1341–1351. [Google Scholar] [CrossRef]
  51. Wei, L.; McDonald, A.G.; Stark, N.M. Grafting of Bacterial Polyhydroxybutyrate (PHB) onto Cellulose via In Situ Reactive Extrusion with Dicumyl Peroxide. Biomacromolecules 2015, 16, 1040–1049. [Google Scholar] [CrossRef]
  52. Ortega-Toro, R.; Jiménez, A.; Talens, P.; Chiralt, A. Properties of starch–hydroxypropyl methylcellulose based films obtained by compression molding. Carbohydr. Polym. 2014, 109, 155–165. [Google Scholar] [CrossRef] [Green Version]
  53. Villalobos, R.; Chanona, J.; Hernández, P.; Gutiérrez, G.; Chiralt, A. Gloss and transparency of hydroxypropyl methylcellulose films containing surfactants as affected by their microstructure. Food Hydrocoll. 2005, 19, 53–61. [Google Scholar] [CrossRef]
  54. Ivorra-Martinez, J.; Quiles-Carrillo, L.; Boronat, T.; Torres-Giner, S.; Covas, J.A. Assessment of the Mechanical and Thermal Properties of Injection-Molded Poly(3-hydroxybutyrate-co-3-hydroxyhexanoate)/Hydroxyapatite Nanoparticles Parts for Use in Bone Tissue Engineering. Polymers 2020, 12, 1389. [Google Scholar] [CrossRef]
  55. Jun, D.; Guomin, Z.; Mingzhu, P.; Leilei, Z.; Dagang, L.; Rui, Z. Crystallization and mechanical properties of reinforced PHBV composites using melt compounding: Effect of CNCs and CNFs. Carbohydr. Polym. 2017, 168, 255–262. [Google Scholar] [CrossRef] [PubMed]
  56. Melendez-Rodriguez, B.; Figueroa-Lopez, K.J.; Bernardos, A.; Martínez-Máñez, R.; Cabedo, L.; Torres-Giner, S.; Lagaron, J.M. Electrospun Antimicrobial Films of Poly(3-hydroxybutyrate-co-3-hydroxyvalerate) Containing Eugenol Essential Oil Encapsulated in Mesoporous Silica Nanoparticles. Nanomaterials 2019, 9, 227. [Google Scholar] [CrossRef] [PubMed] [Green Version]
  57. Bugnicourt, E.; Cinelli, P.; Lazzeri, A.; Alvarez, V.A. Polyhydroxyalkanoate (PHA): Review of synthesis, characteristics, processing and potential applications in packaging; Budapest University of Technology and Economics. Express Polym. Lett. 2014, 8, 791–808. [Google Scholar] [CrossRef] [Green Version]
  58. De Koning, G.J.M.; Lemstra, P.J. Crystallization phenomena in bacterial poly[(R)-3-hydroxybutyrate]: 2. Embrittlement and rejuvenation. Polymer 1993, 34, 4089–4094. [Google Scholar] [CrossRef] [Green Version]
  59. Martinez-Salazar, J.; Sanchez-Cuesta, M.; Barham, P.J.; Keller, A. Thermal expansion and spherulite cracking in 3-hydroxybutyrate/3-hydroxyvalerate copolymers. J. Mater. Sci. Lett. 1989, 8, 490–492. [Google Scholar] [CrossRef]
  60. Barham, P.J.; Keller, A. The relationship between microstructure and mode of fracture in polyhydroxybutyrate. J. Polym. Sci. B Polym. Phys. 1986, 24, 69–77. [Google Scholar] [CrossRef]
  61. Biddlestone, F.; Harris, A.; Hay, J.N.; Hammond, T. The physical ageing of amorphous poly(hydroxybutyrate). Polym. Int. 1996, 39, 221–229. [Google Scholar] [CrossRef]
  62. Di Lorenzo, M.L.; Righetti, M.C. Effect of thermal history on the evolution of crystal and amorphous fractions of poly[(R)-3-hydroxybutyrate] upon storage at ambient temperature. Eur. Polym. J. 2013, 49, 510–517. [Google Scholar] [CrossRef]
  63. Torres-Giner, S.; Gil, L.; Pascual-Ramírez, L.; Garde-Belza, J.A. Packaging: Food waste reduction. Encycl. Polym. Appl. 2018, 3, 1990–2009. [Google Scholar]
  64. Gabirondo, E.; Melendez-Rodriguez, B.; Arnal, C.; Lagaron, J.M.; de Ilarduya, A.M.; Sardon, H.; Torres-Giner, S. Organocatalyzed closed-loop chemical recycling of thermo-compressed films of poly(ethylene furanoate). Polym. Chem. 2021, 12, 1571–1580. [Google Scholar] [CrossRef]
  65. Lagarón, J.M. 1-Multifunctional and nanoreinforced polymers for food packaging. In Multifunctional and Nanoreinforced Polymers for Food Packaging; Lagarón, J.-M., Ed.; Woodhead Publishing: Sawston, UK, 2011; pp. 1–28. [Google Scholar]
  66. Arrieta, M.P.; Fortunati, E.; Dominici, F.; Rayón, E.; López, J.; Kenny, J.M. PLA-PHB/cellulose based films: Mechanical, barrier and disintegration properties. Polym. Degrad. Stab. 2014, 107, 139–149. [Google Scholar] [CrossRef]
  67. Sanchez-Garcia, M.D.; Gimenez, E.; Lagaron, J.M. Novel PET Nanocomposites of Interest in Food Packaging Applications and Comparative Barrier Performance with Biopolyester Nanocomposites. J. Plast. Film Sheeting 2007, 23, 133–148. [Google Scholar] [CrossRef]
  68. Cherpinski, A.; Torres-Giner, S.; Vartiainen, J.; Peresin, M.S.; Lahtinen, P.; Lagaron, J.M. Improving the water resistance of nanocellulose-based films with polyhydroxyalkanoates processed by the electrospinning coating technique. Cellulose 2018, 25, 1291–1307. [Google Scholar] [CrossRef]
  69. Cao, X.; Wang, Y.; Chen, H.; Hu, J.; Cui, L. Preparation of different morphologies cellulose nanocrystals from waste cotton fibers and its effect on PLLA/PDLA composites films. Compos. Part B Eng. 2021, 217, 108934. [Google Scholar] [CrossRef]
  70. Jiang, G.; Yu, L.; Zhang, M.; Wang, F.; Zhang, S. Poly(propylene carbonate)/poly(3-hydroxybutyrate)-based bionanocomposites reinforced with cellulose nanocrystal for potential application as a packaging material. Polym. Adv. Technol. 2020, 31, 853–863. [Google Scholar] [CrossRef]
Figure 1. Atomization unit with indications of its components (a) and process scheme (b).
Applsci 12 02111 g001
Figure 2. Atomic force microscopy (AFM) image of microfibrillated cellulose (MFC) in tapping mode for a scanned 10 µm × 10 µm area in height (a) and amplitude (b) and for a scanned 5 µm × 5 µm area at height (c) and amplitude (d). Three-dimensional phase representation of the scanned 10 µm × 10 µm area (e) and 5 µm × 5 µm area (f).
Applsci 12 02111 g002
Figure 3. Field emission scanning electron microscopy (FESEM) micrographs of the atomized microfibrillated cellulose (MFC) observed at different magnifications, as follows: (a) taken at 1000× with a scale marker of 30 µm; (b) 5000× and 6 µm; (c) 20,000× and 900 nm.
Applsci 12 02111 g003
Figure 4. Representation of torque (M) as a function of time during melt mixing of the following: (a) poly(3-hydroxybutyrate-co-3-hydroxyvalerate) (PHBV) for 25 min; (b) PHBV without and with microfibrillated cellulose (MFC) at 2.5, 5, and 10 wt % for 5 min; (c) PHBV without and with epoxy-based styrene-acrylic oligomer (ESAO) and with triglycidyl isocyanurate (TGIC) and dicumyl peroxide (DCP) for 5 min; (d) PHBV/MFC at 5 wt % without and with ESAO and with TGIC and DCP for 5 min.
Applsci 12 02111 g004
Figure 5. (a) Fourier transform infrared (FTIR) spectra, from bottom to top, of the films of the following: poly(3-hydroxybutyrate-co-3-hydroxyvalerate) (PHBV), PHBV with microfibrillated cellulose (MFC) at 2.5, 5, and 10 wt %, PHBV with triglycidyl isocyanurate (TGIC) and dicumyl peroxide (DCP) and with epoxy-based styrene-acrylic oligomer (ESAO), and PHBV/MFC at 5 wt % with TGIC and DCP and with ESAO. (b) Detail of the FTIR spectra for the films of PHBV/MFC at 5 wt % uncompatibilized and compatibilized with TGIC and DCP and with ESAO. Arrows indicate the wavenumbers of the chemical bonds described in the text.
Applsci 12 02111 g005
Figure 6. Films obtained by thermo-compression of poly(3-hydroxybutyrate-co-3-hydroxyvalerate) (PHBV) with microfibrillated cellulose (MFC) and compatibilized with epoxy-based styrene-acrylic oligomer (ESAO) and with triglycidyl isocyanurate (TGIC) and dicumyl peroxide (DCP) as follows: (a) PHBV; (b) PHBV_2.5%MFC; (c) PHBV_5%MFC; (d) PHBV_10%MFC; (e) PHBV_ESAO; (f) PHBV_TGIC+DCP; (g) PHBV_5%MFC_ESAO; (h) PHBV_5%MFC_TGIC+DCP.
Applsci 12 02111 g006
Figure 7. Spectral distribution curves of the percentage of internal transmittance (Ti) of the films of poly(3-hydroxybutyrate-co-3-hydroxyvalerate) (PHBV) with microfibrillated cellulose (MFC) and compatibilized with epoxy-based styrene-acrylic oligomer (ESAO) and with triglycidyl isocyanurate (TGIC) and dicumyl peroxide (DCP).
Applsci 12 02111 g007
Figure 8. Field emission scanning electron microscopy (FESEM) images of the films of poly(3-hydroxybutyrate-co-3-hydroxyvalerate) (PHBV) with microfibrillated cellulose (MFC) and compatibilized with epoxy-based styrene-acrylic oligomer (ESAO) and with triglycidyl isocyanurate (TGIC) and dicumyl peroxide (DCP) as follows: (a) PHBV; (b) PHBV_2.5%MFC; (c) PHBV_5%MFC; (d) PHBV_10%MFC; (e) PHBV_ESAO; (f) PHBV_TGIC+DCP; (g) PHBV_5%MFC_ESAO; (h) PHBV_5%MFC_TGIC+DCP. Arrows and circles show the morphologies described in the text.
Applsci 12 02111 g008
Figure 9. Differential scanning calorimetry (DSC) thermograms of the films of poly(3-hydroxybutyrate-co-3-hydroxyvalerate) (PHBV) with microfibrillated cellulose (MFC) and compatibilized with epoxy-based styrene-acrylic oligomer (ESAO) and with triglycidyl isocyanurate (TGIC) and dicumyl peroxide (DCP) as follows: (a) Cooling; (b) Second heating.
Applsci 12 02111 g009
Figure 10. Thermogravimetric analysis (TGA) curves of the films of poly(3-hydroxybutyrate-co-3-hydroxyvalerate) (PHBV) with microfibrillated cellulose (MFC) and compatibilized with epoxy-based styrene-acrylic oligomer (ESAO) and with triglycidyl isocyanurate (TGIC) and dicumyl peroxide (DCP).
Applsci 12 02111 g010
Figure 11. Stress (σ) versus strain (ɛ) curves of the films of poly(3-hydroxybutyrate-co-3-hydroxyvalerate) (PHBV) with microfibrillated cellulose (MFC) and compatibilized with epoxy-based styrene-acrylic oligomer (ESAO) and with triglycidyl isocyanurate (TGIC) and dicumyl peroxide (DCP).
Applsci 12 02111 g011
Table 1. Summary of compositions according to the weight content (wt %) of poly(3-hydroxybutyrate-co-3-hydroxyvalerate) (PHBV) and microfibrillated cellulose (MFC) in which epoxy-based styrene-acrylic oligomer (ESAO), triglycidyl isocyanurate (TGIC), and dicumyl peroxide (DCP) were added as parts per hundred resins (phr) of green composite.
SamplePHBV (wt %)MFC (wt %)MAH (phr)ESAO (phr)TGIC (phr)DCP (phr)
PHBV 10000000
PHBV_2.5%MFC 97.52.50000
PHBV_5%MFC 9550000
PHBV_10%MFC 90100000
PHBV_ESAO 10000100
PHBV_TGIC+DCP 10000010.25
PHBV_5%MFC_ESAO 9550100
PHBV_5%MFC_TGIC+DCP 9550010.25
Table 2. Color parameters (L*, a*, b*) hue angle (hab*), color saturation or chroma (Cab*), and color difference (∆Eab*) of the films of poly(3-hydroxybutyrate-co-3-hydroxyvalerate) (PHBV) with microfibrillated cellulose (MFC) and compatibilized with epoxy-based styrene-acrylic oligomer (ESAO) and with triglycidyl isocyanurate (TGIC) and dicumyl peroxide (DCP).
FilmL*a*b*Cab*hab*E*
PHBV 88.41 ± 0.11 a−0.94 ± 0.01 a10.20 ± 0.15 a10.24 ± 0.15 a95.25 ± 0.11 a-
PHBV_2.5%MFC 87.75 ± 0.38 a−1.12 ± 0.03 b11.52 ± 0.87 b11.57 ± 0.86 b95.59± 0.47 a1.53 ± 0.87 a
PHBV_5%MFC 88.40 ± 0.27 a−0.91 ± 0.04 a10.22 ± 0.98 a10.25 ± 0.99 a95.10 ± 0.32 a1.27 ± 0.41 a
PHBV_10%MFC 87.89 ± 0.50 a−0.86 ± 0.05 a11.42 ± 0.64 b11.45 ± 0.64 b94.34 ± 0.41 b1.35 ± 0.75 a
PHBV_ESAO 89.11 ± 0.24 a−1.10 ± 0.05 b8.75 ± 0.23 c8.82 ± 0.23 c97.15 ± 0.17 c1.66 ± 0.34 a
PHBV_TGIC+DCP 89.39 ± 0.15 a−1.22 ± 0.04 c8.80 ± 0.44 c8.88 ± 0.44 c97.91 ± 0.38 c1.75 ± 0.52 a
PHBV_5%MFC_ESAO 88.73 ± 0.07 a−1.14 ± 0.02 b11.24± 0.24 b11.30 ± 0.24 a95.76 ± 0.12 a1.12 ± 0.17 a
PHBV_5%MFC_TGIC+DCP 88.86 ± 0.09 a−1.38 ± 0.05 d9.30 ± 0.22 d9.40 ± 0.22 c98.47 ± 0.23 c1.12 ± 0.20 a
L* lightness (L* = 0 black, L* = 100 white), a* coordinate between red (+) and green (−), b* between yellow (+) and blue (−), hue or tone (hab*), color saturation or chroma (Cab*). Mean values and standard deviation. a–d Different superscripts in the same column indicate significant differences between formulations (p < 0.05).
Table 3. Thermal properties obtained by differential scanning calorimetry (DSC) of the films of poly(3-hydroxybutyrate-co-3-hydroxyvalerate) (PHBV) with microfibrillated cellulose (MFC) and compatibilized with epoxy-based styrene-acrylic oligomer (ESAO) and with triglycidyl isocyanurate (TGIC) and dicumyl peroxide (DCP).
FilmTg (°C)Tc (°C)∆Hc (J/g)Tm (°C)∆Hm (J/g)χc (%)
PHBV−1.73 ± 0.11 a78.65 ± 0.36 a79.07 ± 0.70 a170.53 ± 0.16 a95.81 ± 8.64 a65.35 ± 1.89 a
PHBV_2.5%MFC−1.62 ± 0.07 a82.26 ± 0.57 b78.63 ± 0.64 a167.80 ± 0.11 b91.61 ± 8.42 b65.78 ± 6.04 a
PHBV_5%MFC−1.73 ± 0.04 a76.40 ± 0.66 c71.17 ± 0.23 b168.81 ± 0.04 b95.09 ± 1.22 a68.28 ± 0.87 b
PHBV_10%MFC−1.71 ± 0.21 a75.59 ± 0.56 c63.59 ± 0.71 c169.06 ± 0.79 b84.45 ± 1.60 c64.01 ± 1.21 c
PHBV_ESAO−1.72 ± 0.06 a73.07 ± 0.54 d73.18 ± 0.73 b168.16 ± 0.49 b91.92 ± 0.24 b63.34 ± 0.16 d
PHBV_TGIC+DCP−1.73 ± 0.14 a77.07 ± 4.24 c75.79 ± 0.19 d166.31 ± 0.25 c90.95 ± 2.18 b62.85 ± 1.51 d
PHBV_5%MFC_ESAO−1.77 ± 0.07 a76.90 ± 1.66 c78.87 ± 1.40 a167.40 ± 0.56 c93.66 ± 0.13 d67.25 ± 0.10 b
PHBV_5%MFC_TGIC+DCP−1.76 ± 0.30 a79.93 ± 0.85 e68.49 ± 0.34 e165.76 ± 0.45 d89.59 ± 1.23 b65.15 ± 0.89 c
Tg = glass transition temperature; Tc = crystallization temperature; ∆Hc = enthalpy of crystallization, Tm = melting temperature, ∆Hm = enthalpy of fusion; χc = percent crystallinity. Mean values and standard deviation. a–e Different superscripts in the same column indicate significant differences between formulations (p < 0.05).
Table 4. Thermal properties obtained by thermogravimetric analysis (TGA) of the films of poly(3-hydroxybutyrate-co-3-hydroxyvalerate) (PHBV) with microfibrillated cellulose (MFC) and compatibilized with epoxy-based styrene-acrylic oligomer (ESAO) and with triglycidyl isocyanurate (TGIC) and dicumyl peroxide (DCP).
FilmTonset (°C)Tdeg (°C)Residual Mass (%)
PHBV277.50 ± 1.54 a296.25 ± 0.59 a2.26 ± 0.04 a
PHBV_2.5%MFC280.42 ± 1.77 b301.67 ± 1.18 b2.76 ± 0.12 a
PHBV_5%MFC282.92 ± 1.12 b301.67 ± 1.71 b2.07 ± 0.57 a
PHBV_10%MFC288.75 ± 2.95 c305.83 ± 2.47 c1.91 ± 0.84 a
PHBV_ESAO227.08 ± 3.23 d255.00 ± 2.46 d2.02 ± 0.08 a
PHBV_TGIC+DCP256.25 ± 1.27 e276.67 ± 2.39 e2.11 ± 0.15 a
PHBV_5%MFC_ESAO274.17 ± 2.35 a296.67 ± 1.18 d2.16 ± 0.69 a
PHBV_5%MFC_TGIC+DCP277.08 ± 0.59 a300.83 ± 1.17 d2.01 ± 0.11 a
Tonset = onset degradation temperature (measured at 5% mass loss); Tdeg = degradation temperature. Mean values and standard deviation. a–e Different superscripts in the same column indicate significant differences between formulations (p < 0.05).
Table 5. Mechanical properties of the films of poly(3-hydroxybutyrate-co-3-hydroxyvalerate) (PHBV) with microfibrillated cellulose (MFC) and compatibilized with epoxy-based styrene-acrylic oligomer (ESAO) and with triglycidyl isocyanurate (TGIC) and dicumyl peroxide (DCP).
FilmE (MPa)σy (MPa)ɛb (%)
PHBV2613.5 ± 92.7 a27.4 ± 2.1 a1.37 ± 0.21 a
PHBV_2.5%MFC2684.9 ± 77.1 b22.2 ± 1.6 b1.09 ± 0.13 b
PHBV_5%MFC2746.5 ± 69.7 c21.6 ± 0.9 c0.92 ± 0.20 c
PHBV_10%MFC2873.1 ± 73.5 d20.1 ± 0.7 d0.78 ± 0.14 d
PHBV_ESAO2670.2 ± 21.7 b27.3 ± 1.2 a1.27 ± 0.11 a
PHBV_TGIC+DCP2710.9 ± 76.4 ab27.6 ± 1.7 a1.29 ± 0.15 a
PHBV_5%MFC_ESAO2863.1 ± 55.6 d27.8 ± 1.1 a0.91 ± 0.09 c
PHBV_5%MFC_TGIC+DCP3070.7 ± 41.7 e29.3 ± 2.3 e1.43 ± 0.08 a
E = elastic modulus; σy = tensile stress at yield; εb = deformation at break. Mean values and standard deviation. a–e Different superscripts in the same column indicate significant differences between formulations (p < 0.05).
Table 6. Barrier properties of the films of poly(3-hydroxybutyrate-co-3-hydroxyvalerate) (PHBV) with microfibrillated cellulose (MFC) and compatibilized with epoxy-based styrene-acrylic oligomer (ESAO) and with triglycidyl isocyanurate (TGIC) and dicumyl peroxide (DCP).
FilmThickness
(µm)
WVP × 1015
(kg·m·m−2·Pa−1·s−1)
LP × 1014
(kg·m·m−2·Pa−1·s−1)
OP × 1019
(m3·m·m−2·Pa−1·s−1)
PHBV126 ± 51.84 ± 0.39 a1.41 ± 0.12 a2.09 ± 0.48 a
PHBV_2.5%MFC133 ± 44.19 ± 0.40 b1.34 ± 0.06 a1.60 ± 0.19 b
PHBV_5%MFC128 ± 75.27 ± 0.53 c1.07 ± 0.09 b1.24 ± 0.36 c
PHBV_10%MFC129 ± 65.89 ± 0.47 c1.66 ± 0.15 c1.08 ± 0.12 d
PHBV_ESAO137 ± 24.46 ± 0.19 b2.04 ± 0.17 d2.27 ± 0.15 a
PHBV_TGIC+DCP135 ± 85.69 ± 0.29 c3.80 ± 0.31 e2.70 ± 0.26 a
PHBV_5%MFC_ESAO136 ± 75.48 ± 0.58 c0.99 ± 0.39 b1.36 ± 0.12 c
PHBV_5%MFC_TGIC+DCP128 ± 33.29 ± 0.30 d0.16 ± 0.01 f0.98 ± 0.17 f
WVP = water vapor permeability; LP = limonene permeability; OP = oxygen permeability. Mean values and standard deviation. a–f Different superscripts in the same column indicate significant differences between formulations (p < 0.05).
Publisher’s Note: MDPI stays neutral with regard to jurisdictional claims in published maps and institutional affiliations.

