Article

Structural Performance Degradation of Corrosion-Damaged Reinforced Concrete Beams Based on Finite Element Analysis

1
Innovative Durable Building and Infrastructure Research Center, Hanyang University, Ansan 15588, Korea
2
Department of Smart City Engineering, Hanyang University, Ansan 15588, Korea
3
Department of Architectural Engineering & Smart City Engineering, Hanyang University, Ansan 15588, Korea
*
Author to whom correspondence should be addressed.
Appl. Sci. 2022, 12(4), 2090; https://doi.org/10.3390/app12042090
Submission received: 19 January 2022 / Revised: 11 February 2022 / Accepted: 15 February 2022 / Published: 17 February 2022

Abstract

:
The impact of the seismic performance of corrosion-damaged reinforced concrete (RC) members on the overall seismic performance of the entire RC structure must be investigated. Related research results provide important guidance for a more accurate seismic performance evaluation of RC structures with corroded members including beams and columns. However, currently available technologies for the seismic evaluation of existing RC structures do not consider the impact of reinforcement corrosion-induced deterioration on the seismic performance of RC members. The main focus of this study is on proposing a practical methodology to evaluate the seismic performance of such buildings. More specifically, the proposed methodology enables a direct quantitative evaluation of seismic performance by estimating the structural performance based on the strength and deformation capacity of corroded members. In pursuit of this research background and the objectives, our research team first performed an experimental study to estimate the impact of reinforcement corrosion on the structural behavior of RC shear beams and flexural beams and determine the factors associated with structural performance deterioration. A high correlation between the half-cell potential (HCP) before and after reinforcement corrosion of RC beams and the structural performance degradation factor based on the energy absorption capacity has been seen previously. In this study, a finite element analysis (FEA) was conducted, in which bond strength loss between rebar and concrete due to reinforcement corrosion of beam members was considered as one of the aging-related degradation factors, and the correlation between structural performance degradation before and after corrosion in beam members was studied. In addition, we compared and analyzed the results of the previous experimental research and FEA conducted in this study and proposed a structural performance degradation factor as a function of corrosion of shear and flexural beams. The research results indicate that the FEA-derived bonding factor (β) and performance degradation factor (ϕ) of flexural beam can be approximated with the equation ϕ = ( 0.36 β ) 1 + 101 (R2 = 0.94), together with β–mV (average potential difference in voltage) correlation mV   = ( 1.36 β ) / ( 0.018 0.05 β ) . In the case of shear beams, FEA resulted in ϕ = 37.3 β + 63 , which enables regression approximation, showing a high correlation (R2 = 0.98), together with β–mV correlation ( mV   = 932.5 β 1075 ). Using the mV–βϕ correlation curves, the bonding factor (β) depending on the degree of corrosion of RC beam members and the performance degradation factor (ϕ) based on the consequent strength-deformation capacity can be evaluated.

1. Introduction

Reinforced concrete (RC) structures are the most widely used structural system due to their lower construction and maintenance costs and higher durability compared with those of other types. However, its structural performance degrades over time due to various factors, such as environmental conditions, design loadings, structural design errors, including changes in material properties, and poor construction. Among these, reinforcement corrosion is one of the most frequent causes, which seriously affects RC structures [1,2,3,4]. As shown in Figure 1, reinforcement corrosion seriously undermines the serviceability and structural performance of an RC structure [5].
Among major causes of reinforcement corrosion are chloride and carbonation, which result from atmospheric or environmental conditions, such as oceans, de-icing salts, and pollution.
Hansson [2] and Shamsad [4] investigated the corrosion mechanism of steel and the effects of corrosion on RC members, and identified the following stages of structural deterioration:
(1)
Formation of white patches: Calcium carbonate is produced by reactions between atmospheric carbon dioxide and calcium hydroxide in the cement paste. This calcium carbonate is deposited by moisture on the concrete surface, thereby forming white patches;
(2)
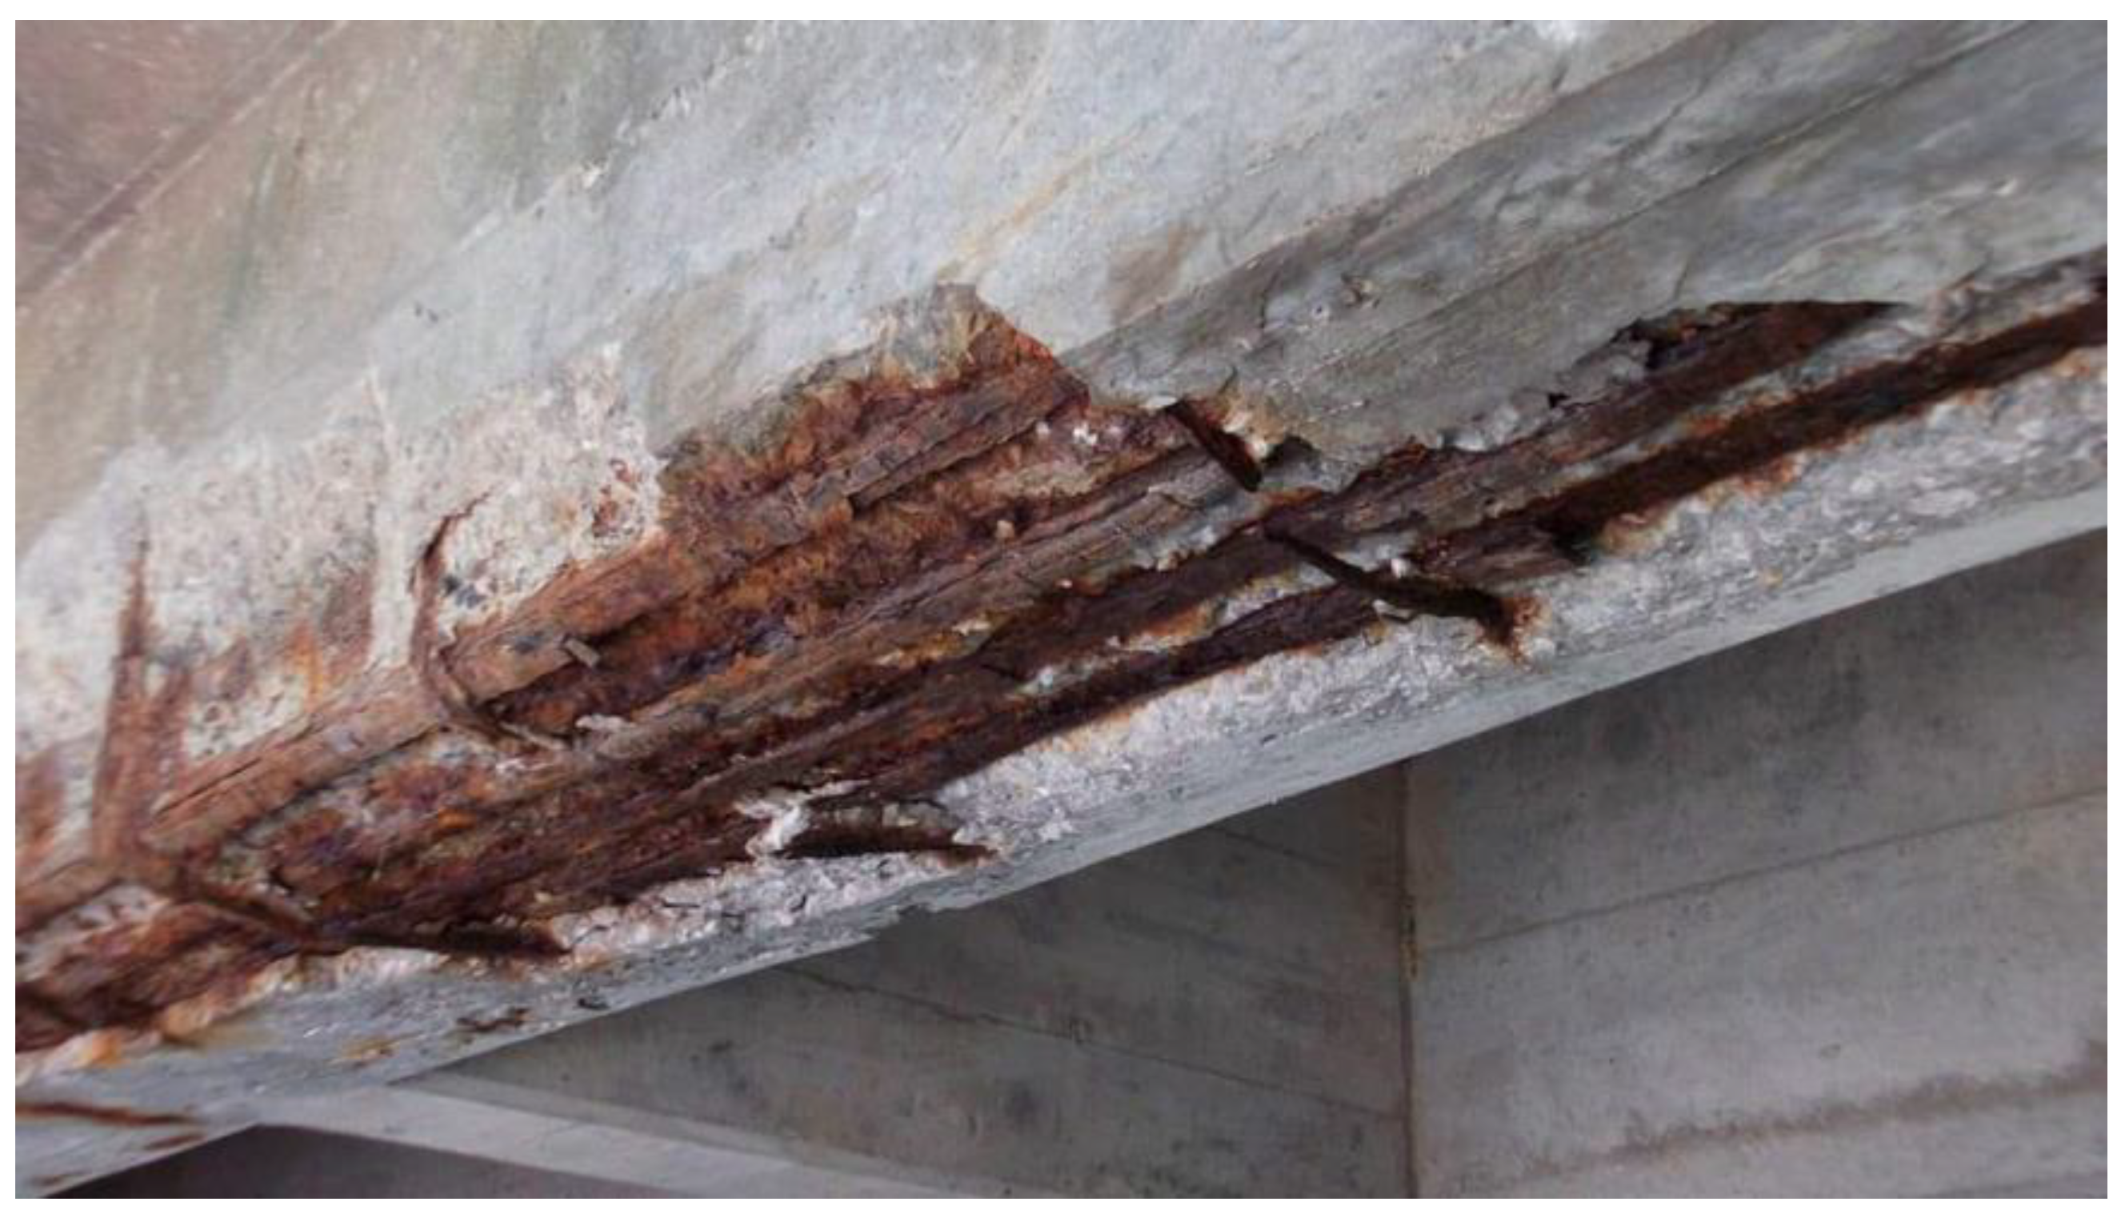
Brown patches of steel: An iron oxide layer forms on the upper part of a steel bar when corrosion begins, and this is carried by moisture to the surface of concrete;
(3)
Formation of cracks: The products of corrosion occupy more space than the original materials, and the pressure exerted on the concrete causes cracks. The greater the corrosion, the wider the cracks;
(4)
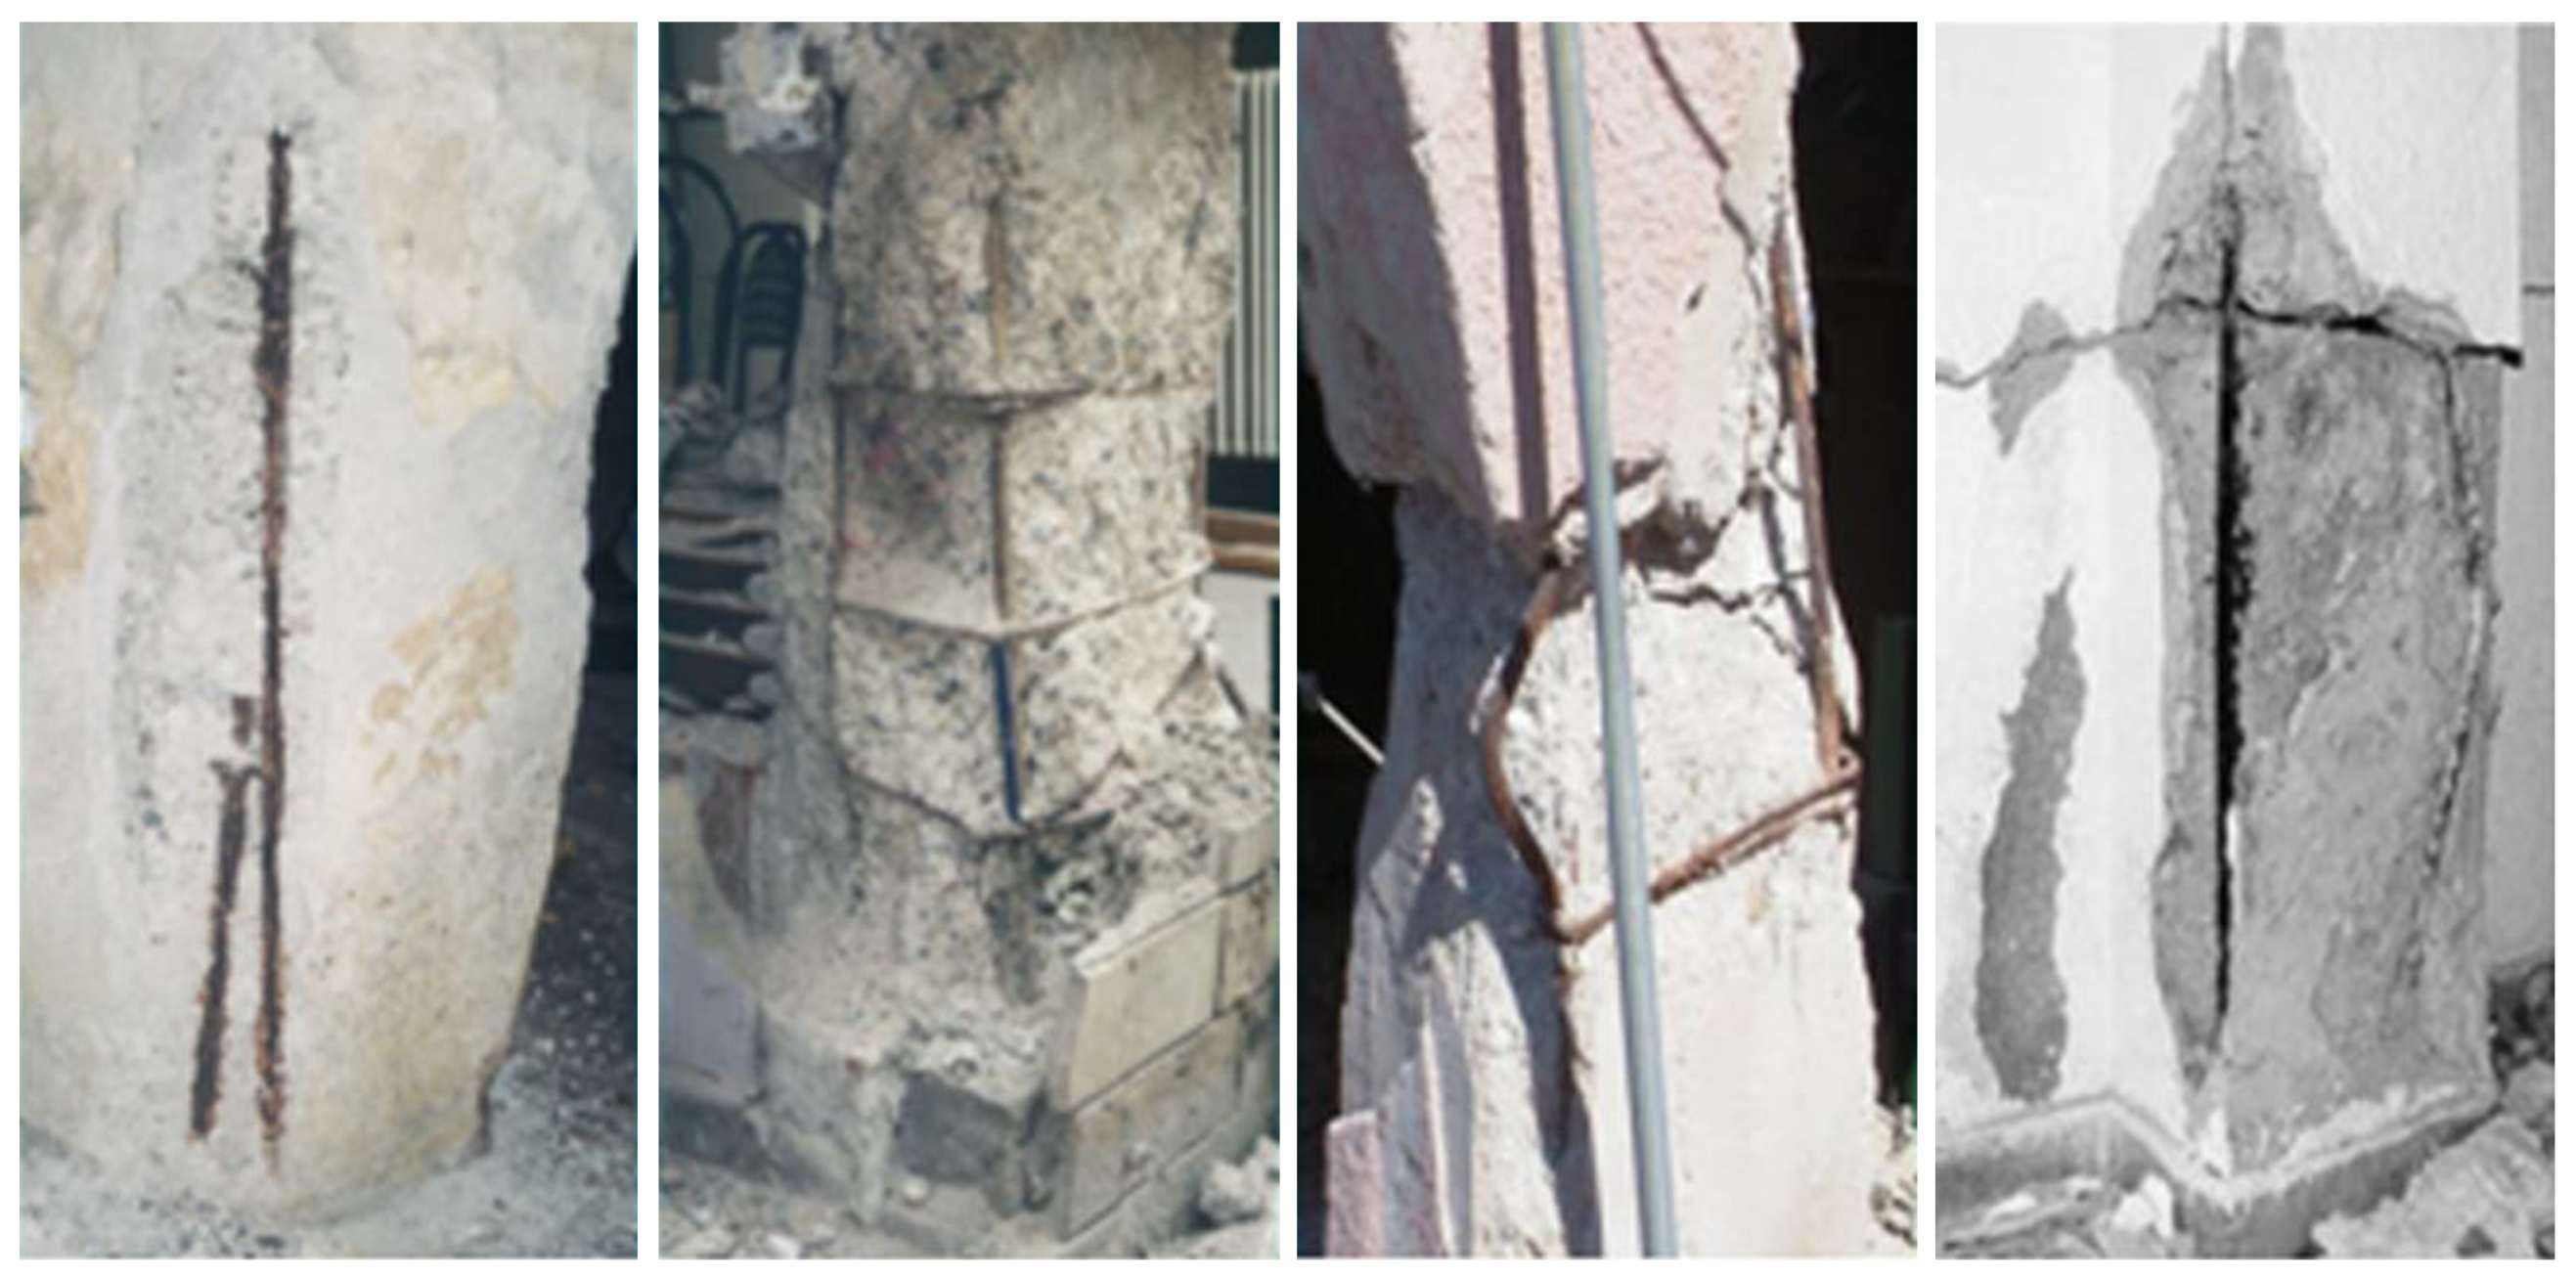
Spalling of concrete: The weakened bond between concrete and steel causes spalling, and the cross-sectional area of steel also decreases;
(5)
Snapping of bars: The reduced cross-sectional area leads to the snapping of steel bars;
(6)
Buckling of bars: Concrete spalling and snapping of bars contribute to the buckling of main bars. The concrete swells up, affecting the stability and service life of RC structures.
A decrease in yield strength due to the reduction of the effective size of bars reduces the tensile force, which the rebars can resist. Moreover, the compressive strength is reduced due to peeling-off of the concrete surface. Consequently, the seriously undermined structural performance ultimately causes the entire structure to collapse.
Additionally, the world has experienced frequent earthquakes in recent years. The severe corrosion of RC structures in earthquake-prone areas will inevitably impact their seismic performance and safety. As shown in Figure 2, the reinforcement corrosion of RC members seriously affects earthquake-induced structural performance, i.e., it indirectly undermines the seismic performance of entire building structures [6]. This phenomenon has been amply demonstrated by seismic disasters in the 1995 Kobe Earthquake (Japan, M = 7.3), the 1999 Jiji Earthquake (Taiwan, M = 7.3), the 1999 Izmit Earthquake (Turkey, M = 7.4), the 2008 Sichuan Earthquake (China, M = 8.0), the 2010 Chile Earthquake (M = 8.8), the 2012 Great East Japan Earthquake (M = 9.0), the 2013 Lushan Earthquake (China, M = 7.0), and the 2016 Komamoto Earthquake (Japan, M = 7.0).
As shown in Figure 3, even in the case of lower seismic intensity, such as the 2004 Niigta-ken Chuetsu Earthquake (Japan, M = 6.8) and the 2017 Pohang Earthquake (Korea, M = 5.4), RC members were damaged by the corrosion of reinforcement as well as non-seismic detail [1]. It not only reduces the cross-sectional area of reinforcing bars, but also the adhesion between reinforcing bars and concrete over time. As a result of this deterioration, bars and concrete do not function properly, significantly weakening the horizontal resistance. Therefore, it is of paramount importance to investigate the impact on the seismic performance of a structure as a whole by examining the impact of the seismic performance of the corroded member in terms of strength and deformation. These research results provide important guidance for accurate seismic performance evaluation of RC structures with corroded members including beams and columns.
However, the currently employed methods for seismic performance assessment of buildings, such as FEMA (Federal Emergency Management Agency guidelines) 310 [7], FEMA 356 [8], and Japan Building Disaster Prevention Association standard (JBDPA) [9], do not sufficiently consider the degradation of seismic performance of RC members, including reinforcement corrosion.
According to FEMA 310 [7] and 356 [8], the seismic evaluation of RC structures should include the degree of damage and the impact of the structural performance of each deteriorated member. As described above, deterioration of concrete and bars significantly lowers the horizontal resistance of RC members. Such evaluation of the impact of concrete and rebar deterioration often requires an onsite investigation. However, according to the methodology presented in FEMA 310, which does not specify a quantitative analysis procedure, the seismic evaluation of RC structures including the impact of corroded members is based on empirical judgment.
Meanwhile, the seismic performance of existing RC buildings for each floor and each direction is evaluated as per the Japanese seismic evaluation standard [9] using the Equation (1):
I s = E o × S D × T
where I s   = structural performance index, E o   = basic structural performance index, S D = irregularity index, and T = aging index.
Here, EO is the basic structural performance index calculated in view of the ultimate horizontal capacity, deformation capacity, number of floors, and a specific number of floors, and SD (non-uniformity index) is the distribution of stiffness according to the irregularity of the building shape and height. SD (irregularity index) is a supplementary index to adjust EO by considering the irregular architectural morphology and irregular distribution of building height and stiffness. Finally, T (aging index) is a supplementary index to evaluate the age-dependent deterioration of building.
T is an index that evaluates the impact of structural deterioration or aging through a systematic onsite inspection consisting of initial inspection, follow-up inspection, and additional elaborate inspection. In the initial inspection, T = 0.8 is applied to a building of minimum 30 years, and T = 0.9 when the interior finishing materials of the building are noticeably peeled off. Among the T values obtained from the onsite inspection, the minimum T value is finally multiplied by the EO index.
In the follow-up inspection and additional elaborate inspection, T of the entire building is calculated by applying the summation principle to Ti of individual members inspected on each floor, where Ti denotes the aging index of the number of inspected floors by the number of floors. Here, Ti represents the aging index of the number of floors (i) inspected. For example, the seismic performance of RC buildings with rebars is evaluated as follows: in the case of beams, if more than 1/3 of all members inspected from each direction have corroded bars, Ti = 0.05; if it is 1/9–1/3, Ti = 0.017; if <1/9, Ti = 0.006; and if 0, Ti = 0. In the case of columns, the corresponding Ti values are 0.15, 0.057, 0.017, and 0, respectively, as shown in Table 1.
Compared with FEMA 310 and 356 guidelines, the Japanese seismic evaluation standard uses T for quantitative evaluation of seismic performance of RC buildings with corrosion-damaged members. However, it is not a direct evaluation method based on EO used to modify Is and the structural performance degradation factor that considers the strength-ductility correlation of T of corroded members; it is an indirect evaluation of the impact of members with corroded bars on the overall seismic performance of buildings. As described above, according to the current standards and guidelines for seismic performance evaluation of RC structures, the strength and deformation of the structure itself are mainly evaluated using primarily a structural analysis program based on structural drawings and measured material strength. That is, the reduction in the durability of corrosion-damaged RC members is addressed by an indirect or qualitative method instead of a direct or quantitative method.
Thus far, hardly any research on the seismic performance evaluation based on the impact of corroded RC members has been conducted [6,10], not to mention research on the quantitative structural performance degradation factor based on the correlation of the strength-deformation capacity of corroded members relative to intact members. It has only been reported that rebar corrosion is the main cause of RC member degradation and reduces the bonding performance [11,12,13,14,15,16,17,18,19].
From the previous, it follows that the seismic performance of RC structures with corrosion-damaged members should be quantitatively and directly evaluated using the structural performance degradation coefficient based on the strength-deformation capacity, i.e., the energy dissipation capacity. Based on these research results, it may be possible to evaluate more accurately the seismic performance of RC structures with corroded members including beams and columns. Therefore, the main purpose of this study is to propose a practical methodology to evaluate the seismic performance of RC structures with corrosion-damaged members; that is, a direct quantitative evaluation of their seismic performance by estimating factors for structural performance degradation based on the strength and deformability of corrosion-damaged members.
In pursuit of the above background and the purpose of the study, we first performed an experimental study to estimate the impact of reinforcement corrosion on the structural behavior of RC beams and determine the factors of structural performance degradation; these results have already been published [1]. The published paper describes the experimental process and results of the impact of rebar corrosion on the structural behavior of RC beams, i.e., the structural performance degradation factor as a function of rebar-corroded RC members experimentally tested using four-point loading under simply supported conditions. In the structural test, shear and flexural beams (n = 8 each) were fabricated, and the impact of reinforcement corrosion on shear and flexural failure was tested. The current technique was used to accelerate the reinforcement corrosion of shear and vertical rebars. A half-cell potential (HCP) was used to quantify the corrosion potential of rebar. Lastly, the correlation between the structural performance degradation factor of the corrosion-damaged member and the voltage-based average potential difference for shear and flexural behavior was proposed, as plotted in Figure 4.
As shown in Figure 4, our aforementioned prior research revealed a relatively high correlation between the performance degradation factor of corroded beam members and the average potential difference in voltage; that is, the correlation coefficient (R2) of the flexural beam and shear beam was verified as 0.78 and 0.91, respectively. It also revealed that the potential difference measured by the HCP method can also be used as an indicator of relative structural performance reduction under constant environmental conditions, and the energy absorption capacity, proposed based on the strength-deformation capacity of corroded RC members, can be evaluated based on the correlation between the performance degradation factor and the average potential difference. The results of the prior study lad to the assumption that the performance degradation factor of corrosion-damaged members can be used as basic data for a direct and quantitative evaluation of the seismic performance of the entire RC building that has corrosion-damaged members.
This study is an extension of our prior research [1] and the second step to proposing a practical method for evaluating the seismic performance of an RC structure that has corrosion-damaged members. Drawing on the results of previous studies [13,14,15,16,17,18,19] that there is a high correlation between corrosion of rebars in RC members and decrease in bonding performance, we performed a finite element analysis (FEA) to identify the impact of a decrease in bonding performance induced by reinforcement corrosion in shear and flexural beams on structural performance reduction based on the strength-deformation capacity. In addition, by comparing and integrating the results of the experimental research performed [1] and FEA results, we made an extended suggestion regarding the performance degradation factor as the function of the corrosion of shear and flexural beams.

2. Outline of the Existing Research Conducted by Authors

Section 2 provides an excerpt from the test results of our aforementioned experimental study [1] on the structural performance reduction of shear and flexural beams with reinforcement corrosion. The excerpted parts are the specimen design and method required for FEA and test results for performance degradation factor and average potential difference in voltage.

2.1. Material Testing and Specimen Design

The compressive strength of the specimens used for the structural test was set to 24.4 MPa. Cylindrical specimens for the strength test were cast in molds (diameter: 100 mm, height: 200 mm) in compliance with ASTM C39/C39M [20], and the 28-day average compressive strength was 24.4 MPa. D16 and D13 were used for vertical rebars, and D10 for stirrups. To identify the material properties of rebars, three rebar tensile test specimens were prepared in accordance with ASTM E8/E8M [21]. As a result, the average yield strength and tensile strength of rebars were 460 and 495 MPa, respectively.
To investigate the impact of rebar corrosion on the flexural and shear behavior of RC beam members, 16 specimens in total (flexural and shear beams, two types each) were designed in accordance with ACI 318 Building Code [22]. As shown in Figure 5, the total length of all specimens amounted to 2200 mm. The cross section of the flexural failure type beam was set to 150 × 250 mm, and the shear failure type beam to 200 × 300 mm. The shear span ratio (a/d) of the shear failure type beam was set to 3.
The flexural failure type beam was designed to have vertical rebars using 2-D13 in the tension part and 2-D10 in the compression part. For the shear reinforcement, D10 was used in the closed-loop stirrup form. The shear failure type beam was designed to have 3-D13 rebars in the tension part and 2-D10 rebars in the compression part, and the shear reinforcement was provided in the form of an open-loop stirrup. F-B0 and S-B0 are flexural and shear beam comparison specimens without rebar corrosion, respectively. FB-C0 through FB-C7 and SB-C0 through SB-C7 are specimens degraded by the sequentially applied impressed current technique.

2.2. Experimental Method and Test Results

As illustrated in Figure 6, all beam members were loaded by a four-point bending test method. The pure bending span between two loading points was 600 mm for the flexural failure type beam and 500 mm for the shear failure type beam. In the structural test, the load was controlled at the loading speed of 20 kN/min until 50% of the expected ultimate load was reached using a monotonic transverse loading method, followed by a speed of 0.7 mm/min using a displacement control method. The experiment was terminated when the maximum tensile strength was reduced to 70% after reaching the peak tensile strength.
In accordance with ASTM C876 [23], each specimen corroded by the impressed current technique was subjected to quantitative measurement of the potential of the member with corroded rebars at 24 measurement points by the HCP [24]. The second column of Table 2 shows the average potential difference of the 24 measurement points for the reinforcement corrosion potential difference of each specimen. The potential difference sequentially increases in the order of specimens FB-C1 through FB-C7 and SB-C1 through SB-C7. This is related to the increase or decrease of the corrosion acceleration rate of the specimen in the process of corrosion by the impressed current technique.
Table 2 presents the ultimate load and deflection of each flexural and shear beam specimen, and also the energy dissipation area calculated based on the strength and deformation caused by corrosion of rebars and the performance degradation factor (ϕ) defined by Equation (2). In a previous study [1], the correlation between the average potential difference in voltage (mV) and the performance degradation factor (ϕ) of each specimen presented in Table 2 was proposed, as illustrated in Figure 4.
ϕ = E r E t
where Et and Er denote the energy dissipation areas of the beam member before and after rebar corrosion, respectively.
In this study, we determined the correlation between the bonding factor (β) and the structural performance reduction coefficient (ϕ) by performing FEA to determine the impact of reinforcement corrosion-induced decrease in bonding performance on strength-deformation capacity-based structural performance reduction using shear and flexural specimens, on which the structural test was conducted [1], based on a high correlation between the corrosion of rebar of RC members and the decrease in bonding performance, as observed previously [13,14,15,16,17,18,19]. By interrelating the βϕ correlation derived from FEA and the mV–ϕ correlation shown in Figure 4 and combining the β–mV correlation in view of ϕ, we ultimately proposed a ϕβ–mV correlation curve as an extension of the proposal made in our prior research [1].

3. Methodology of Finite Element Analysis

3.1. Overview of the Analysis Program

As a FEA analysis model, we used the disturbed stress field model (DSFM) [25] developed by Vecchio of the University of Toronto, extending the modified compression field theory (MCFT) [26]. In the same manner as MCFT, DSFM is based on the rotation angle theory in which the directions of crack and main compressive stress are identical when inducing the equilibrium conditions of force and compatible conditions for strain. However, unlike the DSFM, which uses average stress when considering equilibrium conditions, we considered the shear slip-induced deformation at the crack surface along with average strain. Because the DSFM considers both equilibrium conditions of force and compatible conditions of strain, as does the truss model that considers the conventional compatible conditions, it can predict not only the flexural strength and deformation of RC structural members, but also the shear strength and deformation. DSFM is applied to VecTor2 [27], a two-dimensional nonlinear FEA, and employed for predicting the nonlinear response of RC structures.
In this study, we determined the impact of rebar corrosion-induced decrease in bonding performance on strength-deformation capacity, i.e., the correlation β and ϕ, using VecTor2 [27] for shear and flexural beam specimens, on which the structural test was conducted in our prior research [1]

3.2. Concrete Analysis Model

(1)
Concrete stress-strain model
For the concrete stress-strain relationship, we used the Parabola model proposed by Hognestad [28] expressed by Equation (3), which is suitable for normal concrete strength of up to 40 MPa in the compression pre-peak response.
f c i = f p { 2 ( ε c i ε p ) ( ε c i ε p ) 2 } < 0   for   ε c i < 0
where f c i   = principal compressive stress, f p   = peak compressive stress, ε c i = principal compressive strain, and ε p = peak compressive strain.
In the compression post-peak response, we used Equation (4) proposed by Kent and Park [29] and modified by Park et al. [30] and the modified Park–Kent model shown in Figure 7.
f c i b = [ f p + Z m f p ( ε c i ε p ) ] < 0   o r 0.2   f p   for   ε c i < ε p < 0
where f c i b = f u n c ( ε c i ) , Z m = 0.5 3 + 0.29 | f c | 145 | f c | 1000 · ( ε 0 0.002 ) + ( | f l a t | 170 ) 0.9 + ε p , f c = unconfined uniaxial concrete cylinder strength, and ε 0 = strain corresponding to f c , f l a t = f c 1 + f c 2 + f c 3 f c i 0 (i = 1 or 2), the summation of principal acting transversely to the direction under consideration.
(2)
Concrete compression softening model
The compressive behavior of concrete under biaxial stress is different from that under uniaxial stress in the stress-strain behavior in the main compressive direction due to cracks in the direction of the principal tensile. As the principal tensile strain increases with respect to the principal compressive strain, a smaller compressive stress becomes dominant over the behavior under uniaxial stress, which is called the compression softening effect [26]. To consider this effect, we used the Vecchio 1992-A [25] model expressed by Equation (5) and Figure 8.
f p = β d f c ,   ε p = β d ε c
where, β d = f u n c ( ε c 1 ε 0 ) = 1 1 + C s C d 1 , C d = { 0 0.35 ( r 0.28 ) 0.80   if   r < 0.28 if   r > 0.28 , r = ε c 1 ε c 2 400 , and C s = { 1.0 0.55   if   shear   slip   not   considered if   shear   slip   considered .
The compression softening model illustrated in Figure 8 is proposed based on the test results of 116 panel and shell elements. In this model, the ratio of the principal tensile stress to the compressive strain is limited to 400, so that the softening effect can be prevented from being overestimated when the principal tensile strain is extremely large, for example, when the rebar yields. The coefficient Cs is used to check whether shear slip deformation is considered or not.
(3)
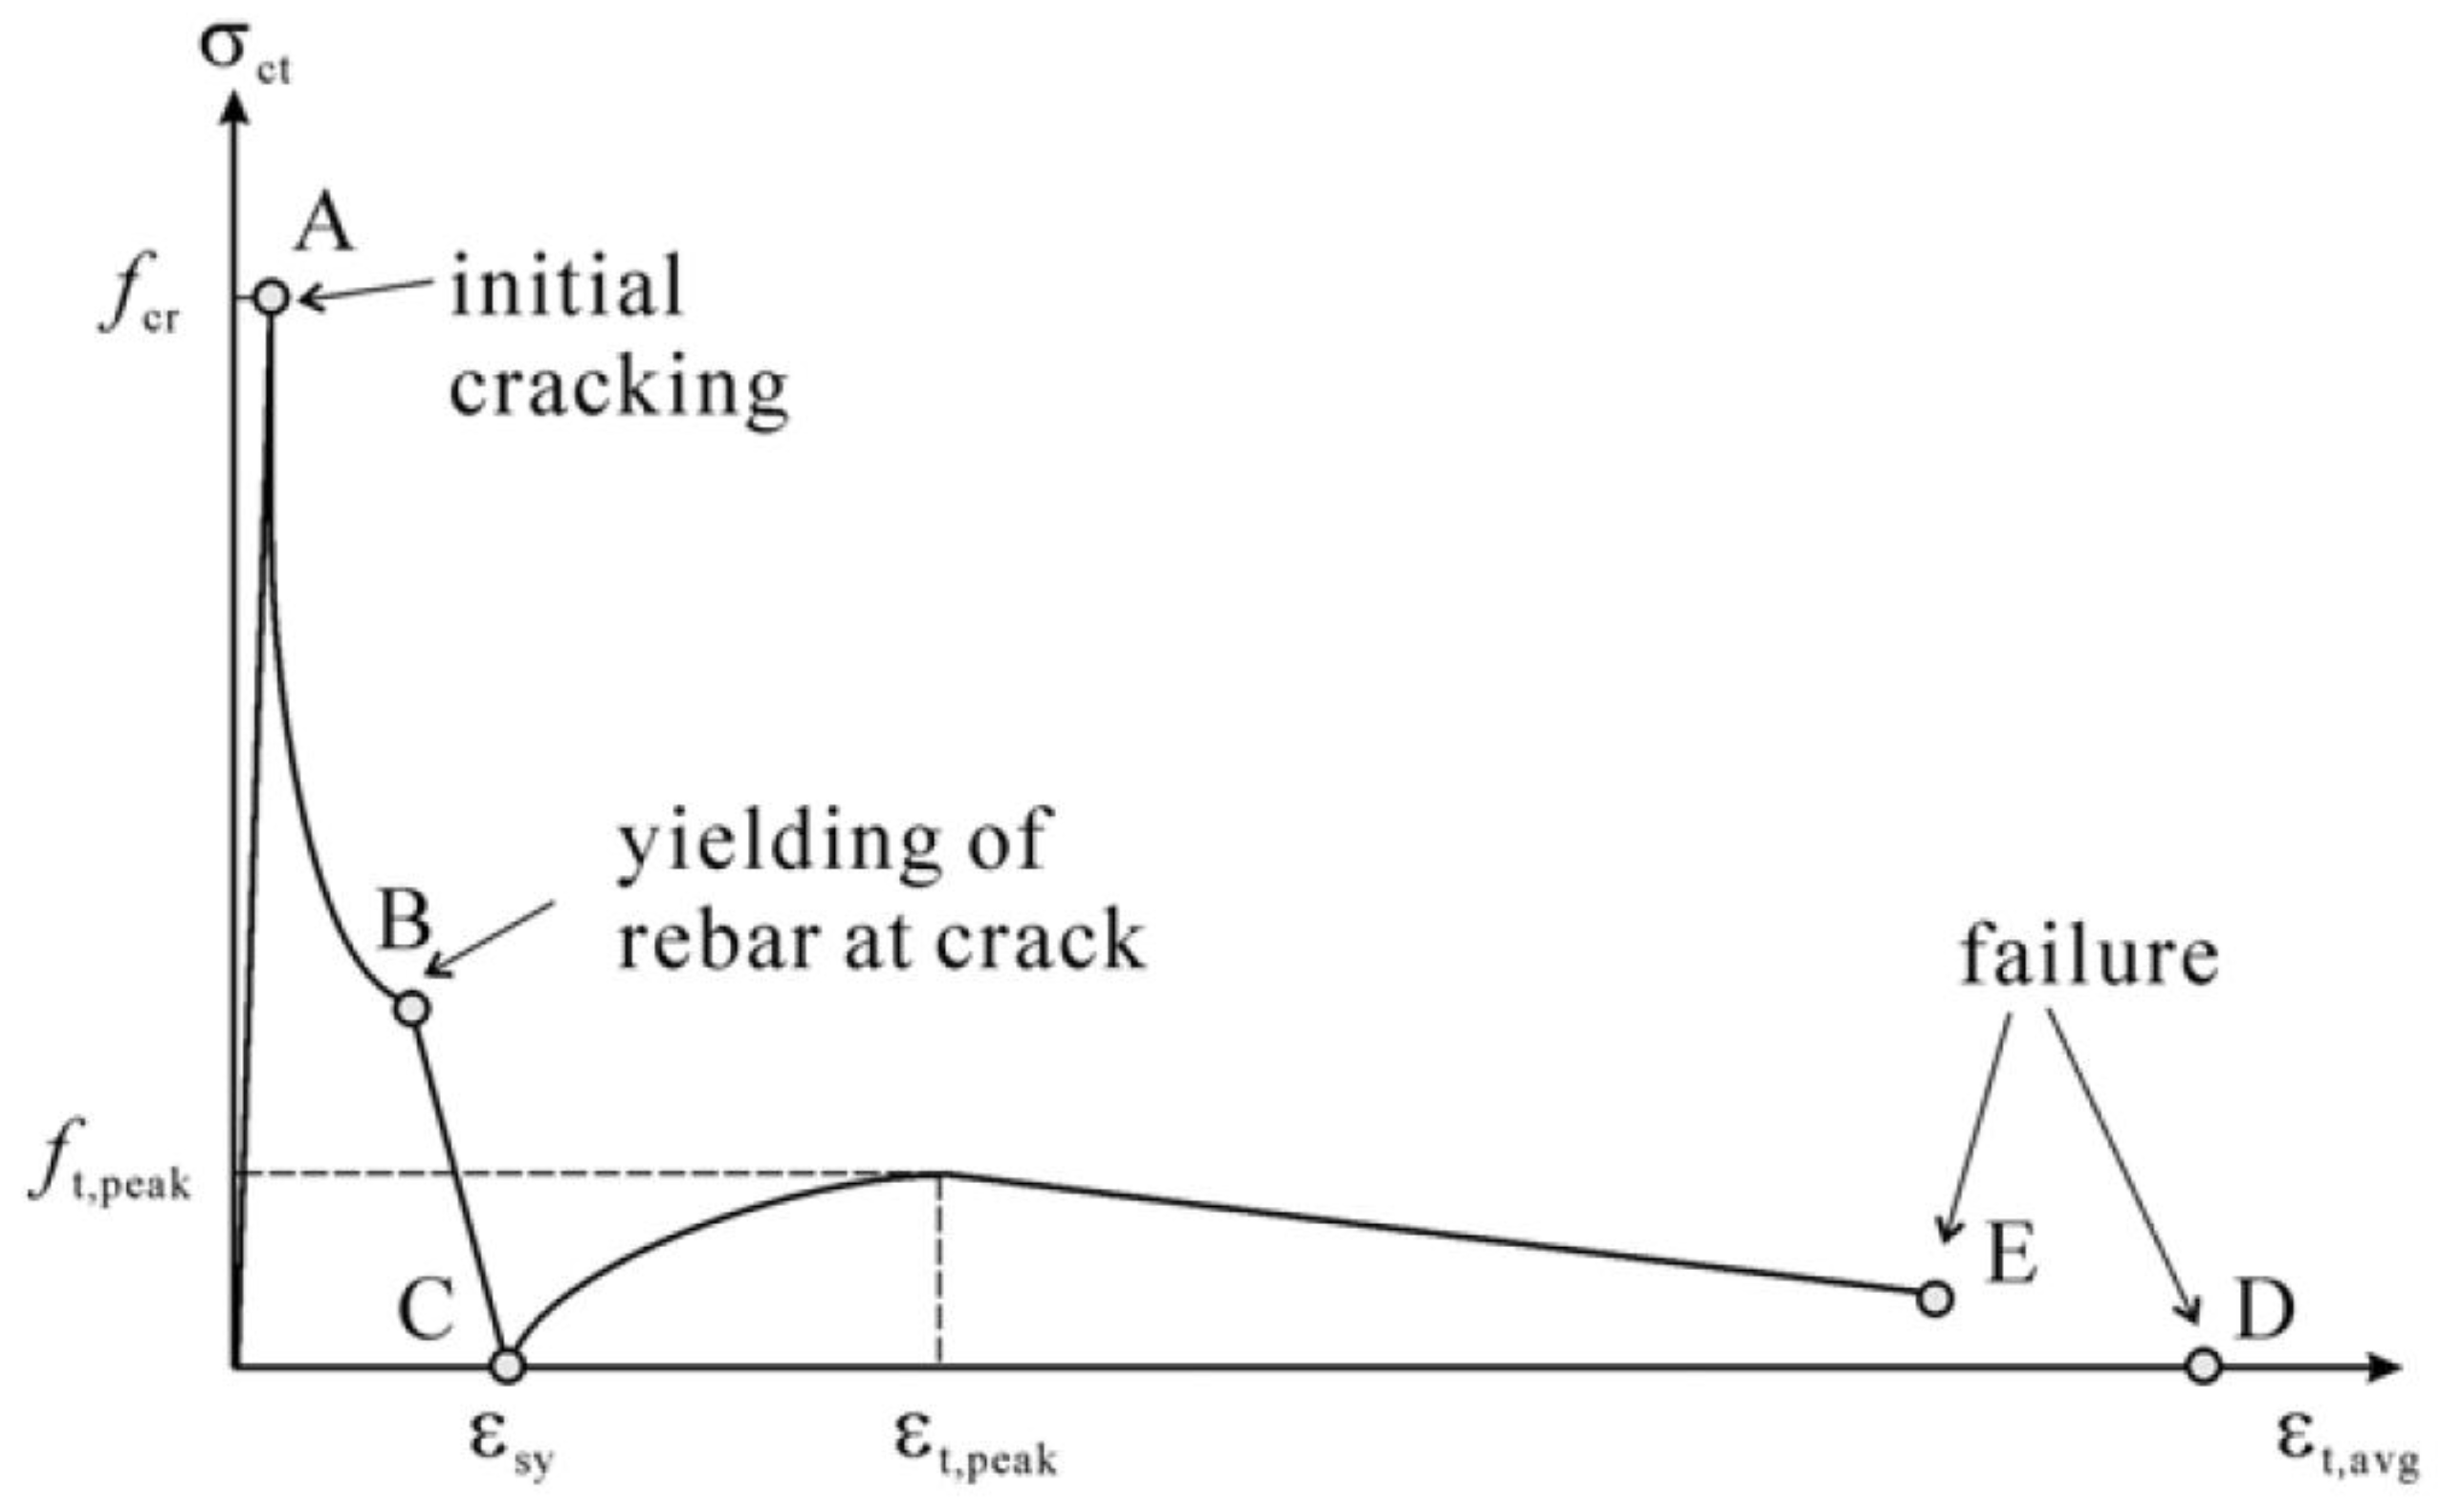
Concrete tensile increase model
When a crack occurs in an RC structure, stiffness decreases, and stress is redistributed on the crack surface. On the crack cross-section, the rebar bears all the tensile force. As the load increases, however, cracks propagate, and the concrete between the cracked sections partially bears the tensile force transmitted from the rebar by bonding force, resulting in an increased tensile strength of the rebar in concrete. This phenomenon is called the tension stiffening effect [31]. If the tensile strength of concrete is not considered, the concrete tensile stress immediately decreases to zero upon cracking and is redistributed across the rebar, triggering discontinuous changes in stiffness, which may lead to unrealistic deviations in load-strain response. To consider the tension stiffening effect, we determined the average deformation condition by calculating the tensile stress at the crack location, using Equation (6) and the model proposed by Lee et al. [31] shown in Figure 9.
f c t , a v g = { f c t , p e a k f c t , p e a k ( ε t , p e a k ε t , a v g ε t , p e a k ε s y ) 2     f o r   ε s y ε t , a v g ε t , p e a k f c t , p e a k f c t , p e a k 0.5 f c t , p e a k , ρ m i n 0.1 ε t , p e a k ( ε t , a v g ε t , p e a k ) 0.5 f c t , p e a k , ρ m i n       f o r   ε t , a v g ε t , p e a k  
where f c t , a v g = average tensile stress of concrete, f c t , p e a k = peak average tensile stress of concrete after yielding of reinforcement ( f c t , p e a k = a f c ), a = 0.0313 ρ s 0.57 d b + 3.3881 ρ s 0.76 , ρ s = reinforcement ratio, ε t , p e a k = peak tensile strain of RC ( ε t , p e a k = 0.01 + 0.001 · max ( 15 d b , 0 ) ε s h ), d b = diameter of reinforcement, ε s h = hardening strain of reinforcement, ε t , a v g = average tensile strain of reinforced concrete, ε s y = yield strain, f c t , p e a k , ρ m i n = f c t , p e a k considering ρ m i n = ε c r · E c f s y ε c r · E s ρ m i n , ε c r = cracking strain of concrete, E c = modulus of elasticity of concrete, E s = modulus of elasticity of steel reinforcement, and f s y = yield strength of steel reinforcement.

3.3. Rebar Analysis Model
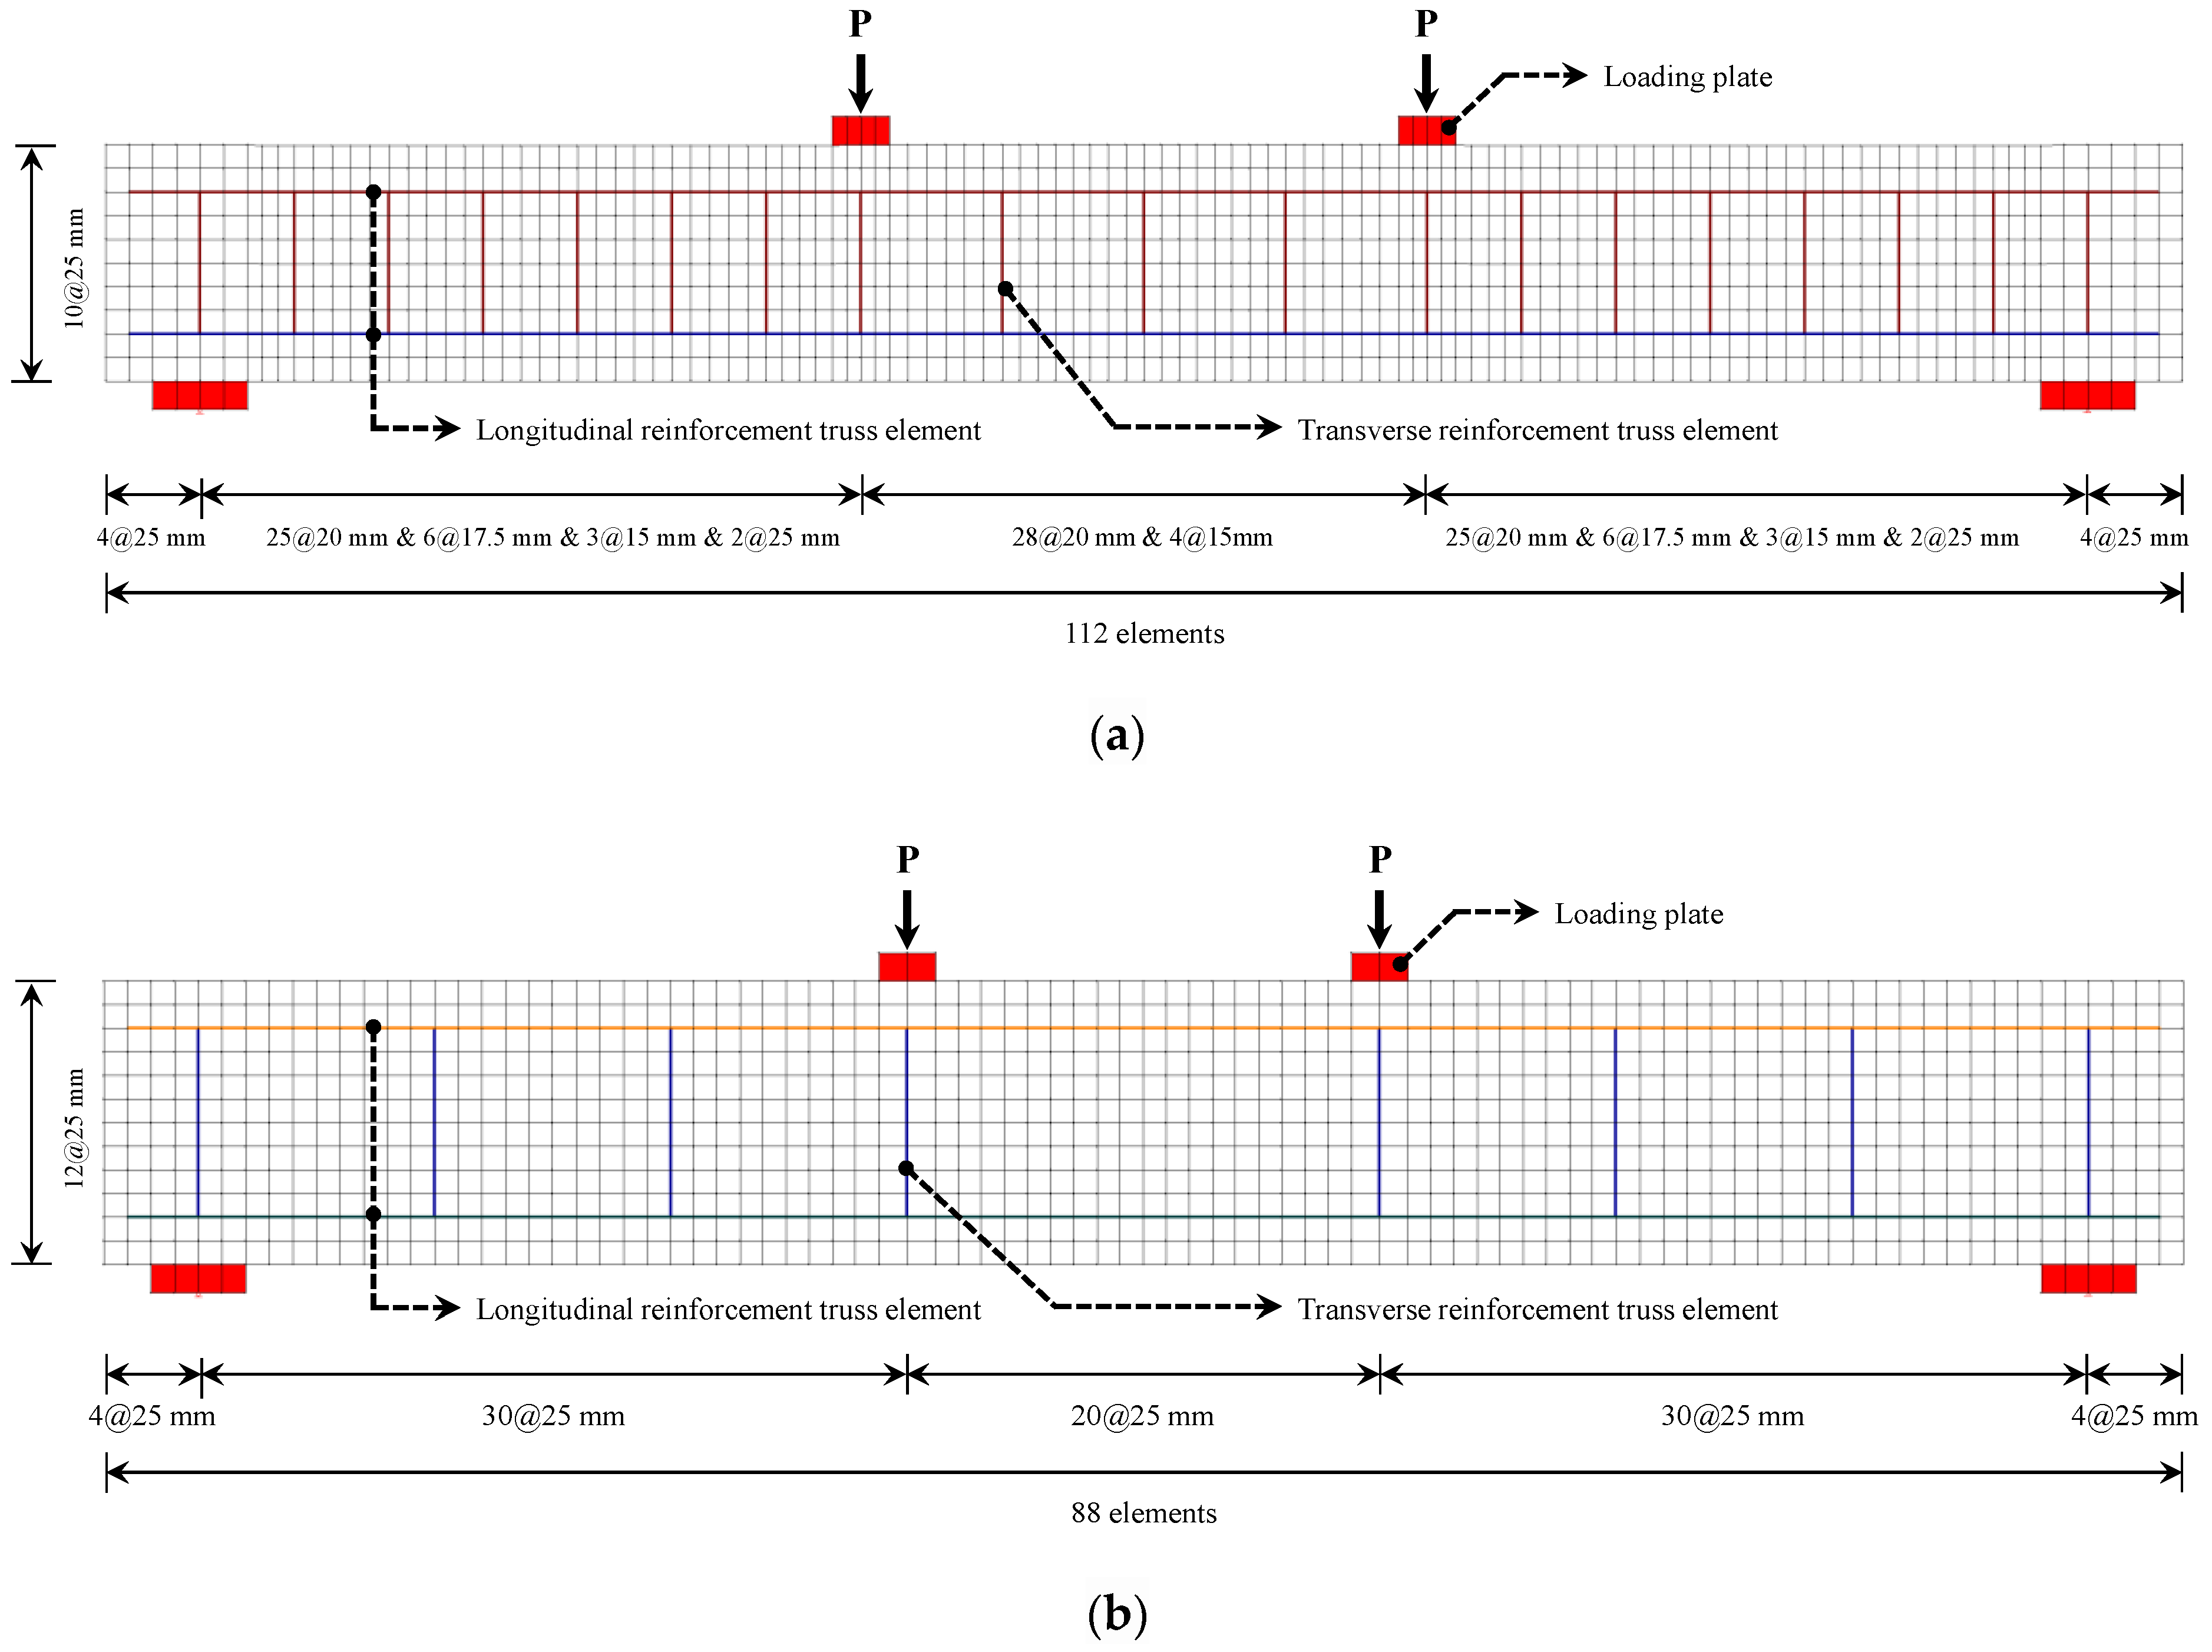
As the rebar stress-strain model, we used the Curvilinear model in which the strain hardening and necking regions can be considered after perfect plasticity following the rebar yield, as expressed by Equation (7). The modulus of elasticity was set to 200 GPa.
f s = f s u ( f s u f s y ) ( ϵ s u ϵ s ϵ s u ϵ s h ) 4
where f s = tensile stress, f s u = rupture strength, f s y = yield strength, ϵ s u = rupture strain, and ϵ s h = hardening strain. These relate to the steel reinforcement.
The dowel action of rebar increases the shear resistance of rebar as the crack slides in the transverse direction of the rebar axis, as shown in Figure 10. As is the case with beams with transverse reinforcement, the dowel action plays an important role in shear strength and ductility after the strain hardening of RC members. In this study, the Tassios model [32,33] expressed by Equation (8) was used for the dowel action of rebar.
V d = E s I z λ 3 δ s V d u
where V d = dowel force developed in reinforcement bar, E s = modulus of elasticity of steel reinforcement bar, I z = π d b 4 64 , λ = k c d b 4 E s I z 4 , k c = 127 · c f c d b   2 / 3 , c = 0.8 , δ s = shear slip along the crack, d b = diameter of the reinforcement, V d u = dowel force developed in reinforcement bar at ultimate limit state ( V d u = 1.27 d b 2 f c f y ), f c = compressive strength of the concrete, and f y = yield strength of the reinforcement.
Previous studies [13,14,15,16,17,18,19] have verified a high correlation between rebar corrosion in RC members and reduced bonding performance. As a rebar bonding model, we used the model proposed by Eligehausen et al. [34], as shown in Figure 11. The bond stress-slip response in this model is determined by (1) ascending non-linear branch, (2) constant bond stress plateau, (3) linearly declining branch, and (4) sustaining residual stress branch in accordance with β (confinement pressure bonding factor), as expressed by Equation (9).
τ = τ s p 1 ( Δ Δ s p 1 ) a   f o r   Δ Δ s p 1 τ = τ s p 1 [ ( Δ Δ s p 12 ) ( Δ s p 3 Δ s p 2 ) ( Δ s p 2 τ s p f ) ]   f o r   Δ s p 1 < Δ Δ s p 2 τ = τ s p 2 [ ( Δ Δ s p 1 ) ( Δ s p 3 Δ s p 2 ) ( Δ s p 2 τ s p f ) ]   f o r   Δ s p 2 < Δ Δ s p 3 τ = τ s p f   f o r   Δ s p 3 < Δ
where τ = bond stress along the reinforcing bar, Δ = bond slip, τ s p 1 = bond stress at an ascending non-linear branch ( τ s p 1 = τ s 1 + β ( τ p 1 τ s 1 ) ), Δ s p 1 = bond slip at an ascending non-linear branch ( Δ s p 1 = Δ s 1 + β ( Δ p 1 Δ s 1 ) Δ s 1 ), τ s p 2 = bond stress at a constant bond stress plateau ( τ s p 2 = τ s p 1 ), Δ s p 2 = bond slip at a constant bond stress plateau ( Δ s p 2 = Δ p 2 ), τ s p f = bond stress at a sustaining residual stress branch ( τ s p f = τ s 1 + β ( τ p f τ s f ) ), Δ s p 3 = bond slip at a sustaining residual stress branch ( Δ s p 3 = Δ p 3 ), and β = confinement pressure bonding factor.

3.4. FEA Model

We performed FEA of flexural and shear beams and rebar placing, as shown in Figure 5 and Figure 12, in line with the concrete and rebar analysis model described in Section 3.2 and Section 3.3. For the modeling of flexural beam, 1120 elements (10 × 112) were used for each specimen (width: 250 mm, length: 2200 mm). For that of shear beam, 1056 elements (12 × 88) were used (width: 300 mm, length: 2200 mm)
In FEA, for the purpose of determining the impact of rebar corrosion-induced decrease in bonding performance on the strength-deformation capacity, i.e., the correlation between bonding factor (β) and performance degradation factor (ϕ), β (confinement pressure bonding factor) was set as the major variable for controlling the bonding performance of rebar, and analysis was performed using a total of 12 variables, varying β down to 0.4, with the perfect bonding state β = 1 as the reference value.

4. Results of FEA

4.1. Beam Controlled by Flexure

Figure 13 shows the comparison between test (FB-C0: comparison specimen without corrosion) and analysis (Case-1: uncorroded flexural beam specimen). Table 3 outlines the results of FEA with 12 variables ( β = 1 down to β = 0.4). The ultimate load of the comparison specimen is 87.3 kN (Table 2) as the analysis result, approximately 107% the experimental value, 81.6 kN (Table 2). The deflection at the ultimate load in analysis vs. test was 115.9 vs. 116.7 mm, respectively, i.e., 99%, demonstrating that the analysis result using VecTor2 shows a very similar behavior to the test result. These results indicate that the applied FEA model effectively simulates the control specimen, and that the structural performance reduction of flexural beams caused by rebar corrosion can be defined as the relationship between the reduction in bonding factor (β) and the performance degradation factor (ϕ) caused by corrosion.
On a related note, Figure 14 shows the correlation between β and ϕ of each FEA case presented in Table 3, and Figure 15 shows that between average potential difference in voltage (mV) and performance degradation factor (ϕ) of each flexural specimen tested in our prior research [1]. The FEA-derived bonding factor (β) and performance degradation factor (ϕ) can be approximated by Equation (10) using regression analysis, and its R2 = 0.94, which indicates a very high correlation. The mV and ϕ of each specimen tested in the aforementioned prior research can be approximated by Equation (11).
ϕ = ( 0.36 β ) 1 + 101   ( A n a l y s i s   :   R 2 = 0.94 )
ϕ = 0.05 ( mV ) + 100   ( T e s t   :   R 2 = 0.78 )
ϕ expressed by Equations (10) and (11) is a coefficient representing the reduction in structural performance induced by rebar corrosion (experiment) and bonding performance (analysis) of flexural beams, which represent the same physical value from the engineering aspect. Therefore, using Equations (10) and (11), the relationship between the bonding factor (β) and the average potential difference in voltage (mV) can be defined by Equation (12). Figure 16 is a schematic representation of the β-mV correlation.
mV = 1.36 β 0.018 0.05 β
By interrelating the correlation between β and ϕ derived from FEA as expressed by Equation (10) and that between average potential difference in voltage (mV) and performance degradation factor (ϕ) as expressed by Equation (11), a ϕβ–mV correlation curve of the flexural beam can be proposed by integrating the β–mV correlation, as expressed by Equation (12) with respect to ϕ.

4.2. Beam Controlled by Shear

Figure 17 shows the test (SB-C0) vs. analysis (Case-1) results of the uncorroded shear beam specimen. Table 4 outlines the results of each analysis performed using a total of 12 variables from the reference value β = 1 down to β = 0.4. The ultimate load of the shear beam specimen was 186.8 kN in the analysis (Table 4) vs. 181.9 kN in the test (Table 2), approximately 3% greater in the analysis, and the deflection at the ultimate load was 12.03 mm in the analysis and 11.3 mm in the test, approximately 6% greater. Analysis using VecTor2 yielded results similar to the test results. These results demonstrate that the FEA model used to determine the impact of the decrease in bonding performance of shear beam due to corrosion of rebars on the reduction in structural performance based on strength-deformation capacity is an effective method to understand the correlation between bonding factor (β) and performance degradation factor (ϕ).
Figure 18 shows the correlation between β and ϕ for each case presented in Table 4, and Figure 19 shows that between the average potential difference in voltage (mV) and performance degradation factor (ϕ) of the shear beam specimens, as conducted in our prior research [1]. The FEA-derived bonding factor (β) and performance degradation factor (ϕ) can be approximated by Equation (13), obtained using regression analysis, and its R2 = 0.98, which indicates a very high correlation. The mV and ϕ of each specimen tested in the aforementioned prior research can be approximated by Equation (14).
ϕ = 37.3 β + 63   ( A n a l y s i s   : R 2 = 0.98 )
ϕ = 0.04 ( mV ) + 106   ( T e s t   :   R 2 = 0.91 )
ϕ in Equations (13) and (14) is a coefficient representing the rebar corrosion-induced structural performance reduction (test) and bonding performance (analysis) of shear beams. Because it represents the same physical value, Equations (13) and (14) can be combined to yield Equation (15) to express the relationship between the bonding factor (β) and the average potential difference in voltage (mV). Figure 20 is a schematic representation of the β–mV correlation of shear beams.
mV = 932.5 β 1075
By interrelating the correlation between β and ϕ derived from FEA, as expressed by Equation (13), and that between average potential difference in voltage (mV) and ϕ, as expressed by Equation (14), a ϕβ–mV correlation curve of the flexural beam can be proposed by integrating the β–mV correlation, as expressed by Equation (15), with respect to ϕ.

5. ϕβ–mV Correlation Curve Obtained by Structural Test and FEA

Using the FEA model for concrete and rebars established in Section 3, the impact of decreased bonding performance due to rebar corrosion of flexural and shear beams on strength-deformation capacity, i.e., the coefficient between bonding factor (β) and performance degradation factor (ϕ), as shown in Figure 14 and Figure 18, respectively, was examined in Section 4. In Section 5, the βϕ correlation and that between the average potential difference in voltage quantitatively measured on corroded beam members by HCP and performance degradation factor, as shown in Figure 15 and Figure 19, respectively, i.e., the mV–ϕ correlation, was compared from the engineering aspect, and an mV–βϕ correlation curve of flexural and shear beams was ultimately proposed.
Figure 21 and Figure 22 show the mV–βϕ correlation curves of corroded flexural and shear beams, respectively. Using these curves, the bonding factor (β) depending on the degree of corrosion of RC shear and flexural beam members and the performance degradation factor (ϕ) based on the consequent strength-deformation capacity can be evaluated. These results assert that the methodology proposed in this study can be used for quantitatively evaluating the seismic performance of corrosion-damaged RC members.

6. Conclusions

This study is an extension of our prior research [1] and the second step to achieving the main purpose of proposing a practical method to evaluate the seismic performance of an RC structure that has corrosion-damaged members. Drawing on the results of a high correlation between the corrosion of rebars in RC members and decrease in bonding performance, we performed FEA to determine the impact of the bonding factor (β) induced by reinforcement corrosion in shear and flexural beams on the performance degradation factor (ϕ) based on strength-deformation capacity. Lastly, by interrelating the mV–ϕ correlation (analysis) and mV–ϕ correlation (test) from the engineering aspect, the mV–βϕ correlation curve of flexural and shear beams was proposed. The results of this study can be summarized as follows:
(1)
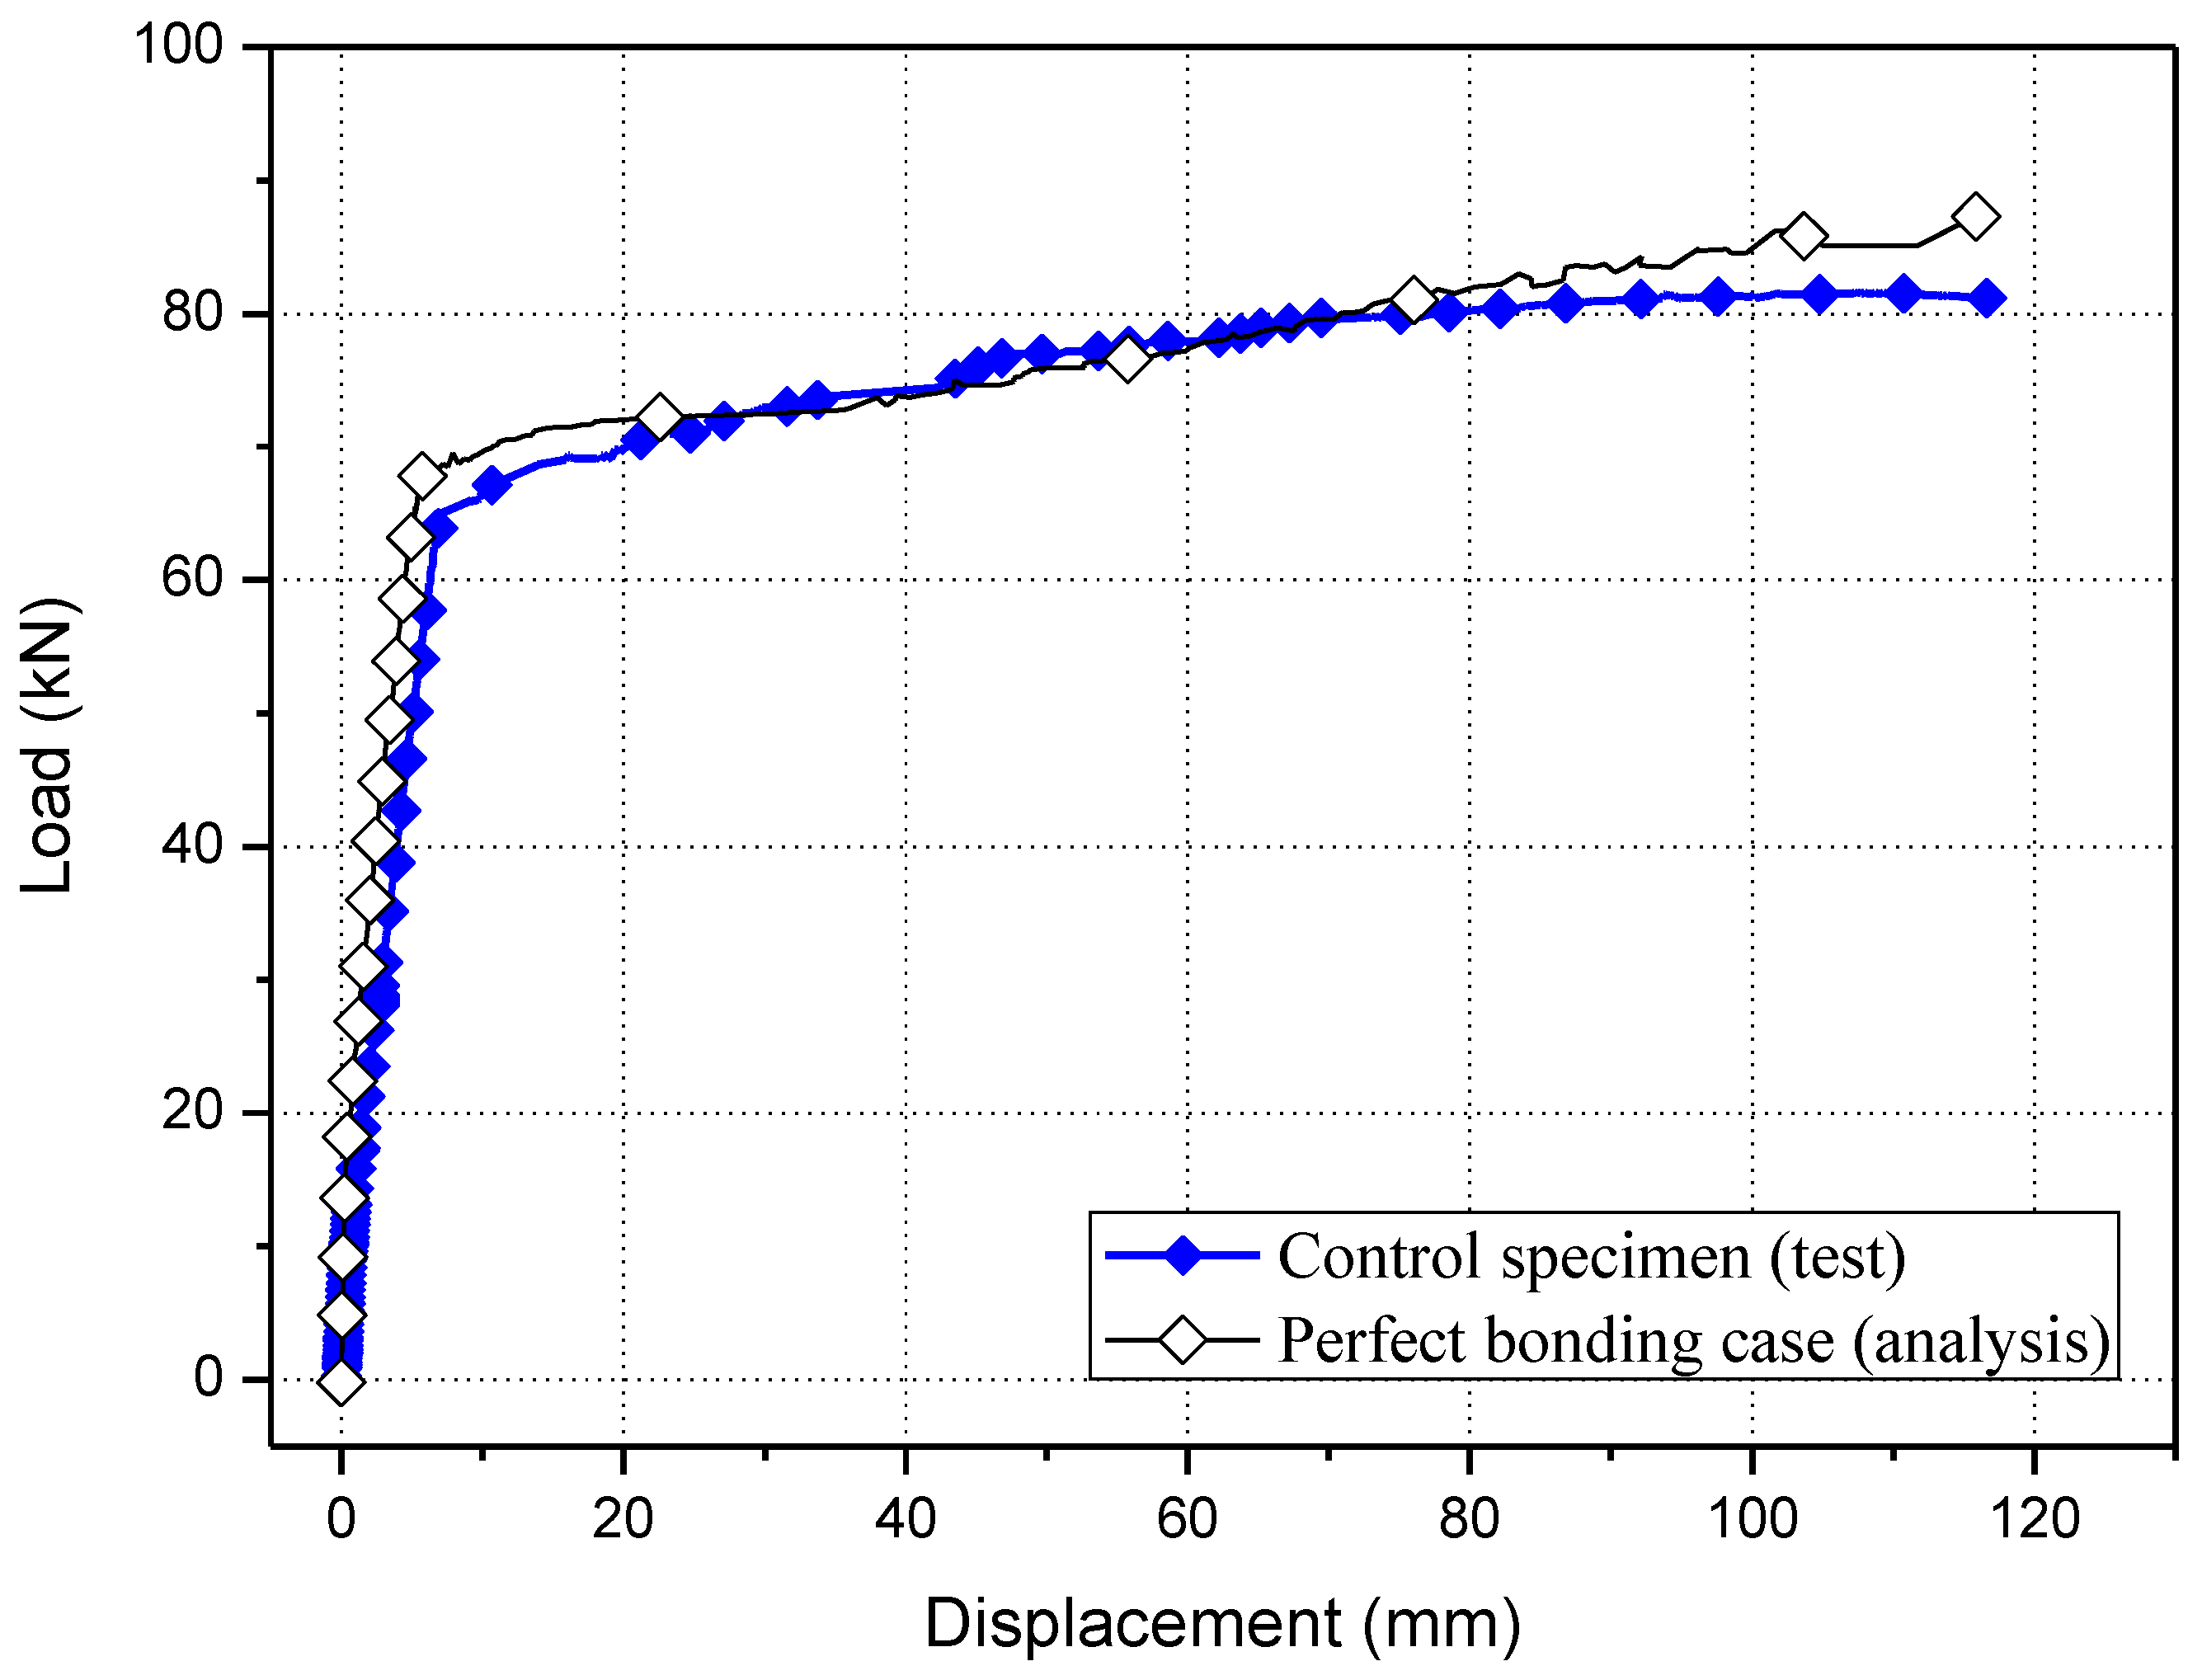
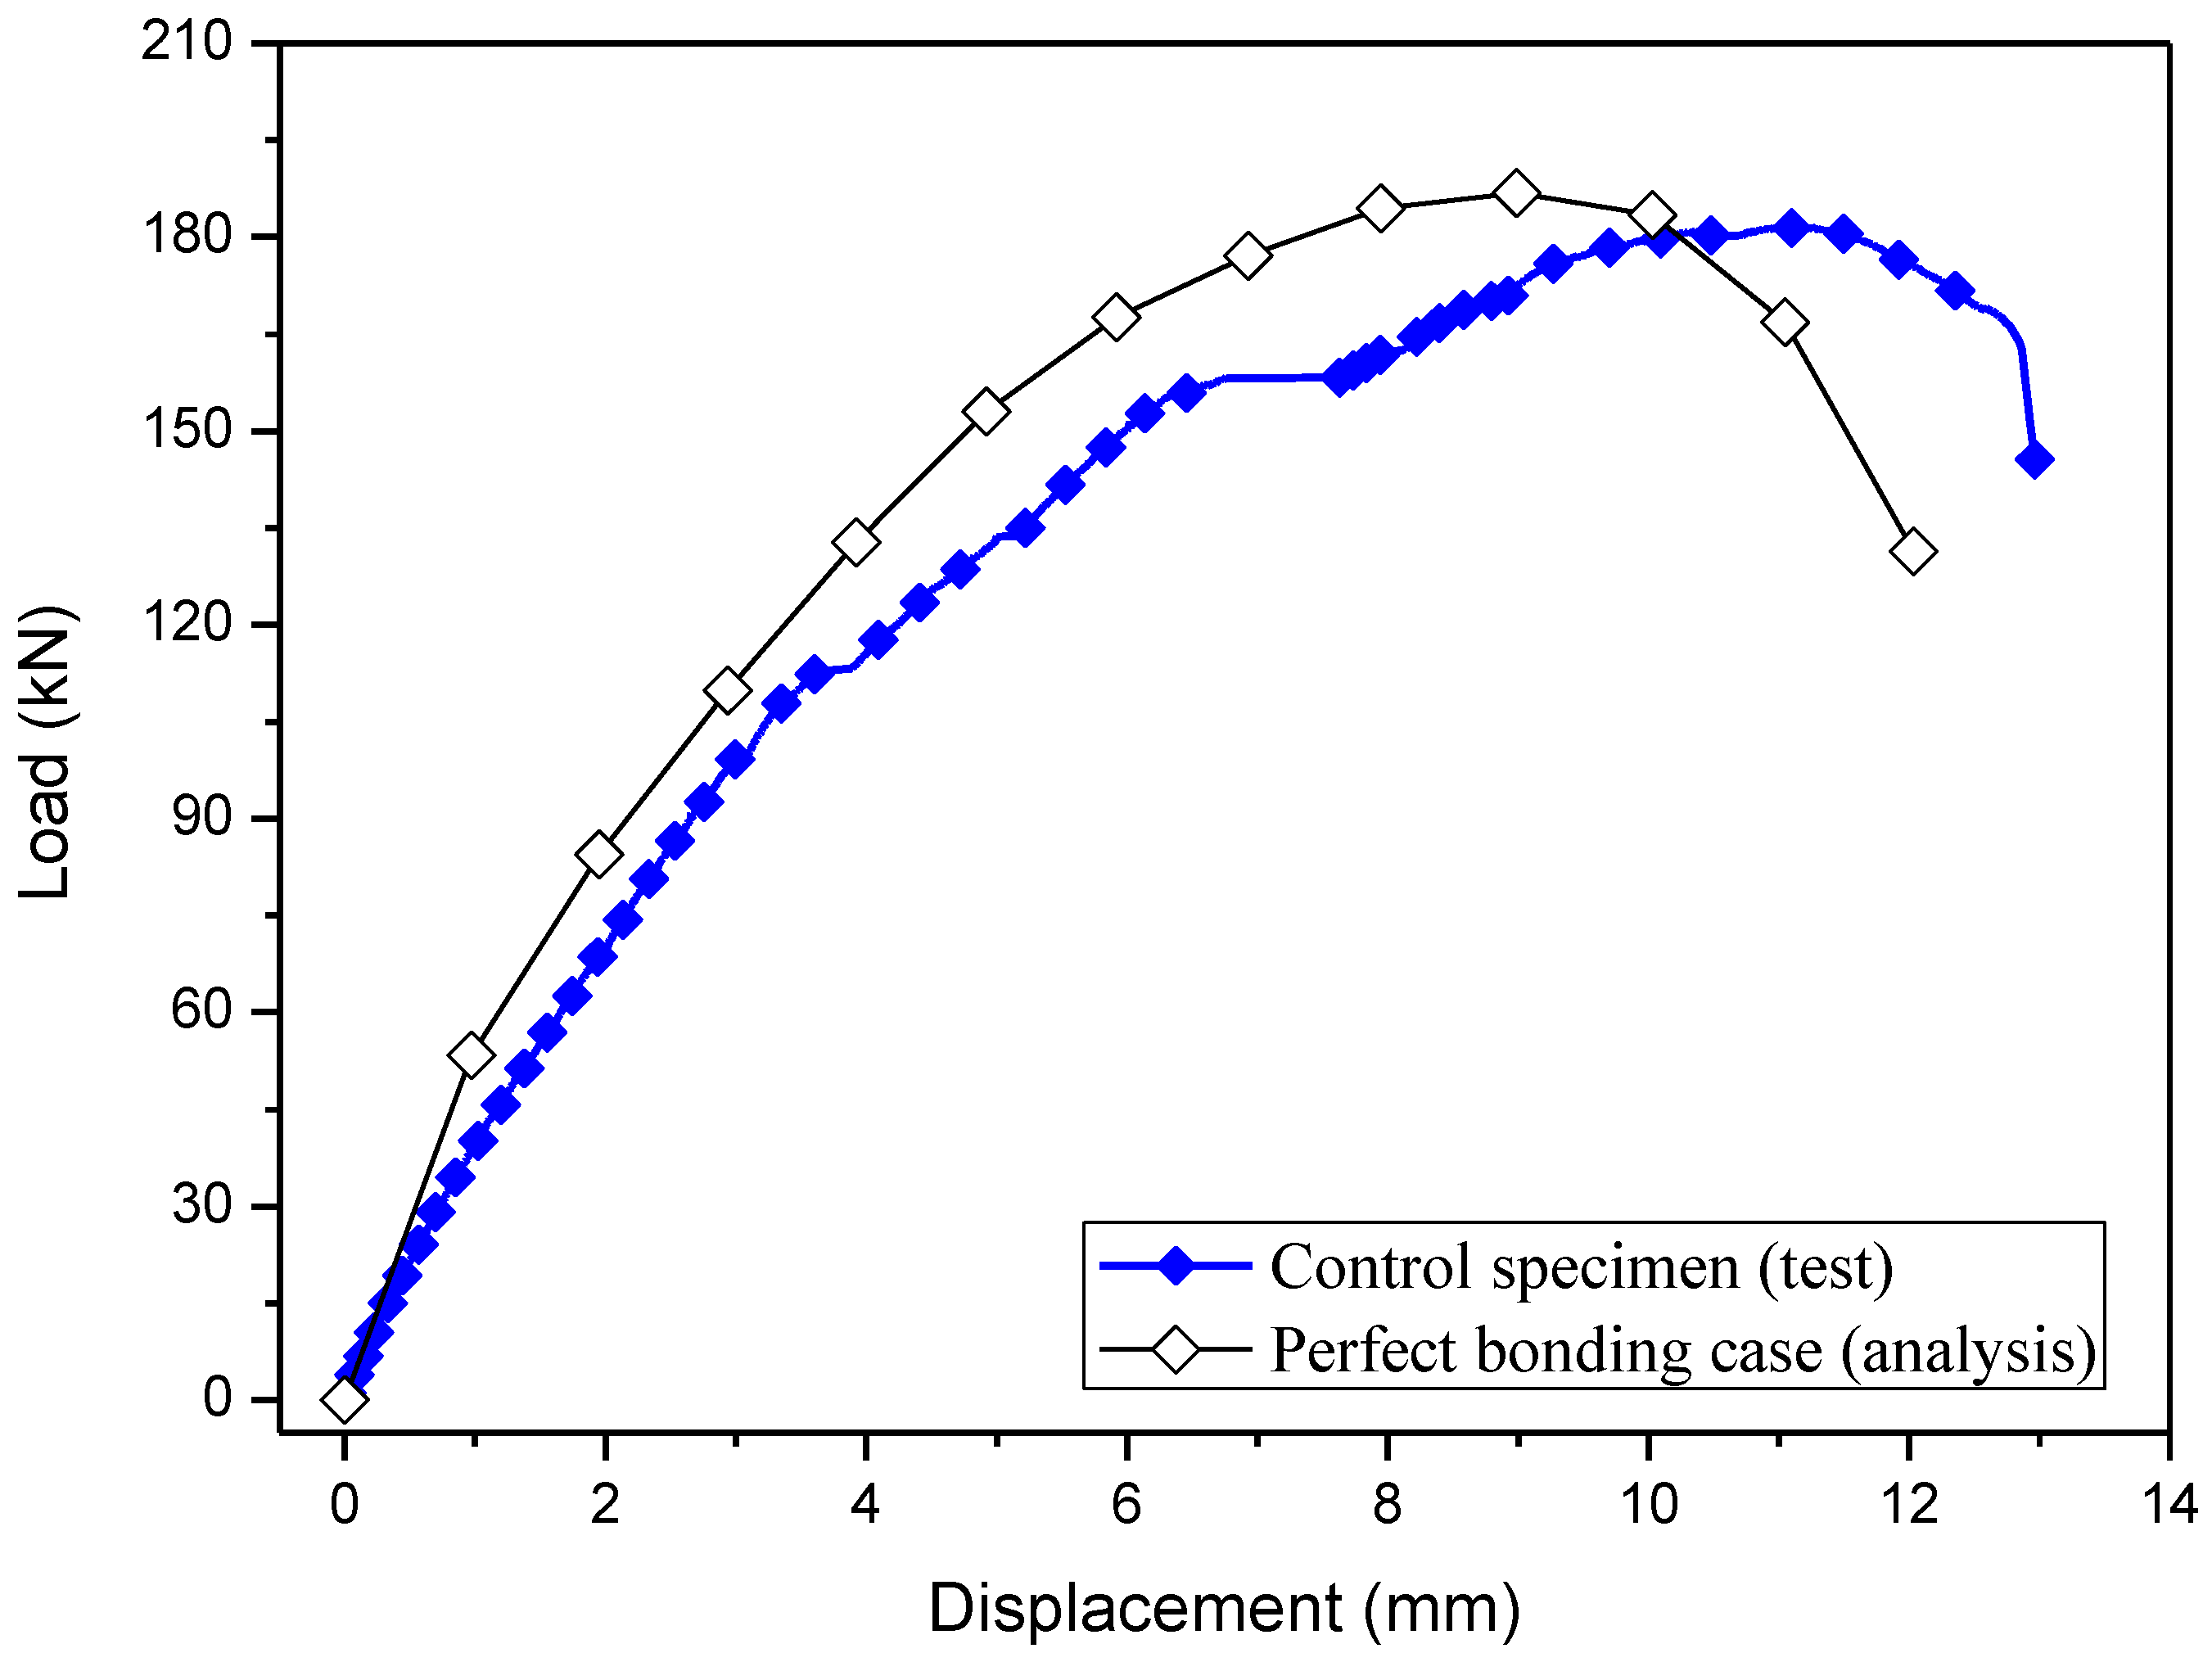
A comparison of the test and analysis results of a flexural beam comparison specimen (uncorroded) revealed that the ultimate load in analysis was approximately 1.07 times greater than that in the test, and the deflections at the ultimate load in test was approximately 0.99 times smaller than that in analysis. On the contrary, a comparison of the test and analysis results on a shear beam comparison specimen revealed that the ultimate load in analysis was approximately 1.03 times greater than that in the test, and the deflections at the ultimate load in analysis was approximately 1.06 times greater than that in test. FEA using VecTor2 yielded behaviors similar to the test results, and the method used in this study to determine the impact of the reinforcement corrosion-induced decrease in bonding performance of shear beam on the structural performance degradation based on strength-deformation capacity can be considered an efficient way to determine the correlation between bonding factor (β) and performance degradation factor (ϕ).
(2)
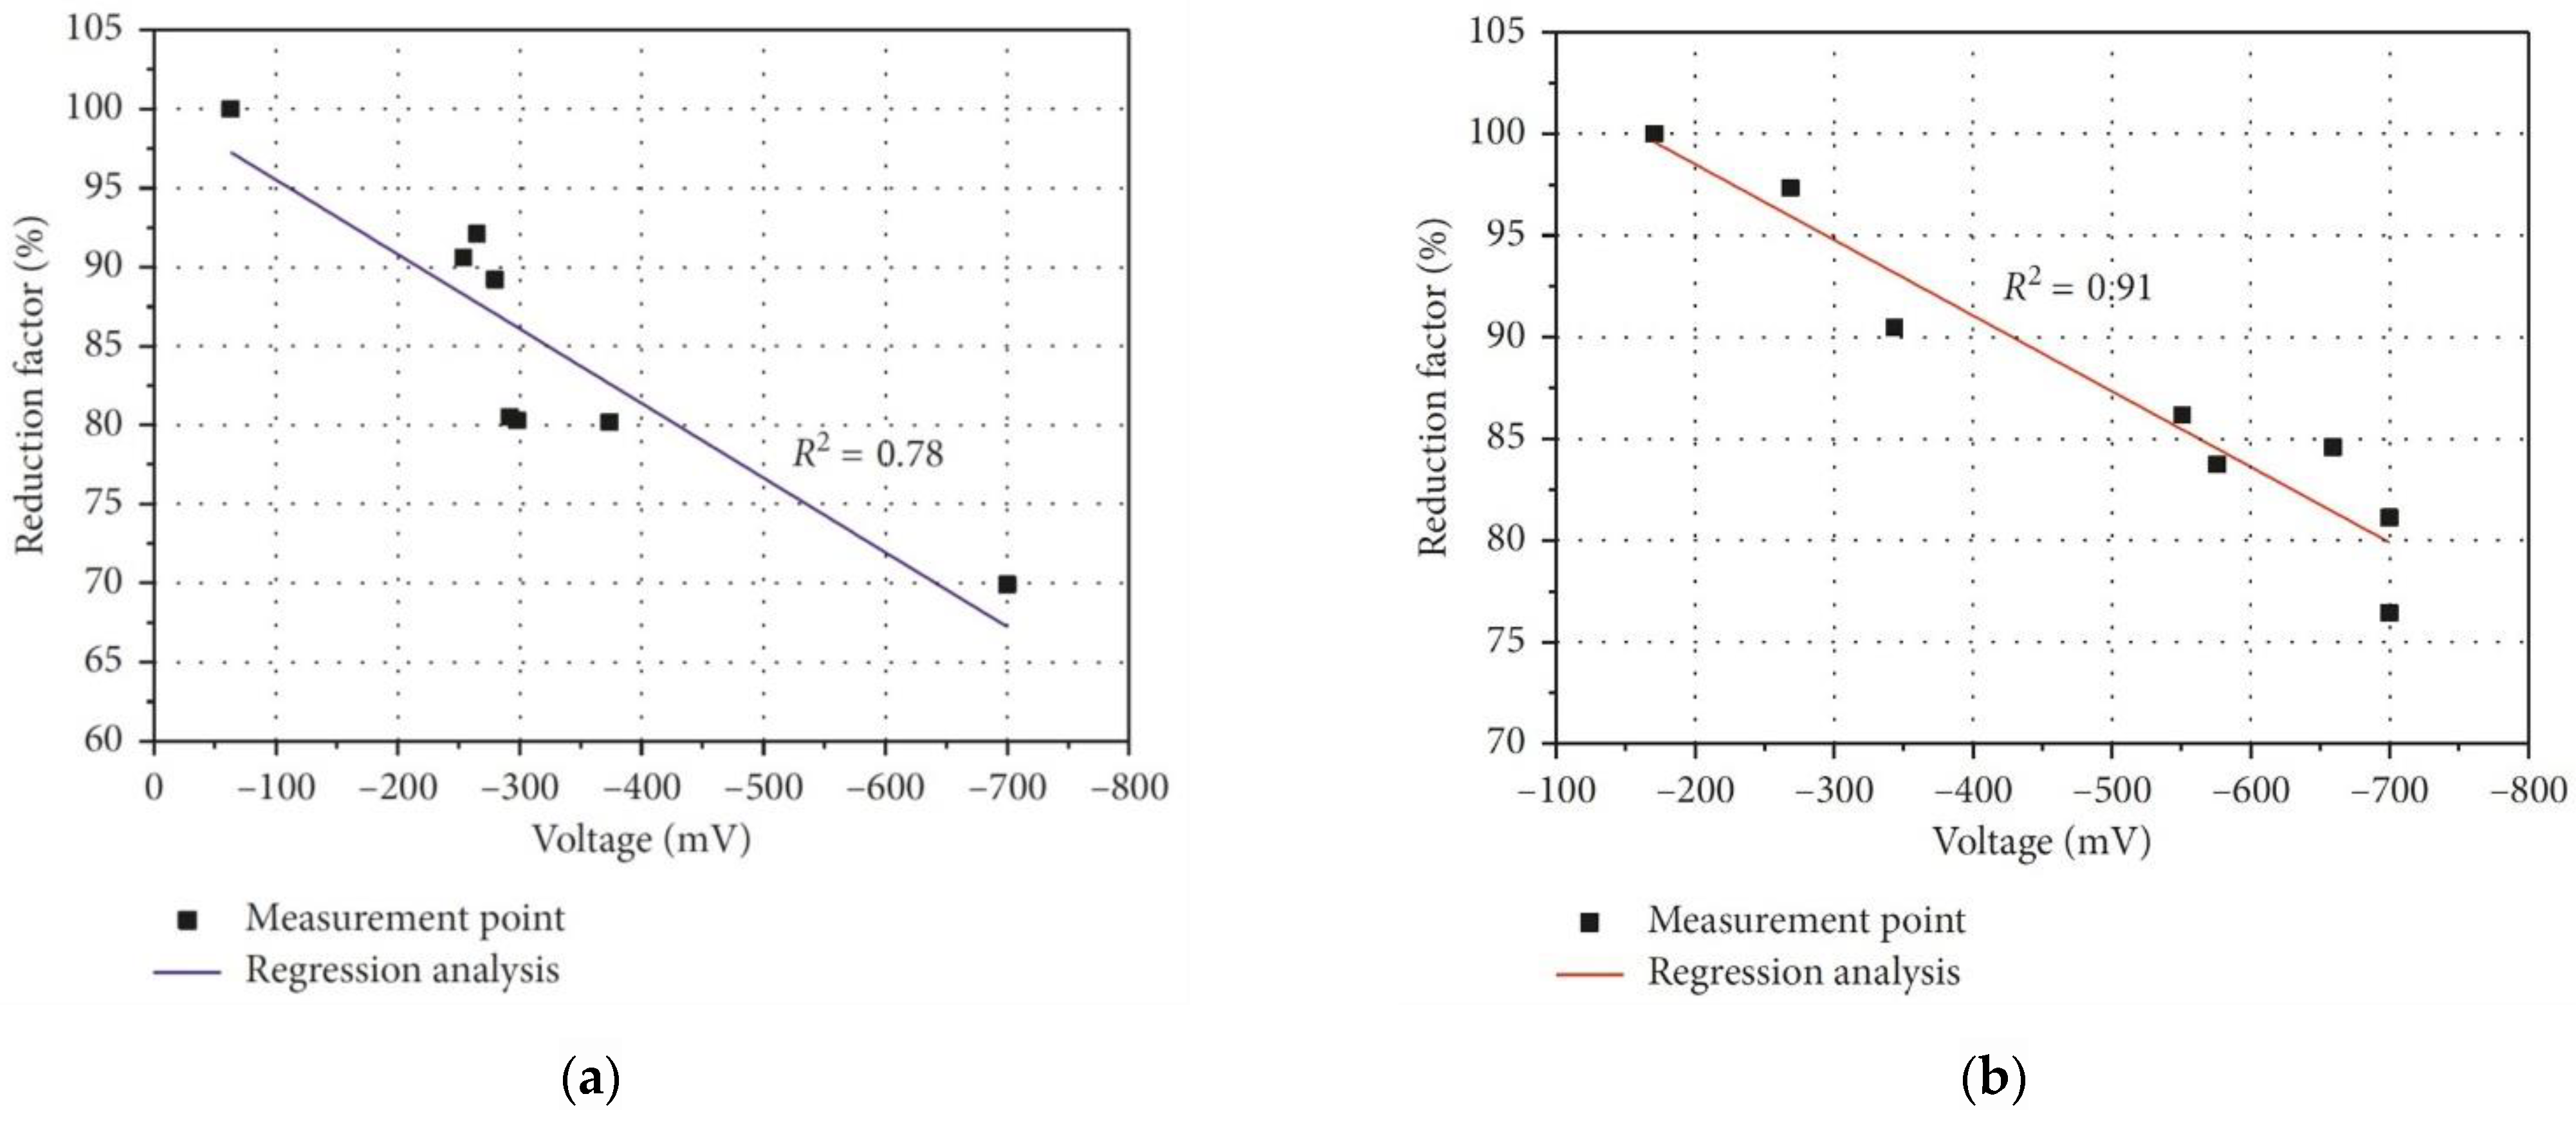
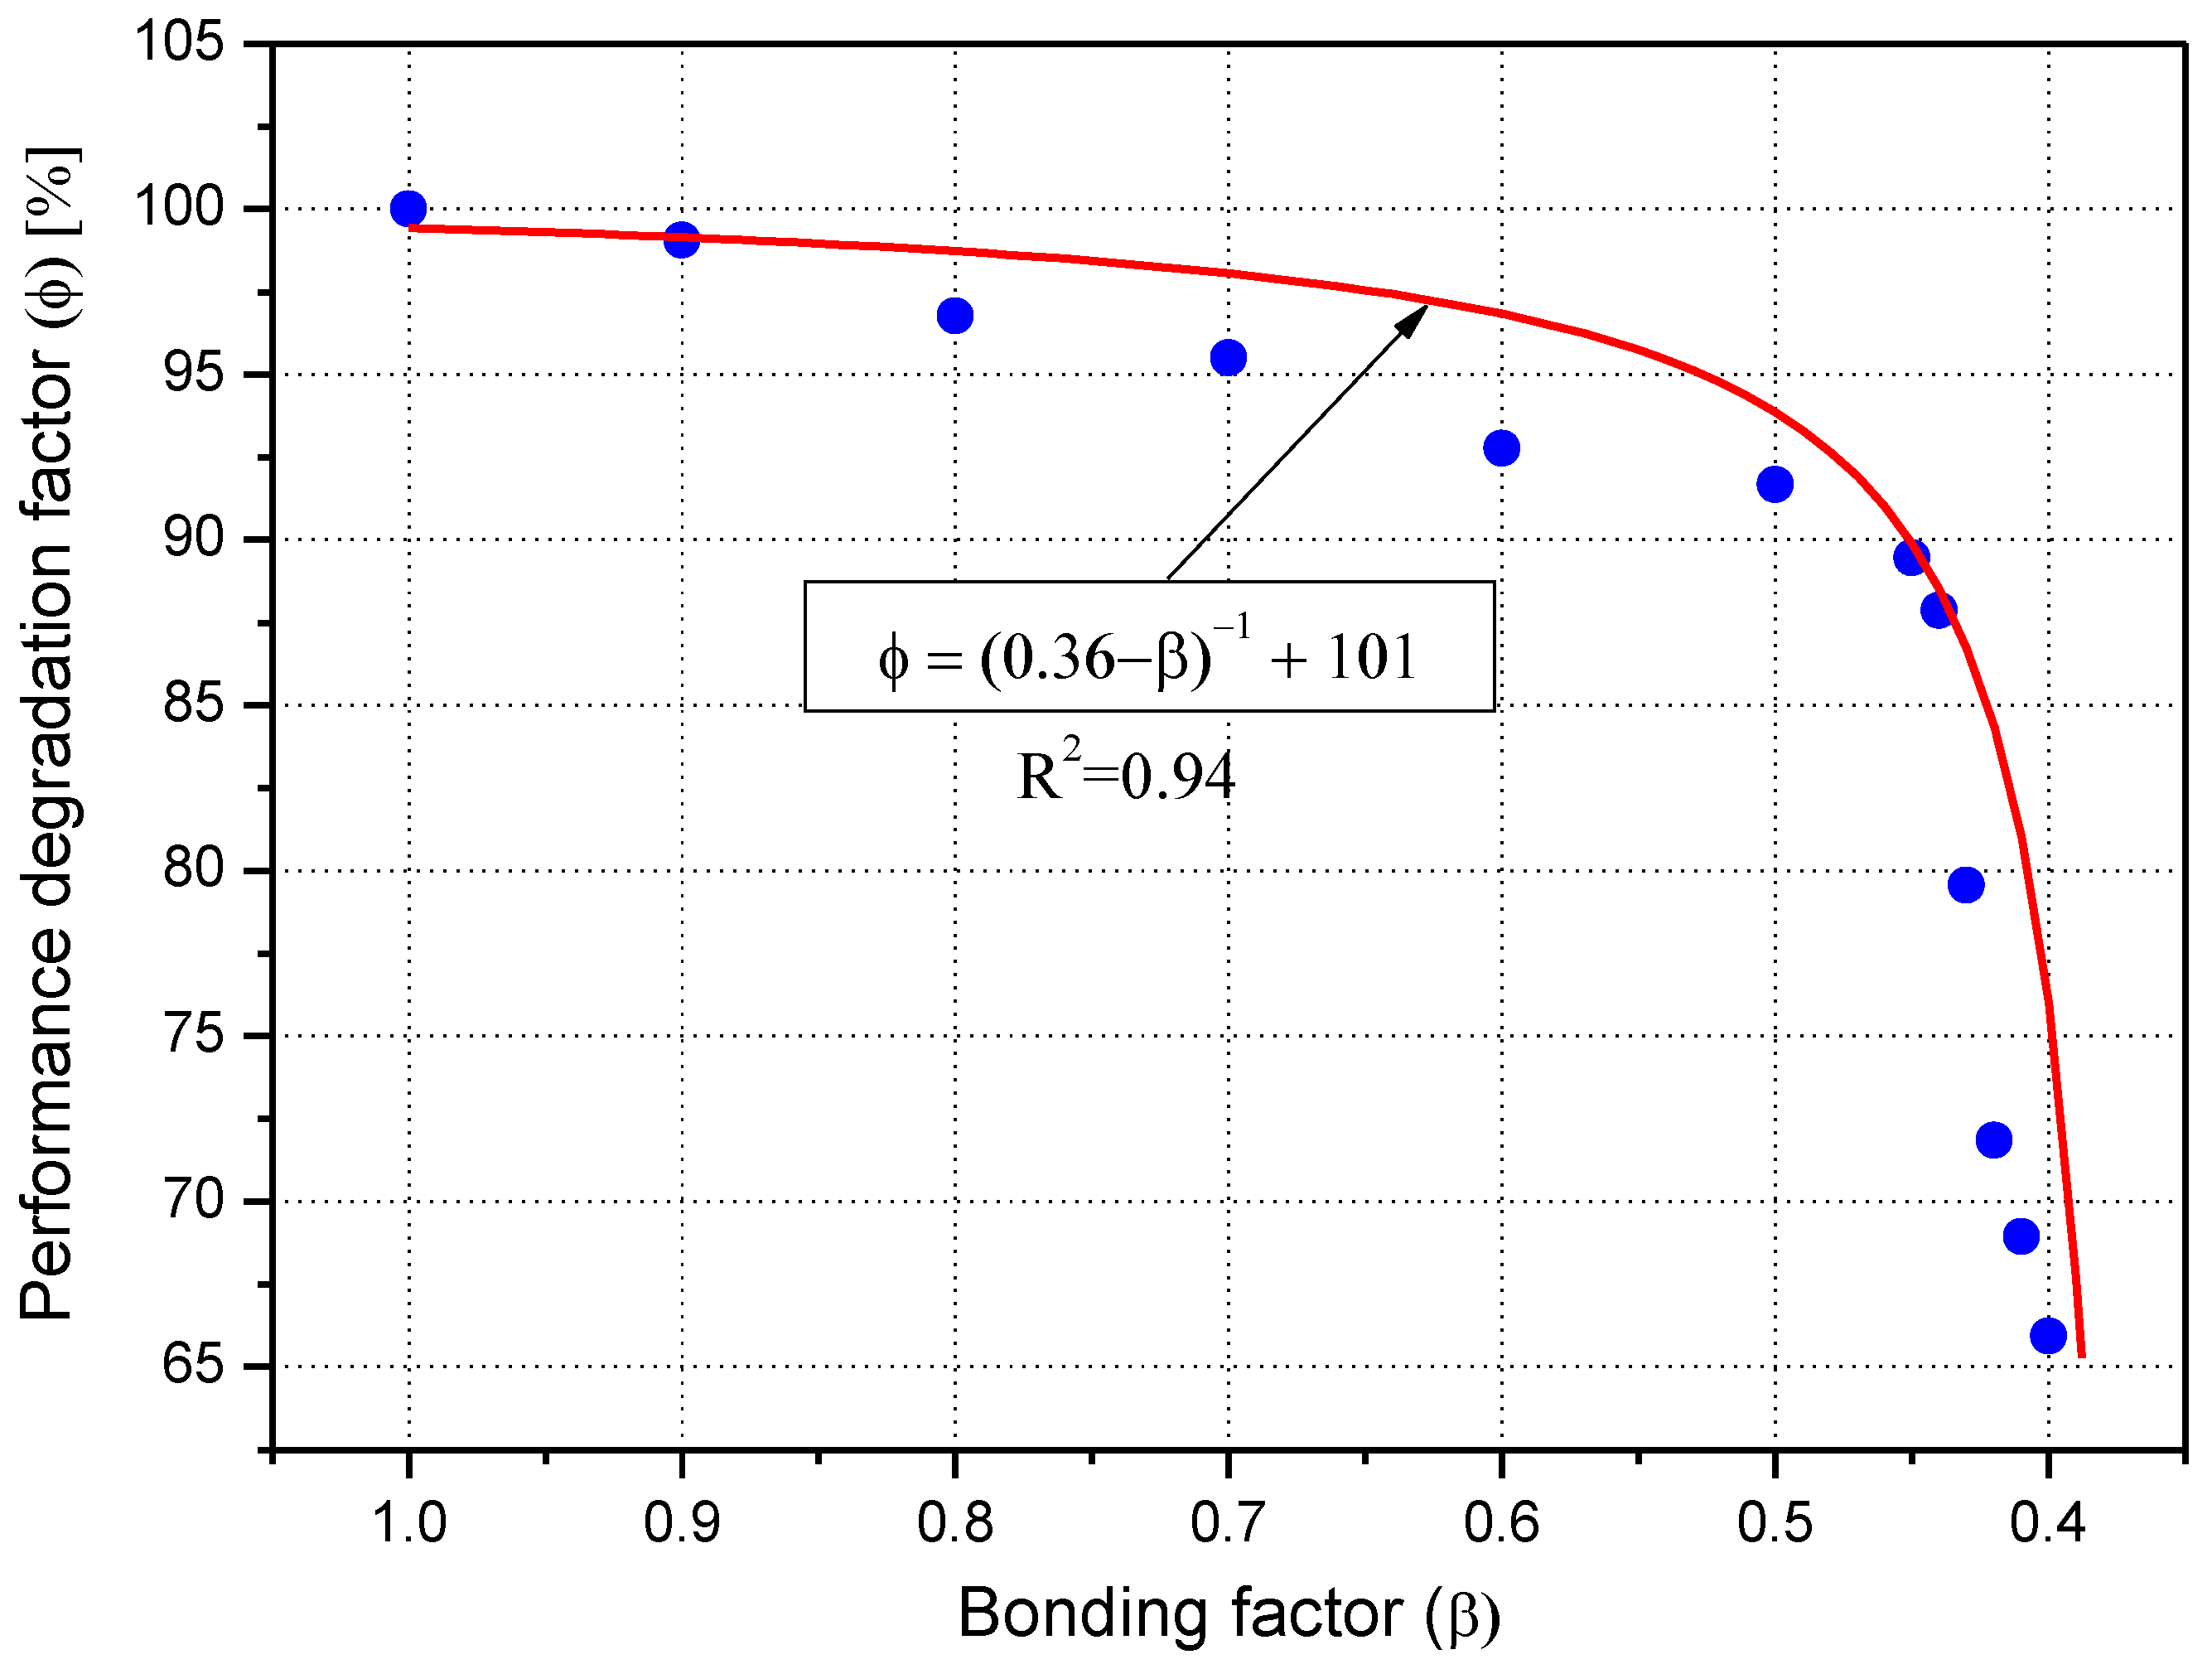
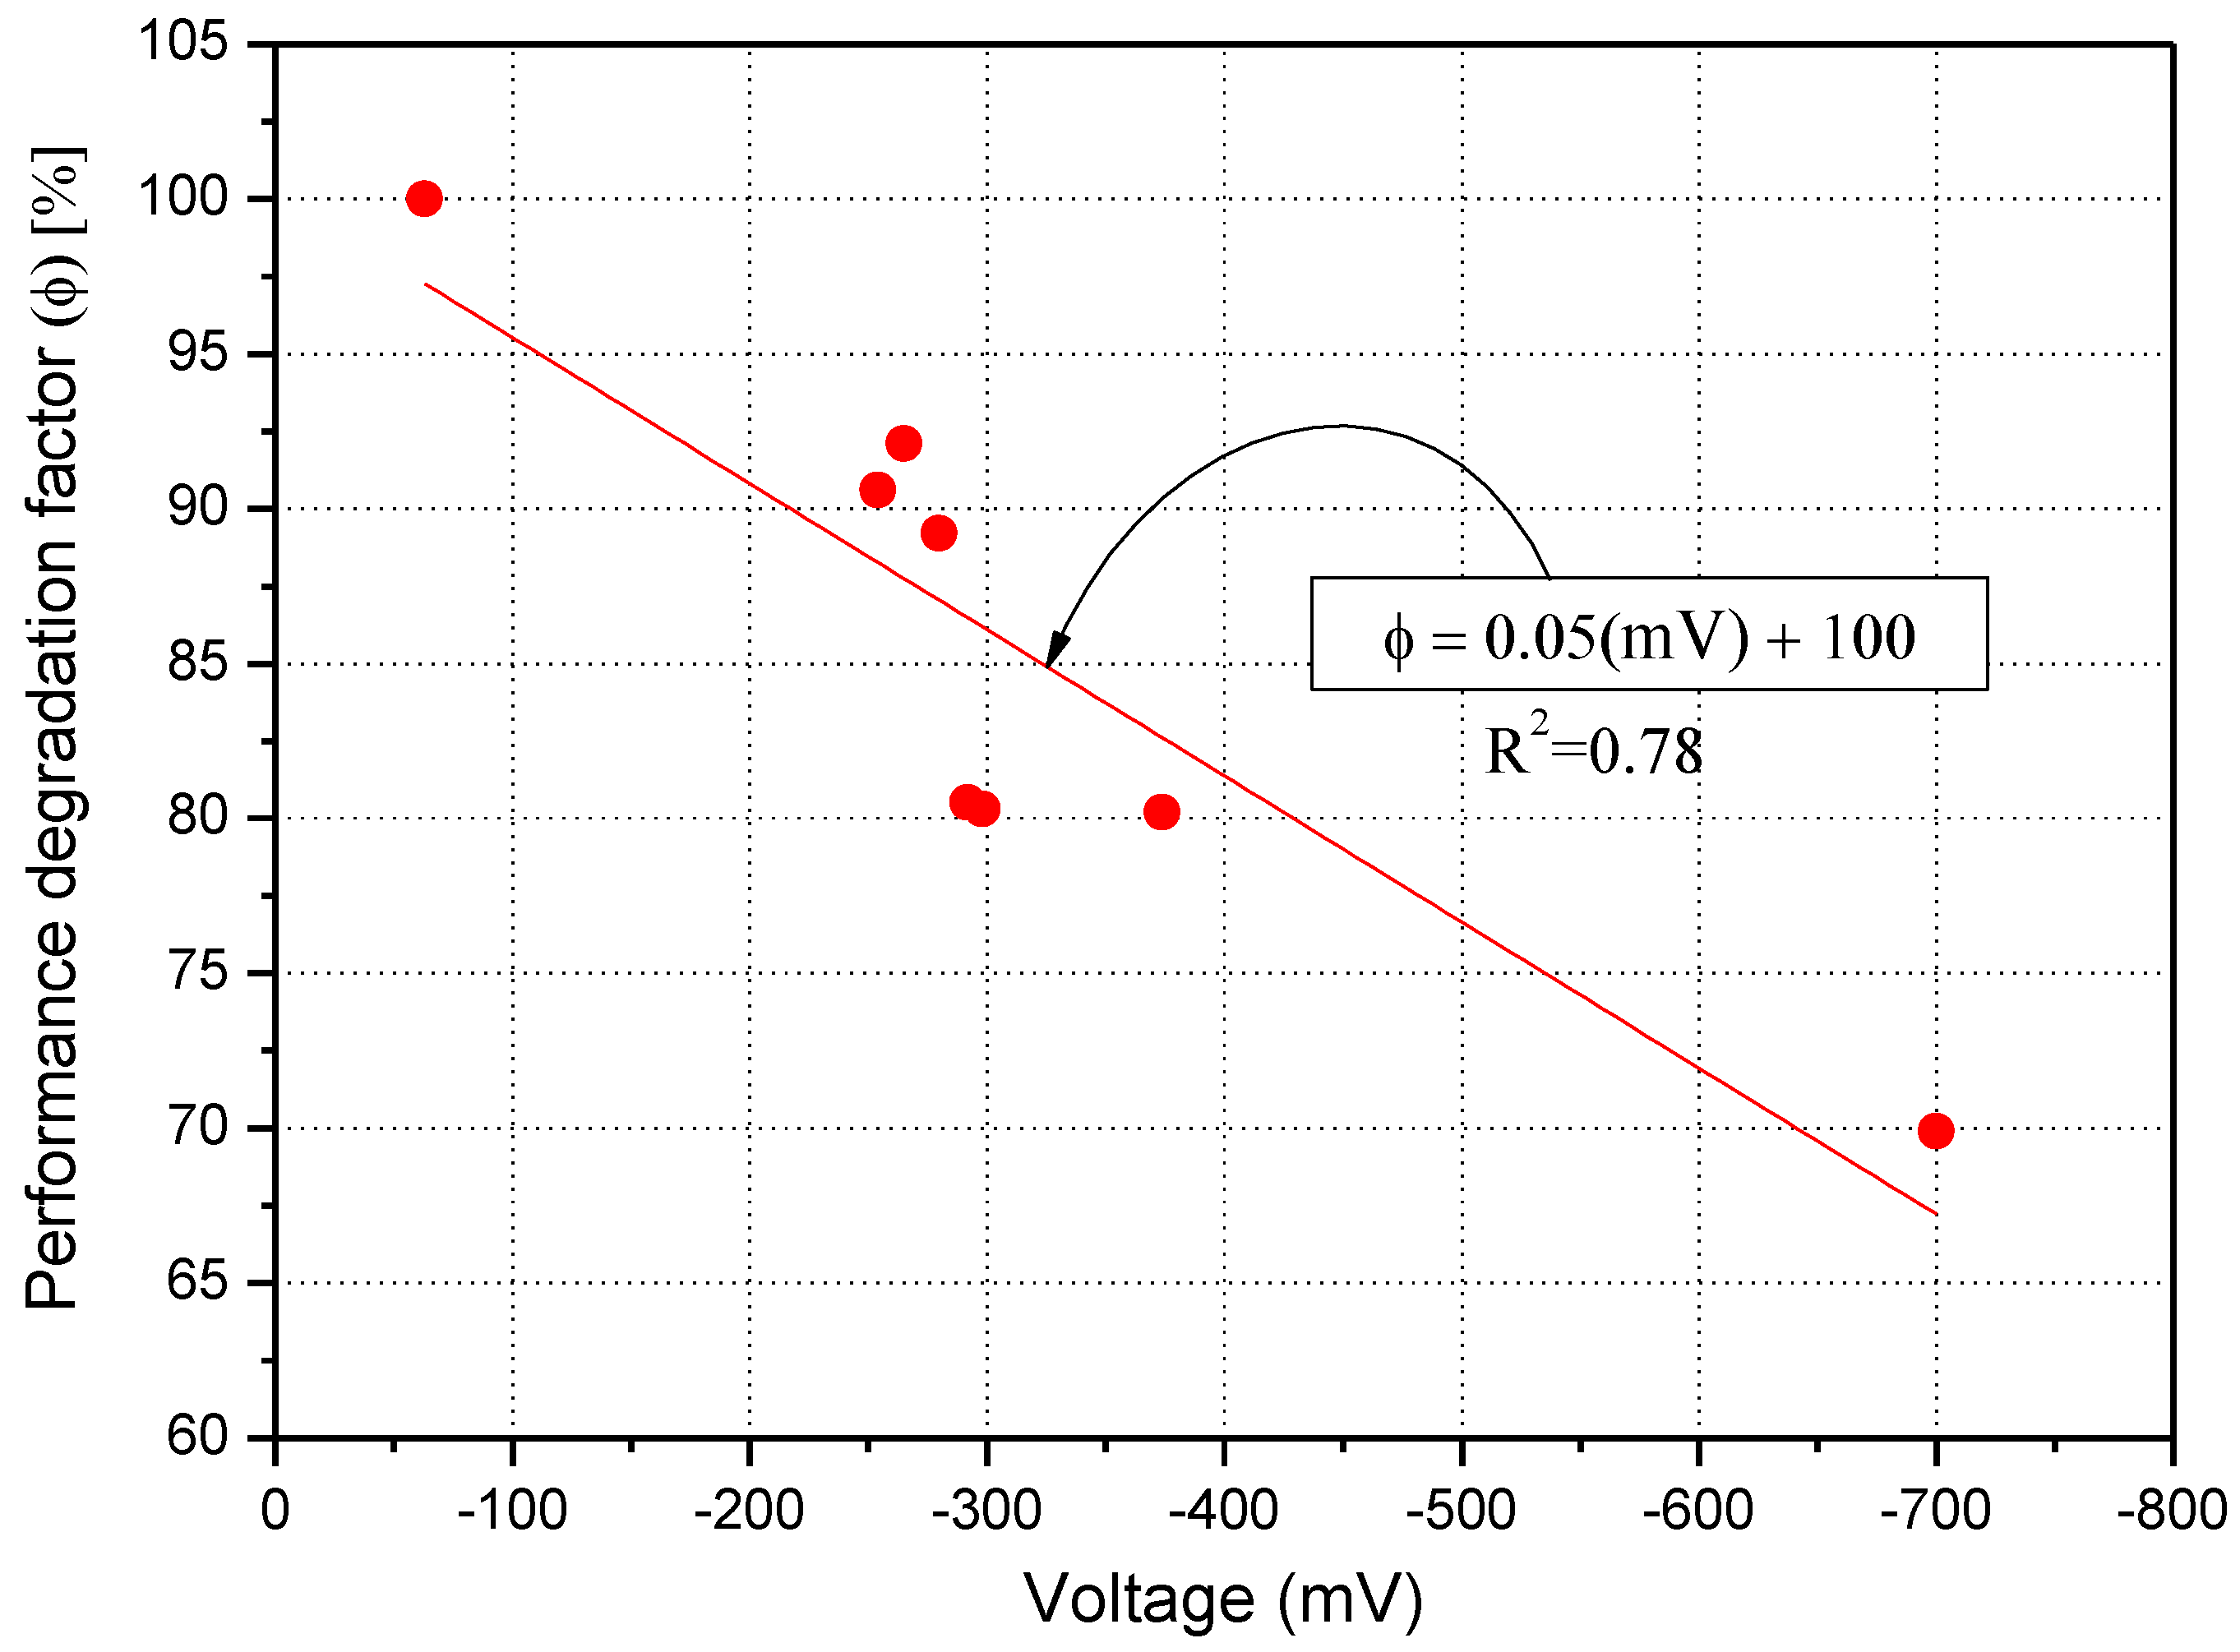
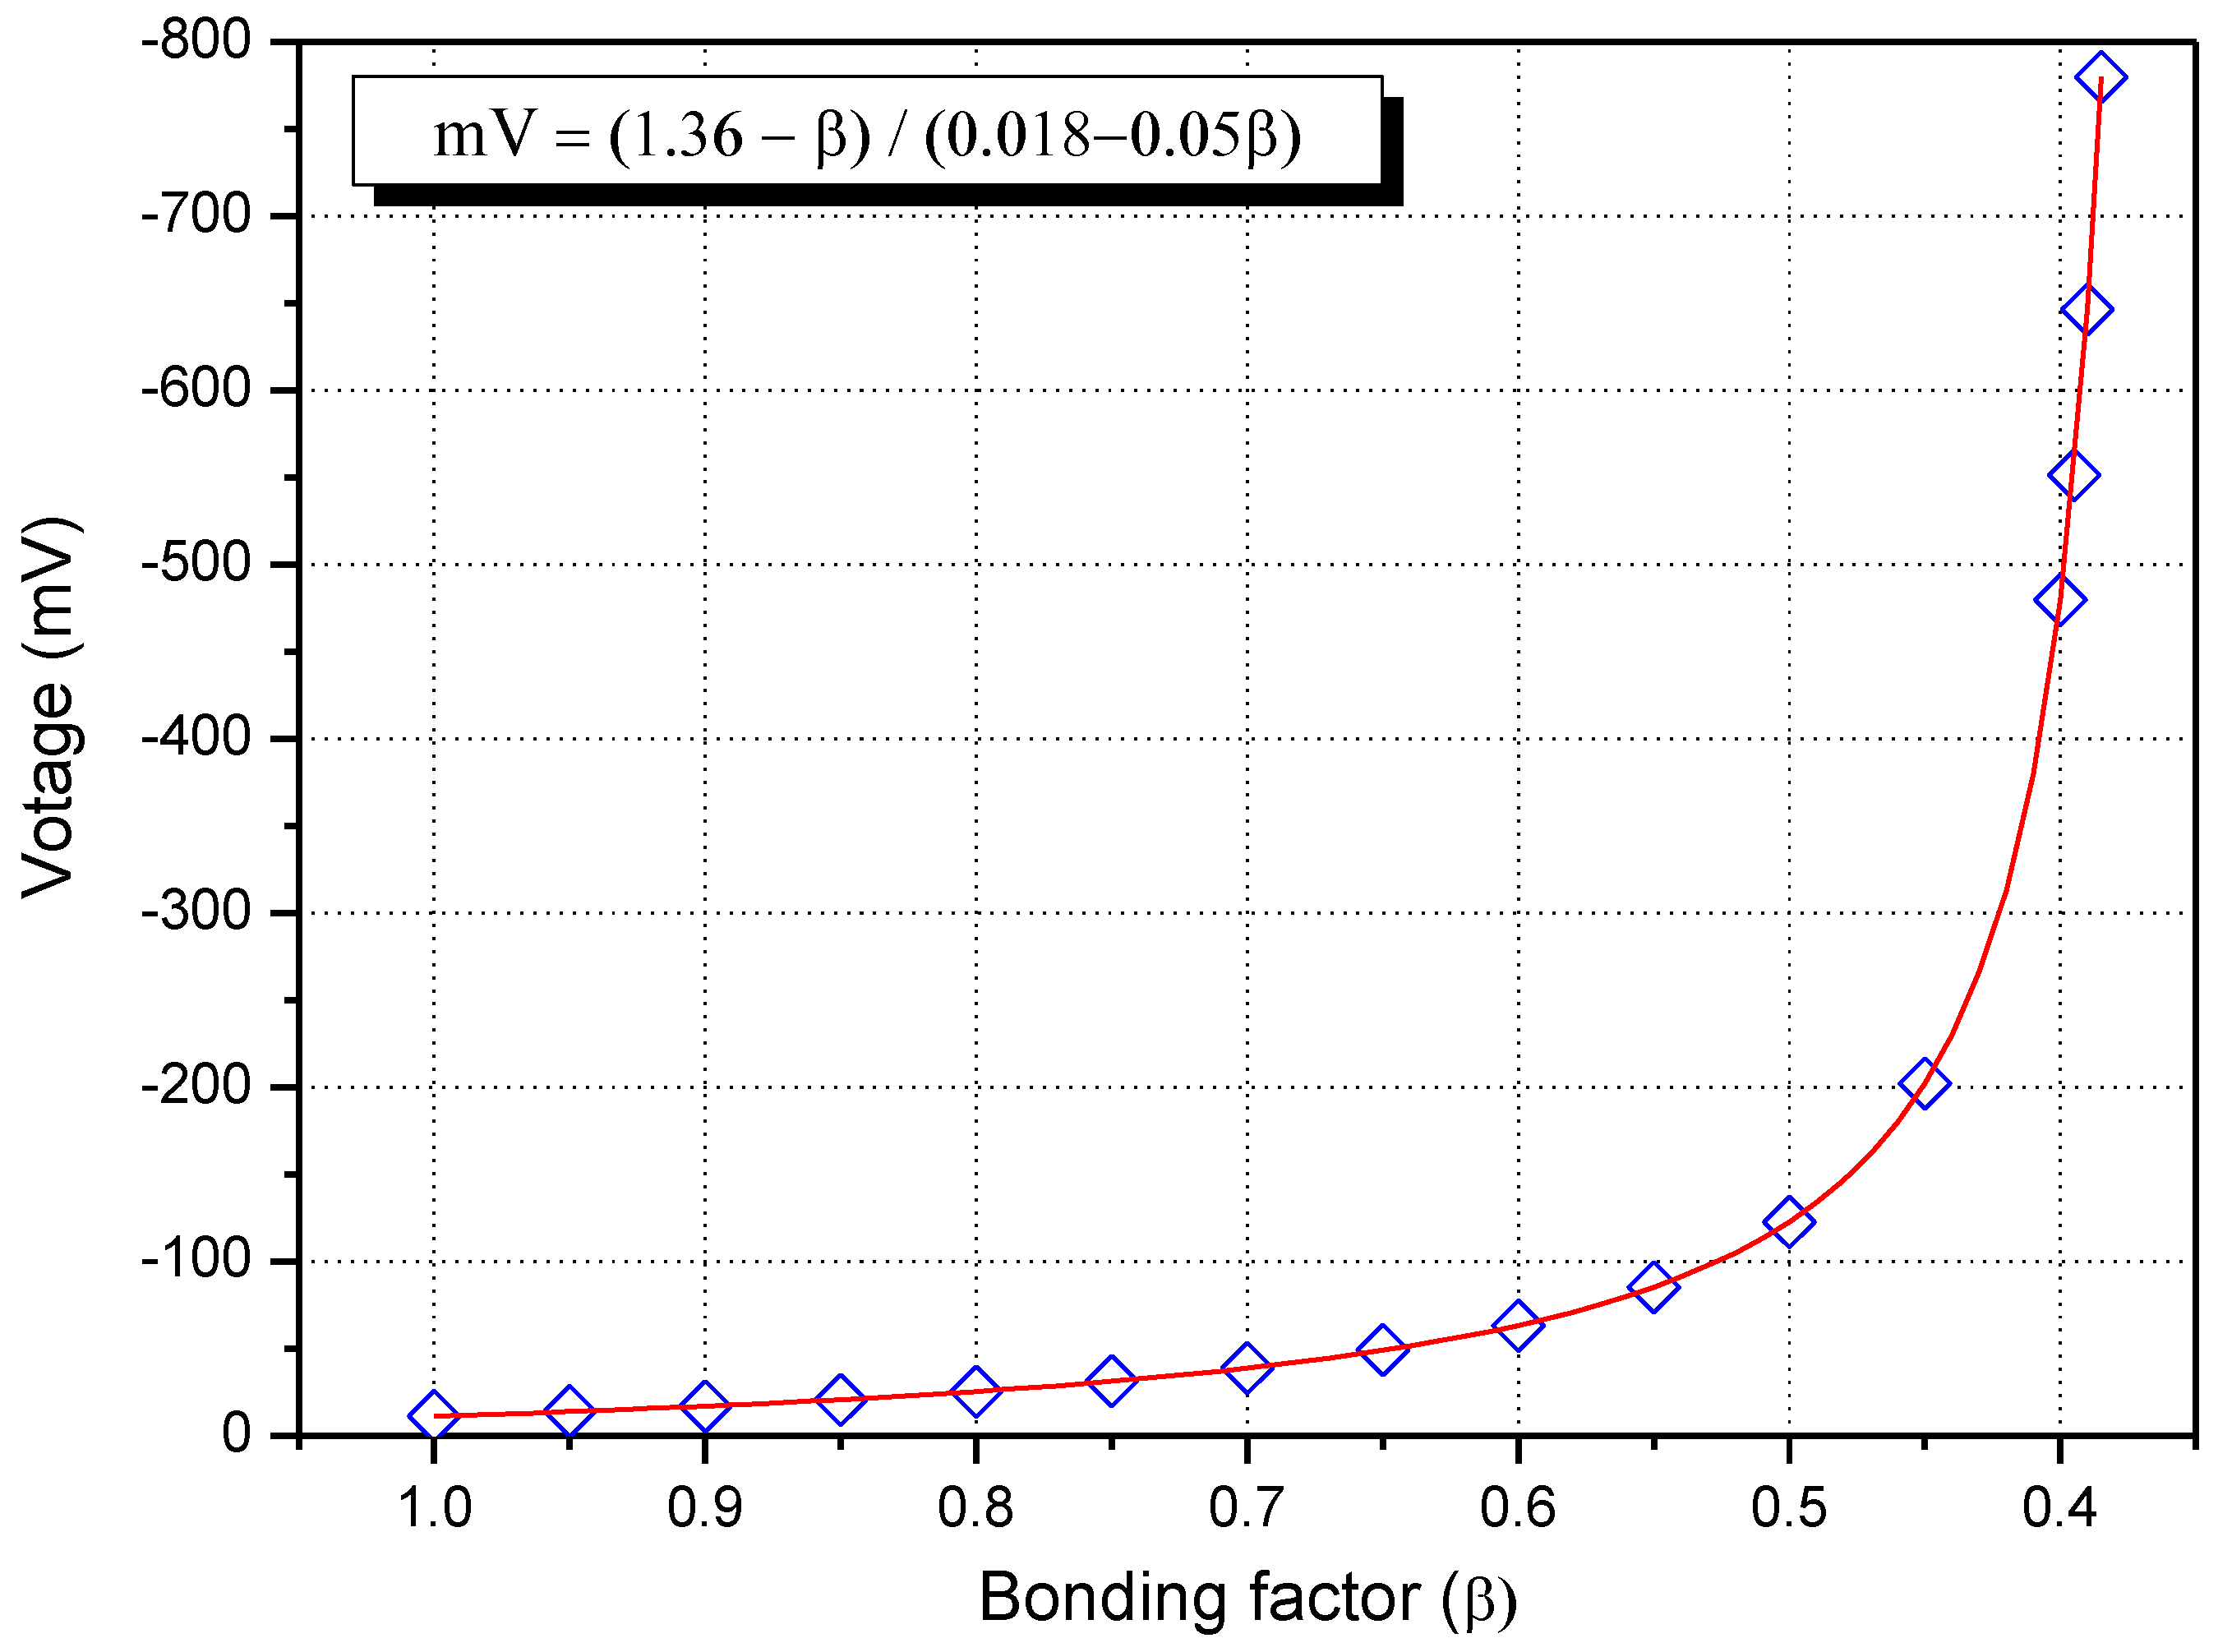
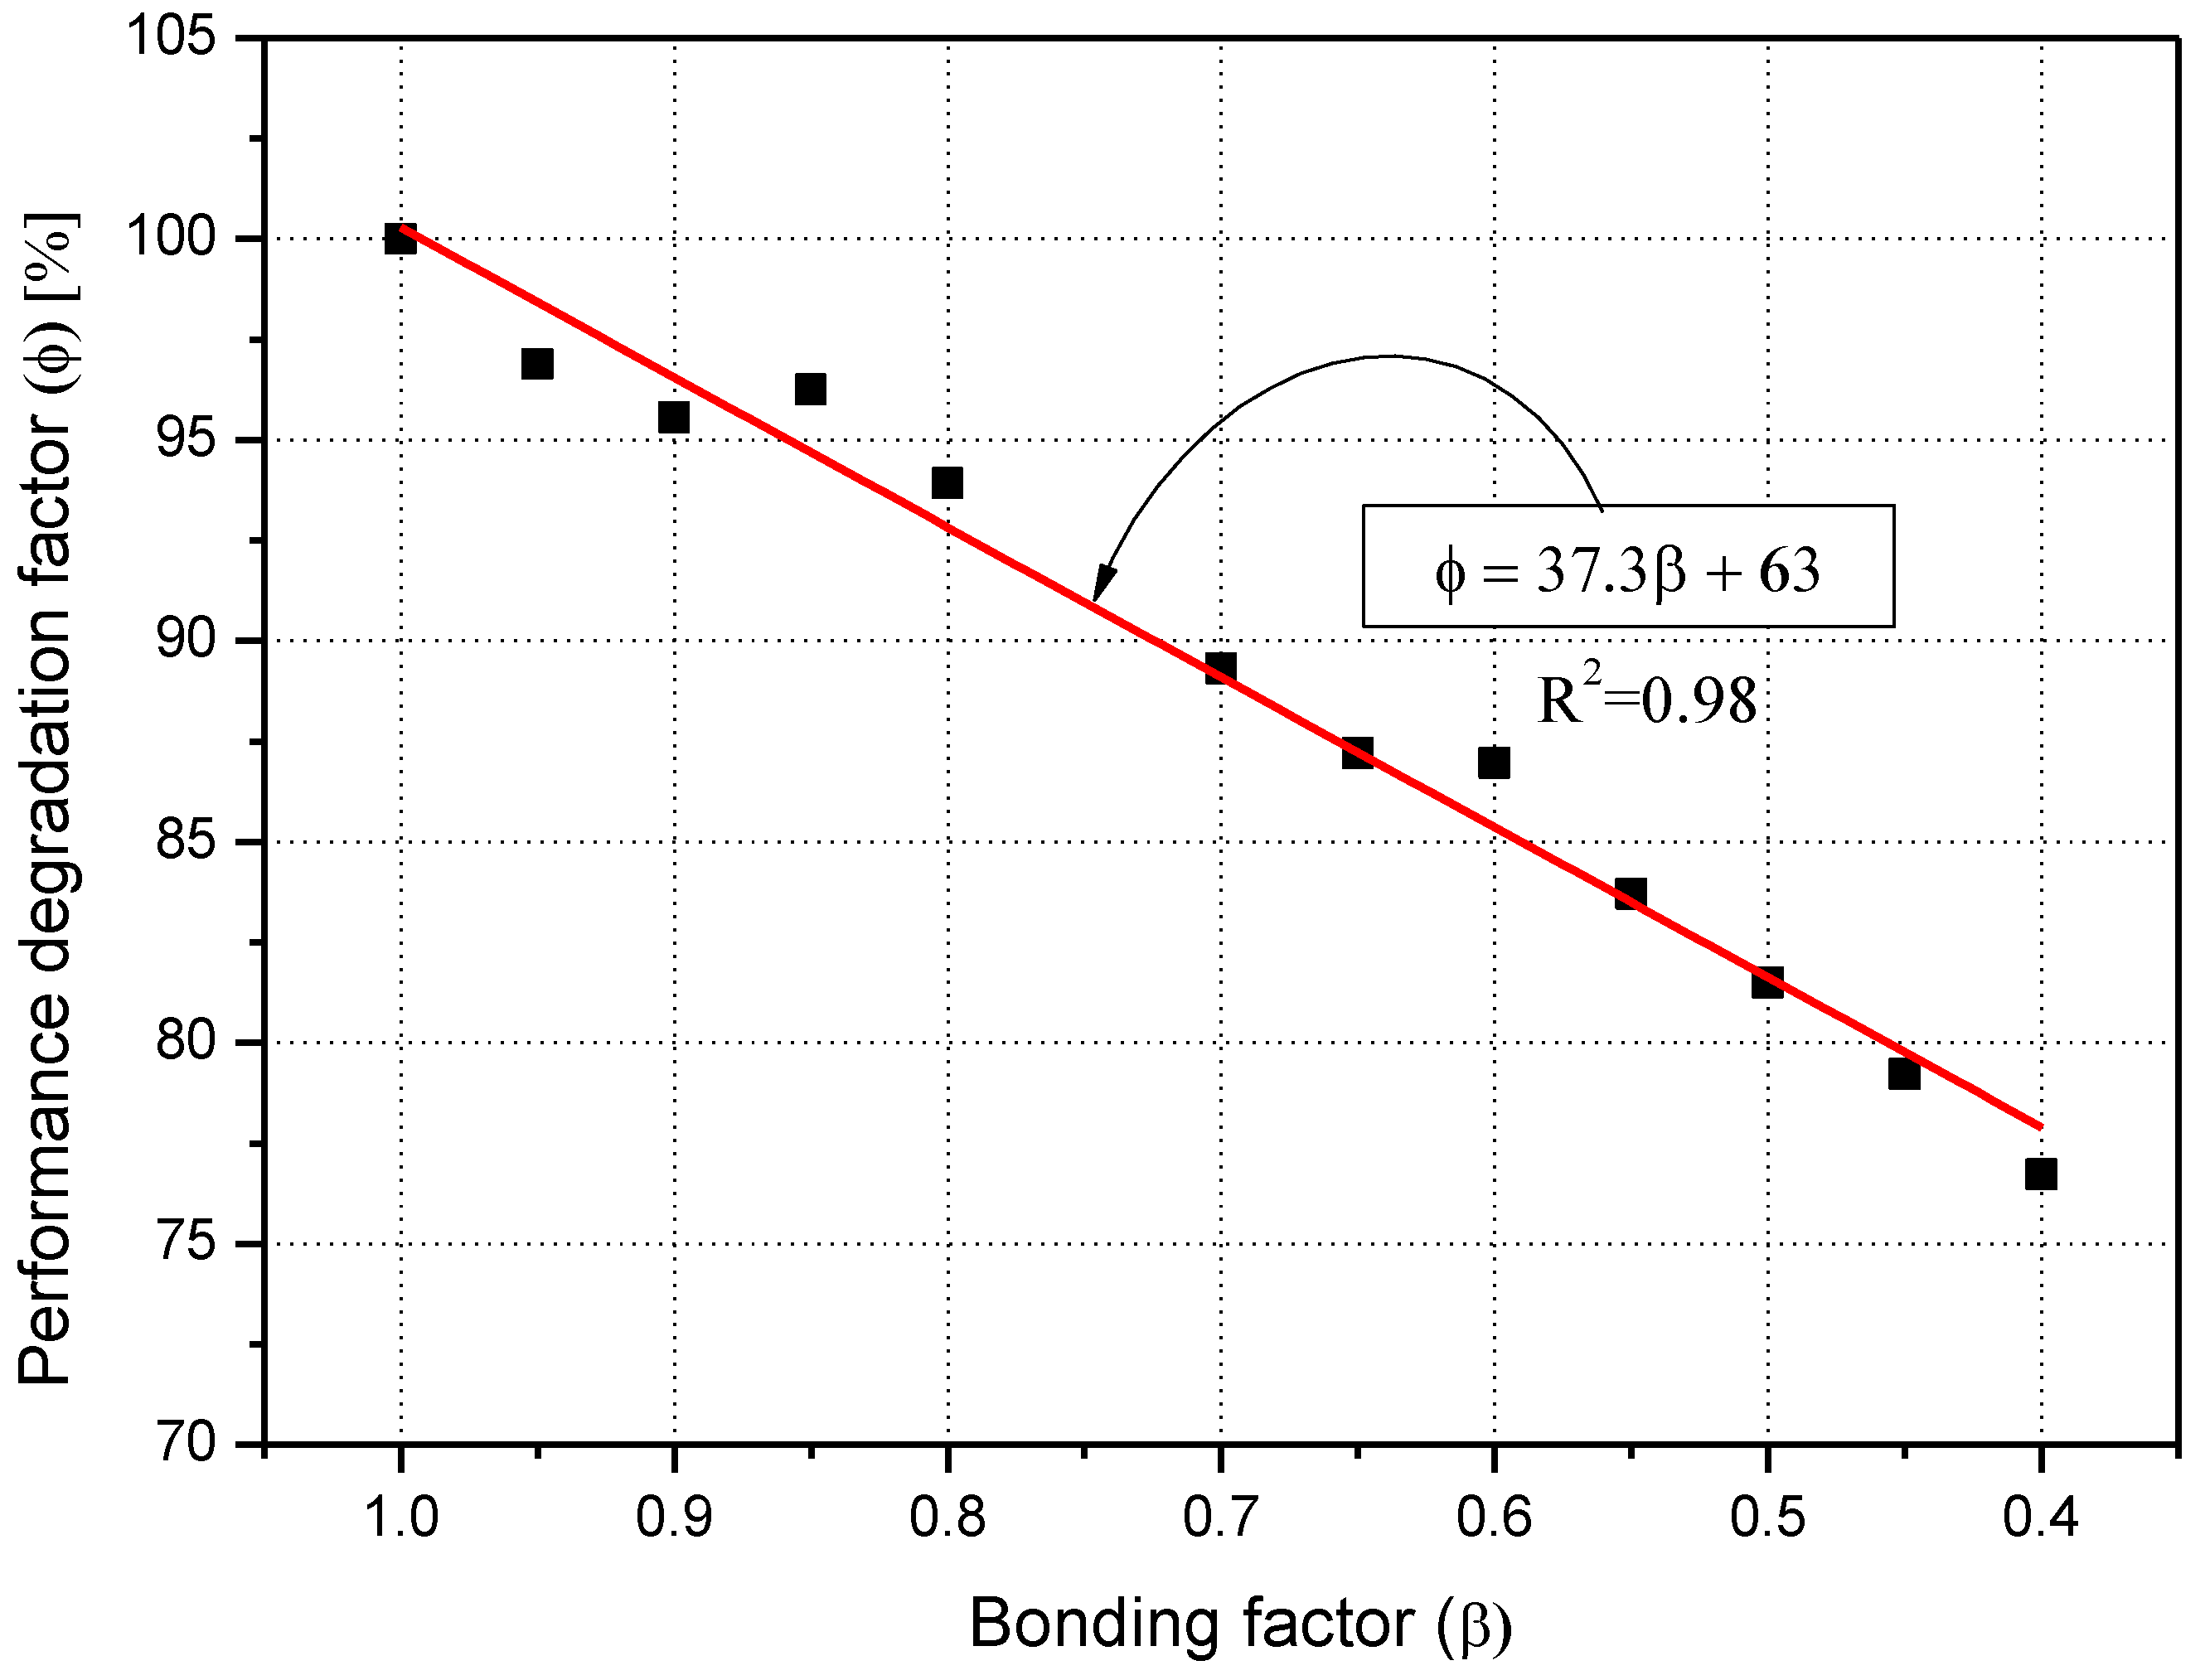
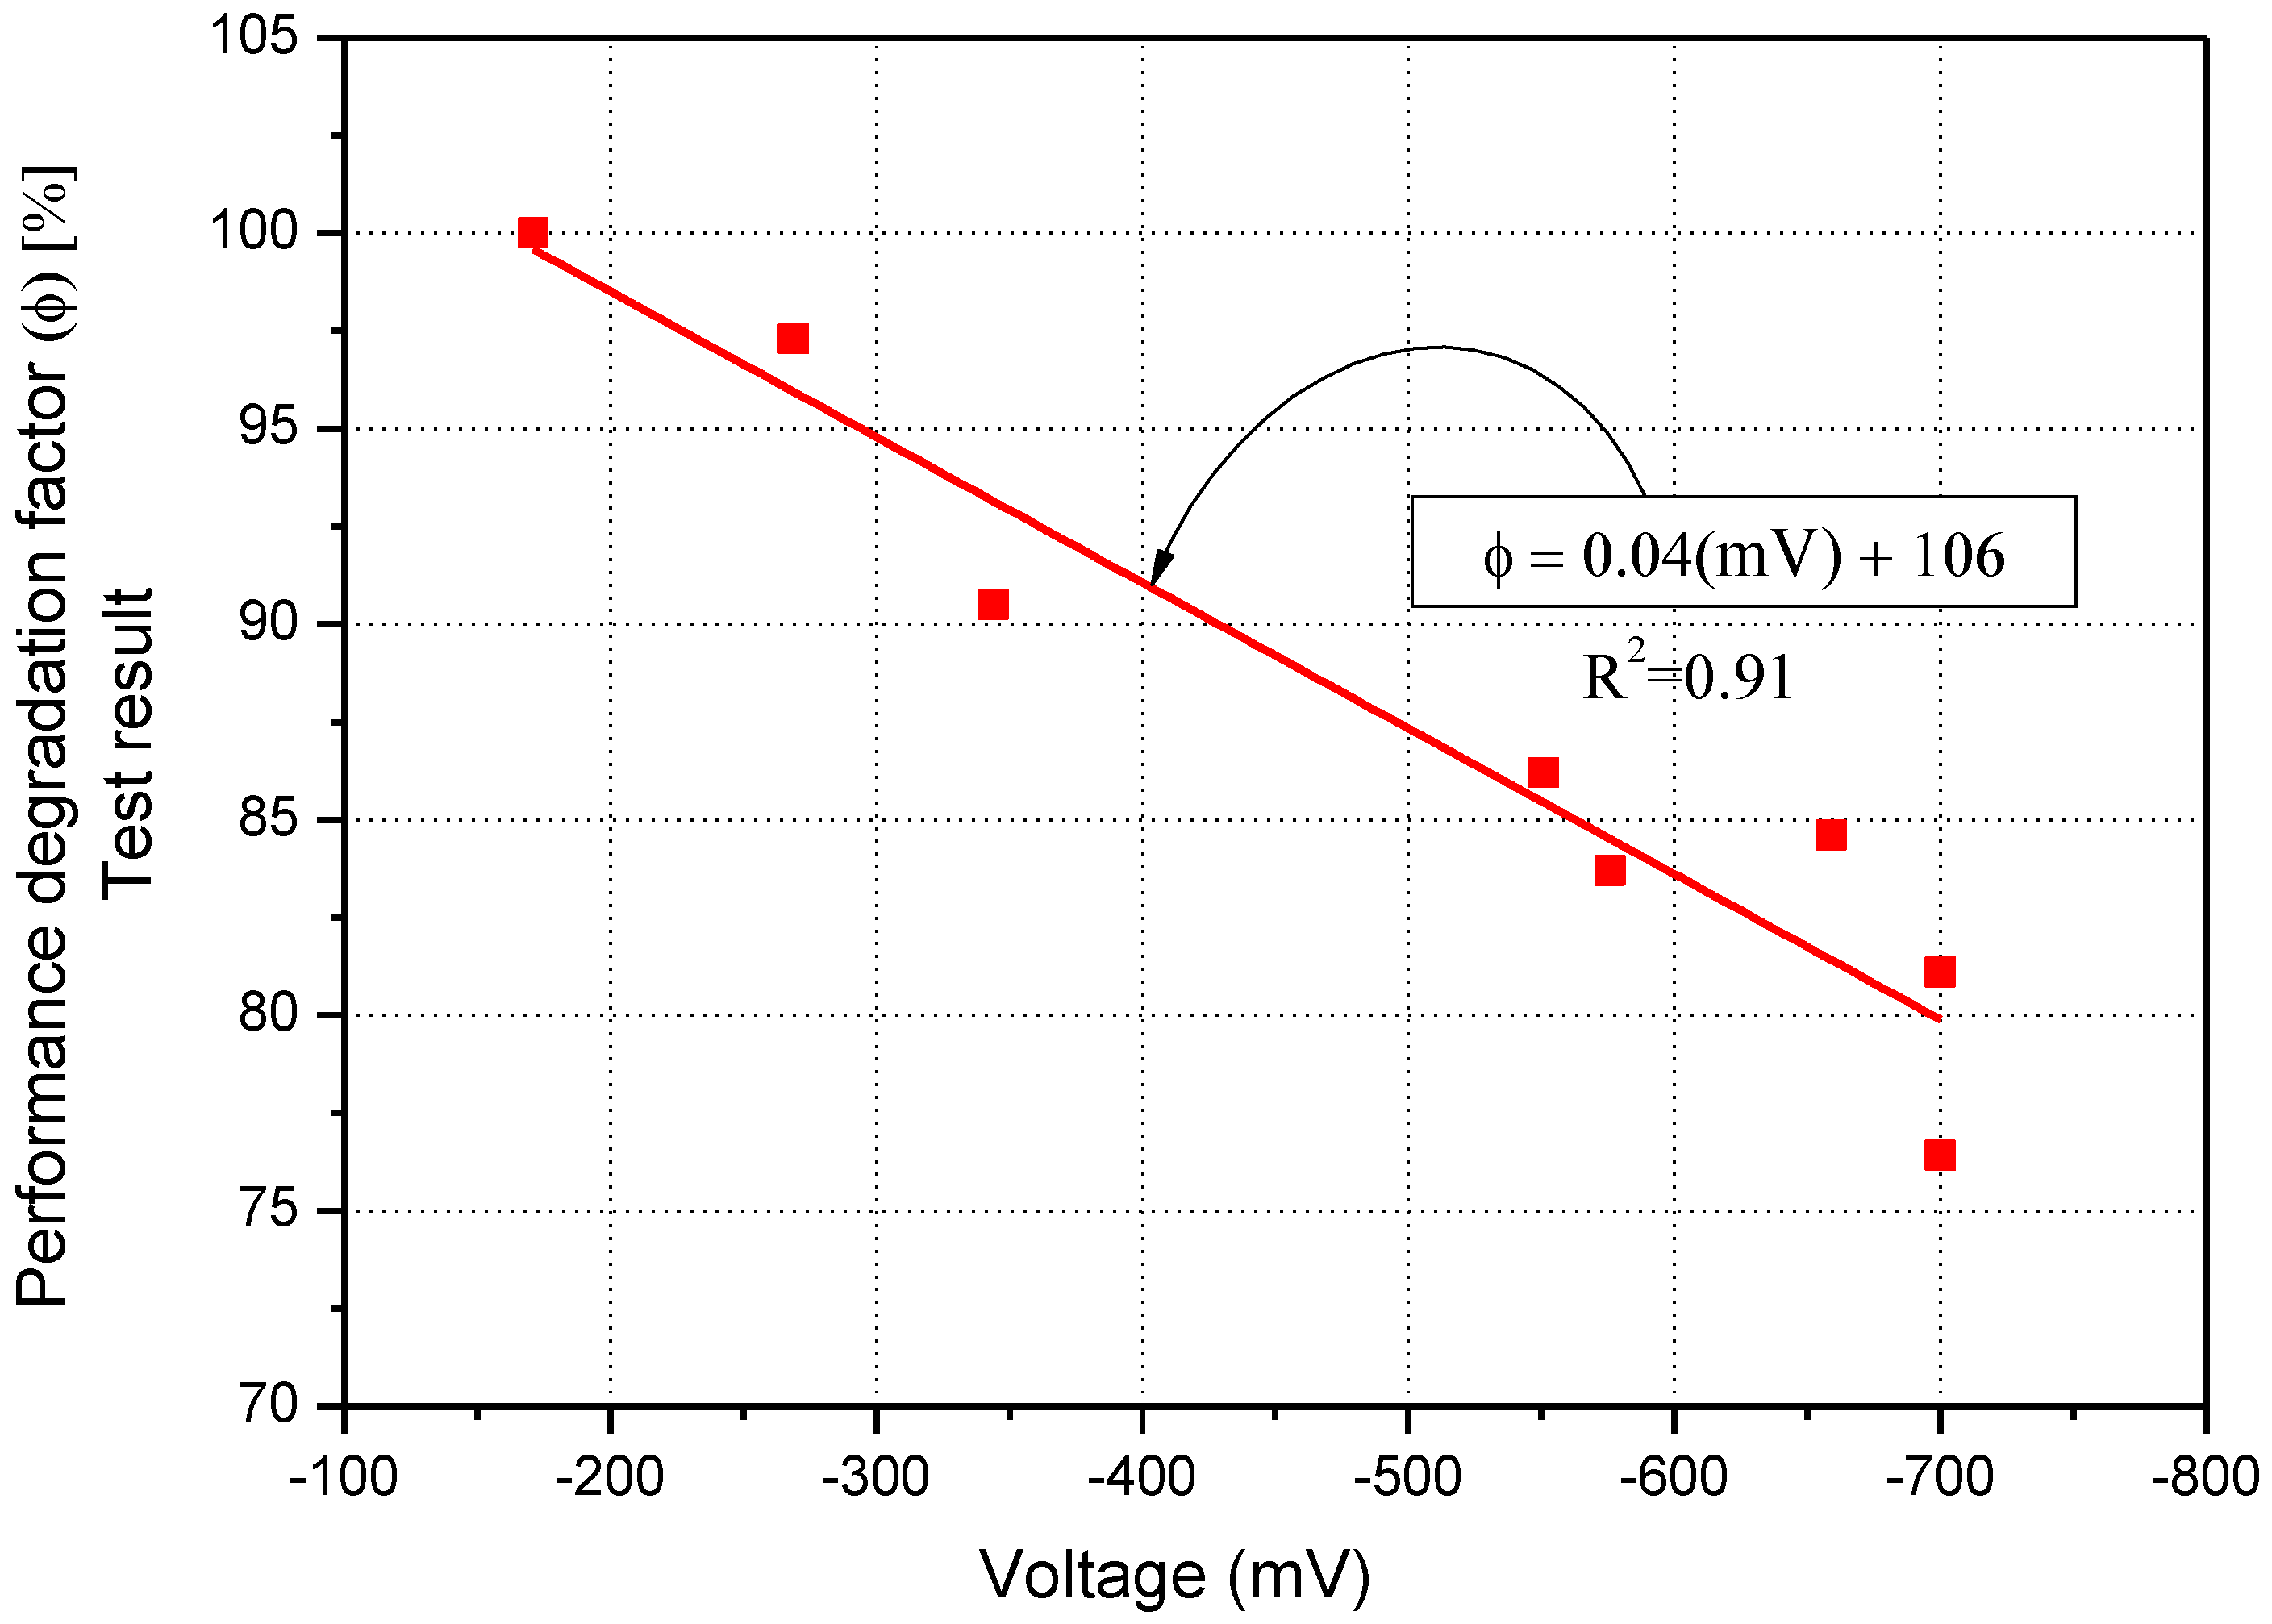
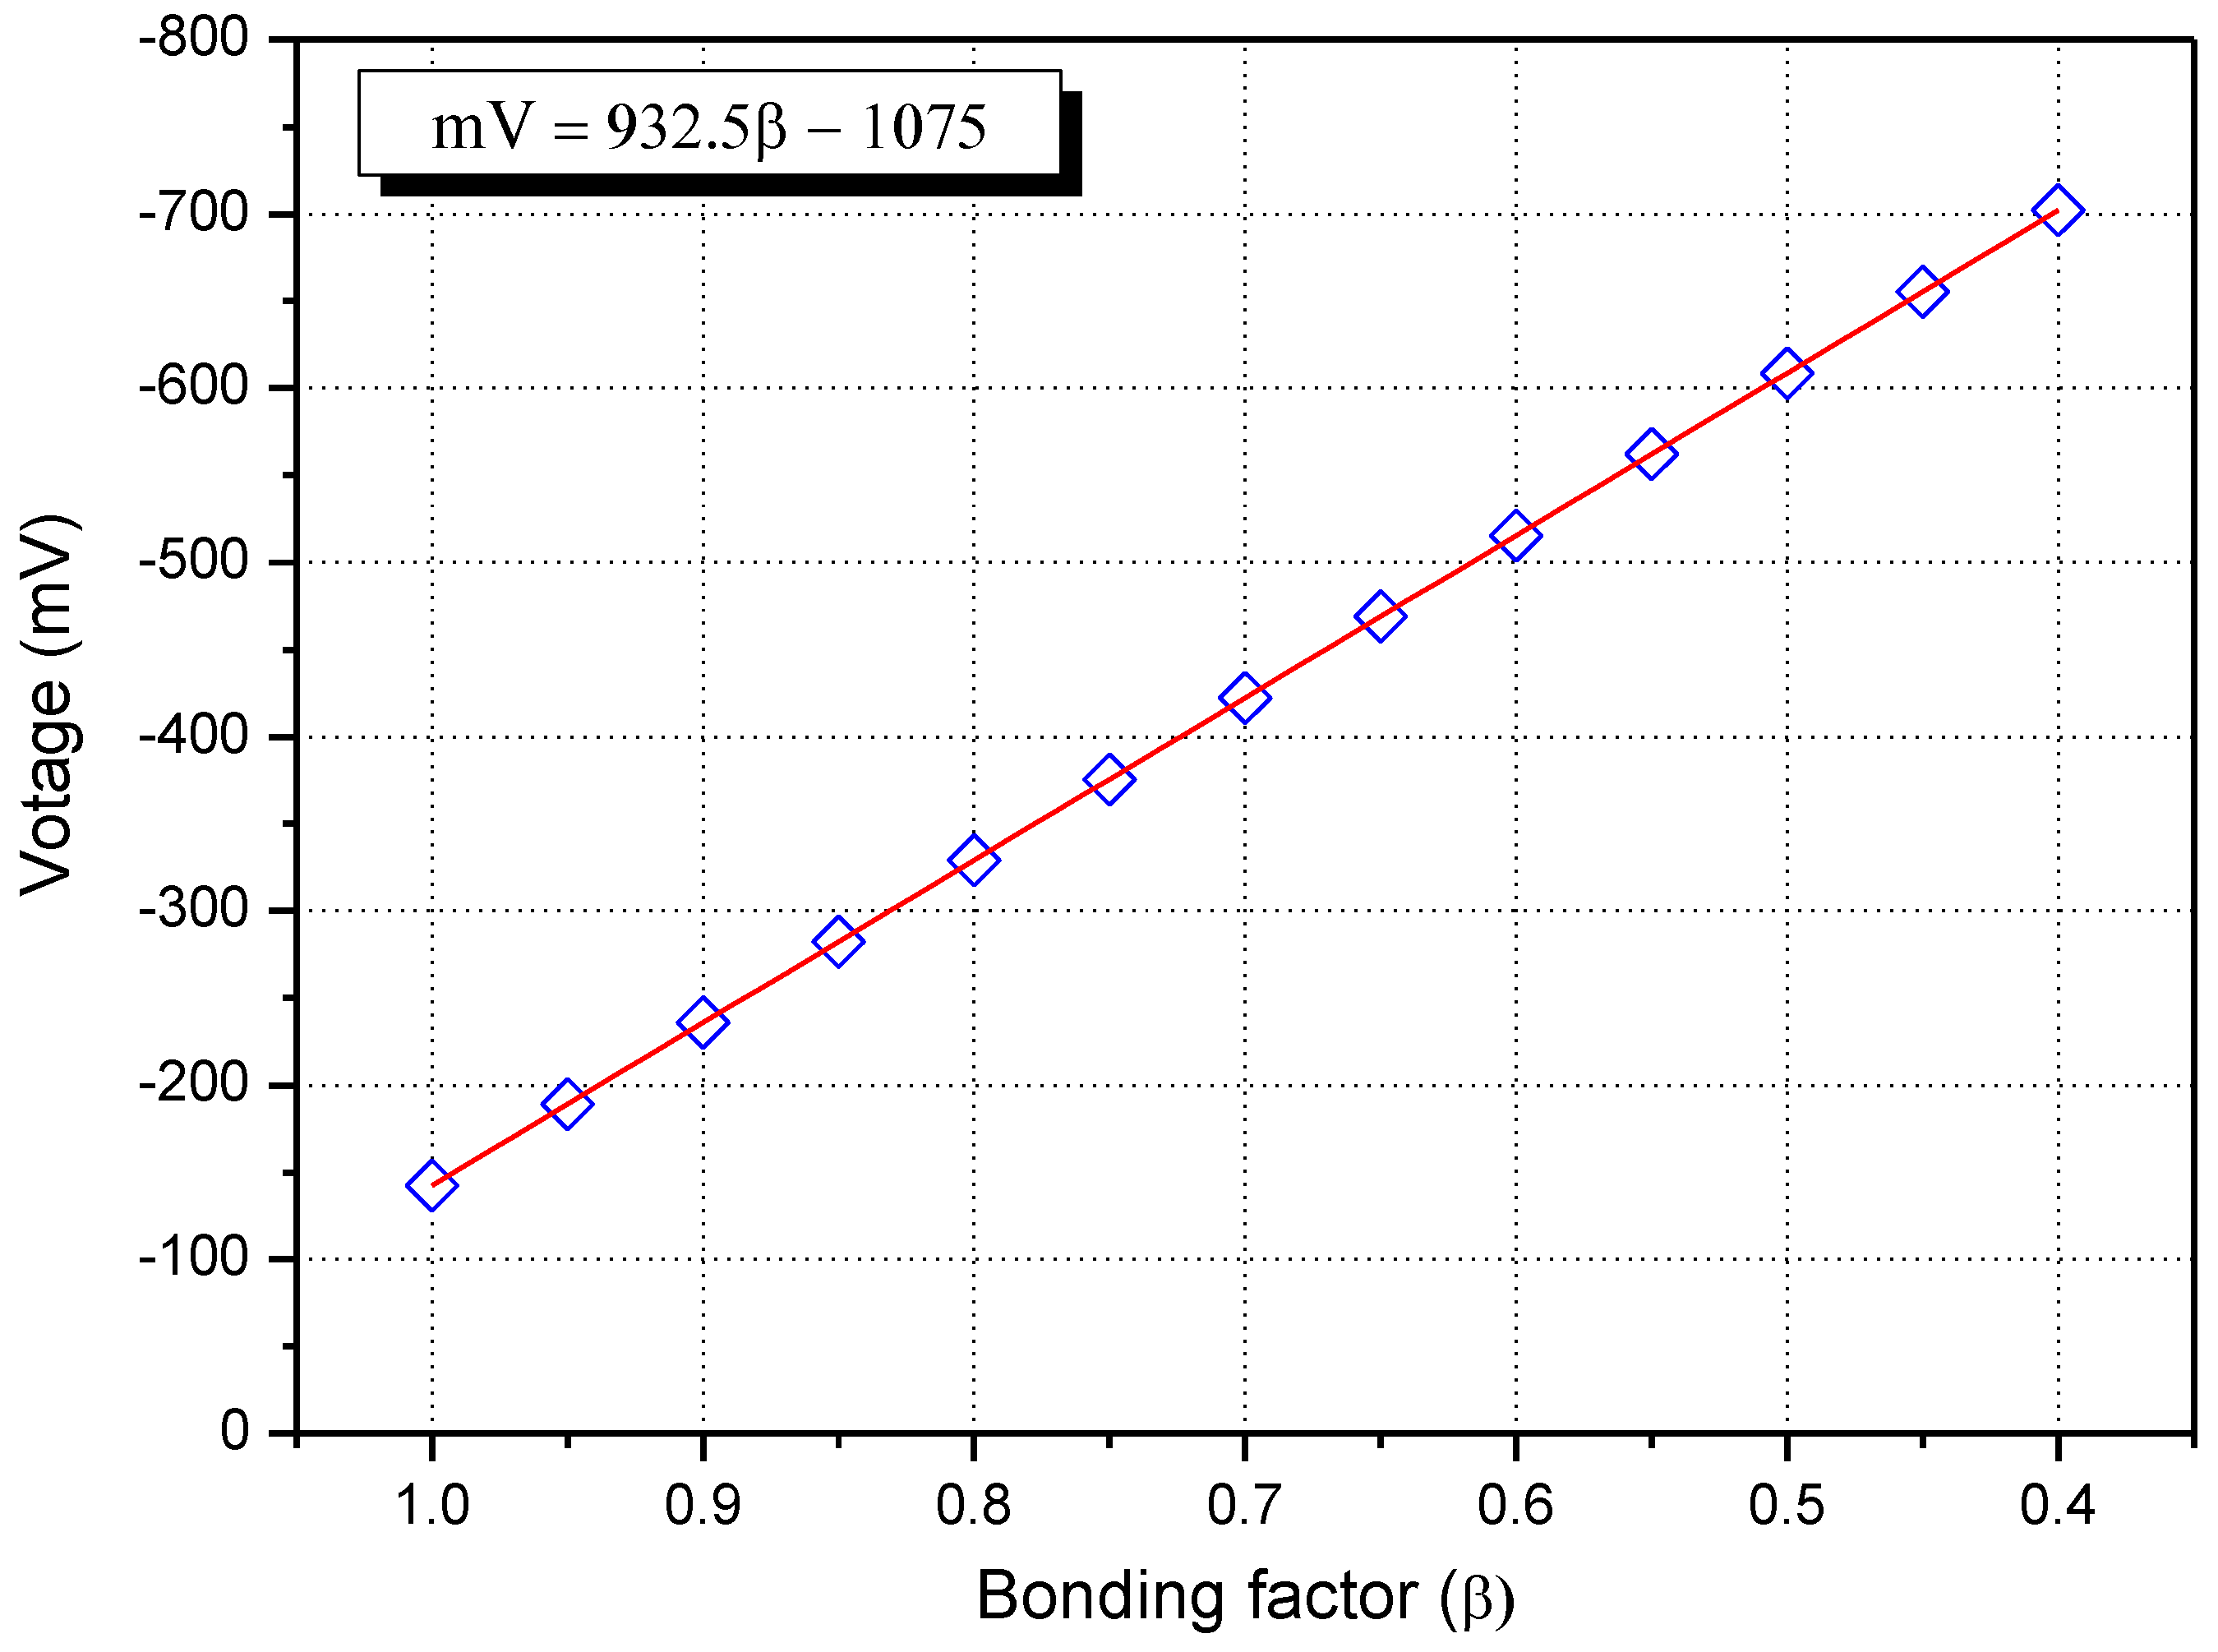
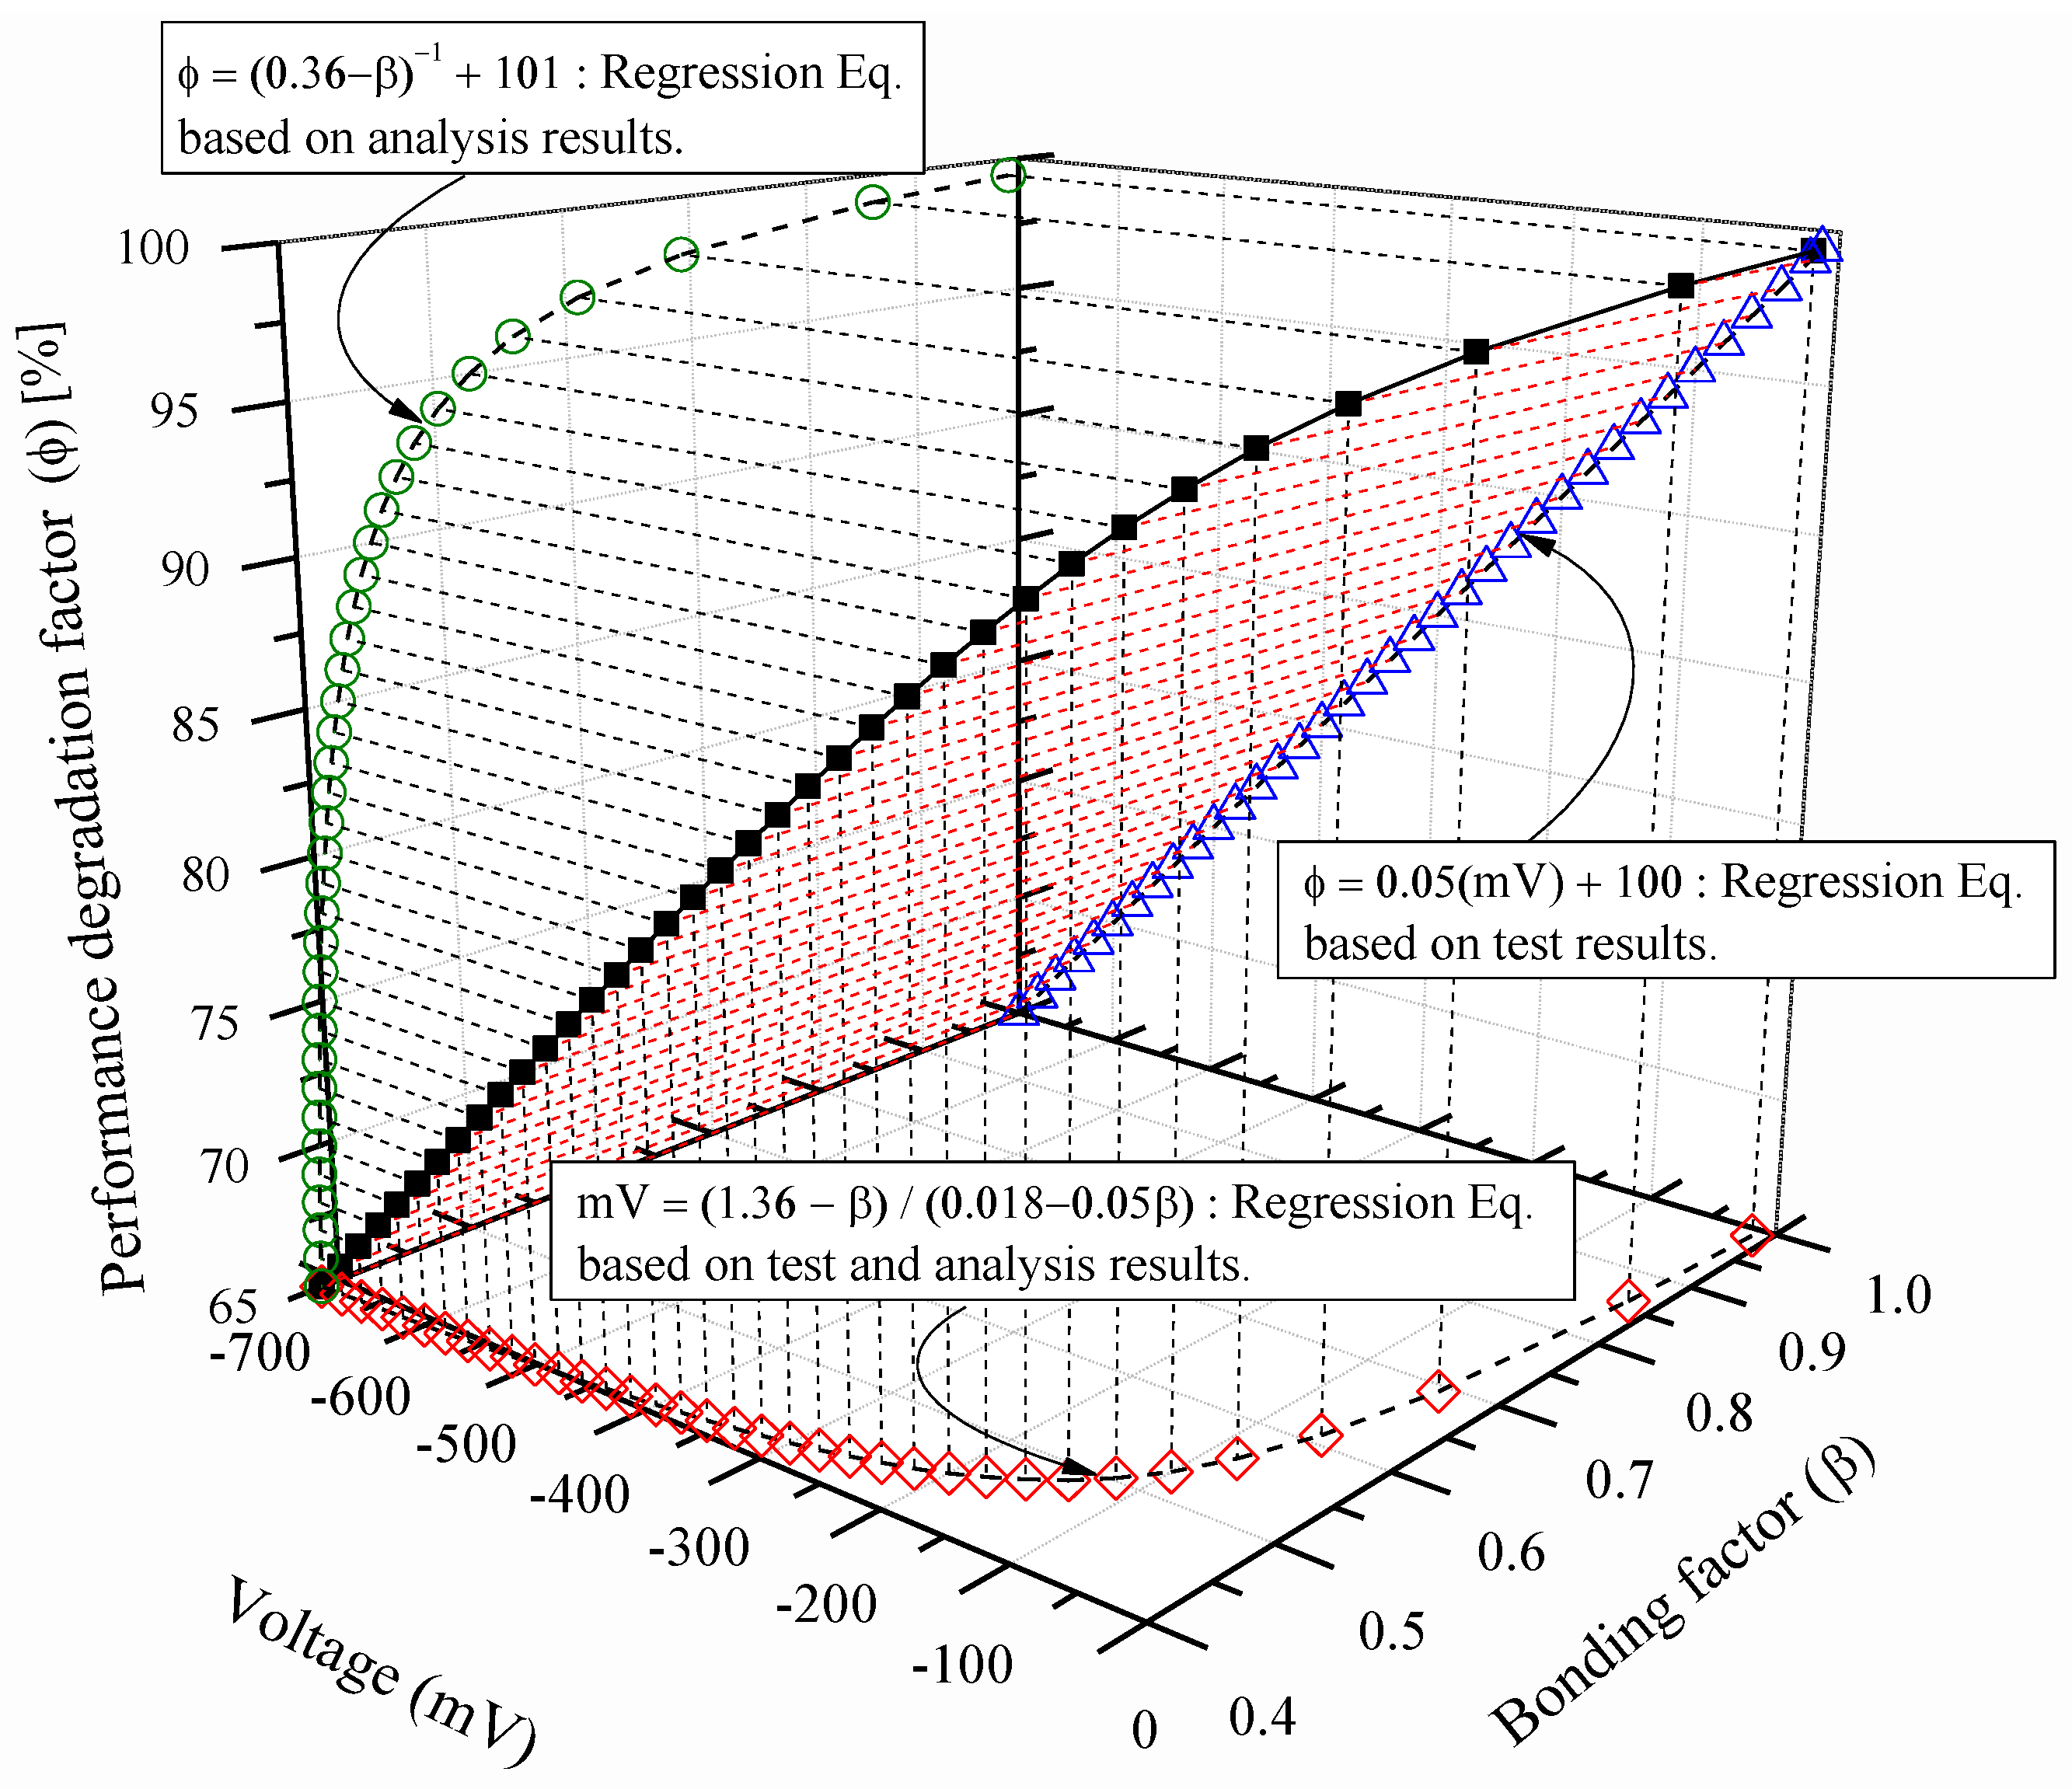
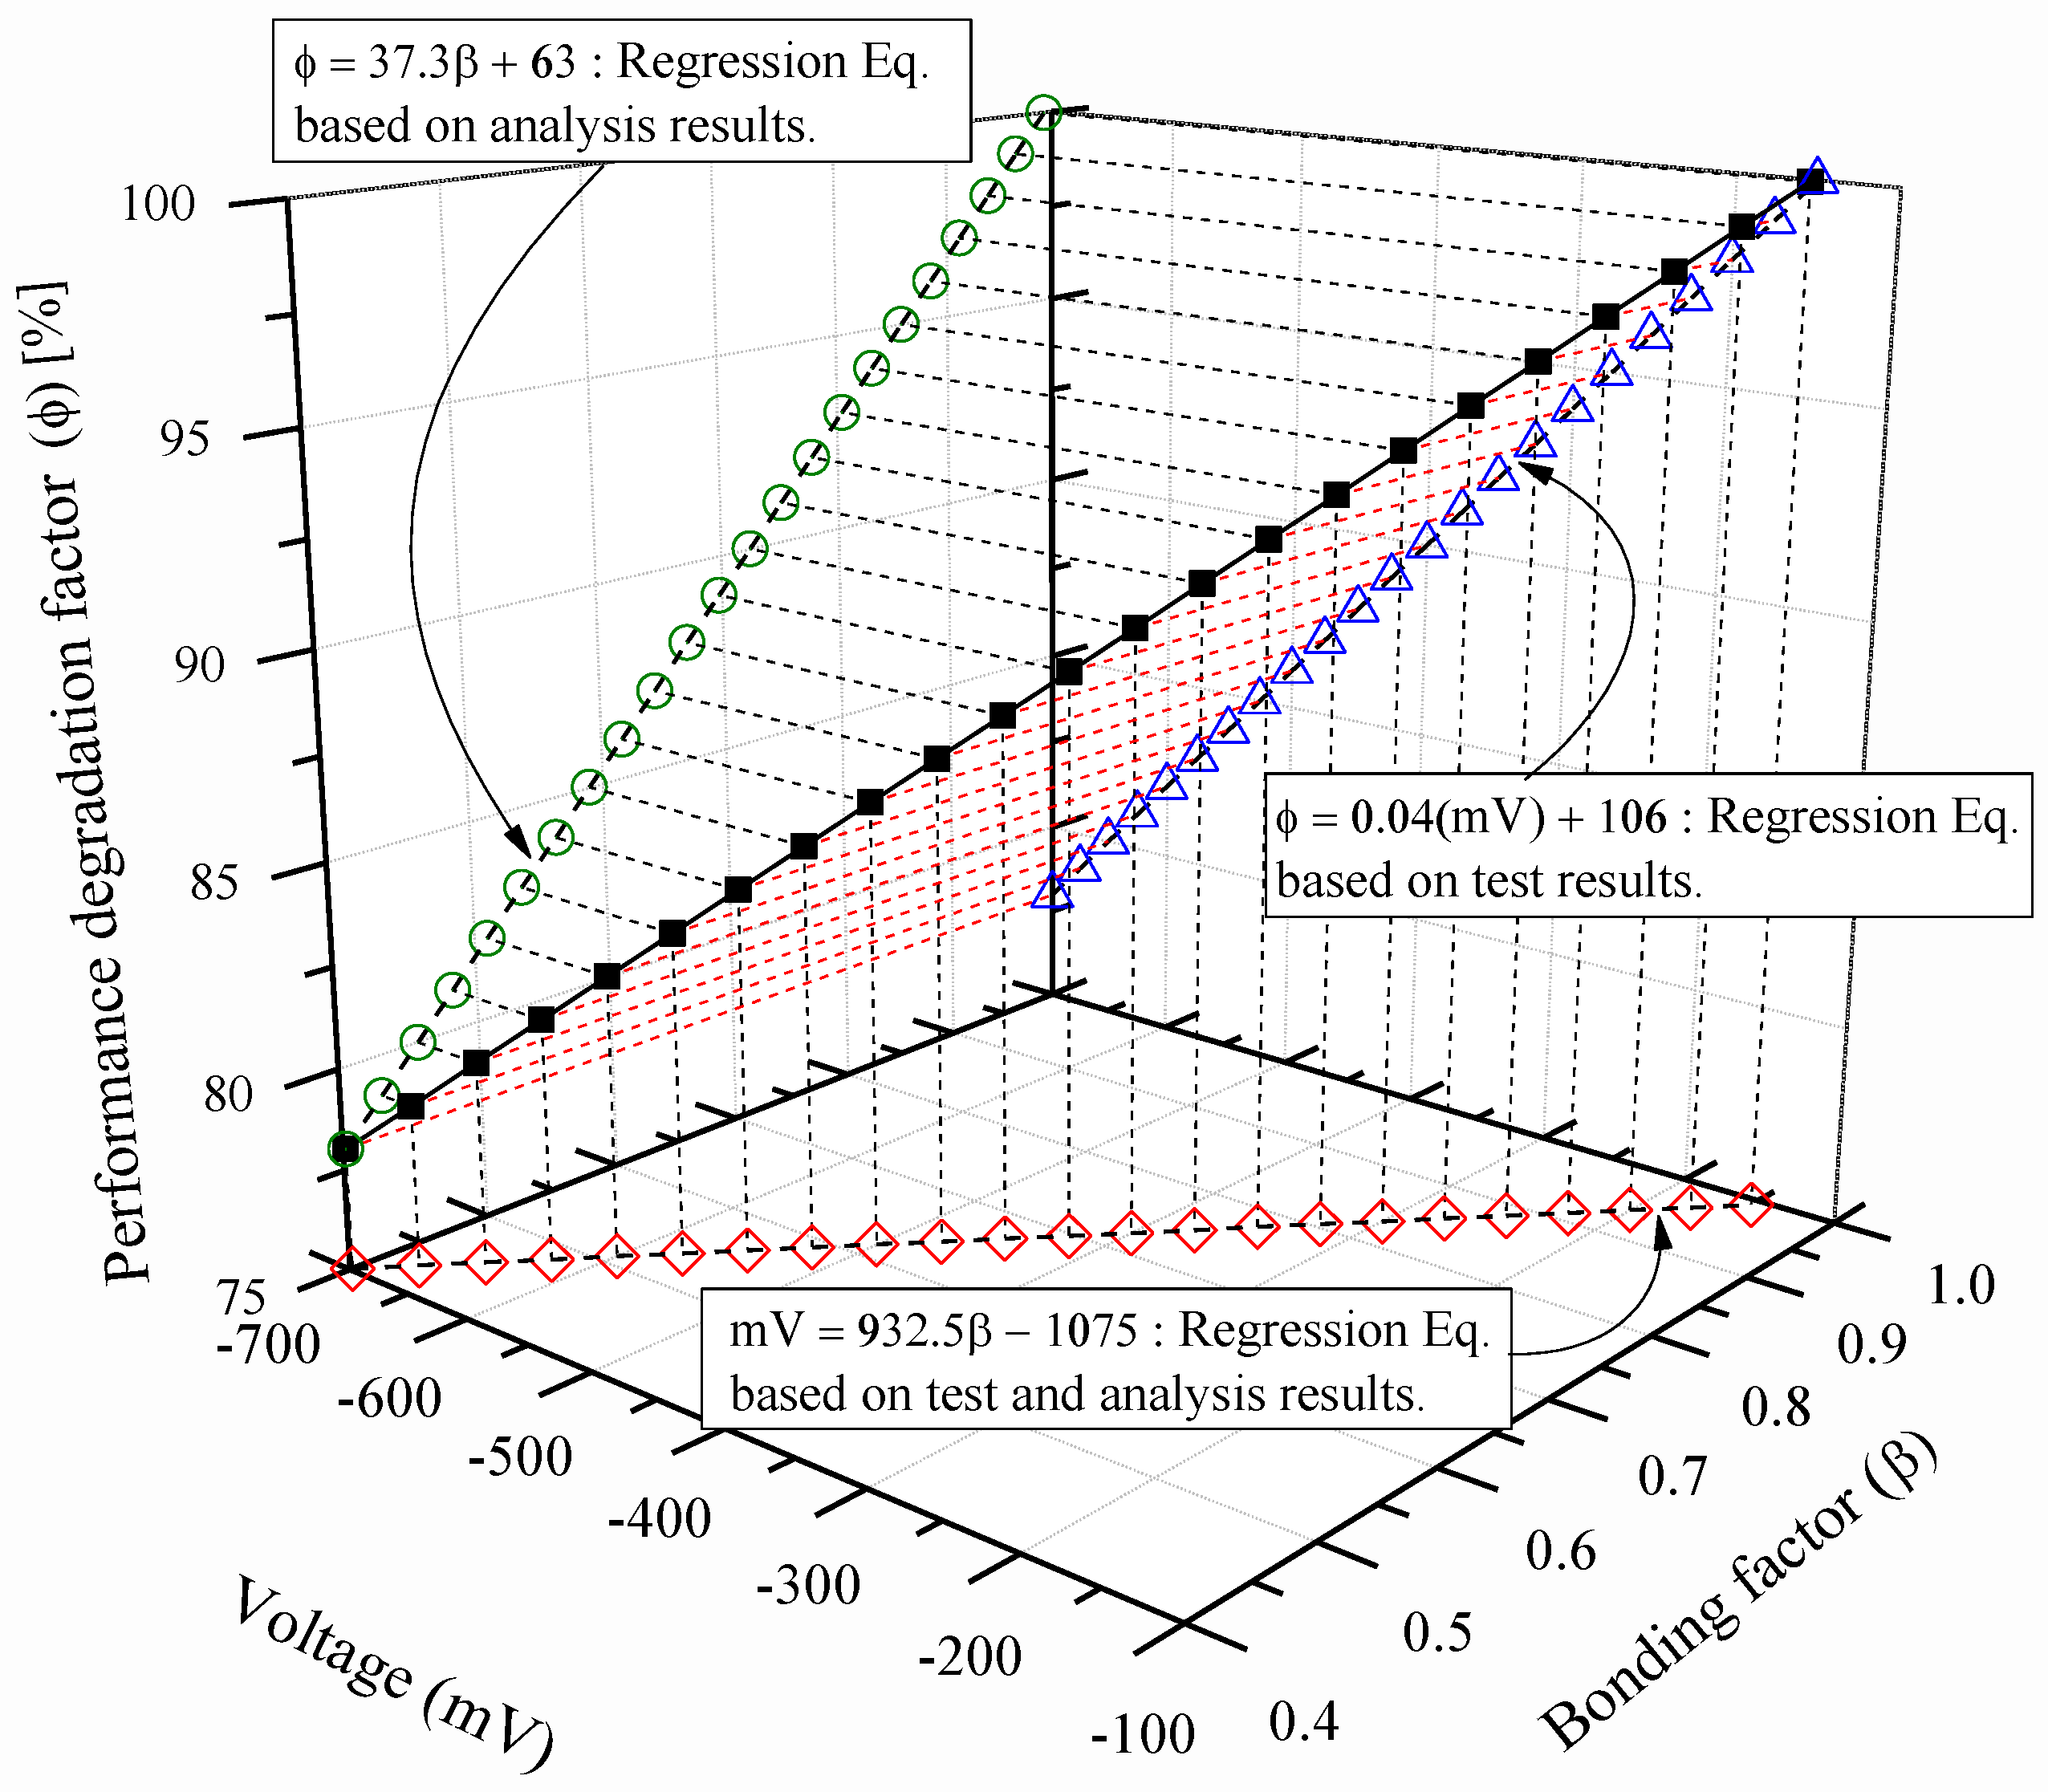
The FEA-derived bonding factor (β) and performance degradation factor (ϕ) of flexural beam can be approximated with the equation ϕ = ( 0.36 β ) 1 + 101 , and a high correlation is seen (R2 = 0.94). Furthermore, the βϕ correlation and the correlation between the average potential difference in voltage (mV) of each rebar-corroded flexural beam specimen and performance degradation factor (ϕ) ( ϕ = 0.05 ( mV ) + 100 , R2 = 0.78) obtained in a previous study [1] yielded the β–mV correlation mV = ( 1.36 β ) / ( 0.018 0.05 β ) with respect to the performance degradation factor (ϕ). In the case of shear member, FEA resulted in ϕ = 37.3 β + 63 , which enables regression approximation, showing a high correlation (R2 = 0.98). As was the case with flexural beam, the βϕ correlation of shear beam and the mV–ϕ correlation equation ( ϕ = 0.04 ( mV ) + 109 , R2 = 0.91) for the test result were integrated to yield the β–mV correlation ( mV = 932.5 β 1075 ) of shear beam with respect to performance degradation factor (ϕ).
(3)
Lastly, the mV–βϕ correlation curves of corroded shear and flexural beams were proposed by interrelating the FEA-derived βϕ correlation of each specimen and the correlation between the average potential difference in voltage quantitatively measured on corroded beam member by HCP and the performance degradation obtained from structural test, i.e., the mV–ϕ correlation, from an engineering aspect. Using the mV–βϕ correlation curves, the bonding factor (β) depending on the degree of corrosion of RC shear and flexural beam members and the performance degradation factor (ϕ) based on the consequent strength-deformation capacity can be evaluated. These results reveal that the methodology proposed in this study can be used for quantitatively evaluating the seismic performance of corrosion-damaged RC members.
(4)
In this study, the correlation between the degree of corrosion and structural performance degradation was evaluated using corrosion-damaged RC beam members. Unlike the column, the beam is not the lateral resisting member. Therefore, the results investigated in this research could not be directly used for evaluating the seismic capacity of the entire RC building. In order to propose a robust practical methodology for evaluating the seismic performance of RC buildings with corrosion-damaged members, the seismic performance degradation factor of lateral load resisting systems such as columns should be experimentally derived for further research, together with analytical investigations such as finite element analysis.

Author Contributions

All authors have contributed to the development of the research and the elaboration of this article. Particularly, J.-S.J. contributed to the methodology and the finite element analysis, conceptualization, and edited the manuscript; J.-W.J. contributed to the finite element analysis and the investigation; K.-S.L. contributed to the methodology, the finite element analysis and the validation. All authors have read and agreed to the published version of the manuscript.

Funding

This research received no external funding.

Data Availability Statement

All datasets generated during this study are available from the corresponding author on reasonable request.

Acknowledgments

This paper was supported by a grant (2021R1A2C2094779) from the National Research Foundation of Korea, and by a grant (20-RERP-B082884-07) from the Housing Environment Research Program funded by the Ministry of Land, Infrastructure, and Transport of the Korean government.

Conflicts of Interest

The authors declare that they have no conflict of interest.

References

  1. Jung, J.-S.; Lee, B.Y.; Lee, K.-S. Experimental Study on the Structural Performance Degradation of Corrosion-Damaged Reinforced Concrete Beams. Adv. Civ. Eng. 2019, 2019, 9562574. [Google Scholar] [CrossRef]
  2. Hansson, C.M. Comments on electrochemical measurements of the rate of corrosion of steel in concrete. Cem. Concr. Res. 1984, 14, 574–584. [Google Scholar] [CrossRef]
  3. Lee, H.S.; Tomosawa, F.; Noguchi, T. Effects of rebar corrosion on the structural performance of singly reinforced beams. Durab. Build. Mater. Compon. 1996, 7, 571–580. [Google Scholar]
  4. Shamsad, A. Reinforcement corrosion in concrete structures, its monitoring and service life prediction—A review. J. Cem. Concr. Compos. 2003, 25, 459–471. [Google Scholar]
  5. Duvnjak, I.; Klepo, I.; Serdar, M.; Damjanovi’c, D. Damage Assessment of Reinforced Concrete Elements Due to Corrosion Effect Using Dynamic Parameters: A Review. Buildings 2021, 11, 425. [Google Scholar] [CrossRef]
  6. Dogan, M. Corrosion failure in concrete reinforcement to damage during seismic. Eng. Fail. Anal. 2015, 56, 275–287. [Google Scholar] [CrossRef]
  7. Federal Emergency Management Agency. FEMA 310 Handbook for Seismic Evaluation of Buildings—A Prestandard; Federal Emergency Management Agency: Washington, DC, USA, 1998.
  8. Federal Emergency Management Agency. FEMA 356 Prestandard and Commentary for Seismic Rehabilitation of Buildings; Federal Emergency Management Agency: Washington, DC, USA, 2000.
  9. Japan Building Disaster Prevention Association. English Version: Standard for Seismic Evaluation of Existing Reinforced Concrete Buildings; Japan Building Disaster Prevention Association: Tokyo, Japan, 2005. [Google Scholar]
  10. Li, Y.; Yin, S.P.; Chen, W.J. Seismic behavior of corrosion-damaged RC columns strengthened with TRC under a chloride environment. Constr. Build. Mater. 2019, 201, 736–745. [Google Scholar]
  11. Cabrera, J. Deterioration of concrete due to reinforcement steel corrosion. Cem. Concr. Compos. 1996, 18, 47–59. [Google Scholar] [CrossRef]
  12. Capozucca, R. Damage to reinforced concrete due to reinforcement corrosion. Constr. Build. Mater. 1995, 9, 295–303. [Google Scholar] [CrossRef]
  13. Jung, W.-Y.; Kwon, M.-H.; Ahn, M.-K. Structural behavior of compressive and flexural members due to corroded reinforcing bars and different bonding interfaces. J. Korean Soc. Hazard Mitig. 2011, 11, 33–39. [Google Scholar] [CrossRef] [Green Version]
  14. Bhargava, K.; Ghosh, A.; Mori, Y.; Ramanujam, S. Suggested empirical models for corrosion-induced bond degradation in reinforced concrete. J. Struct. Eng. 2008, 134, 221–230. [Google Scholar] [CrossRef]
  15. Park, Y.J. Experimental Research on Bond Characteristics and Tensile Strength by Corrosion of Reinforcement Steels. Master’s Thesis, Tong-Myong University, Pusan, Korea, 2004; 120p. [Google Scholar]
  16. Stanish, K.; Hooton, R.D.; Pantazopoulou, S.J. Corrosion effects on bond strength in reinforced concrete. ACI Struct. J. 1999, 96, 915–921. [Google Scholar]
  17. Yang, X.; Zhu, H. Finite element investigation on load carrying capacity of corroded RC beam based on bond-slip. Jordan J. Civ. Eng. 2012, 6, 134–146. [Google Scholar]
  18. Ballim, Y.; Reid, J.C. Reinforcement corrosion and the deflection of RC beams an experimental critique of current test methods. Cem. Concr. Compos. 2003, 25, 625–632. [Google Scholar] [CrossRef]
  19. Torres-Acostaa, A.A.; Navarro-Gutierreza, S.; Teran-Guillen, J. Residual flexure capacity of corroded reinforced concrete beams. Eng. Struct. 2007, 29, 1145–1152. [Google Scholar] [CrossRef]
  20. ASTM C39/C39M-15; Standard Test Method for Compressive Strength of Cylindrical Concrete Specimens. ASTM International: West Conshohocken, PA, USA, 2015.
  21. ASTM E8/E8M-15; Standard Test Methods for Tension Testing of Metallic Materials. ASTM International: West Conshohocken, PA, USA, 2015.
  22. ACI Committee 318. Building Code Requirements for Structural Concrete and Commentary (ACI 318-11) and Commentary; American Concrete Institute: Farmington Hills, MI, USA, 2011. [Google Scholar]
  23. ASTM C876-09; Standard Test Method for Corrosion Potentials of Uncoated Reinforcing Steel in Concrete. ASTM International: West Conshohocken, PA, USA, 2009.
  24. Proceq. CANIN+ Operating Instruction for Corrosion Analyzing Instrument; Proceq: Schwerzenbach, Switzerland, 2009. [Google Scholar]
  25. Vecchio, F.J.; Lai, D.; Shim, W.; Ng, J. Disturbed Stress Field Model for Reinforced Concrete: Validation. J. Struct. Eng. 2001, 127, 350–358. [Google Scholar] [CrossRef]
  26. Vecchio, F.J.; Collins, M.P. The Modified Compression Field Theory for Reinforced Concrete Elements Subjected to Shear. ACI J. Proc. 2001, 83, 219–231. [Google Scholar]
  27. Vecchio, F.J. Web Address of Program VecTor2, Ver. 4.4. 2021. Available online: http://www.civ.utoronto.ca/vector/ (accessed on 10 November 2021).
  28. Hognestad, E. A Study of Combined Bending and Axial Load in R.C. Members; University of Illinois Enginering Experiment Station Bulletin: Champaign, IL, USA, 1951; No. 399. [Google Scholar]
  29. Kent, D.C.; Park, R. Flexural Members with Confined Concrete. ASCE J. Struct. Div. 1971, 97, 1969–1990. [Google Scholar] [CrossRef]
  30. Park, R.; Priestley, M.J.N.; Gill, W.D. Ductility of Square Confined Concrete Columns. J. Struct. Div. 1982, 108, 929–950. [Google Scholar] [CrossRef]
  31. Lee, S.-C.; Cho, J.-Y.; Vecchio, F.J. Model for post-yield tension stiffening and rebar rupture in concrete members. Eng. Struct. 2011, 33, 1723–1733. [Google Scholar] [CrossRef]
  32. Vintzeleou, E.N.; Tassios, T.P. Behavior of Dowels under Cyclic Deformations. ACI Struct. J. 1987, 84, 18–30. [Google Scholar]
  33. He, X.; Kwan, A. Modeling dowel action of reinforcement bars for finite element analysis of concrete structures. Comput. Struct. 2001, 79, 595–604. [Google Scholar] [CrossRef]
  34. Eligehausen, R.; Popov, E.P.; Bertero, V.V. Local Bond Stress-Slip Relationships of Deformed Bars under Generalized Excitations; Earthquake Engineering Research Center, Report No. UCB/EERC-83/23; University of California: Berkeley, CA, USA, 1983; pp. 1–188. [Google Scholar]
Figure 1. Structural performance deterioration of a reinforced concrete (RC) structure due to reinforcement corrosion.
Applsci 12 02090 g001
Figure 2. Corrosion of RC members damaged during the 1999 Izmit Earthquake in Turkey.
Applsci 12 02090 g002
Figure 3. Corrosion of RC beams and columns damaged during earthquakes. (a) the 2004 Niigta-ken Chuetsu Earthquake in Japan and (b) the 2017 Pohang Earthquake in Korea.
Applsci 12 02090 g003
Figure 4. Relationship between the performance degradation factor and average potential difference in terms of voltage: (a) flexural failure type beams and (b) shear failure type beam.
Applsci 12 02090 g004
Figure 5. Reinforcement details of beams: (a) flexural failure type beam and (b) shear failure type beam.
Applsci 12 02090 g005
Figure 6. Test setup.
Applsci 12 02090 g006
Figure 7. Modified Park–Kent model for post-peak concrete compression response.
Applsci 12 02090 g007
Figure 8. A compression softening model.
Applsci 12 02090 g008
Figure 9. A tension stiffening model.
Applsci 12 02090 g009
Figure 10. Dowel resistance mechanism.
Applsci 12 02090 g010
Figure 11. Eligehausen bond stress-slip response.
Applsci 12 02090 g011
Figure 12. Finite element modeling of beams: (a) flexural beam and (b) shear beam.
Applsci 12 02090 g012
Figure 13. Comparison between test and analysis results of flexural beam specimen.
Applsci 12 02090 g013
Figure 14. Relationship between bonding factor (β) and performance reduction factor (ϕ) of flexural beam specimens (FEM analysis).
Applsci 12 02090 g014
Figure 15. Relationship between average potential difference in terms of voltage (mV) and performance reduction factor (ϕ) of flexural beam specimens (Test).
Applsci 12 02090 g015
Figure 16. Relationship between bonding factor (β) and average potential difference in terms of voltage (mV) of flexural beam specimens.
Applsci 12 02090 g016
Figure 17. Comparison between test and analysis results of shear beam specimen.
Applsci 12 02090 g017
Figure 18. Relationship between bonding factor (β) and performance reduction factor (ϕ) of shear beam specimens (FEM analysis).
Applsci 12 02090 g018
Figure 19. Relationship between average potential difference in terms of voltage (mV) and performance reduction factor (ϕ) of shear beam specimens (Test).
Applsci 12 02090 g019
Figure 20. Relationship between bonding factor (β) and average potential difference in terms of voltage (mV) of flexural beam specimens.
Applsci 12 02090 g020
Figure 21. 3D plot of performance reduction factor (ϕ), bonding factor (β), and average potential difference in terms of voltage (mV) of corroded flexural beam.
Applsci 12 02090 g021
Figure 22. 3D plot of performance reduction factor (ϕ), bonding factor (β), and average potential difference in terms of voltage (mV) of corroded shear beam.
Applsci 12 02090 g022
Table 1. Evaluation of T value.
ElementRangeDeterioration and Aging
  • Cracking by Concrete Expansion Due to the Rust of Reinforcing Bar
  • Rust of Reinforcing Bar
  • Deterioration of Concrete Caused by Chemicals
Slab including sub-beam1/3 or more0.017
1/3~1/90.006
1/9 or less0.0023
00
Beam1/3 or more0.05
1/3~1/90.017
1/9 or less0.006
00
Wall & Column1/3 or more0.15
1/3~1/90.05
1/9 or less0.017
00
Table 2. Test results for each specimen.
BeamAverage Potential
Difference in Voltage
Ultimate Dissipation Energy
(kN-mm)
Performance Degradation Factor
ϕ (%)
mV CSE
(Copper Sulfate Electrode)
Load
(kN)
Deflection
(mm)
FB-C0−6381.6116.78298100.0
FB-C1−25478.9100.9752190.6
FB-C2−26577.4110.9763992.1
FB-C3−28080.7101.4740489.2
FB-C4−29278.495.6668380.5
FB-C5−29872.098.7665980.3
FB-C6−37474.397.4665180.2
FB-C7−70077.276.9579769.9
SB-C0−171181.911.31301100.0
SB-C1−269169.810.0126797.3
SB-C2−344172.311.0117890.5
SB-C3−551187.79.0112186.2
SB-C4−576186.712.5109083.7
SB-C5−659178.111.1110184.6
SB-C6−700171.47.8105681.1
SB-C7−700181.910.399576.4
Note: FB and SB indicate beams controlled by flexure and by shear, respectively, and ϕ shows the performance degradation factor.
Table 3. Analytical results for each flexural beam.
CasesBonding
Factor
( β )
UltimateDissipation
Energy
(kN-mm)
Performance Degradation
Factor
ϕ (%)
Load
(kN)
Deflection
(mm)
Case-11.0087.3115.98840.26100.0
Case-20.9084.7114.98756.3599.05
Case-30.8084.3112.578553.496.76
Case-40.7082.7111.378305.6995.50
Case-50.6081.4111.418288.7392.76
Case-60.5085.8109.68179.3591.66
Case-70.4584.6105.167908.589.46
Case-80.4481.3104.137767.5687.87
Case-90.4382.594.927033.9479.57
Case-100.4281.687.386352.0871.85
Case-110.4180.683.466093.7668.93
Case-120.4079.181.055828.6865.93
Table 4. Analysis results for each shear beam.
CasesBonding
Factor
( β )
UltimateDissipation
Energy
(kN-mm)
Performance Degradation Factor
ϕ (%)
Load
(kN)
Deflection
(mm)
Case-11.00186.812.031728.21100.0
Case-20.95186.212.031674.696.9
Case-30.90185.812.021668.5195.55
Case-40.85185.212.021663.4596.25
Case-50.80184.812.021657.8293.93
Case-60.70183.812.021610.2889.32
Case-70.65183.211.021507.0087.2
Case-80.60182.611.021502.9386.96
Case-90.5518211.021478.5983.71
Case-100.50181.211.021454.5981.48
Case-110.45180.411.021429.9179.21
Case-120.40180.610.021325.9576.72
Publisher’s Note: MDPI stays neutral with regard to jurisdictional claims in published maps and institutional affiliations.

