Article

Automatic Screening of Bolts with Anti-Loosening Coating Using Grad-CAM and Transfer Learning with Deep Convolutional Neural Networks

1
Department of Future Convergence Engineering, Kongju National University, Cheonan 31080, Korea
2
Department of Future Automotive Engineering, Kongju National University, Cheonan 31080, Korea
*
Author to whom correspondence should be addressed.
Appl. Sci. 2022, 12(4), 2029; https://doi.org/10.3390/app12042029
Submission received: 10 January 2022 / Revised: 11 February 2022 / Accepted: 13 February 2022 / Published: 15 February 2022
(This article belongs to the Topic Machine and Deep Learning)

Abstract

:
Most electronic and automotive parts are affixed by bolts. To prevent such bolts from loosening through shock and vibration, anti-loosening coating is applied to their threads. However, during the coating process, various defects can occur. Consequently, as the quality of the anti-loosening coating is critical for the fastening force, bolts are inspected optically and manually. It is difficult, however, to accurately screen coating defects owing to their various shapes and sizes. In this study, we applied deep learning to assess the coating quality of bolts with anti-loosening coating. From the various convolutional neural network (CNN) methods, the VGG16 structure was employed. Furthermore, the gradient-weighted class activation mapping visualization method was used to evaluate the training model; this is because a CNN cannot determine the classification criteria or the defect location, owing to its structure. The results confirmed that external factors influence the classification. We, therefore, applied the region of interest method to classify the bolt thread only, and subsequently, retrained the algorithm. Moreover, to reduce the learning time and improve the model performance, transfer learning and fine tuning were employed. The proposed method for screening coating defects was applied to a screening device equipped with an actual conveyor belt, and the Modbus TCP protocol was used to transmit signals between a programmable logic controller and a personal computer. Using the proposed method, we were able to automatically detect coating defects that were missed by optical sorters.

1. Introduction

Automobiles, trains, and large electronic products are made by combining various parts. These combinations, in turn, require the use of techniques such as welding, assembly, and bolt fastening. Among them, bolt fastening is still widely used to combine parts because it allows different parts to be connected without special technology. Bolts, however, may become unfastened owing to vibration or shock, which can be hazardous where safety-critical parts are combined using the bolt fastening technique. To resolve this problem, in products such as Nylock, a liquid nylon coating is applied between the bolt threads, thereby increasing the frictional graft force and the fastening power. These products are called anti-loosening coated bolts (Figure 1).
Anti-loosening coated bolts are manufactured by automatically or manually rotating the coating liquid to spread it between the bolt threads. During this process, the bolts may become defective owing to errors in the liquid viscosity or the quantity of applied liquid. As quality is critical in stabilizing the fastening force, the dried bolts go through a sorting process, during which defective and non-defective bolts are separated. The sorting process is conducted by automated optical sorters. Although four types of defects can occur in coated bolts, the optical sorters are not capable of identifying all of them because they are reliant on colors to find the defects. Therefore, human vision is used to provide an additional sorting process. However, manual sorting activities with the naked eye are repetitive and, therefore, place high stress on the human workers, ultimately reducing the accuracy of the process. Furthermore, rising labor costs and limited sorting speeds negatively impact the production volume. To improve upon the shortcomings of the optical and naked eye sorting methods, various industries have been implementing artificial intelligence technology in the sorting process.
Jia et al. [1] utilized the support vector machine method, a machine learning technique, to detect surface defects with 85% accuracy. Ha and Park [2] applied machine learning technology to detect compact camera module (CCM) defects. Deep learning technology is frequently used to generate algorithms for defect detection because the image-learning characteristics and defective product sorting technology performs well [3,4,5,6]. Deep learning has been used to detect defects in railway track fasteners [7] and bottle surfaces [8]. It has also been shown that even the smallest defects in components can be detected using deep learning techniques [9]. Choi and Seo [10] used deep learning techniques to identify cracks, scratches, and other irregular flaws often observed in industrial parts. To identify irregularly shaped defects arising from processes such as welding, researchers used machine learning and image filtering technology [11]. Image-based deep learning techniques, however, result in a loss of pixel location data due to the inherent flaws in the convolutional neural network (CNN) structure, as well as flaws in the technology in identifying characteristics and patterns from the learned data to independently classify the results. Additionally, these techniques require a high volume of data to determine specific features, which may be difficult to obtain for high-cost products that have insufficient data or for products with a significantly low defect rate. For the anti-loosening coated bolts in the current study, the problem of insufficient samples found in the production process was experienced.
To verify the reliability of the CNN-based coated bolt sorting model and resolve potential issues, in this study, we applied visualization and transfer learning techniques to sort anti-loosening coated bolts and automate the sorting process. First, defective anti-loosening coated bolts were sorted according to established standards. Thereafter, jigs were manufactured to account for the fact that the bolt heads hung from the conveyor belt as they were transported; cameras and lighting devices were placed in locations with optical visibility. The coated bolts were photographed under these conditions to facilitate learning using the VGG16 structure, which is a CNN technique. Using the defect visualization technique, the learning model was visualized to establish the identified defective areas. Accordingly, these input data were improved using the image preprocessing technique. Additionally, fine turning was conducted to achieve high performance and reduce the learning time, with weighted values previously obtained from large data volumes being applied to lower data volumes to increase the quality.

2. Materials and Methods

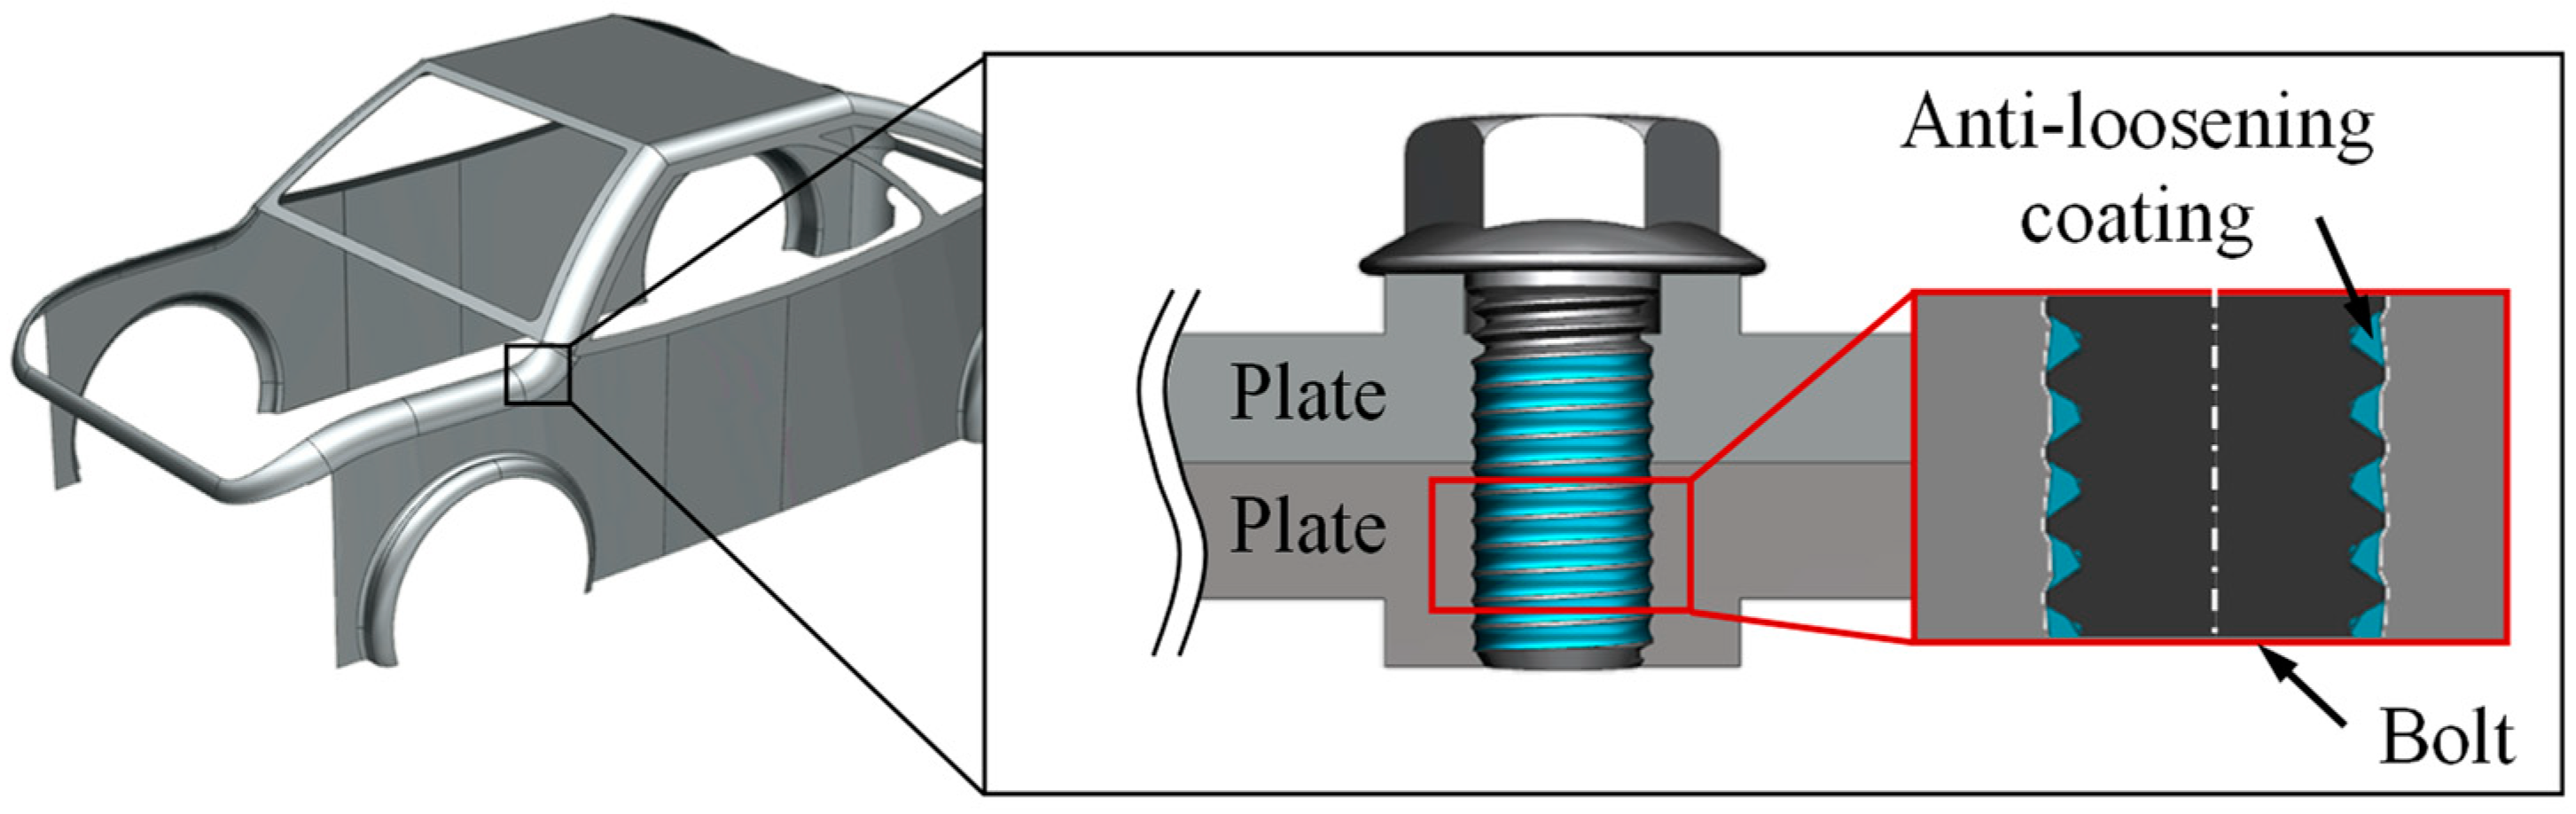
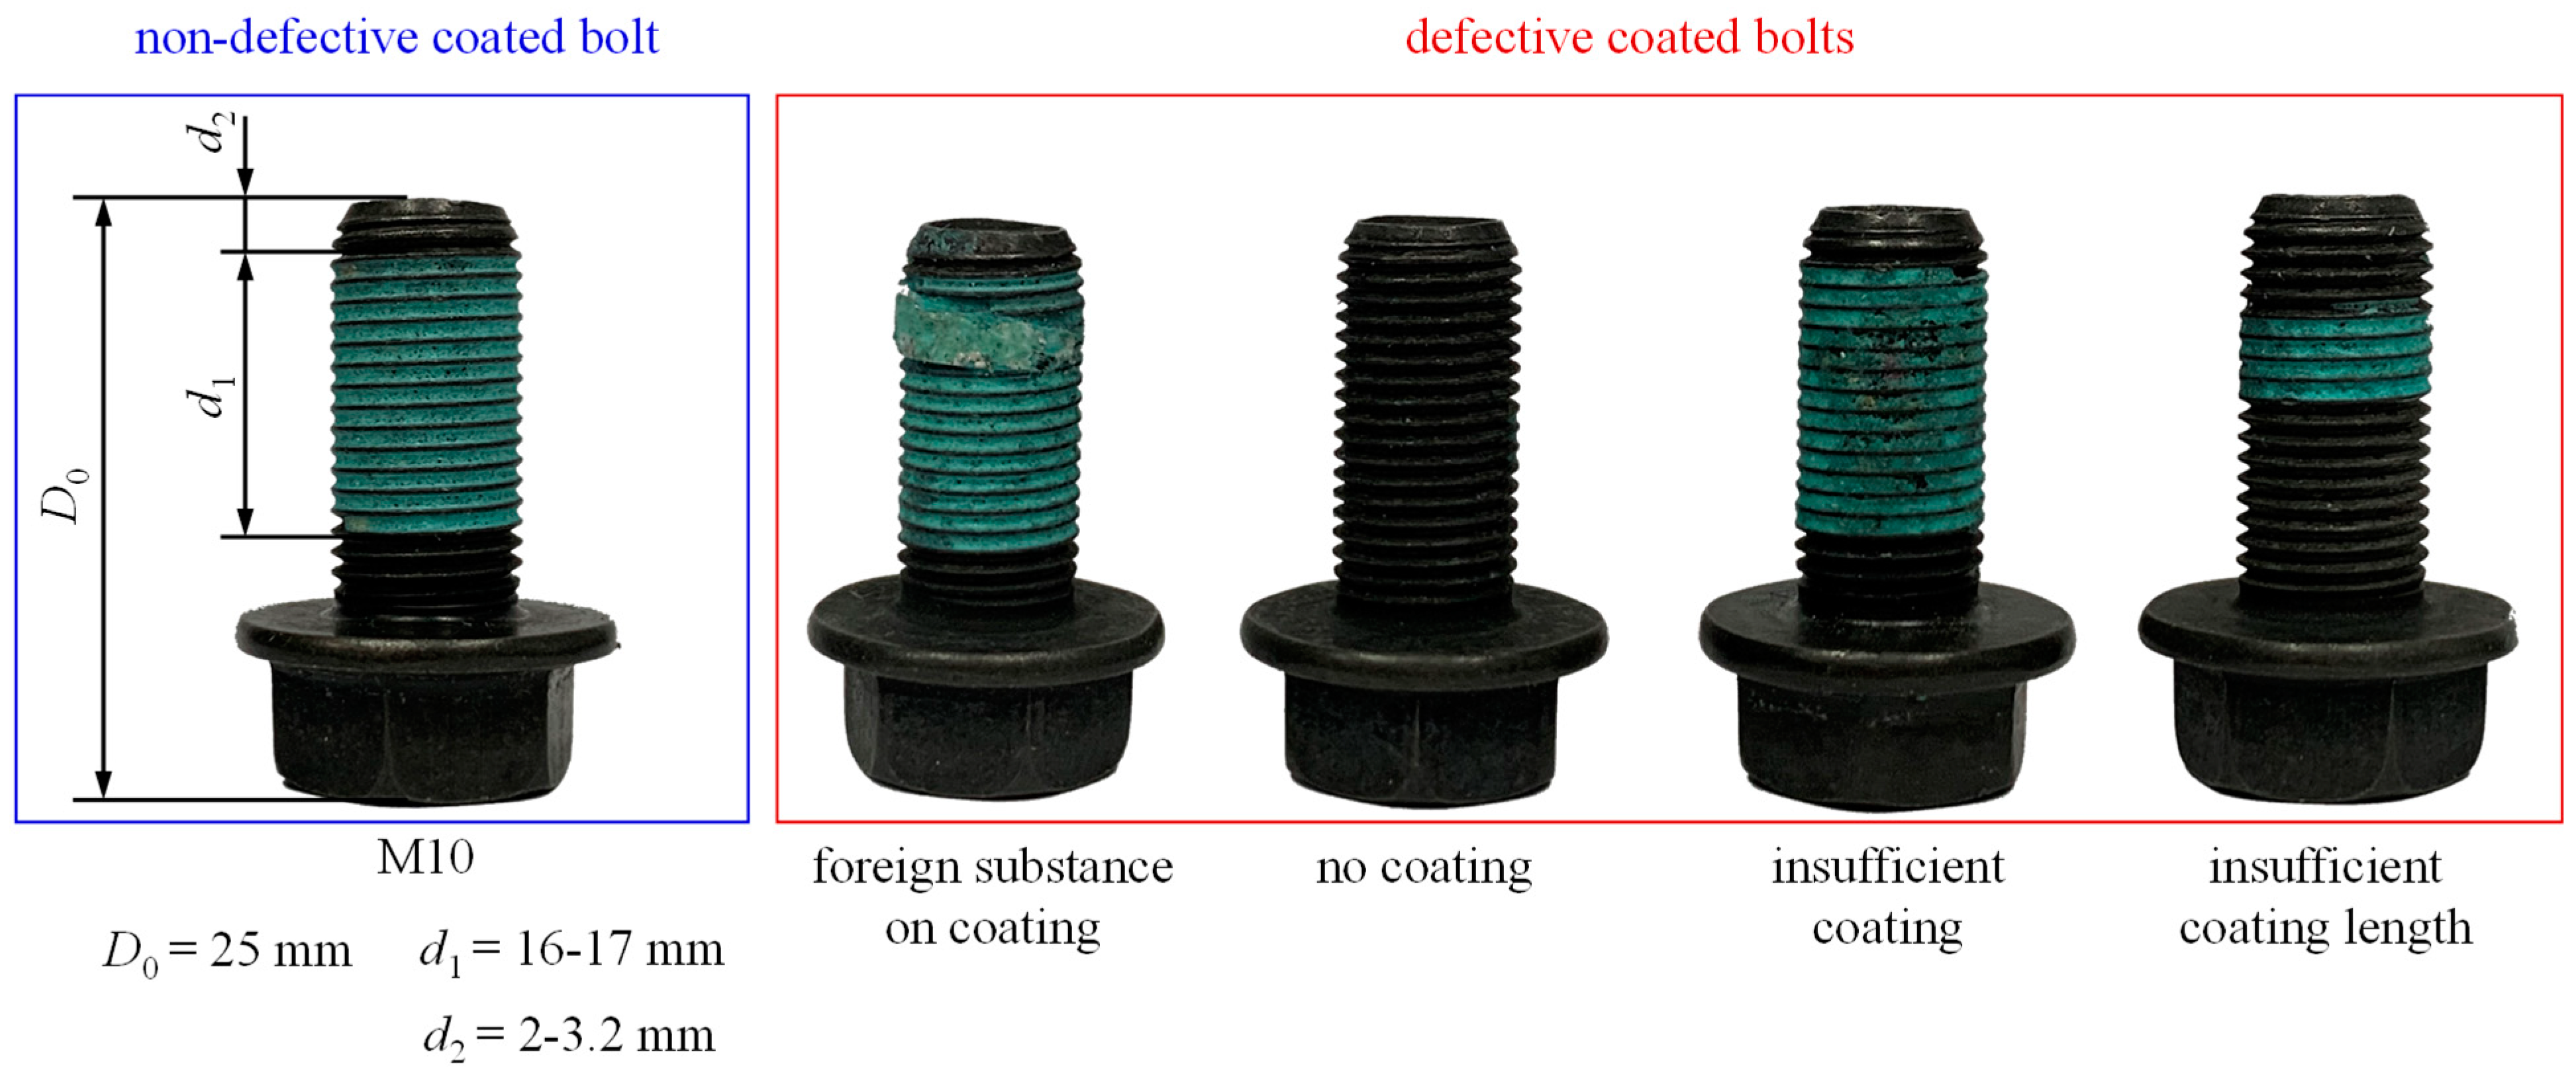
2.1. Defect Sorting Standards for Coated Bolts

Figure 2 shows defective and non-defective anti-loosening coated bolts. Anti-loosening coated bolts have various shapes, sizes, and colors; however, we used an M10 bolt size with a 25 mm thread length in this study. The coating solution was sprayed onto the bolt from the head to the tail in 2–2.3 mm intervals with a spread length of 16–17 mm. The non-continuous spreading of the coating solution and products deviating from these parameters were considered defective. Four types of defects deviating from these standards, based on shape, were identified. These included bolts with insufficient coating due to flaws in the spread of the solution, bolts with no coating, bolts with insufficient coating length, and bolts having foreign substances in the coating. These varying forms of inadequately coated products were classified as defective. As CNN is a supervised learning technique, a clear classification of the defects based on precise standards and identifications is required to ensure high performance. The diversity of the defect forms and sizes leads to ambiguity in the criteria, thus, making it difficult to specify the four defect classes using quantifiable criteria. It was, therefore, determined that using these standards in the learning data would result in lower accuracy. Accordingly, we did not classify the bolts solely based on the defect form; specifically, we also applied two classes, defective and non-defective, in the sorting process.

2.2. Data Acquisition Method

As the coated bolts are cylindrical, blind spots may occur depending on the location of the cameras. Should the defect be in a blind spot, the system would not be able to provide accurate sorting results. Furthermore, sorting speed decreases if only one camera films the rotating bolt because the image acquisition time increases. Therefore, four cameras were used simultaneously to acquire images. Table 1 shows the camera specifications. A system emulating an actual production conveyor belt was installed as shown in Figure 3; the jigs were manufactured and installed to fix the cameras in place. Additionally, the distance, angle, and viewing angle between the bolts and cameras were adjusted to obtain clear images of the bolt threads.
The images of the coating solution defects presented differently depending on the lighting environment. Bolts with insufficient coating, in particular, displayed different defects in terms of size and location depending on the lighting. Therefore, the circular and straight lighting devices were positioned appropriately to minimize shadow interference for bolts with insufficient coatings. Image-based CNN provides high accuracy for images with a decent resolution; however, higher resolutions result in lower learning speeds. Therefore, we selected a resolution that allowed the clear identification of coating defects with the naked eye. Using the preset criteria and data imaging environment, a total of 652 image data points were obtained, half of which were designated as defective and half as non-defective.

2.3. Anti-Loosening Coated Bolt Sorting Using CNN

2.3.1. Coated Bolt Sorting Using VGG16

CNN, a deep learning method, features many layers, and the learning results depend on various structures. We used the VGGNet model, which has a simple structure and has proven to be amenable for use in many CNN-related studies. Depending on the number of layers, VGGNet is categorized as VGG11, VGG13, VGG16, or VGG19, with the structures shown in Figure 4. By repeatedly applying the convoluted layers with featured image filtering techniques and pooling the layers that reduce image data sizes, the image data input was vectorized as fully connected layers, which were then normalized via an activation function (Figure 4). The Sigmoid activation function, which is expressed in zeros and ones, is generally used for binary classification, whereas the softmax function, which is expressed in figures between zero and one, is used for multiple classification. However, inspired by the results reported by Tammina [12], we used softmax as the activation function for binary classification (Equation (1)) to sort defective from non-defective products. The probability of the product falling into either of these product categories (p1, p2) is expressed between zero and one as the predicted value ( y ^ ).
softmax ( z ) = [ e z 1 j = 1 2 e z j e z 2 j = 1 2 e z j ] = [ p 1 , p 2 ] = y ^
The learning process was executed using the VGG16 structure with the learning data obtained via the method outlined in Section 2.1 and 2.2. Python 3.7 and TensorFlow 2.0 were used to identify the parameters for producing the best data learning results. The results were obtained by executing Python scripts on an NVIDIA DGX STATION (Future Automotive Intelligent Electronics Core Technology Center, Cheonan, Korea). The batch size was 32 and the number of epochs was 100. For learning and verification, 80% of all the data were used. The learning accuracy and loss function are shown in Figure 5. The learning result exhibited an accuracy of 97%.

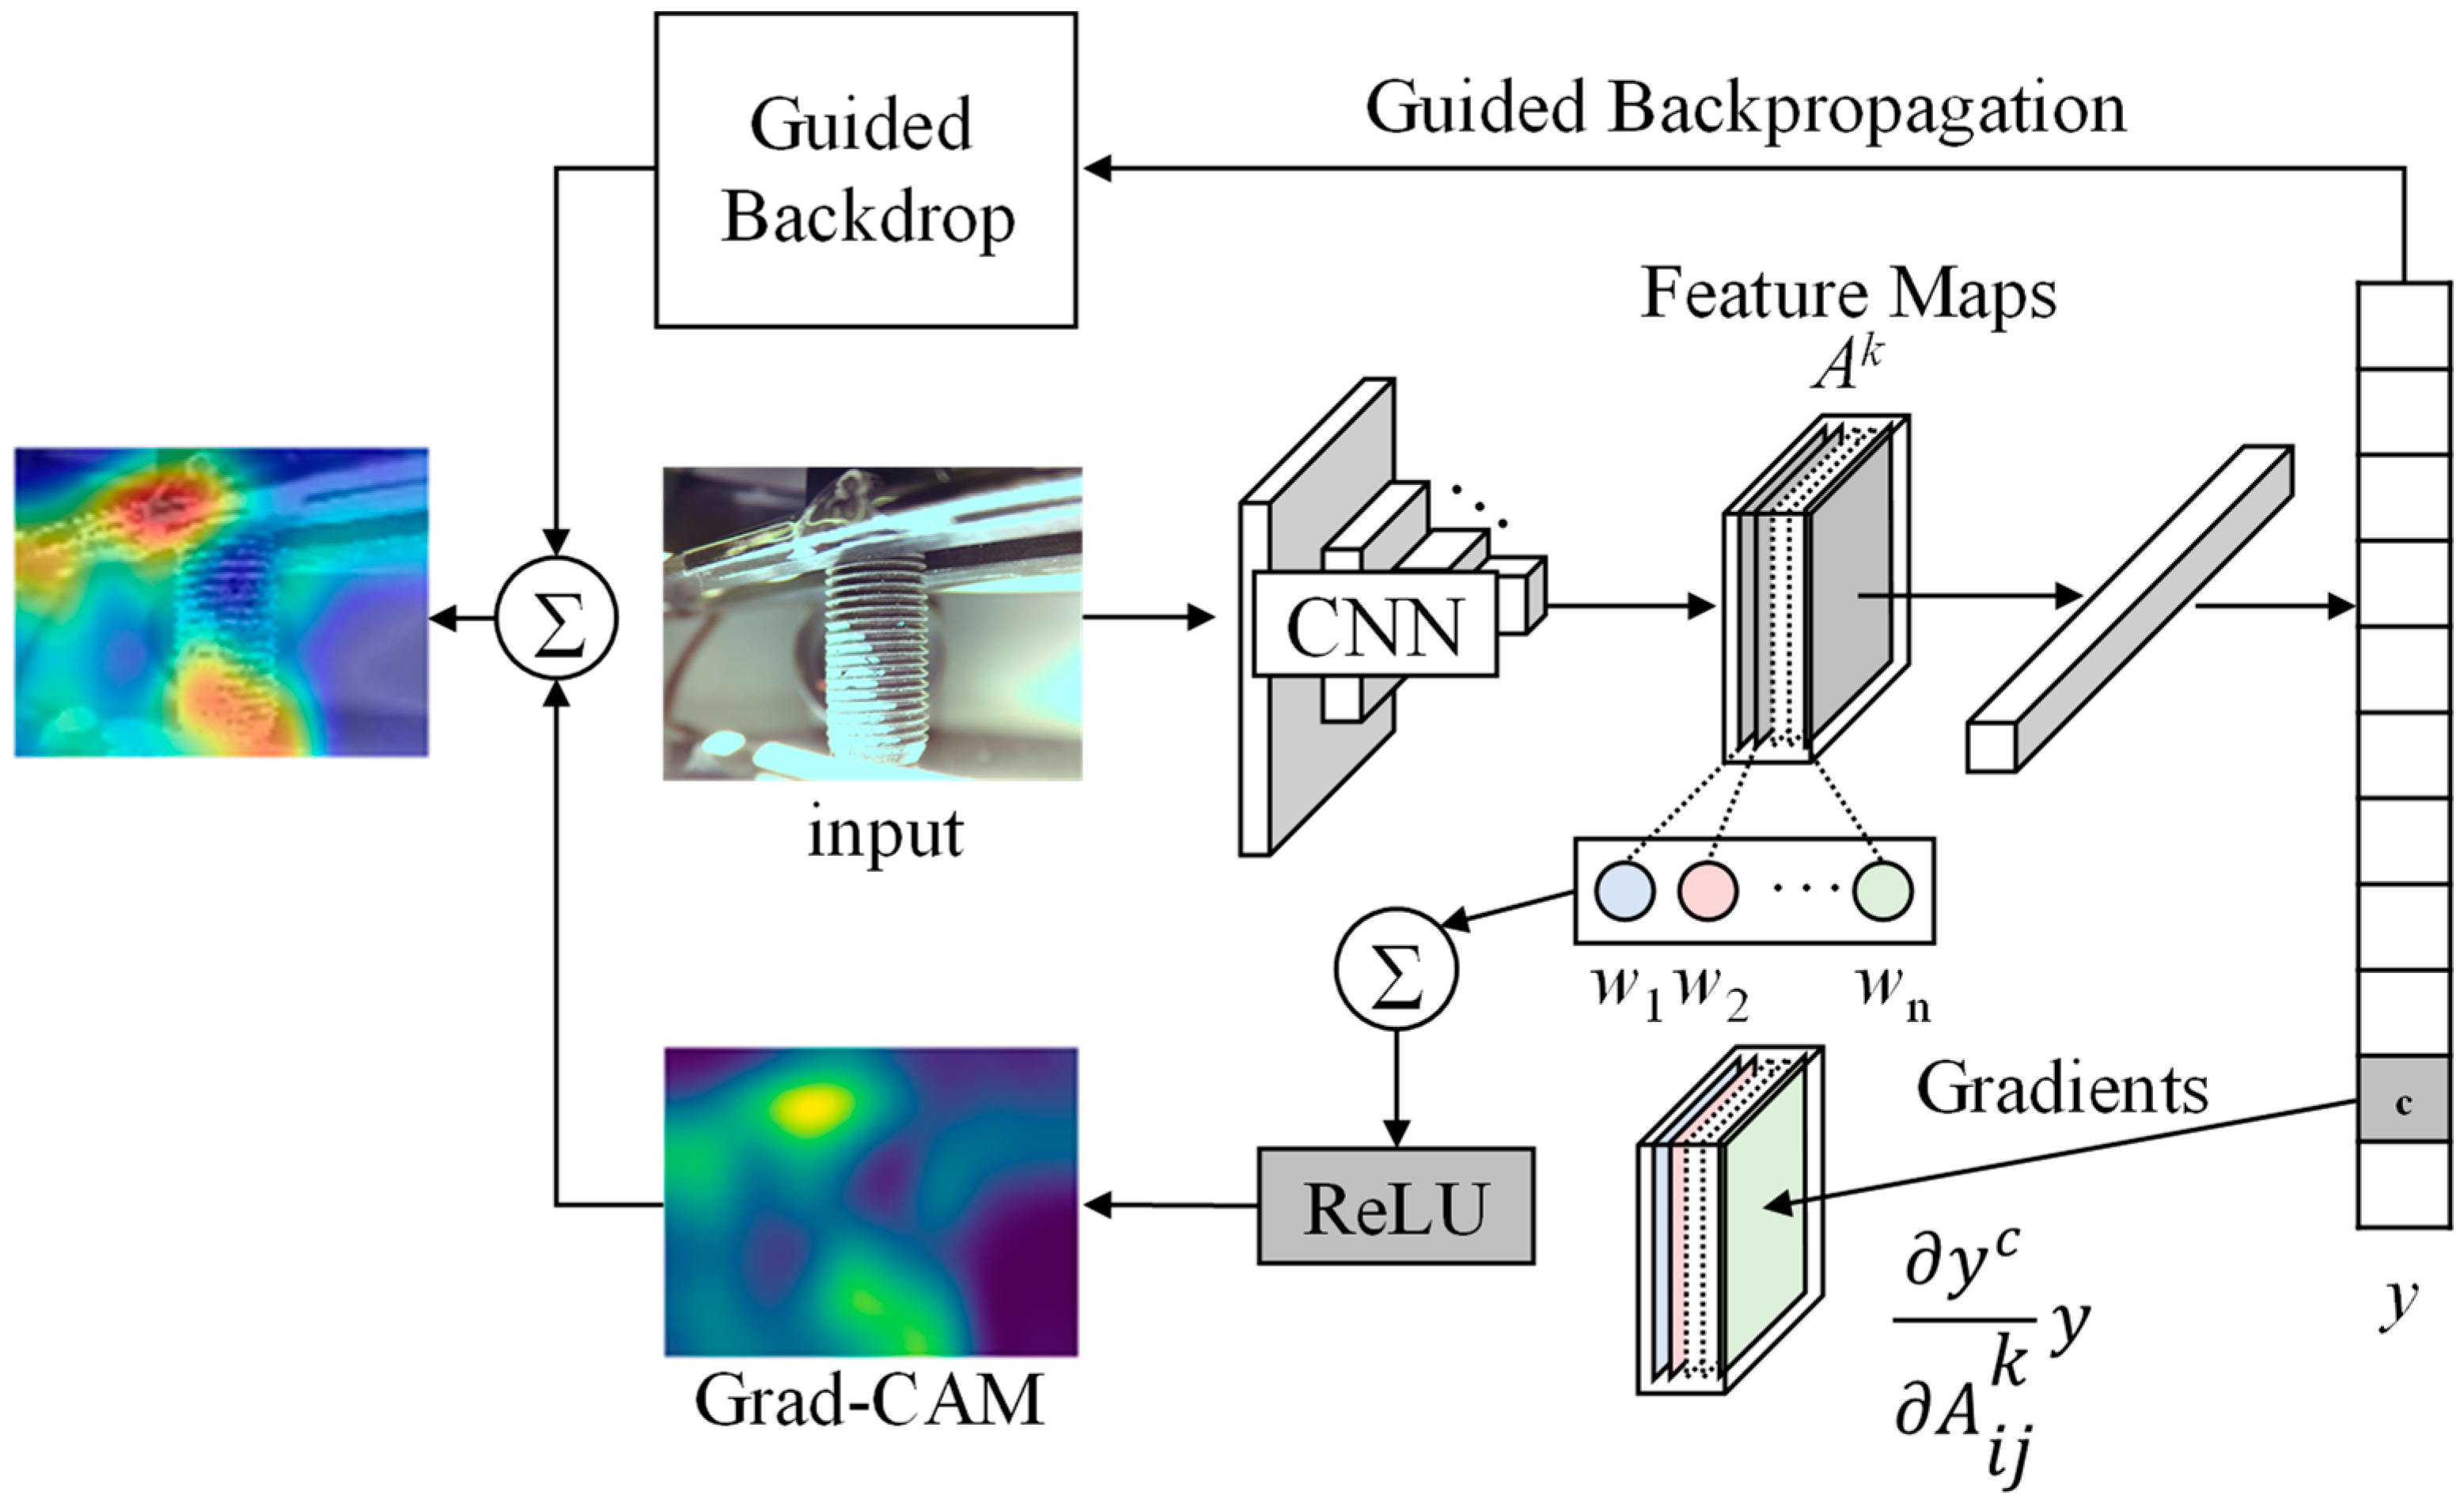
2.3.2. Visualization of Defective Area

Although the accuracy of the VGG16 structure was relatively high, it had difficulty checking the contents in the center and adjacent areas of the input image in the process of outputting it as a single output value. Therefore, a different technique was used to visualize the area, process the image identification, and develop the criteria for sorting defective products [13]. Lee et al. [14] constructed a deep learning-based model that detects defects on steel surfaces and verified the model’s reliability using the class activation map (CAM) [15] visualization technique. The VGG16 structure, employed in the current study as the learning model, uses fully connected layers as the classification layers. The loss of location information from applying a visualization technique can be prevented only by utilizing the global average pooling layer [16]. However, using a different classification layer makes it impossible to evaluate the reliability because the structure differs from the previous models. Therefore, we used the gradient-weighted class activation mapping (Grad-CAM) visualization method, which could be used without changing the structure for visualizing defects.
Grad-CAM [17] solves the backpropagation vanishing gradient problem [18] by partially differentiating y c for A i j k in row j of column i in Ak, the kth feature map of the last convoluted layer, as shown in Figure 6. Global average pooling was applied to the gradient results in Equation (2) to obtain the gradient a k c and the activation function ReLU, defined in Equation (3), was used to output zero or the input value based on the value entered. As shown in Equation (4), only values of zero or higher were expressed on the feature map to enable the identification of the areas.
a k c = 1 z i j y c A i j k
ReLU = max ( 0 , x )
L G r a d C A M c = ReLU ( k a k c A k )

3. Results

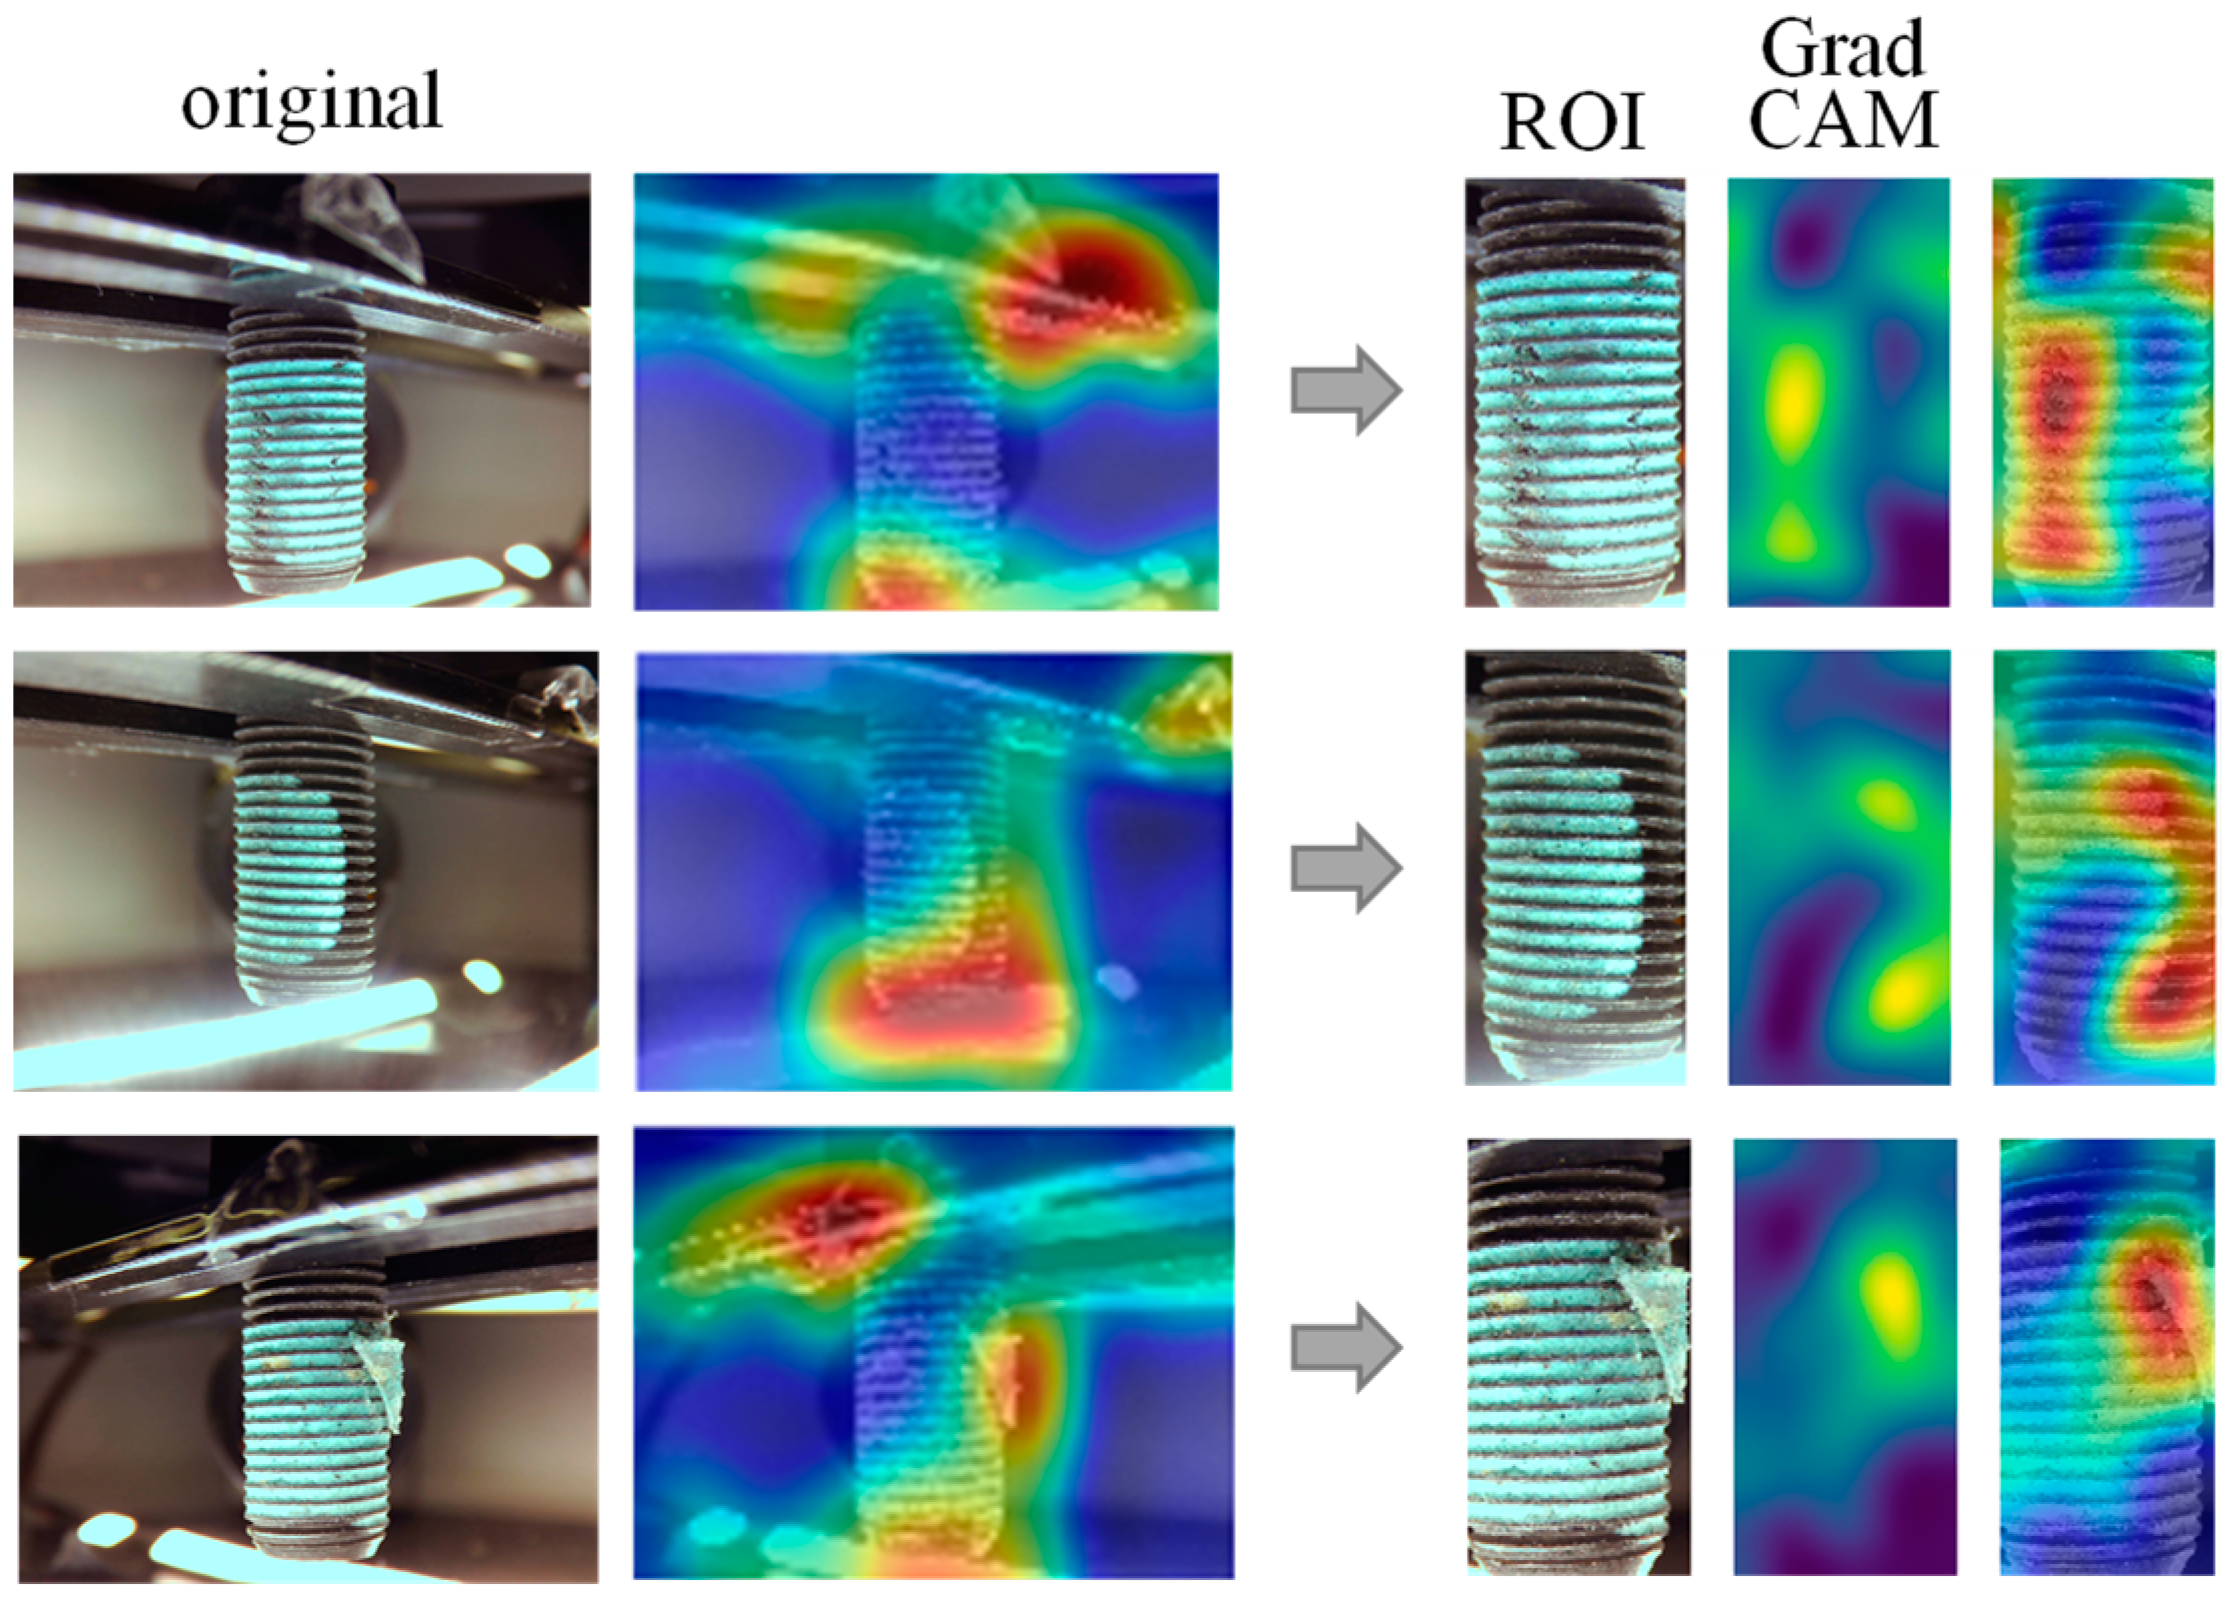
3.1. Grad-CAM Visualization Results

Figure 7 shows the Grad-CAM application results. In the figure, the blue colors indicate that the influence on the determination results decreased, and the red colors indicate that the influence on the determination results increased. As seen in the figure, background factors such as the lighting and the jig, and not the coating solution area, influence the determination results. Therefore, using only the coated area for determination, the input image data must be processed using filtering techniques.
The background of the image data includes the camera, the lighting, the jig, and other complex factors. Therefore, a complete separation was difficult despite many filtering techniques, such as binary conversion, morphology filtering, and Gaussian blur being applied. Consequently, we cropped only the coated areas using the very simple and effective region of interest (ROI) technique. The image size was 425 × 840 pixels, and the Python 3.7-based image processing library, OpenCV [19], was used.
The Grad-CAM visualization technique was used with the ROI-processed image as the input data for the learning process. The results indicated that 95% of the 66 defective product images in the test dataset had accurately identified defect locations. The remaining 5% featured small defect areas. In other cases, the defect areas were at either end of the bolt threads, the curvatures of which made identification difficult. In these cases, images taken from closer cameras would have the defects at their center, making it possible to classify the defects using the preset criteria. The learning accuracy remained at 97% as in the previous model; however, the reliability of the model increased (Figure 7).

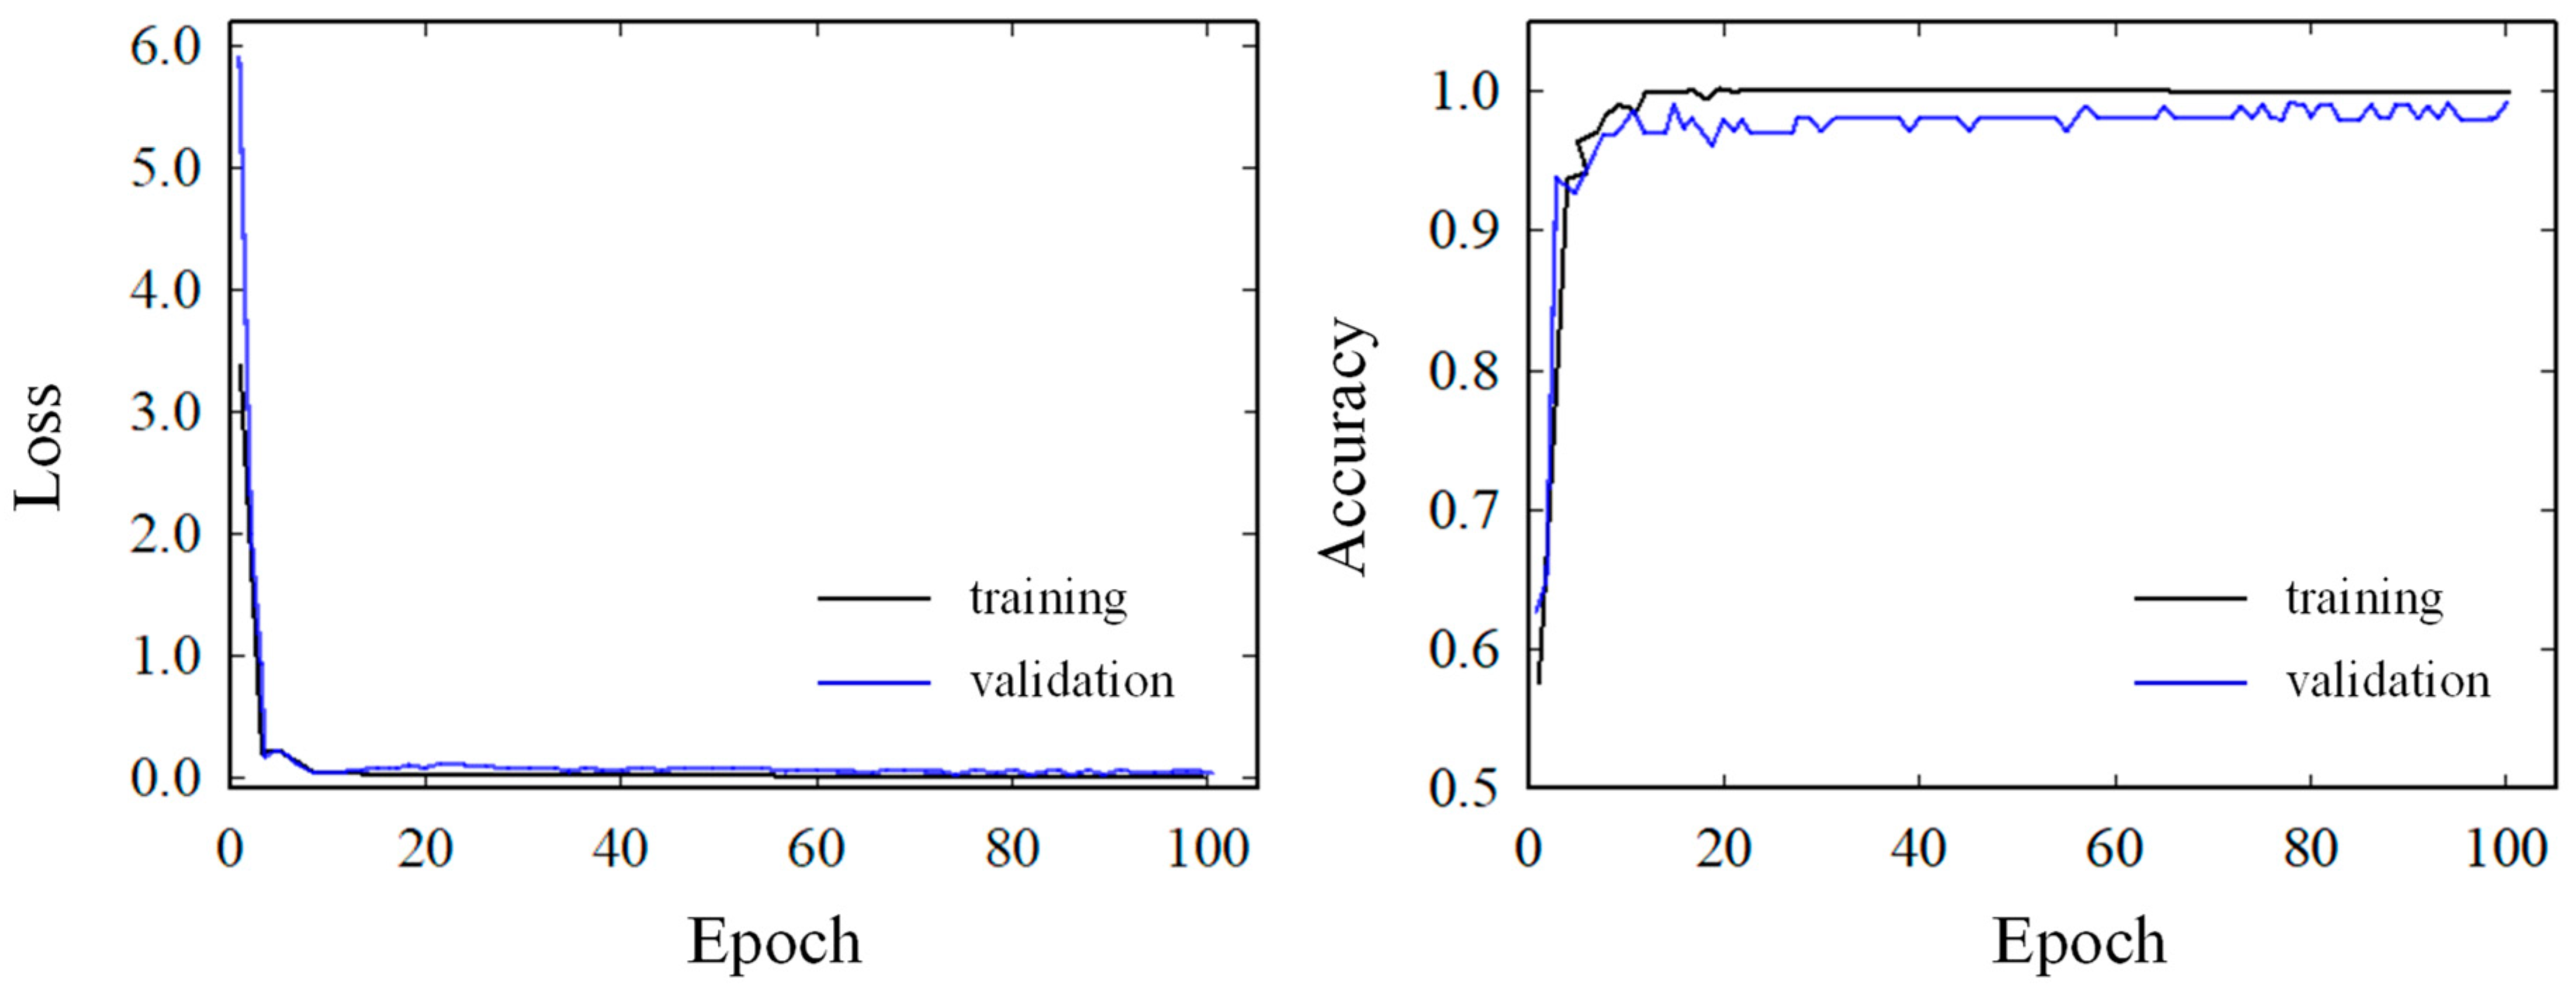
3.2. Transfer Learning

CNN is a deep learning technique that performs classification by identifying features or patterns. Larger datasets result in easier pattern and feature extraction, as well as high levels of accuracy. The coated bolts used in this study, however, had significantly lower defect data compared to non-defect data. Consequently, to achieve high detection performance from the limited sample data, we also applied a transfer learning algorithm [20]. Transfer learning is a method in which weighted values, previously learned using a specific large dataset, are applied to other target datasets to extract and classify certain features and patterns. As previously learned weighted values are used, the learning time is reduced and prediction accuracy is improved. ImageNet [21] and CIFAR [22] are examples of previously learned image datasets.
Although datasets related to coated bolt images do not exist, studies using datasets of manufactured goods defect classification [23] and medical devices [24] have reported that ImageNet could be applicable even though it is dissimilar. However, when using previously learned weighted values, similarities have to be considered and adjustments made to different situations to produce an accurate model. Considering that the dataset was small and the similarities with ImageNet were few for the coated bolts used in this study, the convoluted layer was frozen and only the classification layer was learned. For the classification layer, a fully connected layer was used to consider the VGG16 structure. The learning accuracy was 95%, which was lower than that of the previous model, however, the learning time was half that of the previous model.
As the data weights used in the current study differed, the accuracy could have been lower than when all the layers are learned. Accordingly, to improve the performance, blocks 1–4 were frozen, and the learning process for the last convoluted layer was conducted with the classification layer for fine tuning (Figure 4). In this instance, the learning rate was set at 0.0001; a stable learning speed was maintained through epoch 50, and the gradient was sufficient to prevent the weighted value from being disrupted. The accuracy of the learning model increased from 1% to 98%, and the performance of the model was evaluated using 132 data images.
Using the confusion matrix, frequently used as an evaluation index for models, results were inferred and then compared with the actual results to check the accuracy. True positive (TP) refers to cases in which the results inferred from the learning model align with the actual non-defective results; true negative (TN) refers to cases in which the learning model results align with the actual defective results. When the inferred results differed from the actual results, each case was either denoted false positive (FP) or false negative (FN). Based on the confusion matrix, Equations (5)–(7) were utilized to obtain the precision, recall, and F1-score [25], where the subscripts NG and OK denote defective and non-defective, respectively. Table 2 shows that an accuracy of 97% was achieved in the performance evaluation test.
P r e c i s i o n OK = T P T P + F P , P r e c i s i o n NG = F N F N + T N
R e c a l l OK = T P T P + F N , R e c a l l NG = T N F P + T N
F 1 s c o r e OK = 2 × P r e c i s i o n OK × R e c a l l OK P r e c i s i o n OK + R e c a l l OK , F 1 s c o r e NG = 2 × P r e c i s i o n NG × R e c a l l NG P r e c i s i o n NG + R e c a l l NG

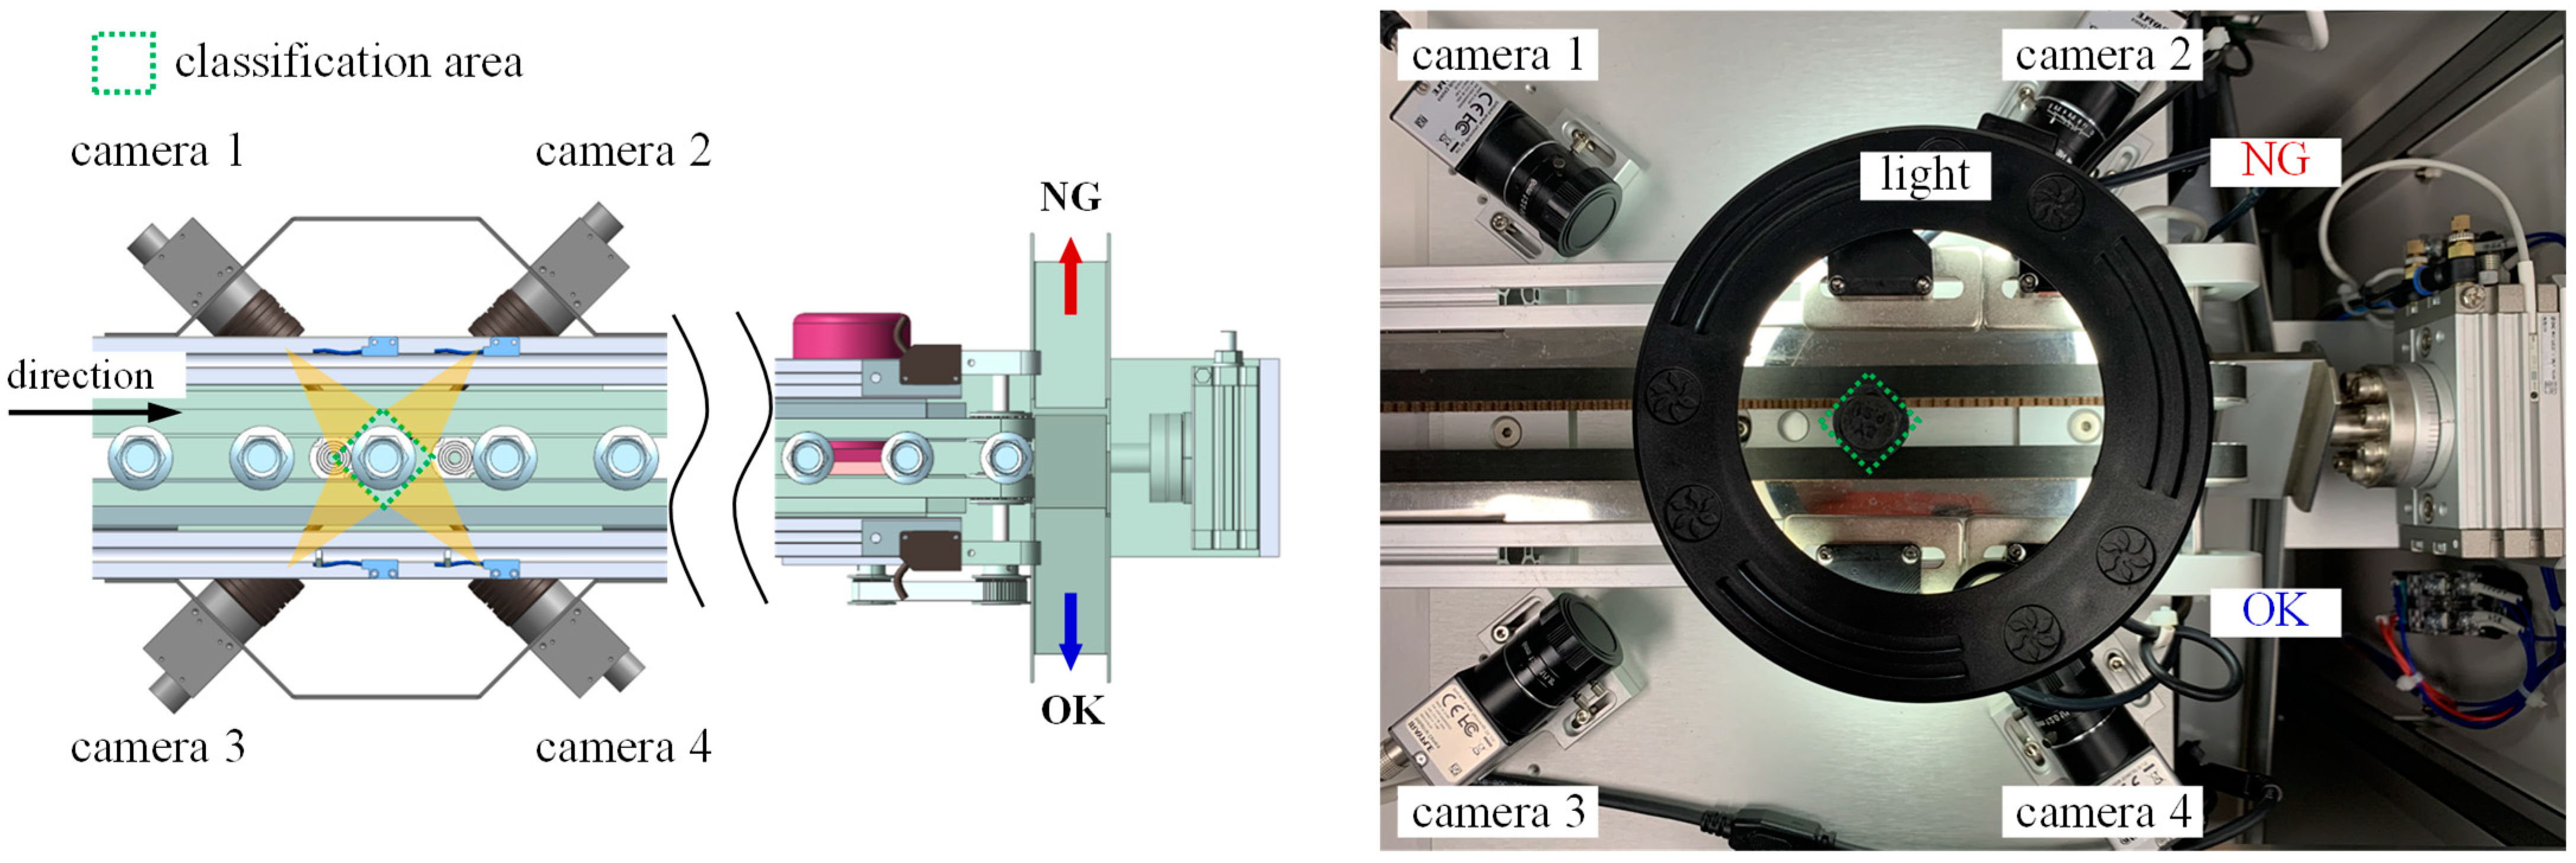
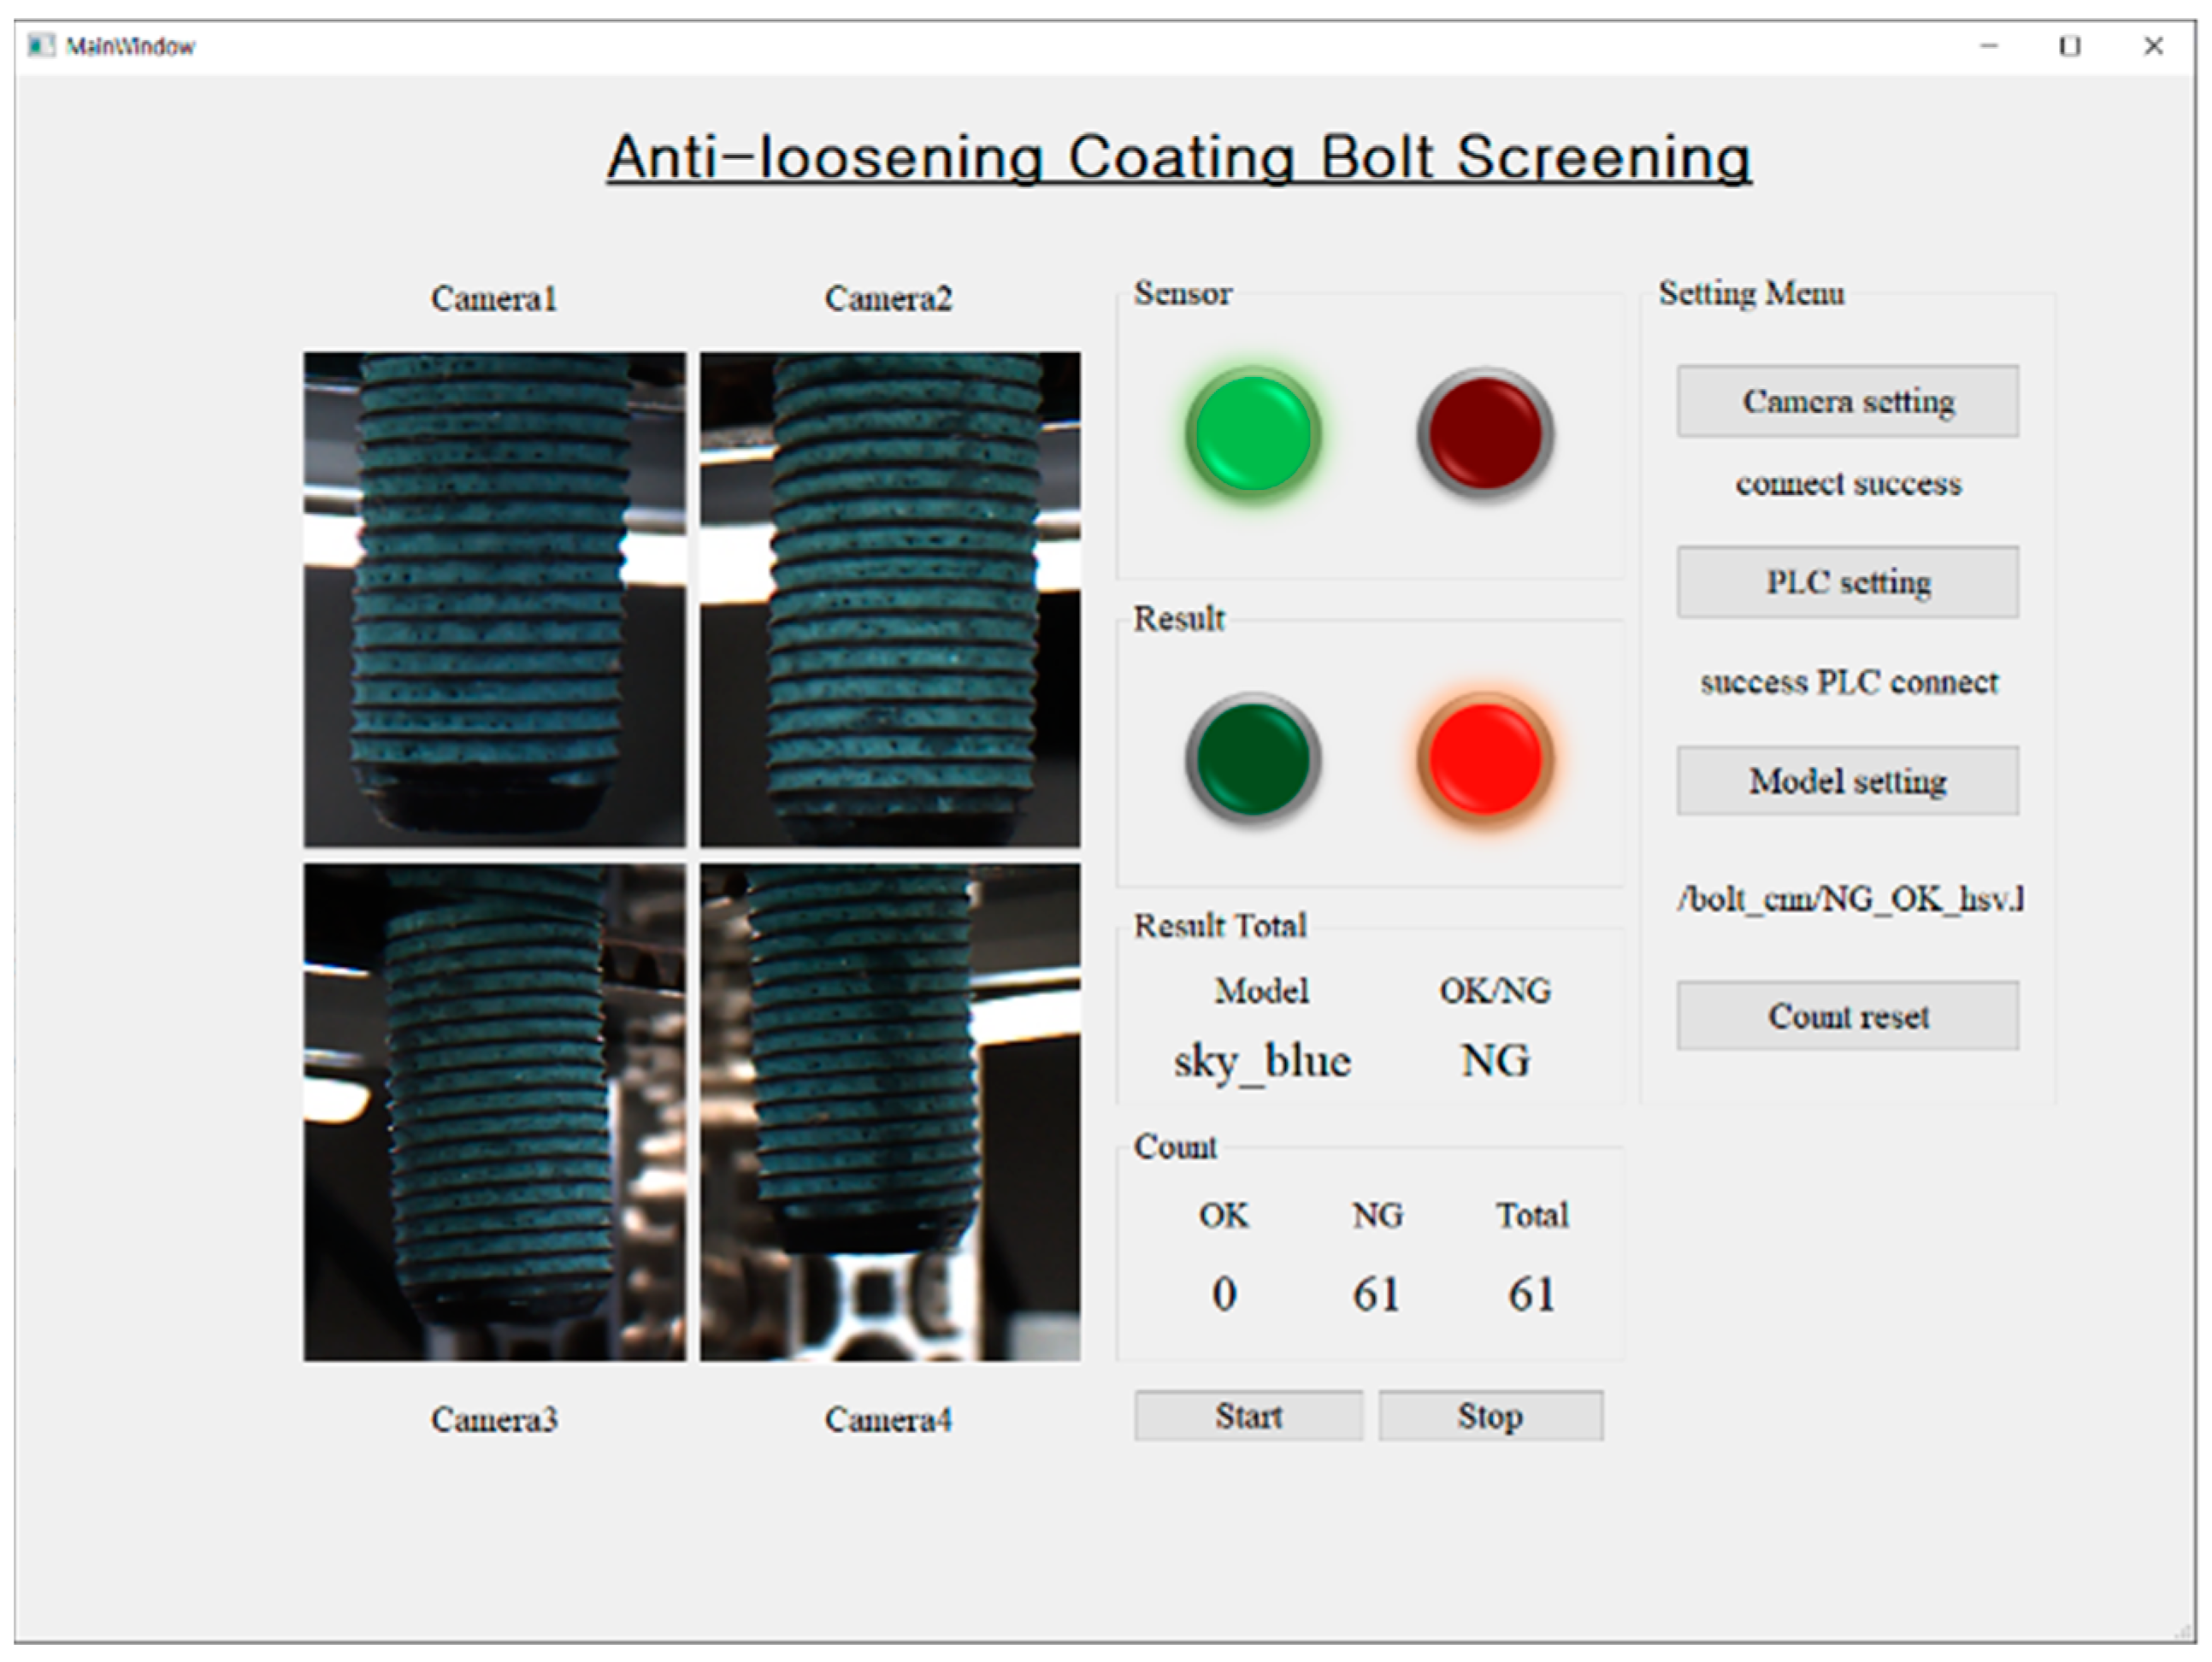
3.3. Verification Using Graphical User Interface (GUI) and Programmable Logic Controller (PLC)

The learning model, established using the visualization technique and transfer learning process, was implemented on the actual conveyor belt to sort the defective products, and the results were verified. As shown in Figure 8, the conveyor belt was composed of the input, the camera, and the sorting areas. The bolt heads were transported by the conveyor belt, and sensors were installed at certain locations to acquire images when the bolts were sensed. Conveyor belt transportation and stoppage, as well as the signal sensors input and output, were implemented by the logic configuration of XEC DR32H, a PLC product by LS Electric.
When the bolt, transported by the conveyor belt, approached the sensors, the cameras acquired images, which were then stored on a personal computer (PC) connected to the PLC. Once the image data were confirmed, the images from all the cameras were entered into the learned model to produce corresponding values. If the system determined that the product was defective, the Modbus TCP method was used to transmit the designated input value within the PLC. The PLC, in turn, used the input signals to operate the sorting mechanism and classify the products.
To help the user compare the real-time image with the resulting values, a GUI was configured, as shown in Figure 9, where “OK” and “NG” denote non-defective and defective products, respectively. Using the camera and PLC setting buttons, the connection was confirmed and, thereafter, the model setting button brought up the learning model. A start button triggered the sorting mechanism of the coated bolts. The sensor values were obtained while the bolts were being transported via the conveyor belt; images from the four cameras were obtained as shown in Figure 9, and the sorting results were produced within 0.9 s. Through this process, the previously learned model was verified; the system was proven to be applicable to actual environments. This system could make the sorting process for bolts of varying colors and sizes more efficient.

4. Conclusions

This paper presented a visualization technique and transfer learning model for sorting anti-loosening coated bolts using deep learning technology. The conclusions of the study are as follows:
(1)
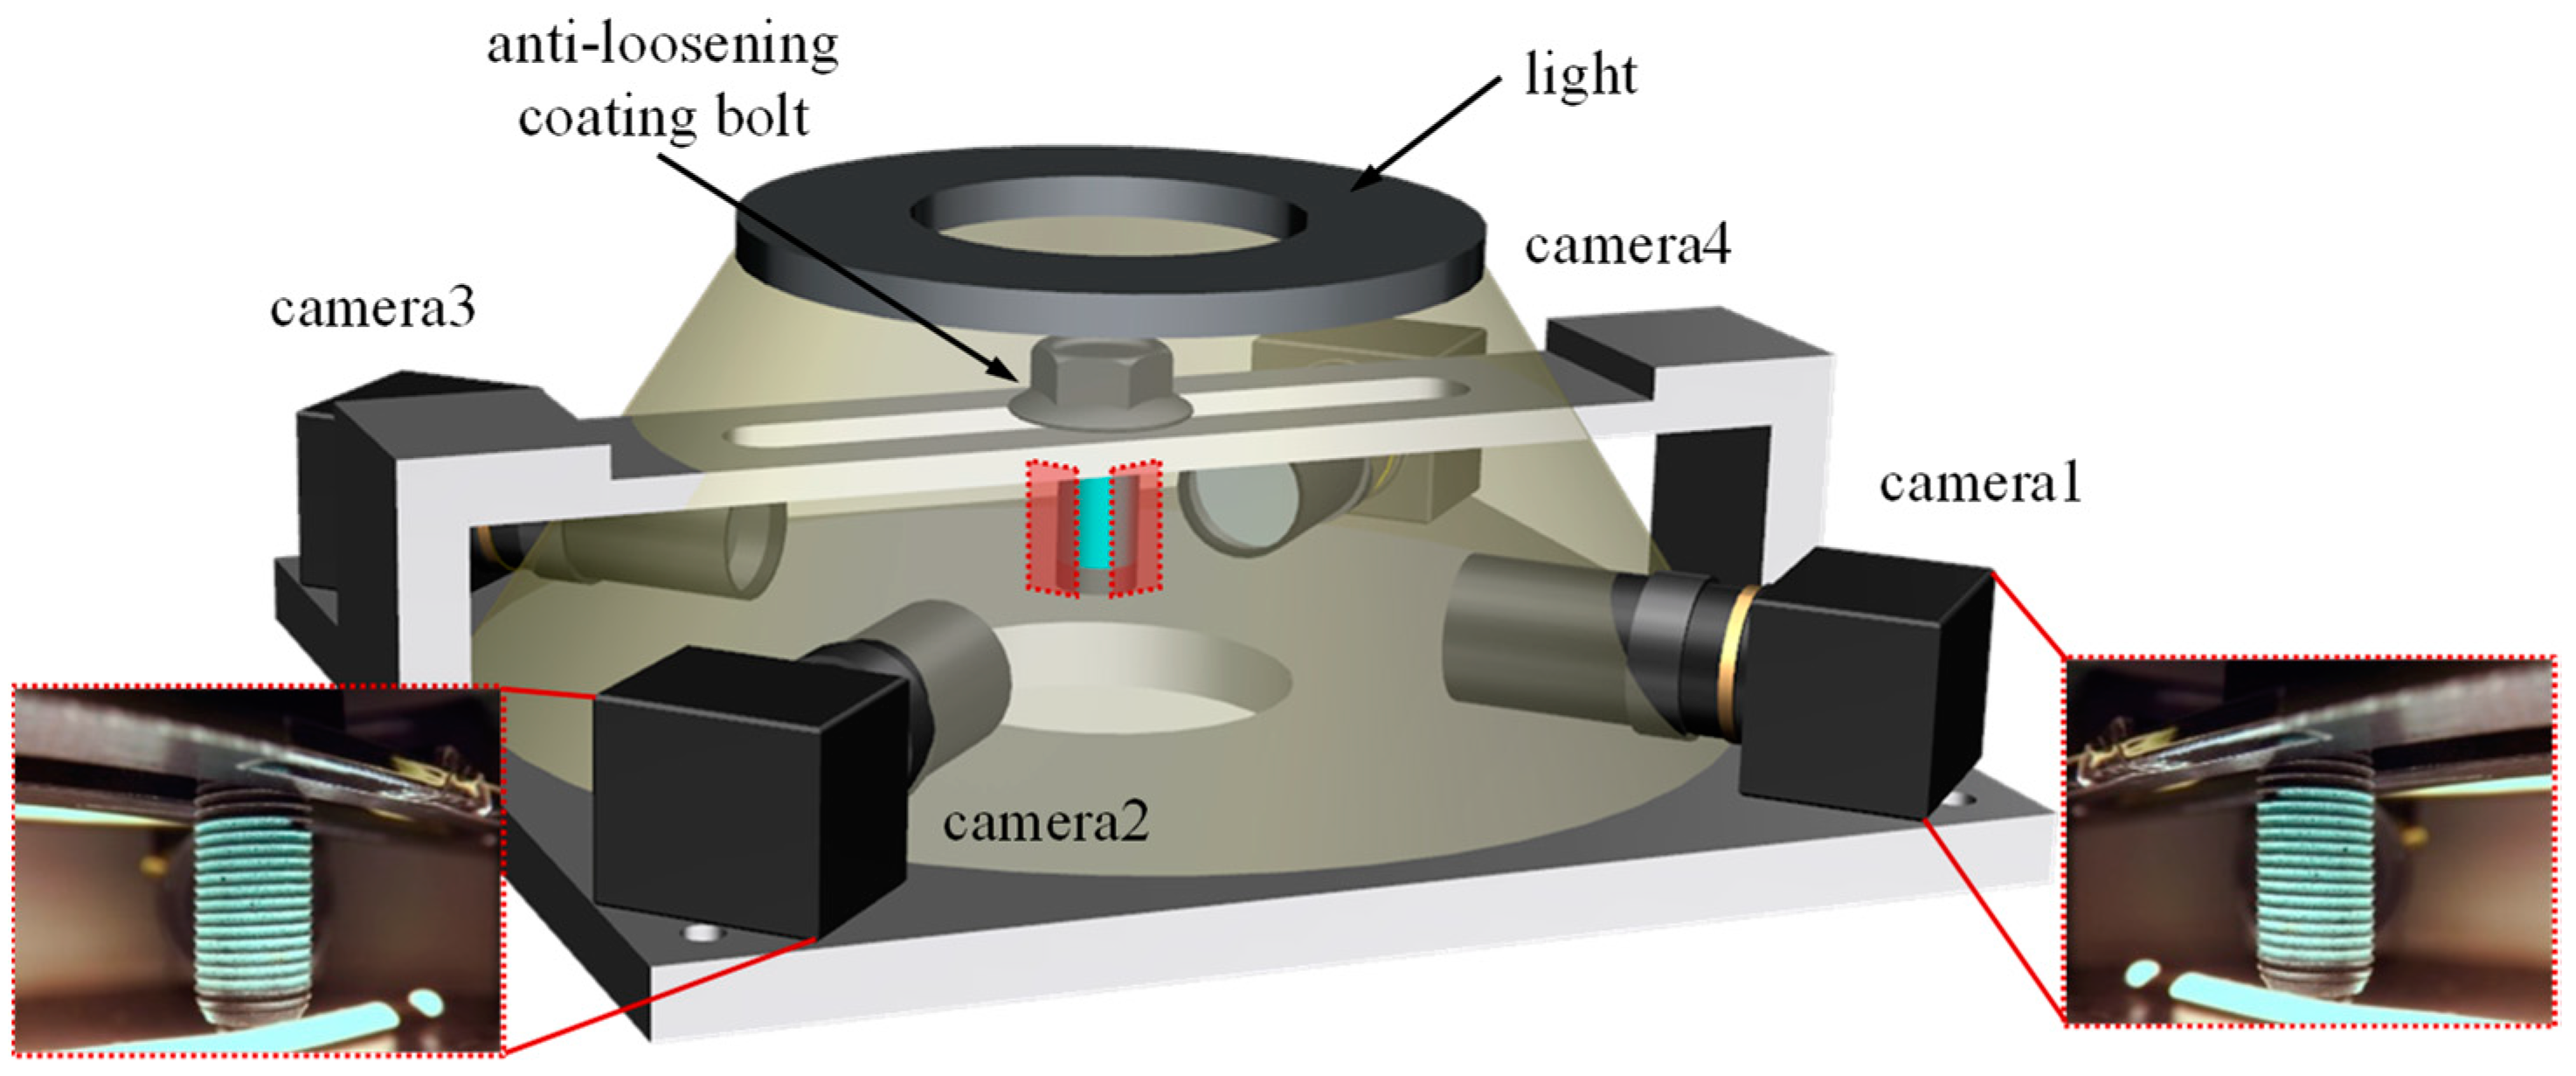
Four cameras were used to photograph the entire area of the bolt, and the lighting was set above the bolt such that the coating color could be seen evenly. A jig was used to fix the camera and lighting, and thereby, provide a shooting environment. Using preset defect criteria, the data were binarily classified to configure an image dataset for the learning process.
(2)
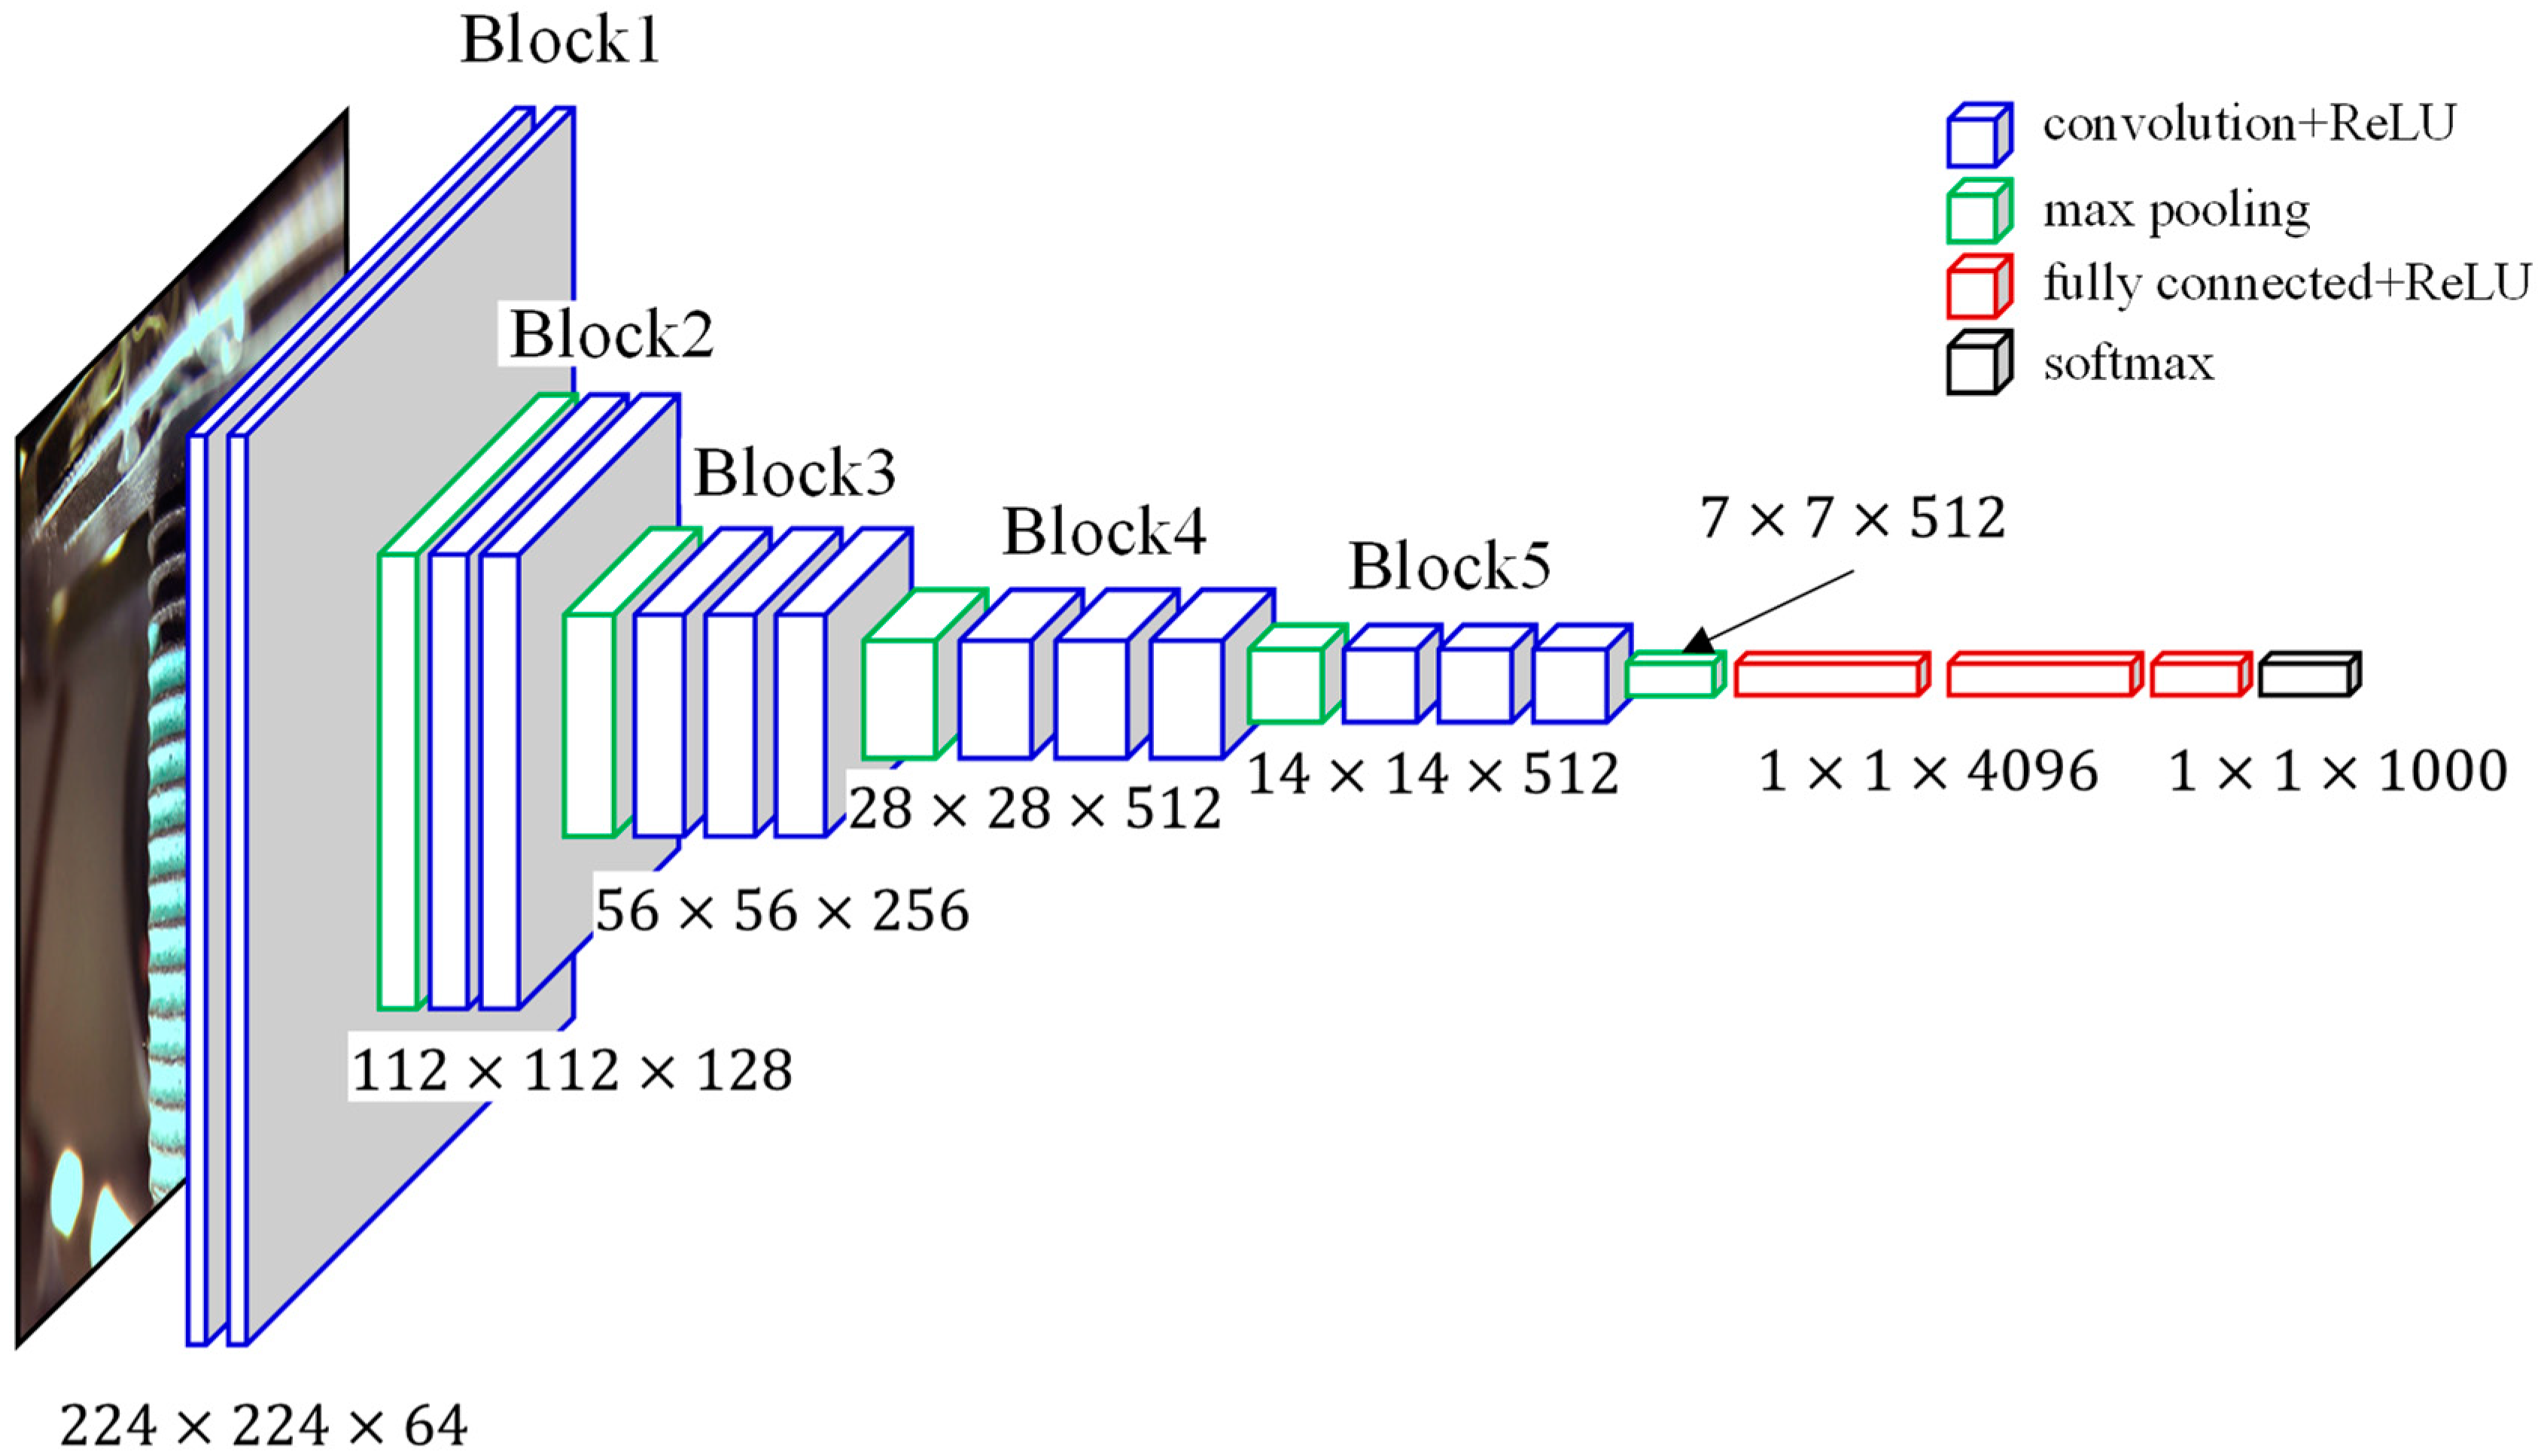
The acquired images were used as input data for the learning process through the CNN VGG16 structure. The accuracy of the coated bolt sorting model was 97%. The CNN VGG16 gradually reduced the pixel values for vectorization; however, location information was lost, making it impossible to determine the standards that the model used to classify the images. Therefore, a visualization technique was used to verify the reliability of the model.
(3)
Owing to the shortcomings of the visualization technique, in which the classification layer had to be converted to global average pooling, Grad-CAM was used for supplementation. This allowed the visualization of learning images without changing the VGG16′s structure. The results indicated that the previously input images were classified based on external factors such as the jigs and cameras, in addition to the bolt thread coating area. Hence, the ROI technique was used to designate the bolt thread as the only area of interest used as input data. The classification proved to be conducted based on the defect location on the bolt thread area, as well as other criteria.
(4)
The anti-loosening coated bolts used in the current study posed a problem due to limited sample sizes, although larger data sizes would lead to longer learning times. Therefore, to reduce the learning time and improve the model performance, the transfer learning technique was also utilized. Using the weighted values learned using the ImageNet big dataset, the model was taught such that only Block 5 and the classification layer would be appropriate for the coated bolt dataset. The subsequent fine tuning resulted in a model accuracy rate of 98%.
(5)
To demonstrate that the coated bolt sorting model is applicable to the actual sorting process, input sensors, motors, and cameras were connected to a conveyor belt via a PLC device and the logic configured. The images acquired by the cameras were put through the coated bolt sorting model to identify defective and non-defective products. The values were transmitted using the Modbus TCP method between the PLC and a PC, thereby proving that the model is applicable to the actual sorting process.

Author Contributions

Conceptualization, S.H.; methodology, S.H. and E.N.; software, E.N.; validation, E.N.; investigation, E.N.; writing—original draft preparation, E.N.; writing—review and editing, S.H.; visualization, E.N.; supervision, S.H.; project administration, S.H. All authors have read and agreed to the published version of the manuscript.

Funding

This research was funded by “Regional Innovation Strategy (RIS)” through the National Research Foundation of Korea (NRF) funded by the Ministry of Education (MOE) (2021RIS-004).

Institutional Review Board Statement

Not applicable.

Informed Consent Statement

Not applicable.

Data Availability Statement

Not applicable.

Conflicts of Interest

The authors declare no conflict of interest. The sponsors had no role in the design, execution, interpretation, or writing of the study.

References

  1. Jia, H.; Murphey, Y.L.; Shi, J.; Chang, T.S. An intelligent real-time vision system for surface defect detection. In Proceedings of the 17th International Conference on Pattern Recognition, ICPR 2004, Cambridge, UK, 26 August 2004. [Google Scholar]
  2. Ha, M.; Park, T. CCM Defect Classification System Based on Machine Learning for Smart Factory. Trans. Korean Inst. Electr. Eng. 2020, 46, 64–70. [Google Scholar] [CrossRef]
  3. Brili, N.; Ficko, M.; Klancnik, S. Automatic Identification of Tool Wear Based on Thermography and a Convolutional Neural Network during the Turning Process. Sensors. 2021, 21, 1917. [Google Scholar] [CrossRef] [PubMed]
  4. Yang, Y.; Lou, Y.; Gao, M.; Ma, G. An automatic aperture detection system for LED cup based on machine vision. Multimed. Tools Appl. 2018, 77, 23227–23244. [Google Scholar] [CrossRef]
  5. Song, L.; Li, X.; Yang, Y.; Zhu, X.; Guo, Q.; Yang, H. Detection of micro-defects on metal screw surfaces based on deep convolutional neural networks. Sensors. 2018, 18, 3709. [Google Scholar] [CrossRef] [PubMed] [Green Version]
  6. Wei, P.; Liu, C.; Liu, M.; Gao, Y.; Liu, H. CNN-based reference comparison method for classifying bare PCB defects. J. Eng. 2018, 2018, 1528–1533. [Google Scholar] [CrossRef]
  7. Wei, X.; Yang, Z.; Liu, Y.; Wei, D.; Jia, L.; Li, Y. Railway track fastener defect detection based on image processing and deep learning techniques: A comparative study. Eng. Appl. Artif. Intell. 2019, 80, 66–81. [Google Scholar] [CrossRef]
  8. Wang, J.; Fu, P.; Gao, R.X. Machine vision intelligence for product defect inspection based on deep learning and Hough transform. J. Manuf. Syst. 2019, 51, 52–60. [Google Scholar] [CrossRef]
  9. Yang, J.; Li, S.; Wang, Z.; Yang, G. Real-Time Tiny Part Defect Detection System in Manufacturing Using Deep Learning. IEEE Access 2019, 7, 89278–89291. [Google Scholar] [CrossRef]
  10. Choi, H.; Seo, K. Comparison of CNN Structures for Detection of Surface Defects. Trans. Korean Inst. Electr. Eng. 2017, 66, 1100–1104. [Google Scholar]
  11. Malarvel, M.; Singh, H. An autonomous technique for weld defects detection and classification using multi-class support vector machine in X-radiography image. Optik 2021, 231, 166342. [Google Scholar] [CrossRef]
  12. Tammina, S. Transfer learning using VGG-16 with Deep Convolutional Neural Network for Classifying Images. Int. J. Sci. Res. Publ. 2019, 9, 143–150. [Google Scholar] [CrossRef]
  13. Noh, E.; Yi, S.; Hong, S. Binary classification of bolts with anti-loosening coating using transfer learning-based CNN. J. Korean Acad. Ind. Coop. Soc. 2021, 2, 651–658. [Google Scholar]
  14. Lee, S.Y.; Tama, B.A.; Moon, S.J.; Lee, S. Steel Surface Defect Diagnostics Using Deep Convolutional Neural Network and Class Activation map. Appl. Sci. 2019, 9, 5449. [Google Scholar] [CrossRef] [Green Version]
  15. Zhou, B.; Khosla, A.; Oliva, A.; Torralba, A. Learning Deep Features for Discriminative Localization. In Proceedings of the IEEE Conference on Computer Vision and Pattern Recognition, Seattle, WA, USA, 27–30 June 2016; pp. 2921–2929. [Google Scholar]
  16. Lin, M.; Chen, Q.; Yan, S. Network in network. arXiv 2013, arXiv:1312.4400. [Google Scholar]
  17. Selvaraju, R.R.; Cogswell, M.; Das, A.; Vedantam, R.; Parikh, D.; Batra, D. Grad-CAM: Visual Explanations from Deep Networks via Gradient-Based Localization. In Proceedings of the IEEE International Conference of Computer Vision (ICCV), Venice, Italy, 22–29 October 2017; pp. 618–626. [Google Scholar]
  18. Springenberg, J.T.; Dosovitskiy, A.; Brox, T.; Riedmiller, M. Striving for simplicity: The all convolutional net. arXiv 2014, arXiv:1412.6806. [Google Scholar]
  19. Bradski, G.; Kaehler, A. Learning OpenCV: Computer Vision with the OpenCV Library; O’Reilly Media, Inc.: Sebastopol, CA, USA, 2008. [Google Scholar]
  20. Noh, E.; Yi, S.; Kim, M.; Hong, S. Identification of Bolt Coating Defects Using CNN and Grad-CAM. Trans. Korean Soc. Mech. Eng. A 2021, 44, 835–842. [Google Scholar] [CrossRef]
  21. Deng, J.; Dong, W.; Socher, R.; Li, L.J.; Li, K.; Fei-Fei, L. Imagenet: A large-scale hierarchical image database. In Proceedings of the 2009 IEEE Conference on Computer Vision and Pattern Recognition, Miami, FL, USA, 20–25 June 2009; pp. 248–255. [Google Scholar]
  22. Krizhevsky, A.; Hinton, G. Learning Multiple Layers of Features from Tiny Images. Available online: https://www.semanticscholar.org/paper/Learning-Multiple-Layers-of-Features-from-Tiny-Krizhevsky/5d90f06bb70a0a3dced62413346235c02b1aa086 (accessed on 28 December 2021).
  23. Kim, N.K.; Lee, J.W.; Kim, J.I.; Hong, S.H. Exotic Plants Classification Using the Transfer Learning. In Proceedings of the Autumn Annual Conference of IEIE, Incheon, Korea, 23–24 November 2018; pp. 477–480. [Google Scholar]
  24. Shin, H.; Roth, H.R.; Gao, M.; Lu, L.; Xu, Z.; Nogues, I.; Yao, J.; Mollura, D.J.; Summers, R.M. Deep Convolutional Neural Networks for Computer-Aided Detection: CNN Architectures, Dataset Characteristics and Transfer Learning. IEEE Trans. Med. Image 2016, 35, 1285–1298. [Google Scholar] [CrossRef] [PubMed] [Green Version]
  25. Sokolova, M.; Japkowicz, N.; Szpakowicz, S. Beyond accuracy, F-score and ROC: A family of discriminant measures for performance evaluation. In Proceedings of the Australasian Joint Conference on Artificial Intelligence, Auckland, New Zealand, 1–5 December 2008; Springer: Berlin/Heidelberg, Germany, 2008; pp. 1015–1021. [Google Scholar]
Figure 1. Automotive parts fastening with anti-loosening coated bolts.
Applsci 12 02029 g001
Figure 2. Defect classification criteria of coated bolts.
Applsci 12 02029 g002
Figure 3. The data capture method.
Applsci 12 02029 g003
Figure 4. VGG16 structure.
Applsci 12 02029 g004
Figure 5. Accuracy according to epoch.
Applsci 12 02029 g005
Figure 6. Visualization by Grad-CAM and CNN.
Applsci 12 02029 g006
Figure 7. Visualization using Grad-CAM (left) and improved defect detection using the ROI method (right).
Applsci 12 02029 g007
Figure 8. System for inspecting bolt coating defects and sorting. NG, defective; OK, non-defective.
Applsci 12 02029 g008
Figure 9. GUI for anti-loosening coating bolt screening. NG, defective product; OK, non-defective product.
Applsci 12 02029 g009
Table 1. Camera specifications.
AttributeSpecification
Resolution600 LW/PH
Minimal illumination0.5 Lux
Focal length5–50 mm
Active array size3264 × 2448
Table 2. Validation results of algorithm for screening coating defects.
PrecisionRecallF1-ScoreSupport
Defective (NG)0.960.980.9766
Non-defective (OK)0.980.950.9766
Publisher’s Note: MDPI stays neutral with regard to jurisdictional claims in published maps and institutional affiliations.

