Article

Analysis of Horizontal Earth Pressure Acting on Box Culverts through Centrifuge Model Test

1
Department of Civil and Environmental Engineering, Incheon National University, 119, Academy-ro, Yeonsu-Gu, Incheon 22012, Korea
2
Department of Artificial Intelligence, Hannam University, 70, Hannam-ro, Daedeok-gu, Daejeon 34430, Korea
*
Author to whom correspondence should be addressed.
Appl. Sci. 2022, 12(4), 1993; https://doi.org/10.3390/app12041993
Submission received: 11 January 2022 / Revised: 7 February 2022 / Accepted: 11 February 2022 / Published: 14 February 2022
(This article belongs to the Special Issue Advances in Geotechnologies in Infrastructure Engineering)

Abstract

:
Underground space is being utilized due to the saturation of surface ground. The box culvert, as a representative infrastructure that has moved underground, is installed to protect such fixtures as electricity and gas. Because buried box culverts are necessarily affected by soil, it is important to study the earth pressure according to soil type. Herein, the horizontal earth pressure of the buried box culvert was analyzed. Accordingly, a precisely simulated centrifuge model test was performed. Additionally, the coefficient of earth pressure was analyzed. The results had significant variability because, in the existing theory, the horizontal earth pressure acting on the side of the box culvert was only calculated using the coefficient of earth pressure and the friction angle of the soil. Therefore, a correction factor was deemed necessary for calculating the horizontal earth pressure acting on the side of the box culvert.

1. Introduction

Due to the saturation of surface space, underground space is garnering increasing interest. Moreover, because some infrastructures do not need to be on surface space, they are being moved to the underground space [1]. A box culvert, a representative buried infrastructure, has a hollow cubic, trapezoidal, or circular, etc., interior. As an important non-transportation infrastructure, it is installed underground for electricity, gas, water, telecommunications, and sewage services. Thus, it can improve urban aesthetics, preserve road structures, and smooth traffic flow [2].
In contrast to when designing surface structures, soil needs to be considered when designing buried structures [3,4]. Unlike structural and traffic loads that act on the ground surface, the self-weight of the soil is imposed on buried structures. Moreover, this varies greatly due to the numerous small particles. The earth pressure acting on the box culvert is an essential consideration in the design process, in addition to the load (live and dead). Therefore, it has been extensively investigated, and the vertical earth pressure is the most active field of research [5,6,7,8,9,10]. The latter is prominently featured in the soil–structure interaction proposed in AASHTO [11]. Moreover, how the vertical earth pressure is affected by other parameters (gravitational acceleration and cover depth) was investigated in a follow-up study [12].
In contrast, there are relatively few studies on the horizontal earth pressure, which is often simply obtained from the coefficient of earth pressure and unit weight of soil. However, references [13,14] showed that the horizontal earth pressure depends on the measurement location (edge or plane), even for the same box culvert, as a result of the thickness of the box culvert. Chen et al. [15] calculated the side friction force through numerical analysis, which yielded a larger value than that from existing equations. Thus, the horizontal earth pressure does not necessarily agree with the theoretical value, and the difference is attributable to ground variability.
Therefore, we focused on the horizontal earth pressure as well as the coefficient of earth pressure in this study. Similar to existing experimental methods, repeated centrifuge model tests were performed to measure horizontal earth pressure. The centrifuge model test is an experimental method that simulates the deformation or stress generated in the actual size by applying the gravitational acceleration to the reduced model because it is difficult to experiment with the actual size of the structure. Many studies have been conducted on box culverts through the centrifuge model test, however, although uncertainty about soil inherent uncertainty and measurement error is predicted, it is not taken into consideration [16,17,18].
In this study, the ground was prepared through sand pluviation using a sand funnel, and the loading and unloading conditions under gravitational acceleration were simulated. Data were collected from the top, middle, and bottom of the side of box culvert, and the variation in the horizontal earth pressure was analyzed using experimental variables (gravitational acceleration, loading and unloading conditions, cover depths, and location of measured sensors). In addition, the coefficient of earth pressure was calculated from the theoretical value of vertical earth pressure and the self-weight of soil; its variation was also analyzed.

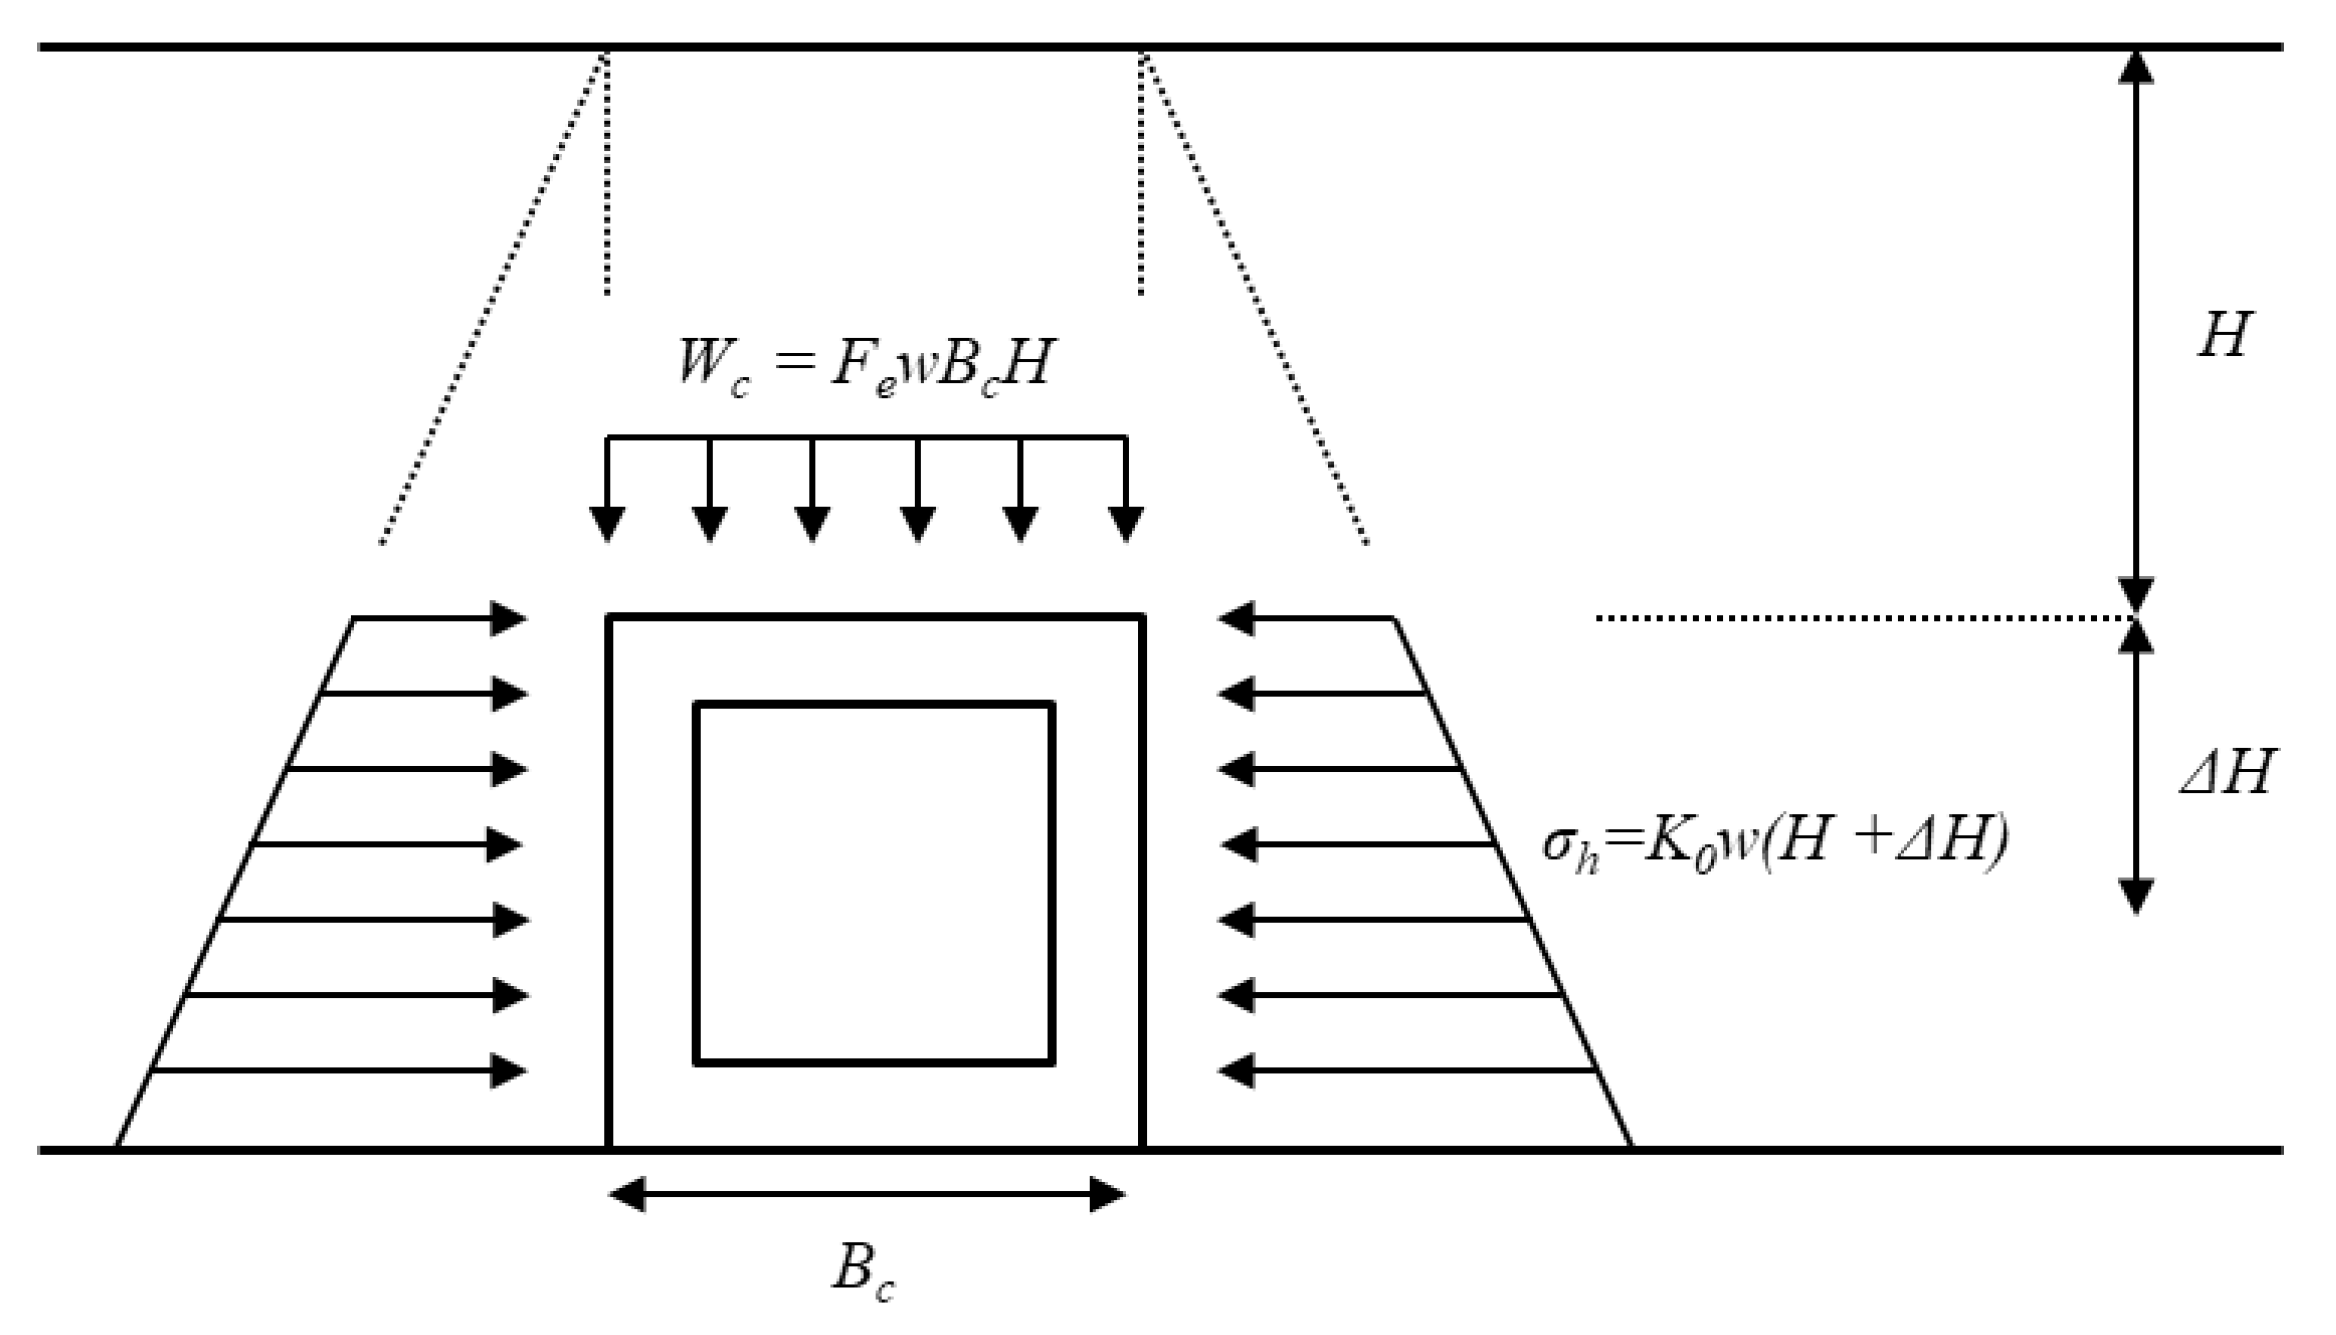
2. Horizontal Earth Pressure Acting on Box Culverts

In general, the earth pressure acting on the box culvert buried in the ground can be divided into vertical and horizontal components. According to AASHTO [11], the vertical soil pressure acting on the box culvert is multiplied by the height (H) and unit weight (w) of the soil at the top of the box culvert, and a correction factor (Fe) is applied to account for the soil–structure interaction. Fe is dependent on the installation conditions of the box culvert (trench or embankment installation).
On the other hand, horizontal earth pressure does not have a separate correction factor, such as Fe, and can be obtained from the depth (H + ΔH), unit weight (w), and coefficient of earth pressure at rest (K0). Here, the coefficient of earth pressure at rest and the unit weight are constants, and the horizontal earth pressure has a triangular profile, as shown in Figure 1. That is, in the case of the same soil, the horizontal earth pressure acts linearly from zero on the ground surface and is evaluated only with the self-weight of soil and K0 as constant because it is generally assusumed that there is no friction between the side wall of box culvert and the soil.
Many laboratory and field studies have been conducted on compressive induced stresses and strains over the past 50 years [19]. However, data sensors that read compressive force, such as earth pressure gauges, have limited value because measurement is complicated by various factors. Properly installing the pressure cell is important for the entire measurement process. Earth pressure measurements are divided into (1) soil mass measurements and (2) measurements of the structural element face.
The first measurement method suffers from errors due to poor fit because the presence of the cell and the installation method usually produce significant changes in the free-field stress. Because the second method is unaffected by most errors related to measurements in the soil mass, it can measure the earth pressure on the face of a structural element more accurately than the first method. However, this method may suffer from systematic errors.
Seed et al. [20] presented two potential systematic errors, as shown in Figure 2, assuming that the earth pressure was systematically measured. Earth pressure gauges protruding from the wall are typically much less compressible than the soil around the sensor. Moreover, because the protruding earth pressure gauge is hard, it induces more horizontal earth pressure, and the pressure is exaggerated, as seen in Figure 2a. A second problem can arise when the earth pressure gauge is inserted into the wall, Figure 2b. Most earth pressure gauges require some deformation of the face to measure pressure. Unfortunately, even very small pressures can cause face deflection, which is sufficient to cause soil arching. This results in the soil pressure being understated. Therefore, Seed et al. [20] proposed a technique for avoiding these problems; because the earth pressure gauge is very stiff and displacement is marginal, it should be placed at the height of the wall.
Accordingly, it is necessary to consider the variation in horizontal earth pressure due to sensor installation and gravitational acceleration during centrifuge model tests.

3. Geotechnical Centrifuge Model Test

The strength and stiffness of the soil are greatly affected by the effective stress, so the scaled model poorly reflects the field-scale behavior. Accordingly, in geotechnical engineering, a centrifuge model test is often used for scaled physical modeling to reflect an accurate magnitude of self-weight stress [21,22].
The centrifuge model principally involves accelerating the scaled ground model. If the actual model is reduced to 1:N and the gravitational acceleration (g) is applied in the centrifuge model tester according to the ratio 1:N, the result is the same as that of the actual model. In addition, because the shape of the scaled model is made in the same manner as that of the actual structure, the structural behavior of the actual model can easily be observed in detail if specific settings and expected output values are properly input into the scaled model [23].

3.1. Device

The specifications of the geotechnical centrifuge machine used in this study are shown in Figure 3 (Daewoo Institute of Construction Technology, Suwon, Korea). It has a rotation radius of 3.0 m; the maximum test package size has a 0.8 m width, 1.0 m diameter, and 0.8 m height; and payload capacity is 120 g·t.
This device comprises a counterweight for gravitational acceleration, platform for inserting test instruments, junction box for converting multiple single connectors and multi connectors, driving motor, video camera that can observe the test screen in the platform, and a safety button.

3.2. Box Culverts

Figure 4 shows the scaled box culvert and the placement of the sensors for measuring horizontal earth pressure in this study. As shown in Figure 3, the scaled box culvert is a rectangular box with a width of 5.2 cm, height of 5.6 cm, length of 20 cm, and thickness of 15 mm. It is made of aluminum because excessive deformation, such as bending, may occur due to gravitational acceleration during the geotechnical centrifuge model test process if concrete is used.
The sensors for measuring horizontal earth pressures are located on the side of the box culvert, and the spacing is 1.4 cm, which is 1/4 the height of the box culvert. Meanwhile, the sensor is an ultra-small strain gauge type, and the diameter of the sensor is 7.6 mm. The sensor was not protruded as much as possible, and was inserted into the hole of the side of box culvert with a bond. At this time, the sensor cable is connected to the external data logger through the square hole. The length of the box culvert is equal to the transverse length of the chamber, and the square part is considered a closed part.

3.3. Ground Composition

Sand was used in the centrifuge model test, and the particle size distribution curve from the sieve test according to ASTM D2487 [24] is shown in Figure 5a. The coefficient of uniformity (Cu) and coefficient of curvature (Cc) of the soil, as calculated from the particle size distribution curve, are 4.09 and 1.18, respectively. Accordingly, the soil was classified as poorly graded sand according to the USCS (Unified Soil Classification System). In addition, the ASTM D698 standard compaction test [25] was performed to determine the degree of compaction for the ground composition process. The result is shown in Figure 5b: the maximum dry unit weight is 1.715 t/m3, and the optimum water content is 8%.
The degree of compaction was set to 95% for dense ground, and the dry unit weight of the model ground was 1.66 t/m3, according to the maximum dry unit weight presented in Figure 5b.
The simplest method for ground composition is compaction using the impact from a hammer. Moreover, when precise conditions, such as those in the centrifuge model test, are required, this problem becomes more serious. Therefore, in this study, the ground was composed via the sand pluviation method using the funnel, as shown in Figure 6. The sand pluviation method using the funnel involves compacting the sand through a steel pipe of a certain diameter. This method reduces the amount of time and area in the air over which the sand falls. Therefore, material separation (difference in falling speed with particle size) can be minimized, as well as sensor damage or malfunction.
Sand pluviation is performed in the vertical direction up and down (red line), and then in the transverse direction (blue line). This process is then continuously repeated to form the ground. Finally, numerous experiments were conducted for target degree of compaction (95%). The length of the steel pipe was 2.0 m, and the diameter of the sieve was 4 mm, as is required for 95% degree of compaction.
Particle size effects can be seen when testing different sized models on the same soil. The smaller the ratio of the model to the mean particle size, the higher the value of the axial friction and point resistance. Therefore, it is necessary to prove the homogeneity of the ground through a small cone penetration test [26,27,28]. For the sand pluviation method, the work skill of an experienced experimenter is the most important, and the homogeneity of the composed ground must be secured. However, in this study, the cone penetration resistance according to the gravitational acceleration could not be confirmed, and the cone penetration resistance according to the initial ground composition was confirmed, as shown in Figure 7. Based on the linear increase trend, homogeneity was confirmed in the initial ground composition process.

3.4. Test Cases

Figure 8 shows a schematic of the box culvert installed in the ground for the scaled model and actual model after gravitational acceleration. First, the lower ground is formed to a thickness of 20 cm using the method presented in Figure 6, and a box culvert is installed on the ground. Afterward, sand pluviation is performed on the side and top of the box culvert, and the final compaction degree of the entire ground is 95%. Meanwhile, the cover depth, which is the height between the top of the box culvert and the ground surface, was set to 4, 8, and 12 cm, respectively, and the horizontal earth pressure, which depends on the cover depth, was read from the sensor.
Figure 9 shows the effect of gravitational acceleration, during which, the stage is divided into ground stabilization, loading, and unloading. The ground stabilization stage is performed to simulate the over-consolidation. In actual box culvert construction, compaction is essential, and the ground has an over-consolidated state due to an impact or additional load. In this study, because the ground was composed through the sand pluviation method to minimize damage to the sensor, it is not an over-consolidation condition, which is an actual condition. Therefore, the over-consolidation state was simulated through ground stabilization.
Accordingly, gravitational acceleration is increased by 20 g and removed when it reaches 100 g. In the loading stage, the gravitational acceleration was increased by 10 g to 50 g, and each load was maintained for 10 min. Finally, in the unloading stage, unlike in the loading stage, gravitational acceleration was decreased by 10 g to 1 g.

4. Coefficient of Earth Pressure at Rest Acting on Side of Box Culvert

4.1. Measured Horizontal Earth Pressure on Box Culvert

Figure 10, Figure 11 and Figure 12 show the horizontal earth pressure measured in the centrifuge model test under loading and unloading conditions. The test was performed at three sensor locations (top, middle, and bottom) at each cover depth (4, 8, 12 cm), and a total of five data points were recorded at each gravitational acceleration (10, 20, 30, 40, and 50 g). The measured horizontal earth pressure acting on the box culvert was greater in the unloading than in the loading condition. However, no special convergence point was found in all analysis cases, and a lot of variability was observed.
Figure 13 shows the average of the results in Figure 10, Figure 11 and Figure 12. The horizontal earth pressure in the loading condition is lower than that in the unloading condition because the residual earth pressure is dependent on the gravitational acceleration. Apparently, this stress is caused by the relaxation of the ground [12].

4.2. Vertical Earth Pressure on Side of Box Culvert

Herein, the horizontal earth pressure was the actual value measured considering the cover depth, position of the sensor attached to the box culvert, and gravitational acceleration through the centrifuge model test. Although the vertical earth pressure was not measured at a specific location, it can be estimated using Equation (1)—the most basic formula for calculating vertical stress in the ground. Here, σv is theoretical vertical earth pressure, γ is the unit weight of sand when the degree of compaction is 95% (1.66 t/m3), dcover is the sum of the cover depth in the centrifuge model test (4, 8, or 12 cm), hsensor is the sensor location, and g is gravitational acceleration.
σv,theoz. = γ·(dcover + hsensor)·g
Figure 14 shows the parameters of vertical earth pressure and box culvert according to Equation (2). Figure 15 presents the predicted vertical earth pressures at specific sensor positions (Top, Middle, and Bottom), with respect to the cover depth and gravitational accelerations, using Equation (1).

4.3. Calculation of Coefficient of Earth Pressure at Rest

There is no direct prediction formula for the horizontal earth pressure acting on buried structures in the ground, such as box culverts, and it is generally calculated using the coefficient of earth pressure, as presented in Equation (1). Here, K is the coefficient of earth pressure, and σv and σh are the vertical and horizontal earth pressure, respectively.
Meanwhile, in relation to the experimental process, because there is no ground movement or external force, a rest rather than an active or passive state is selected. Accordingly, K in Equation (2) is K0.
K = K0 = σh/σv
The coefficient of earth pressure was calculated by substituting the measured horizontal earth pressure presented in Figure 10, Figure 11 and Figure 12 and the predicted vertical earth pressure, as shown in Figure 15, into Equation (1); the results are shown in Figure 16, Figure 17 and Figure 18.
At all cover depths, the coefficient of earth pressure at rest tends to converge as the gravitational acceleration increases, except for the 30 g gravitational acceleration in Figure 17. Thus, the variability, including uncertainty during measuring the horizontal earth pressure at low gravitational acceleration, is large. A detailed analysis is performed later in Section 5, variability analysis.

5. Variability Analysis

5.1. Variability of Coefficient of Earth Pressure at Rest

The average of the coefficient of earth pressure and the coefficient of variation (COV) of earth pressure at rest according to the gravitational acceleration at each cover depth is shown in Figure 19, Figure 20 and Figure 21. The COV is obtained by normalizing the standard deviation ( s x ) of a random variable against its mean ( x ¯ ), as shown in Equation (3), and it indicates the variability of data.
COV = s x x ¯
When the cover depth was large, the average of the coefficient of earth pressure at rest was high, and the COV decreased. The COV is an index of the accuracy of the mean value. A large COV implies a high probability of error, whereas a low COV suggests that the mean is precise. Accordingly, the most reliable measurement was obtained at a cover height of 12 cm with the sensor placed at the bottom. Conversely, a cover height of 4 cm with the sensor at the top required the most care because it was the least reliable.
These results indicate the importance of increasing the gravitational acceleration to obtain high reliability in the centrifuge model test. To apply a large gravitational acceleration, the size of the scaled model must be minimized. In addition, a small cover depth in the actual model is associated with high measurement uncertainty.
According to the earth pressure theory presented in Figure 1, the coefficient of earth pressure at rest should be constant regardless of the measurement depth (cover depth and location of sensors) for a ground with the same material properties. Therefore, the cover depths and gravitational acceleration are not separately classified, as in Figure 18, Figure 19 and Figure 20; only the loading and unloading conditions are classified, as shown in Table 1.
The number of data points for each condition is 60, and the average and COV of the coefficient of earth pressure at rest in the loading condition was lower than that in the unloading condition. Accordingly, the uncertainty was higher during unloading. Presumably, this increases the uncertainty of the residual stress with respect to the loading condition previously applied in the centrifuge model test.

5.2. Comparison of Predicted and Measured Coefficient of Earth Pressure at Rest

As mentioned earlier, there is no direct formula for predicting the coefficient of earth pressure at rest using earth pressure; however, it can be indirectly predicted using the internal friction angle (ϕ). Therefore, the internal friction angle was calculated using a direct shear test [29] on the sample soil. The test confirmed that it was 47°.
Table 2 shows the empirical relationship between the coefficient of earth pressure at rest and the internal friction angle of soil proposed by other researchers [30,31,32,33,34,35,36,37,38,39], as well as the results of substituting the internal friction angle of the sample used in this study. The calculation result of the prediction formula using the internal friction angle ranged from 0.219 to 0.406, and the average was 0.273.
All theoretical values were lower than the measured values in Table 1 except for Matsuoka and Sakakibara [37] in loading condition. This can be attributed to two factors: the lateral earth pressure is overestimated, or the vertical earth pressure obtained by the theoretical formula is small. The former can be caused by many variability factors (for instance, measurement error and relocation of soil particles due to gravitational acceleration) during measurement. The latter is attributable to the vertical earth pressure exceeding the theoretical value due to differences in the ground conditions (a structure with an empty interior such as a box culvert).

6. Conclusions

In this study, the variability and uncertainty in horizontal earth pressure on a box culvert were evaluated through a centrifuge model test. Horizontal earth pressure was measured using three measuring sensors attached to the side of a box culvert, and the parameters were gravitational acceleration and cover depths under loading and unloading conditions. The contents and results of the experiment and statistical analysis were shown in the main text, and the conclusions are as follows.
i.
As a result of all centrifuge model tests, the horizontal earth pressure had a larger value in the unloading condition than in the loading condition. This is considered to be the residual stress that occurs when the gravitational acceleration was applied by this process (10 g → 20 g → 30 g → 40 g → 50 g → 40 g → 30 g → 20 g → 10 g). In addition, the loading condition is a general state in the ground, and the vertical stress (friction force) acting on the side wall of box culvert acts in the upward direction. However, in the unloading condition, the vertical stress acts downward because of the rebound of the sand and over-consolidation state. Because this rebound is larger with more soil, the higher the cover depth and the deeper the sensor position, the greater the difference in horizontal earth pressure is due to the same occurrence of loading and unloading. It is judged that the difference in horizontal earth pressure according to loading and unloading occurs significantly with higher cover depth and lower sensor position.
ii.
For σh, the centrifuge model test result had a larger value than the existing theoretical value. This is the result of overestimation of σh during the test process. The causes of overestimation of measurement results can be analyzed in two ways; (1) Sensor location: The sensor should be installed inside as much as possible, but it protrudes partially during the installation process or the gravitational acceleration application process; (2) Interface: Measurement of a large value because the friction coefficient of the soil in contact with the surface of the sensor is larger than expected.
iii.
As the gravitational acceleration was increased, K0 tended to decrease and converge to a specific point, and the variability significantly decreased. It is judged that this is a result of a decrease in ground variability rather than a decrease in the average value. As the variability decreased, data points with differences from the mean disappeared, which increased the reliability of the experimental results. In the influence of the cover depth, it was confirmed that each sensor position (Top, Middle, and Bottom) of 50 g had a similar value regardless of the cover depth. Based on this, it was confirmed that when the centrifuge model test was performed, the variability of the result was reduced, and an accurate value was obtained if the gravitational acceleration was set to a certain point or higher. Therefore, it is necessary to analyze the correlation between the model production size and the gravitational acceleration.
iv.
In this study, the variability analysis of the horizontal earth pressure acting on the box culvert was performed. It is important in that it proposes the causes of volatility and methods to reduce variability. However, there were limitations in that the difference between the measured value and the predicted value was large, and the size effect and repeated loading was not confirmed.
v.
There was a big difference in the horizontal earth pressure when compared with the reference values. This means that there is a possibility that the used internal friction angle was changed in the centrifuge model test due to rebound according to loading and unloading, which could be the size effect of the ground composed of sand. Therefore, in future research, there is a plan to conduct a study including these characteristics of the ground, and the effect of the number of loading and unloading repetitions, which were not examined in this study, will also be considered.

Author Contributions

Conceptualization, S.I.W. and K.L.; methodology, J.K.; validation, J.K. and K.L.; formal analysis, J.K. and K.L.; investigation, J.K. and K.L.; resources, S.I.W.; data curation, J.K. and K.L.; writing—original draft preparation, S.I.W.; writing—review and editing, K.L.; visualization, J.K. and K.L.; supervision, S.I.W.; project administration, S.I.W. and K.L.; funding acquisition, S.I.W. All authors have read and agreed to the published version of the manuscript.

Funding

This research work has been supported by the Korea Agency for Infrastructure Technology Advancement (KAIA) grant funded by the Ministry of Land, Infrastructure and Transport (Grant 21CTAP-C157021-02).

Institutional Review Board Statement

Not applicable.

Informed Consent Statement

Not applicable.

Data Availability Statement

Not applicable.

Acknowledgments

The authors acknowledge financial support from the Korea Agency for Infrastructure Technology Advancement (KAIA) under the Ministry of Land, Infrastructure, and Transport of the Korean government (Grant #: 21CTAP-C157021-02).

Conflicts of Interest

The authors declare no conflict of interest.

References

  1. Bobylev, N. Underground space as an urban indicator: Measuring use of subsurface. Tunn. Undergr. Space Technol. 2016, 55, 40–51. [Google Scholar] [CrossRef] [Green Version]
  2. Youn, B. Probabilistic approach on the Carbonation Rate of Non-Transport Underground Infrastructures. In Proceedings of the ConMat’20, Fukuoka, Japan, 4–13 July 2020. [Google Scholar]
  3. Hao, T.; Rogers, C.D.F.; Metje, N.; Chapman, D.N.; Muggleton, J.M.; Foo, K.Y.; Wang, P.; Pennock, S.R.; Atkins, P.R.; Swingler, S.G.; et al. Condition assessment of the buried utility service infrastructure. Tunn. Undergr. Space Technol. 2012, 28, 331–344. [Google Scholar] [CrossRef]
  4. Rogers, C.D.F.; Hao, T.; Costello, S.B.; Burrow, M.P.N.; Parker, J.; Armitage, R.J.; Anspach, J.H.; Muggleton, J.M.; Foo, K.Y.; Wang, P.; et al. Condition assessment of the surface and buried infrastructure-a proposal for integration. Tunn. Undergr. Space Technol. 2012, 28, 202–211. [Google Scholar] [CrossRef]
  5. Marston, A.; Anderson, A.O. The Theory of Loads on Pipes in Ditches and Tests of Cement and Clay Drain Tile and Sewer Pipes; Bulletin 31; Iowa Engineering Experiment Station: Ames, IA, USA, 1913. [Google Scholar]
  6. Marston, A. The Theory of External Loads on Closed Conduits in the Light of the Latest Experiments; Bulletin 96; Iowa Engineering Experiment Station: Ames, IA, USA, 1930. [Google Scholar]
  7. Spangler, M.G. Field Measurements of the Settlement Ratios of Various Highway Culverts; Bulletin 171; Iowa Engineering Experiment Station: Ames, IA, USA, 1950. [Google Scholar]
  8. Acharya, R.; Han, J.; Parsons, R.L. Numerical analysis of low-fill box culvert under rigid pavement subjected to static traffic loading. Int. J. Geomech. 2016, 16, 04016016. [Google Scholar] [CrossRef]
  9. Ma, Q.; Ku, Z.; Xiao, H.; Hu, B. Calculation of earth pressure on culvert underlying flexible subgrade. Results Phys. 2019, 12, 535–542. [Google Scholar] [CrossRef]
  10. Li, S.; Jianie, Y.; Ho, I.H.; Ma, L.; Wang, Q.; Yu, B. Experimental and Numerical Analyses for Earth Pressure Distribution on High-Filled Cut-and-Cover Tunnels. KSCE J. Civil. Eng. 2020, 24, 1903–1913. [Google Scholar] [CrossRef]
  11. AASHTO. LRFD Bridge. Design Specifications, 9th ed.; American Association of State Highway and Transportation Officials: Washington, DC, USA, 2020. [Google Scholar]
  12. Chu, I.; Woo, S.K.; Woo, S.I.; Kim, J.; Lee, K. Analysis of Vertical Earth Pressure Acting on Box Culverts through Centrifuge Model Test. Appl. Sci. 2022, 12, 81. [Google Scholar] [CrossRef]
  13. Abuhajar, O.; El Naggar, H.; Newson, T. Static soil culvert interaction the effect of box culvert geometric configurations and soil properties. Comput. Geotech. 2015, 69, 219–235. [Google Scholar] [CrossRef]
  14. Abuhajar, O.; El Naggar, H.; Newson, T. Numerical modeling of soil and surface foundation pressure effects on buried box culvert behavior. J. Geotech. Geoenviron. Eng. 2016, 142, 04016072. [Google Scholar] [CrossRef]
  15. Chen, B.; Meng, Q.; Yan, T.; Wang, C.; Song, D. New Simplified Method for Analysis of Earth Pressure on the Imperfect Trench Installation Box Culvert. Int. J. Geomech. 2020, 20, 04020193. [Google Scholar] [CrossRef]
  16. Oshati, O.S.; Valsangkar, A.J.; Schriver, A.B. Earth pressures exerted on an induced trench cast-in-place double-cell rectangular box culvert. Can. Geotech. J. 2012, 49, 1267–1284. [Google Scholar] [CrossRef]
  17. Chen, B.; Sun, L. Performance of a reinforced concrete box culvert installed in trapezoidal trenches. J. Bridge Eng. 2014, 19, 120–130. [Google Scholar]
  18. Zhang, J.H.; Yao, Y.S.; Zheng, J.L.; Zhang, T. Centrifugal model test and numerical simulation of vertical earth pressure on soft foundation box culvert. J. Cent. South Univ. 2015, 22, 3556–3563. [Google Scholar] [CrossRef]
  19. Yang, M.Z. Evaluation of Factors Affecting Earth Pressures on Buried Box Culverts. Ph.D. Thesis, University of Tennessee, Knoxville, TN, USA, May 2000. [Google Scholar]
  20. Seed, R.B.; Duncan, J.M.; Ou, C.Y. Finite Element Analysis of Compaction Problems. In Advanced Geotechnical Analysis: Development in Soil Mechanics and Foundation Engneering, 4th ed.; Banerjee, P.K., Butterfield, R., Eds.; Elsevier: Amsterdam, The Netherlands, 1991. [Google Scholar]
  21. Schofield, A.N. Cambridge geotechnical centrifuge operation. Géotechnique 1980, 30, 227–268. [Google Scholar] [CrossRef] [Green Version]
  22. Taylor, R.N. Geotechnical Centrifuge Technology; Blackie Academic: London, UK, 1995. [Google Scholar]
  23. Kim, D.S.; Kim, N.R.; Choo, Y.W. Physical Modeling of Geotechnical Systems using Centrifuge. In Proceedings of the Korean Geotechical Society Conference, Incheon, Korea, 25–26 September 2009. [Google Scholar]
  24. ASTM D2487; Standard Practice for Classification of Soils for Engineering Purposes (Unified Soil Classification System). American Society for Testing of Materials: West Conshohocken, PA, USA, 2017.
  25. ASTM D698; Standard Test Methods for Laboratory Compaction Characteristics of Soil Using Standard Effort (12,400 ft-lbf/ft3 (600 kN-m/m3)). American Society for Testing of Materials: West Conshohocken, PA, USA, 2017.
  26. Bolton, M.D.; Gui, M.W.; Phillips, R. Review of miniature soil probes for model tests. In Proceedings of the 11th South East Asia Geotechnical Conference, Singapore, 4–8 May 1993. [Google Scholar]
  27. Bolton, M.D.; Gui, M.W.; Garnier, J.; Corte, J.F.; Bagge, G.; Laue, R. Centrifuge cone penetration test in sand. Gėotechnique 1999, 49, 542–552. [Google Scholar] [CrossRef] [Green Version]
  28. Balachowski, L. Size effect in centrifuge cone penetration tests, Archives of Hydro-Engineering and Environmental Mechanics. Arch. Hydro Eng. Environ. Mech. 2007, 54, 161–181. [Google Scholar]
  29. ASTM D638; Standard Test Method for Tensile Properties of Plastics. American Society for Testing of Materials: West Conshohocken, PA, USA, 2010.
  30. Jaky, J. The coefficient of earth pressure at rest. J. Soc. Hung. Eng. Arch. 1944, 131, 355–358. [Google Scholar]
  31. Jaky, J. Pressure in silos. In Proceedings of the 2nd International Conference on Soil Mechanics and Foundation Engineering, Rotterdam, The Netherlands, 21–30 June 1948. [Google Scholar]
  32. Rowe, P.W. Ce= 0 hypothesis for normally loaded clays at equilibrium. In Proceedings of the 4th International Conference on Soil Mechanics and Foundation Engineering, London, UK, 12–24 August 1957. [Google Scholar]
  33. Bishop, A.W. Test Requirements for Measuring the Coefficient of Earth Pressure at Rest; British Library Lending Division: London, UK, 1958. [Google Scholar]
  34. Brooker, E.Q.; Ireland, H.O. Earth pressure at-rest related to stress history. Can. Geotech. J. 1965, 2, 1–15. [Google Scholar] [CrossRef]
  35. Saglamer, A. Soil parameters Affecting coefficient of earth pressure at-rest of cohesionless soils. In Proceedings of the Istanbul Conference on Soil Mechanics and Foundation Engineering, Istanbul, Turkey, 31 March–4 April 1975. [Google Scholar]
  36. Rymsza, B. Earth pressure at rest in design of retaining structures. In Proceedings of the 7th European Conference on Soi1 Mechanics and Foundation Engineering, Brighton, UK, 1979. [Google Scholar]
  37. Matsuoka, H.; Sakakibara, K. A constitutive model for sands and clays evaluating principal stress rotation. Soils Found. 1987, 27, 73–88. [Google Scholar] [CrossRef] [Green Version]
  38. Bolton, M.D. Geotechnical Stress Analysis for Bridge Abutment Design; Technical Report No. 270; Transport and Road Research Laboratory: Crowthorne, UK, 1991. [Google Scholar]
  39. Szepeshazi, R. On the K0 Factor. Period. Polytech. Civ. Eng. 1994, 38, 127–135. [Google Scholar]
Figure 1. Vertical and horizontal earth pressure on box culvert (modified after AASHTO [11]).
Applsci 12 01993 g001
Figure 2. Systematic errors in the measurement of horizontal earth pressure (modified after Seed et al., 1991); (a) Exaggerated and (b) Understated.
Applsci 12 01993 g002
Figure 3. Device for performing the geotechnical centrifuge model test (modified version of the machine is in Daewoo Institute of Construction Technology, Suwon, Korea).
Applsci 12 01993 g003
Figure 4. Scaled box culverts: (a) Picture and (b) Placement of sensors.
Applsci 12 01993 g004
Figure 5. Results of laboratory test: (a) Particle size distribution obtained from sieve test and (b) compaction test to determine maximum dry unit weight and optimal water content.
Applsci 12 01993 g005
Figure 6. Sand pluviation using funnel: (a) Schematic diagram, (b) Ground composition and (c) Procedure of puliviation.
Applsci 12 01993 g006
Figure 7. Conformity analysis of homogeneous composed ground.
Applsci 12 01993 g007
Figure 8. Diagram of box culvert: (a) scaled model and (b) actual model.
Applsci 12 01993 g008
Figure 9. Application of gravitational acceleration.
Applsci 12 01993 g009
Figure 10. Measured horizontal earth pressure under loading and unloading conditions with cover depth of 4 cm; location of sensor: (a) Top, (b) Middle, and (c) Bottom.
Applsci 12 01993 g010
Figure 11. Measured horizontal earth pressure under loading and unloading conditions with cover depth at 8 cm; location of sensor: (a) Top, (b) Middle, and (c) Bottom.
Applsci 12 01993 g011
Figure 12. Measured horizontal earth pressure under loading and unloading conditions with cover depth at 8 cm; location of sensor: (a) Top, (b) Middle, and (c) Bottom.
Applsci 12 01993 g012
Figure 13. Measured horizontal earth pressure under loading and unloading conditions with cover depth at 8 cm; location of sensor at Top, Middle, and Bottom.
Applsci 12 01993 g013
Figure 14. Ground depth by sensor location for calculation of vertical earth pressure.
Applsci 12 01993 g014
Figure 15. Predicted vertical earth pressure for varying cover depths and gravitational accelerations.
Applsci 12 01993 g015
Figure 16. Coefficient of earth pressure at rest at 4 cm cover depth.
Applsci 12 01993 g016
Figure 17. Coefficient of earth pressure at rest at 8 cm cover depth.
Applsci 12 01993 g017
Figure 18. Coefficient of earth pressure at rest at 12 cm cover depth.
Applsci 12 01993 g018
Figure 19. Variability analysis with cover depth at 4 cm: (a) Average and (b) COV of earth pressure with gravitational acceleration.
Applsci 12 01993 g019
Figure 20. Variability analysis with cover depth at 8 cm: (a) Average and (b) COV with gravitational acceleration.
Applsci 12 01993 g020
Figure 21. Variability analysis with cover depth at 12 cm: (a) Average and (b) COV with gravitational acceleration.
Applsci 12 01993 g021
Table 1. Variability analysis for the coefficient of earth pressure at rest under the loading and unloading conditions.
ConditionsLoadingUnloading
The number of data6060
Average, x ¯ 0.4050.516
Standard deviation, s x 0.1600.232
COV (%)39.58644.983
Table 2. Equations and results of coefficient of earth pressure at rest by references.
No.ReferencesEquationsResults
1Jaky [30] K 0 = [ 1 + 2 3 s i n ϕ ] [ 1 s i n ϕ 1 + s i n ϕ ] 0.231
2Jaky [31] K 0 = 1 s i n ϕ 0.269
3Rowe [32] K 0 = t a n 2 [ 45 ϕ 9 2 ] 0.238
4Bishop [33] K 0 = 1 2 [ 1 + 5 8 3 5 8 ( s i n ϕ ) 1 5 8 + 3 5 8 ( s i n ϕ ) ] 0.250
5Brooker and Ireland [34] K 0 = 0.95 s i n ϕ 0.219
6Saglamer [35] K 0 = 0.97 [ 1 0.97 ( s i n ϕ ) ] 0.282
7Vierzbiczky (mentioned by Rymsza [36]) K 0 = t a n 2 [ 45 ϕ 3 ] 0.316
8Matsuoka and Sakakibara [37] K 0 = 1 1 + 2 s i n ϕ 0.406
9Bolton [38] K 0 = 1 s i n ( ϕ 11.5 ) 1 + s i n ( ϕ + 11.5 ) 0.265
10Szepeshazi [39] K 0 = 0.95 ( 1 s i n ϕ ) 0.255
Publisher’s Note: MDPI stays neutral with regard to jurisdictional claims in published maps and institutional affiliations.

