1. Introduction
The time to move a physical stylus from a home position to a stationary target depends on the size of the target and the distance from the home position to the target. The longer the distance between the home position and the target, the longer the movement time. On the other hand, the smaller the size of the target, the longer the time required for the movement. The proposed law based on this principle is Fitts’ law, which is expressed in Equation (1) [
1]. It was found that the time to move the physical stylus from the home position to the stationary target is linearly proportional to
log2(2
A/
W), called the difficulty index (ID), where
W is the width of the target and
A is the distance from the home position to the target. MT is the average time to complete the movement. a and b are constants that depend on the choice of input device and are usually determined empirically. The parameter a defines the intersection on the
y axis and is often interpreted as a delay. The b parameter is a slope and describes an acceleration.
Fitts’ law is applicable to the actual physical movement of the hand to a target, such as the movement of a cursor to a screen target [
2]. It is also applicable to movement as coarse as a foot reaching for a pedal and as fine as manipulation under a microscope [
3,
4]. This generality provides the law great value in allowing designers to determine keyboard layouts and target sizes in a wide variety of circumstances [
5,
6,
7]. The theoretical basis for Fitts’ law was developed and expended. Several modifications were also proposed such as a model considering the length of probe [
8], a model fittable for the low index of difficulty [
9] and models not using a logarithmic function [
10,
11].
However, most of the studies on Fitts’ law were performed on the movement time for approaching a stationary target. There have been just few studies of Fitts’ law considering moving targets. Jagacinski et al., (1980) first studied the time it takes to catch a moving target based on the Fitts’ law [
12]. They found that even with a moving target, the size of the target is inversely proportional to the time taken, and the distance between the target and the home position is proportional to the time taken. A time prediction model considering the speed of a moving target were proposed as in Equation (2).
In Equation (2), c, d, and e are constants, which are determined according to the characteristics of the work or worker’s skill, and are derived through experiments. The velocity variable V at which the target moves, which does not exist in Equation (1), is additionally considered. The number of empirical constants were increased and the logarithmic function was not used
To follow the form of the traditional Fitts’ law, Hoffmann (1991) proposed a new modified model by reanalyzing Jagacinski et al.’s experimental data without a separate experiment. Equation (3) is a mathematical model proposed by Hoffmann (1991) [
13]. MT, a, b,
A, and
W in Equation (3), are the same as the variables and constants of the Equation (1) and
V is the variable representing the moving speed of the target.
This model is a one-dimensional model and describes the time it takes to capture the target by the physical styles when the target approaches or moves away from the home position of the physical styles. The numerator of the logarithmic function of this model, A ± V/K, indicates the effect of the moving speed of the target on A. The A is the distance between the target and home position before the physical stylus movement begins.
Actual A is shortened as the target approaches the origin at a constant speed. The shortened distance was assumed to be A − V/K. That is, it represents the effect that the length of A becomes shorter due to the movement of the target. On the other hand, A + V/K shows the effect that the length of A becomes longer as the target moves away from the home position at a constant speed.
The denominator of the logarithmic function, W/2 – V/K, represents the effect of the moving speed of the target on target width (W), called effective target width. Whether the target approaches the home position or moves away from the home position, it has the effect of decreasing the W value regardless of the direction of movement. In Equation (3), K is an empirically determined constant for calibrating the unit of the moving speed of the target.
After the Hoffmann (1991) study, the models extended to the case of selecting a two-dimensional moving target and a three-dimensional moving target were proposed under the premise that the Hoffmann’s model well describes the selection time of a moving target [
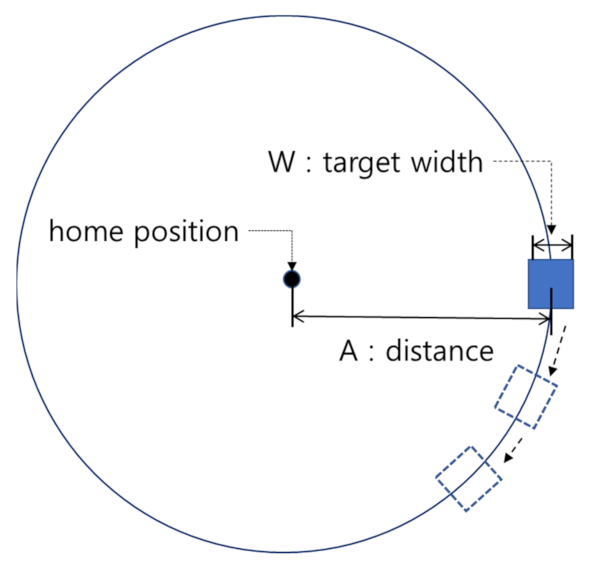
14]. This study is to verify whether the Hoffmann (1991) model is applicable even for a target moving along a circular trajectory. Hoffmann (1991) model may be possible to describe the time required to select a moving target in the situation where the computer cursor is centered on the circular trajectory and the target moves at a constant speed along the circular trajectory. In this case, the distance the cursor moves (
A) does not change between the initial state and the state the target is moving. A moving target only affects target width. In other words, it will only have the effect that the width of the target became narrower. Therefore, the modified model for capturing a target moving along a circular trajectory can be expressed as Equation (4).
3. Results
3.1. Analysis of Target Selection Accuracy
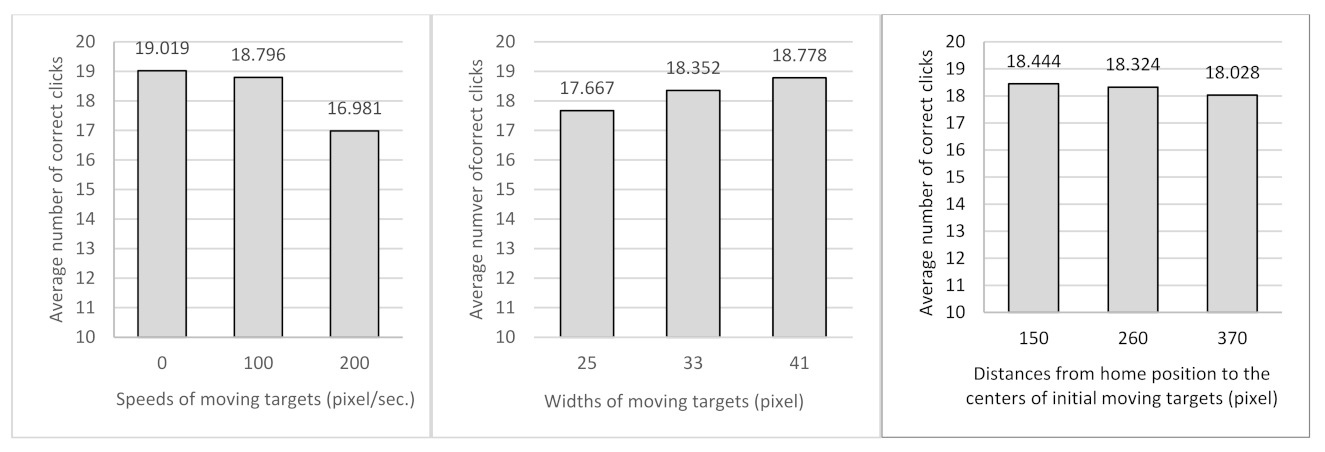
Among the data collected in 20 repeated trials, data that did not accurately click the target was extracted. The mean number of accurate clicks on the target was 18.27 and the standard deviation was 1.18. As shown in
Figure 2, the error of target selection was larger as the target width decreased (
p < 0.001) and the speed of the moving target increased (
p < 0.001). However, the distance between the home position and the moving target on the click error was not statistically significant (
p = 0.157). In general, the target selection is less accurate as the difficulty of the task increases. In this experiment, as the width of the target increased, the accuracy increased, and as the speed decreased, the accuracy increased. On the other hand, although not statistically significant, the shorter the distance between the target and the home position, the greater the accuracy.
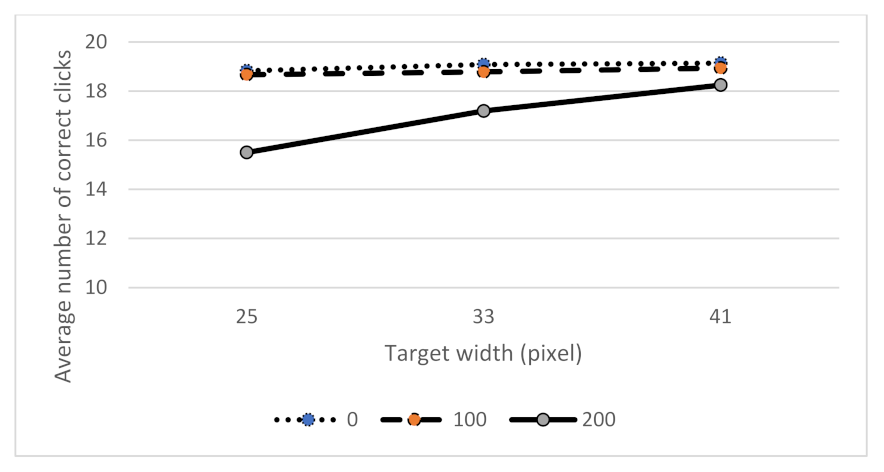
Among the three independent variables, the interaction effect on the selection accuracy was significant only between the moving speed of the target and the target width (
p < 0.001), as shown in
Figure 3. When the target speed was high and the width of the target was narrow, the click accuracy was very low. It was found that if the width of the target was narrow and the speed of the target was high, the difficulty of the task was greatly increased.
3.2. Analysis of Target Selection Time
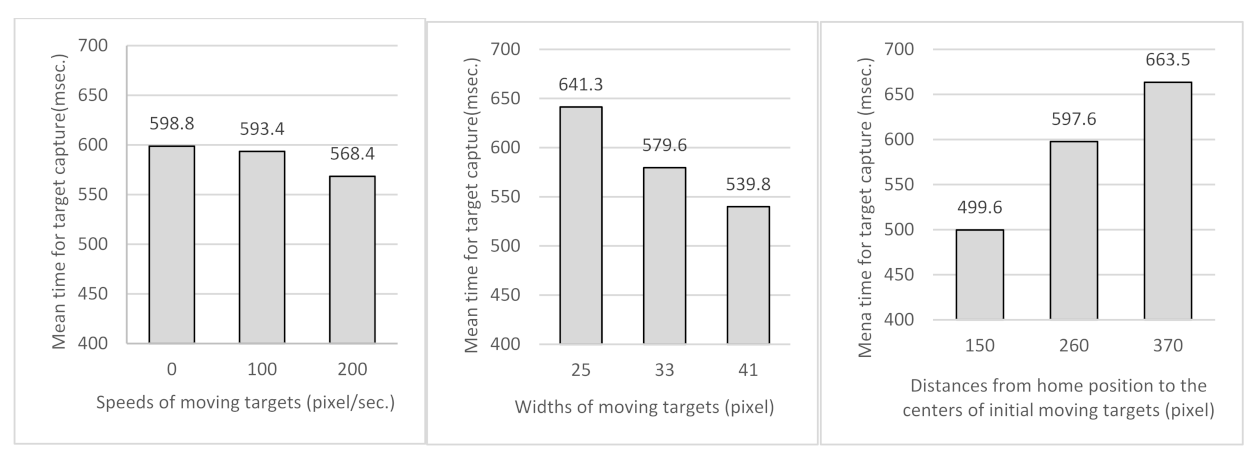
Except for the cases where the target could not be accurately clicked, the averages of the target selection times were calculated according to each participant under each experimental condition were obtained. Analysis of variance was performed on the mean of the target selection times. All three main effects on the mean time of target selection were found to be statistically significant,
p < 0.001 for the distance between home position and moving target(
A),
p < 0.001 for the width of the target (
W), and
p < 0.05 for the speed of the moving target (
V)).
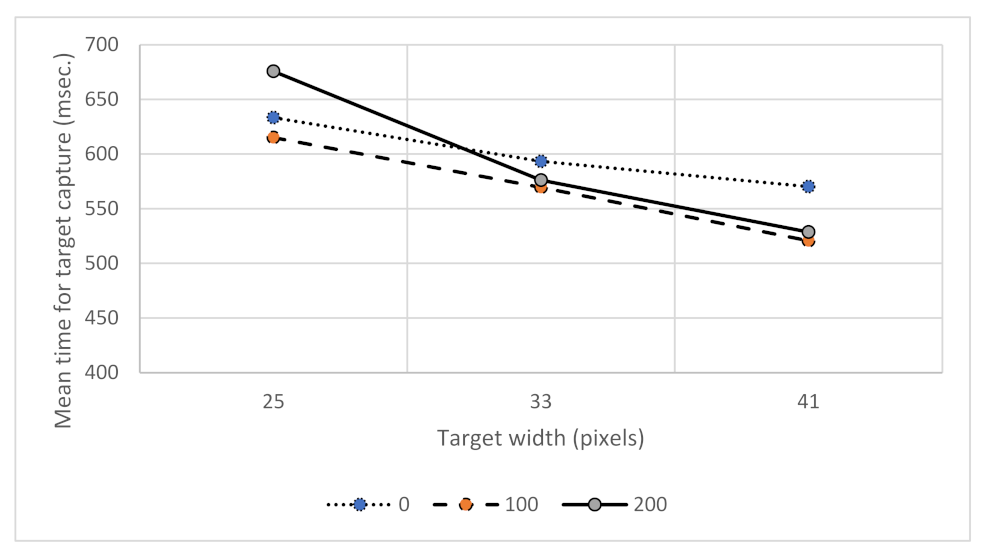
Figure 4 indicates the means of target selection time according to the speed of moving target (left), the target width (center) and the distance between home position and moving target (right).
These results mean that the general principle of Fitts’ law, “Target selection time is proportional to the distance between the target and home position and inversely proportional to the width of the target”, holds true for a moving target as well. On the other hand, it shows that the time to select the target decreases as the movement speed of target increases. This result is inconsistent with Hoffman’s prediction model.
Among the three independent variables, the interaction effect on the selection time was significant only between the moving speed of the target and the target width (
p < 0.05), as shown in
Figure 5. In the case of a fast target speed, if the target width was wide, the cursor movement time was very short, but if the target width was narrower, the movement time increased rapidly.
3.3. Fit of the Fitts’ Model for Moving Targets with the Same Speed
It was tested whether the traditional Fitts’ model could be applied in a situation where the speed of the moving target is the same. The data collected at each three target speeds were examined to see if they could be explained by the traditional Fitts’ model. The results of the linear regression analysis are shown in Equations (5)–(7). The
R2 values of the linear regression model were 0.92 or higher. This means that the traditional Fitts’ model has explanatory power for the targets moving at the same speed. However, there is a question of how to represent the targets moving at different speeds with a single model.
3.4. Fit of the Fitts’ Model for Moving Targets with Various Speeds
It was evaluated whether the collected target selection times were well fitted to the model proposed in this study. The degree of model fit was determined by the degree of linear correlation between measured target selection times and indexes of difficulty. In regression, the R2 coefficient of determination is a statistical measure of how well the regression predictions approximate the real data points. In order to evaluate the degree of model fit, an optimal K value should be also derived. The optimal K value is an empirically determined constant for calibrating the unit of the moving speed of the target. Therefore, linear regression analysis between measured selection time and index of the difficulty was performed while changing K. The K value in the linear regression equation that provides the largest R2 value was determined as an optimal K value.
Table 1 indicates the change of Equation (4) according to
K value change. If the value of
K approaches negative infinity or approaches positive infinity, Equation (4) approximates the traditional Fitts’ law. This is because the speed (
V) of the moving target becomes meaningless when
K is large. On the other hand, if the value of
K is 0, the index of difficulty in Equation (4) becomes 0 and the movement time is equal to a. If the optimal
K value was determined as any negative number, it means that the participants was feeling the target width wider than the actual target width. On the other hand, if the optimal
K value was positive, it indicates that the participants was feeling the target width narrower than the actual target width, due to the speed of moving target. The optimal
K value in the Hoffmann’s study was positive and the result of this study was also expected to be positive.
Contrary to our expectations, the optimal
K value that gave the best model fit was negative. A negative value of
K means that the effective width of the target was larger than the actual target width.
Table 2 shows the change of the
R2 value of the proposed model according to the change of the
K value. When the
K value was between −95 and −100, the
R2 value was the largest (
R2 = 0.9173).
In some cases, linear regression analysis did not work during data analysis. For example, if W = 25, A = 150, V = 200, and K = 10, the ID value could not be calculated. If the value of each parameter is substituted into ID = log2 (A/(W/2 − V/K)), the ID becomes log2(−20). X must be a positive real number in “logb x”, which is the log function of x with respect to base b. Since the value of X is negative, calculation of ID is not possible. This case frequently occurred when the absolute value of K was small. These cases were excluded from the analysis results.
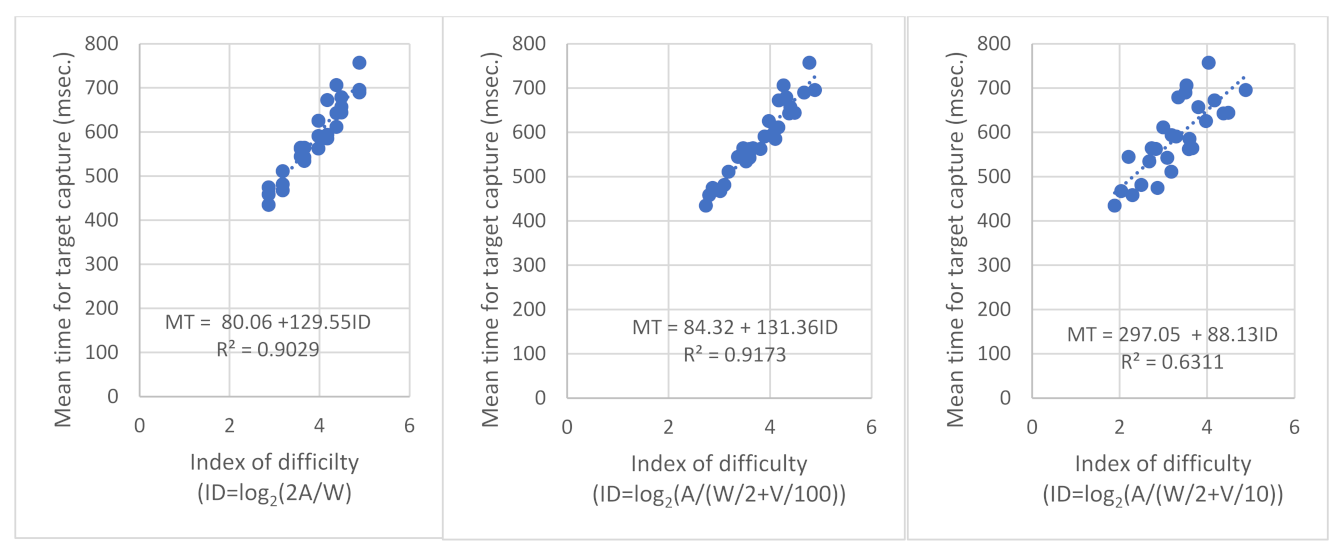
Figure 6 shows three cases of the linear regression equations shown in
Table 2. The linear regression equation on the left is a case where the
K value is close to infinity, so the speed of the moving target does not affect the mouse movement time. The graph presented in the center is the case of the best model fit, where the coefficient of determination of the regression equation is the largest. On the right is an example where the coefficient of determination of the linear regression equation is very low (
K = −10).
The coefficient of determination of the linear regression equation was 0.9029 when the traditional Fitts’ model, which does not consider the velocity of the moving target, was applied to the collected data. This coefficient is very high enough to validate the fit of the model. However, when the model considering the speed of the moving target was applied, the coefficient of determination of the linear regression equation was further improved (R2 = 0.9173).
4. Discussion
In the case of selecting a target moving along a circular trajectory with a computer mouse, if the moving speed of the target was constant, the time to select a target was inversely proportional to the width of the target and changed in proportional to the distance between the target and the starting point, as in the traditional Fitts’ law. These results were similar to the results in the experiment of clicking a target moving in a straight line using a joystick [
15]. It suggests that although the target is moving, if it is moving at the same speed, the target selection time is well explained by the traditional Fitts’ law.
However, there was a research question of how to represent the time for selecting targets moving at different speeds with a single model. Hoffman (1991) set the speed of a moving target as a variable, and included this variable in the modified Fitts’ Law. If this model is applied to the case of selecting a target moving along a circular trajectory, increasing the target speed has the effect of reducing the target width. Consequently, the model that best fits the collected data should be determined when the value of K is positive. Also, increasing the speed of a moving target should increase the time it takes to click the target.
However, the result of this experiment showed that the optimal K value was negative, and as the speed increased, the time to click the target decreased. This result was inconsistent with the assumptions of the Hoffman model. Hoffman’s (1991) model described that when clicking on a moving target, clicking on a fast-moving target was more difficult than clicking on a stationary target or slow-moving targets. He might not take in account the subjects’ tendency to speed up the movement of the mouse in order to click on the moving target. Comparing the target selection error data and the target selection time data simultaneously, when the speed of the moving target more increases, the number of click errors increases and the click time tends to be decreased. That is, it can be said that the subjects increased the mouse movement speed while sacrificing the accuracy of clicking the target.
On the other hand, when
K value of proposed model was very high, the movement speed of the target had no effect on the target selection time. That is, in this case, the Fitts’ model proposed in this paper approaches to the traditional Fitts’ model. The degree of Fitts’ model fits was 0.9029, even in the case where the speed of the moving target did not affect the target selection time. Even though the target movement speed was not included in the model, it is a very high value that the coefficient of determination is more than 0.9. This result might be due to confounding factors. Gori et al. [
16] argued that the high
R2 between the difficulty index (ID) and the mean travel time (MT) is due to the strong confounding between the travel distance (
A) and the difficulty index (ID). Anyway, in this study, a more suitable model was found by considering the speed of the moving target as an additional variable. The fit of the model was higher than when the target speed was not considered (
R2 = 0.9137). However, unexpectedly, the optimal
K value that gave the best model fit was negative.
A negative optimal K value may not mean that when subjects click a target, they use an effective target width that is wider than the actual target width. This can be caused by the human reaction tendency to quickly click on the target, which is affected by the speed of the moving target. In the future, more sophisticated models should be developed to include the tendency of humans to react to moving targets.


