Article

The Study of Biological Glue Droplet Impact Behavior of Bioceramic Powders Applied in 3D Printing of Bone Scaffolds

Industry Engineering Department, School of Mechanical Engineering, Northwestern Polytechnical University, Xi’an 710072, China
*
Author to whom correspondence should be addressed.
Joint first authors: these authors contributed equally to this work and should be considered co-first authors.
Appl. Sci. 2022, 12(4), 1898; https://doi.org/10.3390/app12041898
Submission received: 6 January 2022 / Revised: 4 February 2022 / Accepted: 9 February 2022 / Published: 11 February 2022
(This article belongs to the Topic Additive Manufacturing)

Abstract

:
This paper aims to develop a reliable and effective model to investigate the behavior of micron-sized biological glue droplets impacting micron-sized bioceramic powder beds applied to the 3D printing process. It also endeavours to explore the common rules of droplet impact affected by particle size and the wettability of powder, which are supposed to provide process parameters guidance for the application of new materials in 3D printing. Firstly, based on the low impulse impact model, the simplified model was proposed. Then, the observation and simulation experiments of millimeter-scale droplet impacting were carried out under the same conditions to prove the effectiveness of the model. Furthermore, the characterization of a parametric experiment of a 3D printing practice was used to verify the significance and effectiveness of the simulation study method. Lastly, the method was performed to investigate the effect of wettability and particle size of the micron powder on the micron droplet impact. The results showed that the binder powder’s wettability and particle size could directly influence the droplet spreading behavior. The characterization results of samples printed in the simulation-predicted parameter showed that the amount of binder used could be reduced by 38.8~50.1%, while the green strength only lost 17.9~20%. The significance of this simulation method for prediction of 3D printing process parameters was verified.

1. Introduction

In recent years, additive manufacturing (AM) [1] has been widely used in fabricating bone tissue engineering scaffolds. The biggest advantage of additive manufacturing is that it can produce patient-specific scaffolds with both a complex internal porous structure and a precise external architecture compared to the conventional scaffold fabrication methods [2,3]. Among AM techniques, 3D powder-based printing (3DPP) (the term “3D printing” mentioned in this paper is representative of 3D powder-based printing in particular) is the most promising technology to fabricate artificial bone implants [4,5,6], as 3D printing can be used to fabricate bone engineering scaffolds with bioceramic powders under low-temperature conditions [7,8]. Thanks to their chemical and structural similarities to the inorganic phase of human bone [9,10,11], calcium phosphates, such as hydroxyapatite (HA), β-tricalcium phosphate (β-TCP), have been used in the 3D printing of artificial bone scaffolds [11,12,13,14,15,16,17,18,19,20,21,22]. In the process of 3D printing bone scaffolds, the ceramic powder is deposited on the powder bed platform first, and the thin layer of powder is well compacted and smoothed by a special roller [16], and then the binder drops are sprayed onto the designated areas of the thin powder layer by the print head. This process aims to bind the powders in the selected region following the cross-sectional information generated by the CAD system. After the selective binding of the powder layer, the above processes are repeated until the end of the whole manufacturing process [23]. Previous studies [8,23,24,25] have shown that the powder-droplet interaction plays a key role in the resolution and quality of 3D printing. The powder-droplet interaction involves three steps [11]: (1) the binder droplet impacts and spreads on the surface of powder bed; (2) the binder droplet penetrates the powder; and (3) wetting and setting occur to form nucleation. With regard to the fact that droplet spreading takes place in a very short time, and the time required for droplet penetration and nucleation is significantly longer [12,26,27]. Therefore, the process of powder-droplet interaction is often studied individually. With observation and analysis in relevant works [26,27], it was found that the spreading process of millimeter-sized large droplets on micron-sized powder is measured on a microsecond scale, and the time scale for droplet penetration is of the order of a second. In the study [12], the droplet permeation process with different ratios of CaP:CaSO4 was studied. The results showed that the permeation time ranged from 0.73 s to 5.07 s, and the particle size of powder had a strong influence on the droplet permeation.
The final resolution of the 3D printed products depends on how the droplet spreads on the powder bed [23]. Since the droplet spreading behavior on powders plays a crucial role in 3D printing [28], it will be challenging for precision manufacturing studies in the future. The common way to study droplet spreading behavior is to observe the 3DP process empirically and by determining the final integrity of the printed specimen. In the study [27], the influence of TiNiHf particle size on binder drop spreading time was studied to observe the millimeter-scale drops spreading by a high-speed digital optical microscope. Marston et al. [29,30] studied the binder drop impact on powder during which the spreading, rebound and splashing were observed with high-speed photography. Hapgood et al. [26] also studied the penetration performance of several kinds of droplets on different powder materials with a large number of observation experiments and proposed an absorption time prediction model depending on the Washburn equation [31]. With the common experimental methods, there are still limitations for developing and applying new materials used for 3D printing bone scaffolds.
However, in the actual 3D printing scene, droplet spreading occurs on micron-sized droplets and micron-sized powder particle systems. The spreading behaviors learned from the experimental observation [32,33] of millimeter-sized drops cannot be completely applied to the droplets in micron size because the droplets’ dynamics are size sensitive. Although the modern/advanced high-speed camera can capture ultra-fast fluid phenomenon over million frames, however, for a typical 3D printing scene, it is a big challenge to capture the images of a microdroplet (diameter < 200 μm) with relative high velocity (above 1.0 m∙s−1) to study the spreading behaviors under the space limitation of the print head to powder bed. Limited by the experimental equipment, there is extremely inadequate research [34] on the impact of the millimeter-sized droplets on granular materials with a direct observation-based experimental method. A variety of liquid droplet impact-related simulation [35,36,37,38,39,40] studies have been conducted to solve application problems in 3D printing. However, most existing simulation studies have focused on the effect of binder drop properties (such as surface tension and viscous force and impact velocity) on droplet spreading behaviors rather than on the physical and dynamic characteristics of the binder/powder interaction system.
Therefore, the computational fluid dynamics (CFD) method used to study droplets impacting the powder surface was proposed. This study aims to develop a reliable and effective model to investigate the behavior of micron-sized droplets impacting on a micron-sized powder bed applied to the 3D printing process. First of all, referring to the previous studies and practical experience in 3D printing, we proposed a low impulse model supported by the theoretical calculation results and typical studies. Depending on this strategy, we have simplified the model of a microdroplet spreading on the well-compacted and smoothed micro-particle powder to the model of a single droplet spreading on the rigid multi-sphere substrate, which matches well with the actual 3D printing process. Then, the CFD model for numerical simulation based on the VOF (volume of fluid) method was established. In order to test the VOF model proposed in this study, the observation experiment of millimeter-scale droplet spreading on the rigid substrate and the numerical simulation under the same conditions were carried out. The consistency between the experimental and simulation results has revealed that the VOF model is considerably effective. After that, the effects of the particle size and wettability of powder on the spreading behavior of micro binder droplets were studied through the numerical simulation method based on the VOF model. With the analysis and summary of the microdroplets’ spreading behaviors, the results have shown that the particle size and wettability of the powder greatly influence the spreading behaviors of the droplet. Finally, the characterization of the actual printed samples showed that the optimal process parameters obtained by the simulation study are close to the results of the experimental 3D printing process. In conclusion, the numerical simulation method proposed in this paper can effectively analyze the influence of particle-droplet interaction on the 3D printing process. The results also demonstrated that the droplet impact behavior was governed by the physical and dynamic characteristics of the binder/powder interaction system, rather than the only properties of binder droplet. An enhanced understanding of this interaction with this method might enable substantially higher printing accuracy and the biological activity while optimizing the amount of acid binder in the 3D printing process. Besides, it is a more efficient way to explore new materials’ printability applied to 3D printing of bone tissue engineering scaffolds.

2. Material and Methods

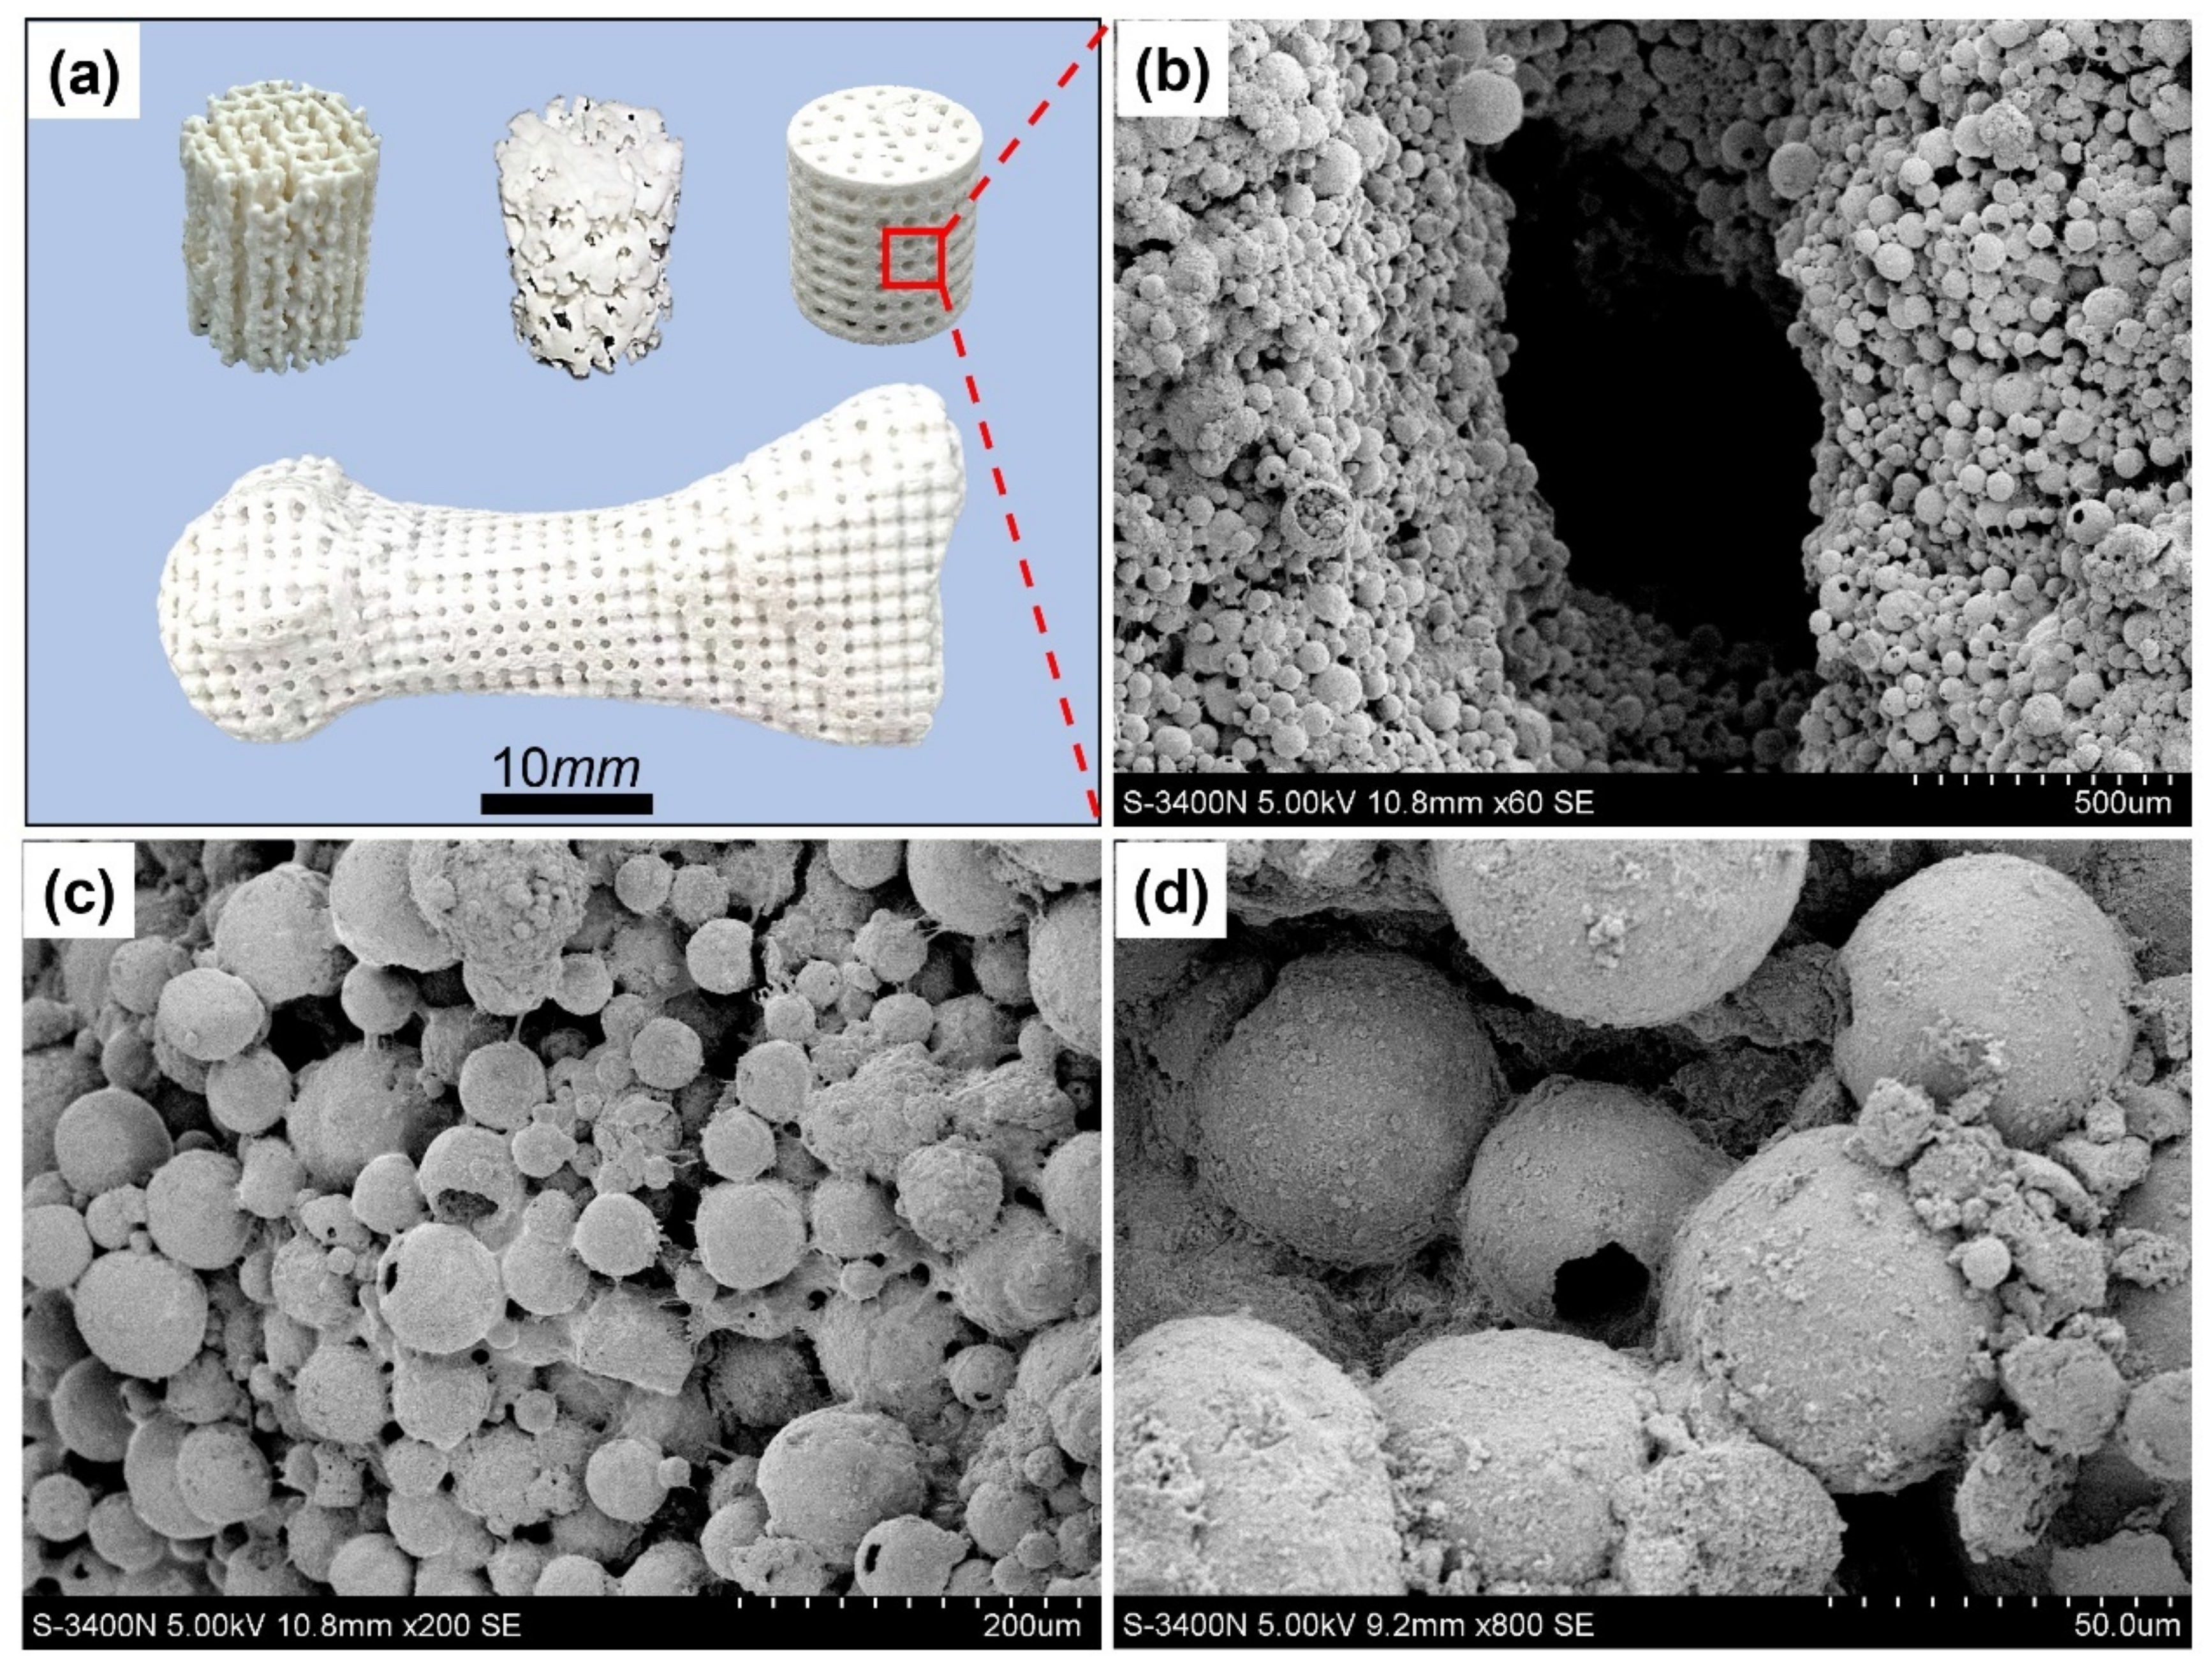
HA and β-TCP, as the most common types of calcium phosphates bioceramic that have been used in 3D printing bone scaffolds and implants (Figure 1), can create strong bonds to human tissues and degrade with physiological fluids and cellular activity [10], showing excellent biocompatibility [9]. By selecting optimal powder material and its particle size, artificial bone scaffolds’ biological and mechanical performance can be controlled.
In the 3D printing of bone scaffolds, the wettability of powder materials with binder and powder particle size not only affects the biological properties of bone scaffolds such as cell adhesion and biodegradable performance but also influences the parameters of the 3D printing process directly. The systematic evaluation of the key powder characteristics influencing 3D printability is a critical requirement for optimal results.

2.1. Low Impulse Droplet Impact Model

Many effective methods have been proposed and applied during the 3D printing process to avoid the excessive impact of droplets on the powder bed. The previous studies [8,12,13,16,41,42] showed that an appropriate packing density could avoid the excessive impact of droplets on the powder bed and achieve better printing quality. In the studies [43,44], moisture was applied to the powder bed to improve the powder bed stability.
In a previously conducted study [30], a diameter of 2.4 mm and a 50% concentration of glycerol drop impacting the glass bed were studied. With an impact momentum of 9.15 × 10⁻⁶ kg∙m/s and the Weber number of 47.56, the powder bed was obviously not damaged (Figure 2b).
In a similar study [12], a digital syringe was used to generate droplets impacting the CaP:CaSO4 powder bed to simulate the 3D printing process. In order to protect the powder bed from excessive droplet impact, the height of droplet volume of 30 μL to the powder bed was 8 mm. The impact momentum can be calculated according to the experimental parameters:
P = m · v = ρ · V · v
where P is the impact momentum, m is the mass, v is the impact velocity, ρ represents density (the value is 1.02 × 10³ kg/m3 here), V is the volume of droplet.
For the free-fall velocity v ,
v = g · t = 2 g h 2
where g is gravity,   h is the height of the droplet (8 mm), t is the time during free fall. The momentum was evaluated to be 1.2 × 10⁻⁵ kg∙m/s.
The Weber number W e can be given as follows:
W e = ρ v 2 d σ
where ρ is the droplet density, d is the droplet diameter, σ is surface tension (48 mN/m).
In this study, the print head of our homemade 3D printer was designed so that the binder droplet impact velocity was 2 m/s, the droplet diameter was 0.1 mm, and the binder density was 1.03 × 10³ kg/m3, the surface tension coefficient was evaluated to be 48 mN/m. The impact momentum and Weber number were compared in Table 1.
Table 1 reveals that the impact momentum and Weber number in currently employed 3D printing is lower than that mentioned in the previously conducted typical studies that examined the droplet impact without damaging the surface of the powder bed.
Furthermore, according to Agland et al. [45,46], when the Weber number is W e < 300, the droplets will spread on the surface of the powder without damaging the surface of the powder bed. Based on the comparison of the data given in 
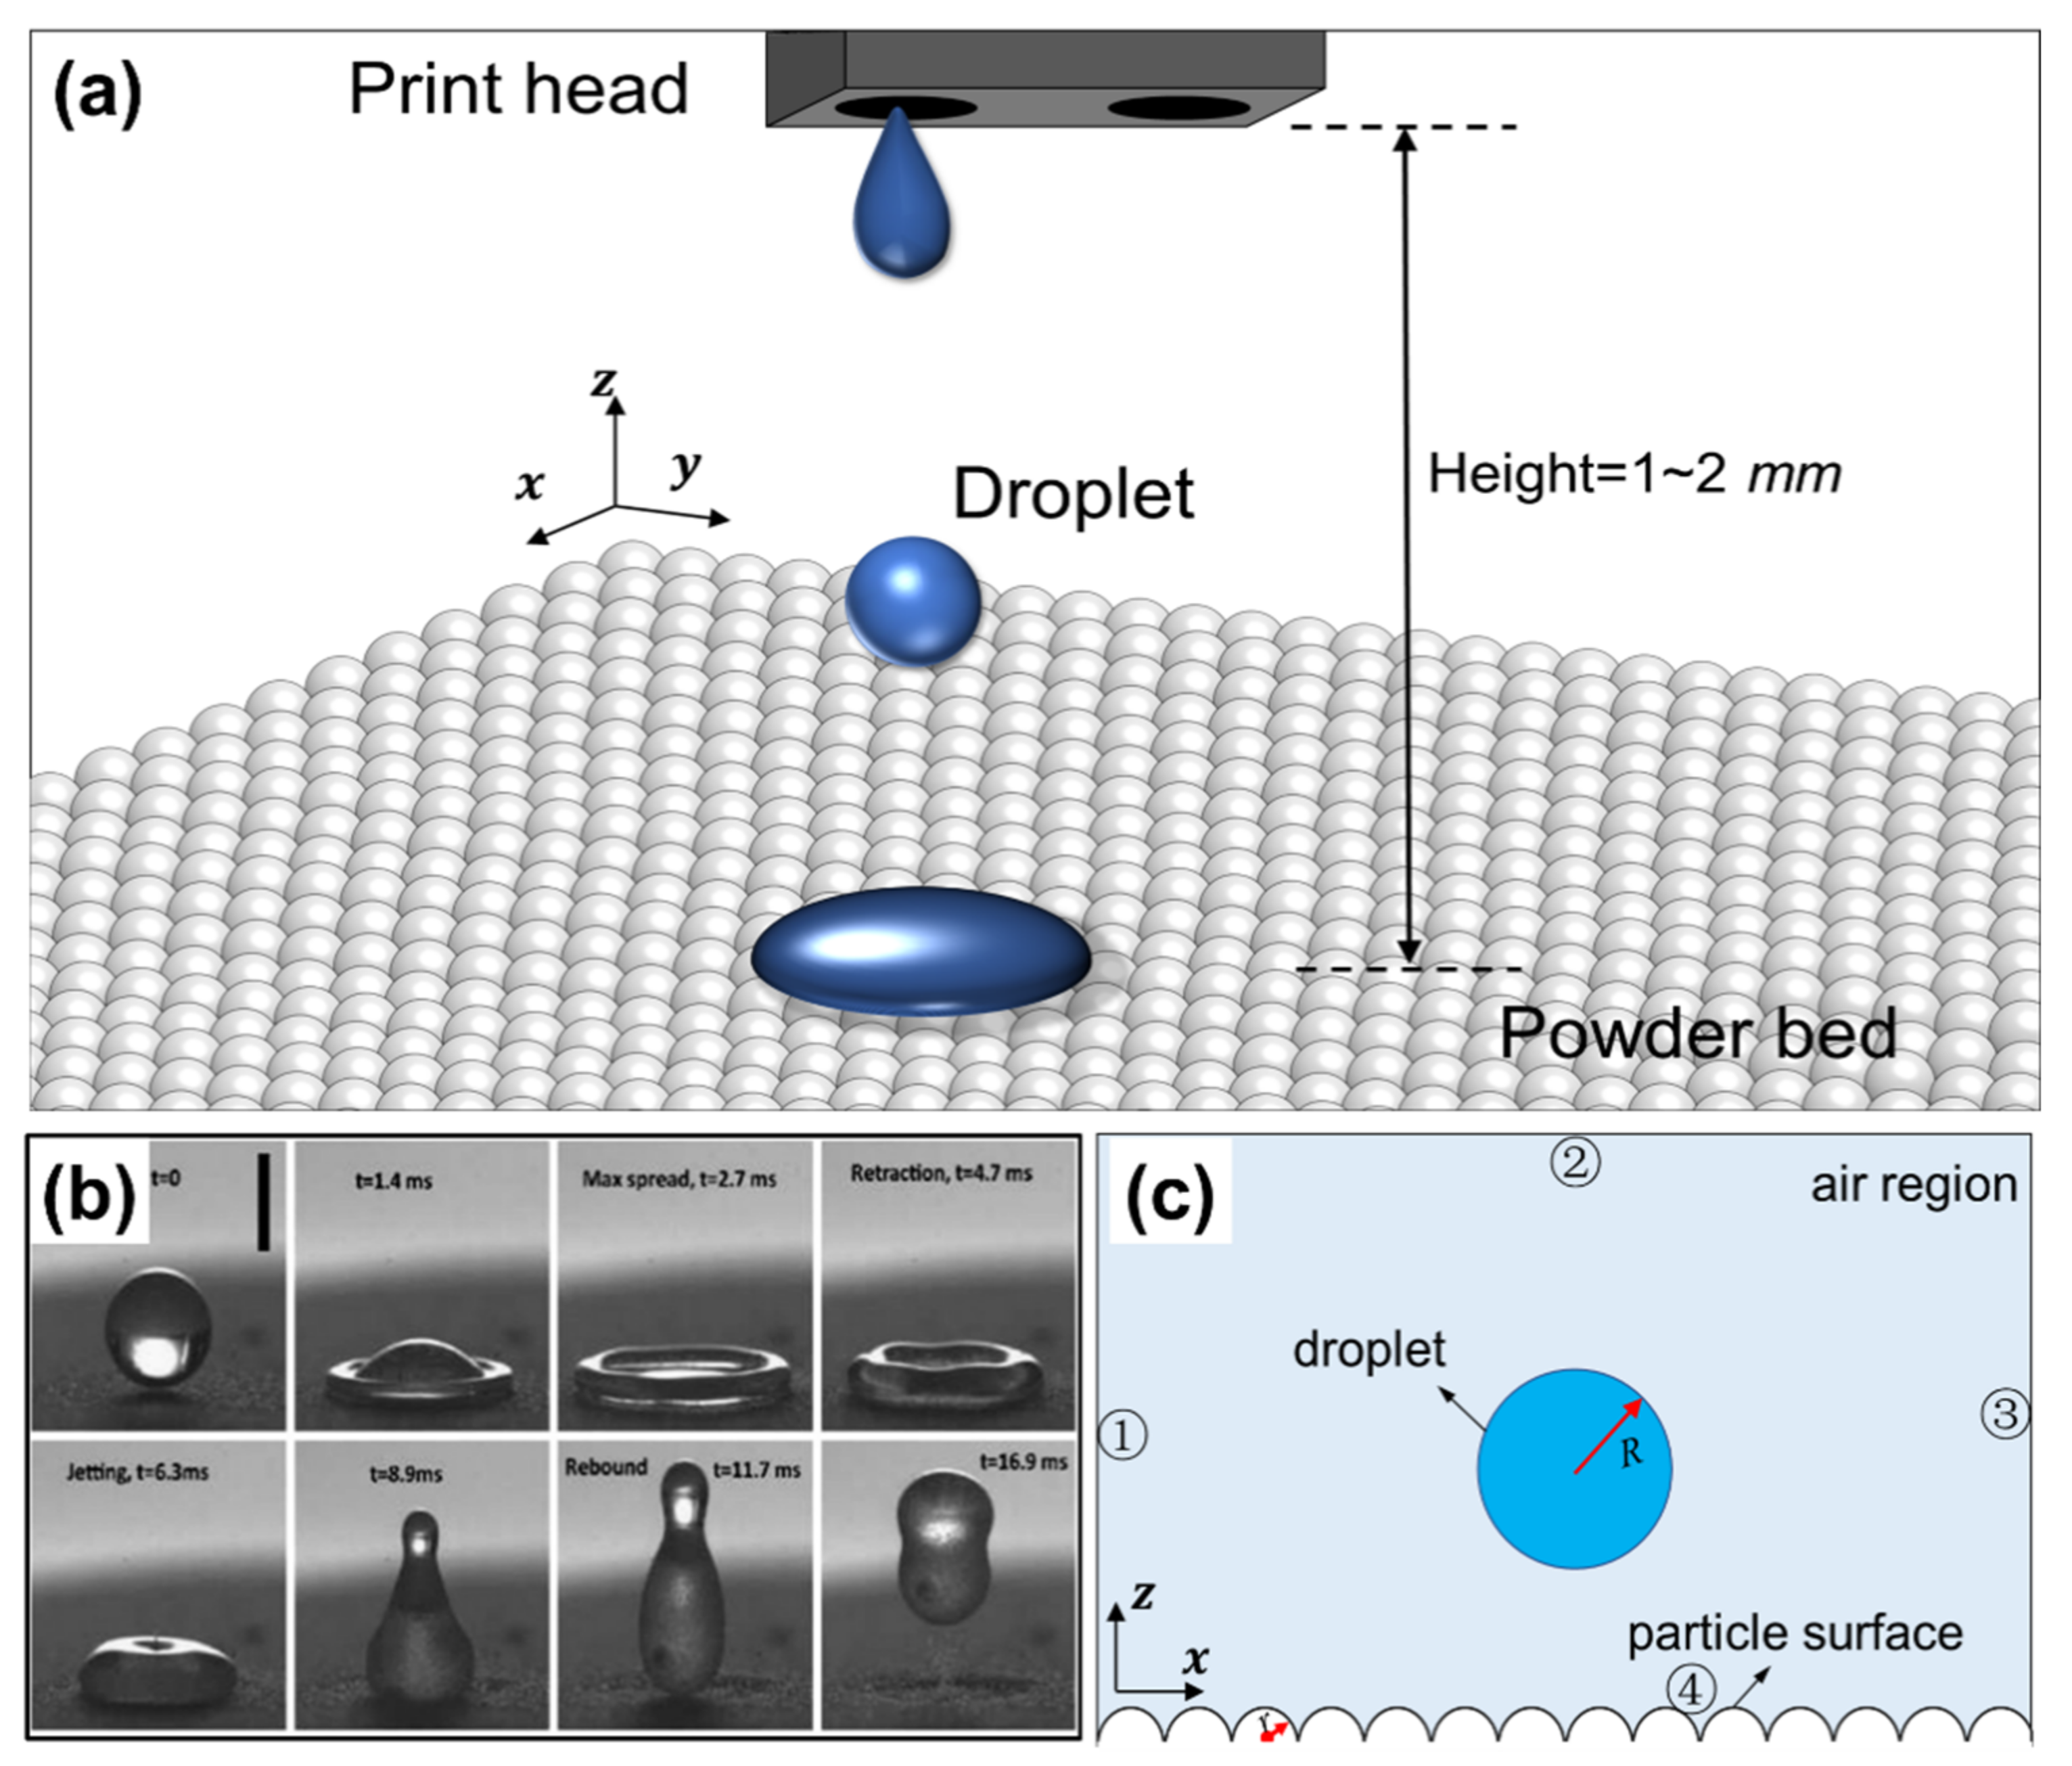
Table 1, the low impulse droplet impact theory is applicable to the 3D printing scene that the droplet impacts and spreads without destroying the powder bed. The problem of micro binder droplet impact in the typical process of 3D printing can be simplified to the model of a droplet impacting on multi-particles/spheres bed/substrate, whereas in the simplified model, the powder particles were well deposited and compacted, and there is no deformation and no slip between the small particles during droplet spreading. The idealized model of binder droplets impacting the powder bed under low impact momentum is shown in Figure 2a.

2.2. VOF Model for Droplet Impact on Powder Bed

In our study, a multiphase flow model (shown in Figure 2c) of binder droplet and the air was established to study the droplet impact behaviors. The continuum surface force model was used in the current study for surface tension. In the two-dimensional numerical simulation model, the boundaries ①, ②, ③ are defined by the conditions of the pressure outlet. The boundary ④ represented the particle bed surface as the conditions of the wall with wall adhesion. According to Francois et al. [47], the droplet contact angle varies in a narrow range, so here, it was set as a constant value to define the wettability of particle materials with the binder. The blue circular region was the liquid droplet phase, and the other region within the boundaries was the filled with air phase.

2.2.1. Governing Equations of Simulation

The impact and spreading of liquid droplets on the solid substrate is a transient and isothermal process involving droplet liquid phase and air phase, which means there is no mass or heat transfer between droplet and air. The continuity and momentum equations of the two-dimensional models can be represented as follows [48]:
ρ t + ρ v = 0
ρ d v d t = p + μ Δ v + μ 3 v + ρ F
where t is the time, ρ is the density, p   is   pressure ,   μ   is   dynamic   viscosity ,   v is the velocity vector, F is the body force.
The interface of droplet and air was tracked and calculated by the volume fraction of the fluid α i :
α i x , t = 0 a 1 0 < a < 1 ,   x t h e   p r i m a r y   p h a s e x t h e   m i x e d   p h a s e   x t h e   s e c o n d a r y   p h a s e
And the conservation equation for the VOF function is given by,
α i t + · v α i = 0
where v is the velocity, α i is the volume fraction of the i phase.
The surface tension is a force that acts only on the surface, in which case balance needs to be maintained. It serves to balance the radially inward intermolecular attraction and the radially outward pressure gradient [37]. The continuous surface force (CSF) model proposed by Brack Bill et al. [49] treats the surface tension into a continuous three-dimensional effect rather than a boundary condition of the interface. The surface tension effect is simulated by adding a source term F to the momentum Equation (5)
F = σ i j ρ k i α i 1 2 ρ i + ρ j
where σ i j is the surface tension, ρ is the density of the mixing unit in the two-phase flow, α i is the volume fraction of the i phase in the unit, α j is the volume ratio of the j phase in the unit, ρ i is the density of the i phase,   ρ j is the j phase density, k i is the surface curvature of the i phase. For the air-liquid flow model,
ρ = α 1 ρ 1 + α 2 ρ 2
According to the continuum surface force (CSF) model [49], k i can be expressed as,
k i = · n ^
n ^ = n n
n = a i
where n and n ^ are the normal vector and unit normal vectors of the liquid-gas interface.
In addition, when the interface is near a solid wall with a specified contact angle θ w , n ^ should be modified as follows:
n ^ = n ^ w cos θ w + t ^ w sin θ w
where n ^ w is the unit normal vector and t ^ w is the unit tangential vector of the wall.
Obviously, k i should be amended in connection with θ w near the wall.
Thereby, the moving of liquid-gas two-phase flow interface can be well tracked, and mass is conserved by solving the above equations.

2.2.2. Initial Boundary Conditions of Numerical Simulation

Using the software ANSYS Fluent, the spreading behavior of droplets was simulated with the method of VOF function. A multiphase flow model of binder liquid phase and air phase was established, in which the primary phase is air, and the secondary phase is binder liquid, as shown in Figure 2c. The coupling equations of pressure and velocities were solved via the pressure implicit split operator (PISO) method. The computational domain with two-dimensional grids is shown in Figure 2c. The droplet with an initial diameter D 0 impacts at a velocity of v 0 on a multi-spherical solid wall surface. Each sphere of the multi-spherical wall was of the mean diameter of the real calcium phosphate’ s powder particles. The boundaries ①, ②, ③ are defined by the conditions of the pressure outlet. The boundary ④ contained the conditions of the wall with wall adhesion and no roughness effect.

2.3. The Validity of the VOF Model

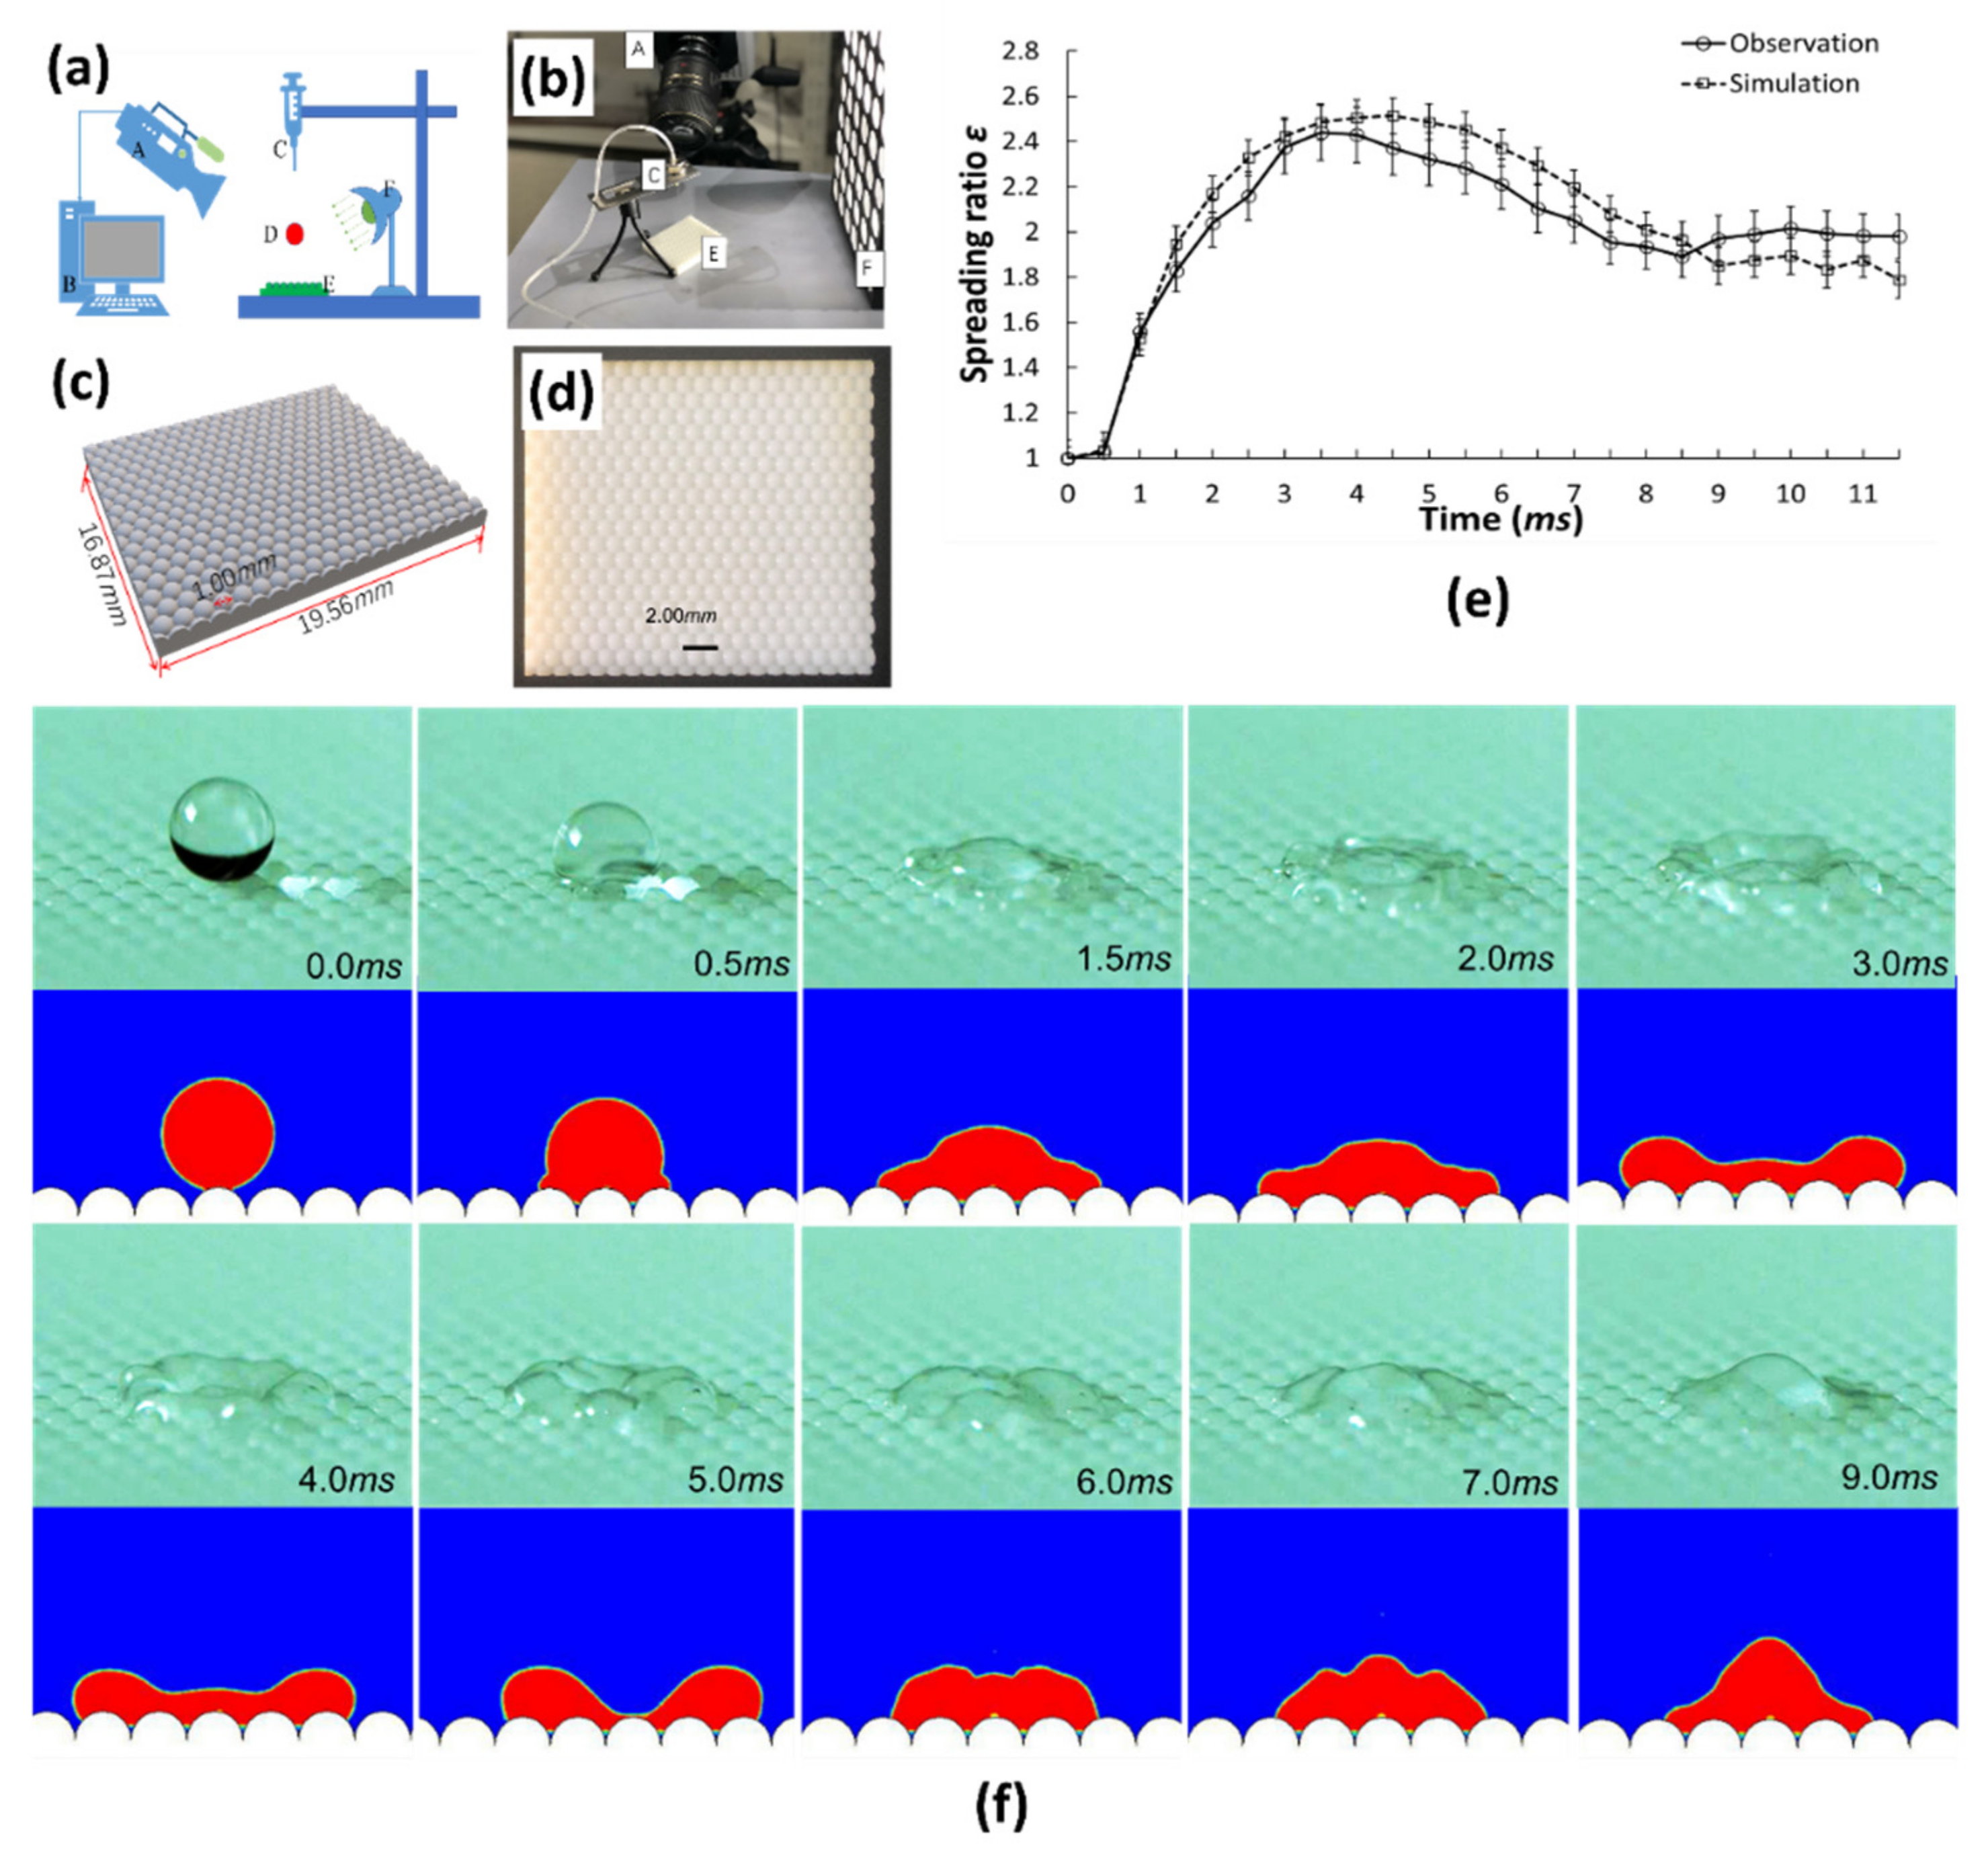
In order to test the VOF model proposed in this study, the observation experiments of millimeter-scale droplets spreading on the rigid substrate and the numerical simulations were carried out under the same conditions. What needs to be noted is that the millimeter-scale droplet is much easier to be generated and captured with common experimental equipment. The schematic diagram of test equipment is shown in Figure 3a–d.
The spreading behaviors were recorded using a high-speed camera (SA-X2, Photron, Tokyo, Japan) with 10,000 frames per second (fps) capability, and the images were saved in 1024 × 1024 pixels for subsequent analysis (shown in Figure 3b). A syringe (1 cm3) with a nozzle (32 G × 4 mm) was used to simulate the pure water droplet sprayed from the printhead. The water droplets detach off the nozzle with an initial speed of zero by slowly squeezing the syringe (shown in Figure 3a). The droplets’ impact velocities were adjusted by regulating the height of the droplets falling off the nozzle. The diameters of the water droplets were about 2.2 mm, and the impact velocities were about 1 m/s in this experiment. The actual impact velocity of the droplet was then corrected according to the results of the photos taken by the high-speed camera. The multi-particle/sphere substrate was prepared by high precision stereolithography equipment (lite600, Union Tech, Shanghai, China). The single-particle size of the substrate was 1 ± 0.05 mm in diameter. The CAD design model is shown in Figure 3c, and the solid model is shown in Figure 3d. The simulations were carried out under the condition similar to the actual experimental parameters, in which the droplet diameter was 2.2 mm, the velocity is 0.991 m/s, density was 0.998 × 10³ kg/m3, the viscosity was 0.894 mPa·s, the surface tension was 71.94 mN/m, and the particle diameter of the substrate was 1.0 mm, and the Weber number was 30.52.The static contact angle of the substrate material with pure water was 92°, which was measured to be used as an attached boundary condition for the numerical simulations.
In the results analysis, the spreading ratio ε was defined as the ratio of the spreading diameter of the droplet to its initial diameter, which is a key parameter to evaluate the binder droplet spreading behavior on the bioceramic particle surface. The spreading ratio ε is defined as follows:
ε = D l D 0
where D l is the spreading diameter of the droplet, and D 0   is the initial diameter of the binder droplet.
During the whole collision process, the shape of the water droplet changing at different times can be accurately reproduced by consistent simulation (see the image in Figure 3f). While comparing the experimental data with simulation results (Figure 3e), the error of maximum spreading ratio was less than 3.1%. Considering that the simulation results are based on ideal conditions, the results were acceptable. The agreements between the simulation results and the experimental data suggest that the VOF model effectively simulated the droplet impacting process.

2.4. 3D Printing, Simulation and Characterization

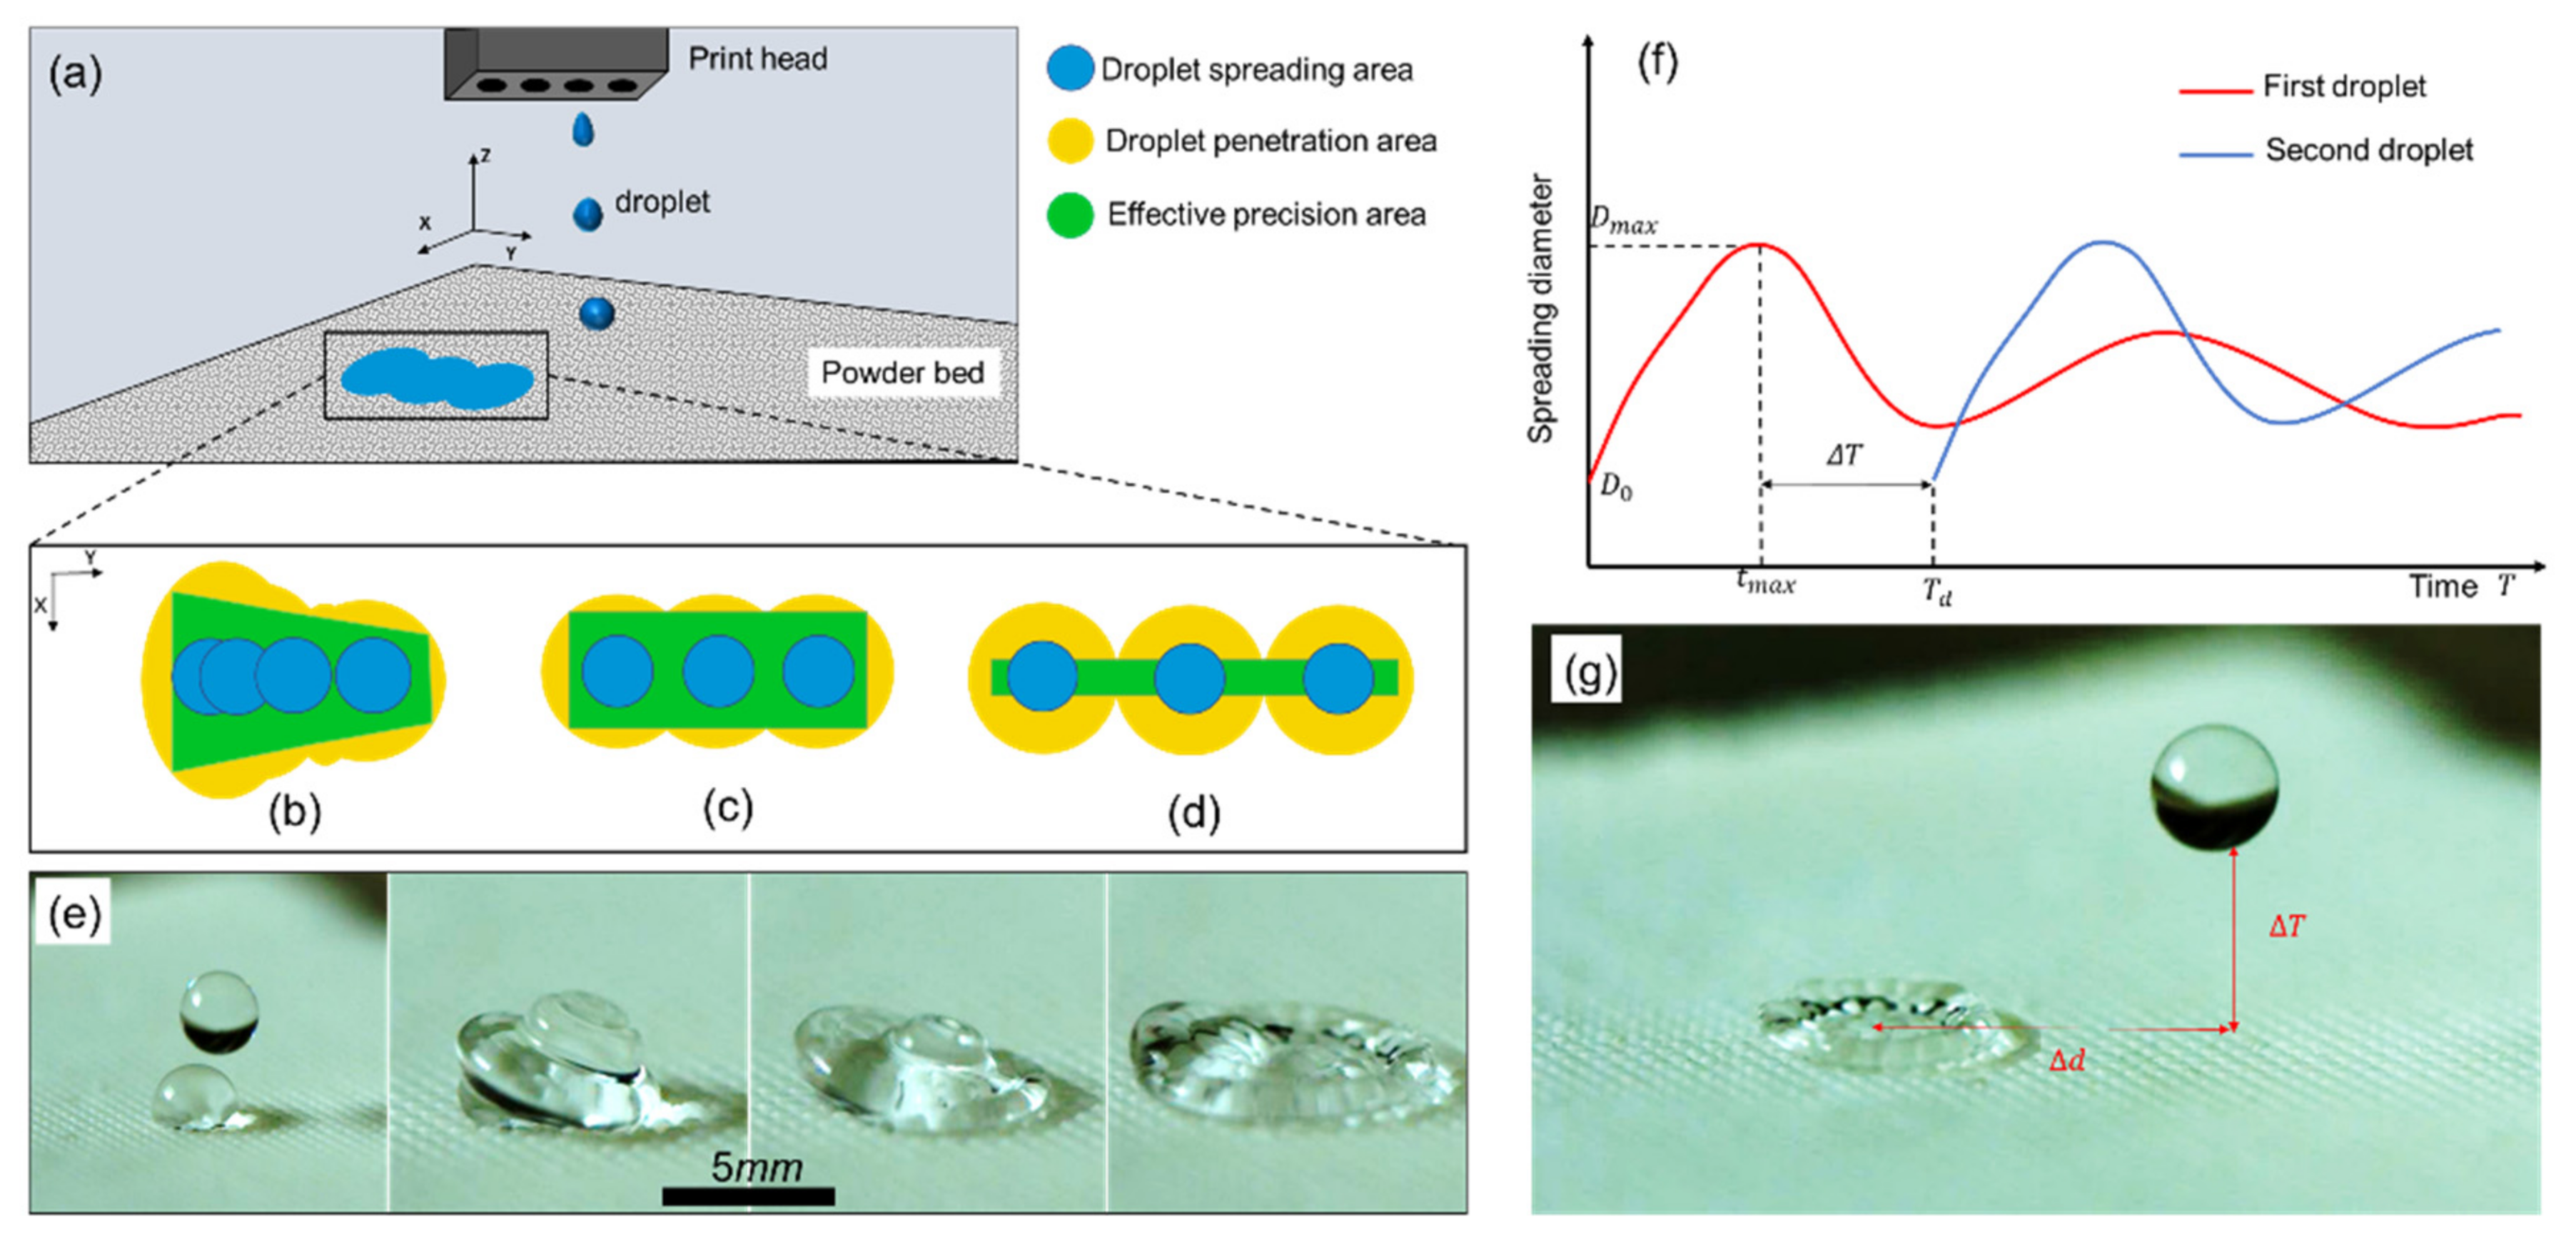
The significance of the maximum spreading diameter in the 3D printing process mechanism in this study must be introduced first. The spreading behavior of droplets determines the final printability of the binder/powder system (shown in Figure 4a) in 3D printing. The droplets spreading interference (a captured diagram of millimeter-scale droplets shown in Figure 4e) caused by the over-narrow space of the droplets position leads to the imbalance of binder penetration. As a result, part of the region of excessive penetration occurs as shown in Figure 4b; meanwhile, too much spacing between droplets leads to a binder blank area, and the desired effective adhesion cannot be formed, as shown in Figure 4d. The optimal droplet spacing distance makes the droplets spread without interference with each other, and the desired region of the powder is effectively achieved after the droplet penetration, as shown in Figure 4c. Regarding the printing accuracy, the consistency between the area of precision printed and the area of design guarantees the accuracy. On the other hand, the final penetration area minus the effective precision area is the printing error. Figure 4f,g are the schematic diagram of the spreading of two droplets, where the t m a x is the maximum spreading time, T d is the droplets’ spreading interval, D m a x is the largest spreading diameter, and Δ T is the time difference between the two droplets.
Under the condition of no interference between droplets during spreading, the maximum spreading performance of droplets determines the minimum droplet spacing distance. That is to say, the droplets deposition distance between two droplets is greater than or at least equal to twice the maximum spreading radius (as shown in Figure 4g); the mathematical expression can be explained as follows,
Δ d   ε m a x · D 0
where ε m a x is the maximum spreading ratio, D 0 is the initial diameter of the droplet. The droplet deposition distance Δ d is defined as the distance between the centers of two adjacent droplets on the XY plane.
In theory, according to the definition of dots per inch (DPI), the relationship between deposition distance Δ d and printing DPI is as follows,
D P I = 1 i n c h Δ d
Based on Equations (14) and (15), the relationship between 3D printing resolution DPI and the maximum spreading ratio, ε m a x can be expressed as,
D P I 1 i n c h ε m a x · D 0
So, the optimal DPI can be deduced by the study of the maximum spreading ratio.

2.4.1. Simulation of 3D Printing Parameters

To verify the effectiveness of this study, a simulation based on our 3D printing device parameters was performed. The droplet spray velocity by the print head was 2 m/s, the droplet diameter was 100 μm, the mean diameter of the HA powder particles was 40 μm, and the thickness of the layer was 0.1 mm. The static contact angle between the powder material and the binder was 98°.
Using the software ANSYS Fluent, a multiphase flow model of binder droplet and the air was established in which the primary phase was air, and the secondary phase was binder liquid. The coupling equations of pressure and velocities were solved via the PISO (pressure implicit split operator) method. The two-dimensional computational domain with grids is shown in Figure 2c. To improve the accuracy of the calculation, the near-wall grids were densified self-adaptively. The number of cells patched for the binder droplet during the simulation was 1665. The minimum grid spacing was 0.01 μm. The corresponding time step, 1.0 × 10⁻⁷ s, was of good efficiency and convergence.
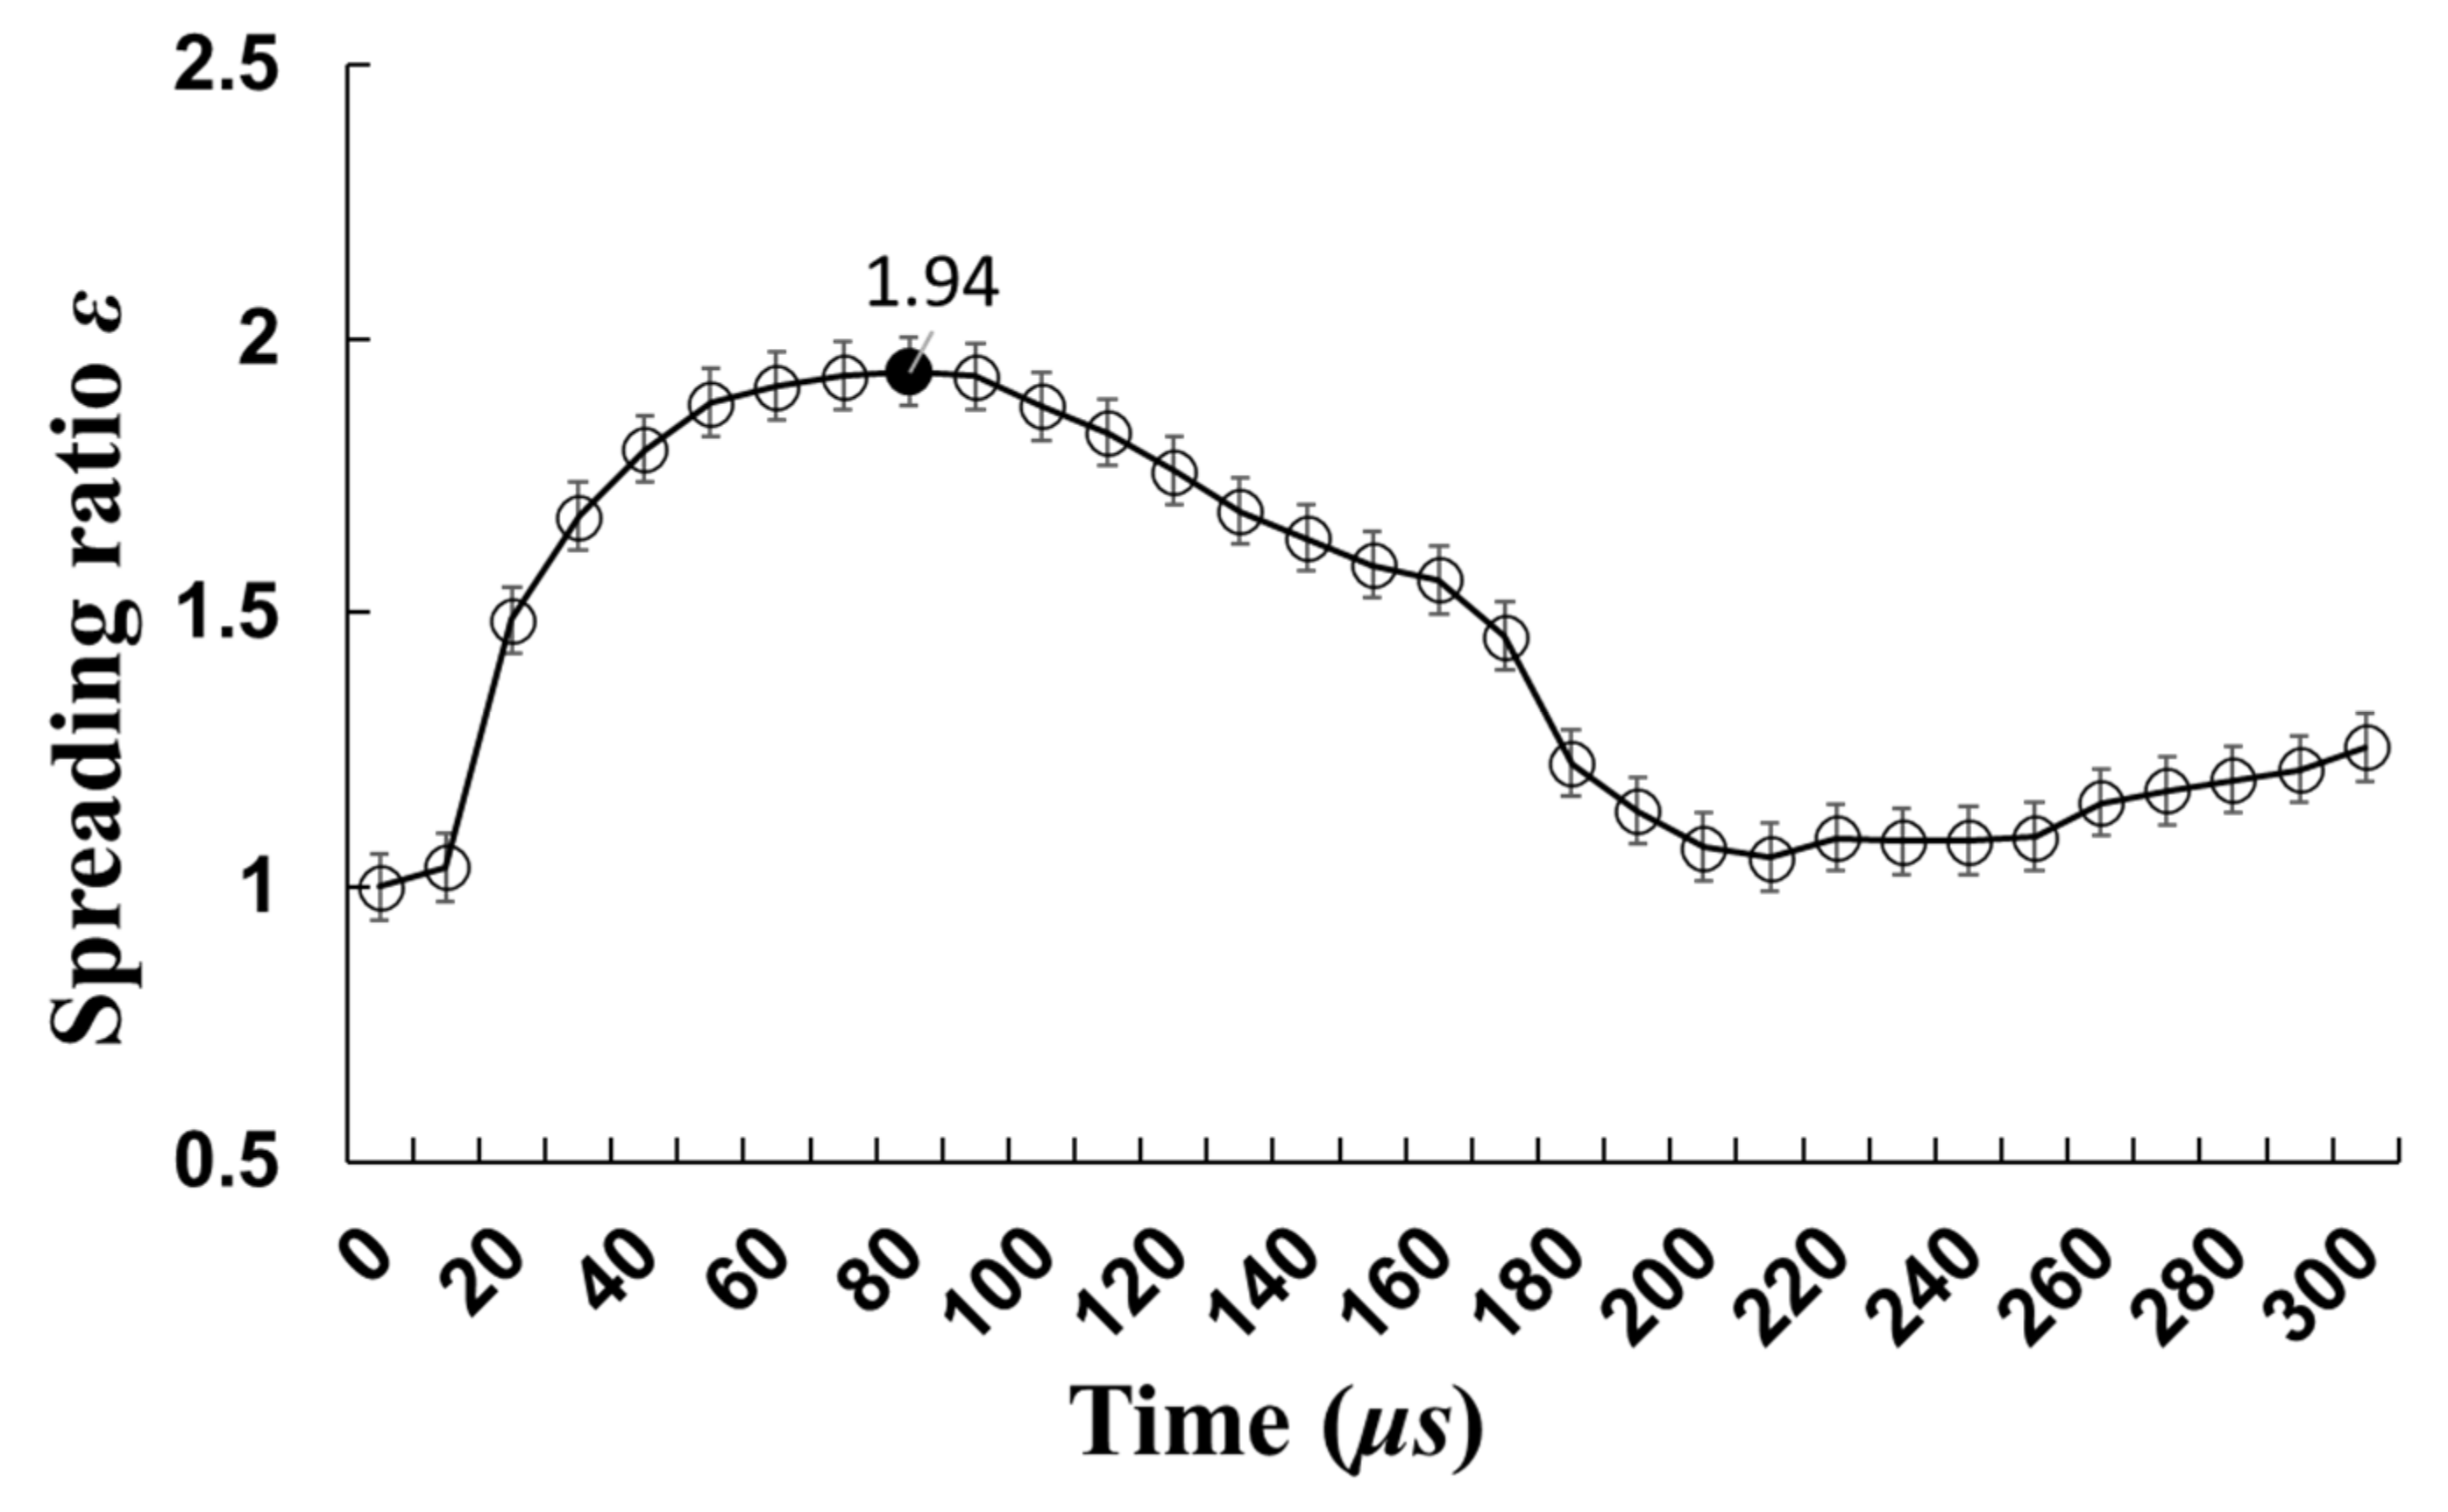
The results are shown in Figure 5. Referring to the effect of the maximum spreading ratio on print DPI, the maximum spreading ratio during the 3D printing process was about 1.94, and the optimal DPI was about 131.

2.4.2. 3D Printing

To verify the simulation results, the experiments were conducted using a modified 3D printer (ZPrinter160, Zcorp, Rockhill, SC, USA). The components of biological glue are phosphoric acid (8.75 wt.%) and Polyvinyl alcohol (PVA, 0.25 wt.%) aqueous solution. The PVA (molecular weight 72000, AR Grade) was purchased from Sigma Aldrich (Sigma-Adlrich, St Louis, MI, USA). The phosphoric acid (85%, AR Grade) was purchased from Nanjing Chemical Reagent Co., Ltd. (Nanjing Chemical Reagent, Nanjing, China). The HA powder (AR Grade) was donated by Bone-Tec Co., Ltd. (Bone-Tec, Xi’an, China). The cylindrical samples with a diameter of 10 mm and height of 15 mm were 3D printed with six groups of printing resolution for testing. There were five samples printed in a certain group for testing of physical and mechanical properties. The basic 3D printing parameters are shown in Table 2.

2.4.3. Characterization

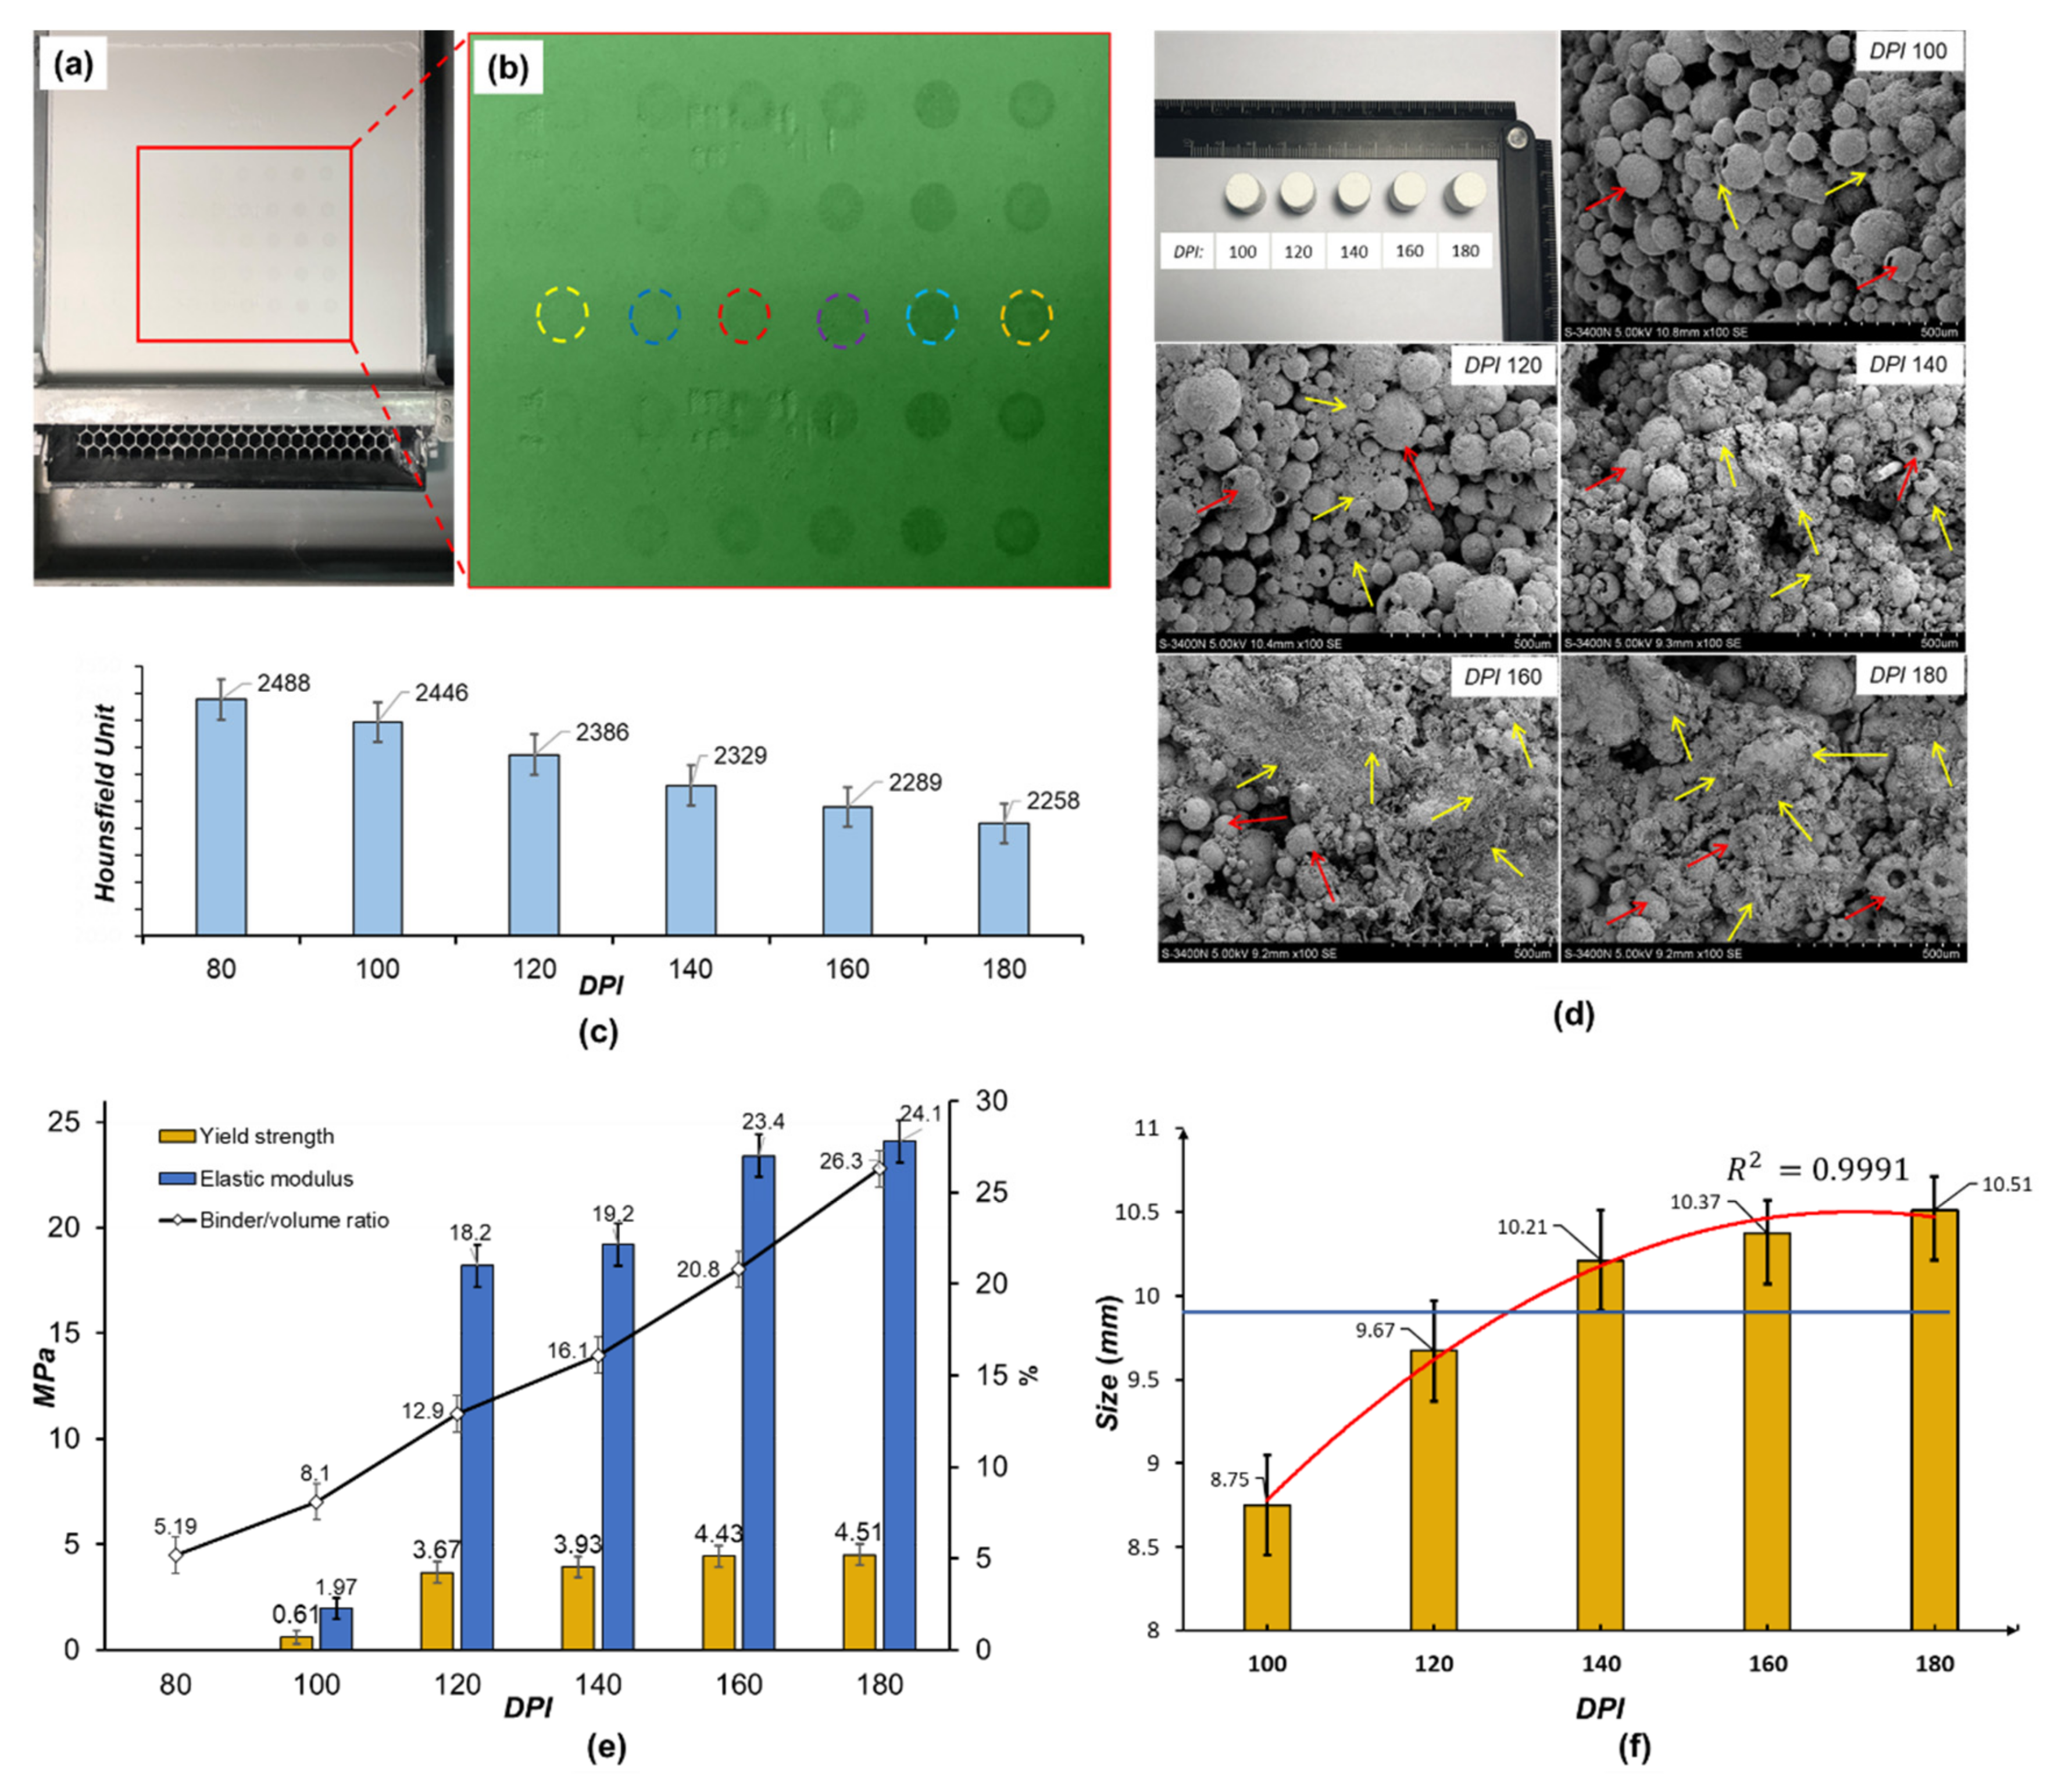
Print Resolution Analysis

The sample sections of powder bed printed with different resolutions during the printing process were recorded and analyzed. Although the phosphoric acid/polyvinyl alcohol binder liquid is transparent, the powder bed printed with different resolutions of binder exhibited a different color.
The Hounsfield Unit (HU) was used to evaluate the difference of samples printed in different resolutions by analyzing the grey values of the grayscale images corresponding to varying print resolution of the binder. The software Magics (Materialise, Belgium) was used to process the histograms of Hounsfield Units.
The HU is a tool for defining the radiodensity of the object in CT scanning with a linear transformation of the X-ray attenuation coefficient [23]. HU is defined as follows,
H U = μ x μ w a t e r μ w a t e r μ a i r × 1000
where μ x is the X-ray attenuation coefficient of the scanned object, μ w a t e r is the X-ray attenuation coefficient of the water, μ a i r is the X-ray attenuation coefficient of the air.

Mechanical Tests

To obtain the compressive properties of samples, a testing machine (CTM8010, XQ Co., Ltd., Shanghai, China) was used. Following the ASTM D1621-2016 standard test method, the samples were compressed at an across-head speed of 1 mm/min to get the yield strength and elastic modulus. Three samples were measured to get the average value for every kind of sample.

Print Accuracy Analysis

The accuracy of 3D printed scaffolds is a key factor that determines cell infiltration and tissue ingrowth with a fine microstructure mimicking natural cancellous bone. The printing accuracy of the cylinder samples printed with different DPI were tested by measuring the outside diameter of the cylinder. Each sample was measured at three places, and a total of three samples were measured to get the average value for one kind of sample.

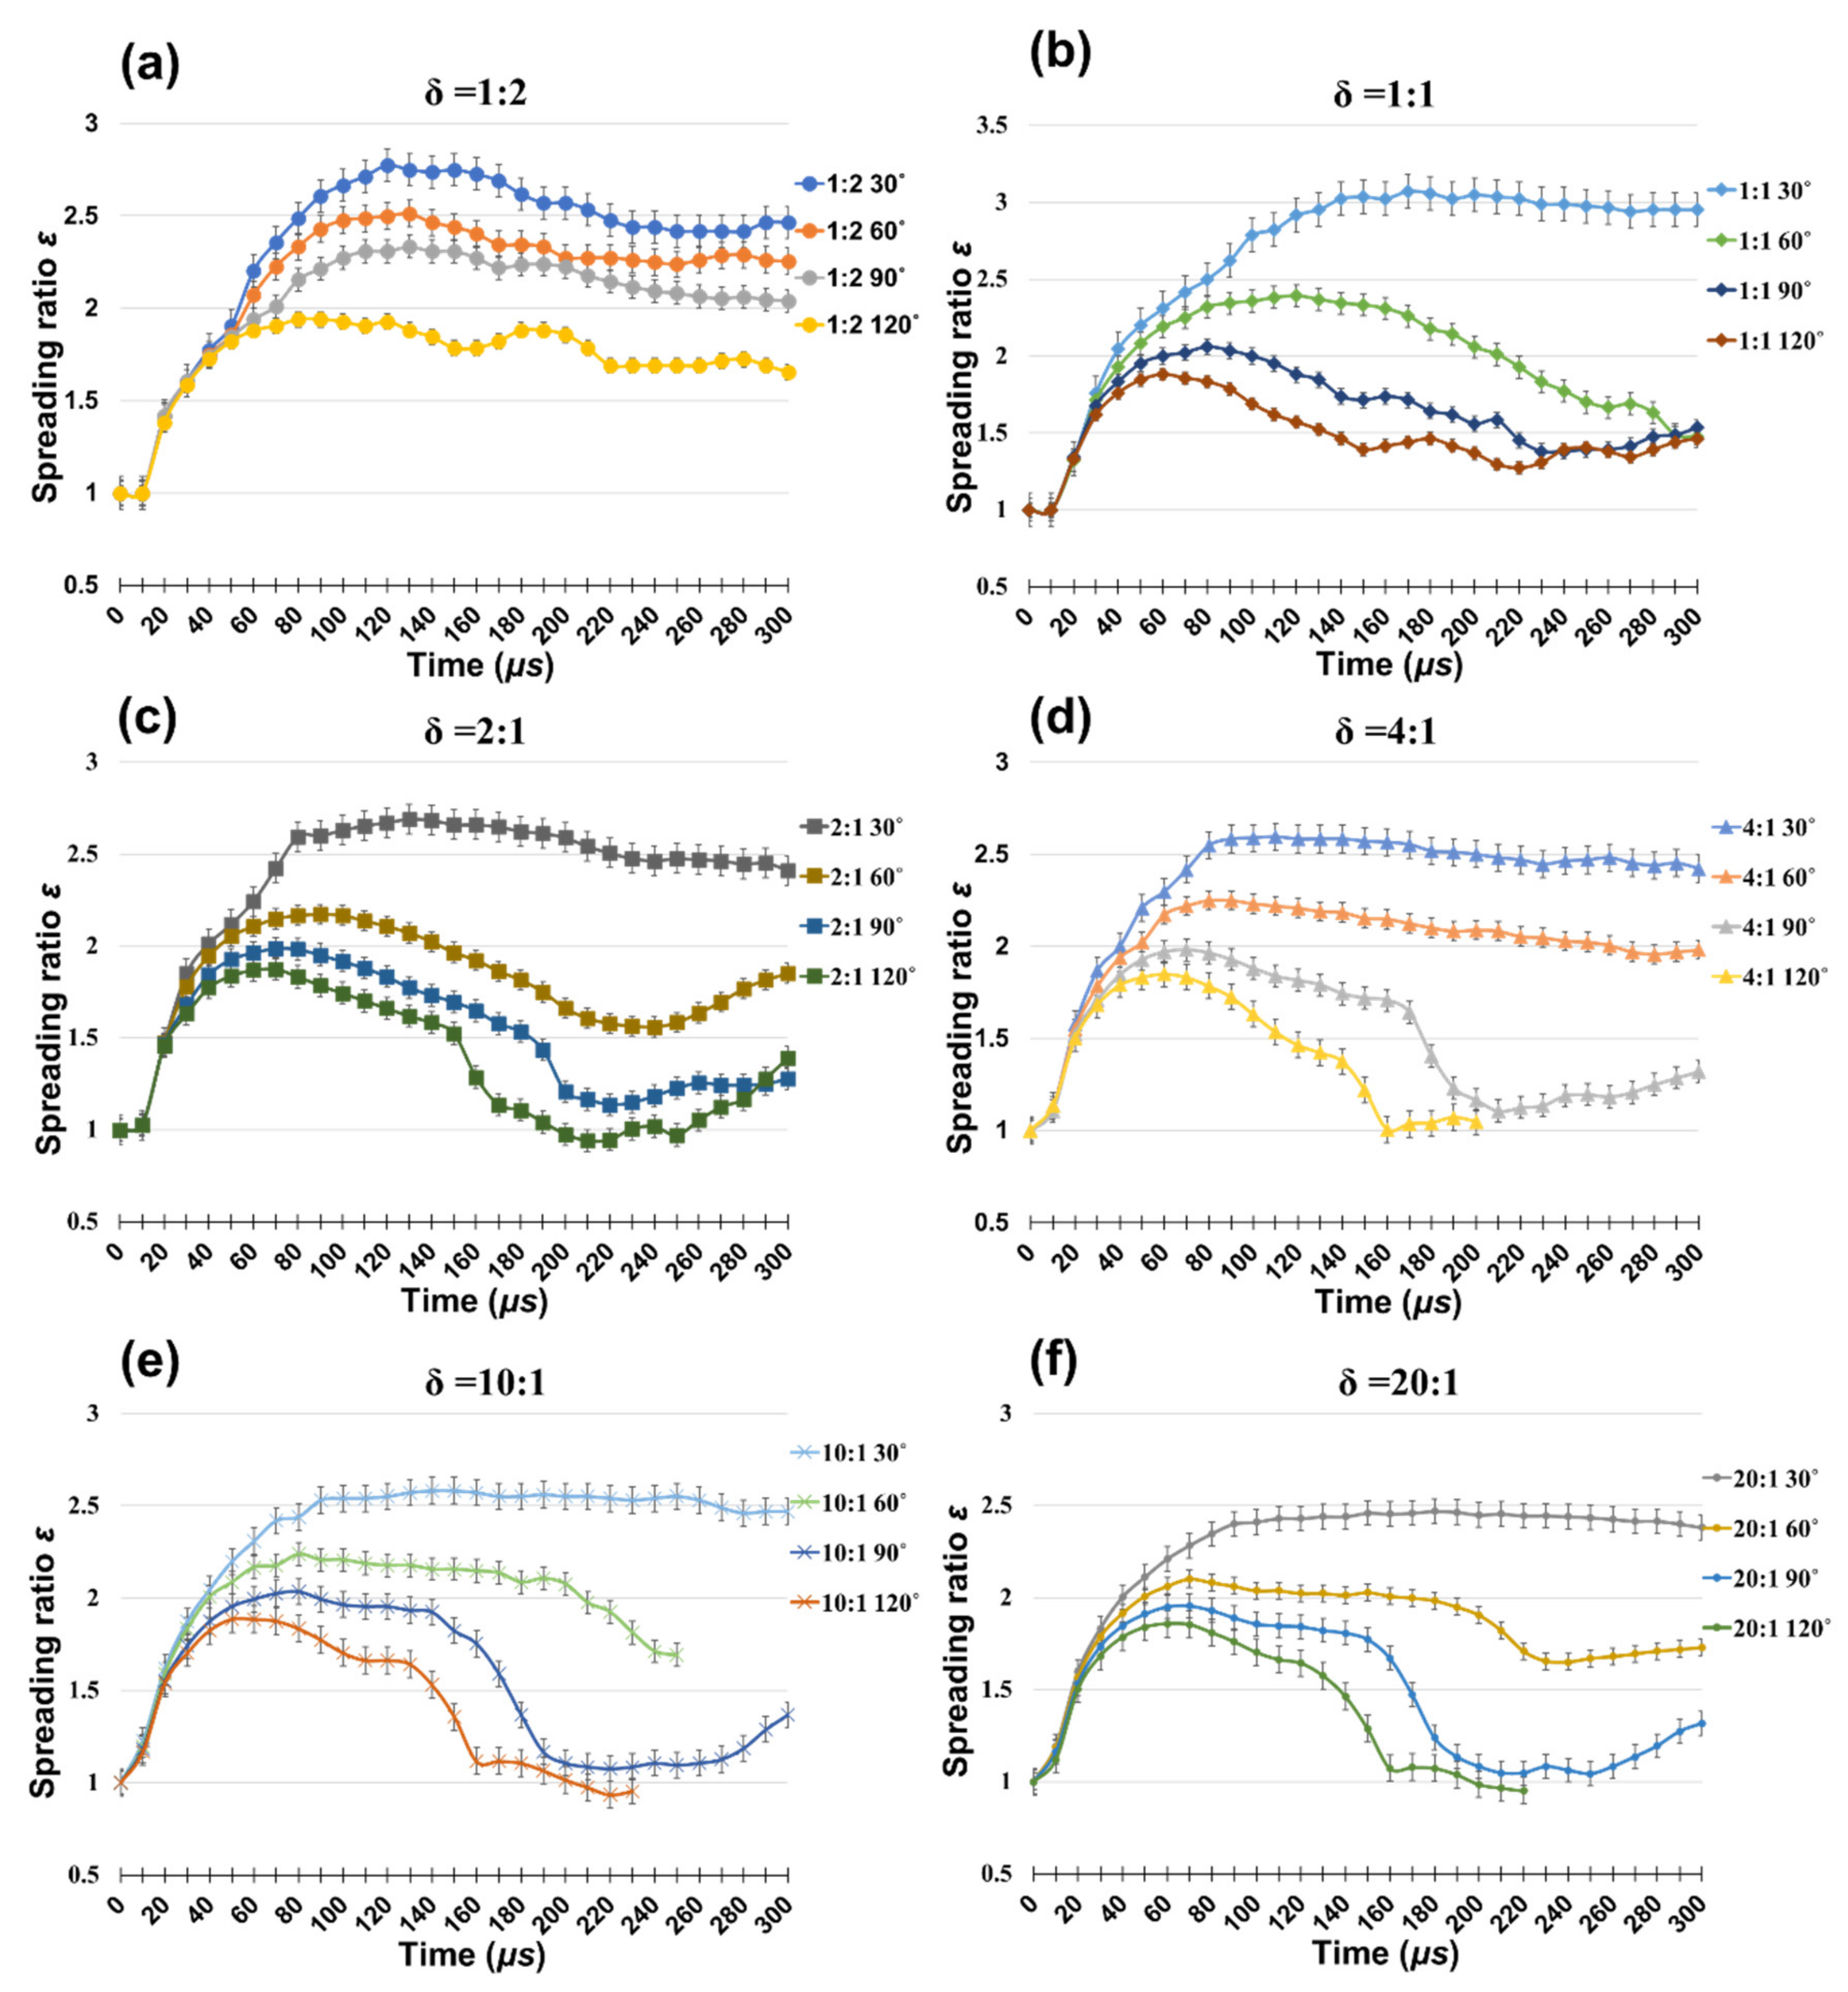
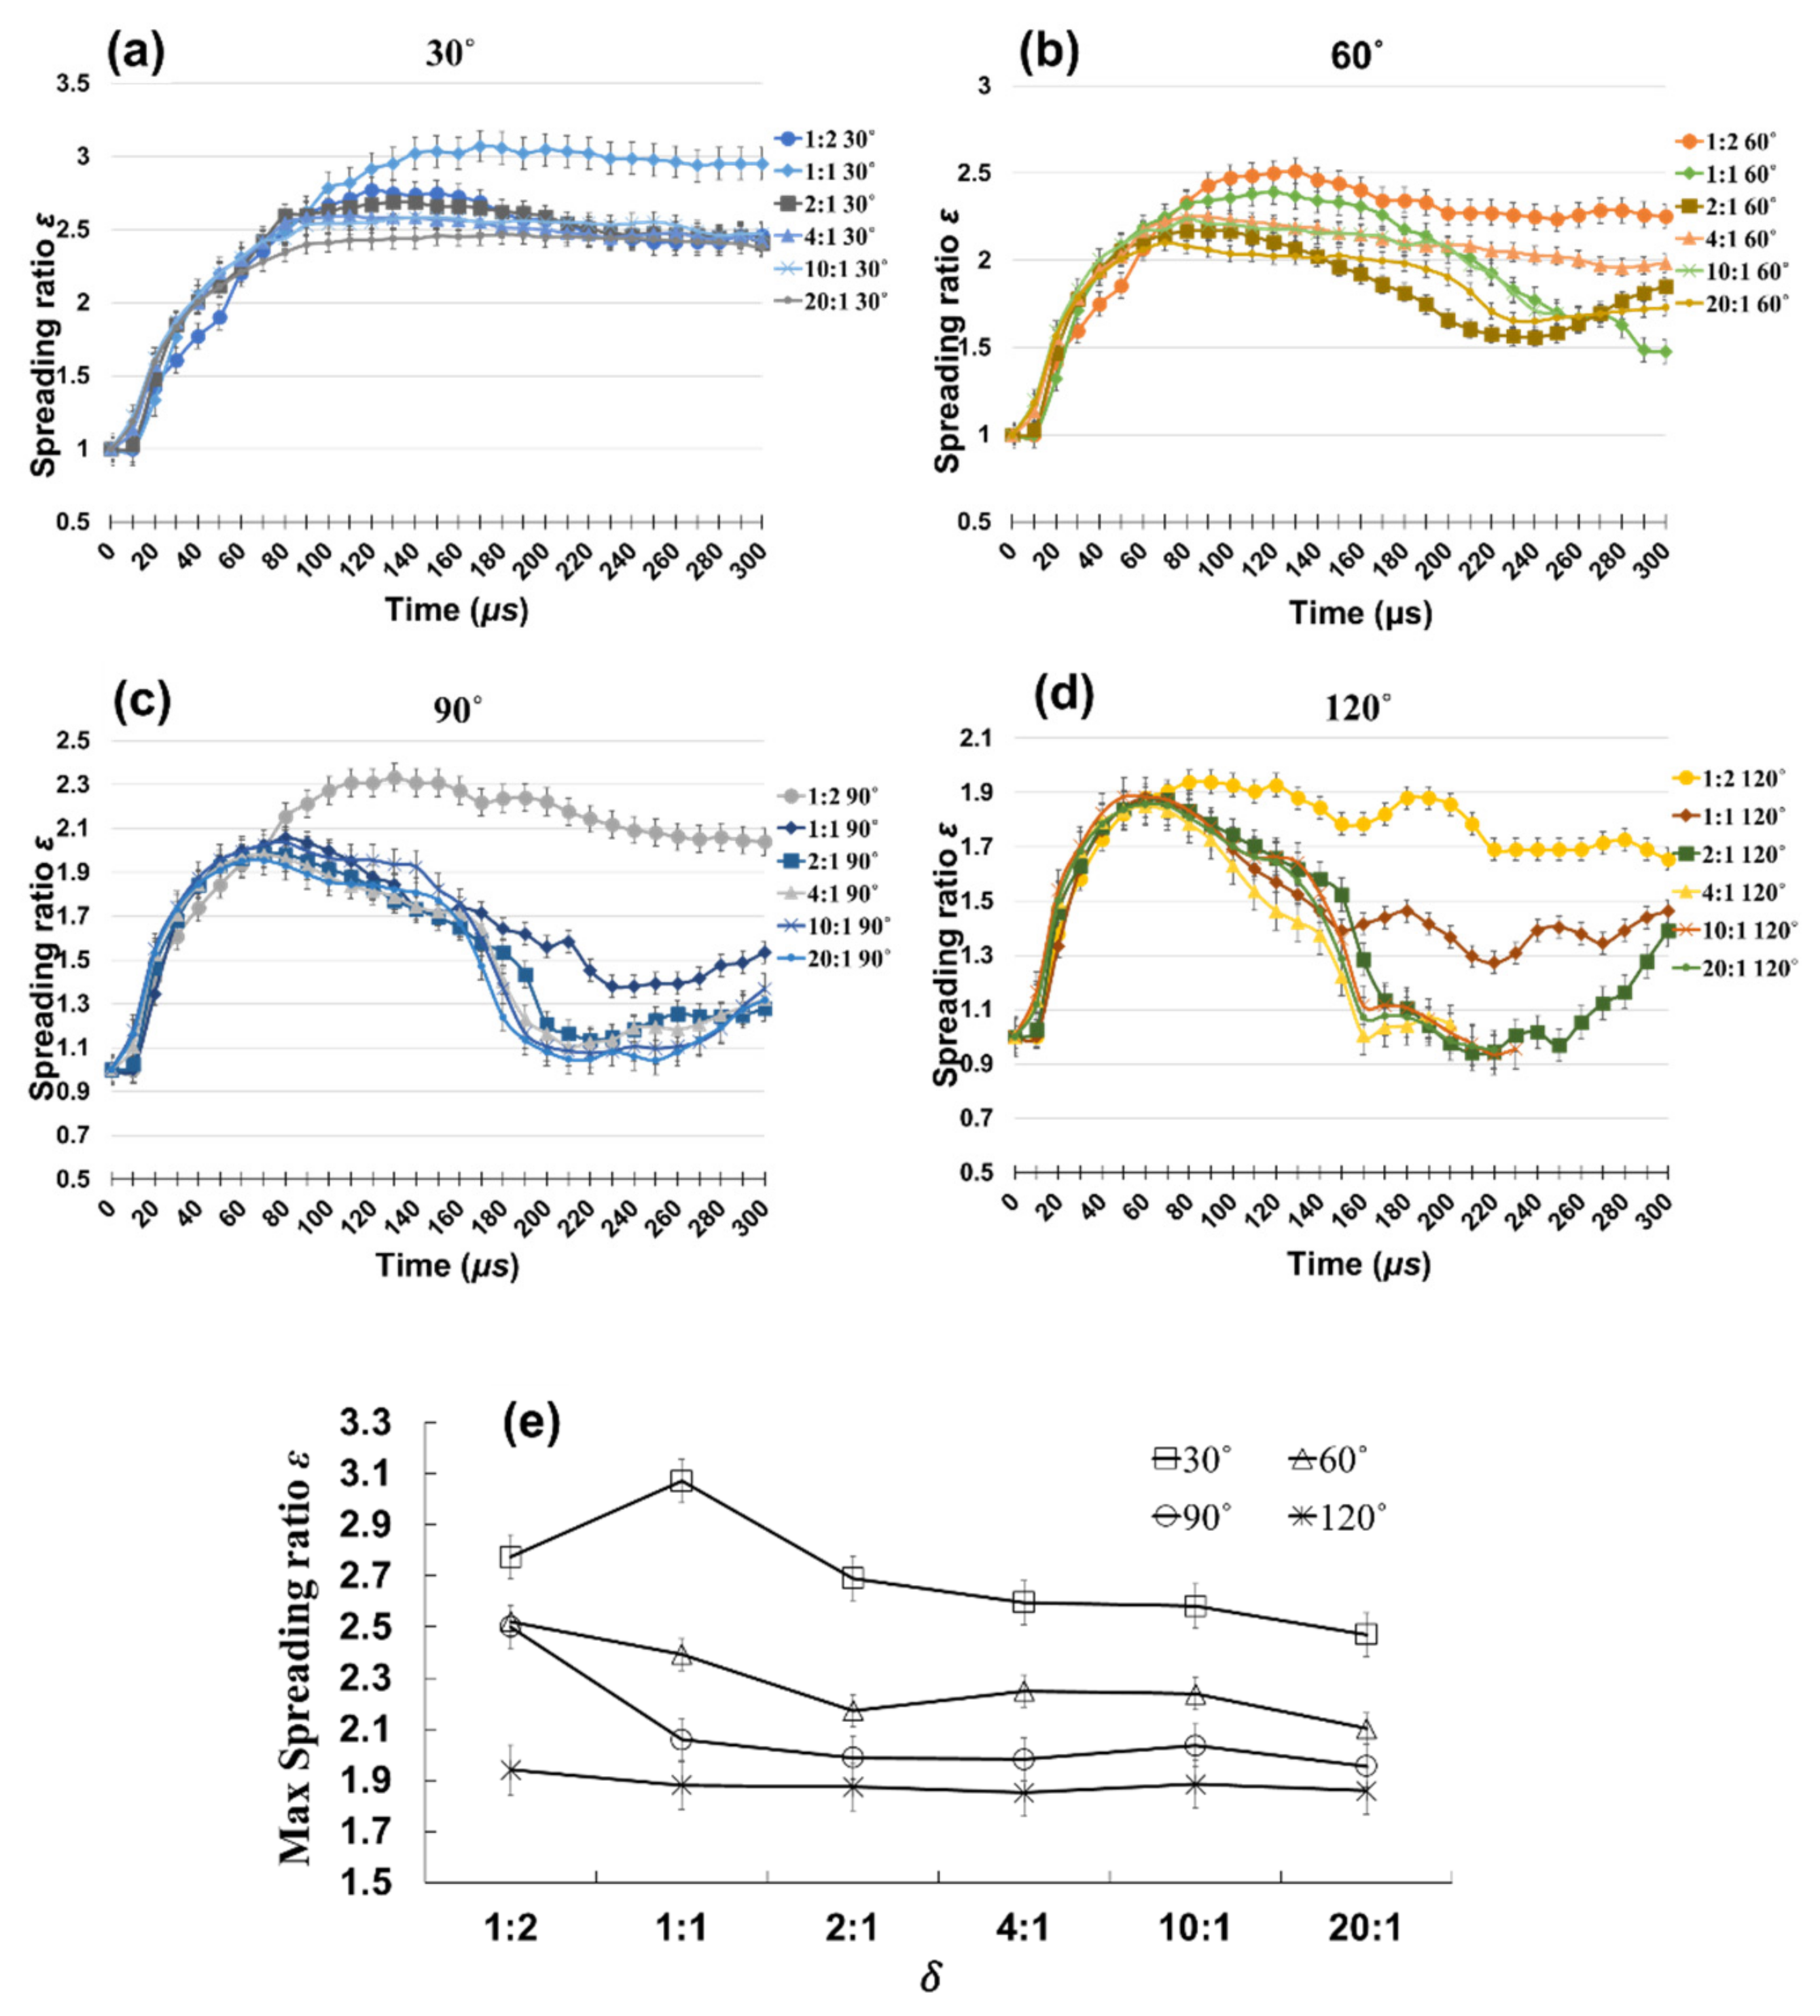
2.5. Simulation of Micron-Sized Droplet on Different Powder Bed

To explore the common rule of droplet impact affected by particle size and wettability of powder, the spreading behavior of micro droplets on powder beds with different contact angles and particle sizes were simulated. And the effects of particle size and wettability of powder by binder on the droplet impact and the dynamic characteristics of droplet spreading were studied and analyzed. The results are supposed to provide process parameter guidance for the application of new materials in 3D printing.
Since the Weber number (which was 8.58 in Table 1) of this section is close to that of the experiment of Section 2.3 (which was 30.52), based on the similarity theory [50], the validated VOF model can be applied to the study of this section.
In practice, the particle size of the powder used in 3D printing varies from sub-micrometers to hundreds of micrometers. In these simulations, powder bed substrates were built with six different particle sizes, including 200 μm, 100 μm, 50 μm, 25 μm, 10 μm, and 5 μm. The contact angles were selected to be 30°, 60°, 90°, 120° to define the wettability of powder materials, which covers the typical range of powder materials. The binder droplet impact velocity was 2 m/s and a diameter of 100 μm. The binder’s dynamic viscosity was 1.42 mPa·s; density was 1.03 × 10³ kg/m3, and the surface tension was 48 mN/m. The height of the binder droplet from the powder bed was 0.05 mm for all simulations. The two-dimensional numerical simulations of a single microscopic droplet impacting a multi-particle powder bed were carried out.
In the simulation results analysis, a nondimensionalized δ was defined as the ratio of droplet diameter to powder particle diameter, δ is as follows:
δ = D 0 d s
where D 0   is the initial diameter of the binder droplet,   d s is the particle/sphere size of the powder bed.

3. Results

3.1. The Characterization and Validity of 3D Printing Process

Figure 6a was taken during the printing process, which was enhanced and processed to get a grayscale image (shown in Figure 6b) used for the analysis of the amount of binder usage according to the HU value. The results (shown in Figure 6c) indicate that a higher printing resolution causes a lower HU value.
After 3D printing, the samples were cleaned with compressed air to remove the unbound powder to obtain the actual structure. It should be noted that the samples printed in DPI 80 collapsed during the de-powdering process due to poor green strength (the green strength means the yield strength of printed samples without any post-processing treatments). As a result, DPI 80 samples were excluded from all the next statistical analyses in Figure 6d–f.
From the SEM photographs (Figure 6d), the different amounts of binder usage can be seen clearly. It is difficult to identify the bioceramic particles of samples printed in DPI 160 and DPI 180, where the particles are almost completely coated with cured binder.
This fact can be analyzed through the binder/volume ratio, which was 20.8% and 26.3% in DPI 160 and DPI 180, respectively (Figure 6e). The binder/volume ratio is a process parameter used to measure the amount of binder [8,51,52].
Focusing on the mechanical properties shown in Figure 6e, the powder-based samples could be saturated or oversaturated by the binder, to some extent, resulting in an increase of the mechanical performance. However, an excessive use of binder fails to improve the yield strength significantly, as shown in Figure 6e for DPI 160 and DPI 180.
With the characterization of the actual printed samples Figure 6e, when the DPI was reduced from 180 to 120~140, the green strength was reduced by 17.9~20%, and the usage amount of binder could be reduced by 38.8~50.1%. Considering that the final mechanical properties of the 3D printed products depended on the post-processing treatments including chemical treatment and sintering, a little loss in green strength is acceptable. Therefore, the printing resolution predicted by this study provides a reference range for balancing the amount of binder and green strength.
The geometrical accuracy analysis was performed and presented as average standard deviation shown in Figure 6f. Overall, the mean values of the green sample’s size increase with increasing print resolution. It was demonstrated that the powder-based samples were extremely oversaturated by the binder, causing the dimensional increase due to the bonding of too many adjacent particles near the designed boundary (DPI 160 and DPI 180). However, lower print resolution brings low saturation, which can cause structure lack or layer displacement affecting the geometrical accuracy (DPI 100). Another reason for DPI 100 samples might be the poor green strength causing the powder layer to peel off in the de-powdering process with compressed air. From the data fitting Equation (17) of the trend line in Figure 6f, the optimal printing resolution close to the target value is about 132, which is very close to the value of 131 predicted in Figure 5.
F X = 3.75 · 10 6 X 3 0.0019 · X 2 + 0.3335 · X 9.5409 R 2 = 0.9991
where X is the DPI value, F X is the size value. R 2 is the coefficients of determination.

3.2. Simulation of Micron-Sized Droplet

The effect of wettability on the spreading of binder droplets was shown in Figure 7 at varying particle sizes. The particle sizes corresponding to Figure 7a–f were 200 μm ( δ = 1:2), 100 μm ( δ = 1:1), 50 μm ( δ = 2:1), 25 μm ( δ = 4:1), 10 μm ( δ = 10:1) and 5 μm ( δ = 20:1), respectively. The diameters of binder droplets were 100 μm. The zero time of the curves was defined as the instant when the droplet contacts the powder bed.
Through an in-depth analysis of the results shown in Figure 7, the influence of the wettability on droplet spreading behavior can be summarized as follows:
Under the condition of high wettability (contact angle = 30°), the unimodal curves were measured at different particle sizes, which means there are no obvious relaxation stages during the spreading of the droplets on high wettability powder surface (shown in Figure 7). When the contact angle was ≥60°, the bimodal or even trimodal curves were measured, showing the occurrence of spreading and oscillation driven by impact.
The larger the contact angle is at a fixed particle size, the smaller the peak value of the curve is. This phenomenon can be more intuitively reflected in Figure 8e. It means the wettability of the powder has a great influence on the binder droplets’ spreading behavior; the lower wettability causes a smaller spreading diameter. This result applies to all particle size results.
At a fixed particle size, the time duration of maximum spreading for the droplets was decreased with increasing contact angle. This observation was also valid for all particle sizes during simulations, which indicates that the impact kinetic energy is transformed and dissipated more quickly in a powder bed with lower wettable particles.
The curves of spreading ratios against time at different contact angles indicated that the contact angle has almost no effect on spreading diameters in the first 10 μs. However, when δ = 1:2, the difference occurs at the time of 50 μs and for δ   ≥ 1, the difference occurs earlier at about 30 μs.
The influence of powder particle sizes on the droplet spreading behavior can be summarized as follows:
As shown in Figure 8a–d, under the same contact angle, the maximum spreading ratios have a strong relationship with the liquid-solid diameter ratio, especially the liquid-solid diameter ratio of δ = 1:2, which shows a completely different trend. In other words, in 3D printing, the influence of particle size larger than the droplet size and the particle size smaller than or equal to the droplet size on droplet spreading behavior needs to be studied separately. However, when δ ≥ 1, the trends of droplet spreading are similar under different particle sizes. But there is no obvious regular relationship between particle sizes with the maximum spreading ratio, as well as the relationship between particle sizes with the maximum spreading time (shown in Figure 8e). The curves of spreading ratios against time at fixed contact angles indicated that particle size has the effect of spreading diameters in the initial and maximum spreading stages.
As shown above, the droplet’s impact behaviors have been greatly affected by the particle size and wettability of the powder. It demonstrated that the impact behaviors were governed by the physical and dynamic characteristics of the binder/powder interaction system, rather than the only properties of binder droplets such as surface tension and viscous force. The current research results can be used as a reference for optimizing process parameters.
At last, all of the above verification of the simulation and experimental results of 3D printing proved that the simulation method proposed in this paper could effectively predict the range of basic parameters of 3D printing.

4. Conclusions

In this study, efforts were made to solve the limitation of experimental observation of binder droplets and powder interaction of the 3D printing process by applying a numerical simulation method with the VOF method. For verification of the VOF model, the simulation and experiments of the impact of millimeter-scale droplets were carried out under similar conditions, and the agreement between the simulation and the experimental data proves the effectiveness of the VOF model. On the above basis, the effects of particle size and wettability of powder on the microdroplets spreading behavior were studied. The results revealed that the powder wettability and particle size could directly influence the droplet spreading behavior. Finally, with the characterization of 3D printed samples under different print resolutions, the significance and effectiveness of the VOF model of droplet impact were verified for the prediction of 3D printing process parameters.
Although this study involves only the influence of wettability and particle size on binder spreading behavior, our modeling method can be promoted and applied in a more widely used mechanism of study rather than just limited to the parameter optimization of binders and powders. In particular, it can be used in printability tests of new materials, which can also help determine reasonable process parameter ranges and reduce the workload of new material applications.
In conclusion, this study has an important reference value in improving the accuracy of 3D printing, assisting in the 3D printing of bioactive scaffolds, and optimizing the amount of binder to improve the activity of the cells of bone scaffolds. We are convinced that there will be more applications in 3D printing practice from the perspective of the current study in the future.

Author Contributions

Conceptualization, X.-P.L. and Y.-E.W.; methodology, Y.-E.W. and Q.-H.W.; software, X.-P.L.; validation, Y.G. and K.Z.; formal analysis, X.-P.L.; investigation, X.-P.L.; resources, Y.-E.W.; data curation, X.-P.L.; writing—original draft preparation, X.-P.L.; writing—review and editing, Y.-E.W. and A.A.; visualization, X.-P.L.; supervision, Y.-E.W.; project administration, Y.-E.W.; funding acquisition, Y.-E.W. and Y.-K.S. All authors have read and agreed to the published version of the manuscript.

Funding

This research was funded by the National Key Research and Development Program of China (Grant No. 2019QY(Y)0502), funded by the key research and development program of Shaanxi province(Grant No. 2020ZDLSF04-07), funded by the National Natural Science Foundation of China (Grant No. 51905438), funded by the Fundamental Research Funds for the Central Universities (Grant No. 31020190502009), funded by the Innovation Platform of Bio-fabrication (Grant No.17SF0002), and funded by the Project Based Personnel Exchange Program with China Scholarship Council and German Academic Exchange Service (PPP) (Grant No.201709920023).

Institutional Review Board Statement

Not applicable.

Informed Consent Statement

Not applicable.

Data Availability Statement

Not applicable.

Conflicts of Interest

The authors declare no conflict of interest.

References

  1. Prinz, F.B.; Atwood, C.L. JTEC/WTEC Panel Report on Rapid Prototyping in Europe and Japan. Volume I: Analytical Chapters; Loyola Coll.; International Technology Research Inst.: Baltimore, MD, USA, 1997. [Google Scholar]
  2. Garrett, B. 3D printing: New economic paradigms and strategic shifts. Glob. Policy 2014, 5, 70–75. [Google Scholar] [CrossRef]
  3. Bose, S.; Vahabzadeh, S.; Bandyopadhyay, A. Bone tissue engineering using 3D printing. Mater. Today 2013, 16, 496–504. [Google Scholar] [CrossRef]
  4. Wang, Y.; Guo, Y.; Wei, Q.; Li, X.; Ji, K.; Zhang, K. Current researches on design and manufacture of biopolymer-based osteochondral biomimetic scaffolds. Bio-Des. Manuf. 2021, 4, 541–567. [Google Scholar] [CrossRef]
  5. Dong, Y.; Duan, H.; Zhao, N.; Liu, X.; Ma, Y.; Shi, X. Three-dimensional printing of beta-tricalcium phosphate/calcium silicate composite scaffolds for bone tissue engineering. Bio-Des. Manuf. 2018, 1, 146–156. [Google Scholar] [CrossRef]
  6. Ji, K.; Wang, Y.; Wei, Q.; Zhang, K.; Jiang, A.; Rao, Y.; Cai, X. Application of 3D printing technology in bone tissue engineering. Bio-Des. Manuf. 2018, 1, 203–210. [Google Scholar] [CrossRef]
  7. Calvert, P. Inkjet printing for materials and devices. Chem. Mater. 2001, 13, 3299–3305. [Google Scholar] [CrossRef]
  8. Butscher, A.; Bohner, M.; Roth, C.; Ernstberger, A.; Heuberger, R.; Doebelin, N.; Von Rohr, P.R.; Müller, R. Printability of calcium phosphate powders for three-dimensional printing of tissue engineering scaffolds. Acta Biomater. 2012, 8, 373–385. [Google Scholar] [CrossRef]
  9. Zhang, B.; Sun, H.; Wu, L.; Ma, L.; Xing, F.; Kong, Q.; Fan, Y.; Zhou, C.; Zhang, X. 3D printing of calcium phosphate bioceramic with tailored biodegradation rate for skull bone tissue reconstruction. Bio-Des. Manuf. 2019, 2, 161–171. [Google Scholar] [CrossRef]
  10. Legeros, R.Z.; Lin, S.; Rohanizadeh, R.; Mijares, D.; Legeros, J.P. Biphasic calcium phosphate bioceramics: Preparation, properties and applications. J. Mater. Sci. Mater. Med. 2003, 14, 201–209. [Google Scholar] [CrossRef]
  11. Bergmann, C.; Lindner, M.; Zhang, W.; Koczur, K.; Kirsten, A.; Telle, R.; Fischer, H. 3D printing of bone substitute implants using calcium phosphate and bioactive glasses. J. Eur. Ceram. Soc. 2010, 30, 2563–2567. [Google Scholar] [CrossRef]
  12. Zhou, Z.; Buchanan, F.; Mitchell, C.; Dunne, N. Printability of calcium phosphate: Calcium sulfate powders for the application of tissue engineered bone scaffolds using the 3d printing technique. Mater. Sci. Eng. C 2014, 38, 1–10. [Google Scholar] [CrossRef]
  13. Seitz, H.; Rieder, W.; Irsen, S.; Leukers, B.; Tille, C. Three-dimensional printing of porous ceramic scaffolds for bone tissue engineering. J. Biomed. Mater. Res. Part B Appl. Biomater. 2005, 74, 782–788. [Google Scholar] [CrossRef]
  14. Leukers, B.; Gülkan, H.; Irsen, S.H.; Milz, S.; Tille, C.; Schieker, M.; Seitz, H. Hydroxyapatite scaffolds for bone tissue engineering made by 3d printing. J. Mater. Sci. Mater. Med. 2005, 16, 1121–1124. [Google Scholar] [CrossRef]
  15. Chumnanklang, R.; Panyathanmaporn, T.; Sitthiseripratip, K.; Suwanprateeb, J. 3D printing of hydroxyapatite: Effect of binder concentration in pre-coated particle on part strength. Mater. Sci. Eng. C 2007, 27, 914–921. [Google Scholar] [CrossRef]
  16. Lee, G.; Carrillo, M.; McKittrick, J.; Martin, D.G.; Olevsky, E.A. Fabrication of ceramic bone scaffolds by solvent jetting 3D printing and sintering: Towards load-bearing applications. Addit. Manuf. 2020, 33, 101107. [Google Scholar] [CrossRef]
  17. Butscher, A.; Bohner, M.; Doebelin, N.; Galea, L.; Müller, R. Moisture based three-dimensional printing of calcium phosphate structures for scaffold engineering. Acta Biomater. 2013, 9, 5369–5378. [Google Scholar] [CrossRef]
  18. Inzana, J.A.; Olvera, D.; Fuller, S.M.; Kelly, J.P.; Graeve, O.A.; Schwarz, E.M.; Kates, S.L.; Awad, H.A. 3D printing of composite calcium phosphate and collagen scaffolds for bone regeneration. Biomaterials 2014, 35, 4026–4034. [Google Scholar] [CrossRef] [Green Version]
  19. Ke, D.; Bose, S. Effects of pore distribution and chemistry on physical, mechanical, and biological properties of tricalcium phosphate scaffolds by binder-jet 3D printing. Addit. Manuf. 2018, 22, 111–117. [Google Scholar] [CrossRef]
  20. Vorndran, E.; Klarner, M.; Klammert, U.; Grover, L.; Patel, S.; Barralet, J.; Gbureck, U. 3D Powder Printing of β-Tricalcium Phosphate Ceramics Using Different Strategies. Adv. Eng. Mater. 2008, 10, B67–B71. [Google Scholar] [CrossRef]
  21. Brunello, G.; Sivolella, S.; Meneghello, R.; Ferroni, L.; Gardin, C.; Piattelli, A.; Zavan, B.; Bressan, E. Powder-based 3D printing for bone tissue engineering. Biotechnol. Adv. 2016, 34, 740–753. [Google Scholar] [CrossRef]
  22. Rahmati, S.; Shirazi, F.; Baghayeri, H. Perusing piezoelectric head performance in a new 3-D printing design. Tsinghua Sci. Technol. 2009, 14, 24–28. [Google Scholar] [CrossRef]
  23. Kumar, A.; Mandal, S.; Barui, S.; Vasireddi, R.; Gbureck, U.; Gelinsky, M.; Basu, B. Low temperature additive manufacturing of three dimensional scaffolds for bone-tissue engineering applications: Processing related challenges and property assessment. Mater. Sci. Eng. R Rep. 2016, 103, 1–39. [Google Scholar] [CrossRef]
  24. Hogekamp, S.; Pohl, M. Methods for characterizing wetting and dispersing of powder. Chem. Ing. Tech. 2004, 4, 385–390. [Google Scholar] [CrossRef]
  25. Lanzetta, M.; Sachs, E. Improved surface finish in 3D printing using bimodal powder distribution. Rapid Prototyp. J. 2003, 9, 157–166. [Google Scholar] [CrossRef]
  26. Hapgood, K.P.; Litster, J.D.; Biggs, S.; Howes, T. Drop Penetration into Porous Powder Beds. J. Colloid Interface Sci. 2002, 253, 353–366. [Google Scholar] [CrossRef]
  27. Lu, K.; Hiser, M.; Wu, W. Effect of particle size on three dimensional printed mesh structures. Powder Technol. 2009, 192, 178–183. [Google Scholar] [CrossRef]
  28. McEleney, P.; Walker, G.; Orr, J.; Dunne, N.J. Investigations on drop penetration and wetting characteristics of powder-liquid systems in relation to the mixing of acrylic bone cement. Int. J. Nano Biomater. 2010, 3, 20–35. [Google Scholar] [CrossRef]
  29. Marston, J.; Sprittles, J.; Zhu, Y.; Li, E.; Vakarelski, I.; Thoroddsen, S. Drop spreading and penetration into pre-wetted powders. Powder Technol. 2013, 239, 128–136. [Google Scholar] [CrossRef]
  30. Marston, J.; Thoroddsen, S.; Ng, W.; Tan, R. Experimental study of liquid drop impact onto a powder surface. Powder Technol. 2010, 203, 223–236. [Google Scholar] [CrossRef]
  31. Washburn, E.W. The Dynamics of Capillary Flow. Phys. Rev. (Ser. I) 1921, 17, 273–283. [Google Scholar] [CrossRef]
  32. Pan, K.-L.; Tseng, K.-C.; Wang, C.-H. Breakup of a droplet at high velocity impacting a solid surface. Exp. Fluids 2009, 48, 143–156. [Google Scholar] [CrossRef]
  33. Yarin, A. DROP IMPACT DYNAMICS: Splashing, Spreading, Receding, Bouncing. Annu. Rev. Fluid Mech. 2006, 38, 159–192. [Google Scholar] [CrossRef]
  34. Holman, R.K.; Cima, M.J.; Uhland, S.A.; Sachs, E. Spreading and Infiltration of Inkjet-Printed Polymer Solution Droplets on a Porous Substrate. J. Colloid Interface Sci. 2002, 249, 432–440. [Google Scholar] [CrossRef]
  35. Sun, J.; Liu, Q.; Liang, Y.; Lin, Z.; Liu, C. Three-dimensional VOF simulation of droplet impacting on a superhydrophobic surface. Bio-Des. Manuf. 2019, 2, 10–23. [Google Scholar] [CrossRef]
  36. Fujimoto, H.; Ogino, T.; Takuda, H.; Hatta, N. Collision of a droplet with a hemispherical static droplet on a solid. Int. J. Multiph. Flow 2001, 27, 1227–1245. [Google Scholar] [CrossRef]
  37. Wang, Y.-E.; Li, X.-P.; Li, C.-C.; Yang, M.-M.; Wei, Q.-H. Binder droplet impact mechanism on a hydroxyapatite microsphere surface in 3D printing of bone scaffolds. J. Mater. Sci. 2015, 50, 5014–5023. [Google Scholar] [CrossRef]
  38. Pasandideh-Fard, M.; Qiao, Y.M.; Chandra, S.; Mostaghimi, J. Capillary effects during droplet impact on a solid surface. Phys. Fluids 1996, 8, 650–659. [Google Scholar] [CrossRef]
  39. Nie, Q.; Tanveer, S.; Dupont, T.F.; Li, X. Singularity formation in free-surface Stokes flows. Contemp. Math. 2002, 306, 147–165. [Google Scholar]
  40. Gunjal, P.R.; Ranade, V.V.; Chaudhari, R.V. Dynamics of drop impact on solid surface: Experiments and VOF simulations. AIChE J. 2004, 51, 59–78. [Google Scholar] [CrossRef]
  41. Cox, S.C.; Thornby, J.A.; Gibbons, G.J.; Williams, M.A.; Mallick, K.K. 3D printing of porous hydroxyapatite scaffolds intended for use in bone tissue engineering applications. Mater. Sci. Eng. C 2015, 47, 237–247. [Google Scholar] [CrossRef]
  42. Lam, C.; Mo, X.; Teoh, S.; Hutmacher, D.W. Scaffold development using 3D printing with a starch-based polymer. Mater. Sci. Eng. C 2002, 20, 49–56. [Google Scholar] [CrossRef]
  43. Sachs, E.; Cima, M.; Cornie, J.; Brancazio, D.; Bredt, J.; Curodeau, A.; Fan, T.; Khanuja, S.; Lauder, A.; Lee, J.; et al. Three-Dimensional Printing: The Physics and Implications of Additive Manufacturing. CIRP Ann. 1993, 42, 257–260. [Google Scholar] [CrossRef]
  44. Cima, M.; Sachs, E.; Fan, T.; Bredt, J.F.; Michaels, S.P.; Khanuja, S.; Lauder, A.; Lee, S.-J.J.; Brancazio, D.; Curodeau, A. Three-Dimensional Printing Techniques. U.S. Patent 5,387,380, 7 February 1995. Available online: https://www.freepatentsonline.com/5387380.html (accessed on 20 January 2021).
  45. Agland, S.; Iveson, M.S. The impact of liquid drops on powder bed surfaces. In Chemeca 99: Chemical Engineering: Solutions in a Changing Environment; Barton, A.C.T., Ed.; Institution of Engineers: Barton, Australia, 1999; pp. 218–224. [Google Scholar]
  46. Range, K.; Feuillebois, F. Influence of Surface Roughness on Liquid Drop Impact. J. Colloid Interface Sci. 1998, 203, 16–30. [Google Scholar] [CrossRef]
  47. Francois, M.; Shyy, W. Computations of drop dynamics with the immersed boundary method, part 2: Drop impact and heat transfer. Numer. Heat Transf. Part B Fundam. 2003, 44, 119–143. [Google Scholar] [CrossRef]
  48. Bakshi, S.; Roisman, I.; Tropea, C. Investigations on the impact of a drop onto a small spherical target. Phys. Fluids 2007, 19, 032102. [Google Scholar] [CrossRef]
  49. Brackbill, J.U.; Kothe, D.B.; Zemach, C. A continuum method for modeling surface tension. J. Comput. Phys. 1992, 100, 335–354. [Google Scholar] [CrossRef]
  50. Bolster, D.; Hershberger, R.E.; Donnelly, R.J. Dynamic similarity, the dimensionless science. Phys. Today 2011, 64, 42–47. [Google Scholar] [CrossRef] [Green Version]
  51. Detsch, R.; Schaefer, S.; Deisinger, U.; Ziegler, G.; Seitz, H.; Leukers, B. In vitro-Osteoclastic Activity Studies on Surfaces of 3D Printed Calcium Phosphate Scaffolds. J. Biomater. Appl. 2010, 26, 359–380. [Google Scholar] [CrossRef] [PubMed]
  52. Gbureck, U.; Hölzel, T.; Biermann, I.; Barralet, J.; Grover, L. Preparation of tricalcium phosphate/calcium pyrophosphate structures via rapid prototyping. J. Mater. Sci. Mater. Electron. 2008, 19, 1559–1563. [Google Scholar] [CrossRef] [PubMed]
Figure 1. 3D printed HA bone scaffolds (a) and the SEM microstructure images of scaffolds at different magnifications (bd). The 3D printed bone scaffolds are the accumulation of bioceramic powder particles. The powder-droplet interaction plays a key role in quality of 3D printed bone scaffolds.
Applsci 12 01898 g001
Figure 2. The modeling of binder droplets impact in 3D printing. (a) is the schematic illustration of binder droplets impact on powder bed in the 3D printing. (b) is the sequence of events for the typical low impulse droplet impact. (c) is the two-dimensional numerical simulation model.
Applsci 12 01898 g002
Figure 3. Comparison of observation experiment and simulation. (a) is the schematic diagram of test equipment, (b) is the real pictures of experimental equipment (A. CCD high-speed camera, B. computer, C. syringe with a needle, D. water droplet, E. multiple spherical substrates, F. light source) (c) is the CAD design model of the substrate, (d) is the solid substrate. (e) are the curves of spreading ratio with time observation experiment and simulation. (f) is the droplet spreading deformation process, where the red region was the droplet, and the blue region was air.
Applsci 12 01898 g003
Figure 4. The illustration of the interaction mechanism of multiple droplets spreading. The light blue area in (a) is the binder droplet spreading area. (bd) shows the relationship among spreading, penetration and printing precision. The light blue region was the droplet spreading area, the yellow region was the droplet penetration area, and the green region was the effective precision area of the printed sample. (e) is a captured diagram of millimeter-scale droplets to explain the droplets spreading interference. (f,g) are the schematic diagram of the spreading of two droplets. The curves of two droplets spreading behavior against time are shown in (f). (g) the photograph of droplets captured on a millimeter scale was used to explain the spreading mechanism. The t m a x is the maximum spreading time, T d is droplets spreading interval, D m a x is the largest spreading diameter, Δ T is the time difference between the two droplets.
Applsci 12 01898 g004
Figure 5. The simulation result of binder droplet spreading ratio against time based on the parameter of our 3D printing practice.
Applsci 12 01898 g005
Figure 6. The characterization of 3D printed samples. (a) is the picture of powder bed taken during the printing process. (b) is the partial enlargement for the analysis of the binder print resolution according to graphic image analysis (c) is the histograms of Hounsfield Units with image analysis software. (d) are the cross-section SEM images of printed samples, where the small balls indicated by red arrows are bioceramic particles, and the irregular objects covering the ball indicated by yellow arrows are the cured binder. (e) is the mechanical properties and binder/volume ratio of samples printed in different resolution. (f) is the geometrical accuracy analysis of samples printed in different resolution. The blue solid line is the target value, and the red line is the trend line.
Applsci 12 01898 g006
Figure 7. The curves of spreading ratio with time at contact angle of 30°, 60°, 90°, 120°, under different ratios of droplet diameter to powder particle diameter, respectively. The contact angles were used to define the wettability of powder materials, which covers a range of contact angles for the most common bioceramic.
Applsci 12 01898 g007
Figure 8. (ad) shows the temporal evolution of the droplet spreading ratios with different particle sizes. (e) summarizes the relationship between particle sizes with the maximum spreading ratio.
Applsci 12 01898 g008
Table 1. The comparison of the currently defined parameters droplet diameter, impact momentum, and Weber number with typical studies.
Reference [30]Reference [12]This Study
Droplet diameter (mm)2.42.00.1
Impact momentum (kg∙m/s)9.15 × 10−61.2 × 10−51.08 × 10⁻⁹
Weber number47.5613.608.58
Table 2. 3D printing parameters.
SampleDPILayer Thickness
(mm)
Particle Mean Size
(μm)
Powder MaterialBinder
A800.140HAPhosphoric acid/Polyvinyl alcohol
B1000.140HAPhosphoric acid/Polyvinyl alcohol
C1200.140HAPhosphoric acid/Polyvinyl alcohol
D1400.140HAPhosphoric acid/Polyvinyl alcohol
E1600.140HAPhosphoric acid/Polyvinyl alcohol
F1800.140HAPhosphoric acid/Polyvinyl alcohol
Publisher’s Note: MDPI stays neutral with regard to jurisdictional claims in published maps and institutional affiliations.

