1. Introduction
According to the Global Wind Report 2021 of GWEC [
1], the wind industry in 2020 was growing by 13% when compared to the previous year. Nowadays, 743 GW of installed wind power helps avoid over 1.1 billion tons of CO
2 produced by fossils. This is happening because climate change requires increased wind energy exploitation for decarbonization procedures, and wind energy is still one of the most popular renewable energy systems, despite the increasing usage of solar energy. However, traditional wind generators are not suitable for places with an annual average wind speed lower than 5 m/s, and the studies show [
2] that in such cases, the needed power of the wind generator will grow too high, which makes the generator economically not feasible. Notwithstanding the previous, Russia already has ambitious projects [
3] to design wind power plants in areas with low wind speed, such as in Saint Petersburg. Furthermore, similar solutions may be implemented in neighboring Estonia, where the annual average wind speed further, away from the coast and islands, is not reaching the required levels [
4]. Furthermore, the rapid development and massive implementation of distributed energy solutions are based on an alternative paradigm, which offers the closeness of generators to the consumers, changes in consumer roles, and the development of new types of generators in power systems, making small wind turbines a popular choice. However, the traditional blades of small wind turbines have not proven to be energy efficient enough, especially in areas with low wind speeds. That is why developing a new type of small wind turbine with maximum energy efficiency at low wind speed is a crucial challenge for modern technology. Magnus effect-based Wind Turbines (MWT) described in [
5] could be energy efficient in a wide wind speed range of 2–40 m/s, in comparison with 5–25 m/s for conventional bladed small wind turbines [
6].
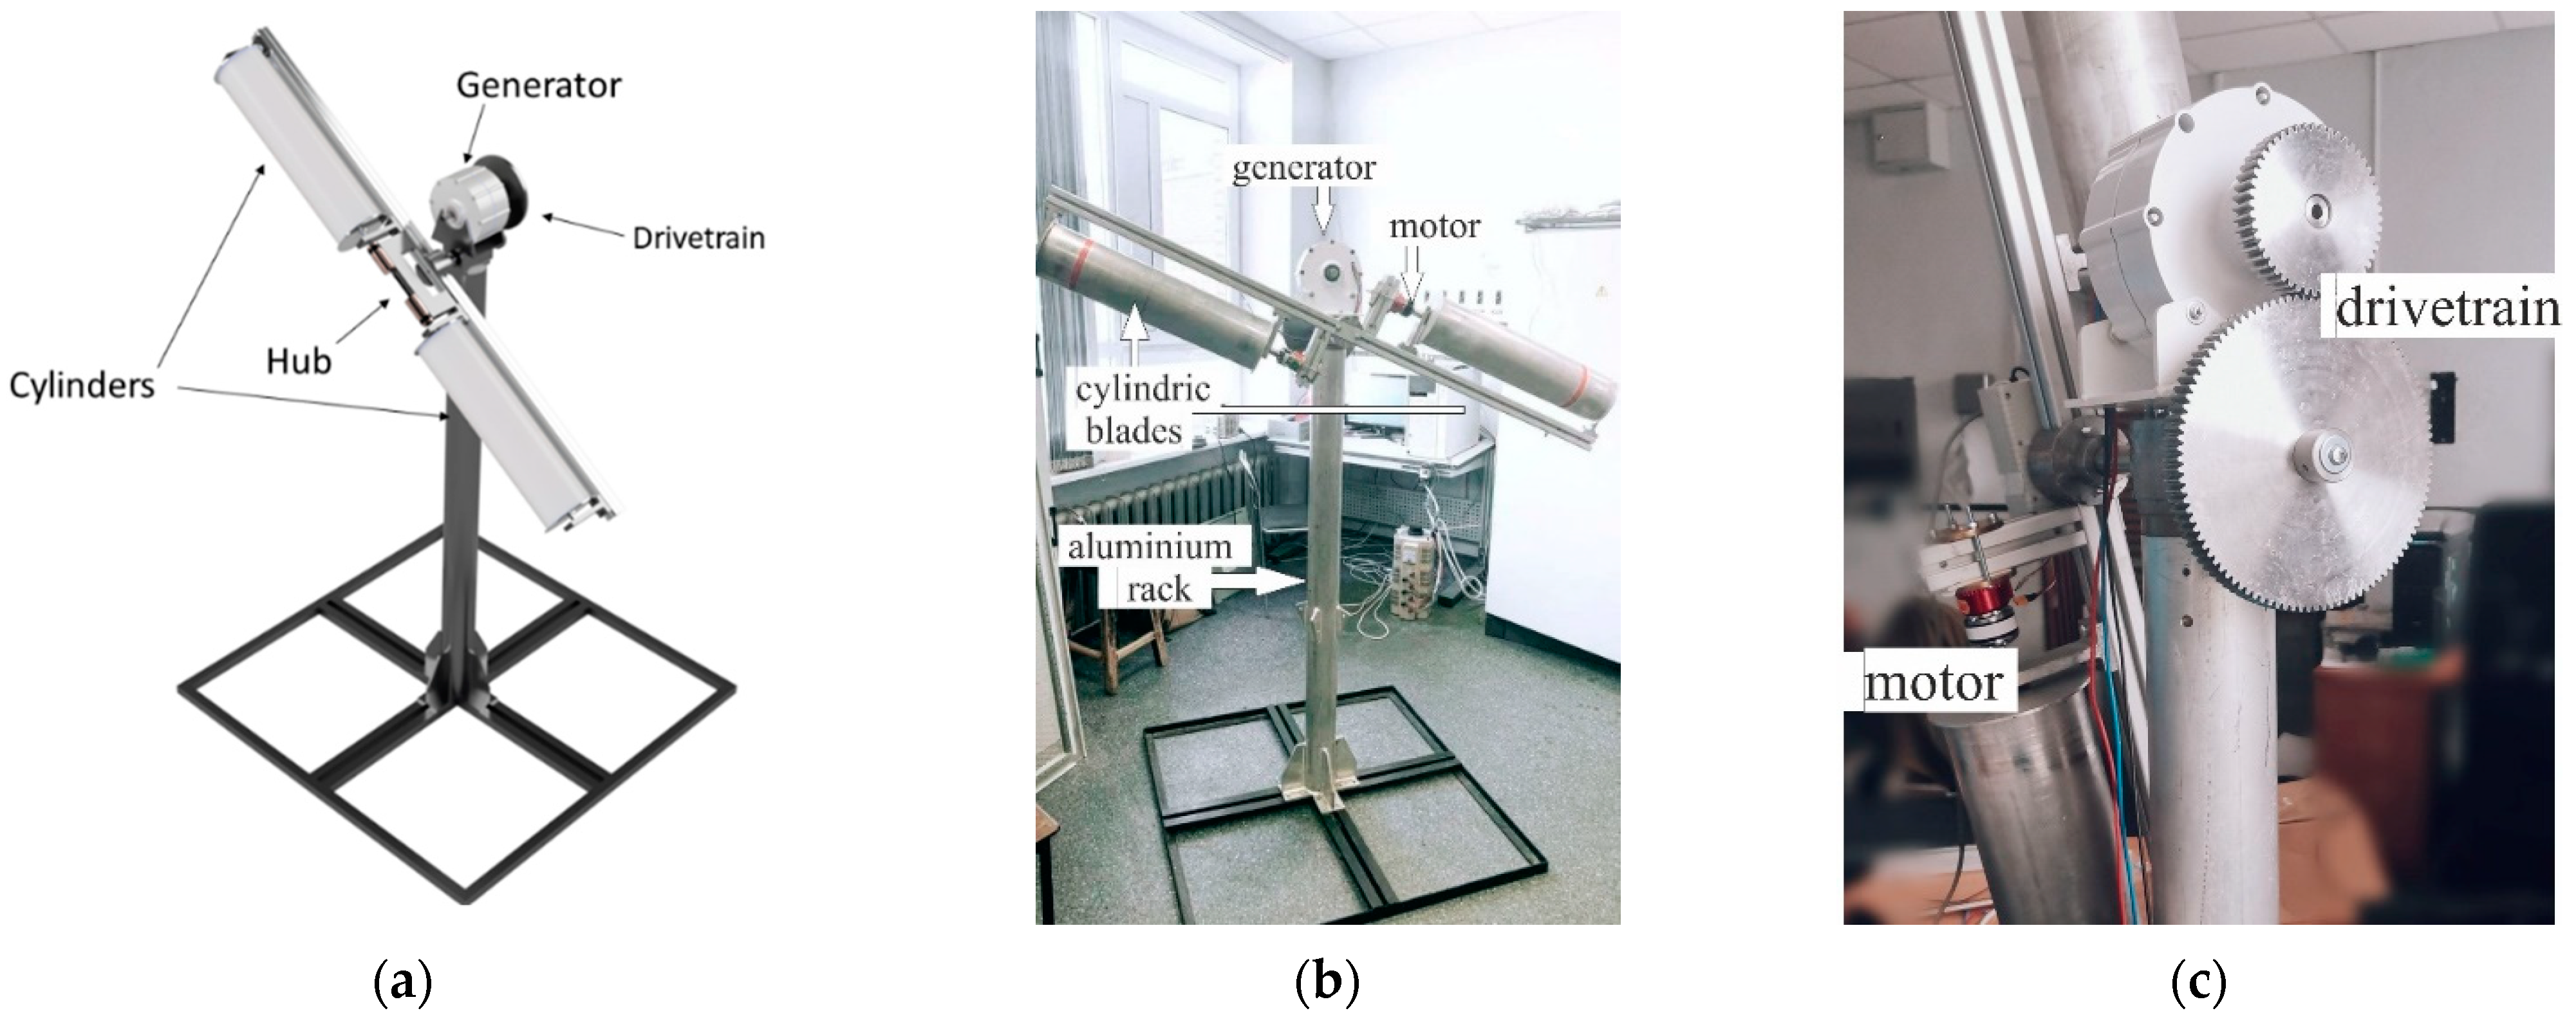
The Magnus effect is a sideways force that influences the rotating cylinder, immersed in the surrounding motion between the rotation cylinder and the environment. As a whole, MWT is a complex device needing an extra subsystem that rotates the turbine’s cylinders. The structure scheme of MWT is presented in
Figure 1. It consists of two cylindrical blades with diameters 575 × 125 mm, with a maximum power density of 2 kW. Cylinder blades are installed on an aluminum rack connected to the shaft of MWT via the hub. The shaft rotates inside the nacelle, supported by two bearings. The cylinders are caused to rotate by two motors, and connected to the shaft of the MWT via the hub. Rotating cylinders provide lift force. The shaft rotates inside the nacelle and rotates all the nacelle, leading to the rotation of the generator. As a generator in this realization of MWT, we used a Permanent Magnet Synchronous Generator (PMSMG). However, it could be also be built using a Flux-Switching Permanent Magnet Synchronous Generator as described in [
7]. This prototype of MWT is designed to operate at a 100 rpm external wheel that satisfies low wind speed (2–8 m/s).
A research survey in this area revealed that four investigators’ teams were developing different types of MWTs. However, only three of them achieved the fifth technology readiness level.
The first project, headed by Bychkov [
8,
9,
10,
11,
12], aimed to develop a six cylinder MWT. The MWT working principle is based on lift force, posed by six cylindrical blades [
8]. Overall dimensions were 3.6 × 3.6 m, and aerodynamic simulation showed the effectiveness of such a wind turbine at 4.5 m/s wind. His team also provided research in construction limitations, and, in [
9], a MWT simulation with various types of cylindrical blades diameters, from 0.05 to 0.09 m, was presented. DC motors rotated the cylindrical blades with speeds of up to 8000 rpm. Other research in constructive simulation, speed, and power density simulations is featured in [
10]. This research demonstrated a comparison between a traditional bladed wind turbine and a cylindrical MWT. In [
11], this comparison research is expanded and shows the benefits of MWT in wind speed of less than 8 m/s. The research conclusion takes into account constructive calculations, and power coefficients were given in [
12].
The second project was under the lead of Sedaghat [
13,
14]. Based on experimental results in [
12], he has led an algorithm for the development of MWT and has resulted in cylindrical blades’ lift and drag forces experimental measurements being within the recommendation for calculations of power coefficients, with a discussion of power density. Another paper [
13] focused on aerodynamic characteristics of MTW and design calculations. This paper discussed the possibility of maximum power-tracking algorithms for better control of the MWT based on power coefficient. The MWT prototype from Sedaghat’s team is similar to Bychkov’s team’s MWT.
The third scientific group managed by Maro Jinbo focused its efforts on developing control systems of MWT [
15,
16]. They concluded that the most efficient approach is the maximum power point tracking (MPPT), based on the hill-climbing control algorithm (HIL) [
15]. Based on the background, the authors designed an algorithm and method to realize the fixed-step HIL algorithm for MWT. The expanded description of the HIL algorithm was described in [
16]. That paper focused on algorithm practical realization. The construction of their MWT was similar to the previous one, including a boost converter and DC motors for cylindrical blades.
The last team, led by Atsushi Shimizu [
17], reported a practical realization of MWT with vertical axis blades. Nowadays, they have undertaken an active promotional campaign at energy markets in various countries. The main publication in their research is [
18], where the principal scheme was shown, and the MPPT algorithm was described.
All these projects have tried to find the optimum solution for the control system and design the modern MWT. The main idea in all teams is to find the maximum power point for MWT. All commands try to find such a point using experimental results. Another study in synthesizing the MPPT algorithm for MWT is given in [
19]. Here was given an algorithm to control four cylindrical blades of an MWT using the hill-climbing algorithm with divided steps. Simulation results confirmed the correctness of this method.
In [
20], momentum theory and symbolic regression found the optimum number of cylinders for MWT. It was shown that the optimum number of cylindrical blades is two. This two-cylinder blade configuration allows for the generation of maximum energy. Increasing the number of cylindrical blades decreases the MWT output power. In this research, the construction of the two-cylinder blades was considered.
As seen from the literature review, there is little attention paid to MWT development nowadays. However, promising MPPT algorithms may have potential application in distribution grids, where energy balancing is critical. This paper presents a comparative analysis of MWT simulation models, and the development of a numerical model proposed to be used in the MPPT algorithm. From a sustainability point of view, this work provides a systematic analysis method that may help optimize the overall efficiency of novel renewable energy sources. Furthermore, the presented model (s) may be used to improve life cycle assessment and power management. Full experimental and methodical details are provided so that the research work results can be reproduced using the code published together with an article (see Data Availability Statement). The structure of the research paper is as follows:
Section 2 presents the analysis of three available models and power coefficient calculation for studied MWT;
Section 3 presents model adaptation for the MPPT algorithm; the implications of main findings and future research directions are discussed in
Section 4.
2. Magnus Effect-Based Wind Turbine Simulation Methods
The wind turbine model can be separated into different subsystems, including a model of the wind, aerodynamic model, mechanical model of the turbine and drive train, electromechanical model of the generator, the electrical model of the power converter, and the model of the control system. The main goal of this work was to perform an aerodynamic simulation of a wind turbine based on the Magnus effect.
The aerodynamic simulation of the wind turbine is based on Blade Element Momentum theory and can be presented as a function of mechanical power extracted from the wind by the wind wheel, as shown in (1) [
21].
P is the power extracted from the flow, is the rotor swept area, is the air density, is the wind speed, and is the power coefficient of a wind energy conversion system, showing the ratio of extractable mechanical power to the power contained in the air stream . The maximal possible value is known as the Betz limit and has an estimated value of 0.593.
Based on [
22], the power coefficient
depends on the wind speed ratio and is calculated using the strip theory [
23]. The book [
22] held extensive discussions on the dependence between power coefficient
, the rotor power curves, and the torque curves in wind turbines with various types of blades, including the one vertical rotation blade wind turbine. The main parameters of wind turbine dominating the
, under [
22], are the number of rotor blades, length of blades, blades aerodynamic profile, and gondola profile. According to (1) the power
P captured from the wind is linear to the
. This electric output power versus the tip speed ratio provides us with the power curve depending on wind turbine technical characteristics, wind profile, and turbine design. Due to the linear relationship between output power and power coefficient, further discussion will focus on
.
Building the
function for the selected wind turbine is required to create an accurate aerodynamic model of the wind wheel. The power coefficient can be presented as a function of a velocity ratio of the flow before and after interacting with the wind wheel. The wind wheel is presented in
Figure 2. Extraction of mechanical energy from the free flow leads to a decrease in wind velocity
after passing through the rotor area; by the flow conservation law, this leads to an increase in area
.
The flow conservation law is shown in (2), where
A is the rotor swept area,
V’ is the wind speed at the windwheel,
and
are cross-sectional upstream and downstream, where
and
are upstream and downstream wind speed, respectively.
The power coefficient can thus be specified as (3).
Determining the function of the power coefficient is an essential step in modeling wind energy conversion systems. According to Vaimann et al. in [
2], different methods of representing
can be used, including exponential models, sinusoidal models, and polynomial models. As it can be seen from the above-mentioned research work, one of the most commonly used models is an exponential model.
Here,
λ is the tip-speed ratio, determined by (5),
is the pitch angle,
is determined by (6),
R is the rotor radius,
is the rotational speed of the rotor,
and
are coefficients of the exponential model, which depend on mechanical and aerodynamic characteristics of the rotor and can be obtained via experiment or simulation.
Previous equations show that wind turbine can be varied by tuning the rotor speed and blade pitch. However, determining constructional coefficients requires prior knowledge of the blade shape parameters of the rotor. Thus, obtaining these coefficients in the initial stage of modeling presents a challenging task. Moreover, in horizontal-axis MWT, controlled via the cylinder rotational speed, should be used instead of turning the blade pitch. Therefore, modeling the wind turbine based on the Magnus effect requires using a function different from the one used for conventional bladed turbines.
During this work, three methods of building a
function for horizontal-axis MWT were studied. The first approach, presented in [
24], is based on the blade element momentum theory. This model is further referred to as the analytical model. This work aimed to estimate the wind power coefficient function for the MWT via an analytical solution. The authors present the power coefficient as the function of three parameters: tip rotor solidity
, tip speed ratio (TSR)
, and relative speed of the cylinder’s rotation (or cylinder speed ratio, CSR)
. These parameters are obtained in (7)–(9) and depend on constructional features of each wind turbine, such as the radius of the rotor swept area and the cylinder. The analytical solution itself is based on calculating the lift force of each cylinder blade element. The application of blade element momentum theory allows deriving the
function, which is shown in (10). The presented function was modified following data obtained by numerical Boundary Element Method (BEM) solutions. Here,
is the rotational speed of the rotor,
is the rotational speed of the cylinder,
R is the rotor radius,
r is the cylinder radius, and
N is the number of cylinders.
The derived function shows that in the case of MWT, the MPPT can be achieved by varying the speed of the rotor and rotational speed of the cylinder. The maximal achievable value of
, which can be obtained using this function, is 0.593, which is the same value as the Betz limit. The presented method of estimating
does not take the drag of the cylinder into account, however, it can be used at a preliminary stage of the development of horizontal-axis MWT.
Another method is proposed in [
20]. At the first stage of work, a mathematical model of the wind turbine was developed using data obtained by Bychkov. For the sake of clarity, this model is referred to as the regression model. The authors used BEM and symbolic regression to create simplified models for different horizontal-axis MWTs with different cylinder numbers. Then, a direct method was applied to the model. Combinations of dimensionless parameters, such as the earlier-mentioned tip speed ratio, the relative speed of the cylinder’s rotation, the aspect ratio, and Reynolds number, were generated using symbolical regression. As a result, the optimum function with the most significant correlation coefficient was selected for each configuration (number) of the cylinder. Experimental horizontal-axis MWT uses only two cylinders, thus, a function for a two-cylinder model is presented in (11). This function uses TSR and CSR as inputs, similar to the previous one, and introduces cylinder aspect ratio
, which can be calculated as shown in (12), where 2
r is the diameter of the cylinder. Researchers conclude that a two-cylinder configuration is optimal for the MWT, and it allows the generator to reach the maximum power coefficient, which is equal to 0.2 in that particular case [
19].
Another method proposed (referred to as correlation model in text) by the same research group is presented in [
25]. Similar to the previously mentioned studies, a mathematical model of the horizontal-axis MWT is derived, however, instead of the direct method, high correlation models are used to achieve optimal
functions for different configurations of wind turbines. The proposed mathematical model can be adapted to different cases according to the number of cylinder blades. In the case of a two-bladed cylinder, the function of
is presented in (13). Research confirms that a two-cylinder configuration is preferable, however, the maximum value of
Cp reached during the simulation was not higher than 0.11. A decrease in drag coefficient, however, can lead to a higher
of up to 0.24. In both correlation and regressive models, the validity of obtained results is limited to a Reynolds number of 10
5 <
Re < 10
6.
Three models of the power coefficient were built using the presented algorithms. Parameters of the experimental turbines are presented in
Table 1.
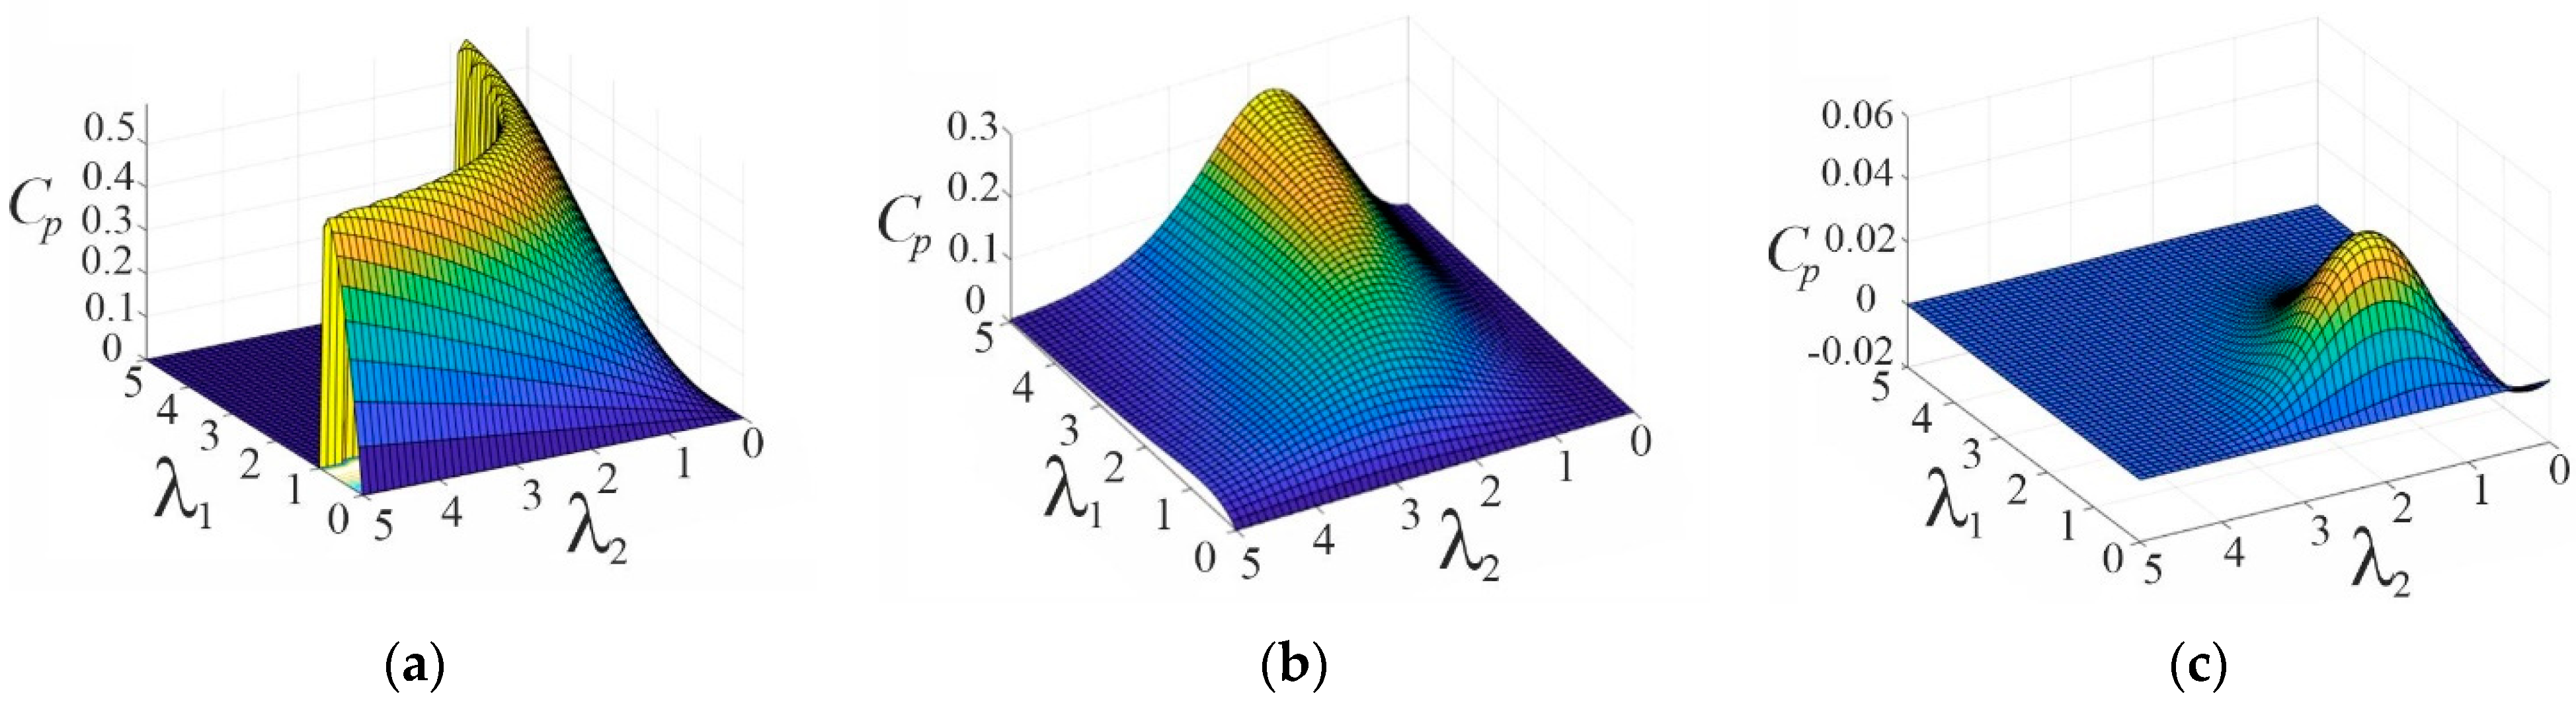
Concerning these parameters,
Cp against tip speed ratio
λ1 and cylinder speed ratio
λ2 was plotted for three formulas. Results for the analytical model are presented in
Figure 3a. The plot shows steep dependency for both TSR and CSR. The maximum value of
reached during this simulation is 0.569, with multiple values of
and
corresponding to a maximum value of wind power coefficient. In the case of the regression model, as shown in
Figure 3b the maximum value
obtained by this model is 0.247 at
= 5 and
= 1.7. Finally, a high correlation model is presented in
Figure 3c. Here the maximum value reached is 0.047 at
= 1 and
= 1.7.
The direct comparison shows significant discrepancies between different approaches to simulate the power coefficient. The primary explanation for such discrepancy is a different approach to the deduction of Cp function. In the case of regression and correlation models, experimental data obtained by previous researchers was used to find dependencies between Cp and different parameters of the windwheel. In the case of the analytical model, however, the formula for Cp is derived from the Blade Element Momentum theory. Therefore, the first two models depend on the mechanical characteristics of the generator, which were used to obtain experimental data. Some of these characteristics can be exclusive to the wind turbine and were not taken into account when deriving Cp. Meanwhile, the analytical model is more universal and does not depend on the unique mechanical parameters of the wind turbine. Thus, the difference between different models can be explained by the unique structural properties of the experimental generator. Another explanation is that correlation and regression models function in a specified Reynolds number area, and the Re number of simulated turbine exceeds this range. To determine which model is more feasible, a full mechanic and aerodynamic simulation of the wind turbine was performed and described in the next chapter.
3. Simulation Results
Three models were used for further processing: analytical, correlation, and regression. All simulation models in MATLAB/Simulink are available via the link available in the Data Availability Statement. A mechanical and aerodynamic model of the wind generator is presented in
Figure 4. The simulation includes the input block used to tune control parameters (rotational speed of cylinders) and wind speed. The aerodynamic model is based on a BEM function (1). The mechanical model simulates the inertia of the rotor without a drivetrain or a generator (configuration during the experiment), and mechanical load is presented as a constant. In addition, a mechanical model is used to obtain the rotational speed of the windwheel. Thus, the torque on the rotor can be controlled with one parameter (cylinder speed), which was a primary requirement for the developed model.
Results of the experiment with experimental MWT are presented in
Figure 5. Data points show experimental data obtained during the initial tests of the turbine without the generator and the drive train. The data points are interpolated using a cubic polynomial. The plot shows three distinct areas: the initial area, where the dependence between angular speed and torque is insignificant; the quasilinear area; the saturation area, where the increase in angular speed does not lead to an increase in torque. The quasilinear area is where the generator is to be operated, and thus, determining its beginning and end point is important for the further development of the control system. The plot clearly shows that rotor torque increases with an increase in wind speed, and the end point shifts towards the higher end of the angular speed axis. Maximum torque points are highlighted with circular markers. To ensure effective control of the wind generator, it has to operate at these points.
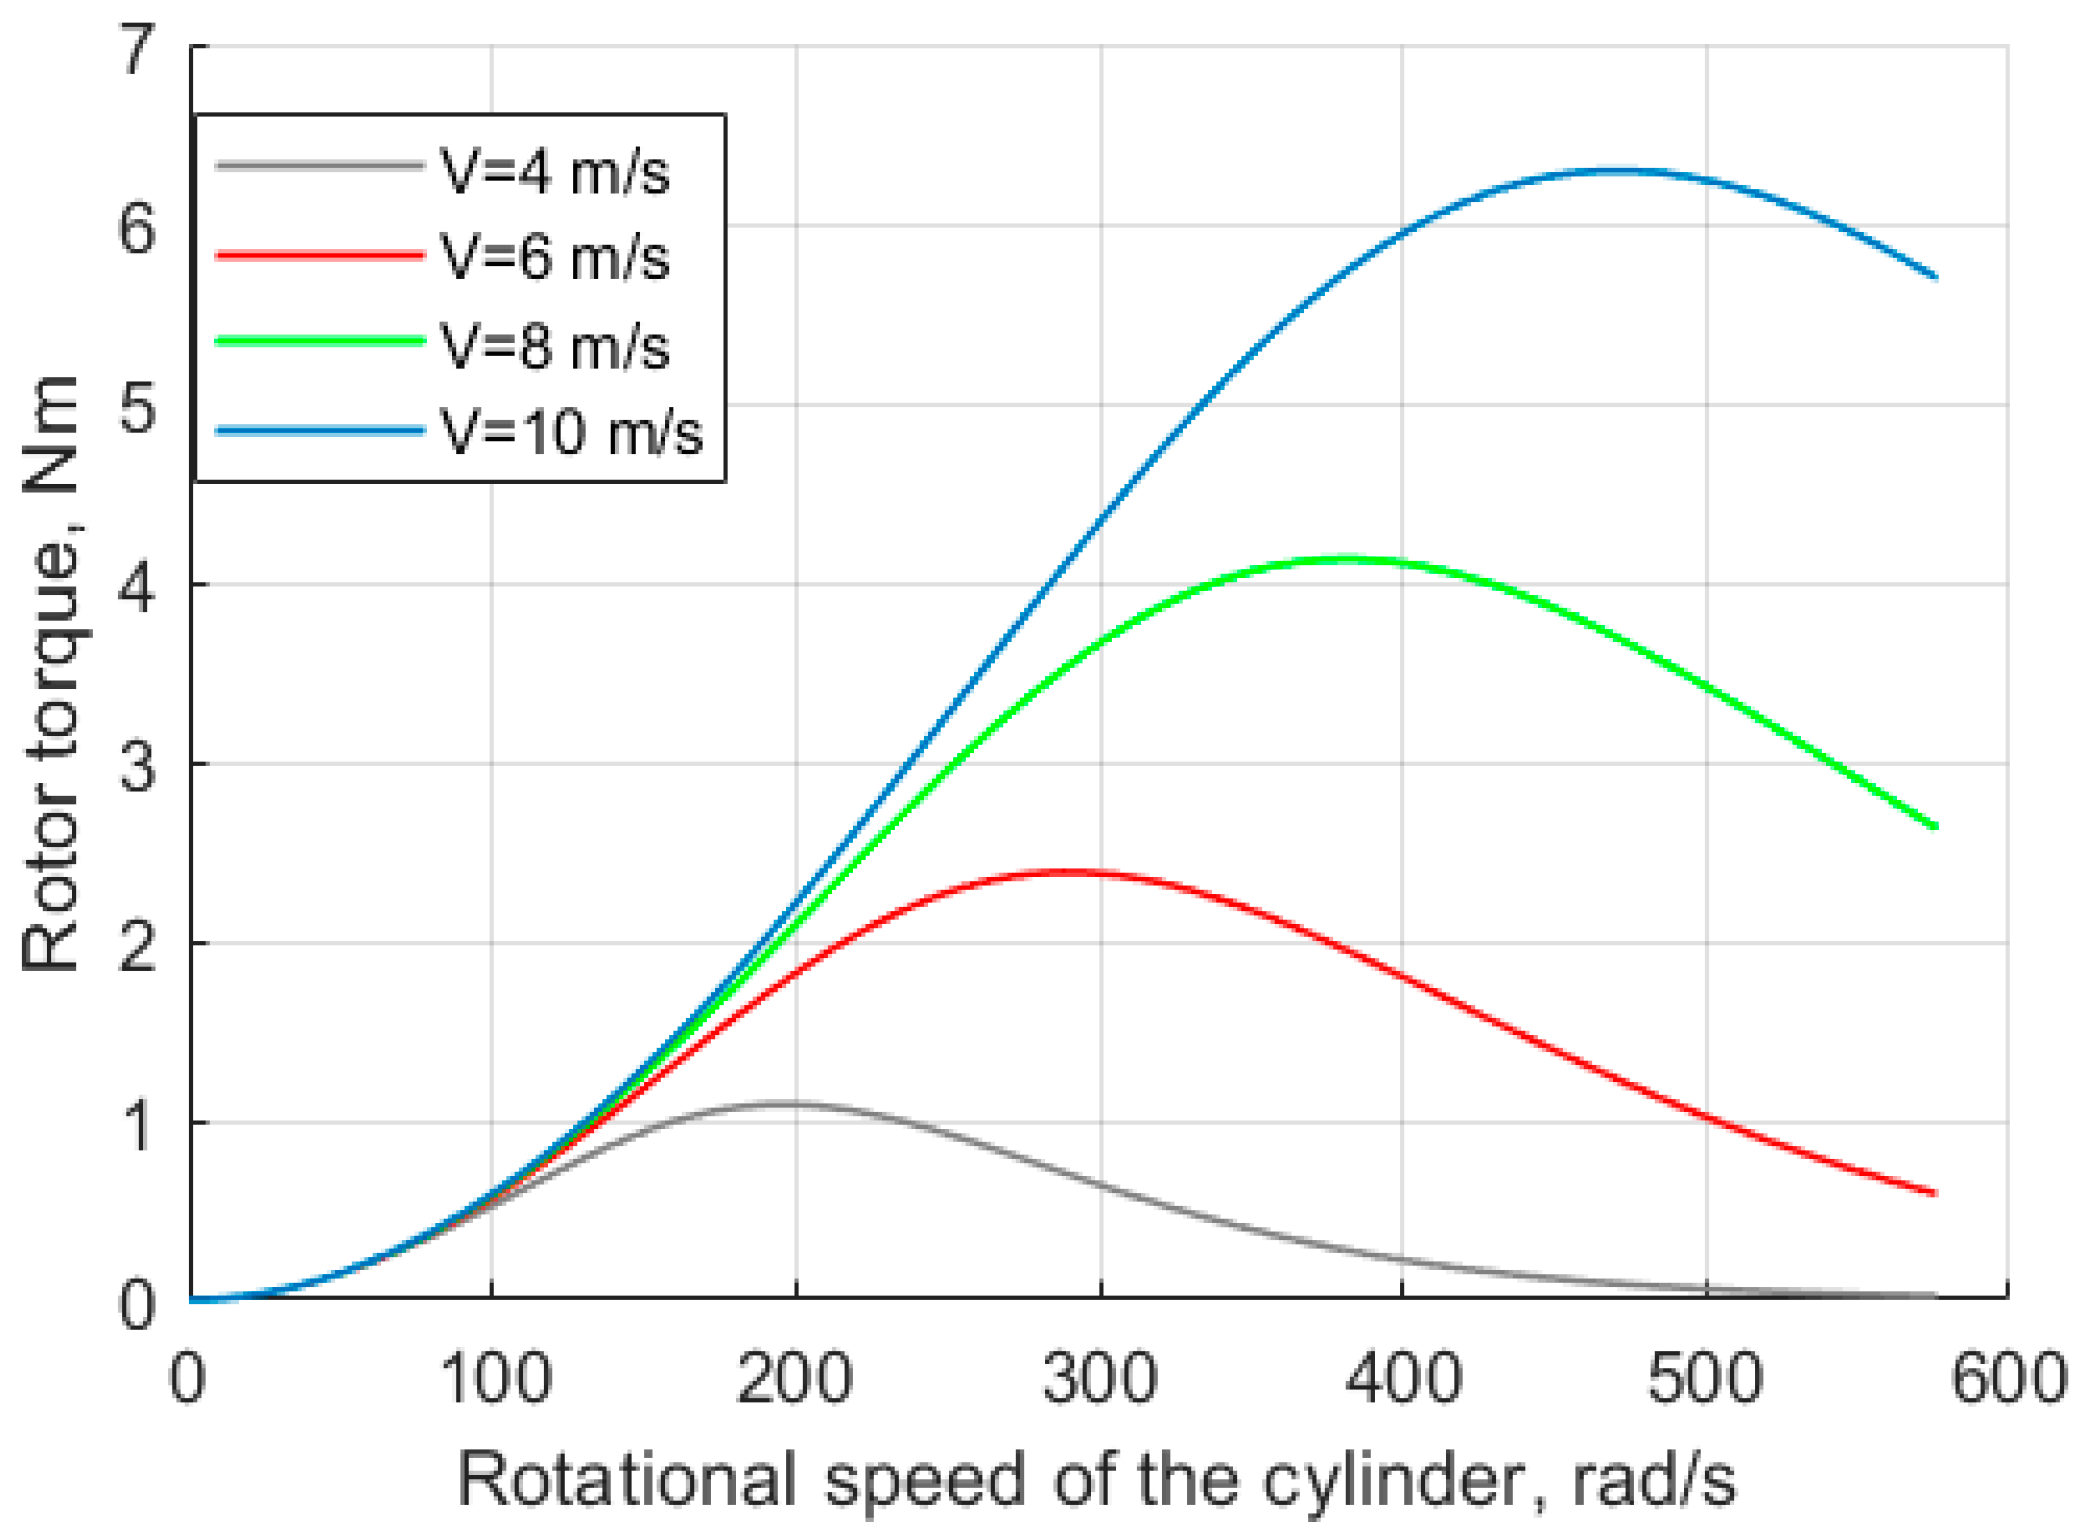
Results of the simulation for the analytical model are presented in
Figure 6. Similarly, to the experiment, the angular speed of the cylinder was increased from 0 to 600 rad/s, and the mechanical torque was measured. The plot for each wind speed shows two distinct areas: saturation and quasilinear, without any distinct initial area. Otherwise, the presented model follows the same patterns as experimental data and shows the maximum rotor torque of 23.8 Nm.
A similar simulation was performed for the regression model, and results are presented in
Figure 7. The presented model shows the main dependencies between mechanical power and rotational frequency and, unlike the analytical model, presents a distinct initial area. However, since the maximum value of
this model can obtain is relatively low, the maximum torque is significantly lower than in the previous model, reaching the value of 6.29 Nm.
The regression and correlation models showed poor accuracy when compared to experimental results.
Figure 7 and
Figure 8 are provided with smaller axes limits for illustrative purposes.
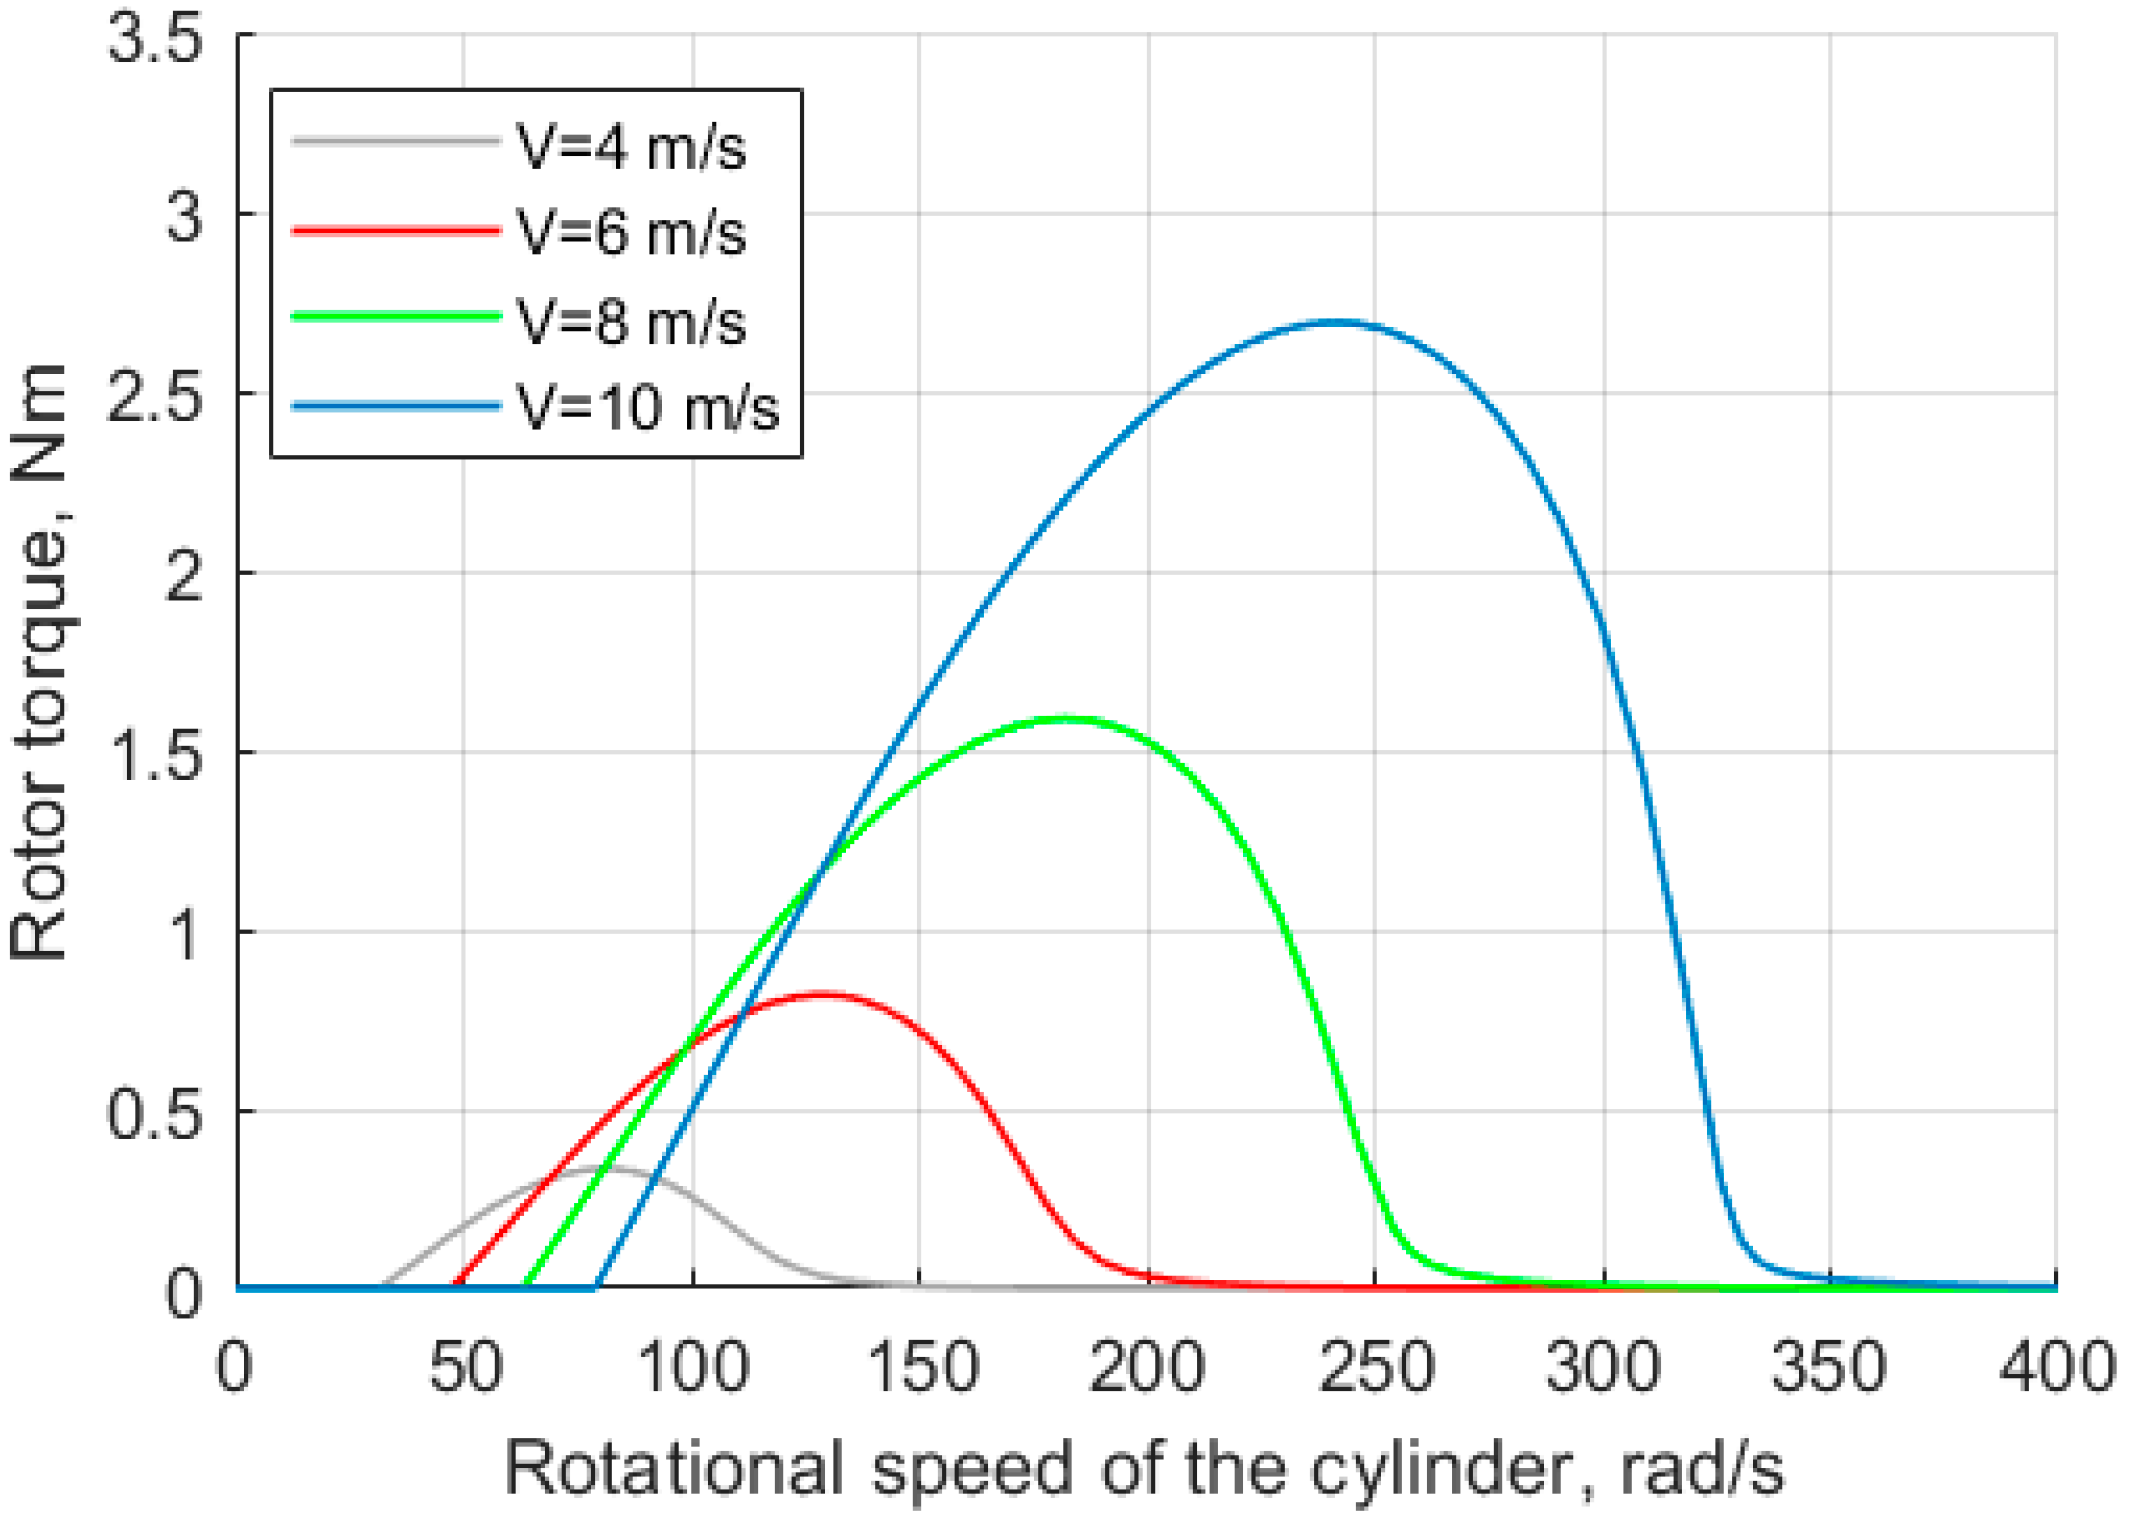
The last simulation was performed using the correlation model. The results are shown in
Figure 8. This simulation does not show a distinct initial area but clearly shows quasilinear and saturation areas. In addition, the model shows a significantly lower rotational speed required to reach the saturation area. However, the maximum torque on the rotor shaft is limited to 2.69 Nm, which is lower than previous models show.
As the next step of the experiment, data of maximum torque for each different wind speed was gathered and presented in
Table 2 and visualized in
Figure 9. Experimental data was used to assess the accuracy of each model. The data shows that an analytical model obtained the most accurate result. However, the correlation and regression models have shown less accuracy since the maximum value of
reached using this model is significantly lower. This discrepancy can be explained by the fact that the simulated turbine does not operate in the specified
Re area.
To summarize, it can be said that the developed models follow the same dependencies as the experimental MWT. The analytical model showed the most accurate results. Other models have shown to be highly dependent on the mechanical characteristics of the wind generator used. This can be explained by the fact that the correlation and the regression models were built for a very specific range of Reynolds numbers between Re 105 and 106. This Reynolds number is true for wind turbines with a radius of 2–5 m, however, the radius of the experimental wind turbine is 0.6 m. Meanwhile, the significant difference between the maximum torque of the correlation and the regression models can be caused by different approaches in both methods; the regression model uses the experimental data as an input, while the correlation model was based on dependencies between variables in equations describing the Magnus effect.
4. Discussion
The goal of MPPT techniques is to achieve maximal power production at the given wind speed. An MPPT can be achieved with different control methods, including variable blade pitch, yaw control, torque control, and aerodynamic brakes. Variable blade pitch allows changing Cp by adjusting one of the function’s parameters. This method allows for simple control; however, it also requires more complex blades with pitch control drives. Yaw control aims to reduce the rotor swept area by rotating the nacelle against the flow direction. However, this control method increases fatigue of rotor blades due to variation in load, and therefore it is rarely used for large-scale wind turbines. Torque control is one of the most straightforward and affordable techniques. It is based on varying torque on the generator, and it does not require additional mechanical components inside the rotor or nacelle to control yaw or pitch. Meanwhile, aerodynamic brakes are used to stall the turbine. This is a relatively complex control technique that requires the mechanization of rotor blades.
In the case of MWT, the most feasible conventional control technique is torque control. However, due to the fact that lift in the rotor of MWT is generated by cylinders and depends on their rotational speed, it becomes possible to control the wind turbine by adjusting the angular speed of Magnus cylinders. This approach has a potential advantage of over-torque control because it allows for the running cylinders at optimal rotational speed to limit energy consumption.
The model developed in this research work was used to study the power characteristics of the experimental generator. For that reason, the mechanical output power was obtained at wind speeds from 2 to 10 m/s, and results are presented in
Figure 10. Thus, the power curve shown in the figure represents the maximum mechanical power extracted from the wind at a given wind speed.
In the first region (wind speed 1–4 m/s), the wind turbine operation is not feasible due to low power output. In the second region (4–10 m/s), MPPT techniques should be used to achieve optimal mechanical output. With the increase in wind speed, the MWT reaches the third region (10+ m/s), and the rated power production should be achieved. The turbine has to be kept at a lower rotational speed in this region to ensure the rated power generation and avoid mechanical damage.
5. Conclusions
The technological level of today’s industry and everyday life requires sustainable energy preservation and regeneration methods. Therefore, new and renewable energy sources should provide high efficiency in order to achieve that goal. MWT is one of the potential technologies that can contribute towards advanced control techniques (e.g., MPPT) being used. In the current research work, multiple goals required for developing an MPPT control for the MWT were achieved.
Primarily, the literature analysis shows that, when compared to conventional wind turbines, MWT has inferior coverage from the scientific research groups. There were only three possible simulation models discussed in the literature, so all approaches to simulate of the power coefficient of MWT were studied. As a result, mechanical and aerodynamical models of the MWT were created.
The conducted study showed the possibility of designing three simulation models for describing MWT power characteristics. The literature review showed the linear relationship between the generated power and power coefficient of a wind energy conversion system. Three analytical models—analytical, regression, and correlation, using the power coefficient—were created. The simulation results for the presented mathematical models were later validated by comparing them to the experimental data on mechanical torque of the rotor of the experimental wind generator. The analytical model in the comparison was the most accurate with experimental results. Other models have been shown to be highly dependent on the mechanical characteristics of the wind generator used. The final comparison has shown that the analytical model presents the most accurate results, and it was selected to be a base model for further research in the field of MPPT for MWT.
All discussed in the paper models may be repeated by using the link given in the Data Availability Statement section.
Moreover, a power curve was obtained using the chosen analytical model. This curve is to be used to determine the optimal approach to MPPT. Further work in the field of MPPT for MWT requires the implementation of electrical, electromechanical blocks to the developed model, and simulating different MPPT techniques.


 ,
, 


