Article

Spatial-Temporal Heterogeneity in the Deformation and Damage of Rock Samples: Experimental Study Using Digital Image Correlation Analysis

1
School of Mechanics and Civil Engineering, China University of Mining & Technology (Beijing), Beijing 100083, China
2
International Cooperation Base of Beijing Transportation Infrastructure Construction and Beijing Future Urban Design High-Tech Innovation Center, Beijing University of Civil Engineering and Architecture, Beijing 100044, China
*
Author to whom correspondence should be addressed.
Appl. Sci. 2022, 12(3), 1364; https://doi.org/10.3390/app12031364
Submission received: 8 December 2021 / Revised: 9 January 2022 / Accepted: 19 January 2022 / Published: 27 January 2022
(This article belongs to the Topic Advances in Dynamics of Building Structures)

Abstract

:
In situ observations and laboratory experiments showed that slow deformation waves widely exist in geomedia under loading conditions. Slow deformation waves’ behavior exhibits some similarities in media ranging from the scale as large as the Earth’s crust to the scale as small as the laboratory test samples. However, the mechanism underlying their generation has not been clarified yet. In this research an experimental study was performed on small-scale red sandstone samples subjected to uniaxial compression at the displacement rates of 0.1, 0.5, and 1 mm/min. Slow deformation waves under different loading rates were analyzed by speckle photography for microscopic characterization combined with the digital image correlation (DIC) technique. The Luders deformation bands were predominantly observed in the flow channels formed at the stage of macro-elastic deformation. The spatial-temporal heterogeneity of the rock sample surface was quantified, and the deformation waves’ propagation velocities under different loading rates were obtained. The linear relationship between the propagation velocities of slow deformation waves and the loading rates was determined. The research findings shed some new light on the evolutionary characteristics of the slow deformation waves.

1. Introduction

In situ observations showed that slow deformation waves with propagation velocities much lower than those of transverse and longitudinal waves generated by earthquakes exist in Earth’s crust. Slow deformation waves have different names with less essential differences, for example, seismoactive waves [1], creeping stress waves [2], tectonic waves [2,3], plastic flow waves [4,5,6] etc. According to the concept of epicenter migration-related waves [7], their propagation velocities in the seismic belt may reach only several dozens of kilometers per year [8]. The presence of creeping waves can be related to the instability caused by frictional sliding [9]. As to the occurrence mechanism of these waves, it is believed that they are jointly triggered by external factors and the changes in the properties of the media in the focal area [10]. Inside the Earth’s crust, there is an interlayer composed of volatile media. Under certain conditions, the propagation of slow deformation waves may be triggered in such volatile media, and they play a crucial role in seismic development and occurrence [11]. Studies on the plastic flow network and plastic flow waves of the continental lithosphere [5,6] have shown that the driving force at the margin of the continental plate is transmitted over a long distance, primarily through the network-like flow and slow deformation waves in the lower lithosphere, including the lower crust and lithospheric mantle. This driving force also controls the intraplate deformation and seismic activities. Under the Indian plate’s pushing effect, the deformation flow waves with different quasi-periodicity are present in the central and eastern Asian continent, such as ten-year and one-hundred-year period waves.
Deformation and failure of solids under the action of external factors are among the top research concerns in materials science and engineering [12,13]. In recent years, both the spatial and temporal scales of deformation and failure of solids studied by the researchers have constantly been expanding [14]. Qi et al. [15] applied the continuous phase transition theory and the Lagrangian mechanics theory to construct a theoretical model of slow deformation waves in rock surrounding deep level tunnel. The scales related to slow deformation waves may range from global to atomic scales, and the types of loading causing the deformation and failure vary from short-term (rapid) loading to long-term loading (at creep rates) [16,17]. The theoretical study by Li and Shao [18] applied the multi-microcrack model to study the macroscopic brittle creep failure caused by microcrack growth under step loading and unloading in rocks. During large-scale field observations, significant variations of the geophysical field’s spatial-temporal characteristics were measured to determine slow waves’ features. It was found that the directional migration of the epicenter was a prevalent phenomenon, which could be observed, for example, in the Hindu Kush region [19,20], in the Baikal Lake region of Siberia [21,22], and in China [23]. As to the deformation waves at the laboratory level, compression and tensile tests have been performed for the sylvite, marble, and alkali halide samples. The slow deformation waves traveling in the samples were studied [24,25]. It was found that the slow deformation waves traveling in the rock samples and the alkali halide samples were similar to those observed previously in the metallic materials [26]. All of these findings are of high significance to the study of slow deformation waves in geomaterials.
Most of the existing experimental studies on the slow deformation waves have been conducted on such homogeneous materials as metals or metal halides, but less commonly on rocks. The propagation and evolution characteristics of the deformation waves in rocks have not yet been adequately studied. The microscopic and mesoscopic mechanism of the slow deformation wave has not been clearly explained. The relationship between the propagation speed of the slow deformation wave in the rock and the loading rate has not been specifically studied. Since slow deformation waves mainly propagate in the Earth’s crust, typically through rocks as the media, it is important to study their propagation and evolution in rocks. In the present study, indoor uniaxial loading tests were performed for a group of red sandstone samples under the loading rates of 0.1, 0.5, and 1 mm/min, respectively. In the process of deformation and failure of the rock samples, the speckle photography technique combined with the digital image correlation (DIC) technique were used to quantify the slow deformation waves. The evolution of the strain component ε x x   under the three loading rates was studied, and the propagation rates of the deformation waves under different loading rates were calculated. The relationships between the wave propagation velocity and loading rate were further analyzed. The analysis of obtained nephograms indicated that the Luders deformation occurred predominantly in the flow channels formed at the stage of macro-elastic deformation. It was related to the extreme values of the elastic standing waves.

2. Experiments

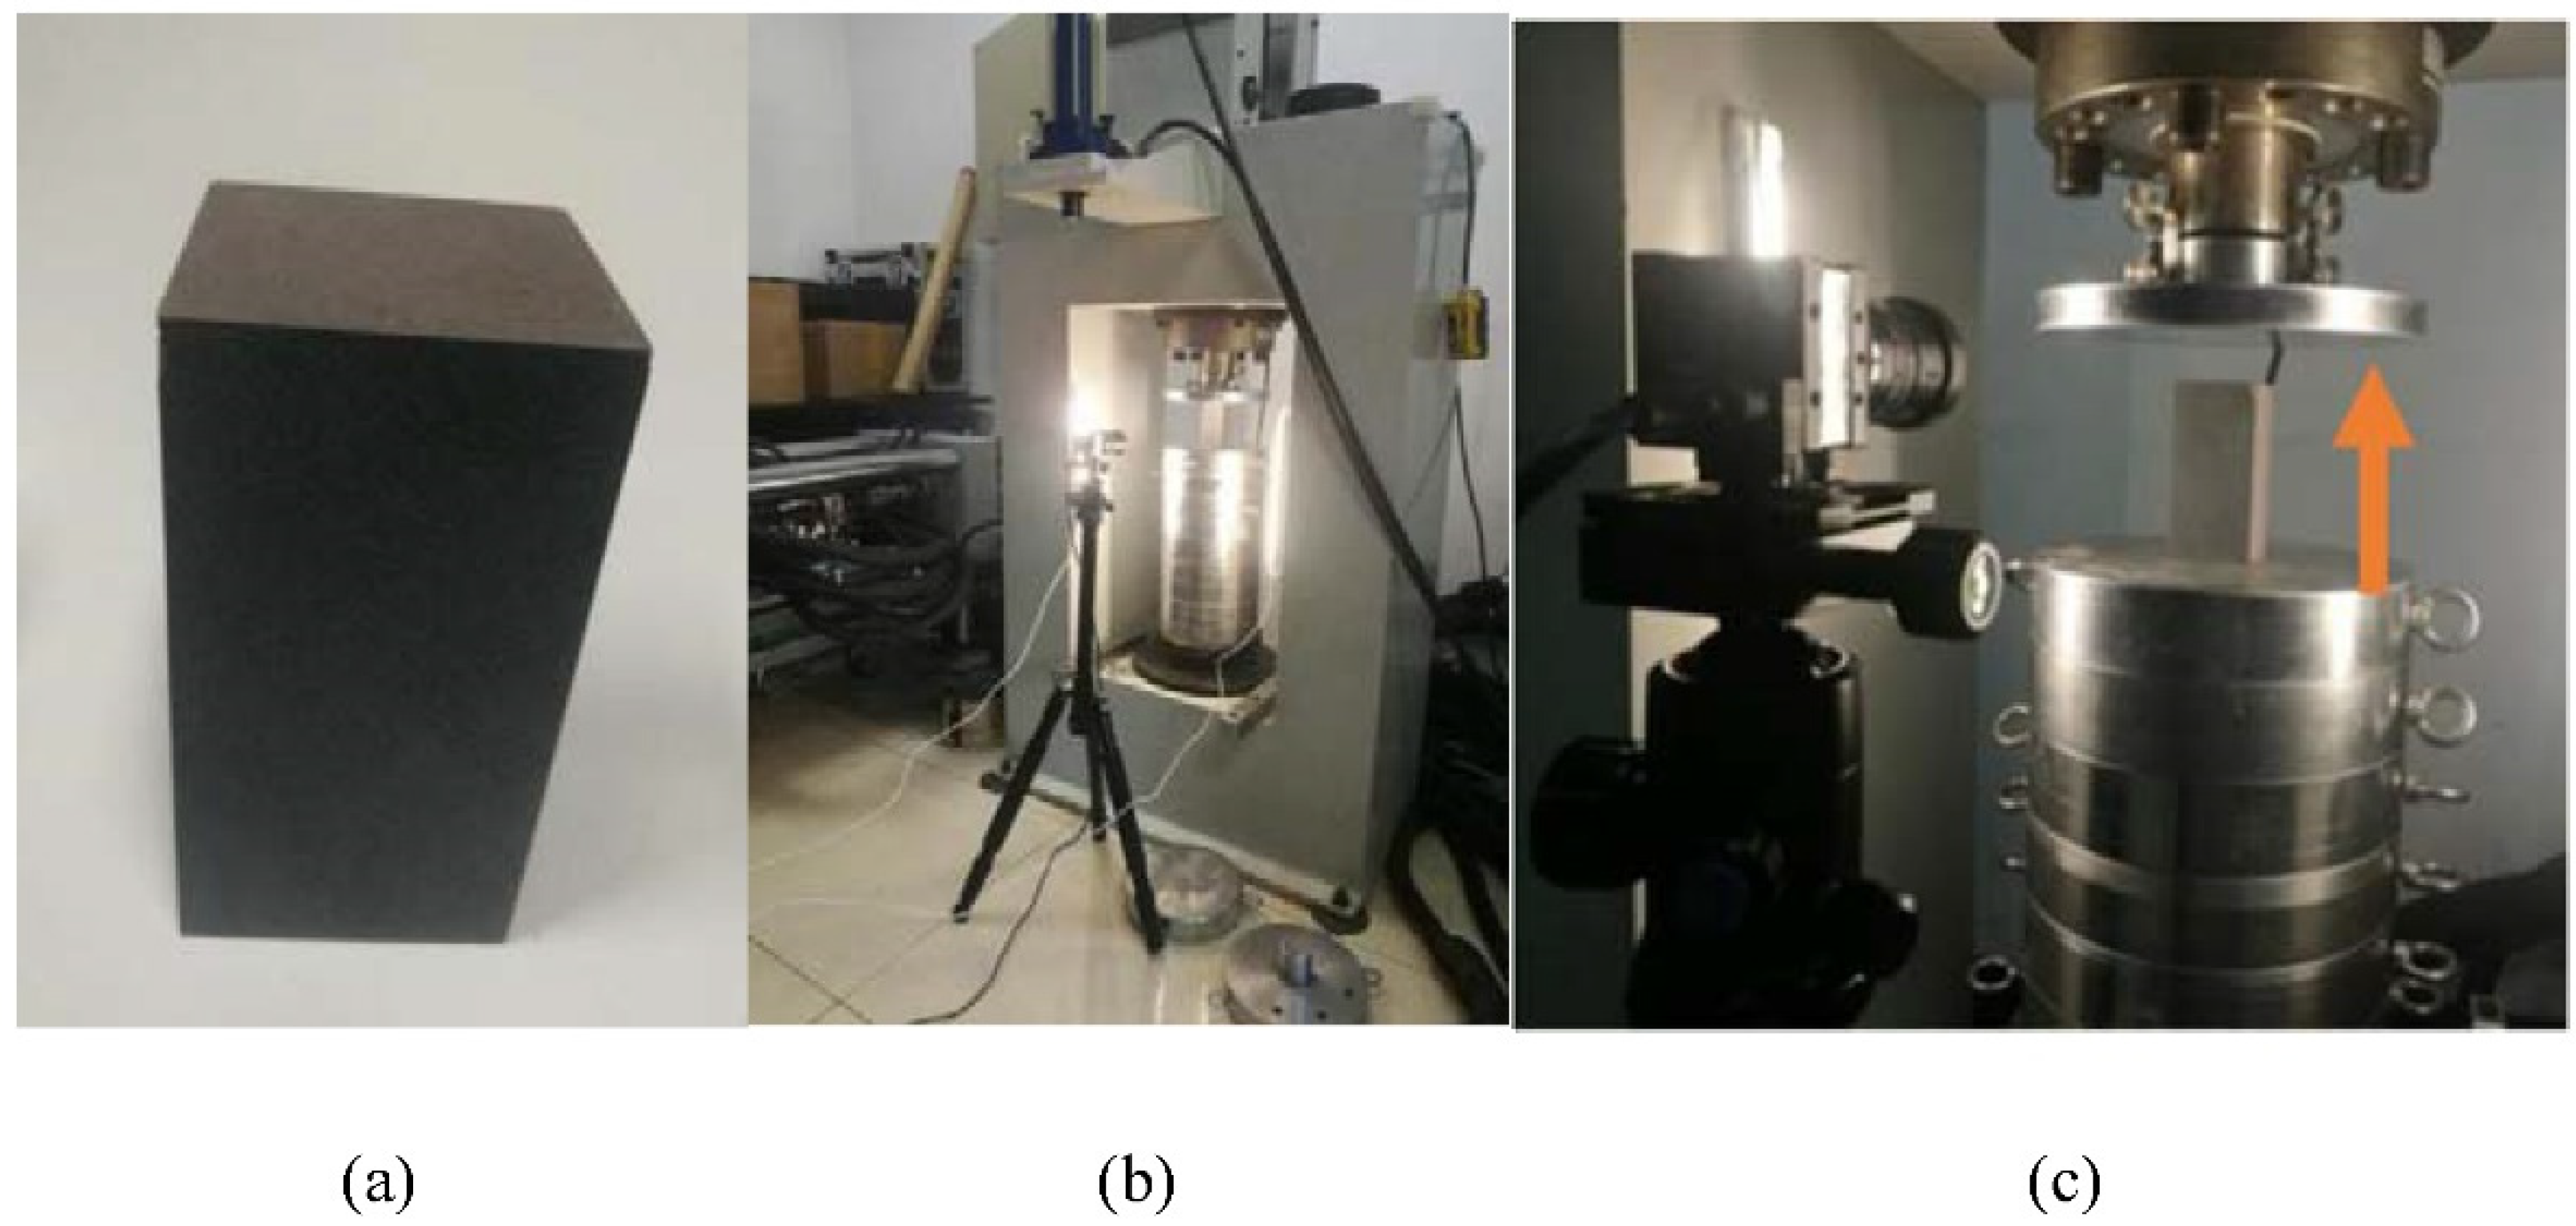
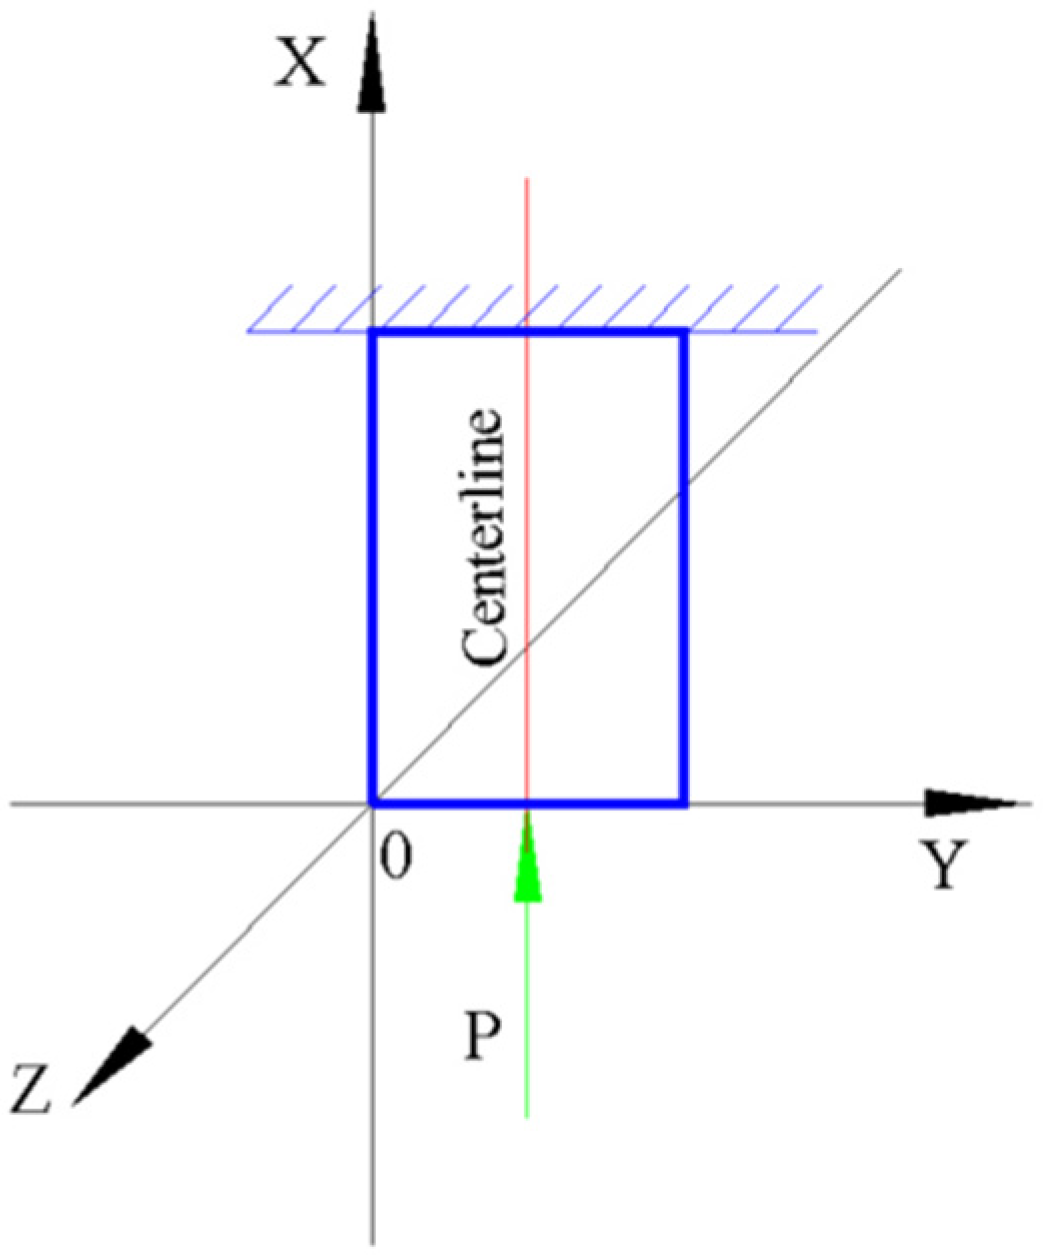
2.1. Test Equipment and Rock Samples

The rock samples under study correspond to the third category of the red sandstone. The latter exists in two main structure forms, including granular-clastic and mud cement forms, and has high hygroscopicity, porosity ranging approximately from 0.1 to 0.3, low bonding performance, poor overall performance, and is less prone to disintegration than ordinary sandstone. Nine red sandstone samples with dimensions of 50 mm × 50 mm × 100 mm were prepared using the method recommended by the International Society for Rock Mechanics (ISRM) [27]. Every two opposite sides were parallel to each other, and all of them were smooth. All samples were prepared from the same batch of blocks harvested on-site. Those with defects and joints were eliminated.
The rock samples were subdivided into three groups, each containing three samples, and were subjected to displacement-controlled compressive loading at three loading rates, using a DRTS-500 test bench composed of the loading system (with the maximum axial load of 500 KN) and the data collection system. The displacement control mode was adopted since the test goal was to investigate slow deformation waves under different loading rates. The rock sample geometry and the experimental equipment are shown in Figure 1.
Given that speckle photography was adopted to capture the rock samples’ images, the samples were first sprayed with a layer of ordinary white paint and left to dry. Then, another layer of black particle paint was sprayed to form random speckles [28,29,30].

2.2. Experimental Scheme

Before the main displacement-controlled tests, a group of uniaxial compression tests were first performed to obtain the basic mechanical parameters of rock samples. The average compressive strength of the rock samples was 80 MPa. The loading was imposed under the displacement-controlled mode with three different rates: 0.1, 0.5, and 1 mm/min, respectively. In each group, speckle photography was used for microscopic characterization from the start to the end of the loading process. Later, the collected images were subjected to the digital image correlation (DIC) analysis. The evolution of the displacement vector r(x, y) field at the marked points on the sample surface was tracked and recorded to provide data for the further analysis.
A typical stress-strain curve of an intact rock sample can be roughly subdivided into the following four stages. The first stage is the compaction stage, where the curve bends slightly upwards, and the initial microcracks are closed due to the compression. The curve is a straight line at the second stage, so this is the linear elastic stage. At the third stage, the curve bends slightly downwards, and unstable microcracks are generated in the direction parallel to the loading direction. The third stage is called a non-elastic (plastic) stage, while the fourth one is referred to as the failure stage. At the plastic and failure stages, cracks appeared on the sample surface, so the DIC technology would fail to achieve the desired effect. Therefore, DIC is only applicable to the data at the first two (compaction and elastic) stages. In metals and alloys, features of strain localization that resemble those of the deformation waves have been observed at the linear elastic stage in the samples under compression or tension [31,32]. In the present study, the deformation waves’ propagation velocities at the linear elastic stage were of primary concern during the loading process. At this stage, the wave propagation velocity was closer to the slow waves’ velocities observed in Earth’s crust and exhibited similar evolution patterns.

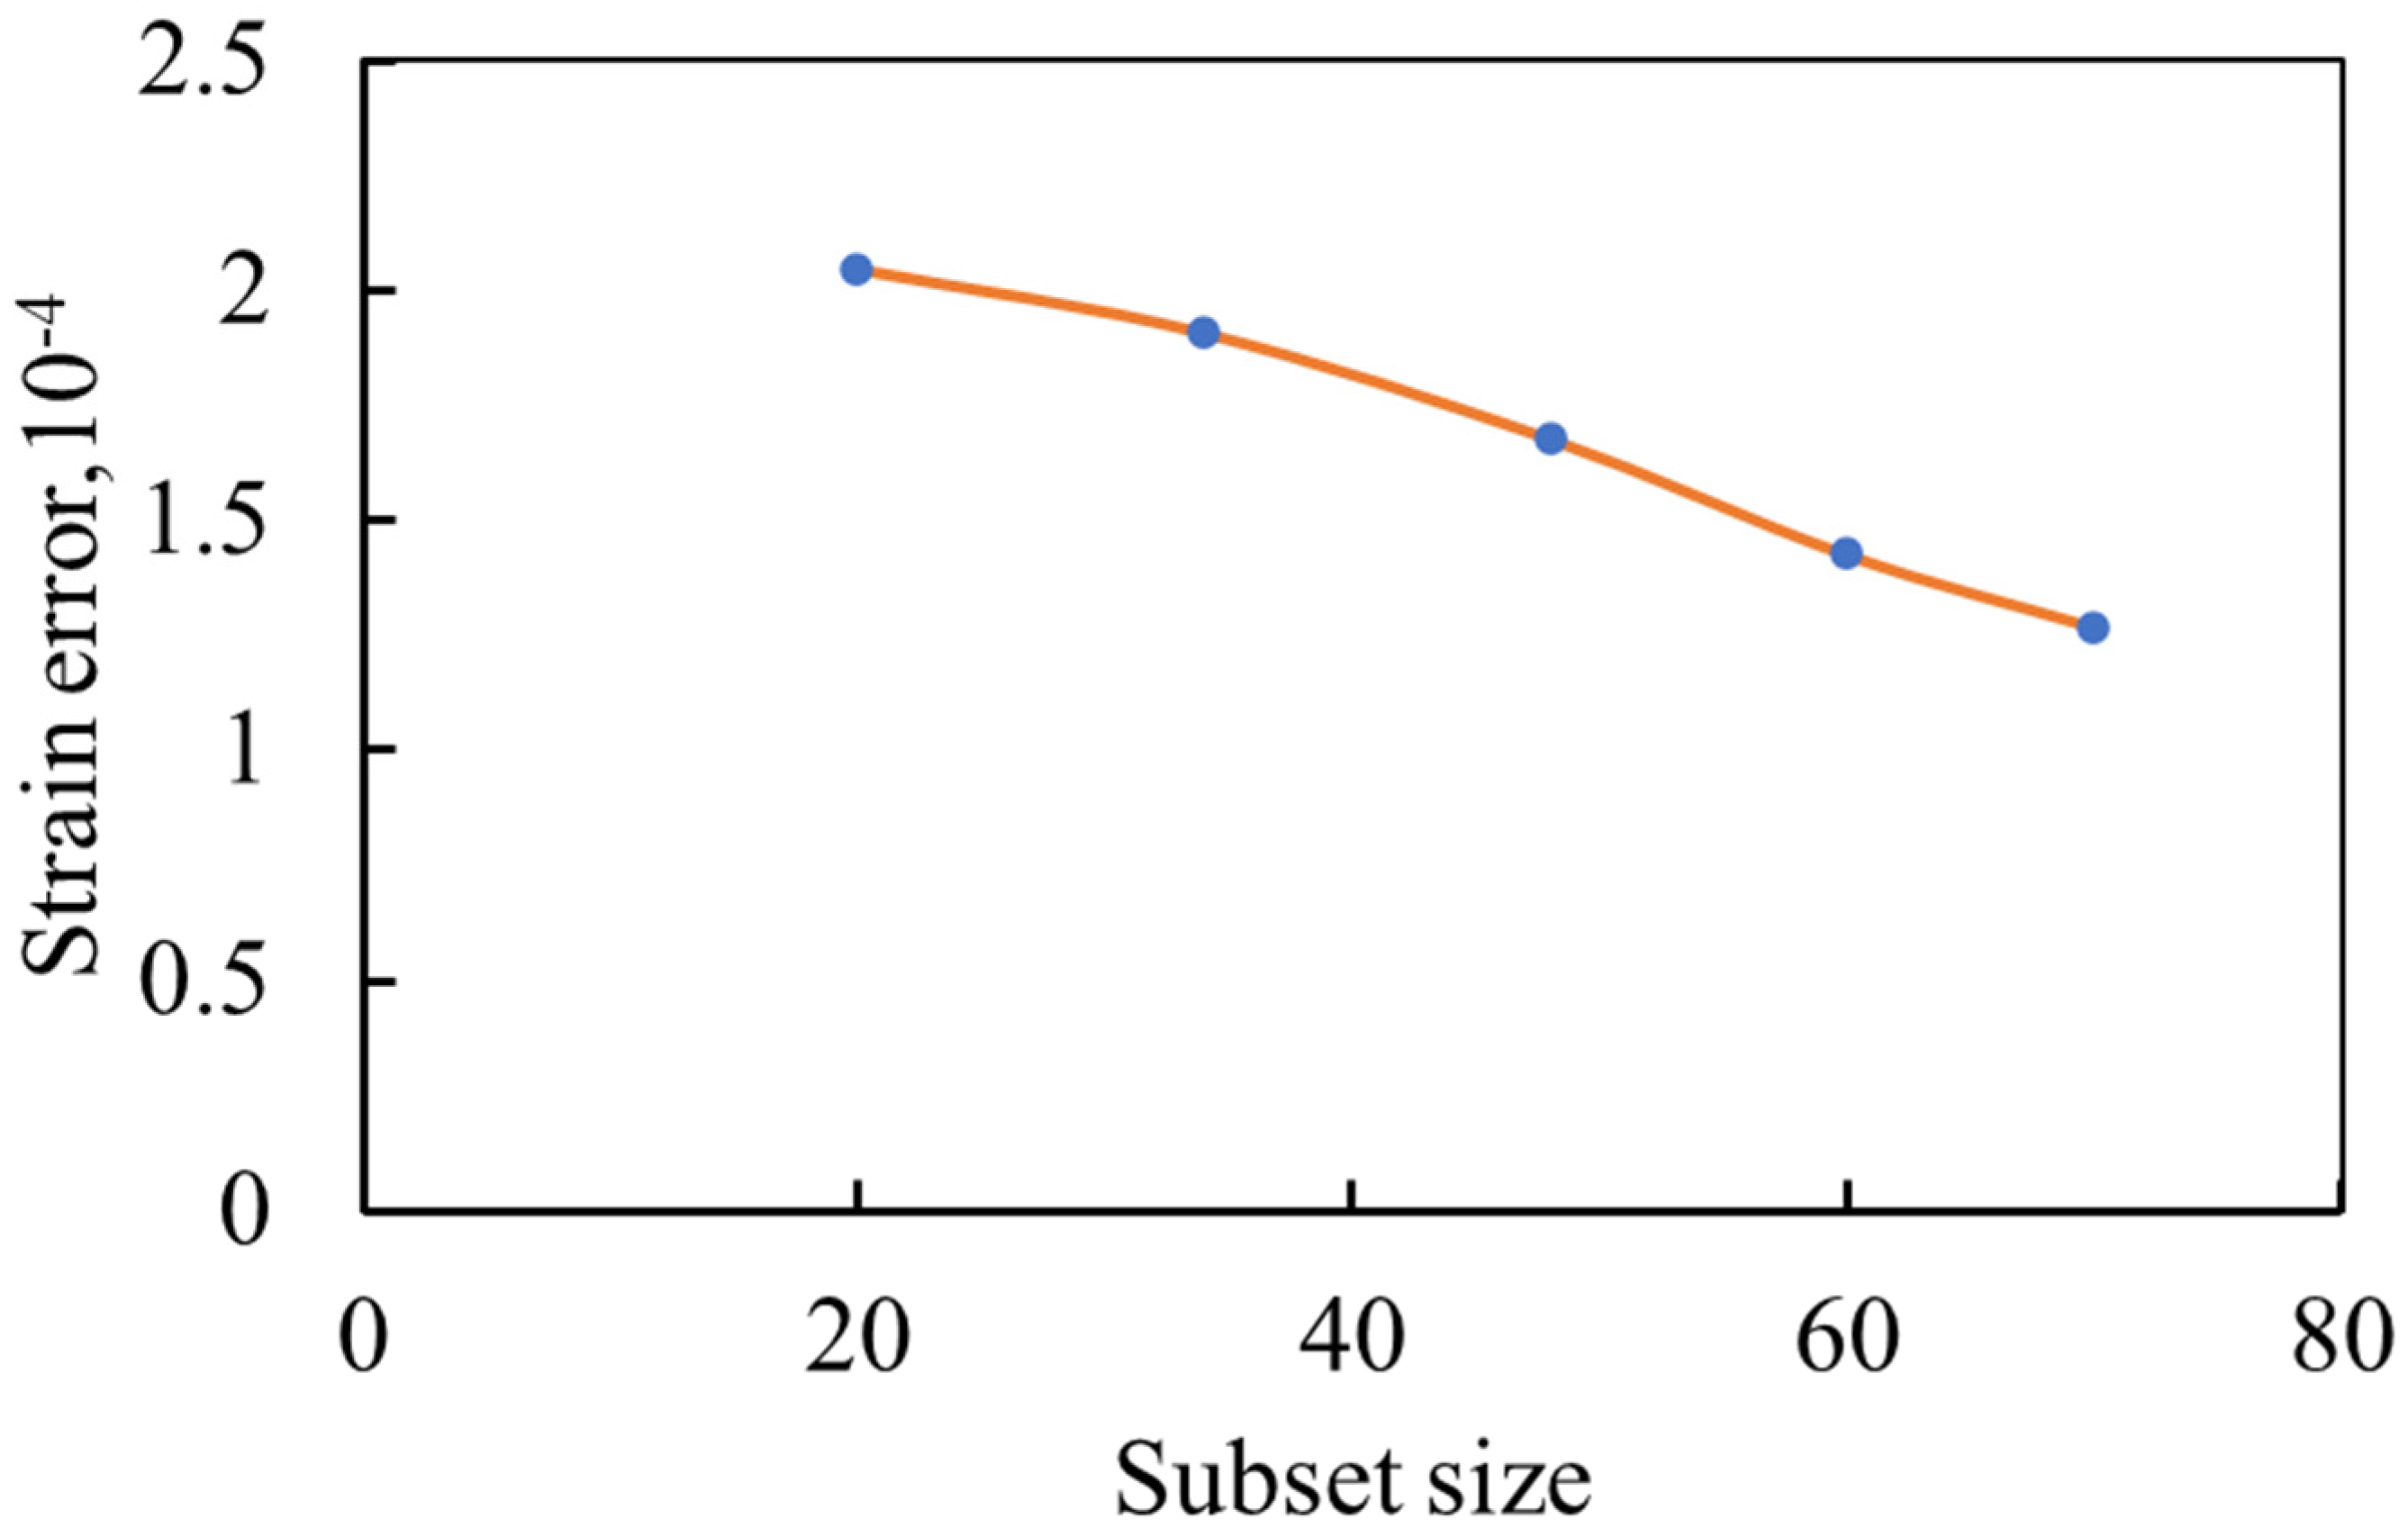
2.3. Technical Principle of DIC

Digital image correlation (DIC) technique is a non-contact optical technique known for its practicability and effectiveness [28]. This technology can be used to measure the deformation of an object’s surface. Currently, DIC has been widely applied to experimental studies on the deformation of rocks and rock-like materials [33,34,35,36,37,38,39]. The core algorithm used in the DIC tracks the relative displacement of the speckles by comparing the current image against the reference one. The reference image is subdivided into smaller subsets, whose changes are tracked on the deformation images. The x and y coordinates of the point Pcur (xcur, ycur) in the current subset are related to the coordinates of the point Pref (xref, yref) in the reference subset as follows:
x c u r = x r e f + u r c + u x r c ( x r e f x r e f c ) + u y r c ( y r e f y r e f c )
y c u r = y r e f v r c + v x r c ( x r e f x r e f c ) + v y r c ( y r e f y r e f c )                    
where x r e f and   y r e f are the x and y coordinates of the point P r e f   in the reference subset, respectively; x r e f c   and y r e f c   are the x and y coordinates of the central point Q r e f   in the reference subset, respectively; u r c   and v r c are the horizontal and vertical displacements of the subset, respectively; u x r c , u y r c , v x r c ,   and   v y r c are the gradients of the subset’s displacement components, respectively.
The main DIC algorithm used in the software is based on the RG-DIC (reliability guided digital image correlation) framework. The image takes pixels as coordinate units and the sub-area size is 16 × 16 pixels, and the default step size is 8 pixels. In theory, the sub-area with a small size should be selected as much as possible to prevent disordered displacement data. Following the recommendations of the International DIC Society (https://idics.org/guide/) (accessed on 7 December 2021), HD industrial camera (resolution 2560 × 1922) conduct data was acquired with a sampling frequency of 0.5 Hz and a pattern frame number of 14.2 fps.

2.4. Calculation of Different Strain Components

Different strain components are calculated as follows:
r = β i j = | ε x x ε x y ε y x ε y y | + ω z
where ε x x = u x   is the strain vector component along the compression direction x,  ε y y = v y   is the transverse strain component, ε x y = ε y x = 1 2 ( u y + v x ) is the shear strain component, ω z = 1 2 ( u y v x ) is the rotational component, while u and v are the components of the displacement vector r along the x- and y-axes, respectively.
In the software, the strain is obtained from the displacement data by using least square plane fitting (generally a continuous circle). One of the strain types calculated with Ncorr is a green Lagrange strain, which is obtained by using four displacement gradients as follows:
E x x = 1 2 ( 2 u x + ( u x ) 2 + ( v x ) 2 ) E x y = 1 2 ( u y + v x + u x u y + v x v y ) E y y = 1 2 ( 2 v y + ( u y ) 2 + ( v y ) 2 )

3. Experimental Results

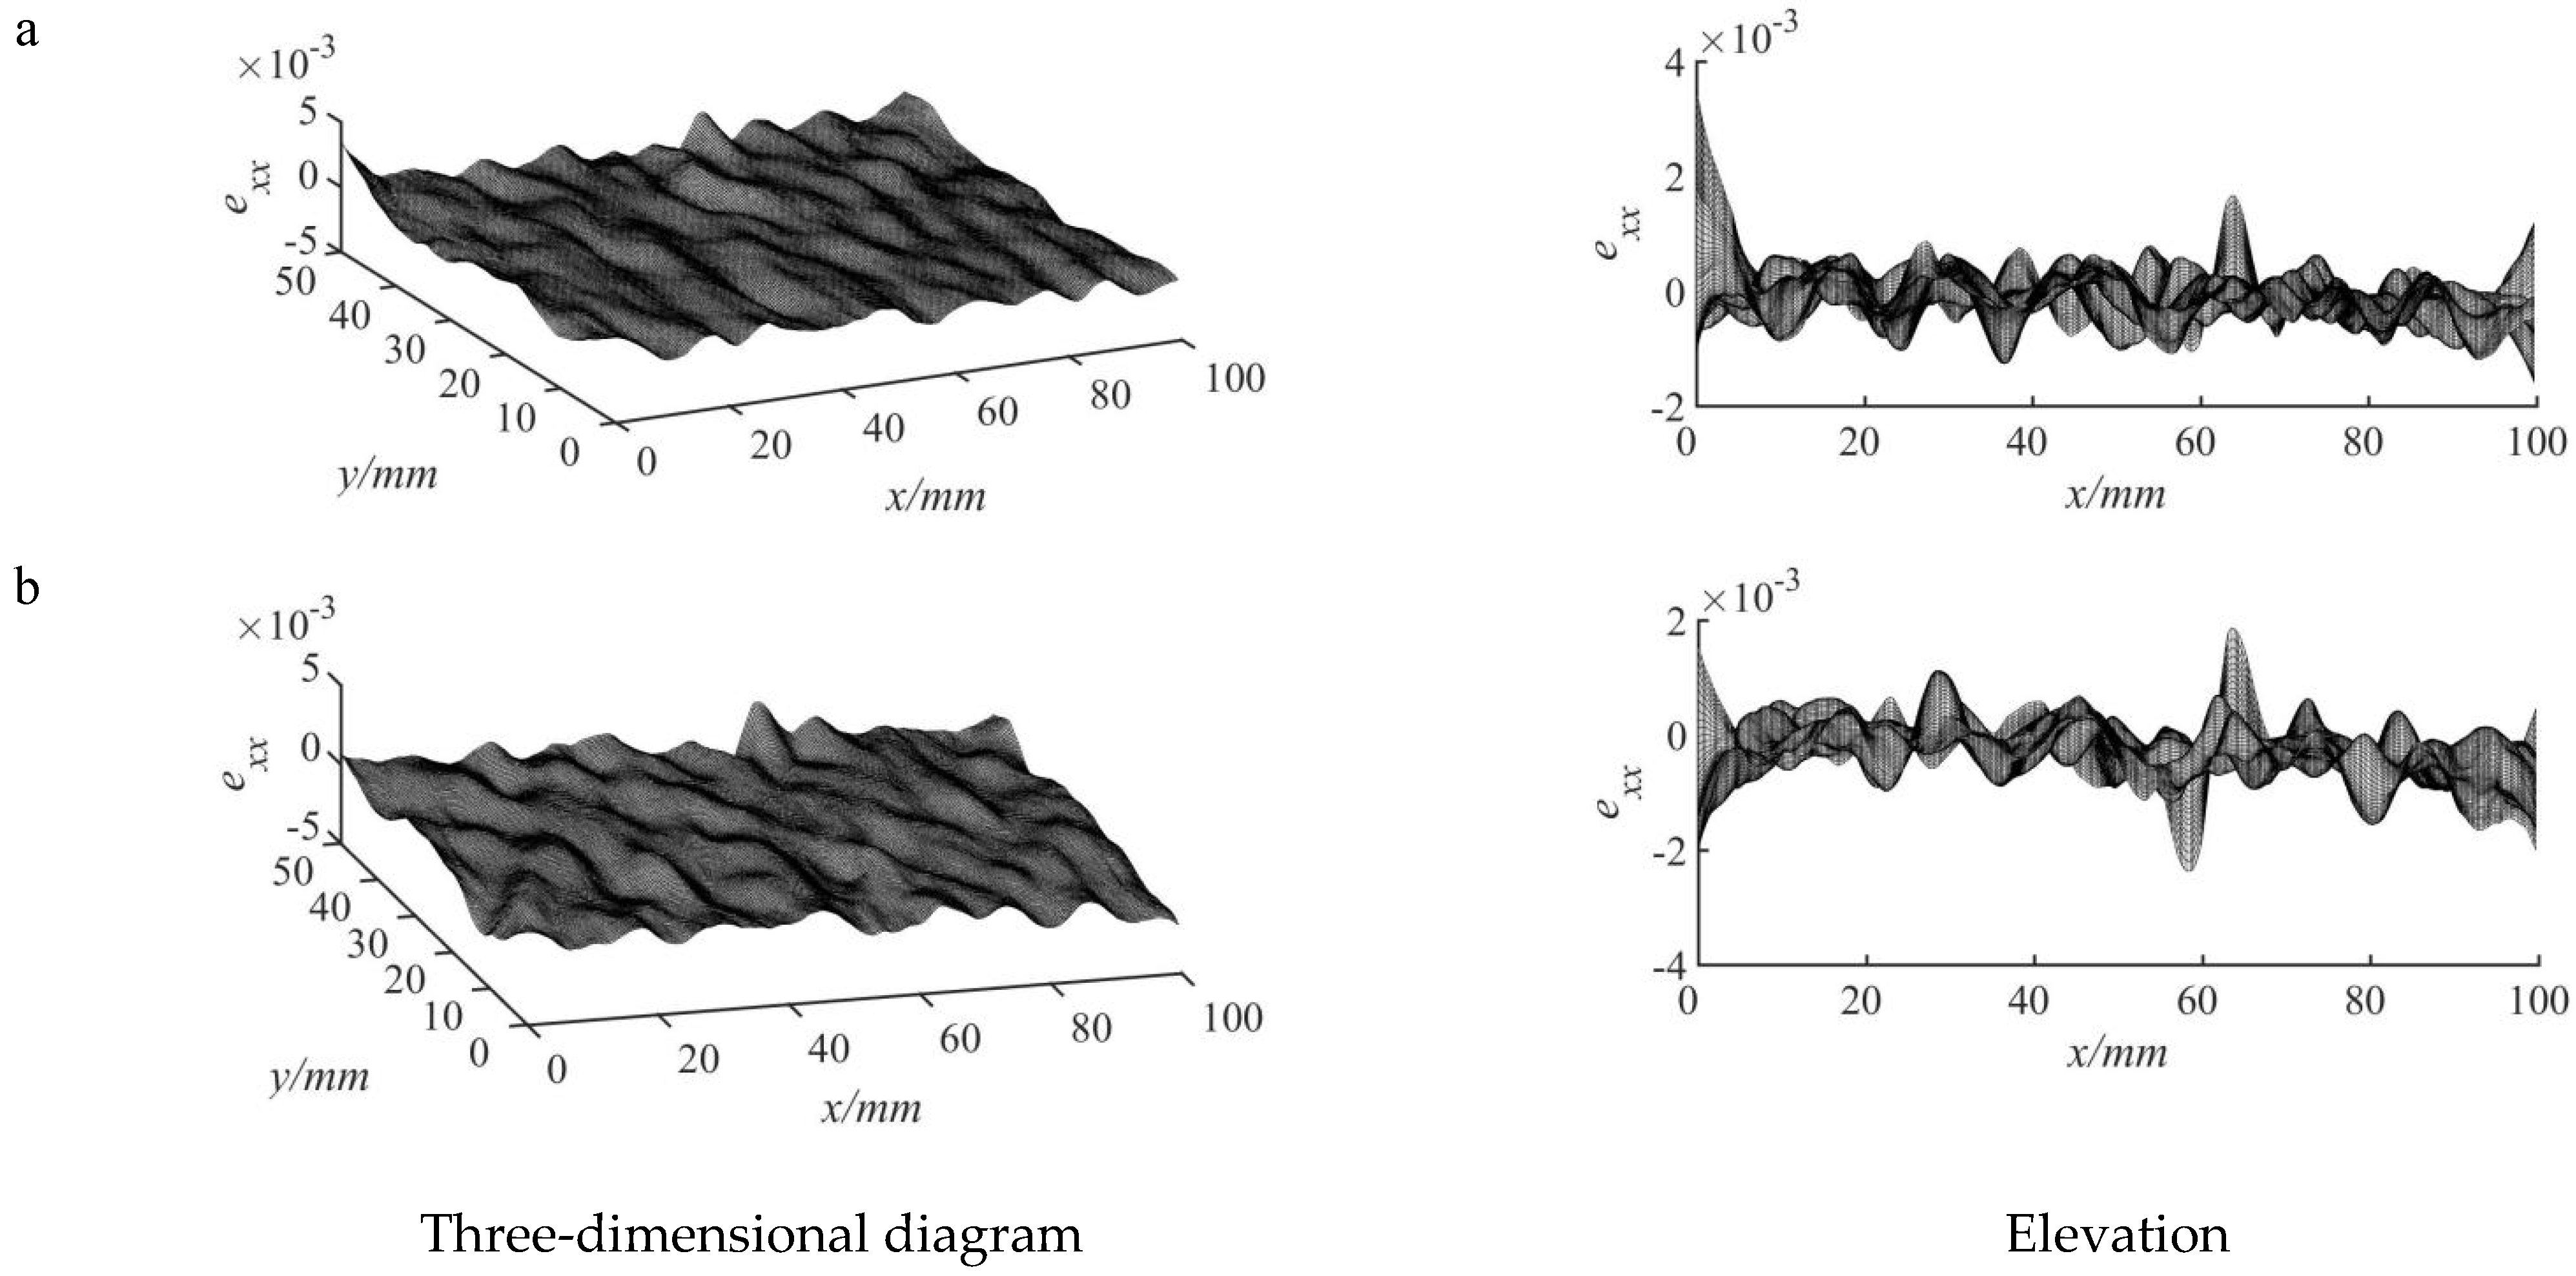
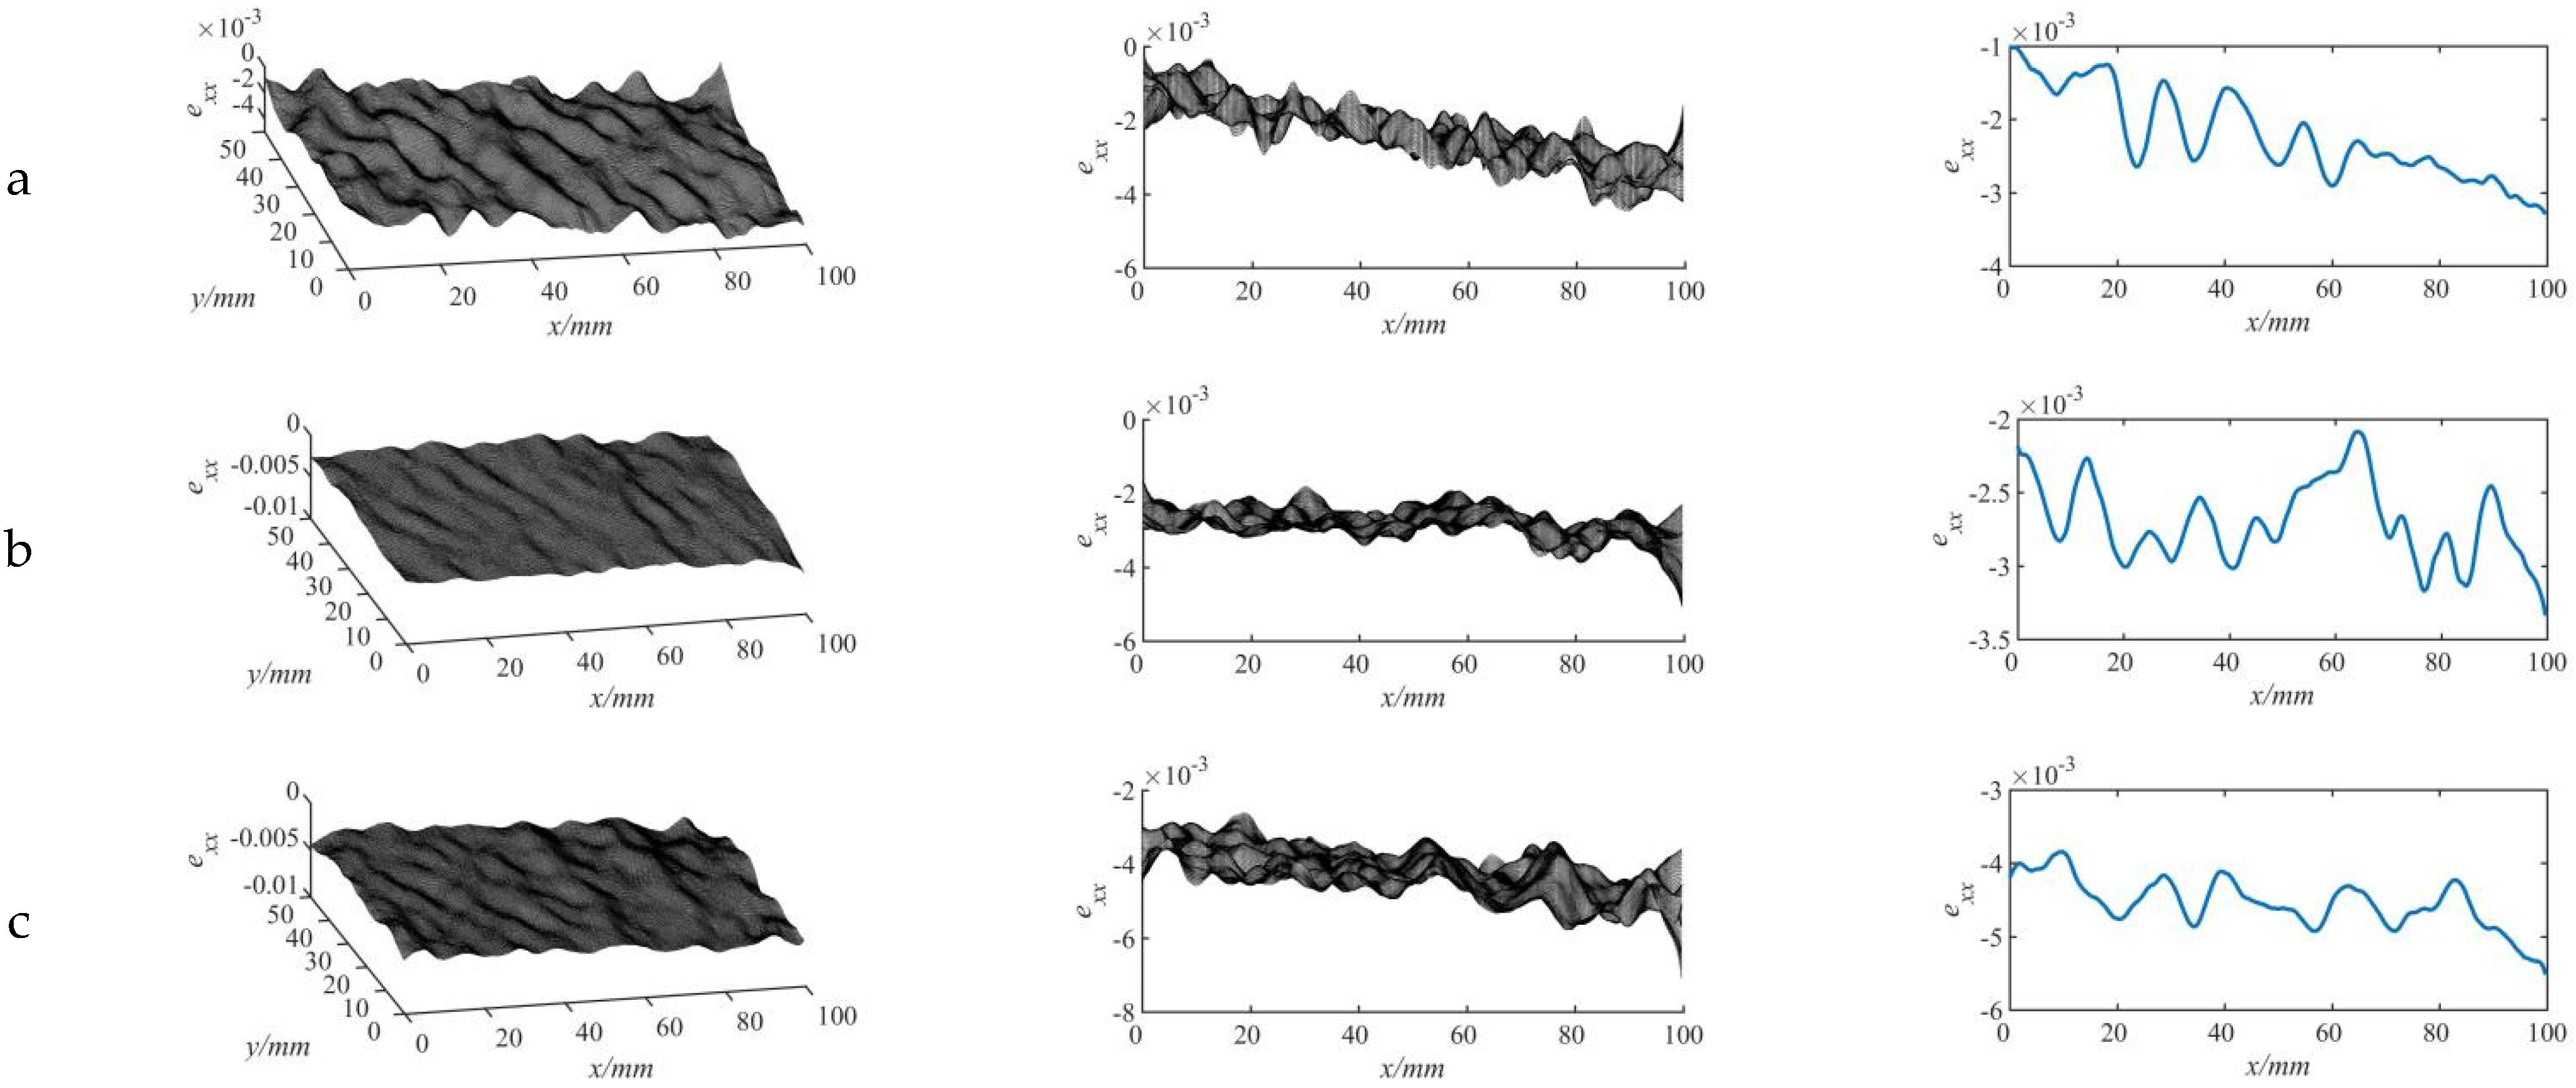
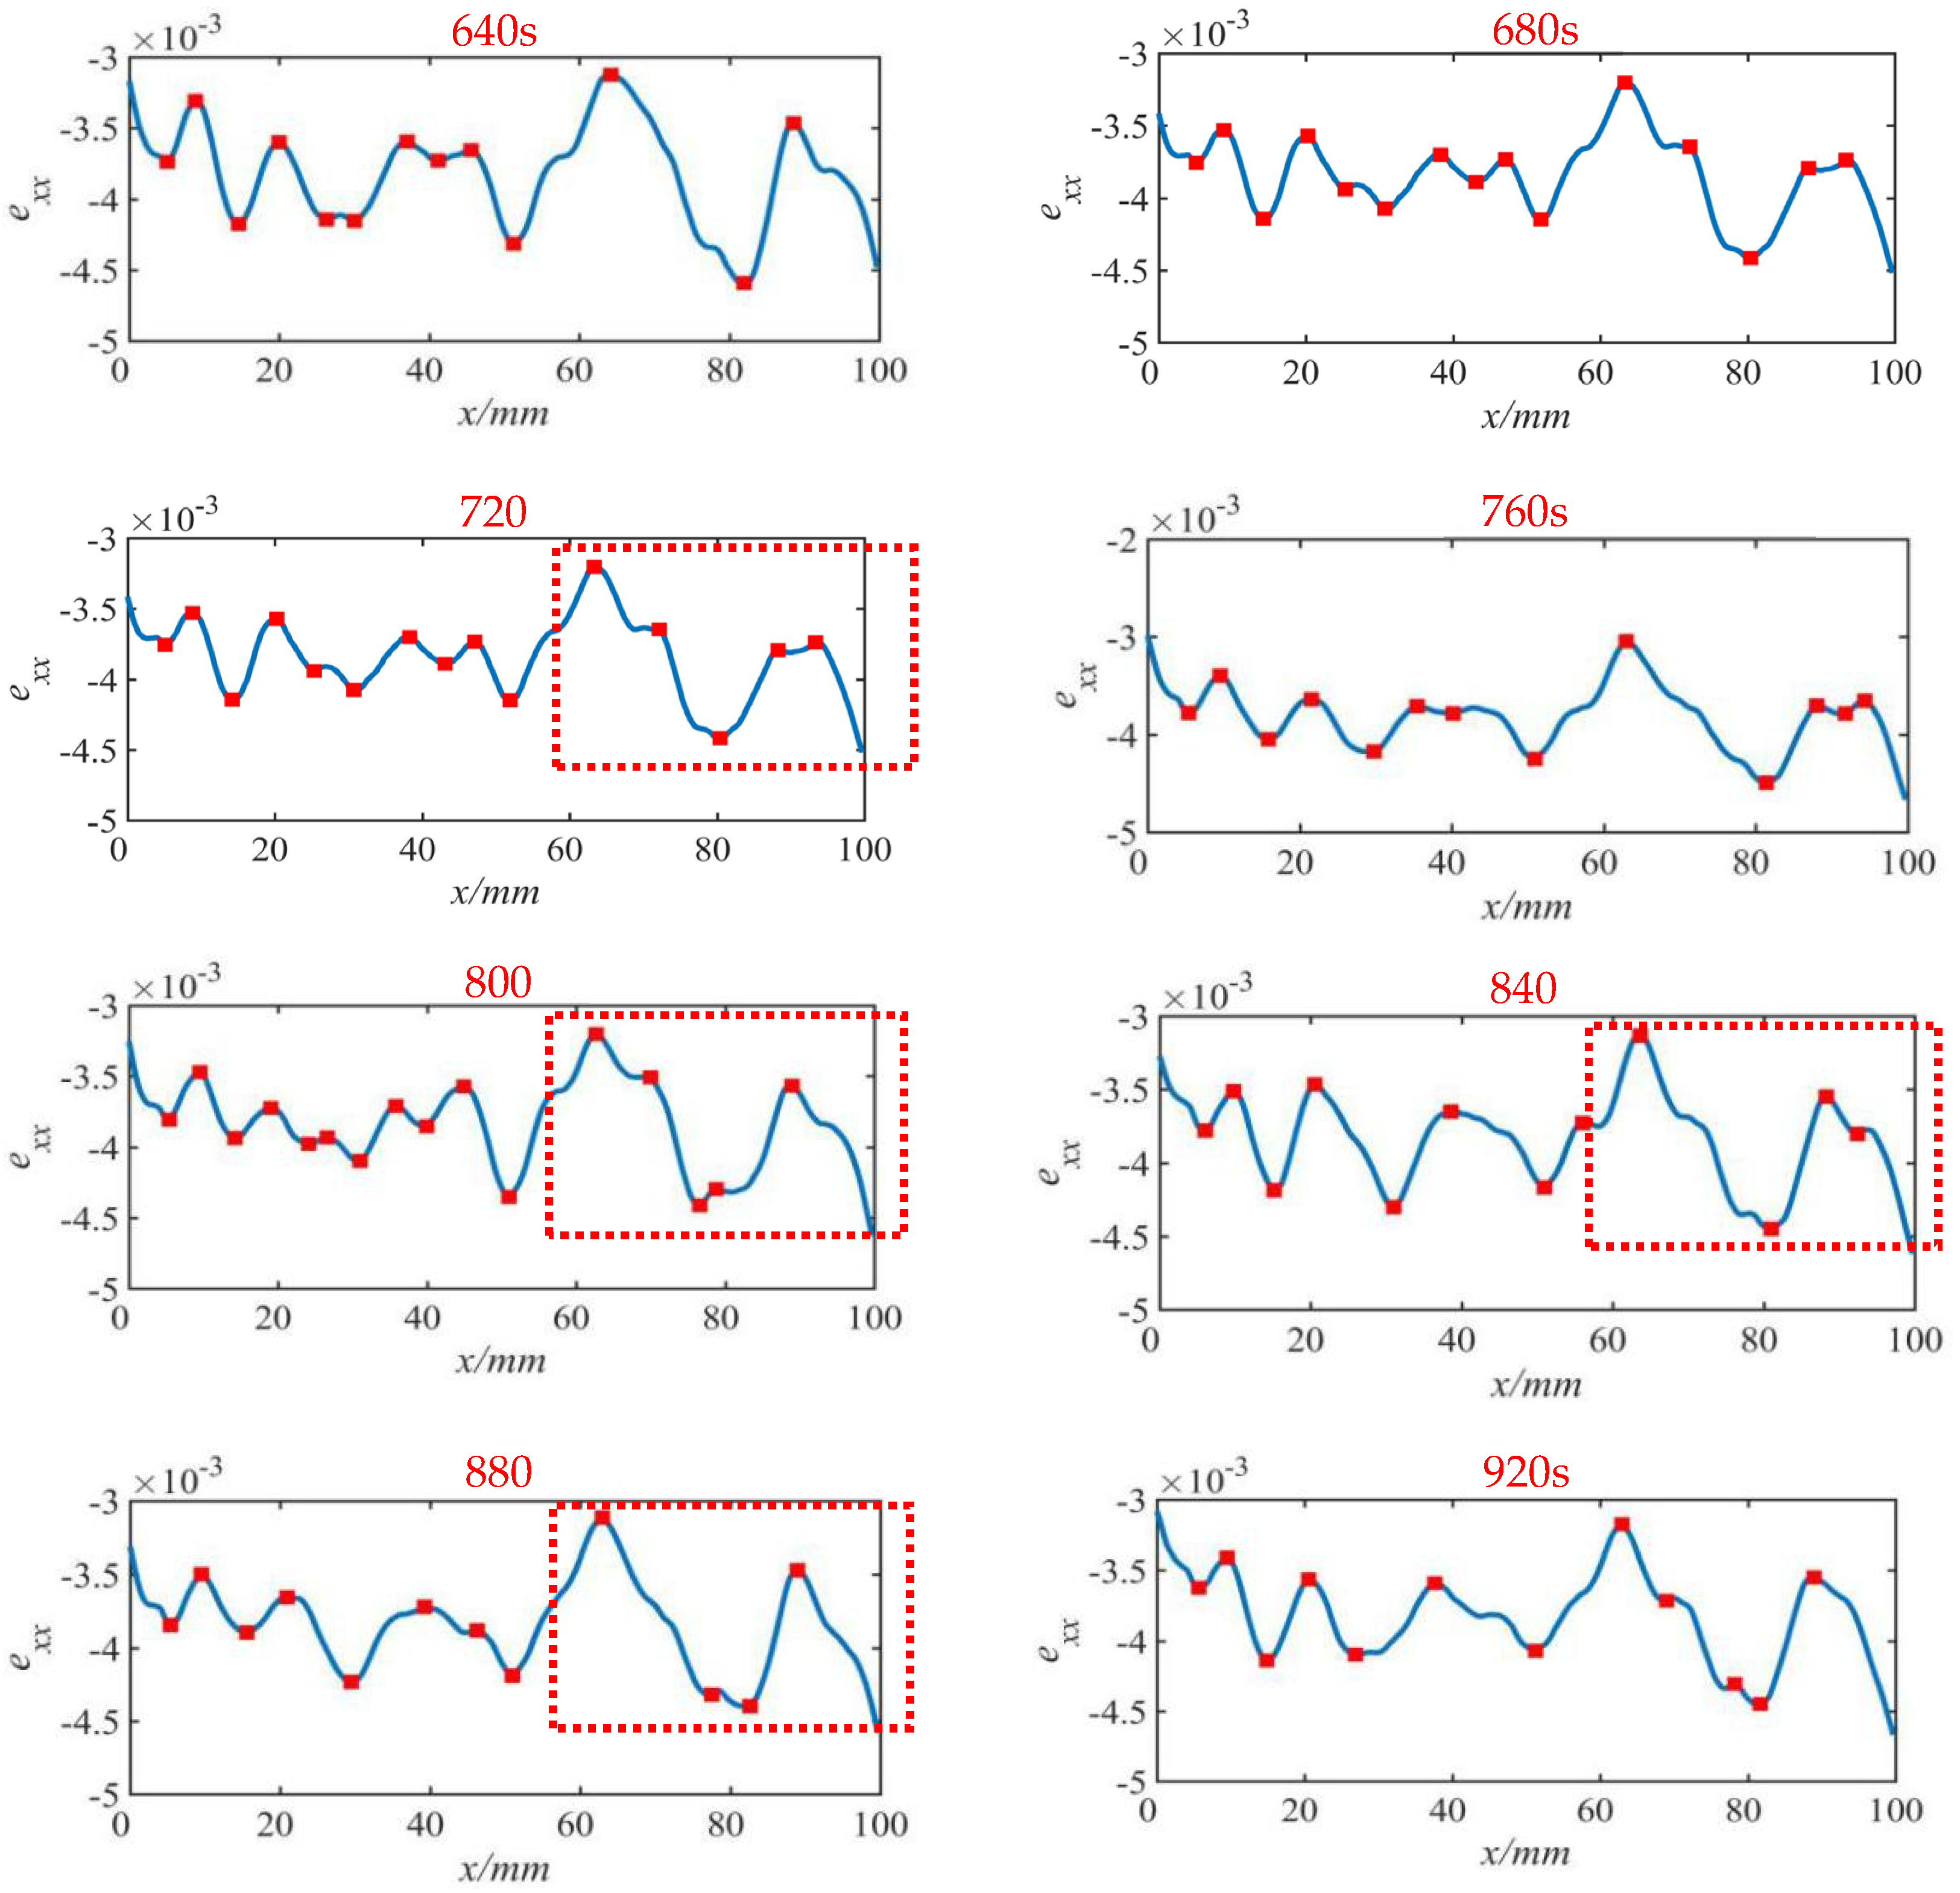
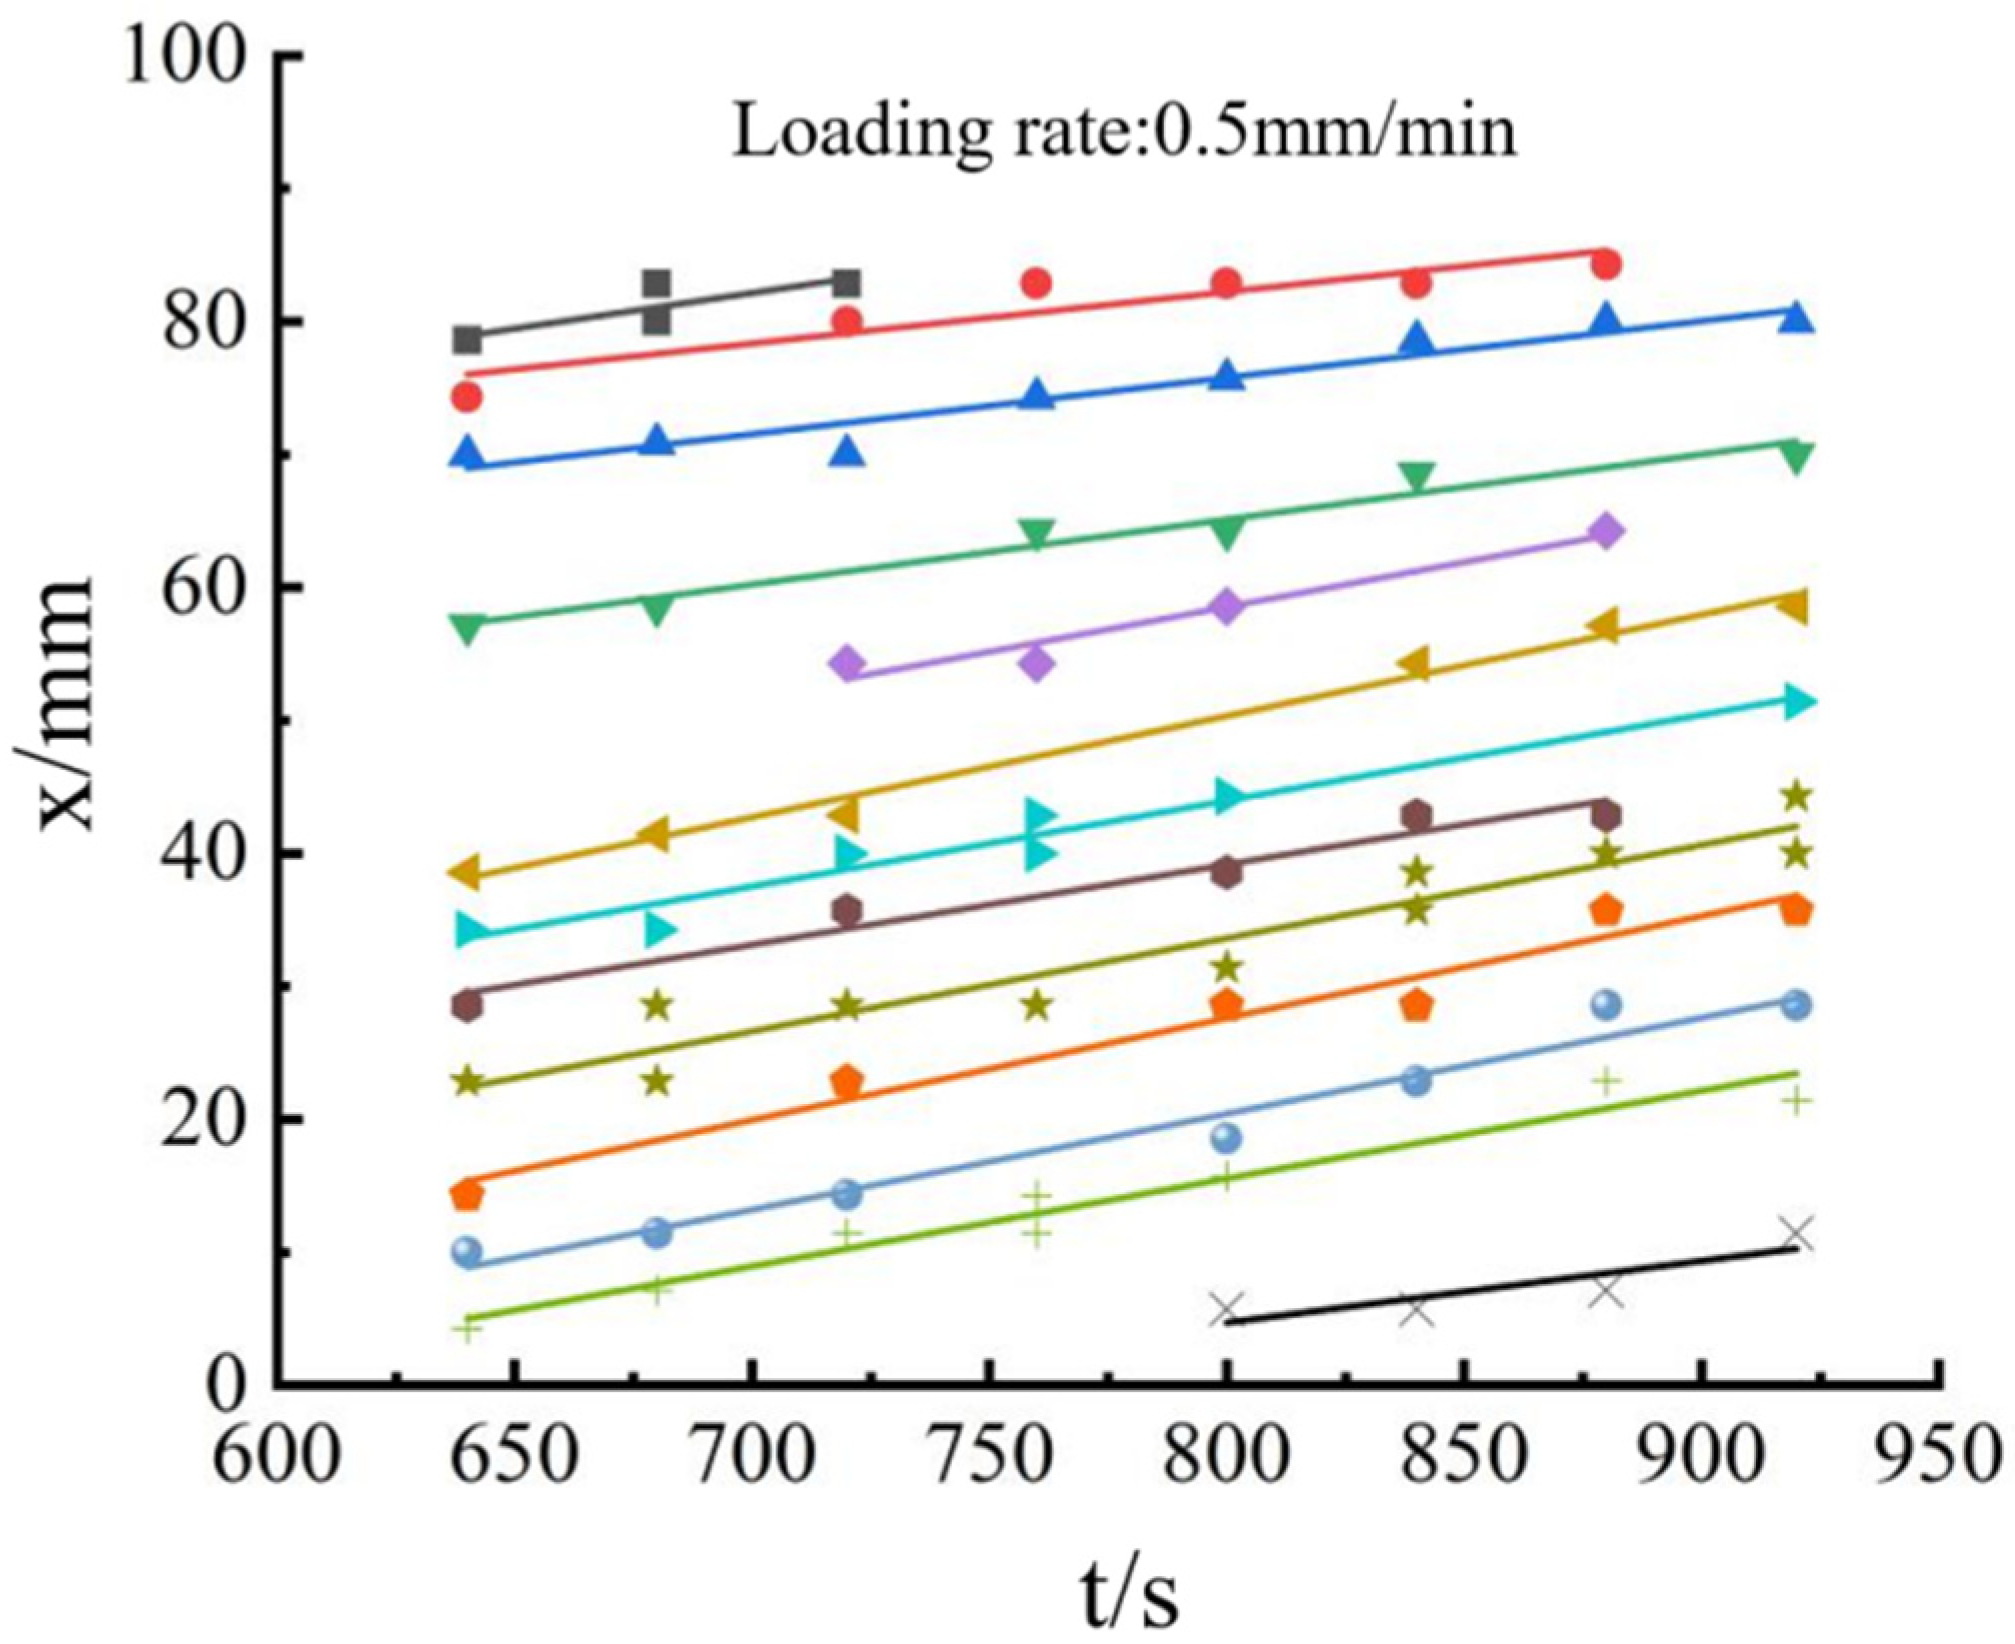
3.1. The Slow-Wave Propagation Pattern at the Compaction Stage

The rock samples’ DIC data were studied at the first (compaction) stage at three loading rates (0.1, 0.5, and 1 mm/min). The variations of the strain component ε x x   on the sample surface at the initial stage of loading were analyzed. Here, the 3D diagrams and vertical views of the rock samples under the loading rate of 0.1 mm/min at the two time moments are presented and described in detail. Only the vertical views of the experimental results under the two loading rates (0.5 and 1 mm/min) are presented due to limited space.
According to the relevant research by Bornert, we also do the error analysis [40]. From our quantitative error analysis (Figure 2), we can see that the error decreases gradually with the increase of subset size. Moreover, when the subset size of this test is 48, the strain error is less than the test measured value. In addition, we also select the boundary for quantitative error analysis. The strain error increases slightly, but it is also less than the test strain. In this way, we can show that these test characteristics are not caused by errors.
Figure 3 shows the strains at two time moments at the compaction stage under the loading rate of 0.1 mm/min (8 s, 16 s) and the 0 mm of the sample, to which the load was applied. The first column shows the 3D diagrams of the strain, from which the strain of the sample could be intuitively observed at a specific time moment for the sample under loading. The second column shows the vertical view of the diagram corresponding to the first column, from which the maximum strain and strain fluctuations along the length of the sample can be obtained. It can be seen from the 3D diagram in Figure 3a that the irregular strain fluctuations occurred throughout the entire stage. The fluctuations were more significant on the left side and gradually attenuated towards the right side. From the vertical view, it could also be observed that after applying load, strains with more significant fluctuations first appeared on the left side at the initial stage. By contrast, the fluctuations were milder on the right side, and the fluctuations were not synchronized on the left and right sides. At the distance 60–70 mm from the left side end, there was an isolated peak of compressive strain. Such a fluctuation pattern, which occurred in the form of a single moving peak, resembled a solitary wave or surge wave [41], i.e., a gravity wave, which is generally caused by the inertial force and gravity.
According to Figure 3a, the strain values over the entire sample surface fluctuated consistently in the 3D diagram. Except for the leftmost side, there was no significant difference in the strain values within this region. As shown by the vertical view, the strain values fluctuated in a wave-like pattern. However, after the peak at the distance 65 mm from the left side end, the fluctuations were less significant than those on the right side. Although the strain values increased, the fluctuations were obscure and less regular. The strain values were slightly higher at the two ends. In Figure 3b, several large strain peaks occurred and showed a dispersed distribution. Their spatial distribution was non-uniform and disordered. Compared with Figure 3a, there are several complete wave fluctuations between 65 mm–100 mm, and the fluctuations are clear and obvious. According to the vertical views in Figure 3a,b, as loading continued, the fluctuations became more pronounced, and the degree of waviness increased. The peak values gradually increased and occurred more frequently. Moreover, the waviness became increasingly apparent.
It is noteworthy that as the loading rate increased, the fluctuations on the left half side became more intensive. The peaks were also greater and denser. At the loading rate of 1 mm/min, the sample surface was subjected to a greater pressure than at other loading rates. As a result, the maximum strain occurred instantaneously in the left corner, its value being approximately five times the strain values at other places on the same surface (Figure 4).
Taken together, whatever the loading rate is, the strain component was greater at the end to which the load was applied but smaller at the other end. As the loading continued, the strain components at both ends became more consistent. During this process, the slow deformation wave propagated through the media, accompanied by energy accumulation and conversion. The slow deformation waves were generated by adjusting the imbalance between the driving force and the viscous force inherent inside the solids. This process involved the conversion between the elastic strain and kinetic energies.

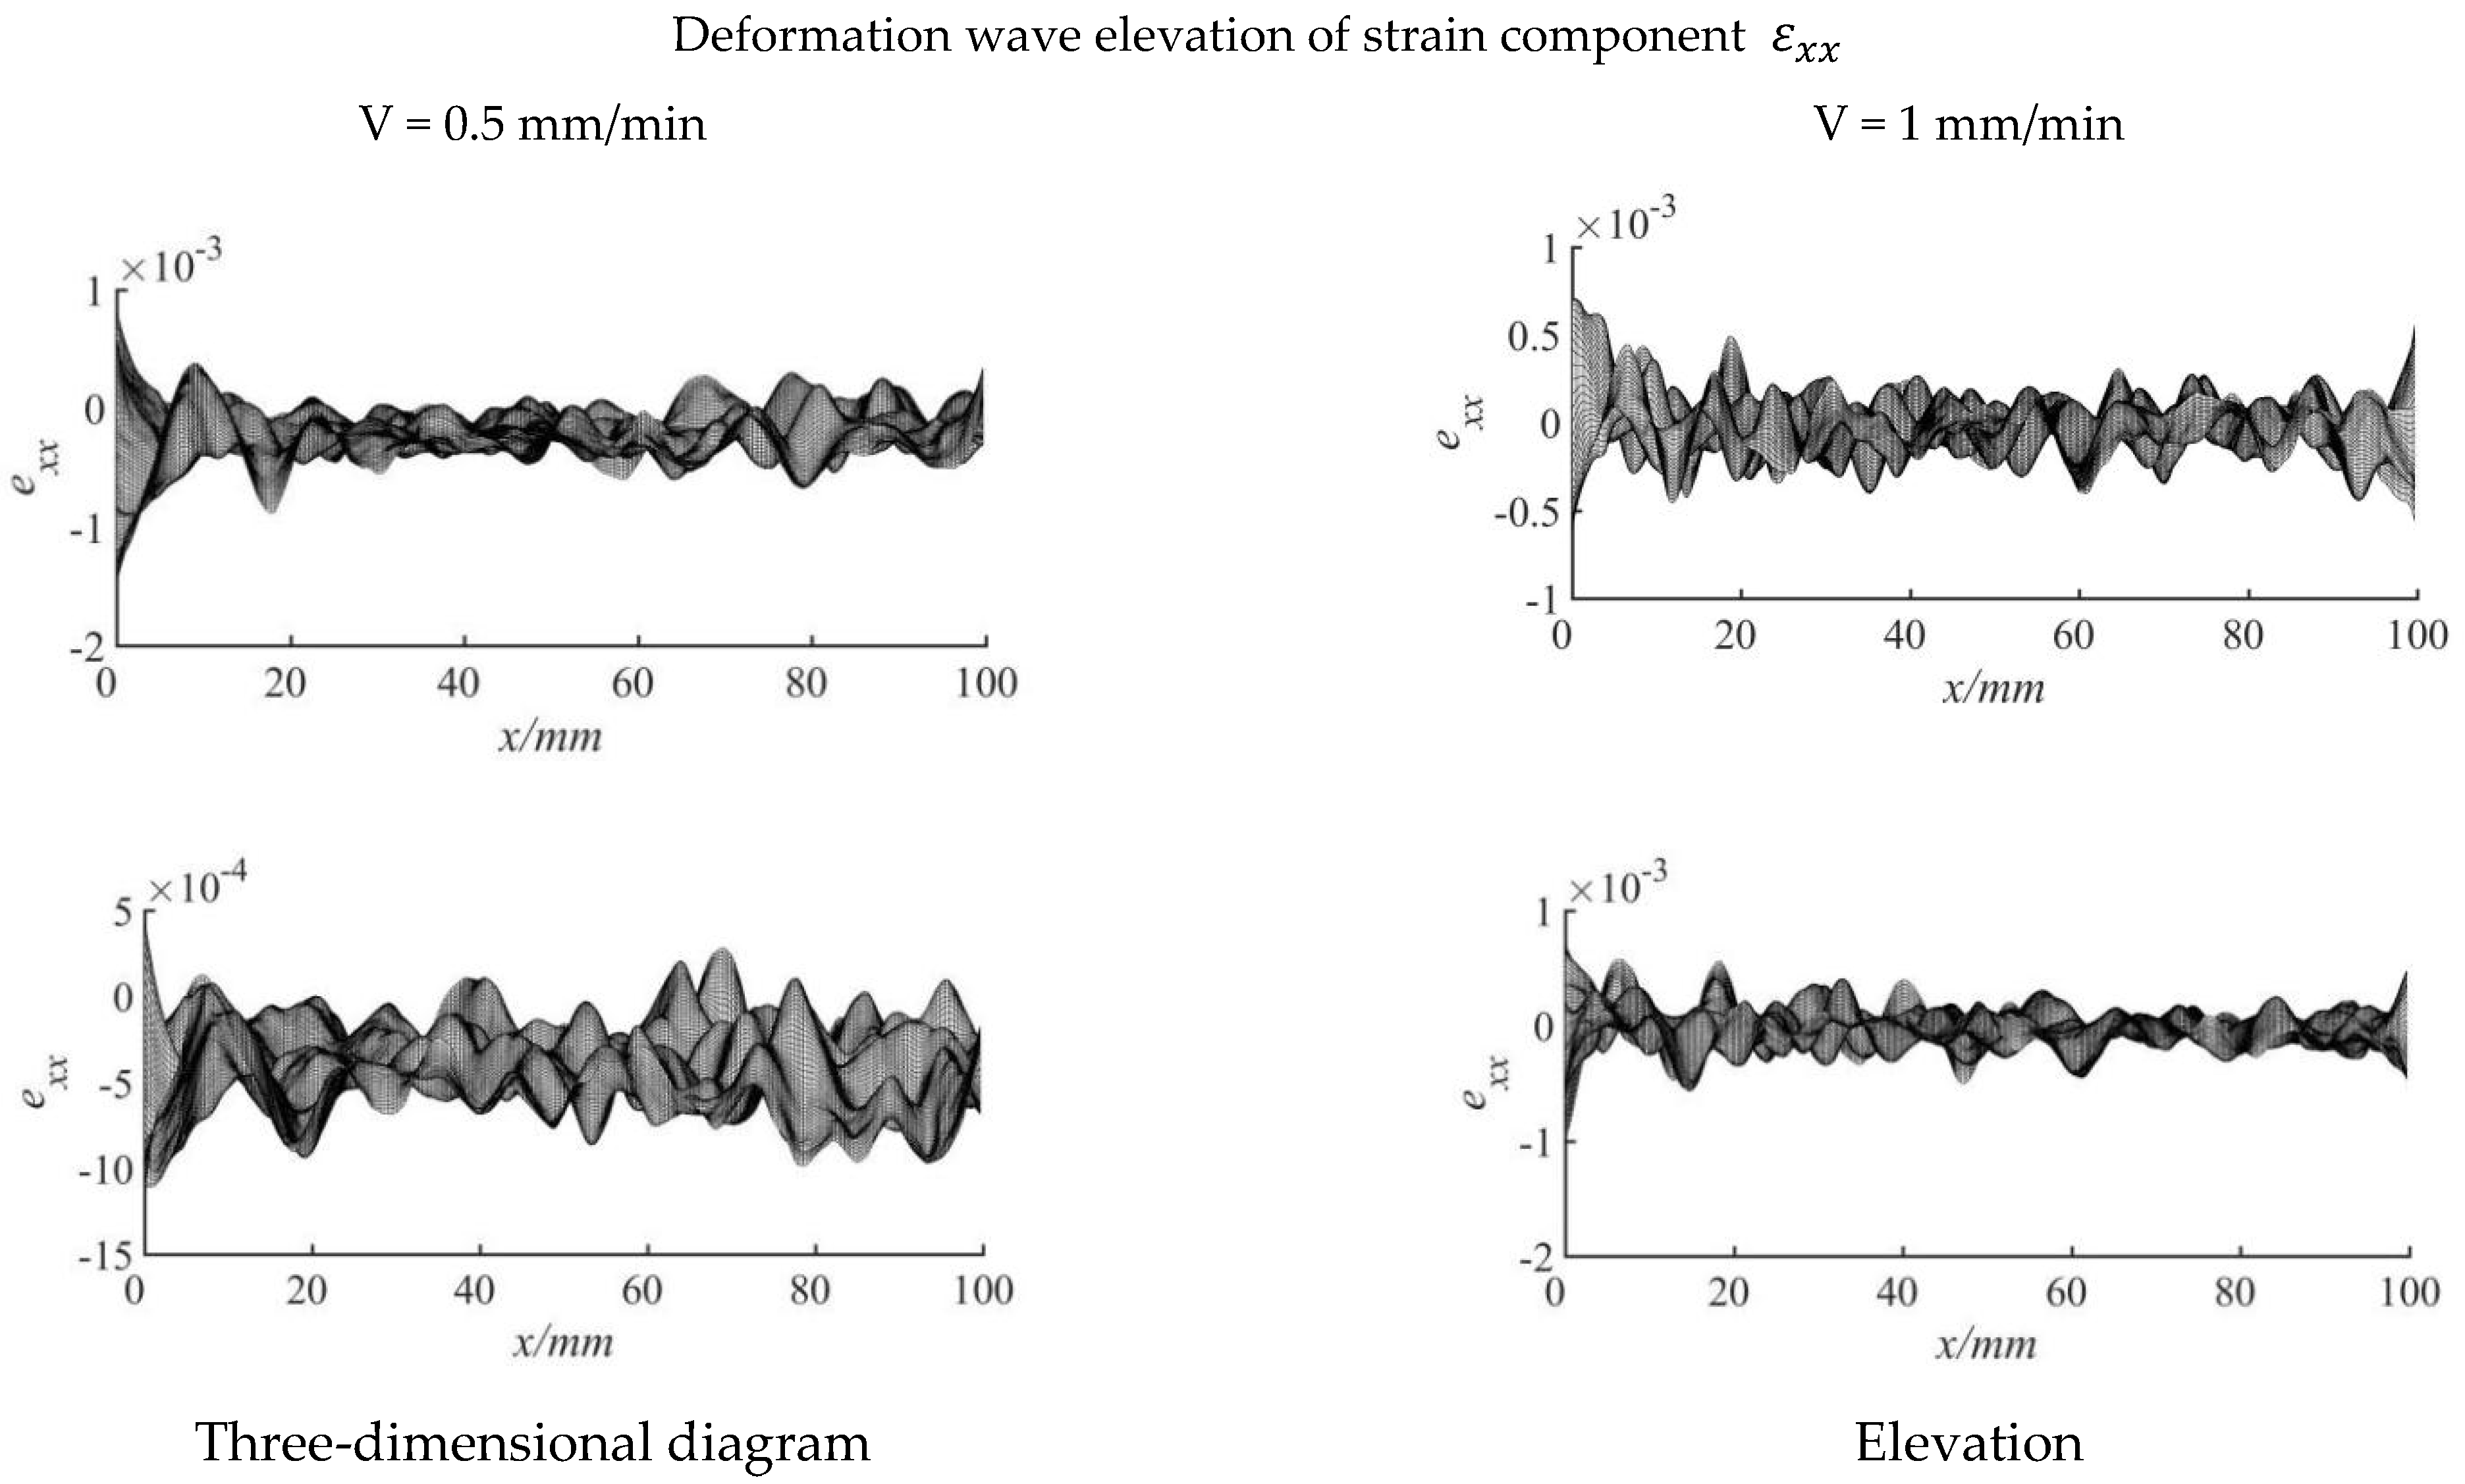
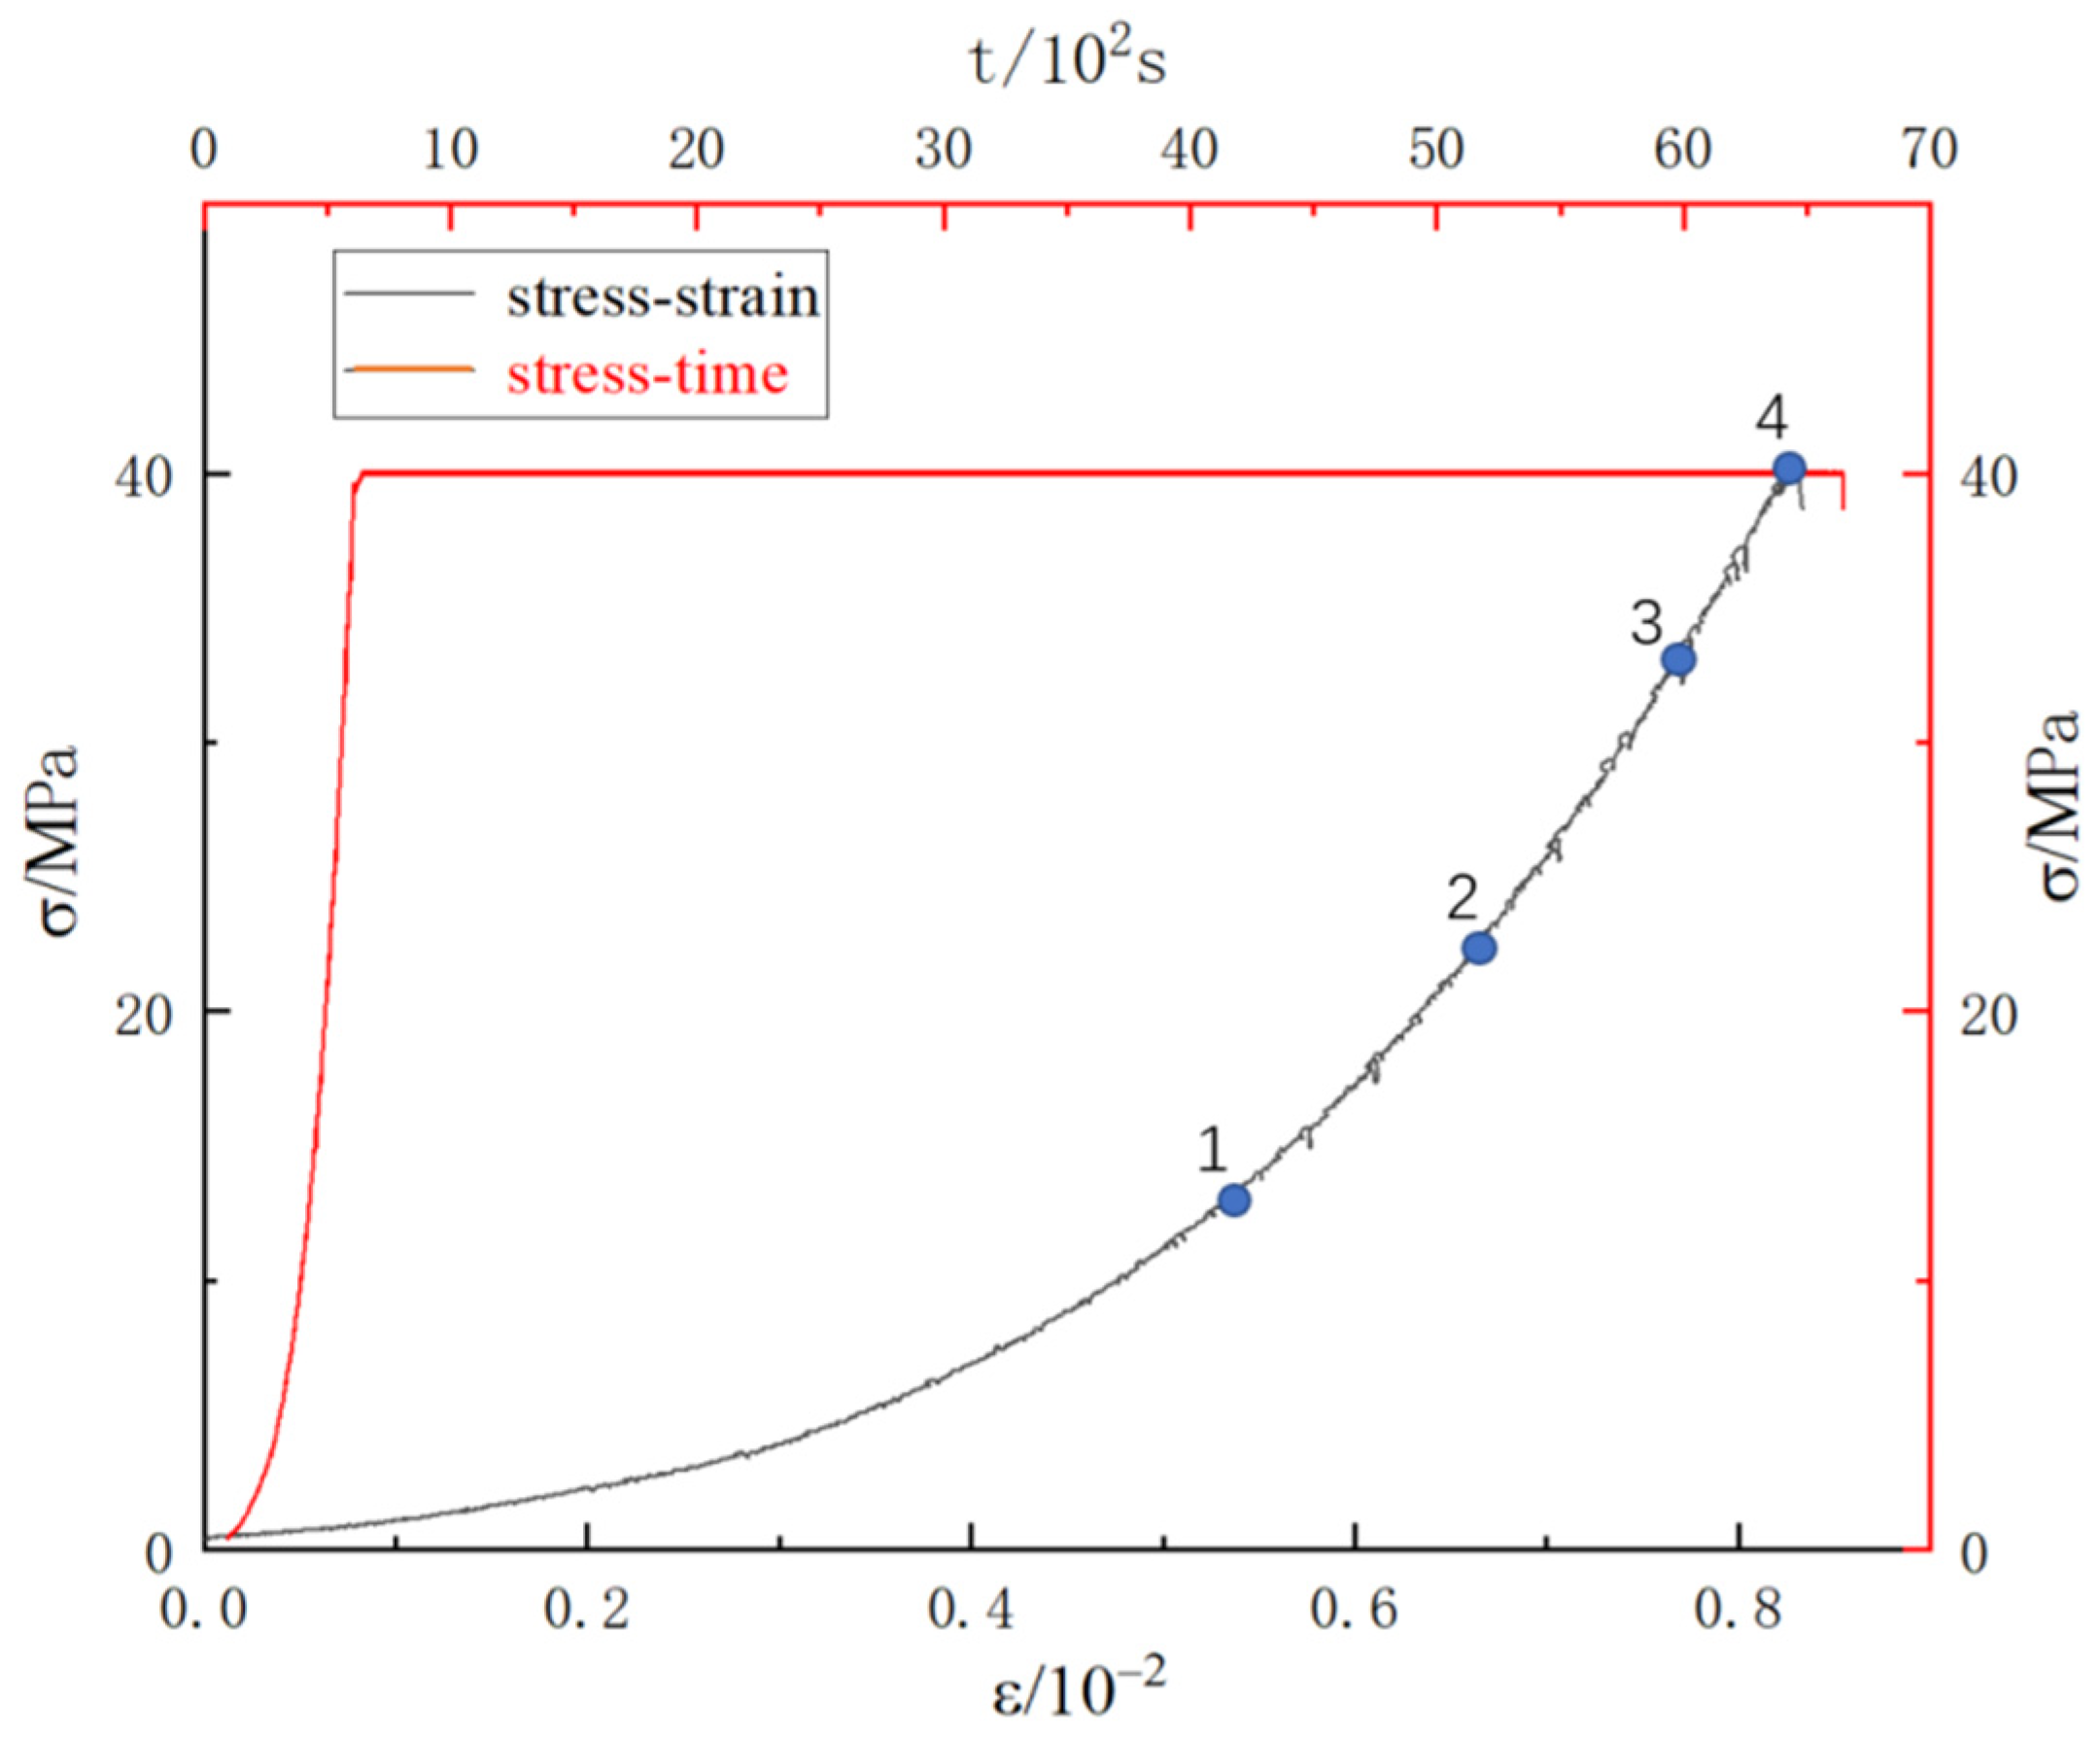
3.2. Wave Characteristics at the Same Strain under Different Loading Rates

The strain data were analyzed at the strain level of 0.006 under the three loading rates. Figure 5a–c present the 3D strain diagrams under the loading rates of 0.1, 0.5, and 1 mm/min, respectively. The vertical views are compared to the strain diagrams along the sample surface’s central line, as shown in Figure 5.
Comparison of the 3D strain diagrams under the three loading rates indicated spatial-temporal heterogeneity and disorderedness. The fluctuations were more significant on the 3D strain diagram under the loading rate of 0.1 mm/min (Figure 5a) than under the other two loading rates. A comparison of the vertical views showed that the deformation waves’ peaks were denser on the strain diagrams under the loading rates of 0.1 and 1 mm/min (Figure 5a,c). By contrast, there were much fewer peaks in Figure 5b, indicating more regular and consistent strain fluctuations on the sample surface. The strain diagrams along the central line of the sample surface were analyzed under the three loading rates. The fluctuation is obvious from the left boundary to 65 mm in Figure 5a. However, the fluctuations barely existed in the second half, indicating that the deformation wave had not yet propagated to the second half. By contrast, the fluctuation in Figure 5c is not so regular, and there is no obvious fluctuation period. As compared with the cases of the other two loading rates, the waves undulate gently. Thus, the deformation waves’ fluctuations were much more regular in the red sandstone samples under the loading rate of 0.5 mm/min. The propagation rate was the lowest at the loading rate of 0.1 mm/min. At 1 mm/min, the deformation wave propagates in the form of broken lines.

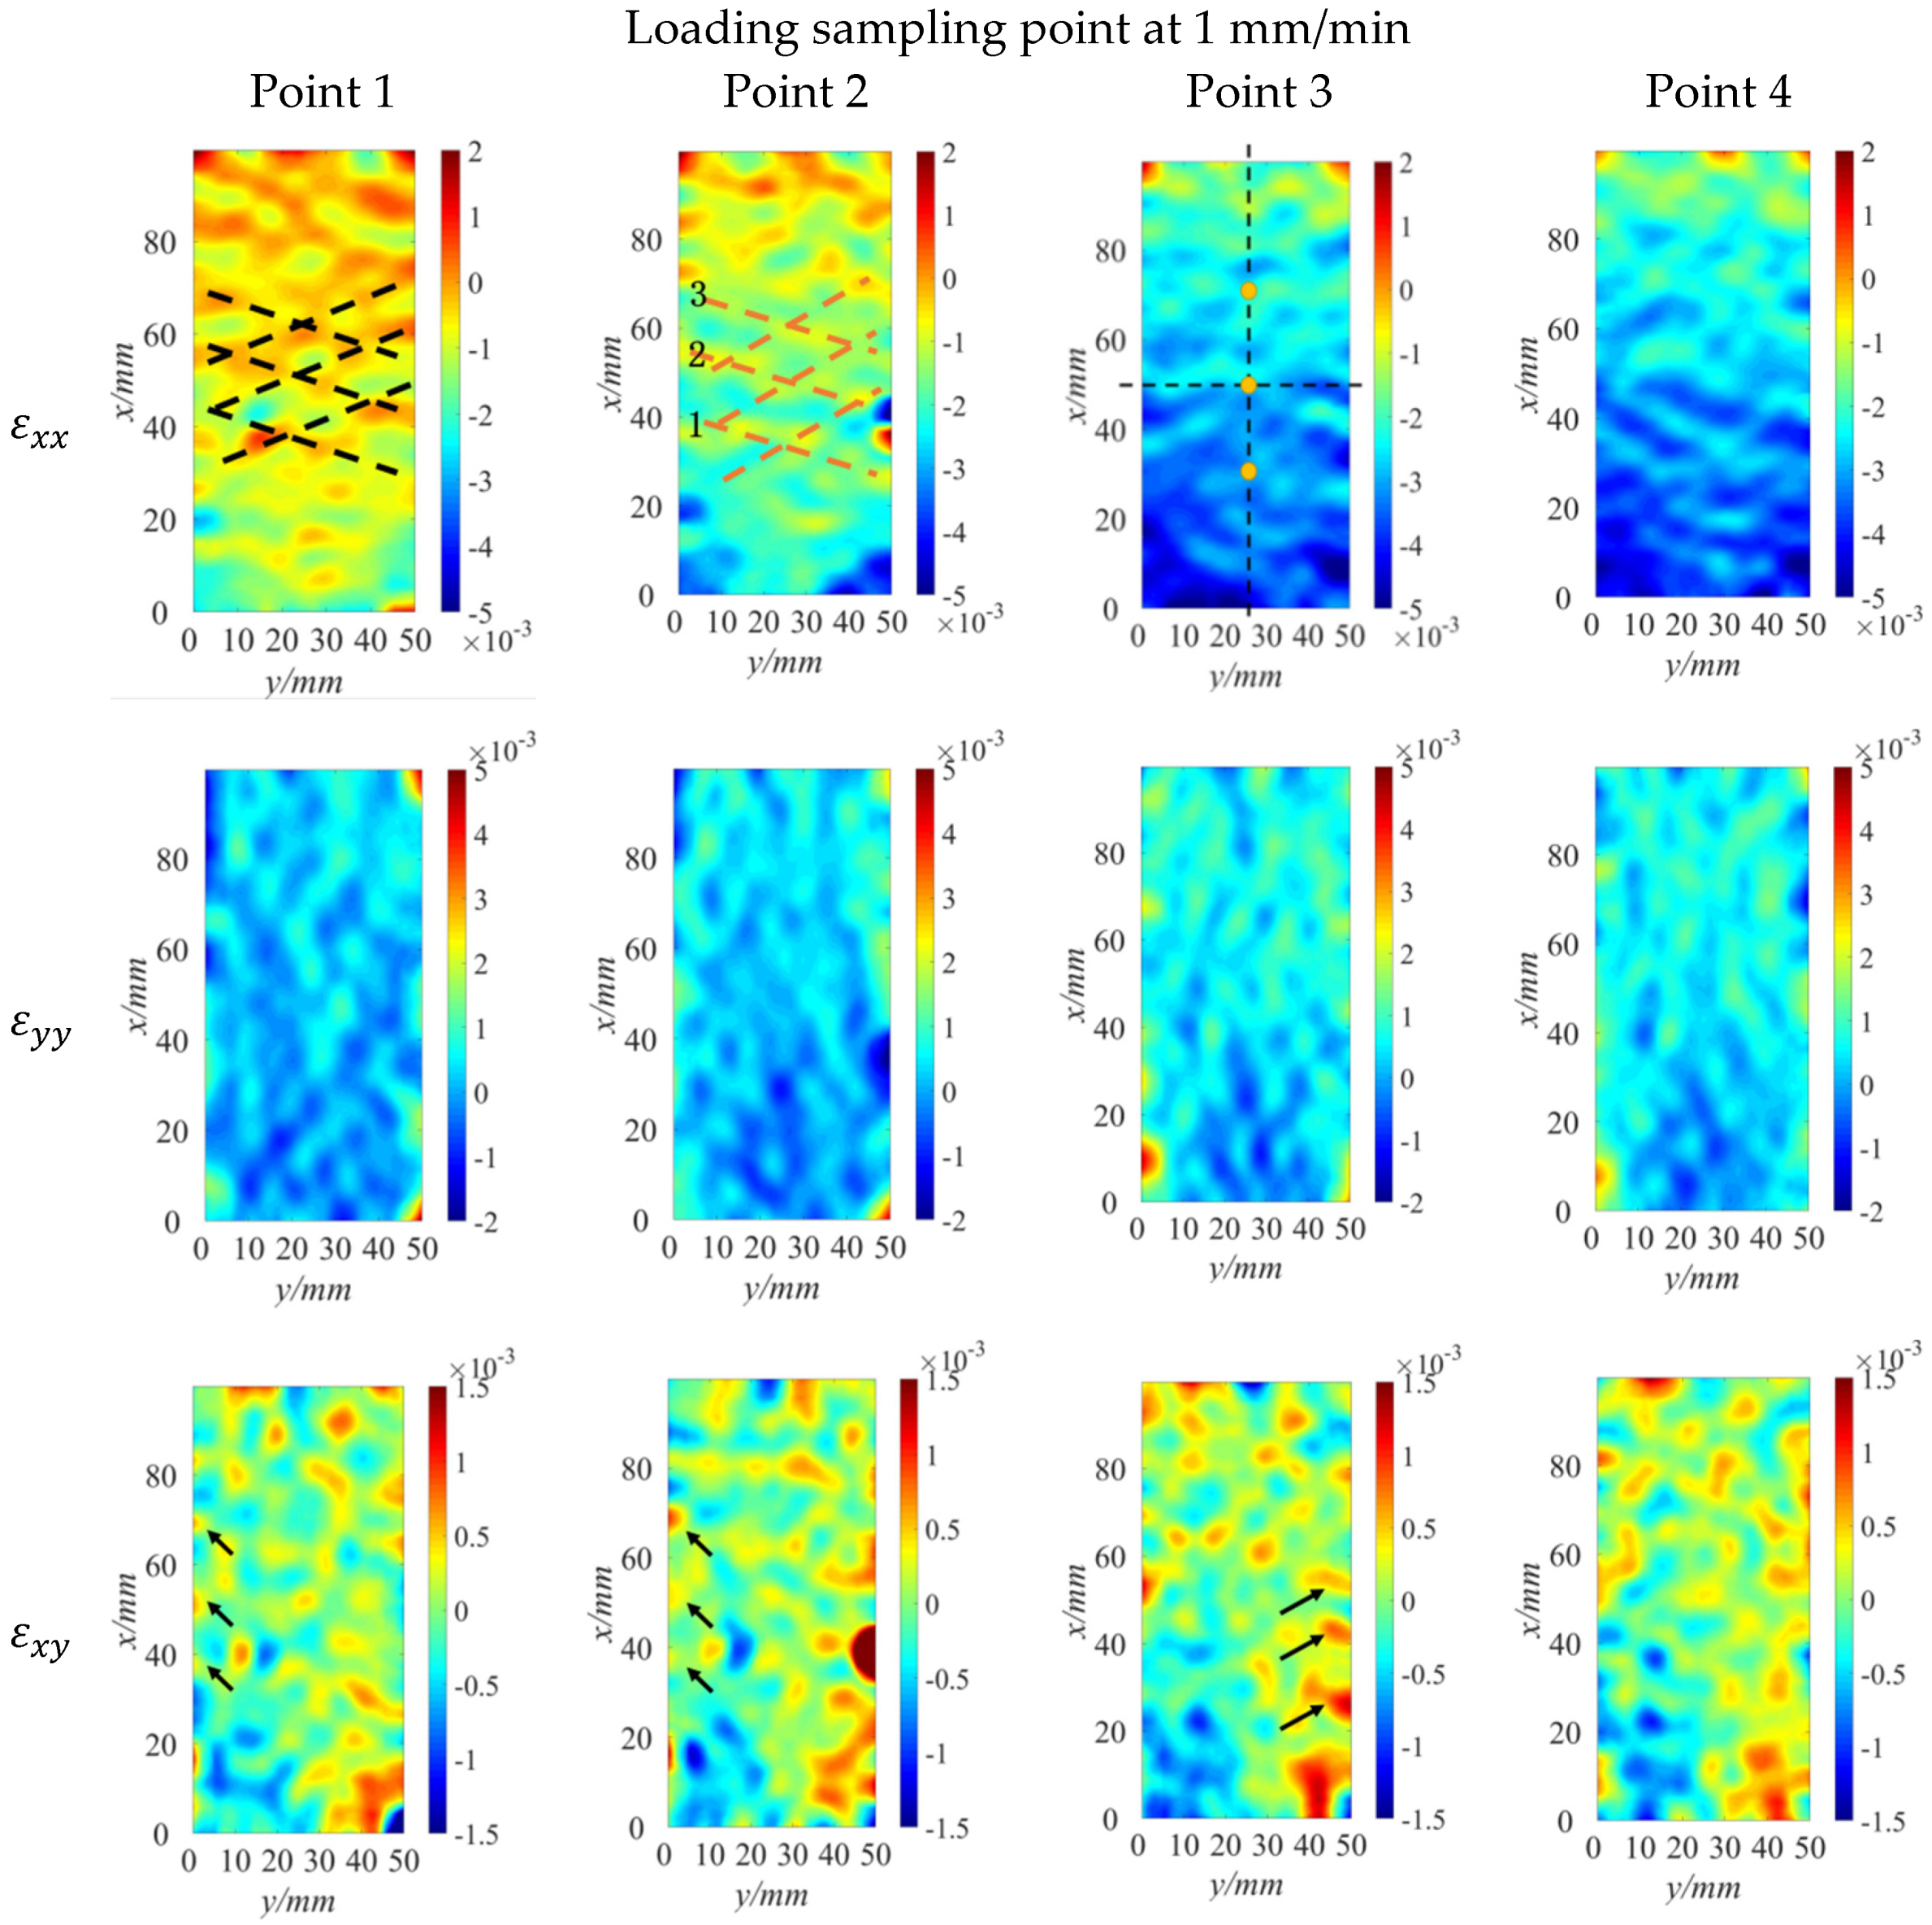
3.3. Strain Nephograms of the Deformation Waves

Four snapshots at the compaction and elastic stages were chosen during the loading process (see Figure 6). The strain nephograms of the three strain components, ε x x , ε y y and ε x y   , are presented at these four time moments, as shown in Figure 7. For data processing, negative strain values under compression were represented by blue and light blue in the nephograms, while positive strain values under tension were represented by red and yellow. As indicated by the strain component ε x x , the micro-grains on the sample surface prior to loading were in a disordered and dispersed state. During the compression process, there was a region of tensile deformation between the regions of compressive deformation. As the loading continued, these micro-grains near flow channels moved closer to the flow channels (at an angle of about 60° relative to the x-axis, i.e., the sample axial direction. Points 1 and 2, represented by dotted lines in Figure 7) and gradually became connected along the flow channels. These flow channels cross symmetrically with each other and are distributed in a grid pattern.
Throughout the loading process, the values of the strain components ε y y and ε x y were very small. Among them, the distribution of the ε y y cloud image shows obvious vertical distribution characteristics, and gradually shifts to the middle with the loading time. The areas on both sides of the ε x y strain cloud map show periodic strong tensile deformation zones from the beginning. For example, in the nephograms (Figure 7), corresponding to points 2 and 3 in Figure 6, the strong tensile deformation, as indicated by the strain component ε x y , periodically appeared at 20–60 mm, with a magnitude of about 0.1% (as indicated by the arrowhead at the point 3 in Figure 7). These regions of strong tensile deformation corresponded to the flow channels observed in the nephogram of ε x x . This phenomenon was observed throughout the compaction and elastic stages of loading.
As observed in the nephogram of ε x x , the nucleation of Luders bands (LB), i.e., shear bands formed in regions of stress concentration, occurred during the loading process (point 2 in Figure 7). At first, the nuclei had small oval cross-sections and appeared in pairs. One of them was a region of compressive strain with the maximum strain value being −0.5%; the other was a region of tensile strain with the maximum strain value being 0.2%. The grain deformation and LB nucleations were more conspicuous in the nephogram of ε x y and observed roughly at the same positions as those in the hephogram of ε x x . The maximum strain value was 0.15%. The observed nucleation pattern can be explained as follows. The displacements originated from the sample surface, whose deformation exceeded the bulk one, i.e., the average deformation of the sample. During the sample’s loading-induced deformation, the displacement was rapidly released, thereby resulting in the LB nucleation.
After grain deformation and LB nucleation, the Luders bands were gradually formed. In the beginning, the Luders bands were obscure. As the loading continued, the Luders bands became clearer and began to show more conspicuous banding features. This trend started from both sides of the sample simultaneously, with slow interconnection and penetration in the transverse direction. This phenomenon indicated that the Luders bands were already formed (points 3 and 4 in the nephogram of ε x x in Figure 7) before the plastic deformation stage. The Luders bands were mainly concentrated on the half part of the sample near the end where the load was applied; however, the strain was smaller on the other half part. This situation was not observed on the nephograms of ε y y and ε x y .
On the nephogram of the ε x y component near the left side of the sample, the strain concentrations were periodically distributed at an interval of about 10 mm (as indicated by the arrowheads at points 1 and 2 in Figure 7). The deformation (probably, a plastic one) at these central points was about 0.5%. Between these points, there were points with the opposite sign of the εxy component, which were treated as nodes of elastic standing waves in the samples under loading (points of maximum and minimum values). The points marking the flow channels and the nodes of elastic standing waves that appeared at the compaction and linear elastic stages remained active throughout the entire loading process. This indicated the conversion between the plastic and elastic deformation standing waves.
As to the component ε x x , the flow channels were parallel to the Luders bands. However, the Luders bands and the initial stress concentrators (i.e., nucleation sites) were located outside the flow channels. From this, we inferred that they were of different origins.
Three points were chosen along the sample’s axis, namely, at 30, 50, and 70 mm (positions of these points are shown in the nephogram of ε x x at point 3 in Figure 7). The temporal variations of the axial strain components at these three points during the loading process were tracked and represented, as shown in Figure 8. The curves in Figure 8 depict fluctuations of the vertical strain component during the loading process. Generally speaking, the deformation is greater near the end when the load was applied and smaller farther away from this end. At 30 mm, 0.3% < ε x x < 0.35%; at 50 mm, 0.35% < ε x x < 0.4%; at 70 mm, 0.4% < ε x x < 0.48%. These three points were close to the three flow channels generated during the loading process (Figure 7).
Thus, the maximum deformation amplitudes of the three flow channels can be ranked as follows: ε x x m a x (FC1) >   ε x x m a x (FC2) >   ε x x m a x (FC3). They are determined by their duration. The longer the time it appears, the greater its deformation. As the width of the Luders bands increased, these three flow channels successively entered an active deformation regime. Therefore, it was presumed that the Luders bands’ formation was related to the flow channels’ maximum strain value. As the deformation was intensified, the Luders bands interacted with the flow channels nearby to generate the maximum strain values.

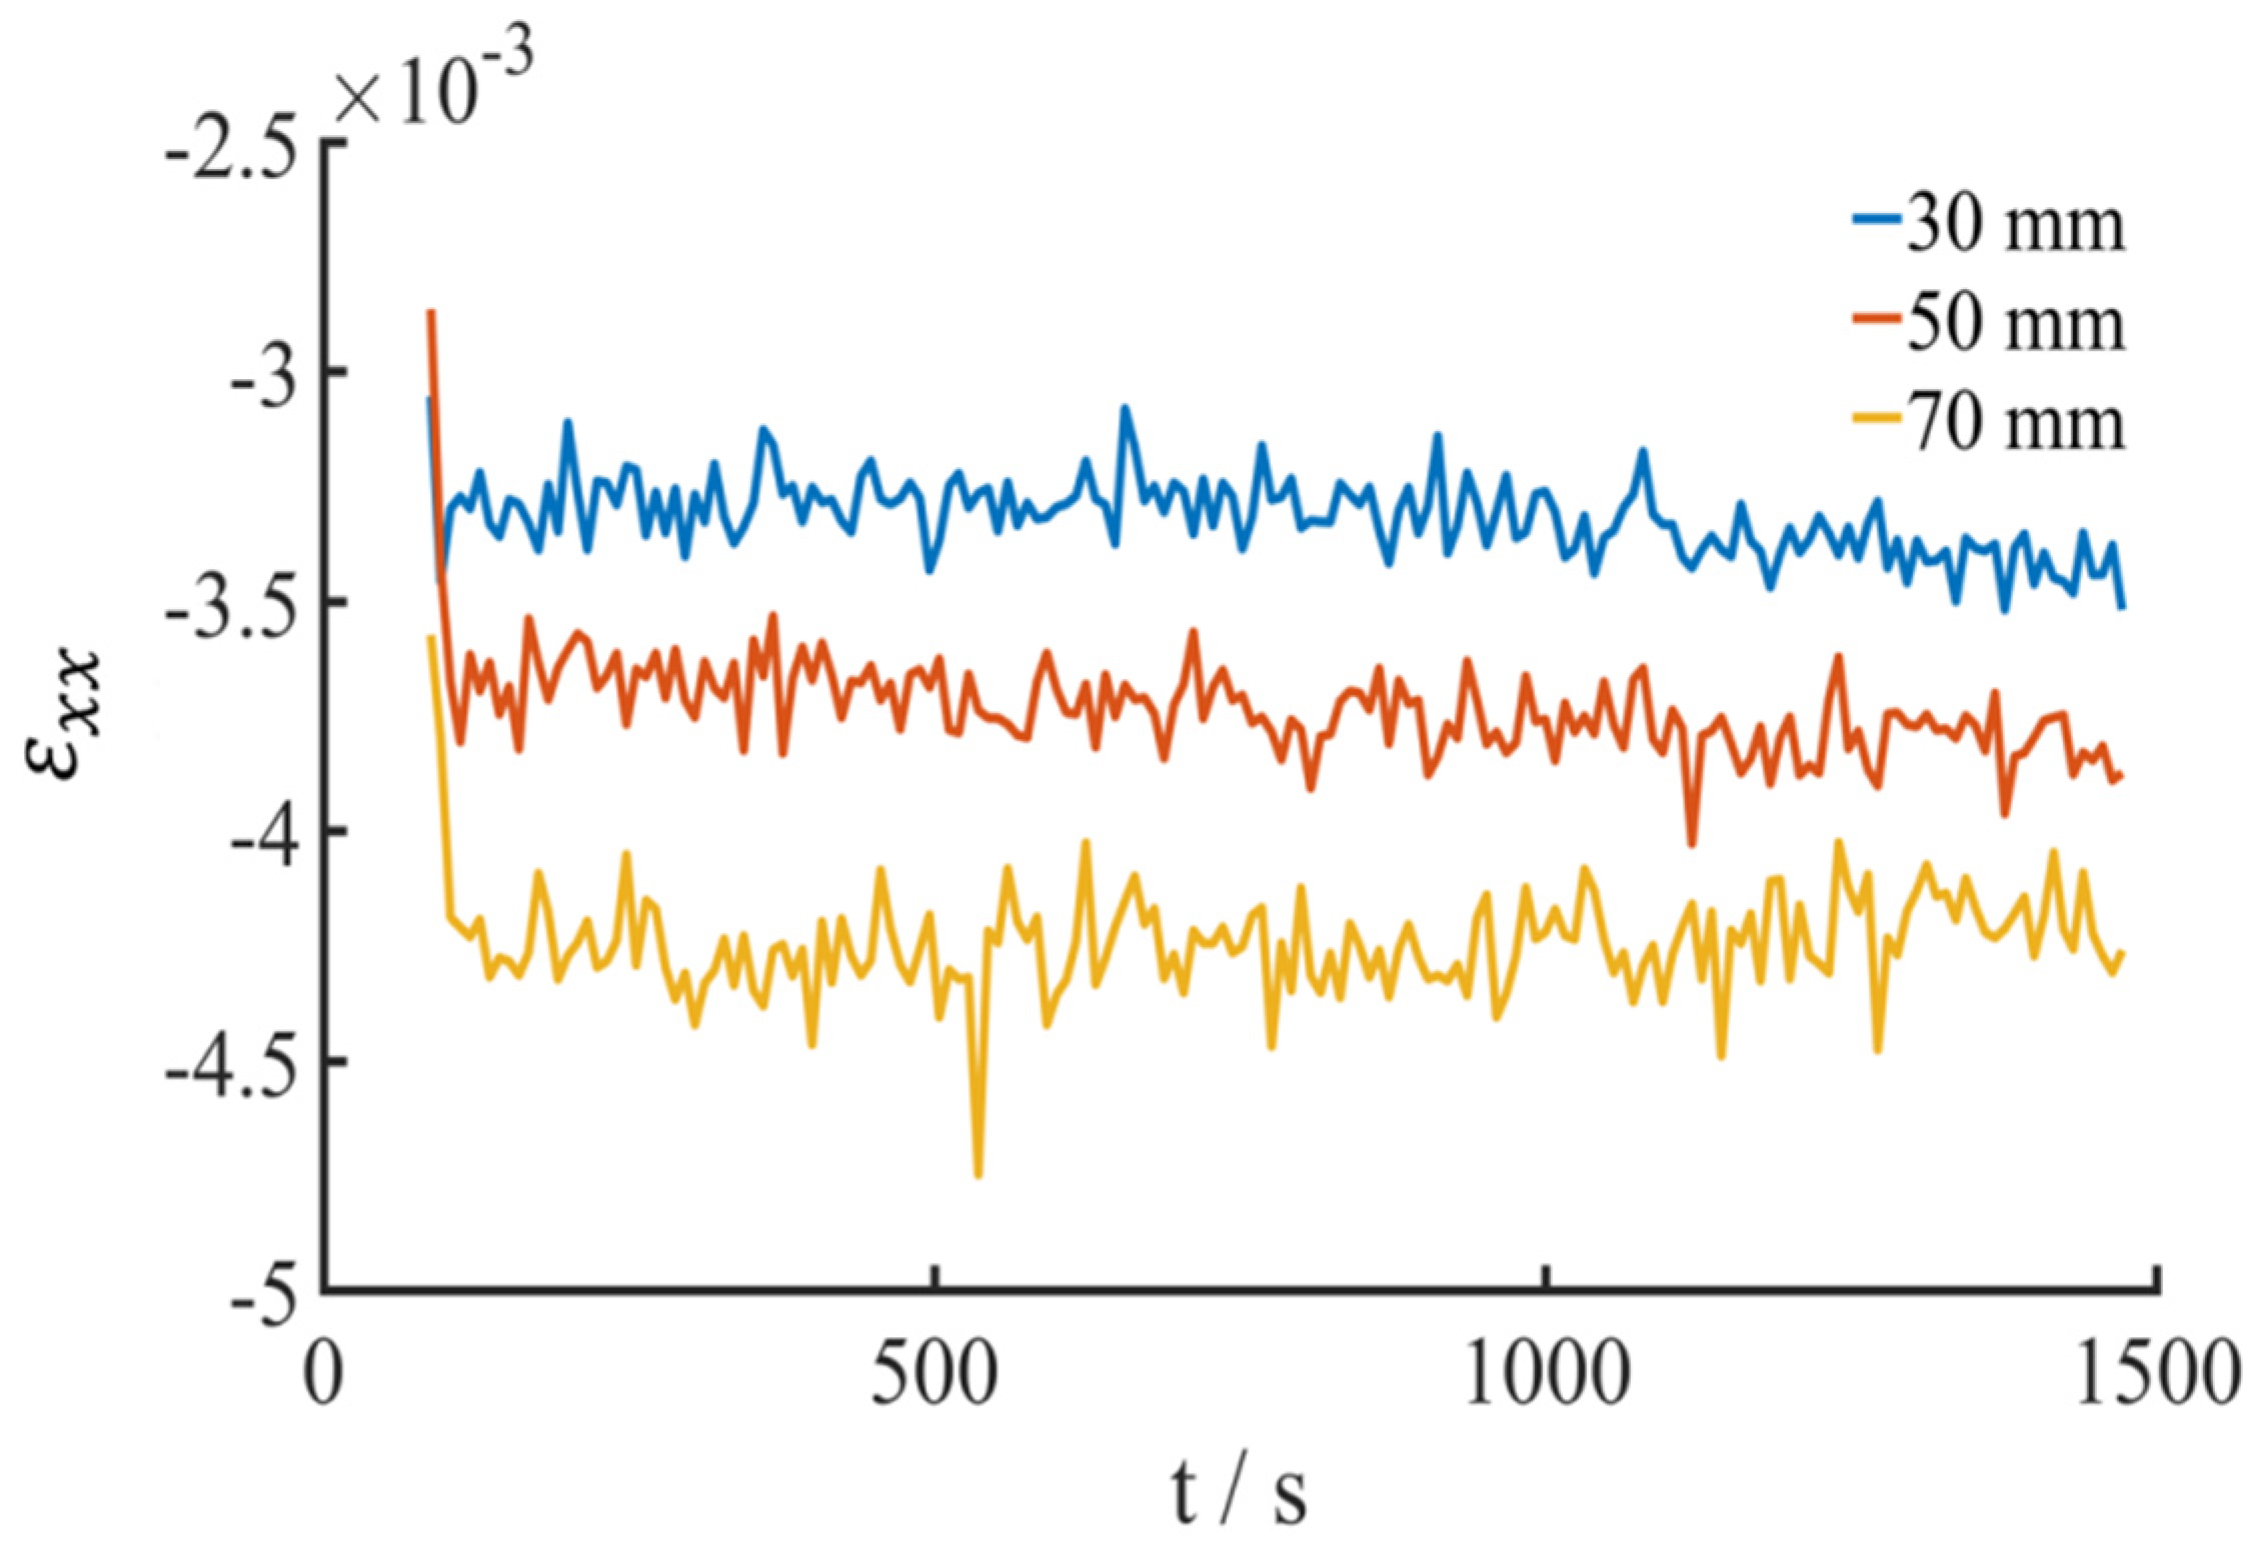
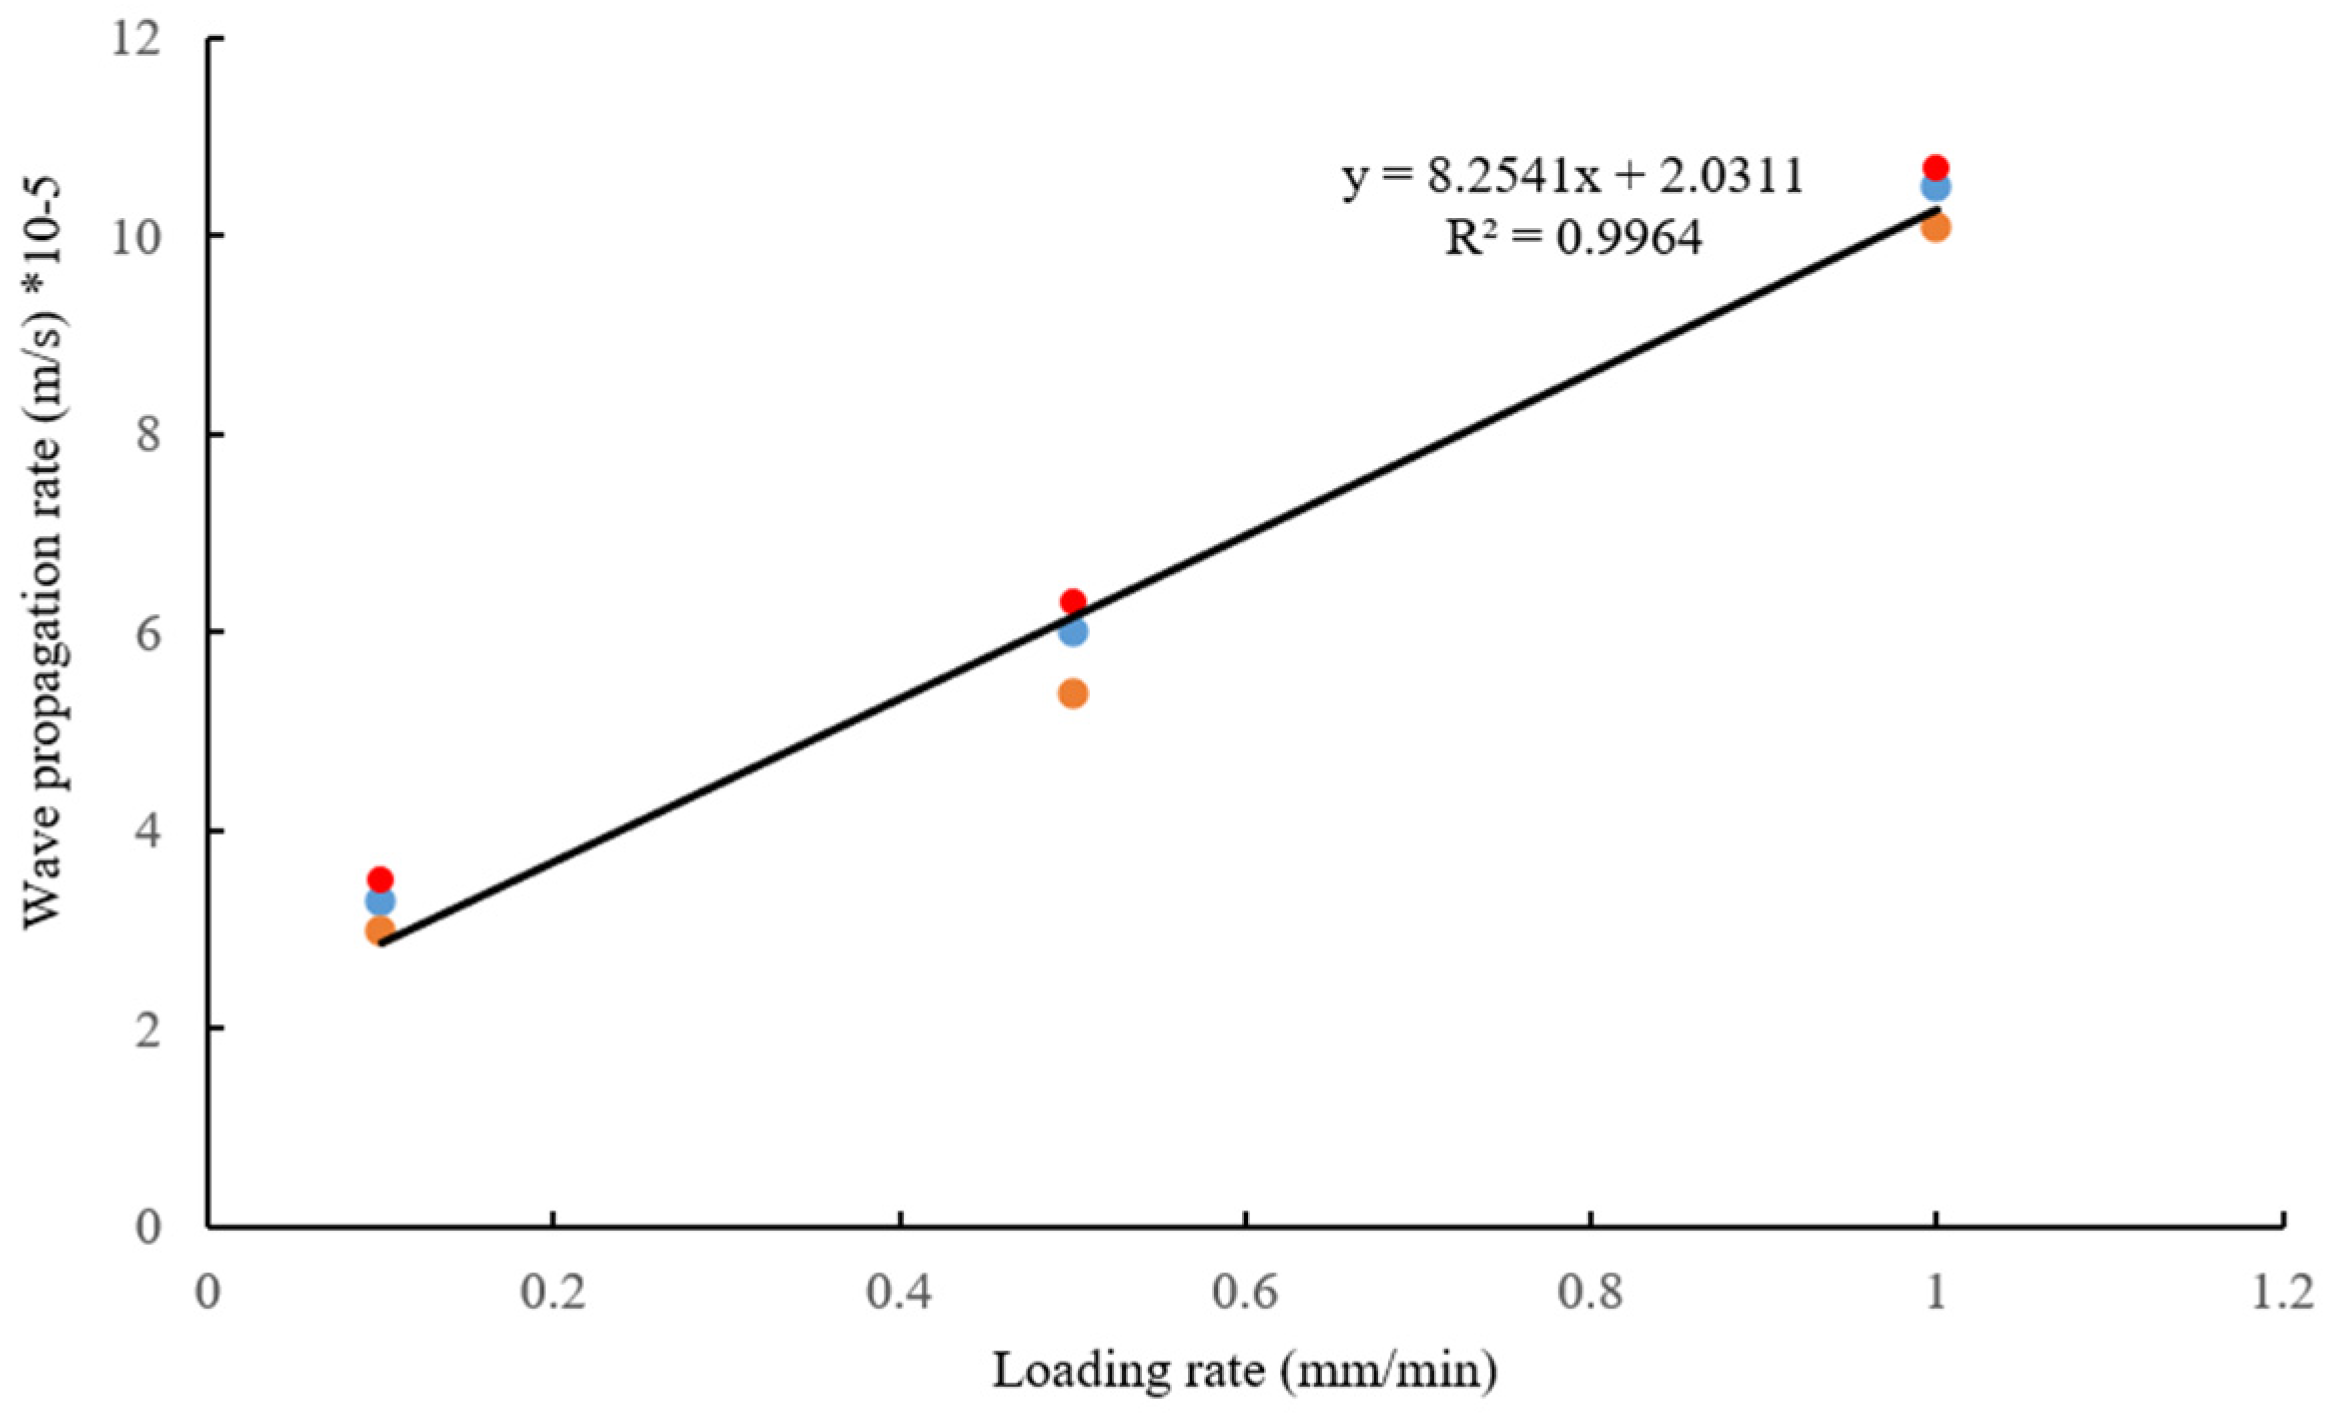
3.4. Propagation Velocity Analysis of the Deformation Waves at the Elastic Stage

Deformation waves are generated during the loading process of the red sandstone samples. Some researchers have studied the propagation of deformation waves and estimated their propagation velocity range. However, the relationships between the propagation velocities of the deformation waves and the loading rates have not been fully clarified. In our study, such relationships were determined based on the experimental data.
Deformation waves have one unique feature: they propagate along the sample’s axis. The loading diagram is shown in Figure 9. Since the samples were loaded at a steady loading rate, an approximate dependence ε ~ t was assumed. The deformation waves’ strain peaks (i.e., peaks and troughs of the deformation waves) were plotted on the X-axis. The slope of the straight line representing the relationship of X vs. t was calculated. On this basis, the motion velocities of the points with the maximum and minimum values of strain, that is, the propagation velocities of the deformation waves were estimated.
Taking the case with a loading rate of 0.5 mm/min as an example. After the microscopic characterization of the specimen, the deformation diagram of the strain component ε x x on the centerline at 8 time moments was selected in the elastic stage (Figure 10). According to the treatment method of local strain maximization, the points of local strain maximum are chosen for comparative analysis. The results are shown in Figure 11.
After data processing, the deformation wave’s propagation velocities were estimated as 5.4 × 10⁻⁵, 6.0 × 10⁻⁵, and 6.3 × 10⁻⁵ m/s in the three groups of experiments under the loading rate of 0.5 mm/min. After averaging, the strain peak’s propagation velocity (of deformation waves) was 5.9 × 10⁻⁵ m/s in the samples. It exceeded the axial boundary advance propagation velocity of 0.8 × 10⁻⁶ m/s (equivalent to the loading rate of 0.5 mm/min) by one order of magnitude. Therefore, the propagation velocities of the deformation waves were significantly higher than those of the matter particles.
The propagation velocity of the slow deformation waves was calculated under the loading rate of 0.5 mm/min. Under this loading rate, stable regions of localized deformation were formed due to the slow deformation waves. These regions did not move over time. It can be observed from the dashed box in Figure 10 that at 60–100 mm on the sample surface, the peaks and troughs’ positions were relatively fixed, and the peak and the basic shape of the wave only change slightly. However, the waveform and the peaks’ positions changed significantly for the regions formed at an earlier stage, indicating the normal propagation and fluctuations. This situation persisted until the last diagram. The above region was stable and no longer experienced dramatic plastic deformation over time. The propagation of the slow deformation wave occurs at the initial stage of loading, that is, the elastic stage and the compaction stage. At the initial stage, the damage of the sample develops uniformly, and the slow deformation wave propagation is produced. As the loading process goes on, the plastic localization occurs gradually, and the propagation of the slow deformation wave no longer appears. At this stage, the plastic deformation is concentrated to the adjacent weak points, thus showing the plastic localization, and then these weak points are gradually connected, resulting in the fracture of a plane.
Using the same method, the propagation velocities of the deformation waves in the three groups of samples under the loading rate of 0.1 mm/min were estimated as 3.0 × 10⁻⁵, 3.3 × 10⁻⁵, and 3.5 × 10⁻⁵ m/s, respectively. The average wave propagation velocity was 3.27 × 10⁻⁵ m/s. Under the loading rate of 1 mm/min, the propagation velocities of the deformation waves in the three tested samples were 10.1 × 10⁻⁵, 10.5 × 10⁻⁵, and 10.7 × 10⁻⁵ m/s, respectively, and the average velocity was 10.4 × 10⁻⁵ m/s. The wave propagation velocities under the three loading rates were roughly equivalent to those of the plastic flow waves controlling earthquake migration in the lower lithosphere [6].
The deformation waves’ propagation velocities obtained at the loading rates of 0.1, 0.5, and 1 mm/min by testing nine samples are plotted in Figure 12. As the loading rate increases, the propagation velocities of the deformation waves increase linearly. Thus, a positive linear correlation between these parameters with a high correlation coefficient R2 = 0.9964 was revealed. The above dependence was best-fitted by a linear regression formula presented in Figure 12.

4. Discussion

Various experimental tools tracked the spatial-temporal occurrences of the deformation waves in the deformed red sandstone samples during their loading. The generation of deformation waves in the rock samples was found to be related to the regions of elastic stress concentration of varying scales [42]. Under the three loading rates, the deformation waves’ propagation rates were 3.0 × 10⁻⁵, 5.9 × 10⁻⁵, and 10.4 × 10⁻⁵ m/s, respectively. They exceed, by one order of magnitude, the axial loading rates, i.e., the boundary advance speeds, of 0.16 × 10⁻⁶, 0.8 × 10⁻⁶, and 1.6 × 10⁻⁶ m/s for the loading rates of 0.1, 0.5, and 1 mm/min, respectively. Thus, the propagation rate of deformation waves is significantly higher than that of the mass particles. The local thickening and uplift caused by boundary advancement continue to propagate with the help of elastic force and inertial force. Thus, the matter particles’ initial high displacement rate under the elastic force’s action tended to decrease due to viscous resistance. As the flow rate decreased, the subsequent substance deformation was accumulated, leading to local bulging and increased elastic potential. This would further accelerate the matter particles’ displacement velocity. Such alternation of high and low velocities is manifested as wave propagation. It can be considered that this is a kind of deformation wave that contains the migration of matter particles which is essentially the particle momentum waves proposed by Fitzgerald [43].
The deformation wave propagation is a process of mutual conversion between the elastic and kinetic energies under the boundary-driven condition and a process of adjustment for the imbalance between the driving force and viscous force inherent in solids. The situation where the driving boundary induces the deformation wave propagation is known as “boundary-driven wave generation” or “external-driven wave generation”. Viscous deformation arises when the elastic stress is relaxed in regions of stress concentration [44]. The elastic strain concentration is restricted by viscous deformation (relaxation). Moreover, since the viscous deformation is usually induced near the regions of stress concentration, the distribution of centers of viscous deformation (flow channels) in the samples coincided with those of the regions of elastic strain concentration.

5. Conclusions

In the present study, rock samples were subjected to microscopic characterization by speckle photography during the uniaxial compression test. The image processing via the DIC technology revealed the spatial-temporal evolution of the deformed samples’ deformation waves. The characteristics of deformation waves in the samples under loading were obtained as follows:
(1)
The deformation waves slowly propagated from one end of the sample, to which the load was applied. The strain magnitude was much higher at one end to which the load was applied than that at the other one at the beginning of loading. However, the strain values became comparable over time over the sample, thus demonstrating deformation wave propagation in the laboratory tests of small-scale rock samples.
(2)
In the samples under loading, the deformation waves are influenced by the elastic standing waves, which could be inferred from the positions of the minimums and maximums of the elastic standing waves (regions of stress concentration) and the flow channels’ distributions. These flow channels were formed at the compaction and elastic stages and were involved in the subsequent stages. As the stress increased, the LB nuclei interacted with the flow channels nearby to generate the minimum and maximum strain values ( ε x x ).
(3)
As the loading rate increased, the propagation velocity of the deformation waves increased linearly. Thus, a positive linear correlation between these parameters with a high correlation coefficient, R2 = 0.9964, was revealed.
(4)
The experiments and comparative analyses conducted in this paper were semi-quantitative ones, and further investigations are needed in this respect. The research findings shed some new light on the evolutionary characteristics of slow deformation waves and earthquake migration. They also provide experimental data for more in-depth analysis of the generation and propagation mechanism of slow deformation waves in the continental plates.

Author Contributions

Conceptualization, F.Y. and C.Q.; methodology, R.S.; software, F.Y.; validation, F.Y., C.Q. and R.S.; formal analysis, F.Y.; investigation, C.Q.; resources, R.S.; data curation, F.Y.; writing—original draft preparation, F.Y.; writing—review and editing, F.Y.; visualization, C.Q.; supervision, R.S.; project administration, F.Y.; funding acquisition, C.Q. All authors have read and agreed to the published version of the manuscript.

Funding

This research was funded by Chengzhi Qi. And the APC was funded by Chengzhi Qi. This work was supported by the National Key Basic Research Development Plan (approval No.: 802015CB575), the National Natural Science Foundation of China (approval No.: 51774018), and the Yangtze River Scholars Innovation Team program (PCSIRT, IRT_17R06).

Data Availability Statement

Some or all data, models, or code that support the findings of this study are available from the corresponding author upon reasonable request.

Conflicts of Interest

The authors declare no conflict of interest.

References

  1. Mogi, K. Relationship between shallow and deep seismicity in the western Pacific region. Tectonophysics 1973, 17, 1–22. [Google Scholar] [CrossRef]
  2. Savage, J.A. A theory of creep waves propagation along a transform faults. J. Geophys. Res. 1971, 76, 1954–1966. [Google Scholar] [CrossRef]
  3. Elsasser, W. Convection and stress propagation in the upper mantle. In The Application of Modern Physics to the Earth and Planetary; Wiley: New York, NY, USA, 1969; pp. 223–246. [Google Scholar]
  4. Kasahara, K. Earthquake Mechanics; Cambridge University Press: Cambridge, UK, 1981. [Google Scholar]
  5. Wang, S.Z. Brittle ductile transition and plastic flow network of rocks. Prog. Geophys. 1993, 4, 25–37. (In Chinese) [Google Scholar]
  6. Wang, S.Z.; Zhang, Z.C. Intraplate plastic flow waves and seismic migration (1). Seismogeology 1994, 4, 289–297. (In Chinese) [Google Scholar]
  7. Richter, C.F. Elementary Seismology; W.H. Freeman: San Francisco, CA, USA, 1958. [Google Scholar]
  8. Levina, E.A.; Ruzhich, V.V. The seismicity migration study based on sace-time iagramas. Geophys. Tectonophyiscs 2015, 6, 225–240. (In Russian) [Google Scholar]
  9. Ruina, A. Slip instability and state variable friction laws-Ruina-2012. J. Geophys. Res. Solid Earth 1983, 88, 10359–10370. [Google Scholar] [CrossRef]
  10. Feng, D.Y. Study of Seismicity Waves, World Seismological Translation; China Seismological Society: Tianjin, China, 1986. (In Chinese) [Google Scholar]
  11. Geng, N.G.; Xu, D.J. Plastic deformation waves in fault gouge observed in field large scale friction experiments. Acta Seismol. Sin. 1990, 1, 45–49. (In Chinese) [Google Scholar]
  12. Shan, R.L.; Jiang, Y.S.; Li, B.Q. Obtaining dynamic complete stress–strain curves for rock using the Split Hopkinson Pressure Bar technique. Int. J. Rock Mech. Min. Sci. 2000, 37, 983–992. [Google Scholar] [CrossRef]
  13. Qi, C.; Wang, M.; Bai, J.; Wei, X. Investigation into size and strain rate effects on the strength of rock-like materials. Int. J. Rock Mech. Min. Sci. 2016, 86, 132–140. [Google Scholar] [CrossRef]
  14. Qi, C.Z.; Wang, M.Y.; Qian, Q.H. Evolution of the deformation and fracturing in rock masses near deep-level tunnels. J. Min. Sci. 2009, 45, 112–119. [Google Scholar] [CrossRef]
  15. Qi, C.; Chen, H.; Chanyshev, A.; Qi, J. Modeling deformation wave in rock near deep level tunnel. J. Min. Sci. 2017, 53, 1025–1036. [Google Scholar] [CrossRef]
  16. Li, S.C.; Wang, H.P.; Qian, Q.H.; Li, S.Z. In situ monitoring study on zonal cracking of surrounding rock in deep roadway. J. Rock Mech. Eng. 2008, 27, 1446–1553. (In Chinese) [Google Scholar]
  17. Li, X.; Qu, X.; Qi, C.; Shao, Z. A unified analytical method calculating brittle rocks deformation induced by crack growth. Int. J. Rock Mech. Min. Sci. 2019, 113, 134–141. [Google Scholar] [CrossRef]
  18. Li, X.Z.; Shao, Z.S. Investigation of Macroscopic Brittle Creep Failure Caused by Microcrack Growth under Step Loading and Unloading in Rocks. Rock Mech. Rock Eng. 2016, 49, 2581–2593. [Google Scholar] [CrossRef]
  19. Malamud, A.S.; Nikolaevsky, V.N. Cyclicity of seismic tectonic events in the border of Indian lithosphere plate. Rep. USSR AS 1985, 283, 1333–1337. (In Russian) [Google Scholar]
  20. Malamud, A.S.; Nikolaevsky, V.N. Earthquake Cycles and Tectonic Waves; Donish: Dushanbe, Tajikistan, 1989. [Google Scholar]
  21. Sherman, S.I.; Gorbunova, E.A. Wave origin of fault activation in central Asia on the basis of seismic monitoring. Phys. Mesomech. 2008, 11, 115–122. (In Russian) [Google Scholar]
  22. Psakhie, S.G.; Ruzhich, V.V.; Smekalin, O.P.; Shilko, E.V. Response of the geological media to dynamic loading. Phys. Mesomech. 2001, 4, 67–71. (In Russian) [Google Scholar]
  23. Wang, S.Z.; Zhang, Z.C. Plastic-flow waves(‘slow waves’) and seismic activity in Central-Eastern Asia. Seismol. Geol. 2004, 26, 91–101. (In Chinese) [Google Scholar]
  24. Barannikova, S.A.; Nadezhkin, M.V.; Zuev, L.B.; Danilov, V.I. On inhomogeneous straining in compressed sylvinite. Tech. Phys. Lett. 2010, 36, 507–510. [Google Scholar] [CrossRef]
  25. Zuev, L.B.; Barannikova, S.A.; Zhigalkin, V.M.; Nadezhkin, M.V. Laboratory observation of slow movements in rocks. J. Appl. Mech. Tech. Phys. 2012, 53, 467–470. [Google Scholar] [CrossRef] [Green Version]
  26. Zuev, L.B.; Danilov, V.I. Plastic deformation modeled as a self-excited wave process at the maso- and macro-level. Theor. Appl. Fract. Mech. 1997, 30, 175–184. [Google Scholar] [CrossRef]
  27. Fairhurst, C.E.; Hudson, J.A. Draf ISRM suggested method for the complete stress-strain curve for intact rock in uniaxial compression. Int. J. Rock Mech. Min. Sci. Geomech. Abstr. 1999, 36, 281–289. [Google Scholar]
  28. Munoz, H.; Taheri, A.; Chanda, E.K. Pre-peak and post-peak rock strain characteristics during uniaxial compression by 3D digital image correlation. Rock Mech. Rock Eng. 2016, 49, 2541–2554. [Google Scholar] [CrossRef]
  29. Heinz, S.R.; Wiggins, J.S. Uniaxial compression analysis of glassy polymer networks using digital image correlation. Polym. Test. 2010, 29, 925–932. [Google Scholar] [CrossRef]
  30. Yang, G.; Cai, Z.; Zhang, X.; Fu, D. An experimental investigation on the damage of granite under uniaxial tension by using a digital image correlation method. Opt. Lasers Eng. 2015, 73, 46–52. [Google Scholar] [CrossRef]
  31. Danilov, V.I.; Konovalov, S.V.; Zhuravleva, S.V.; Zuev, L.B.; Gromov, V.E. Macrolocalization of plastic strain in creep of fine-grain aluminum. Tech. Phys. 2005, 50, 376–379. [Google Scholar] [CrossRef]
  32. Danilov, V.I.; Orlova, D.V.; Zuev, L.B.; Nadezhkin, M.V. Special features of the localized plastic deformation and fracture of high-chromium steel of the martensitic class. Russ. Phys. J. 2009, 52, 525–531. [Google Scholar] [CrossRef]
  33. Peters, W.H.; Ranson, W.F. Digital imaging techniques in experimental stress-analysis. Kluwer Law Int. 1982, 21, 427–431. [Google Scholar] [CrossRef]
  34. Stirling, R.A.; Simpson, D.J.; Davie, C.T. The application of digital image correlation to brazilian testing of sandstone. Int. J. Rock Mech. Min. Sci. 2013, 60, 1–11. [Google Scholar] [CrossRef] [Green Version]
  35. Lin, H.; Yang, H.; Wang, Y.; Zhao, Y. Determination of the stress field and crack initiation angle of an open flaw tip under uniaxial compression. Theor. Appl. Fract. Mech. 2019, 104, 102358. [Google Scholar] [CrossRef]
  36. Miao, S.; Pan, P.-Z.; Wu, Z.; Li, S.; Zhao, S. Fracture analysis of sandstone with a single filled flaw under uniaxial compression. Eng. Fract. Mech. 2018, 204, 319–343. [Google Scholar] [CrossRef]
  37. Lin, Q.; Wan, B.; Wang, S.; Li, S.; Fakhimi, A. Visual detection of a cohesionless crack in rock under three-point bending. Eng. Fract. Mech. 2019, 211, 17–31. [Google Scholar] [CrossRef]
  38. Zhao, C.; Zhou, Y.M.; Zhao, C.F.; Bao, C. Cracking processes and coalescence modes in rock-like specimens with two parallel pre-existing cracks. Rock Mech. Rock Eng. 2018, 51, 3377–3393. [Google Scholar] [CrossRef]
  39. Zhou, X.P.; Lian, Y.J.; Wong, L.N.Y.; Berto, F. Understanding the fracture behavior of brittle and ductile multi-flawed rock by uniaxial loading by digital image correlation. Eng. Fract. Mech. 2018, 199, 438–460. [Google Scholar] [CrossRef]
  40. Bornert, P.; Bouret, S. Principles of whole-body continuously-moving-table MRI. PLoS Biol. 2008, 19, 1–12. [Google Scholar] [CrossRef] [PubMed]
  41. Qian, L.X. Encyclopedia of China. Mechanics; China Encyclopedia Press: Beijing, China, 1985. (In Chinese) [Google Scholar]
  42. Farber, V.M.; Polukhina, O.N.; Vichuzhanin, D.I.; Khotinov, V.A.; Smirnovet, S.V. A Study of Plastic Deformation of 08G2B Steel before and at the Yield Plateau by Digital Image Correlation Technique. Part 1. Formation of Plastic and Elastic Deformation Waves. Met. Sci. Heat Treat. 2019, 61, 274–279. [Google Scholar] [CrossRef]
  43. Fitzgerald, E.R. Particle waves and audio frequency modes in crystals. J. Acoust. Soc. Am. 1966, 21, 1856–1869. [Google Scholar]
  44. Farber, V.M. Contribution of Diffusion Processes to Structure Formation in Intense Cold Plastic Deformation of Metals. Met. Sci. Heat Treat. 2002, 44, 317–323. [Google Scholar] [CrossRef]
Figure 1. Red sandstone samples and relevant experimental equipment. (a) The rock samples, (b) the loading and speckle photography system, (c) the local image of loading.
Applsci 12 01364 g001
Figure 2. Strain error analysis.
Applsci 12 01364 g002
Figure 3. Strain characterization of the rock samples at different time points under the loading rate of 0.1 mm/min ((a,b) is the schematic diagram at different times).
Applsci 12 01364 g003
Figure 4. Vertical view of the strain component ε x x   at different time points at loading rates of 0.5 and 1 mm/min.
Applsci 12 01364 g004
Figure 5. Strain diagrams at the same strain under different loading rates.
Applsci 12 01364 g005
Figure 6. Stress-strain and stress-time curves at a loading rate of 0.1 mm/min.
Applsci 12 01364 g006
Figure 7. Strain nephograms corresponding to points 1 to 4 of the stress-strain curve in Figure 6.
Applsci 12 01364 g007
Figure 8. Variations of the strain component ε x x over time at different sites.
Applsci 12 01364 g008
Figure 9. The loading scheme of rock samples.
Applsci 12 01364 g009
Figure 10. Deformation waves along the central line of the samples from 640 s to 920 s.
Applsci 12 01364 g010
Figure 11. Variation trend of the maximum value of localized strain along the central line.
Applsci 12 01364 g011
Figure 12. Dependence of the propagation rate of the deformation waves on loading rate.
Applsci 12 01364 g012
Publisher’s Note: MDPI stays neutral with regard to jurisdictional claims in published maps and institutional affiliations.

