Article

The Investigation of Detect Position of Partial Discharge in Cast-Resin Transformer Using High-Frequency Current Transformer Sensor and Acoustic Emission Sensor

by
Nuttee Thungsuk
1,
Narong Mungkung
2,
Apidat Songruk
2,
Khanchai Tunlasakun
2,
Kittimasak Tikakosol
3,
Siriwut Nilawat
4,
Kanitphan Boonsomchuae
5,
Toshifumi Yuji
6,
Somchai Arunrungrusmi
2,* and
Hiroyuki Kinoshita
7
1
Department of Electrical Engineering, Dhonburi Rajabhat University Samut-Prakan, Samut-Prakan 10540, Thailand
2
Plasma and Electrical Discharge Laboratory, Faculty of Industrial Education and Technology, King Mongkut’s University of Technology Thonburi, Bangkok 10140, Thailand
3
Advanced Power Equipment (Thailand), Co., Ltd., Bangkok 10510, Thailand
4
Faculty of Industrial Technology, Nakhonphanom University, Nakhonphanom 48000, Thailand
5
School of Industrial Technology, Faculty of Science and Technology, Pathumwan Institute of Technology, Bangkok 10330, Thailand
6
Faculty of Education and Culture, University of Miyazaki, Miyazaki 889-2192, Japan
7
Department of Engineering, University of Miyazaki, 1-1 Gakuen-Kinabanadai-Nishi, Miyazaki 889-2192, Japan
*
Author to whom correspondence should be addressed.
Appl. Sci. 2022, 12(3), 1310; https://doi.org/10.3390/app12031310
Submission received: 13 December 2021 / Revised: 5 January 2022 / Accepted: 6 January 2022 / Published: 26 January 2022
(This article belongs to the Topic Power Distribution Systems)

Abstract

:
The lifetime of a cast-resin transformer mainly depends on the condition of insulation material. Partial discharge (PD) is an important reason for insulation deterioration in cast-resin transformers. Identifying the position of PD is very necessary for damage assessment while the transformer is still operating, and the transformer is covered by housing. This paper proposes the investigation of a cast-resin transformer using an AE sensor and HFCT sensor to specify the precise source of PD. In this study, four AE sensors were used to find PD sources, and the high-frequency current transducer (HFCT) technique was used to identify the PD source and the criteria level. The experiment, in the first two parts, identified the possibility of PD, which includes the position of PD. The final part of the experiment verified the position of the PD source of a cast-resin transformer and confirmed the inspection results. AE and HFCT sensors can be used to detect the location of PD sources, confirming the position of the PD source by sensor detection. In addition, the evident partial discharge picture on the insulator surface of high voltage side. The process successfully and accurately identifies and locates the PD source.

1. Introduction

Transformers are the main equipment in transmission and distribution systems because of their ability to easily transfer voltage levels. At present, electricity is the dominant form of energy used in daily life. In addition, in industrial systems, electrical energy is required for production in different industries, such as the automotive industry, agriculture and food industry, petrochemical and chemical industry, etc. However, when using electric energy, the equipment in the transmission and distribution system is also affected, which inevitably includes transformers. Usually, require maintenance periods. However, when a transformer has a partial discharge (PD) defect that is not detected early, it will cause the insulation of the transformer to deteriorate and, which could cause a serious accident in the future [1]. These failures are a problem that will inevitably cause damage to the transformer and cause enormous economic losses. The relationship between PD and sensors has been extensively studied due to the importance of PD in power systems, as PD results in damage to electrical equipment. Several researchers have studied sound-wave propagation inside a transformer tank with the simulation method [2], as well as the properties and suitability of sensors to detect PD in electrical devices, such as switchgear, rotary electric machines, cables, and transformers [3].
Inspection of insulation and partial discharge (PD) analysis are used to reflect the state of the insulation, with accurate PD signal measurement being key to detection systems for transformer insulation [4,5]. PD measurement is widely used in many industries, such technology as technology and manufacturing, and is one of the most common techniques that used to assess the insulation condition of transformers. For example, PD measurement is used to observe the location of insulation defects causing discharge, i.e., PD source localization [6,7]. Localization of PD faults in transformers is required at various times when fault currents are identified in transformers. Measurement of partial discharge levels in accordance with IEC 60,270 is an important procedure, which is standardized worldwide in order to guarantee quality assurance of transformers [7,8,9]. In addition, PD measurement is performed as a part of routine measurements during the manufacturing process [6,8]. Therefore, PD detection and localization procedures are normally initiated as a result of corresponding indications, which are obtained from dissolved gas-in-oil analysis (DGA) and PD monitoring. For these reasons, precise location of PD can help with effective maintenance during operation to optimize the production of power transformers [9]. However, unusual devices can create some problems, such as causing nonstop PD pluses and phenomena, such as light, sound and electromagnetic radiation. Therefore, a new device is required to address these issues.
At present, the excellent properties of cast-resin dry-type transformers are widely used in industrial systems, such as heavy industry, airports, hospitals, public transport systems, and high-rise buildings. In particular, cast-resin transformers are used buildings requiring safety from explosions or fire, as it is the safest transformer for indoor installation [10,11]. Furthermore, it is a first-choice equipment for use in high-rise buildings and other buildings. However, the service life of cast-resin dry-type transformers depends on the insulation conditions; when in operation under heat, the electric field, mechanical force, and the environmental conditions can lead to the transfer of electric charges in the transformer. Periodic offline diagnostic tests play an important role in the transformer devices, generally occurring over a 6–12 month/period. However, if something goes wrong with the transformer between inspections, it can result in massive damage to the transformer and related power systems. It may take hours to address damages that occur as a result of PD. However, “ongoing” or “online” measurements and monitoring have become increasingly popular, reducing the need for offline inspections and interventions in power systems. These measurements were put into practice for a case study of cast-resin transformers [12,13,14]. Furthermore, the efficiency and reliability of transformers in power plants can be gradually increased. Another benefit is that it can reduce maintenance costs, improving the efficiency of equipment and maintenance procedures, helping to manage the increased risk of aging transformers [15,16,17]. This research proposes an online measurement method for partial discharge detection and location in case-resin transformers using frequency and acoustic sensors. Our method of detection and diagnosis of PD identifies the location and assesses the potential risk of PD. This method can assess the position of PD in order to correct it as soon as possible, preventing further damage.

2. Materials and Methods

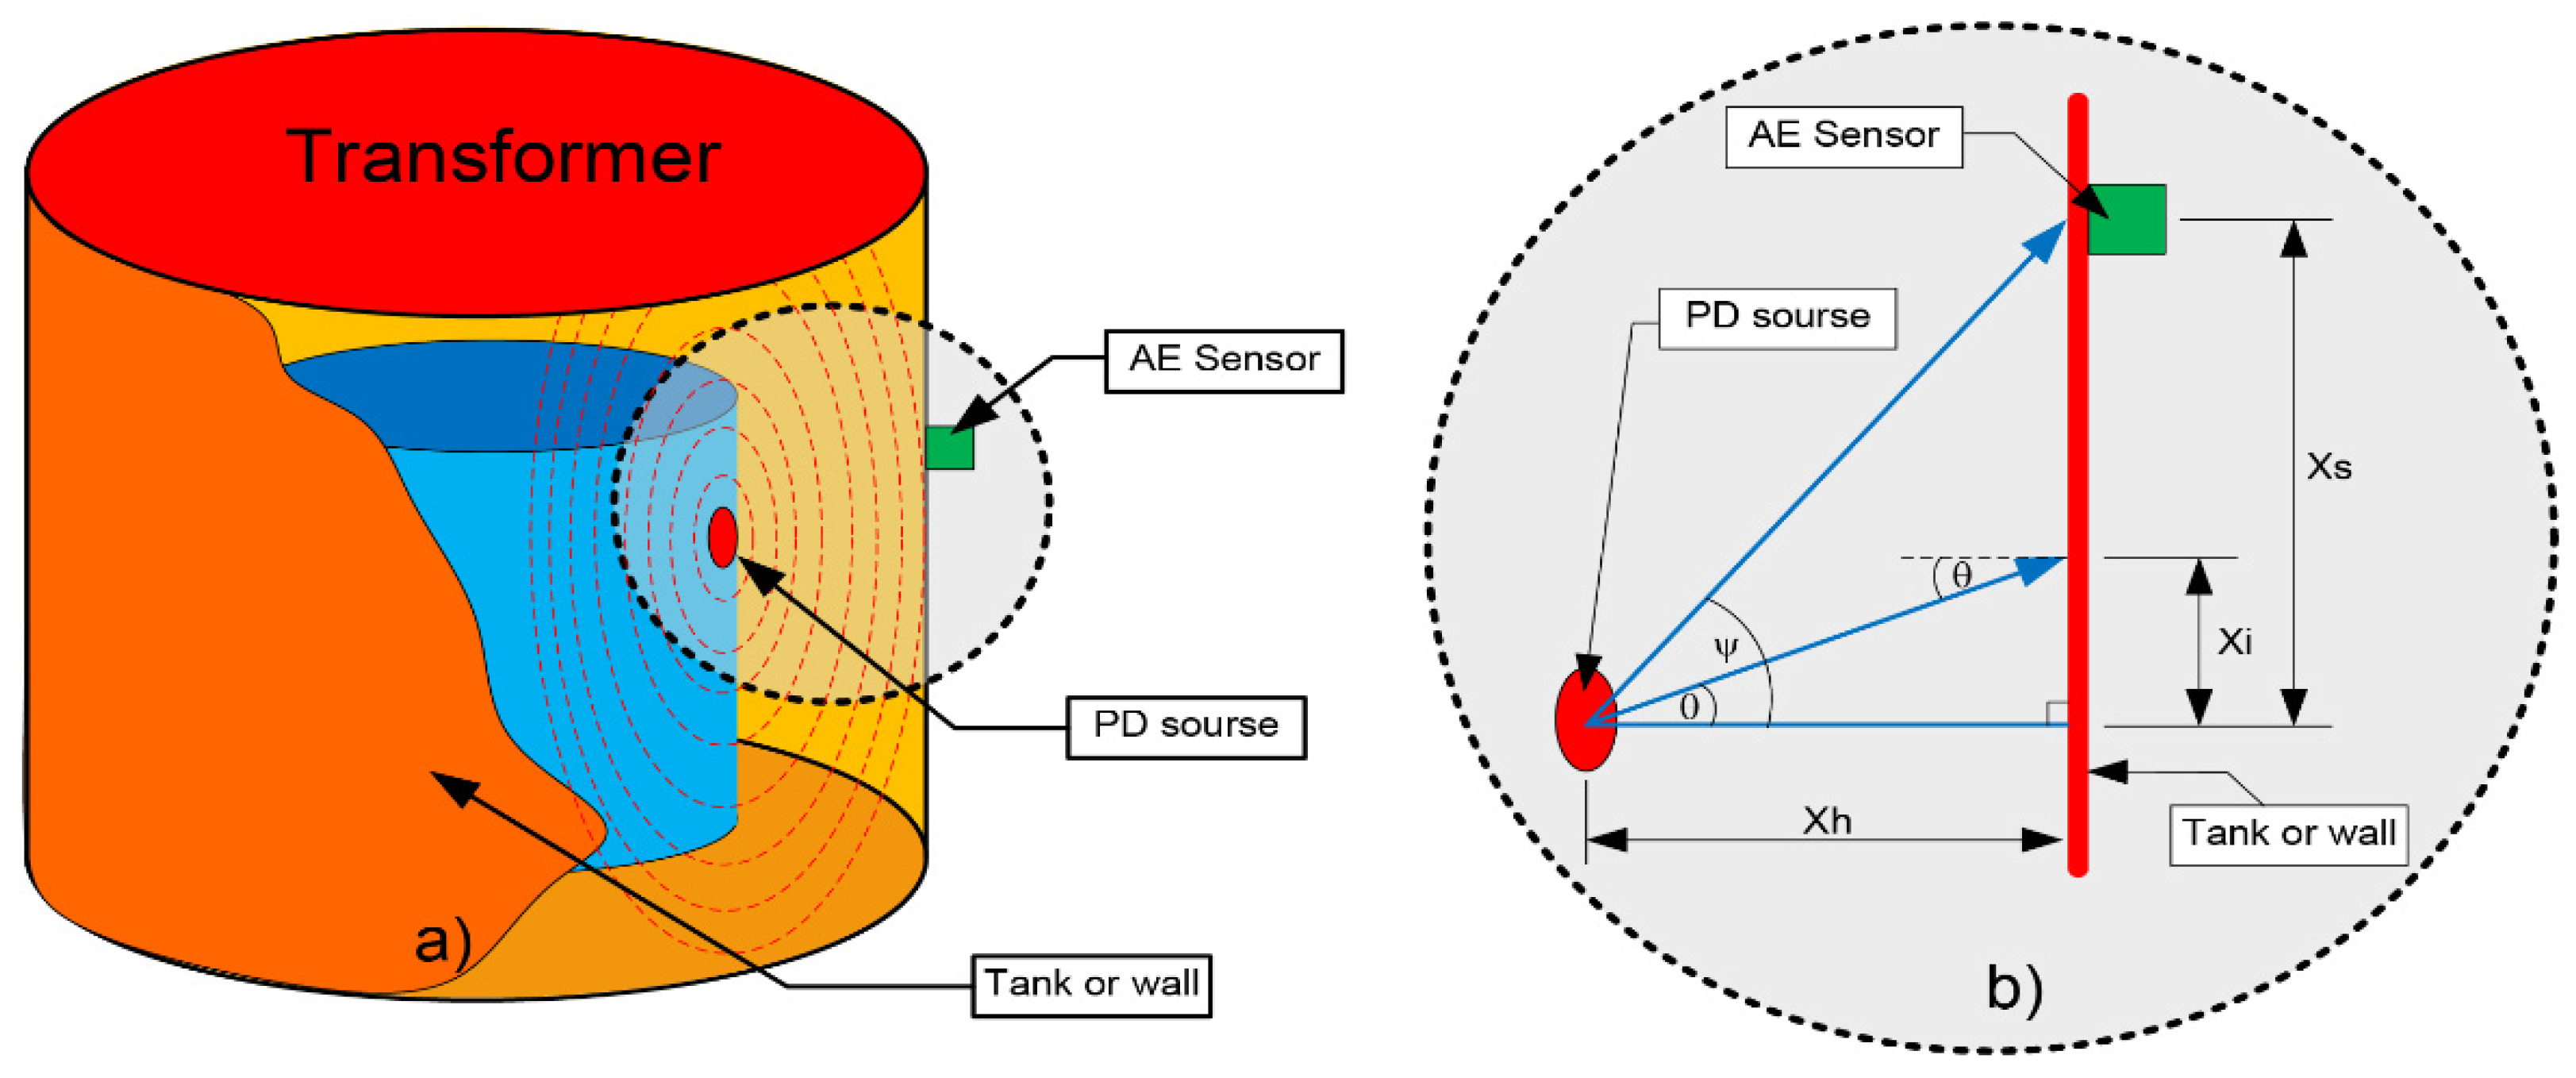
2.1. Principles of PD Source Localization

Various methods have been explored by many researchers to measure PD based on electrical and non-electrical phenomena [8]. The detecting signal emission based on the fact can be successfully identified, which appears to be the origin of acoustic waves of PD [7,18].
Figure 1 shows the relationship between the PD source and the AE sensor. Figure 1a shows the sound wave travel time is the passed time while the acoustic PD signal disseminates from its discharge location to an AE sensor. The PD signal disseminated was symmetrical in that the signal impacted the tank wall or case at the outside of the transformer. The tank wall of transformer was an AE sensor installation meant to receive signals from PD signals. Figure 1b shows the various parameters characterizing PD wave propagation paths. Nevertheless, a number of different dissemination paths could exist for sound waves traveling from the PD source to the sensor [7], as can be seen by Figure 1. The determination of the time of arrivals (TOAs) from the PD source to a number of AE sensors was used to be an acoustic emission (AE) measurement method to locate the PD source. The acoustic signal traveling distance from a PD source to an AE sensor as follows the Equation (1) [18]. All acoustic waves spread through the internal structure of a high voltage device until reaching the external surface.
distance ( m ) = velocity ( m s ) × traveltime ( s )
The total sound wave travelling time to a sensor can be computed as Equation (2) and the sound wave travel time is the time elapsed while an acoustic PD signal prop-agates from its discharge location to an AE sensor, which can be calculated from the following Equation (3) [7].
t = X i 2 + X h 2 V a i r + X s X i V m e t a l
t = X s v m e t a l
For the direct path, in which the sound wave only travels before reaching AE sensor, the elapsed time can be calculated from the following Equation (4).
t = X i 2 + X w 2 v a i r
According to above, the acoustic signal travels considerable distance X w before reaching transformer tank wall. In addition, the shortest traveling time can be completely achieved when the sound wave entering to the metal tank together with a critical incident angle. The critical incident angle (α) can be following Equation (5).
α = sin 1 ( v a i r v m e t a l )
In order to obtain the corresponding wave traveling time, it can be calculated from the following Equation (6).
t = X w V a i r cos θ + X S X W tan θ V m e t a l

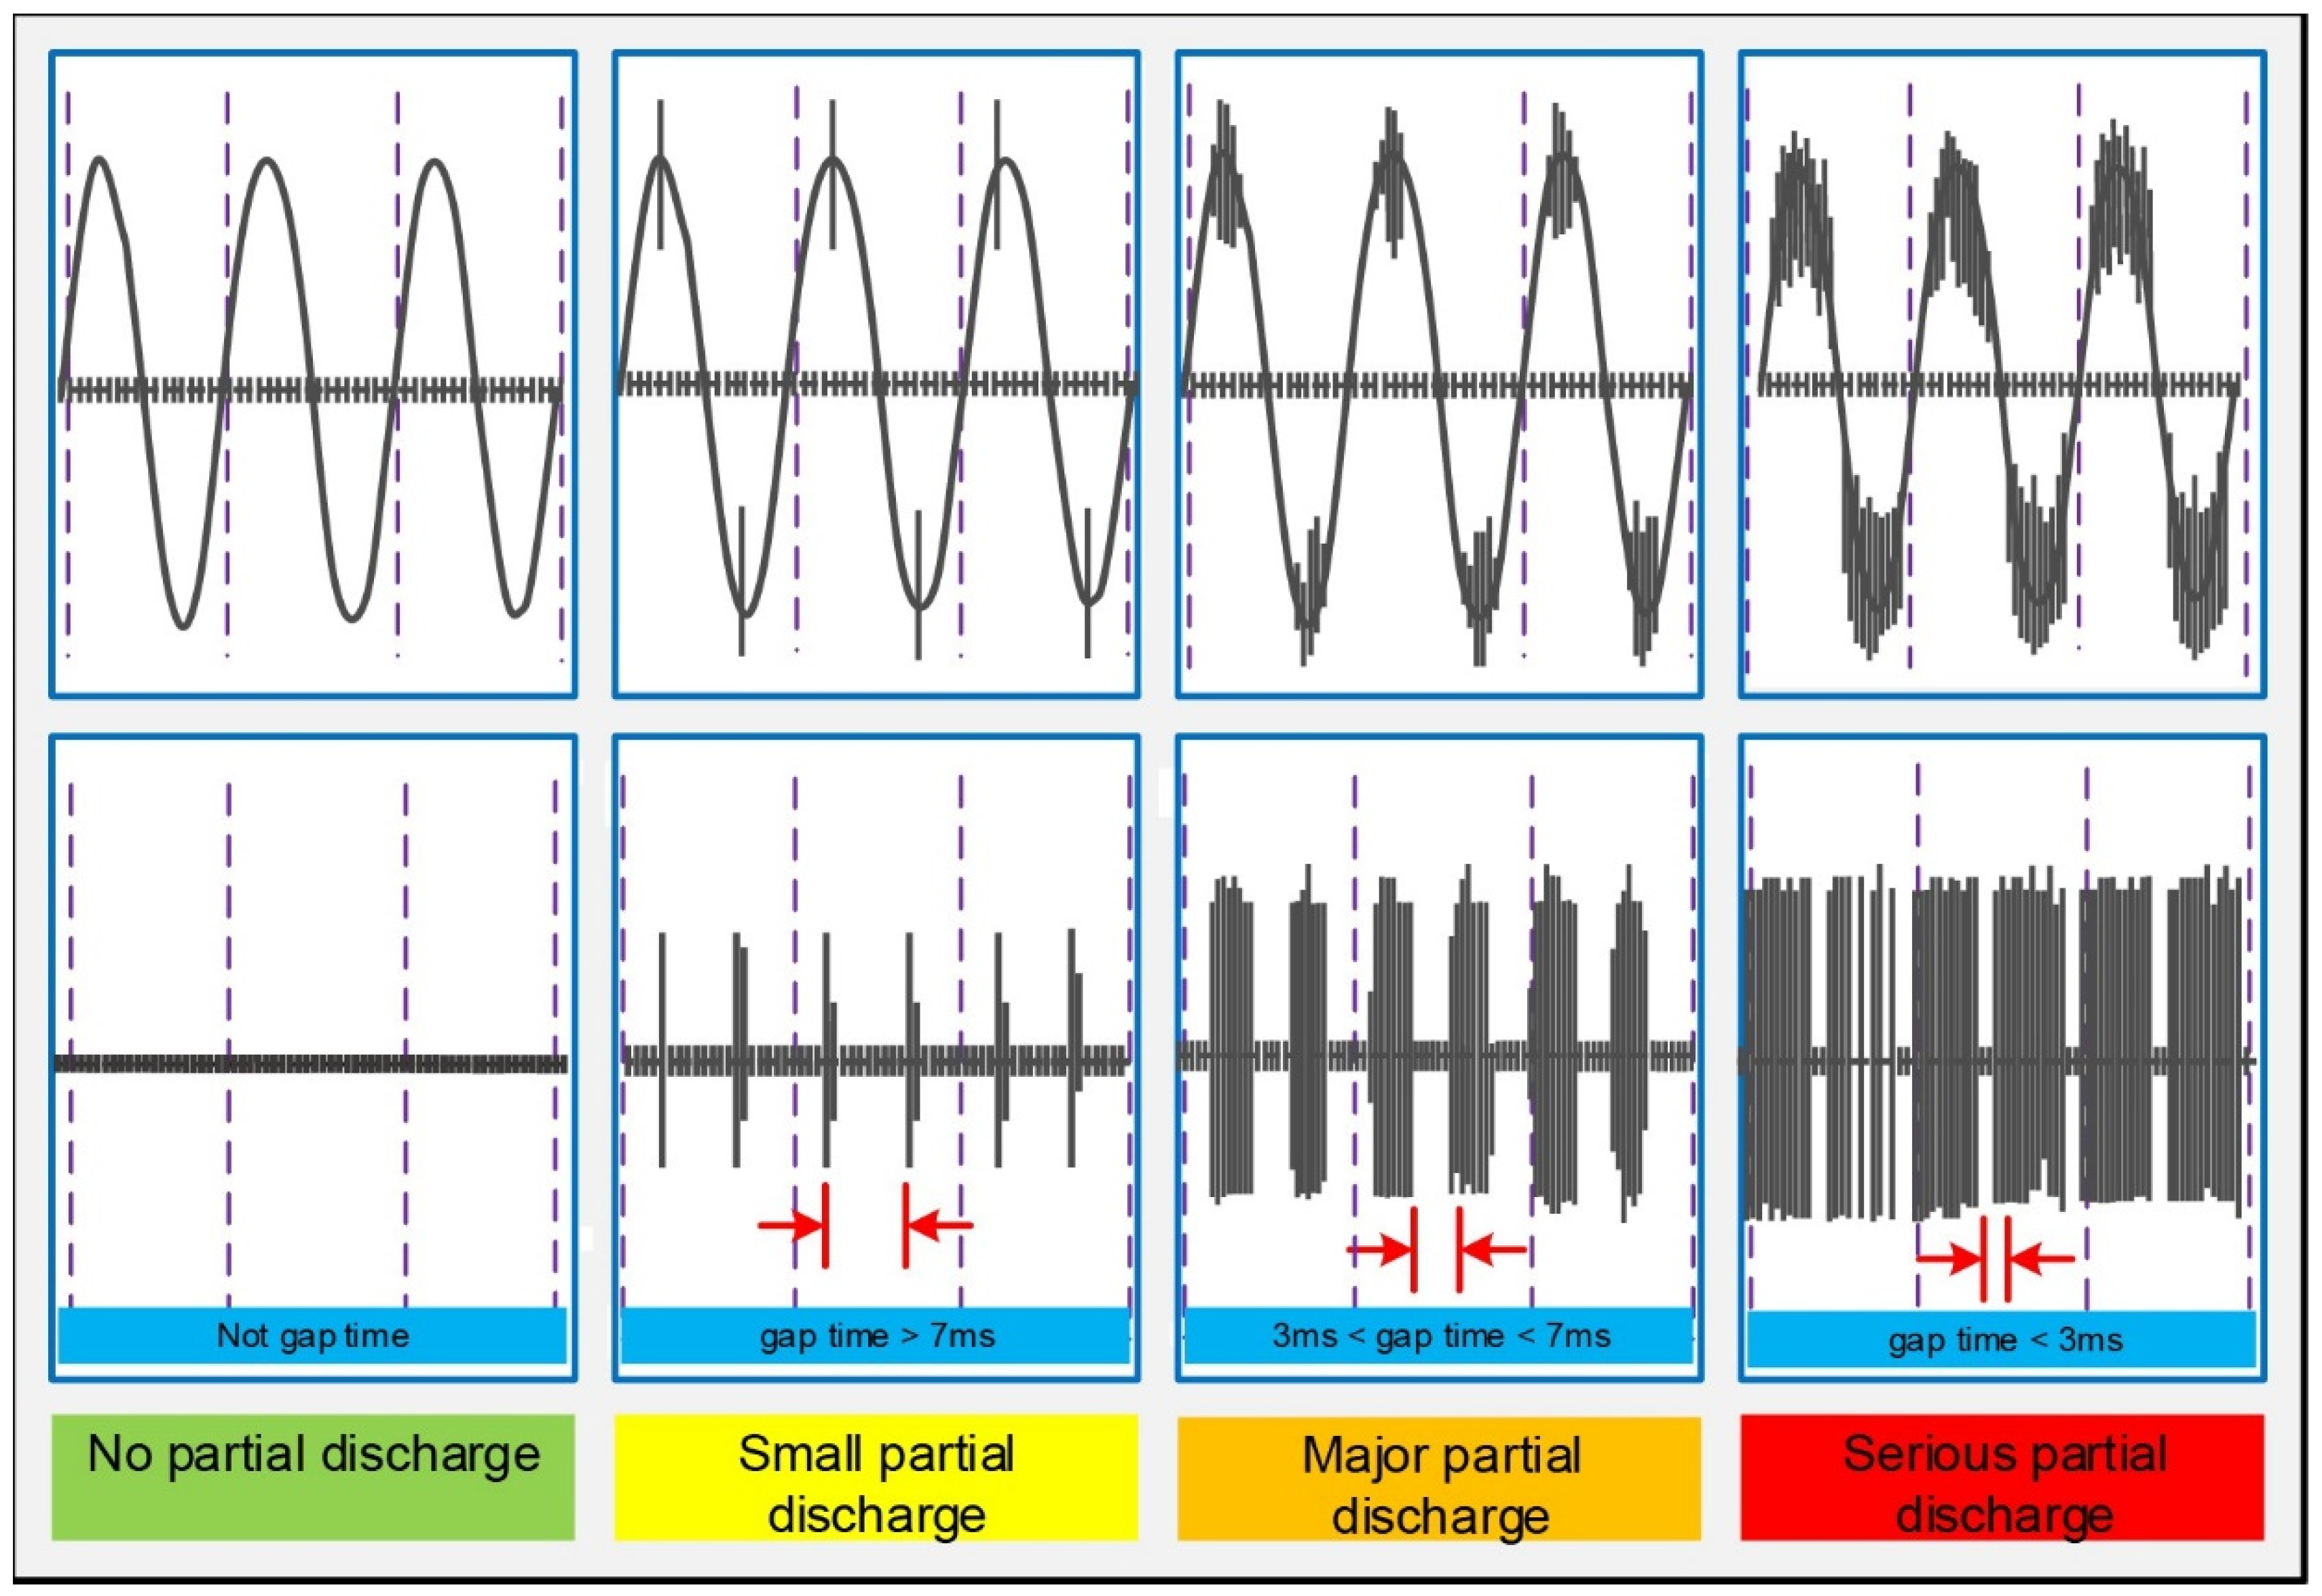
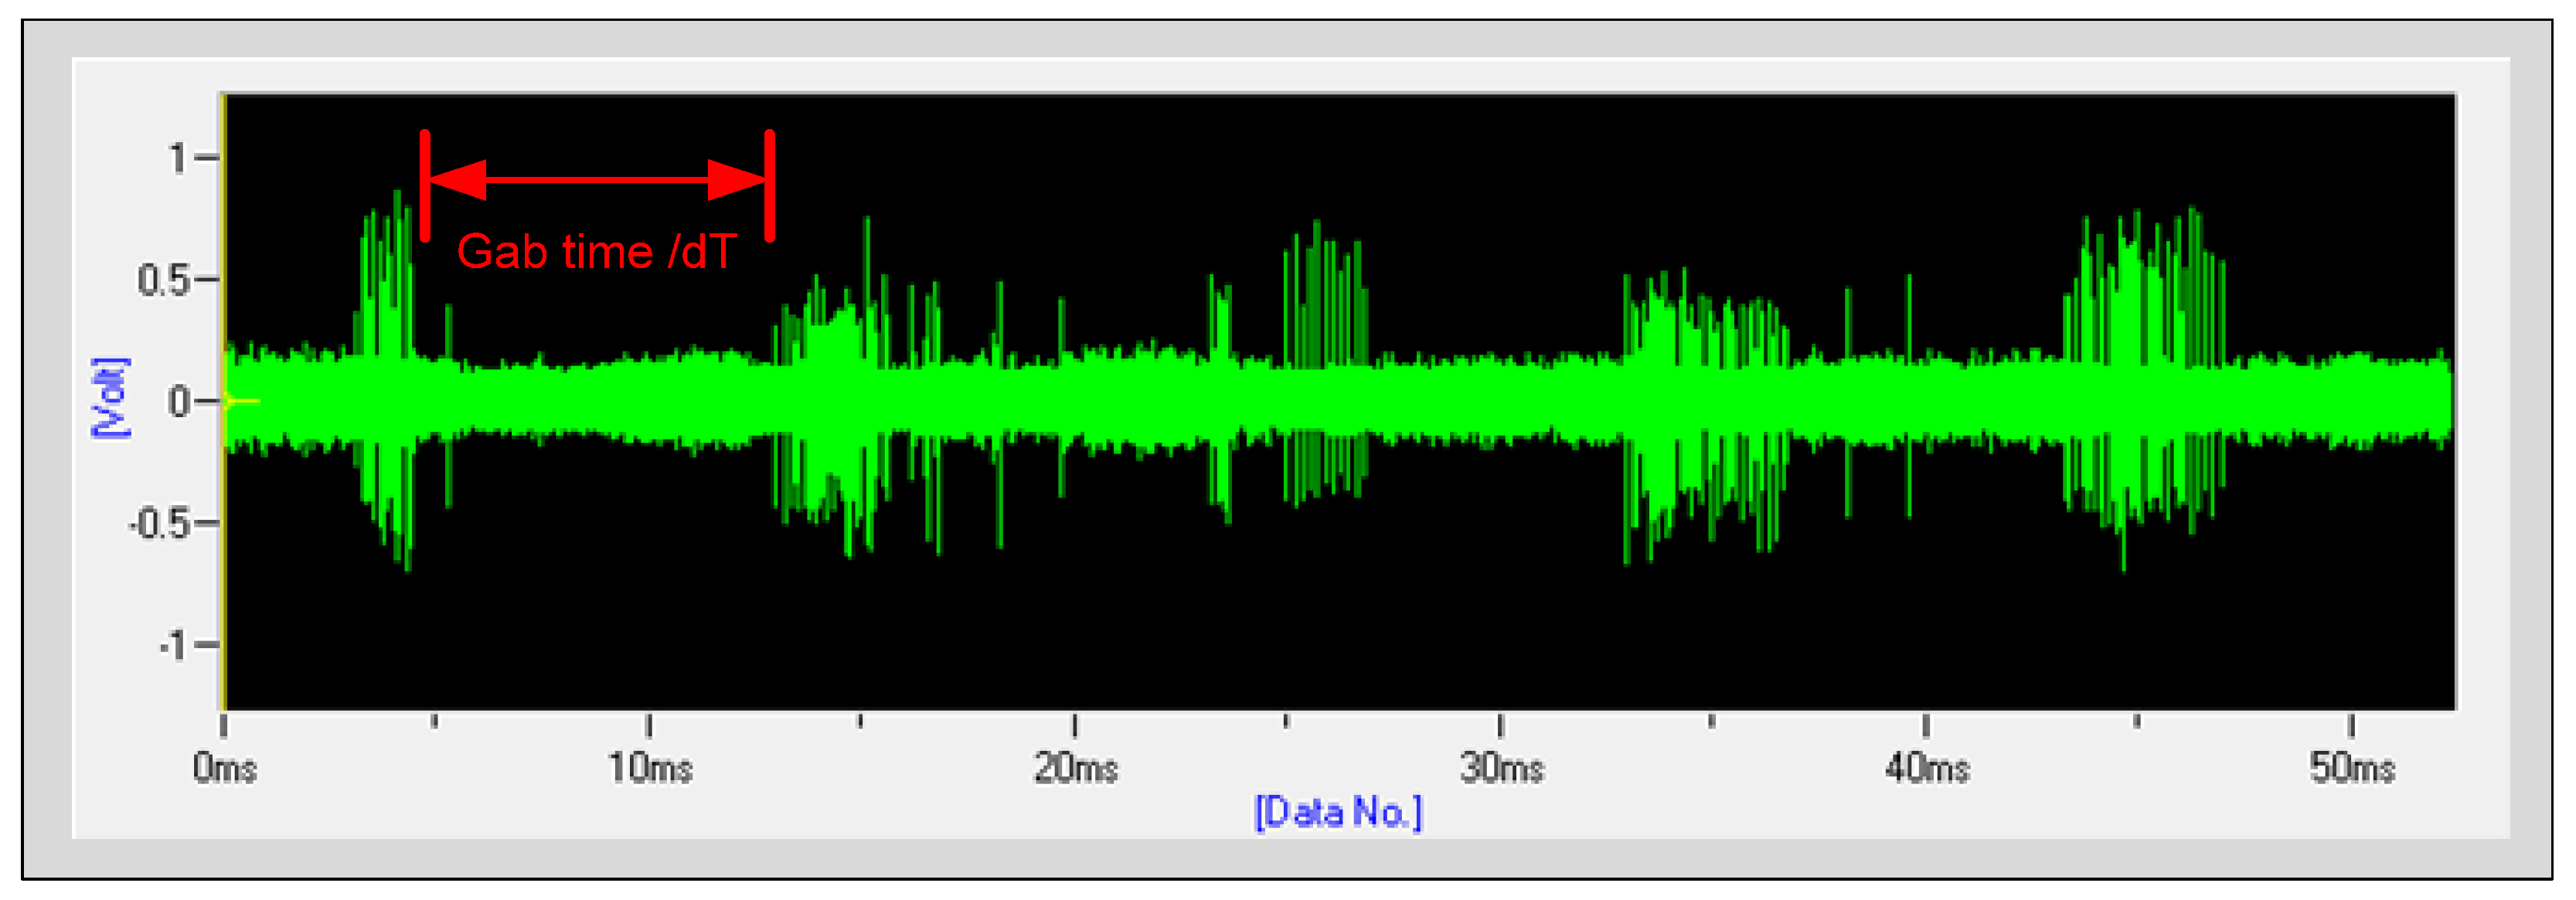
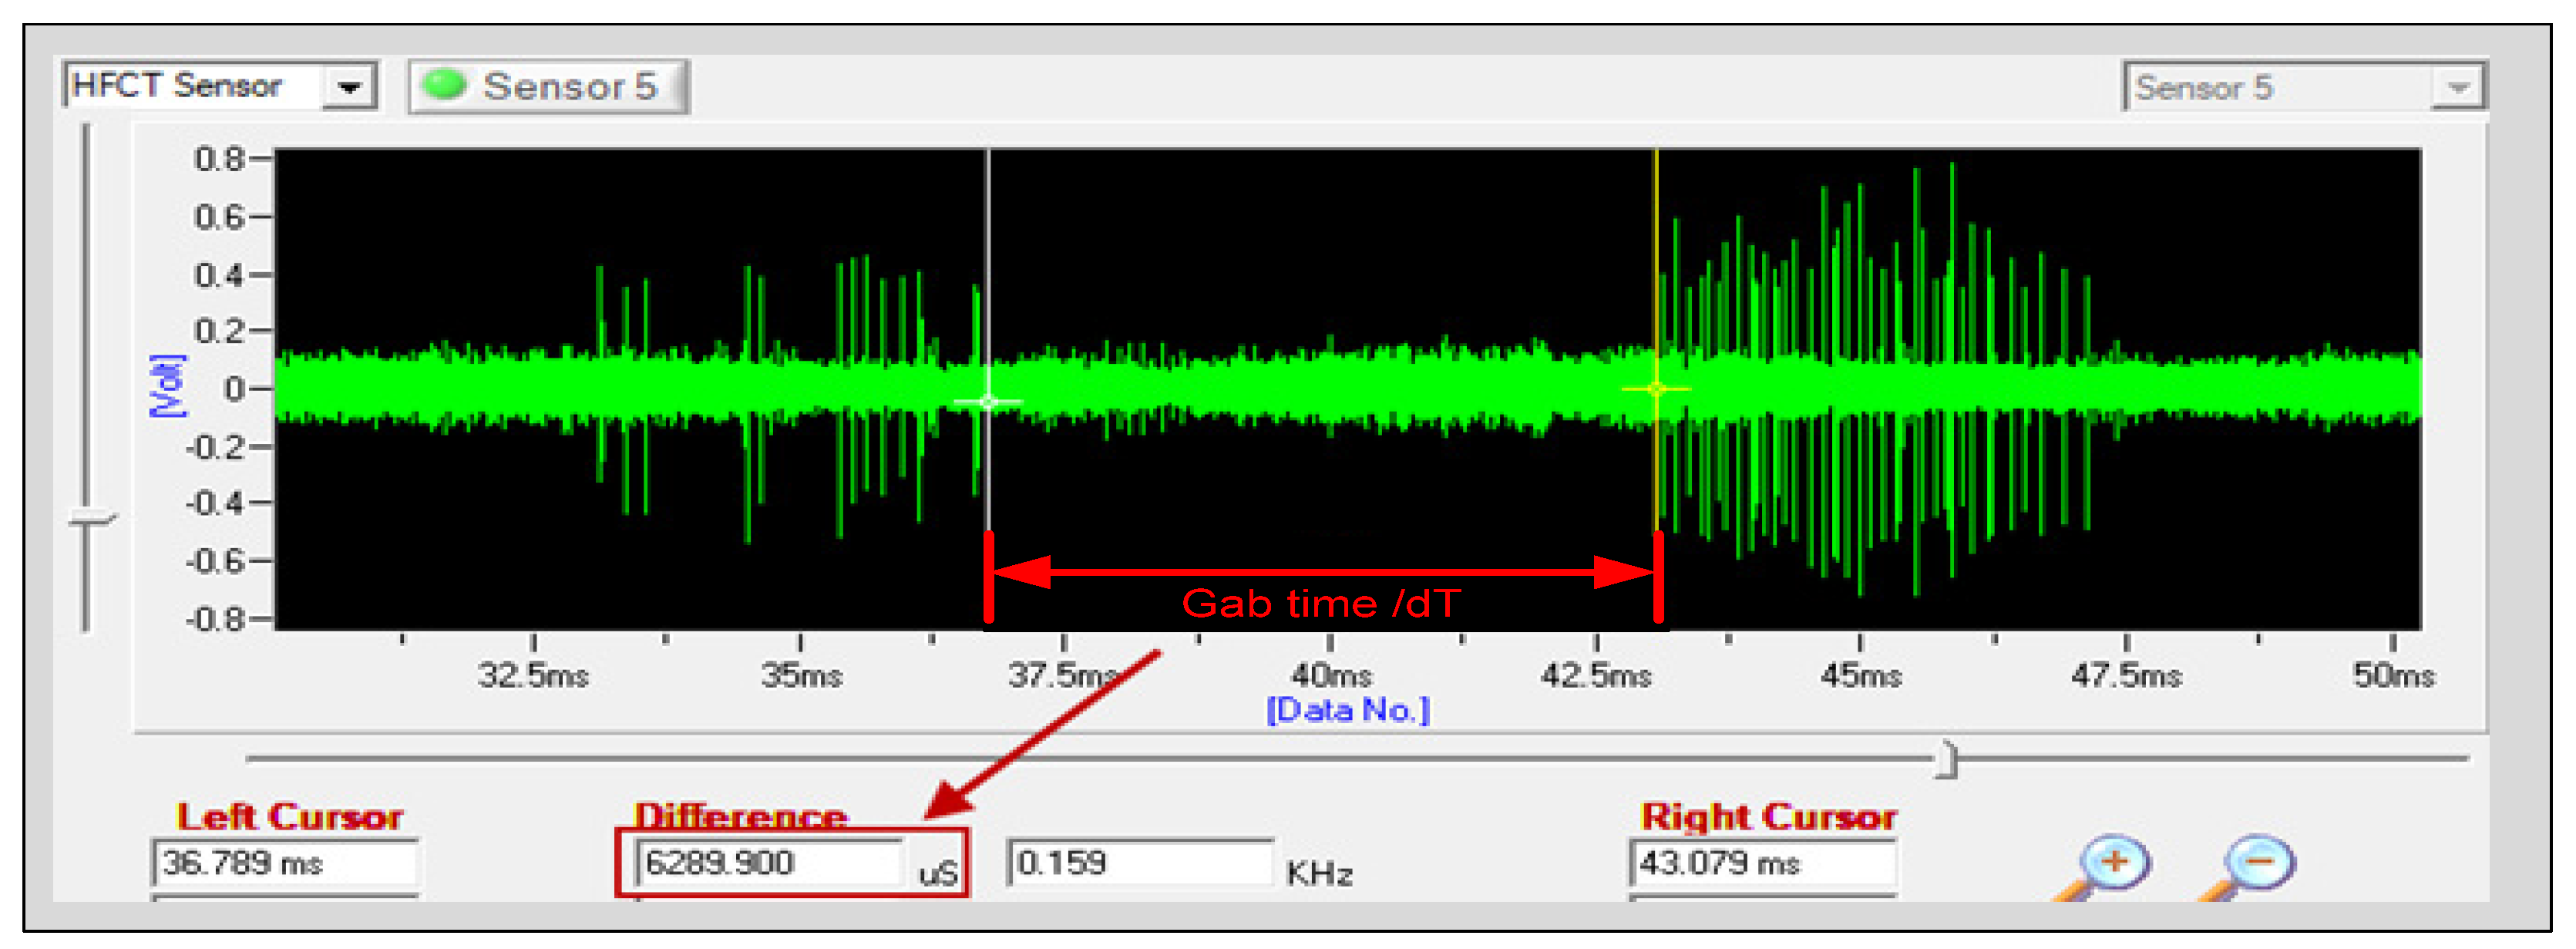
2.2. The Partial Discharge Signal and the Risk Level

Figure 2 shown the relationship between electrical PD signal and acoustic PD signal which the acoustic PD signal was compared to the electrical PD signal which is based on the real PD signal from the transformer. The electrical signal from the PD is presented in the form of a unipolar pulse, by increasing the time, the unipolar pulse can be shown to the minimum of nanoseconds level. The increase in pulse at the point of origin depends on the type of discharge. The high frequencies are steadily reduced when the signal propagates through the transformer and the pulse shape will be modified because of multiple reflections and the exciting resonant frequency of the transformer components [2,19]. Furthermore, the severity criteria for partial discharge were called “Gap time” and the unit is in milliseconds. The gap time is a space between the end of one burst and the beginning of the next burst. If the gap time has not been generated it was found that a not partial discharge. When the gab time was observed in graph, and it had over 7 ms. which cause the partial discharge was found, but identifier was small partial discharge. The lower the gab time, the greater the partial discharge incidence is, the closer it dangerously becomes to 3 ms., clearly indicating that failure is imminent. Which, burst intervals are critical information in determining the severity of PD [20,21,22].
Table 1 shows the risk level of PD according to the PowerPD reference; the gab time difference in level was presented in the results which it can confirm the determination of the condition level of PD difference. In addition, this table also recommended actions when the PD was generated. The minimum of PD condition level was acceptable when it had not been the gab time and the maximum of PD condition level was sinuous when the gab time was less 3 ms.

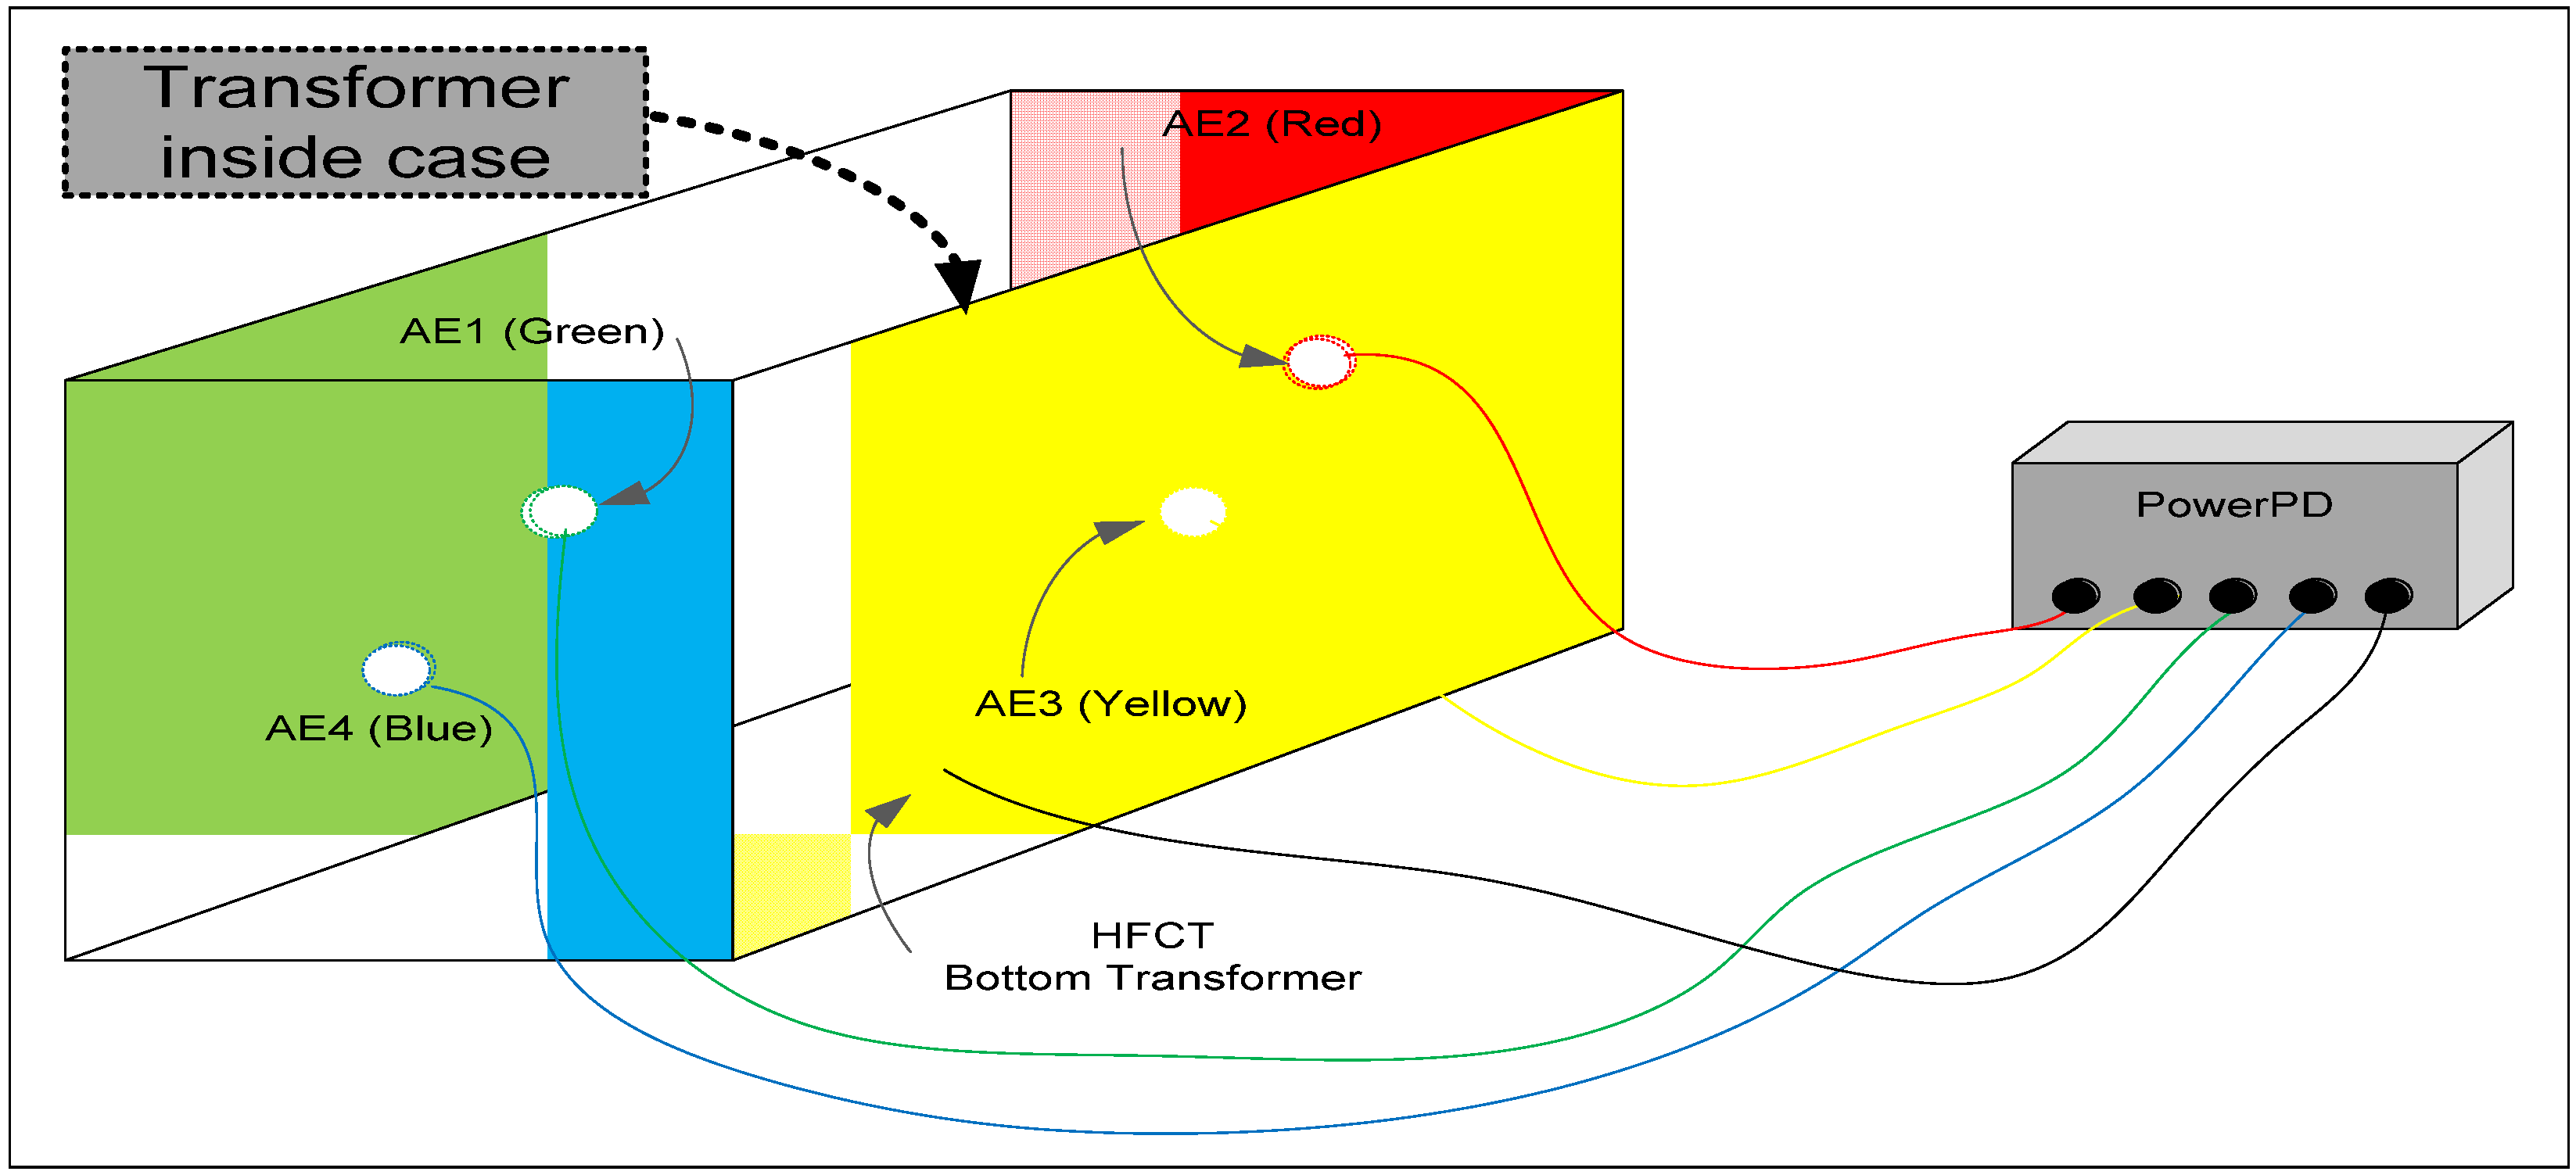
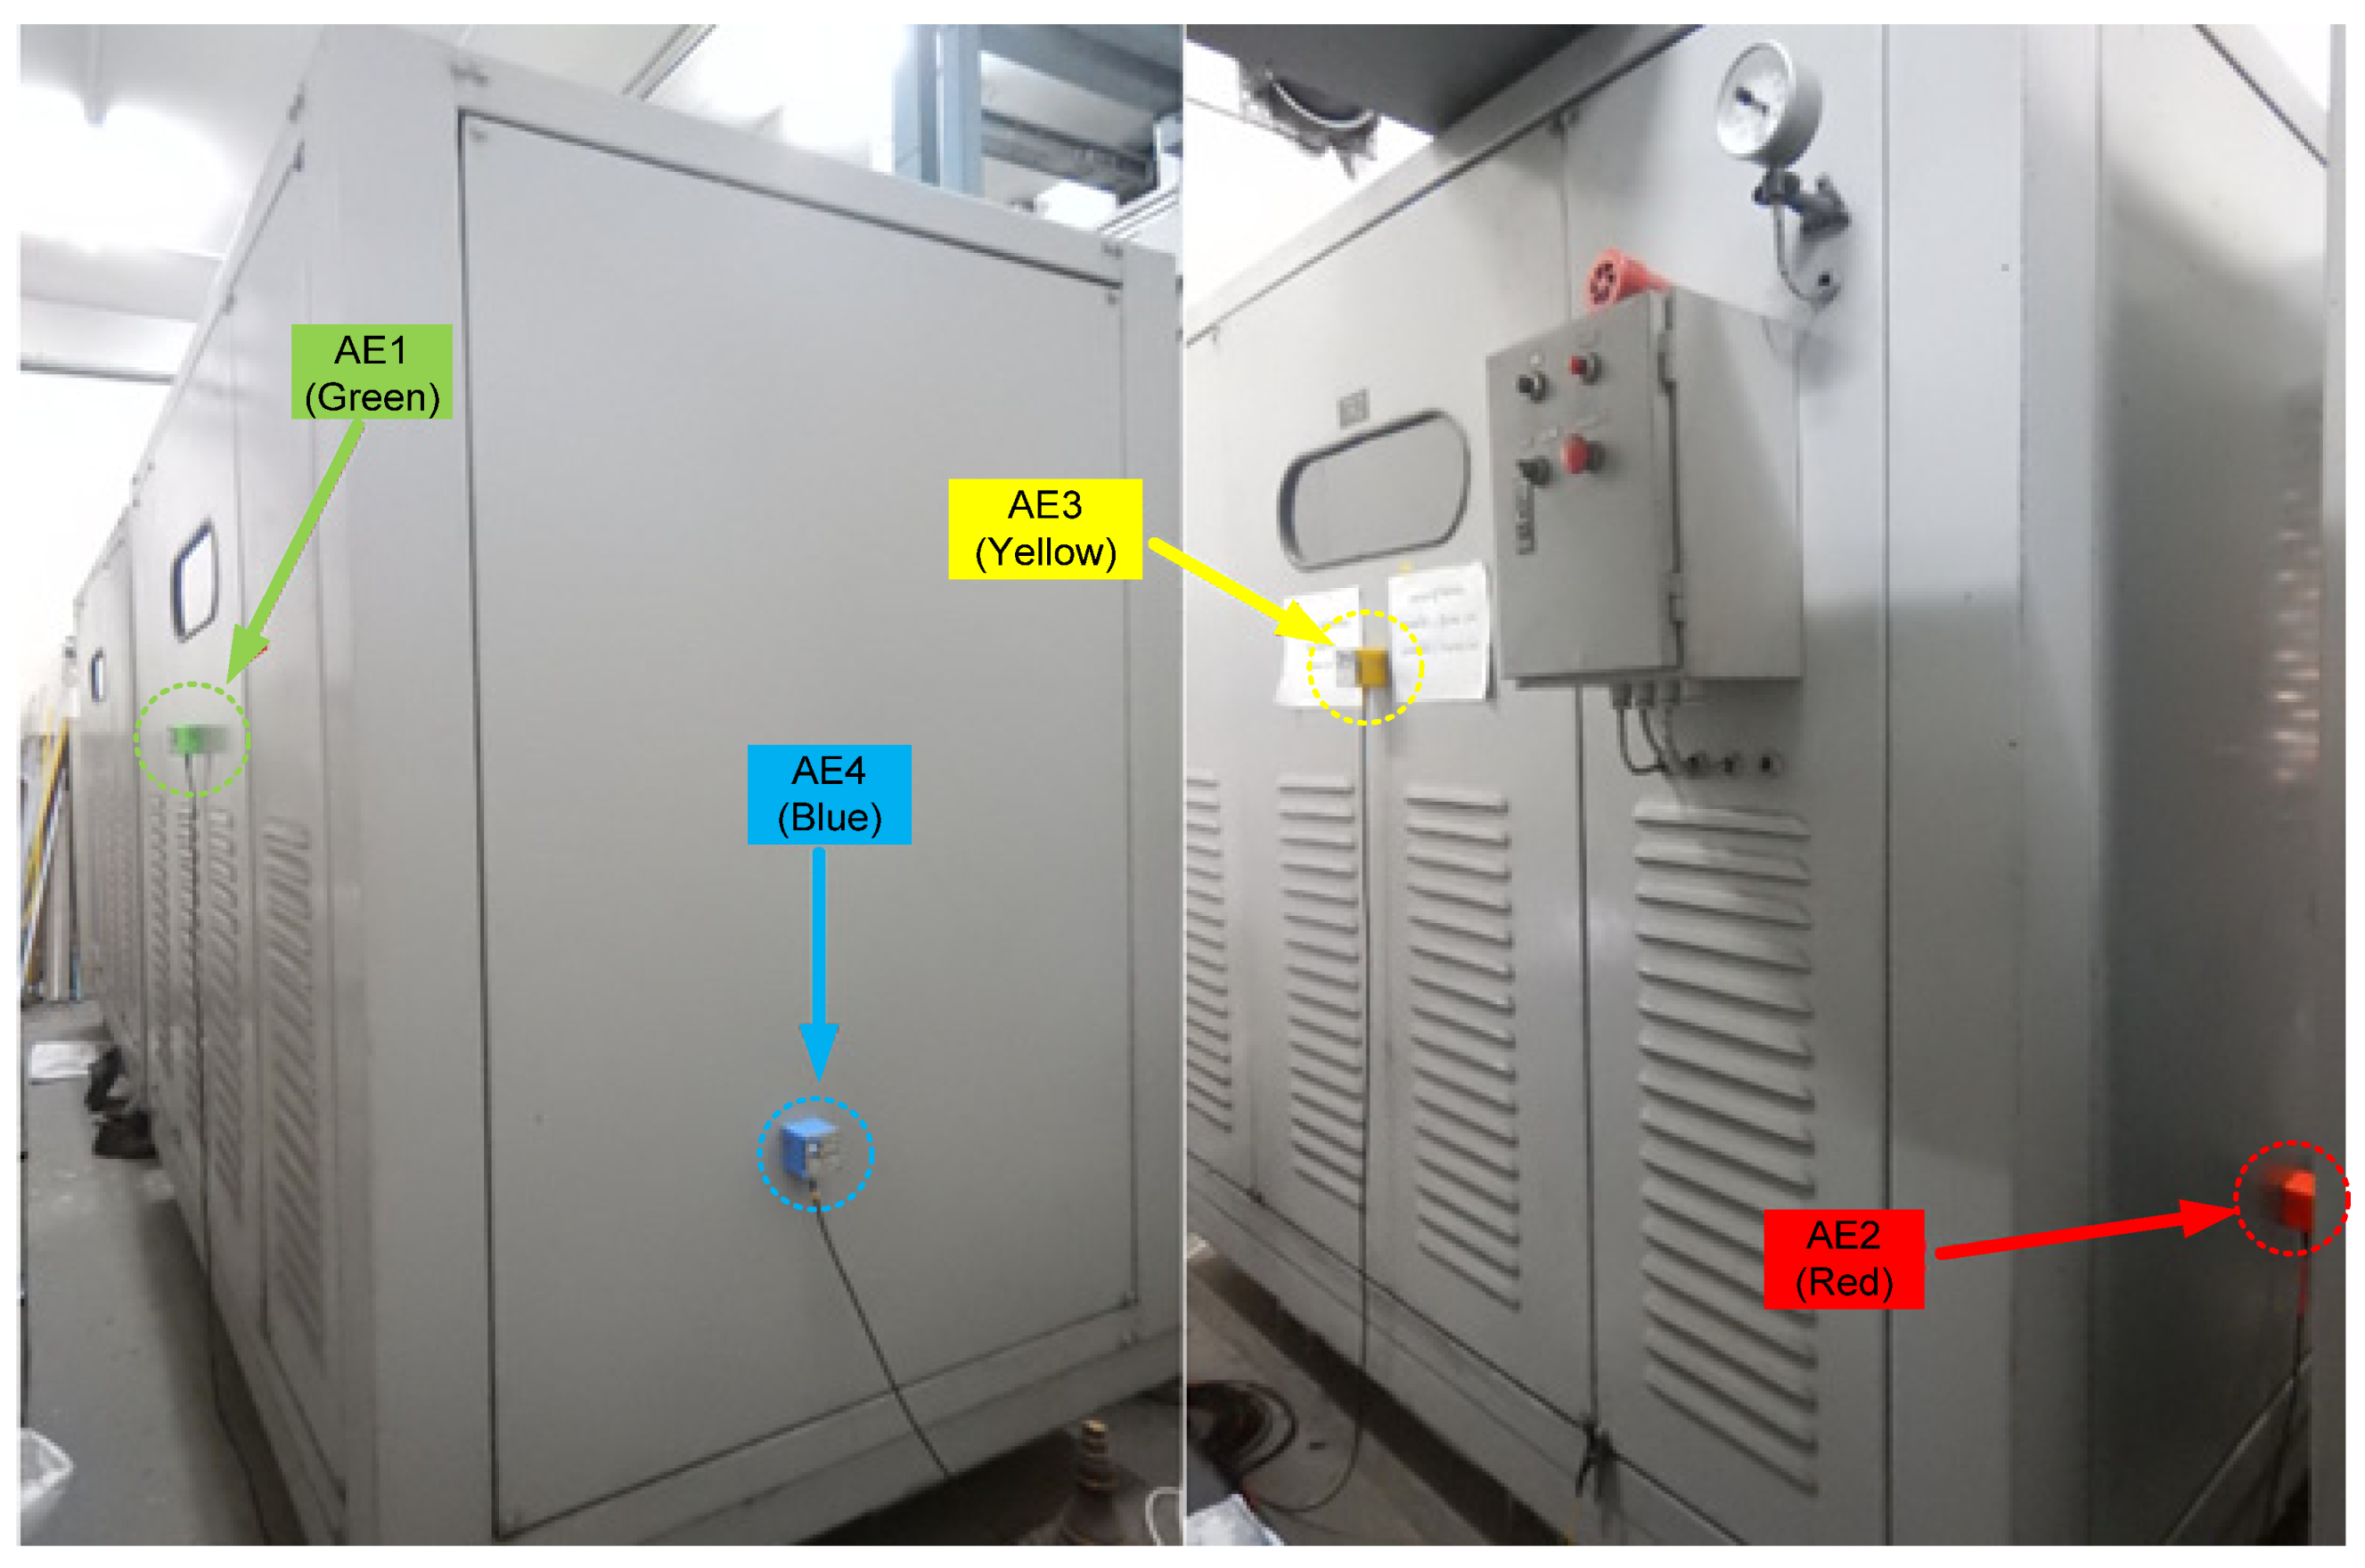
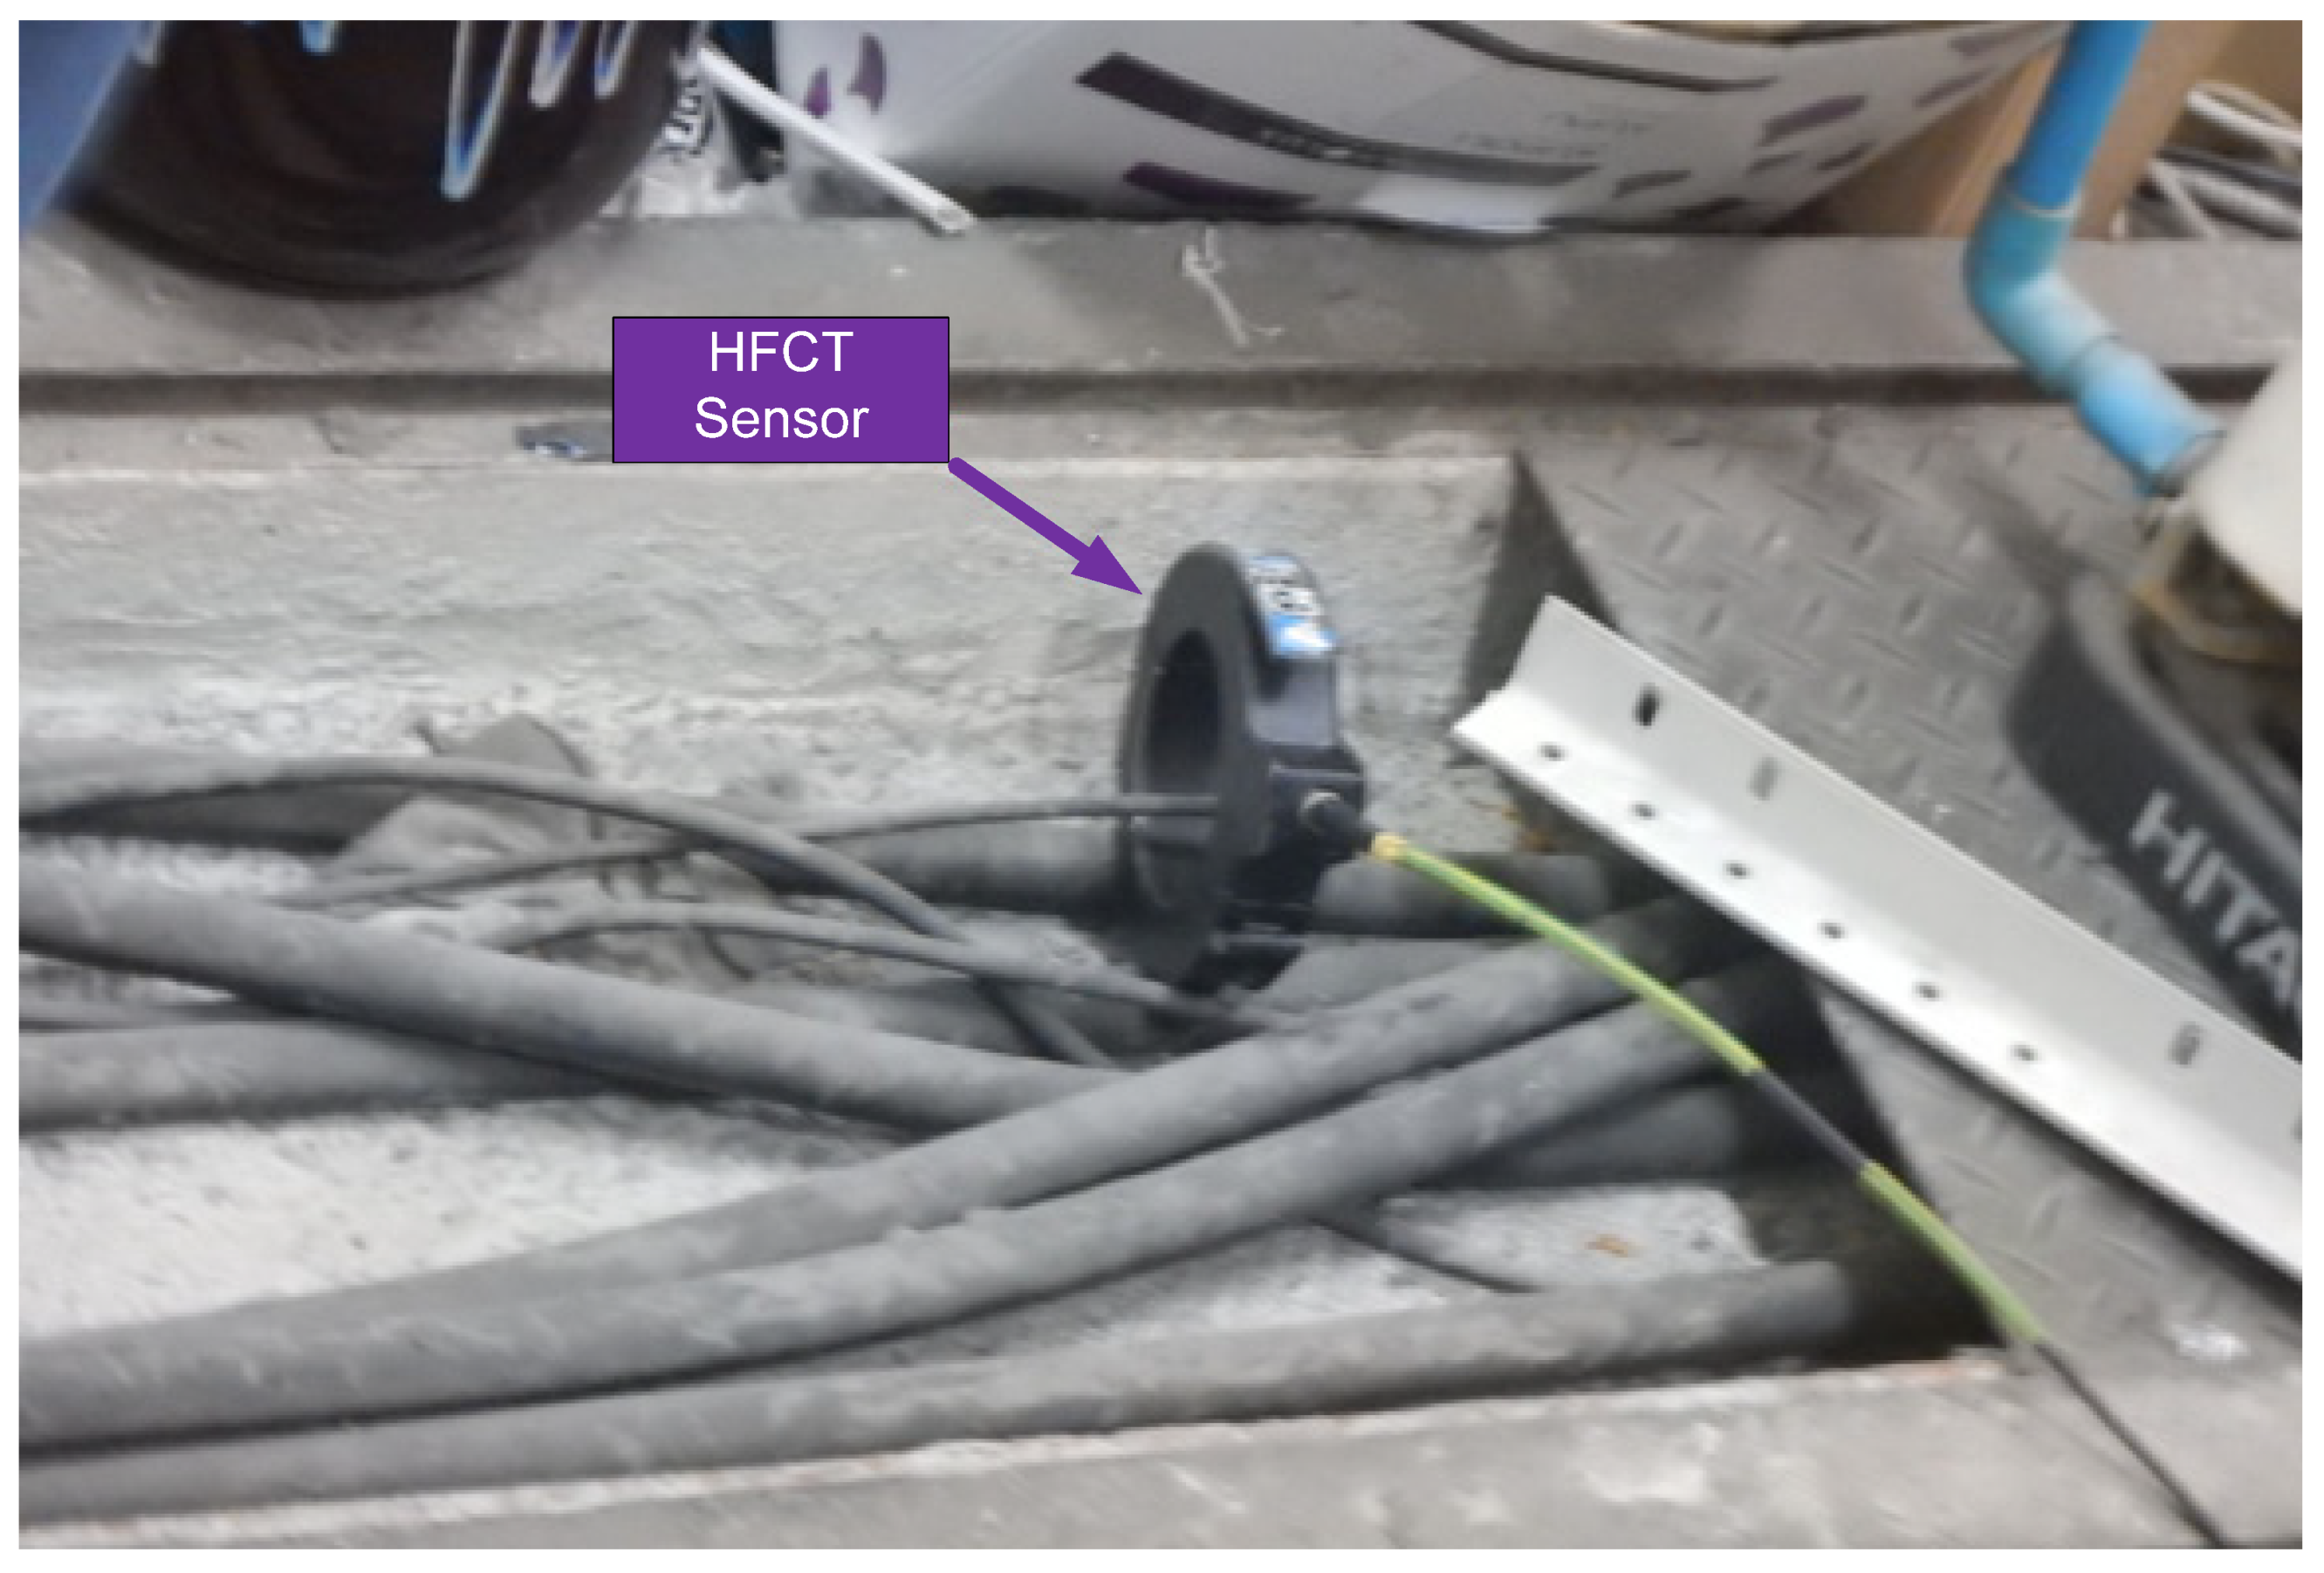
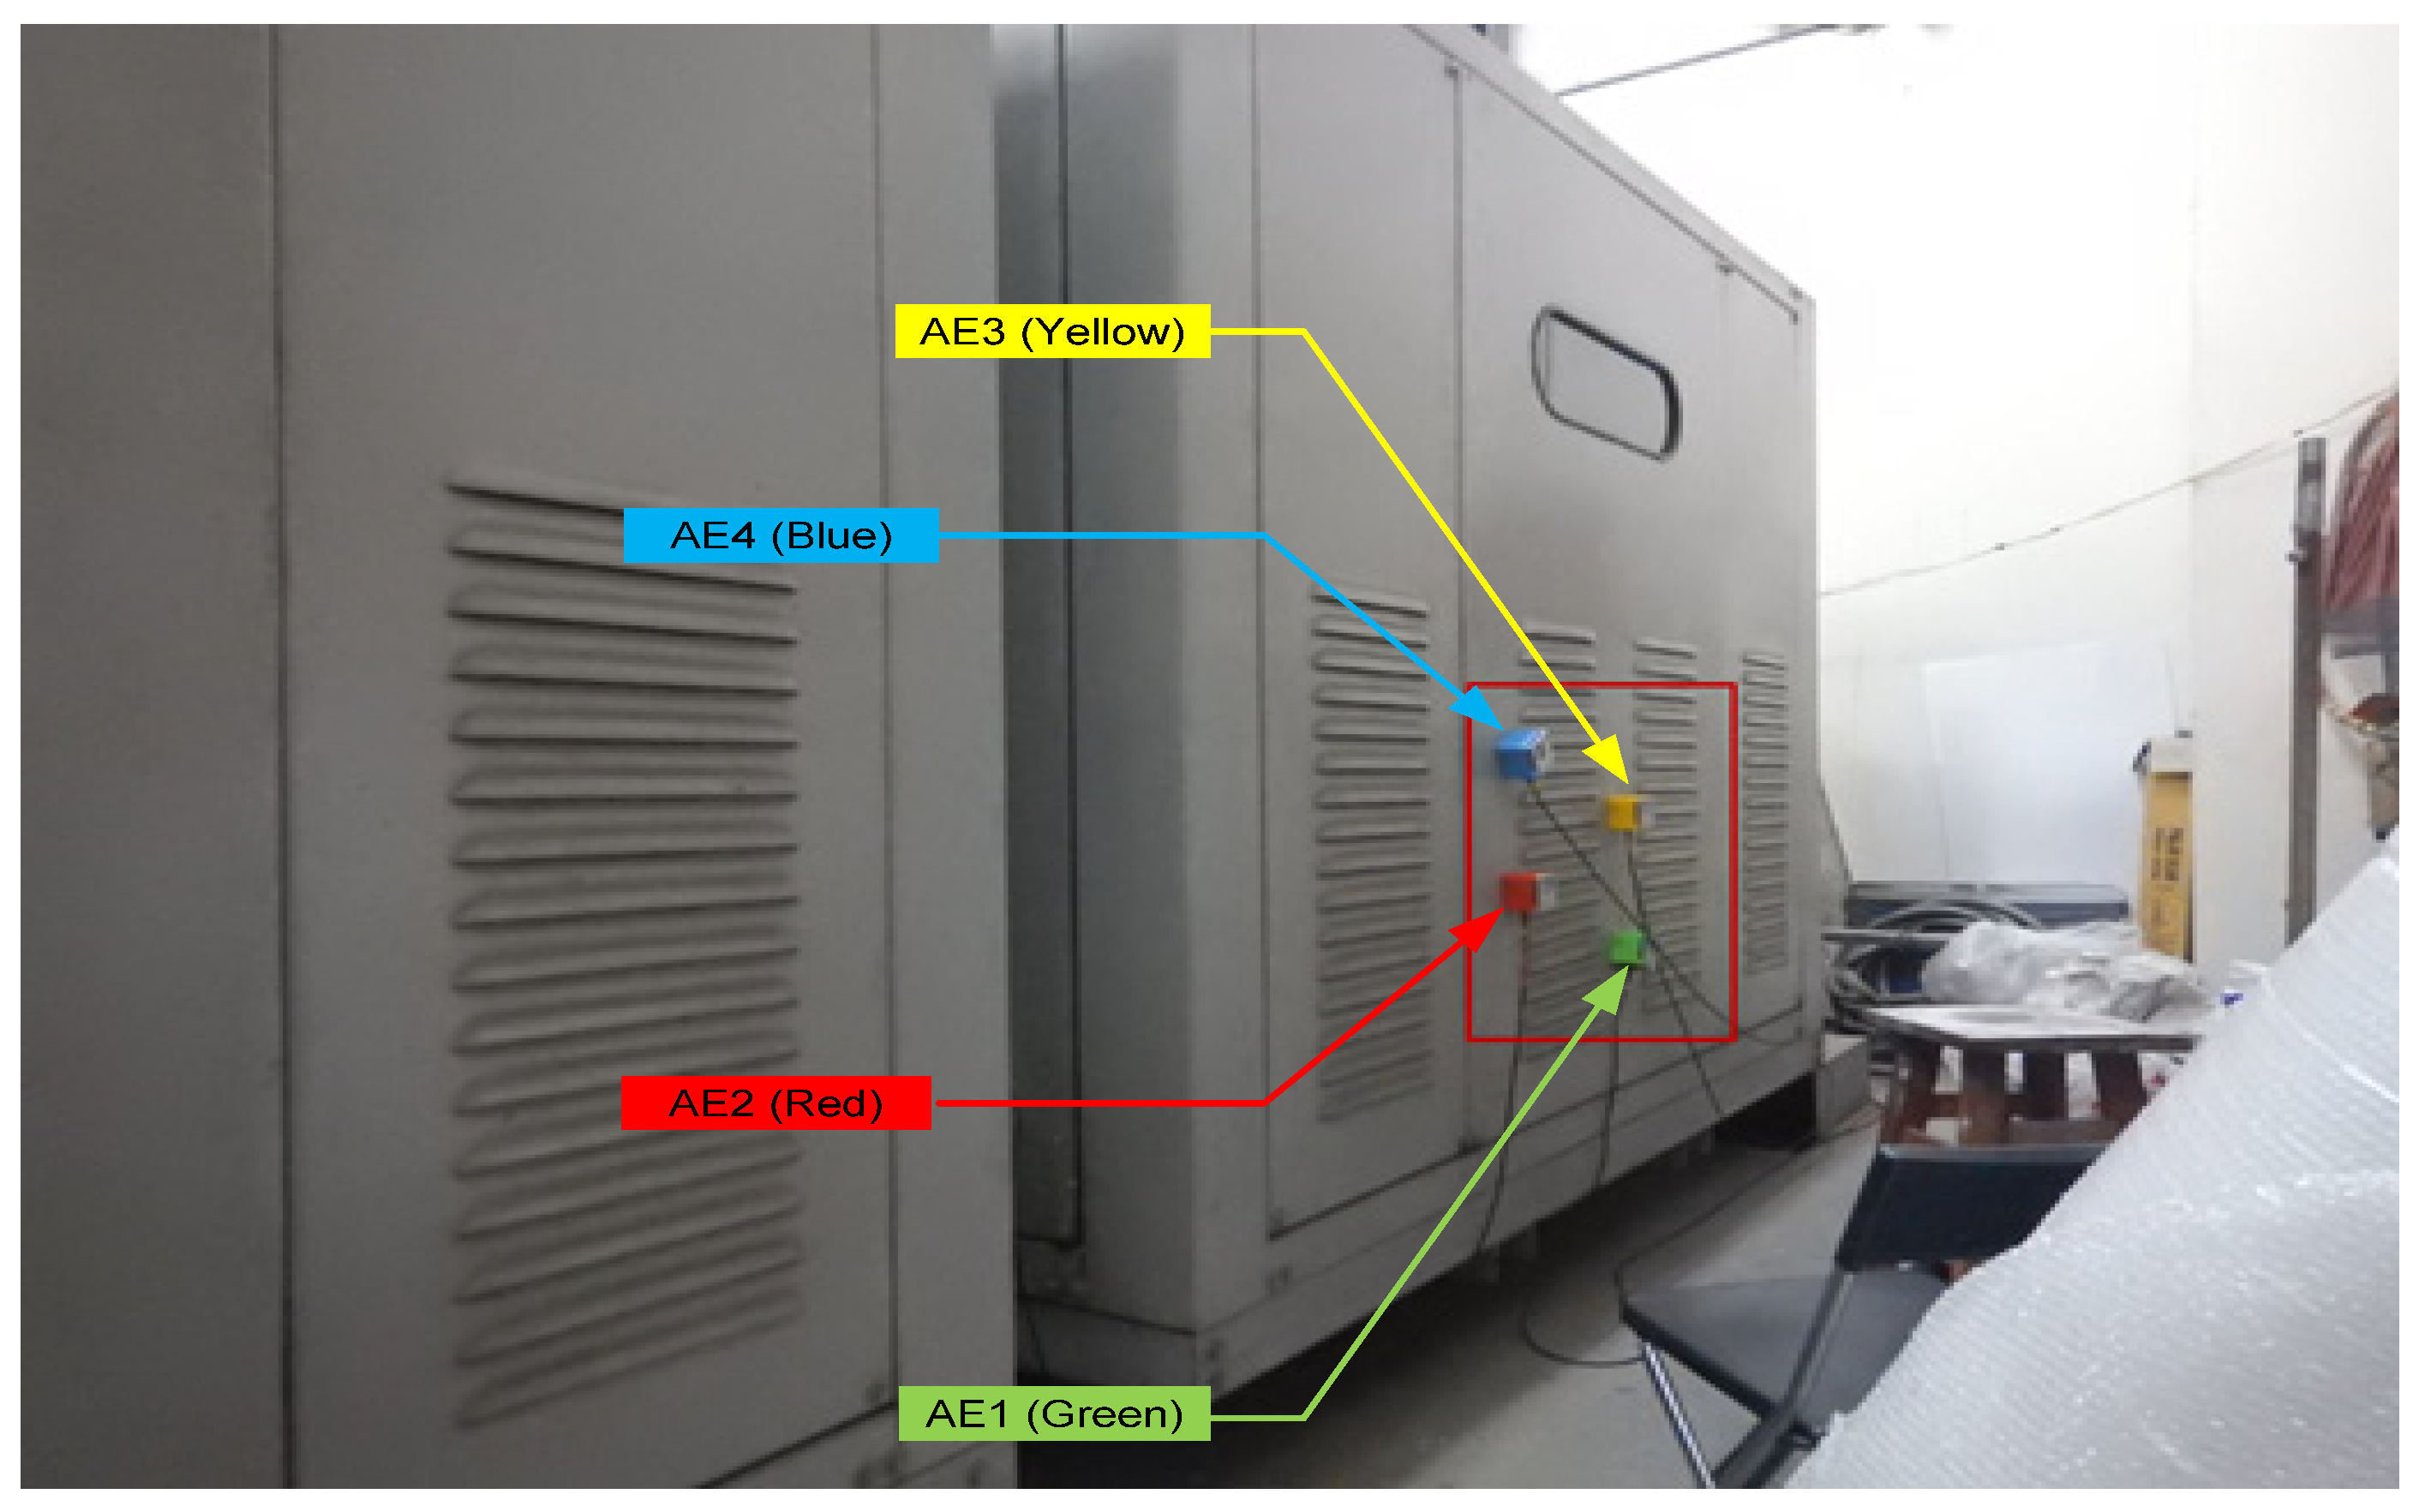
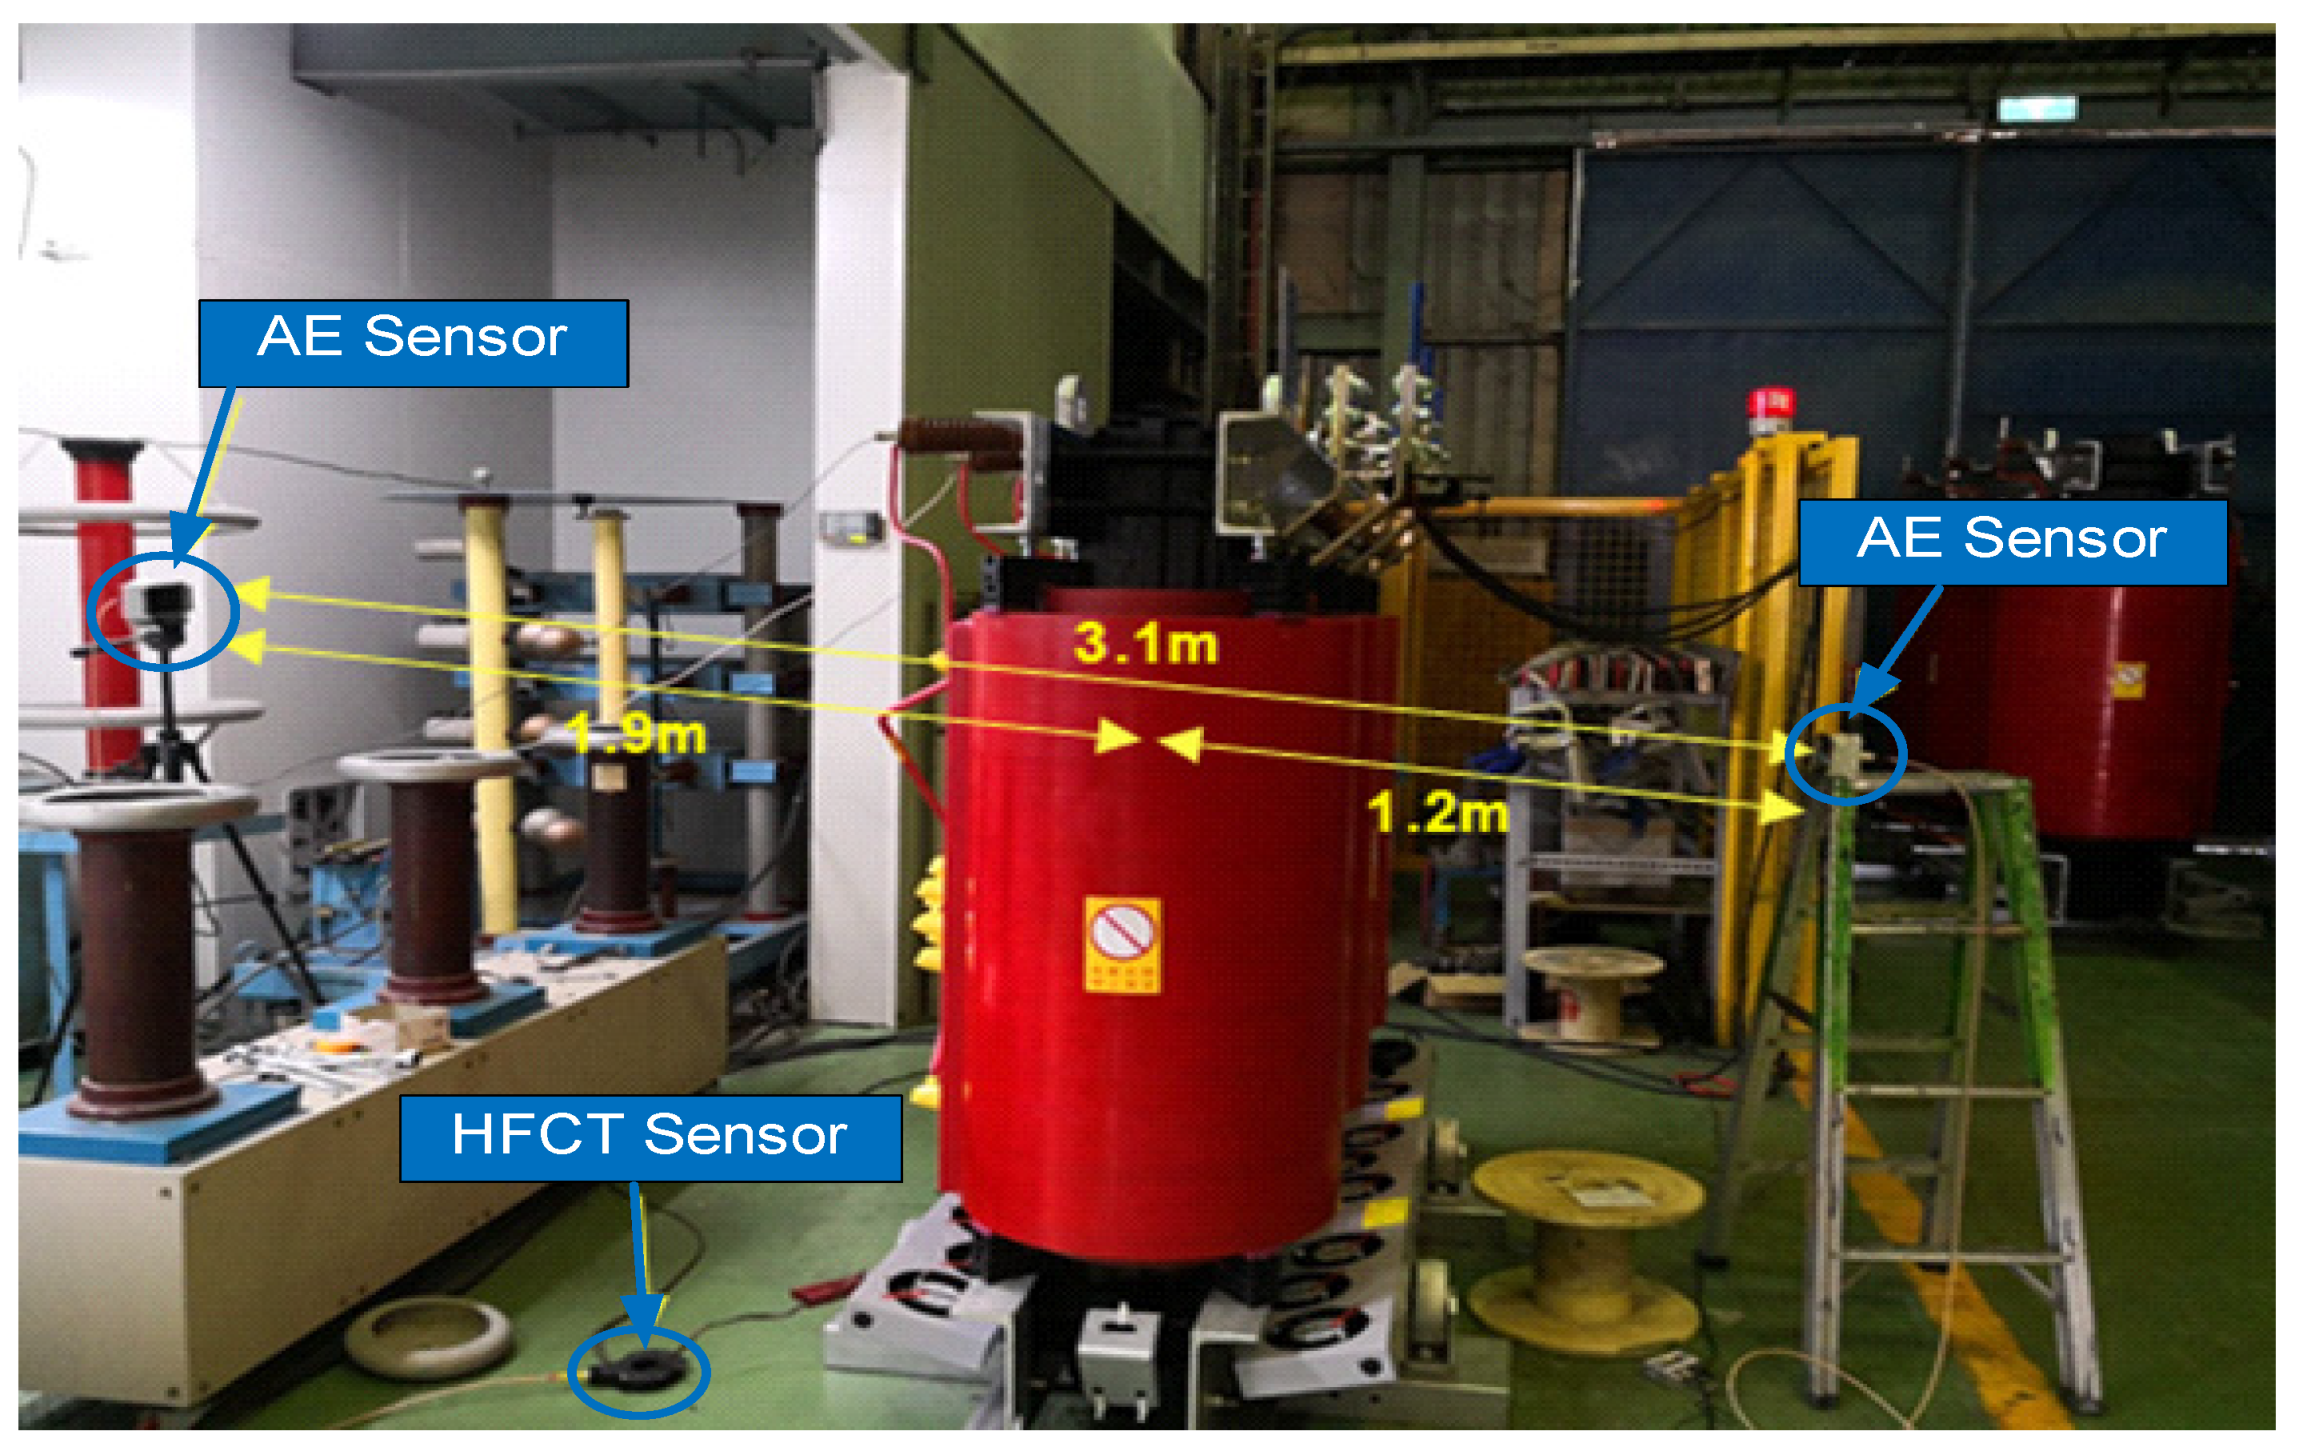
3. Experimental Setup

Figure 3 shows schematic diagram of experimental installation, in which four AE sensors were installed on the housing of the transformer. Moreover, the high-frequency current transducer (HFCT) was installed at the ground of the transformer [2,19]. However, all sensors (AE sensor and HFCT) were connected to PowerPD (PD-TP500A). The data storage device was used to view the results on a computer. Moreover, there was the special sensor, an acoustic emission sensor used that was a passive piezoelectric, with a frequency response featured by a peak at 150 kHz where it exhibited a resonance. The frequency range was fixed at 100 kHz to 450 kHz along with transformer function of 4.5–5.0 V/A. Except for disconnection, a split core ferrite was retrospectively allowed to fit in earth straps for HFCT. To provide RF shielding and improve performance in noisy environments, the HFCT was constructed with an aluminum body.
When the AE sensor No.1 (Green color) was located on the HV side of the transformer. The AE sensor No.2 (Red color) was located at the next side, which was determined by clockwise direction on the bottom of the transformer. The AE sensor No.3 (Yellow color) was located by the LV side of the transformer, which was opposite to the AE sensor No.1. The AE sensor No.4 (Blue color) was located approximately opposite to the AE sensor No.2 on the bottom position of the transformer. At the beginning, the four AE sensors and HFCT sensor connected with PowerPD and the stored data by the computer after measuring. Then, the PD pattern, time domain, and frequency were analyzed by the dedicated software.
Detection and coarse location of at least one source can be carried out by moving one or more external sensors to another location on the transformer housing. The combination method is the electrical measurement, which is improved by the confidence in the results of the PD test. When PD signals are detected, the other AE sensors will be moved to the corresponding of the AE sensors, which has detected the PD activity and is located in X-Axis and Y-Axis fashion before confirming the exact location of the PD source. The accurate position of the PD source can be determined by the relative time of the acoustic signal through each sensor. This is especially the case when PD bursts were detected from AE sensors and HFCT sensors; it could be concluded that the PD obviously occurred within the transformer.
To perform a systematic study, the PD was actually measured by a cast-resin transformer while it’s still working through the unusual measurement techniques. In addition, the essential techniques were experimentally used to locate the PD on these transformers. This research, the transformer 24 kV and 1000 kVA in 1991 at a hotel in Bangkok, Thailand was studied. However, the transformer must be maintained for at least 4 years, which has not been maintained for this transformer. In this study, cast resin transformers were tested through the combination of AE and HFCT detection techniques. Acoustic Emission Sensor and High-frequency current transformers techniques were used experimentally for measurements and analysis with PowerPD. In addition, cast resin transformers were tested again by removing the housing of the transformer to confirm the PD measurement results at the location of occurrence and illustrated. The surface and inside the insulation of cast resin transformer shows the insulation condition from effect of PD.

4. Results and Discussion

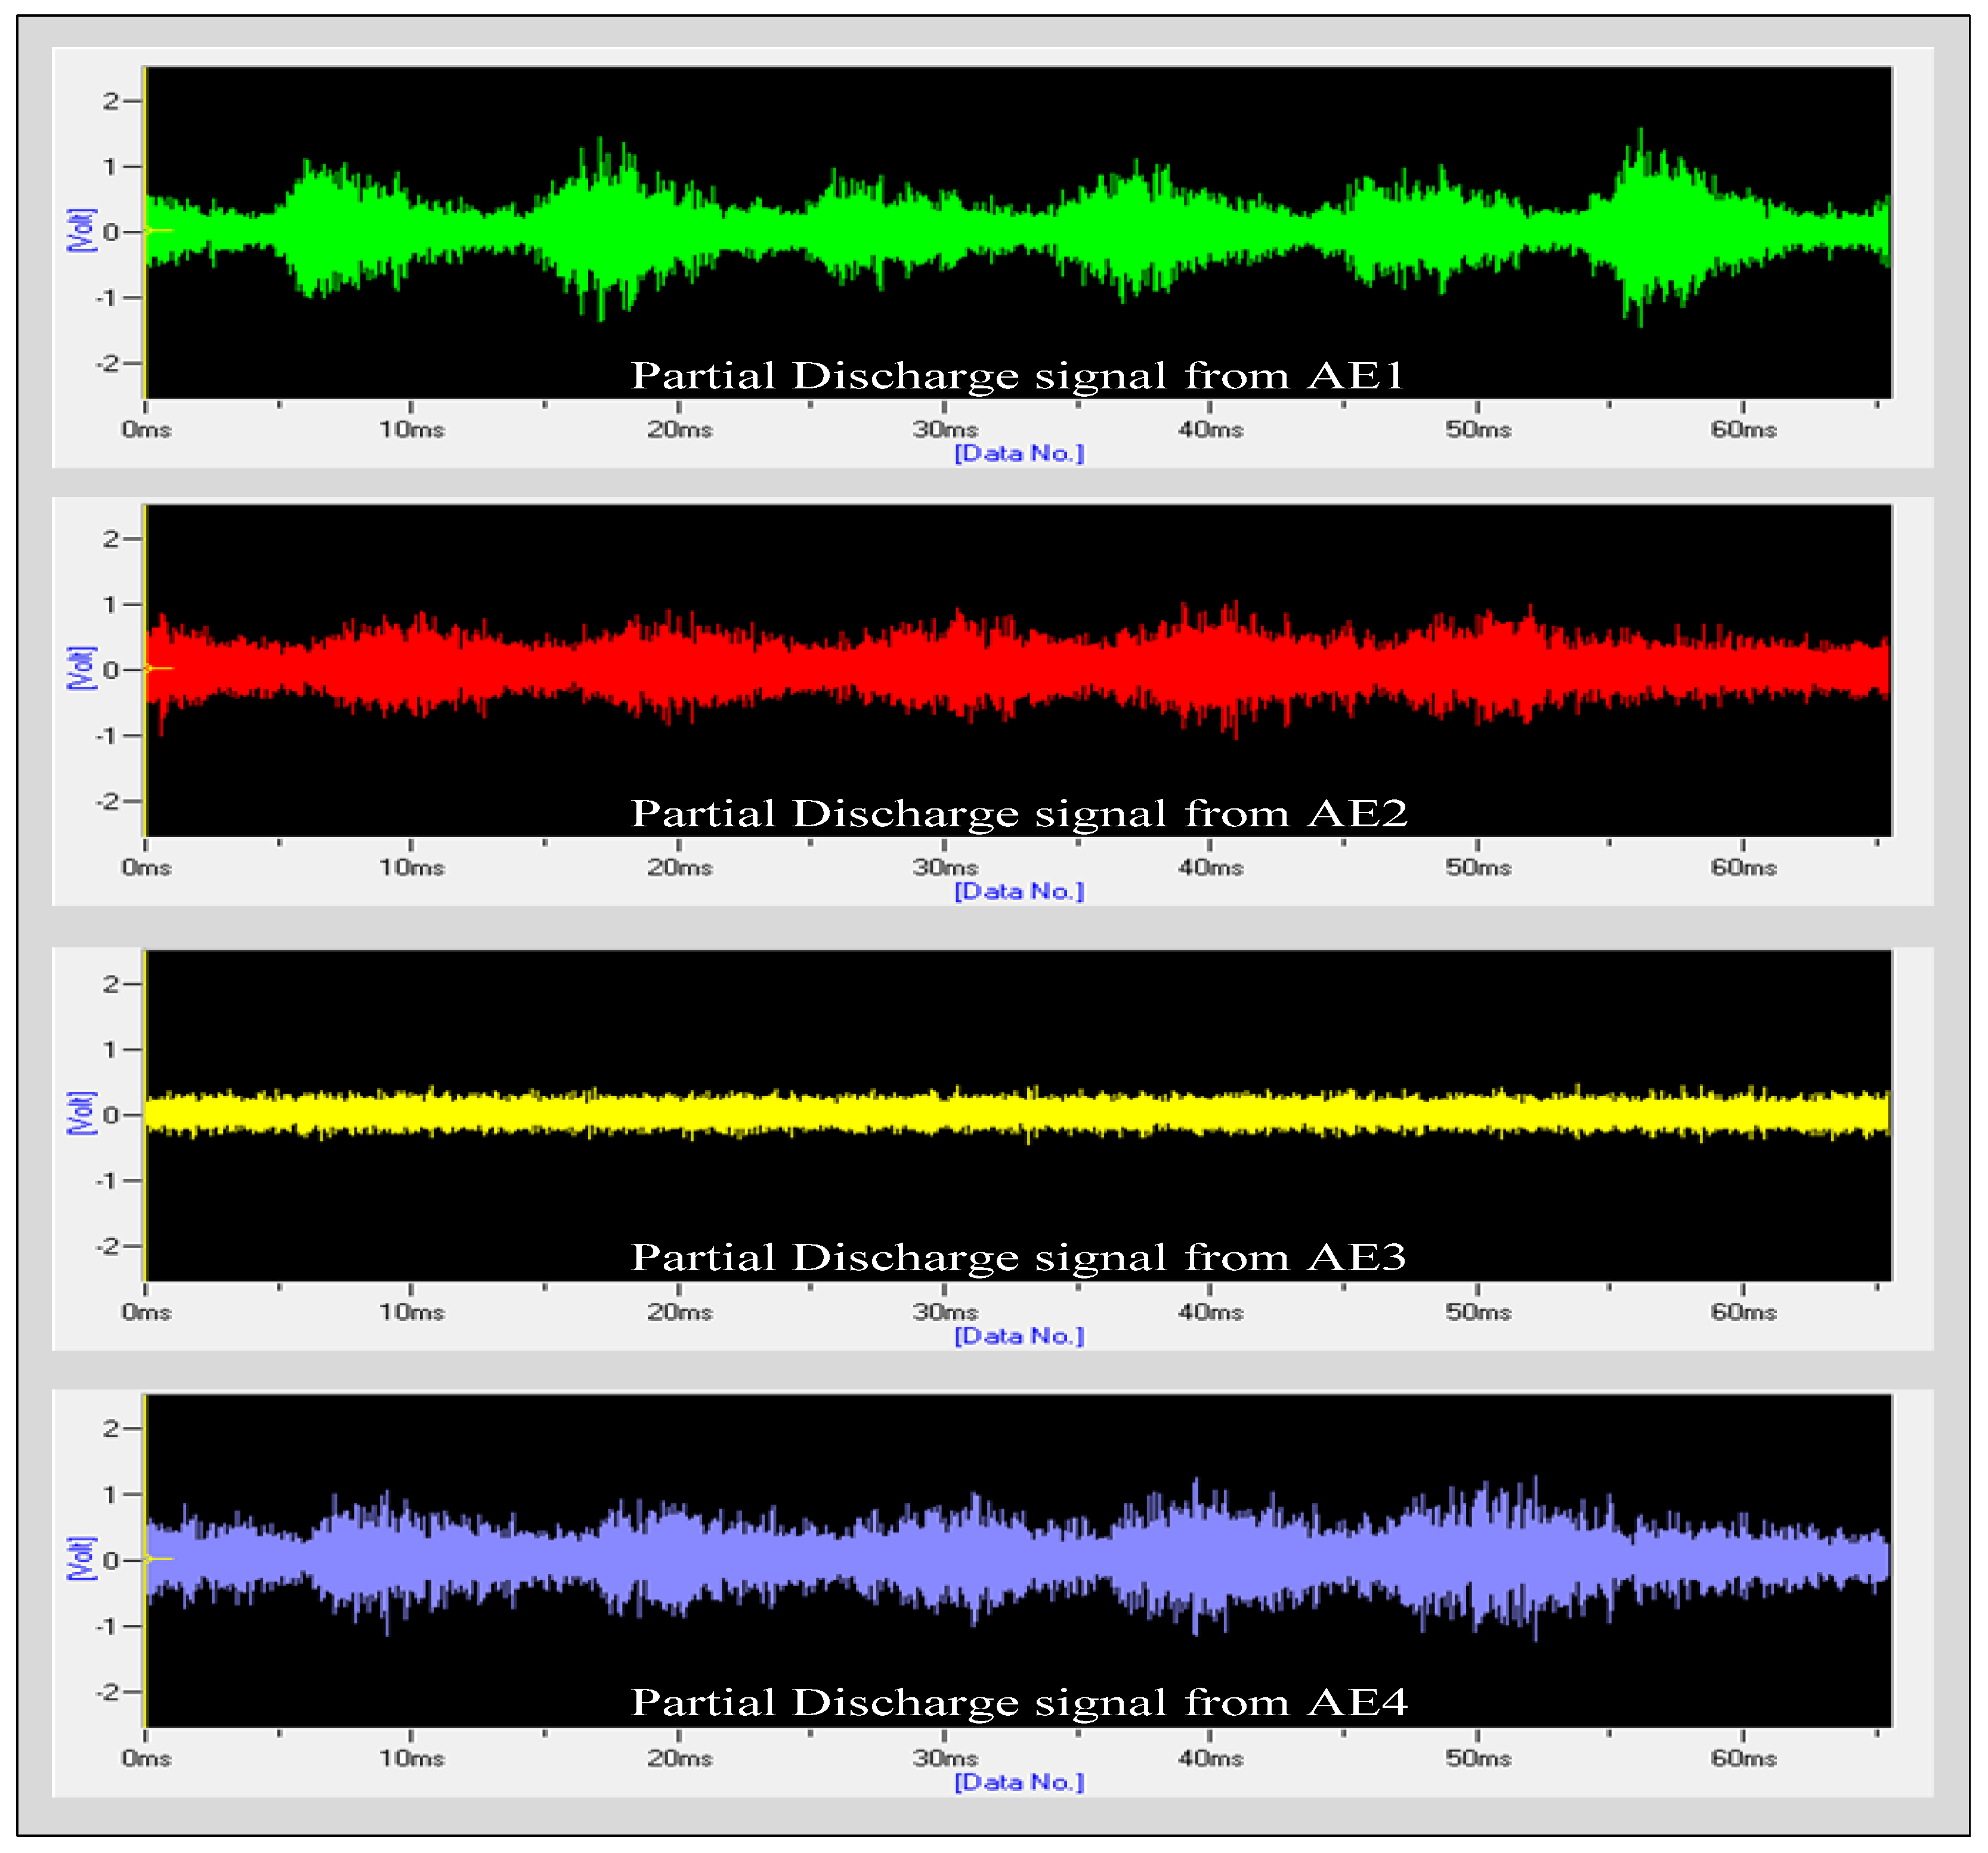
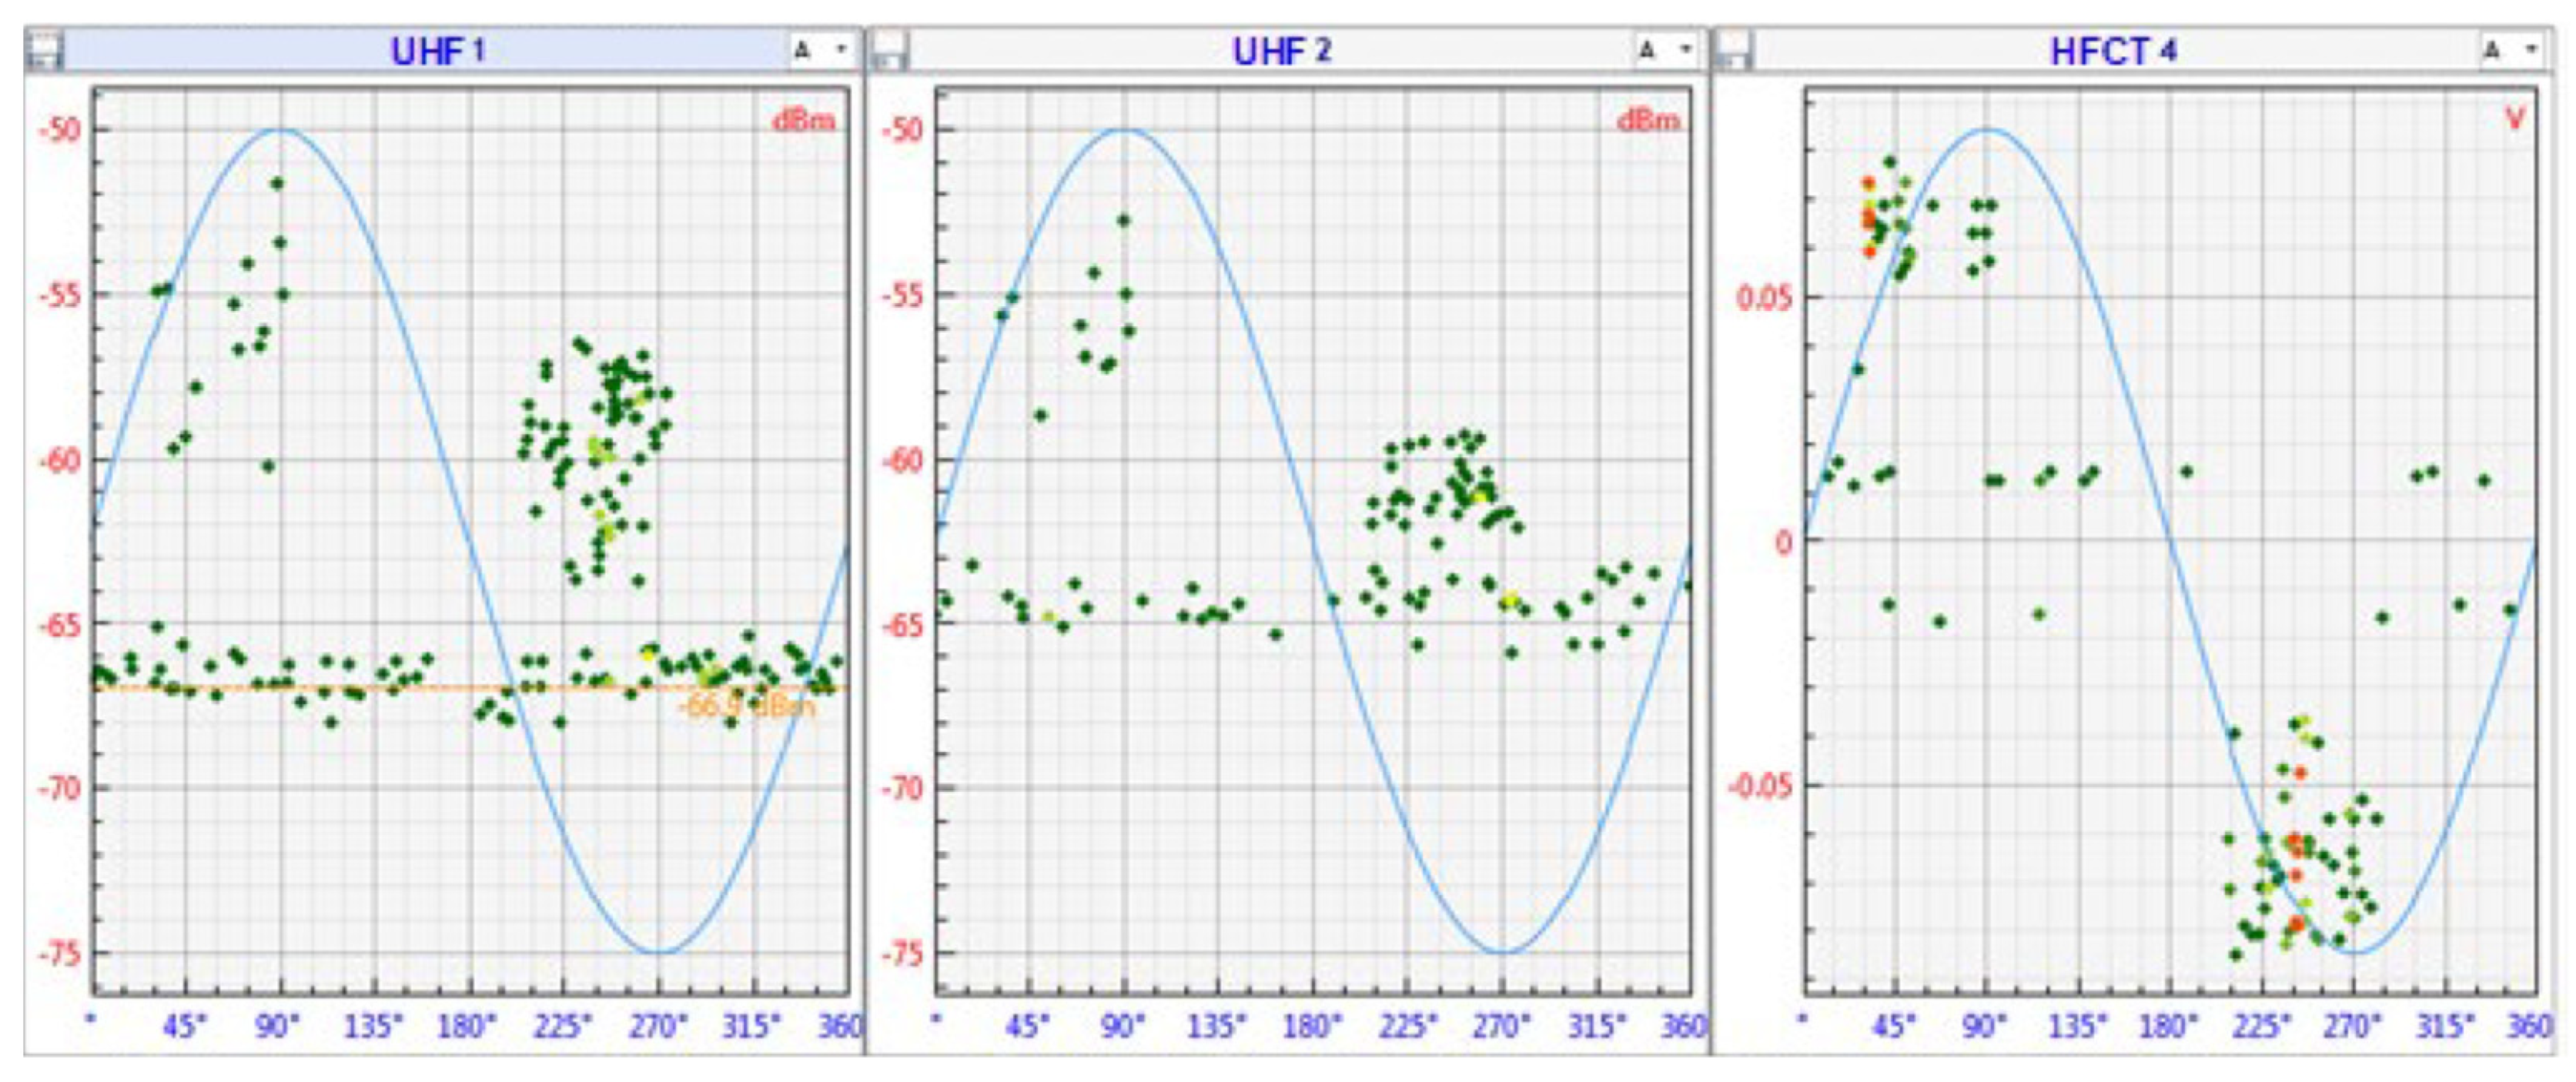
4.1. The Primary Examination of Partial Discharge

As the first step, the four AE sensors (AE1 to AE4) were installed with housing of transformer as follows from Figure 3. for detected PD signal by PowerPD software. Figure 4 shows a real installation of Acoustic Emission Sensers with 4 positions. The PD signal from PowerPD software showed four signals with different colors (green, red, yellow, and blue) at the position of AE sensor was installed. Figure 5 shows the PD signal of each AE sensor detected with AE1, AE2, AE3, and AE4, in which it was found that the PD signal from PowerPD software was green, red, yellow, and blue color, respectively.
Figure 5 shows the PD signal waveforms obtained from each sensor in four directions of installation. Usually, the location of the PD by sound waves is successful only when the PD waveform has a strong amplitude and repetitive rate with the AE sensor detects at least three channels. It was observed that the PD signal by AE 3 (yellow color) was rather steady; ostensibly that, the amplitude of AE3 was minimum than AE1, AE2 and AE4. The amplitude of AE3 was minimum as the results of PD signal detection were low, which AE3 was installed with low side of this transformer and expected, the PD should not be caused from this side. It was found that the PD signal of AE1, AE2 and AE3 was unsteady, which when compared three signals, it was observed that the amplitude of AE 2 (red color) was lower than AE1 and AE4. The PD should not be caused from the AE2 installation side due to the PD signal was minimum. However, the PD signal of AE1 and AE4 cannot judge which signal was less than the others due to the fact that they have similar signals. Therefore, it is necessary to combine the signals into the same figure for easy analysis, which follows in Figure 6.
Figure 6 shows comparison of the PD signal waveform with AE1–AE4, it was observed that the PD signal by AE1 (green color) was higher than AE4 (blue color) from peak amplitude. The AE1 sensor was installed on the high side of transformer for detecting the PD signal in this experimental, while the AE4 sensor was installed on the left side of transformer when seen from high side of transformer. When the level of PD signal of AE1 was higher than AE4 with significance, thus, high possibility that the PD was generated from high side transformer which must be detail examined in next step.
Figure 7 shows installation of HFCT at ground wire of cast-resin transformer, which the HFCT sensor was sensor number 5 at connect to PowerPD software for shown PD signal waveform. The HFCT sensor was connected to PowerPD due to it was easy to evaluate of condition level of PD with gab time can be easily seen. Figure 8 shows the PD signal waveform from HFCT sensor, it was observed that the gab time/dt was about 8 ms. Where, the signal was the electromagnetic wave signal when characterized by the discharge on the surface of the insulation (Surface Discharge) [11,23,24]. From Table 1, this data was evaluated for condition level at small PD due to gab time/dt > 7 ms. whereas this data must be examined in the next step when the AE sensor was moved to investigate the exact position of PD.

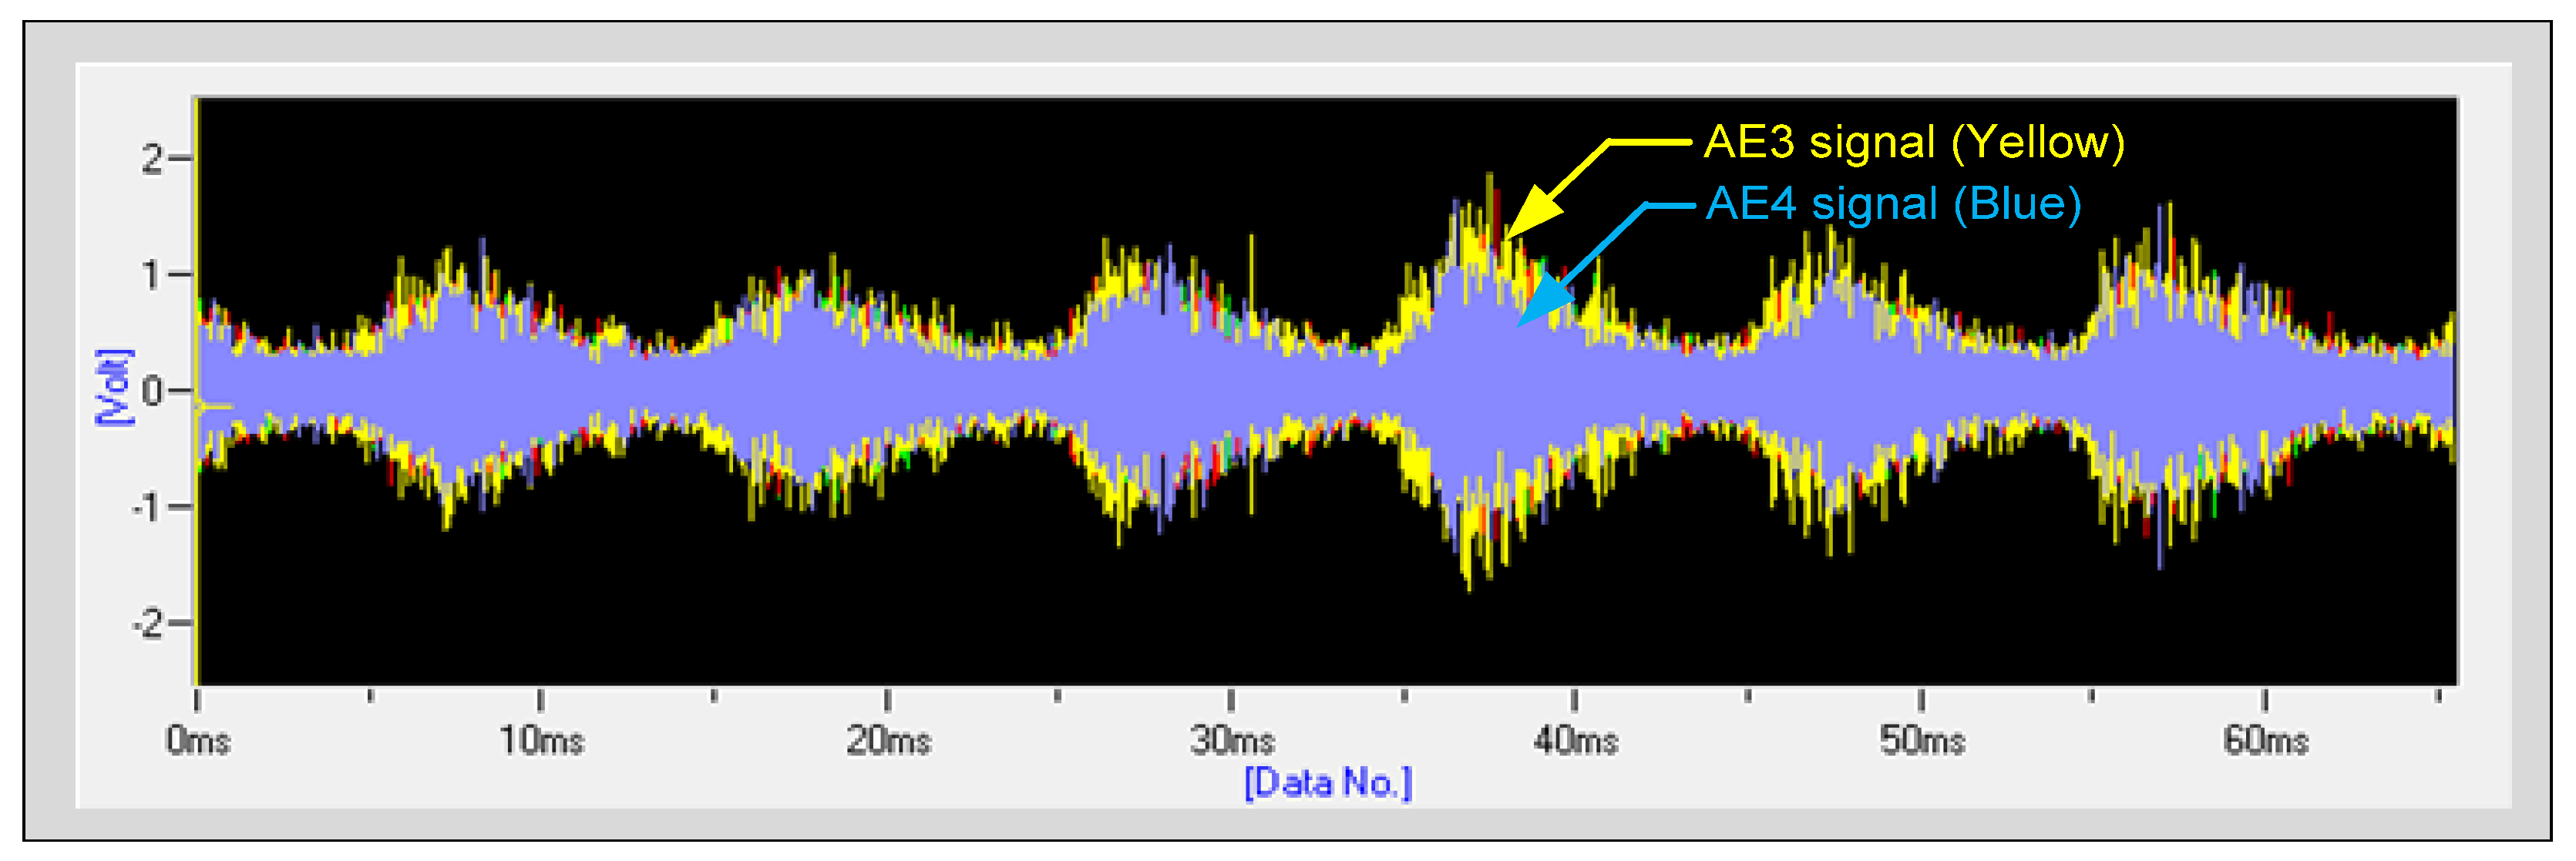
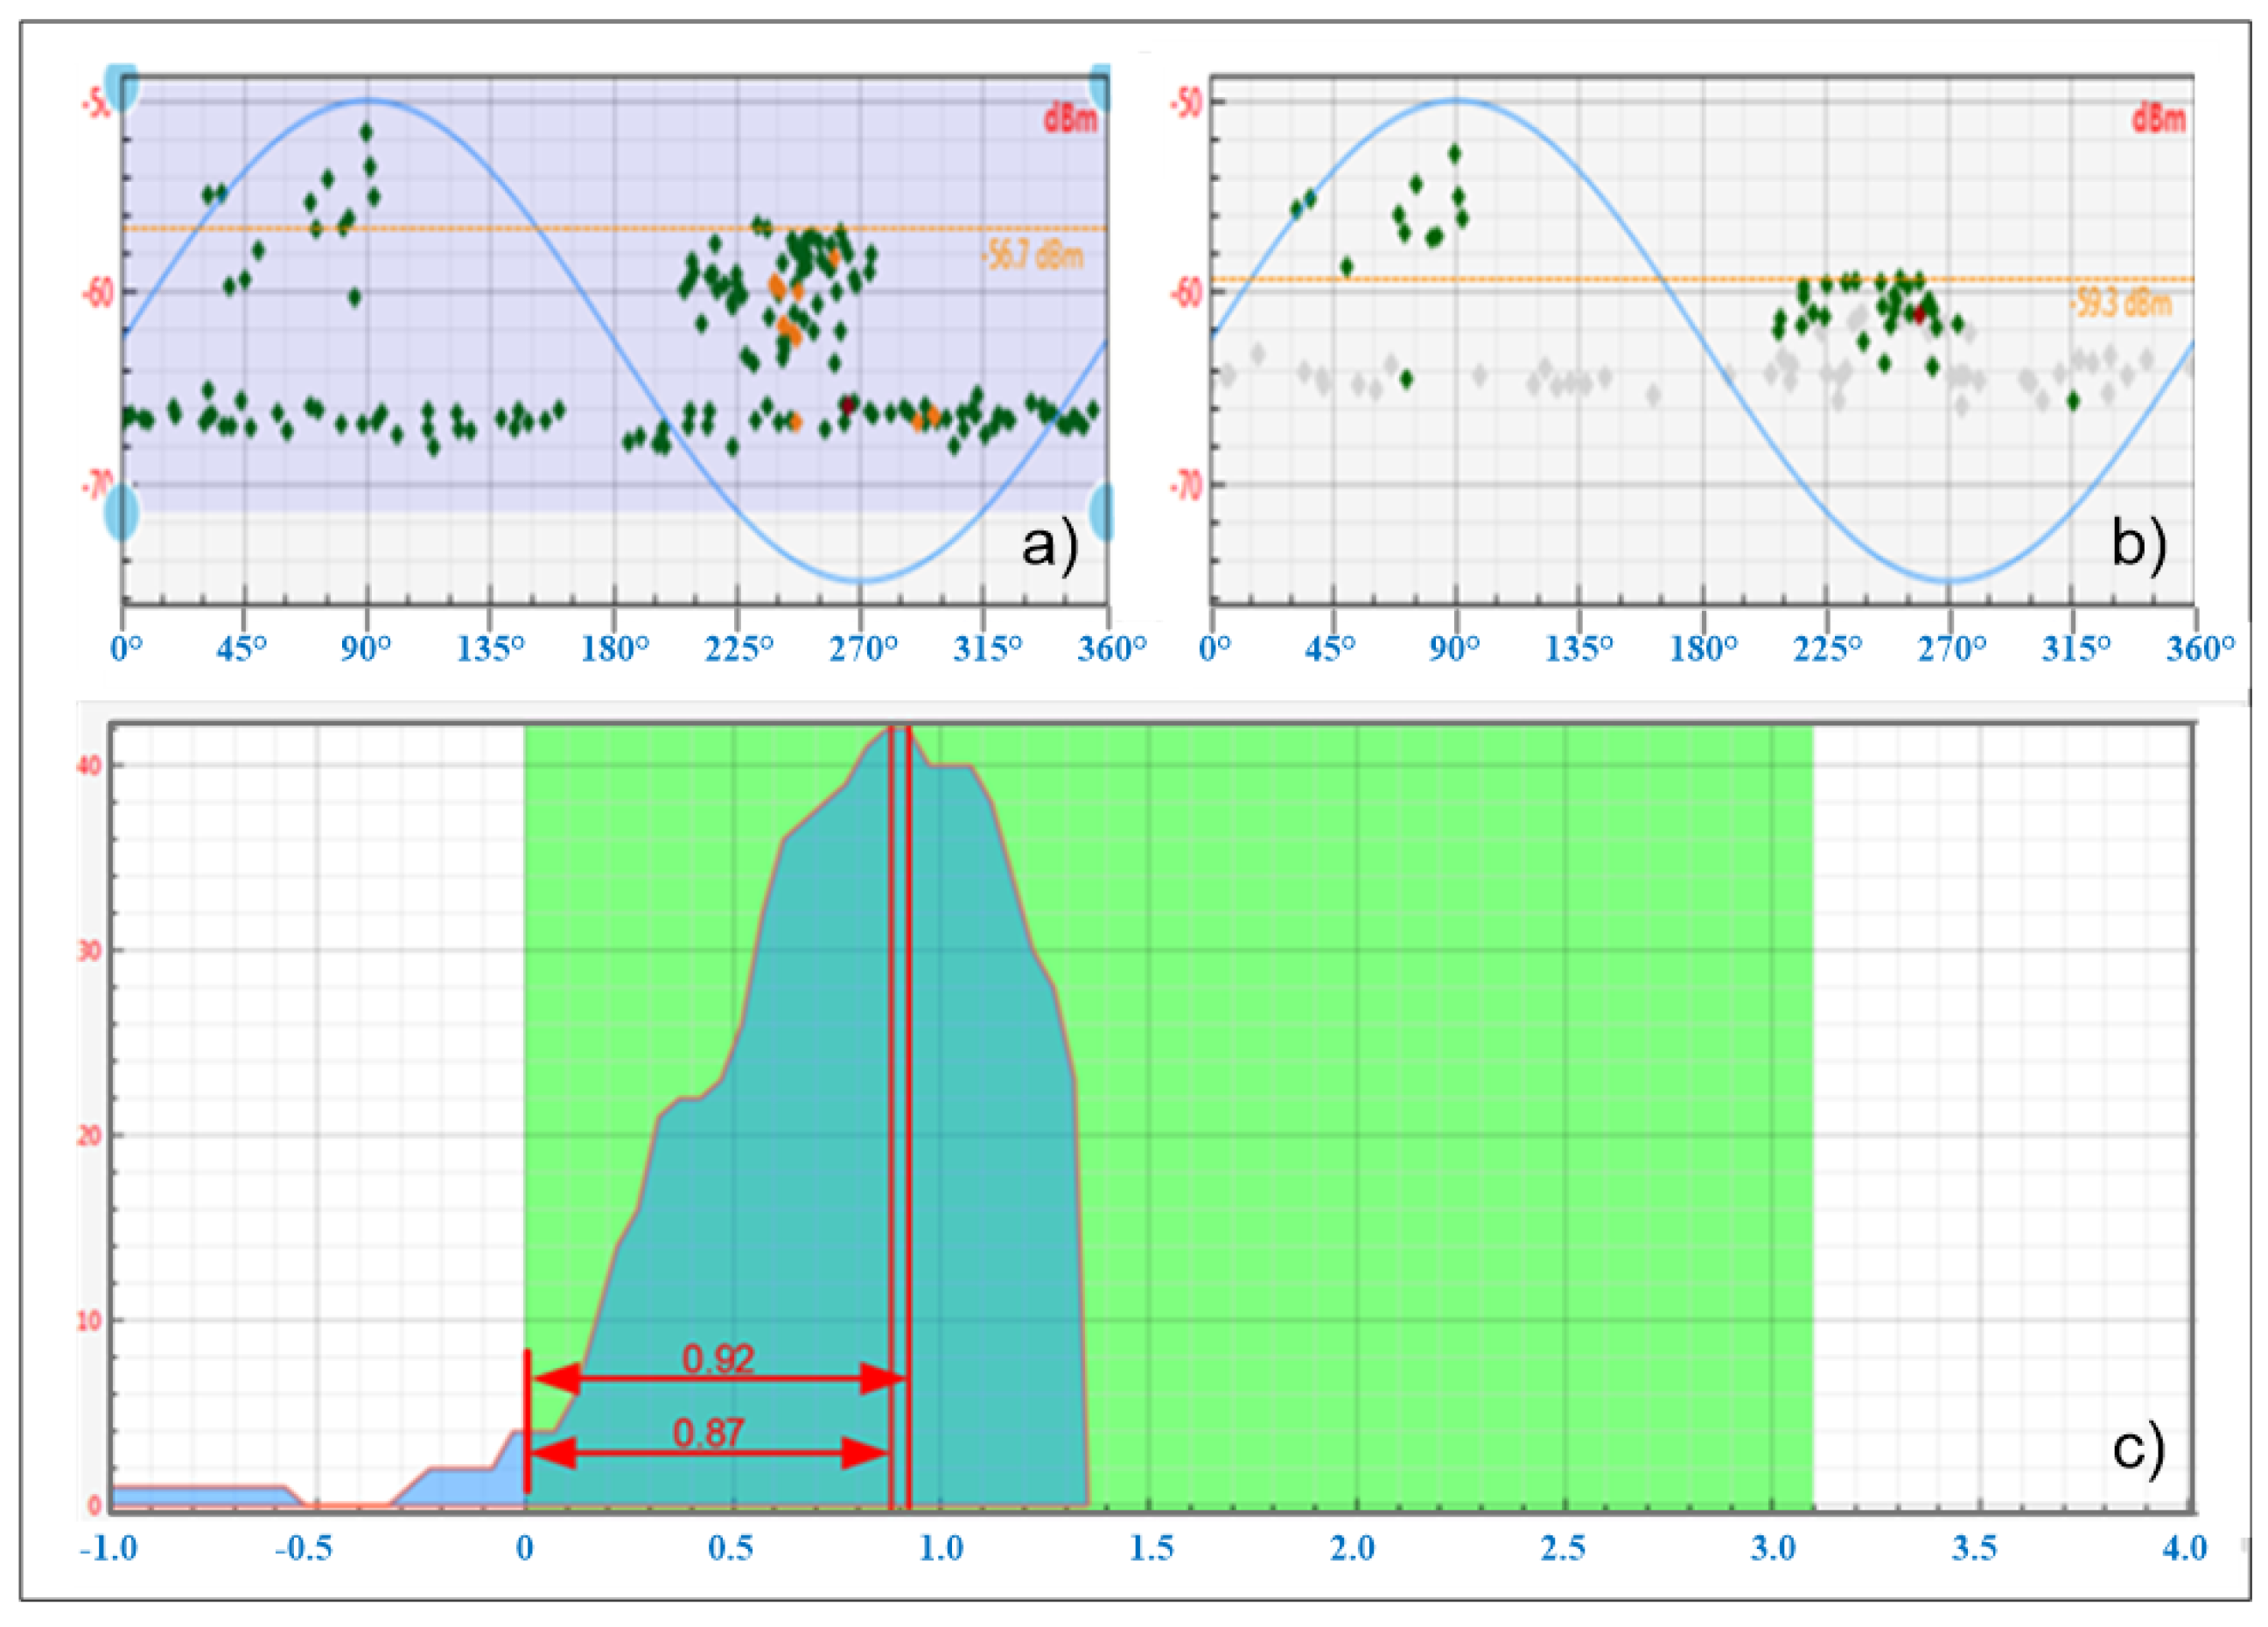
4.2. The Insightful Examination of Partial Discharge

In the primary examination of partial discharge there was a PD signal from AE1 and HFCT sensor with significance which it has been, primary evaluation of condition level was small PD. However, cast-resin transformers must be insightful investigations of partial discharge for true evaluation of condition level of PD. It is well known that audio signals are considered direct path or longitudinal waves; thus, in order to identify of position of a PD source, therefore, it is necessary to signal detector as close as possible to the source. The PD signal have been a high-level signal from AE1 sensor which AE1 was installed on high side of transformer; thus, all AE sensor was moved to installation on high side of transformer in order to specify exact position from detected signal and true evaluation of PD. In Figure 5, the AE1 sensor was installed rather towards the top of the housing of the high side transformer, which usually was the part that was far from the electrical part of the transformer. Therefore, the insightful investigation of PD signal should installation of all AE sensor was near electrical part of transformer. Figure 9 shows the four AE sensor installation on housing of high side transformer which observed that AE sensor was group installation at center of housing transformer which near electrical part of transformer.
Figure 10 shows the comparison PD signal waveform when all AE sensor installation on housing of high side transformer. It was observed that PD signal form AE3 (Yellow color) was higher level than AE1 AE2 and AE4, with ostensibly where, AE4 (blue color) was a slightly lower PD signal level than AE3. It was confirmed that the position inside of cast-resin transformer at AE3 installation area had been partial discharge due to PD signal from PowerPD analysis. It was observed that all channels of PD waveform have a strong amplitude and repetitive rate which it confirmed that this location was PD source definitely.
The HFCT sensor was still at ground wire of cast resin transformer (sensor number 5) and connected to PowerPD software for the shown PD signal waveform. Figure 11 shows the PD signal waveform from HFCT sensor when all AE sensor installation on housing of high side transformer. In addition, for accuracy of the evaluation, the cursor was pinned to both the left and right sides of the gag time in PowerPD software. When the value right cursor and left cursor was 43.079 ms and 36.789 ms, respectively, it was confirmed that the gab time/dt was 6.289 ms. From Table 1, The range of gab time/dt was between 3 ms to 7 ms as results of PD condition level was major PD which this PD level have been effect more than small PD from primary examination of PD.

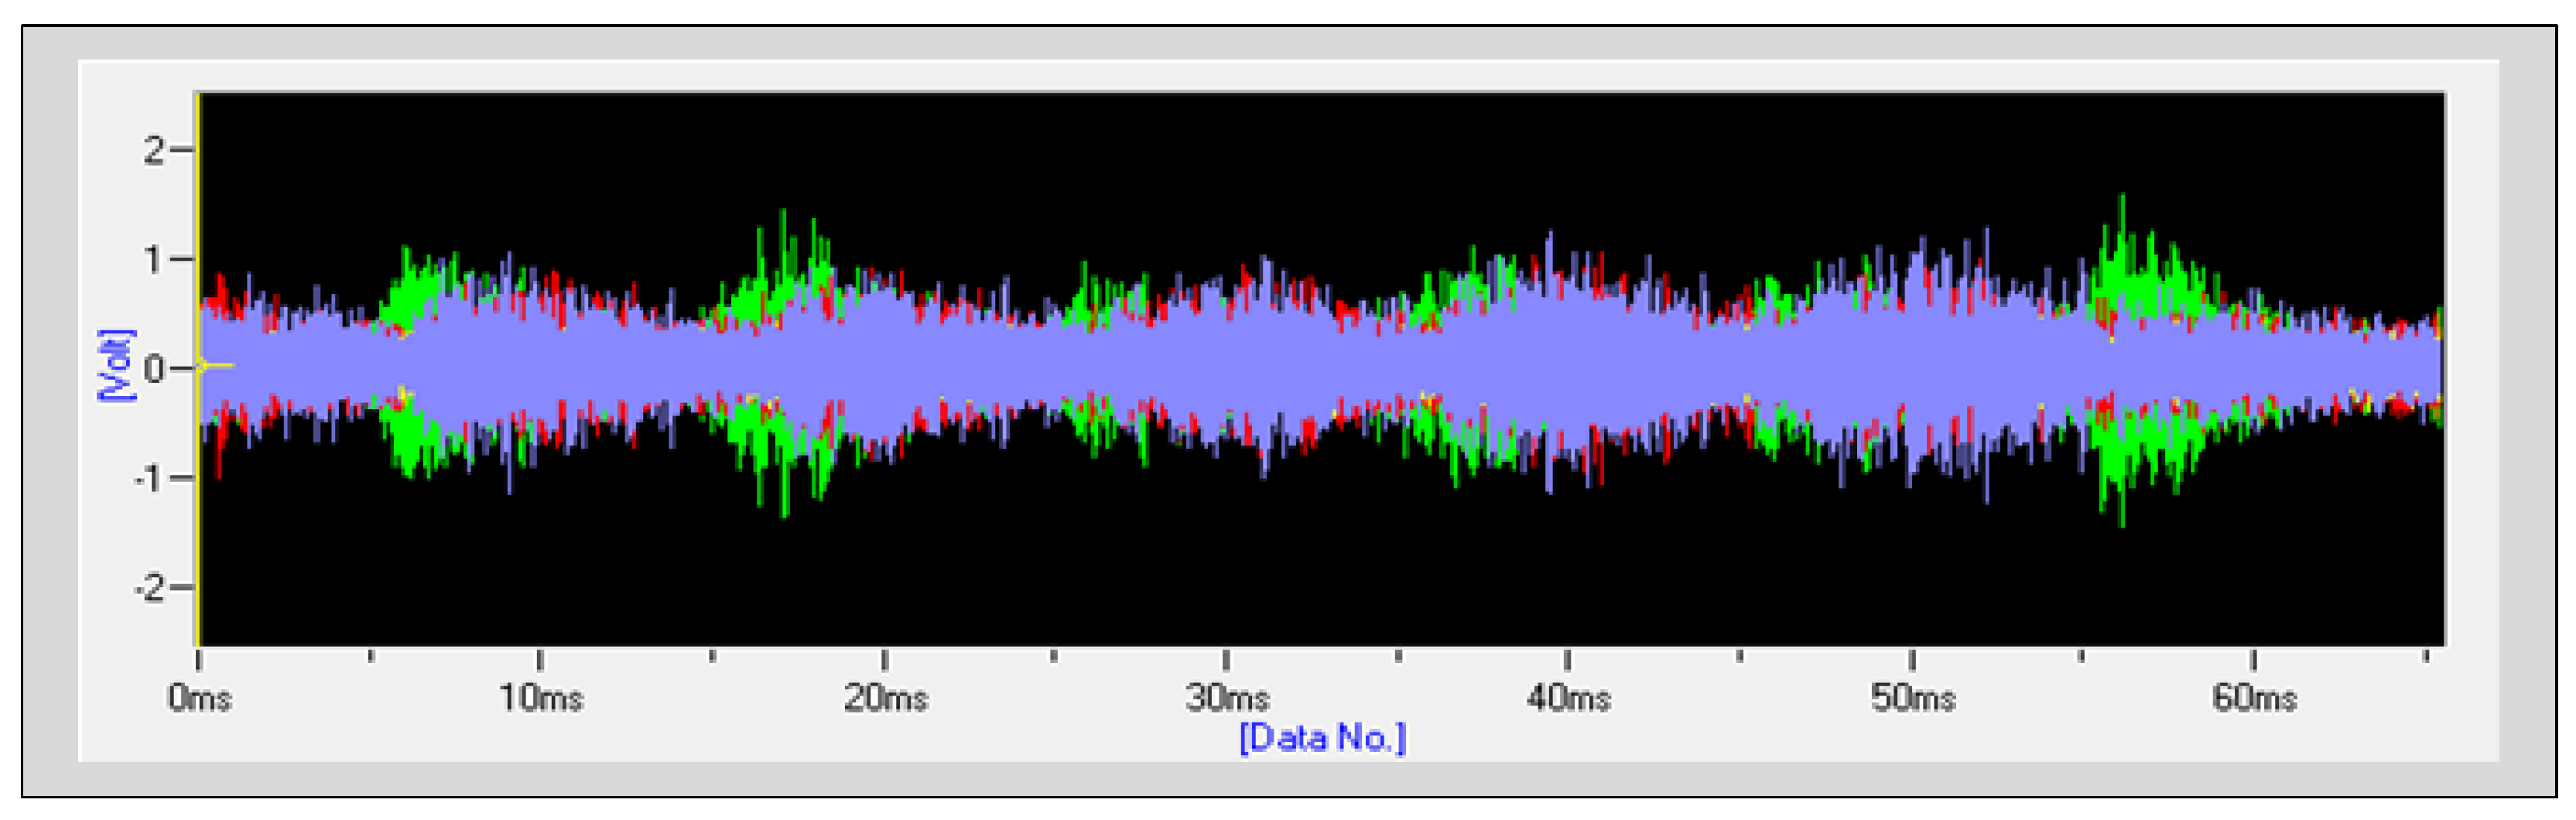
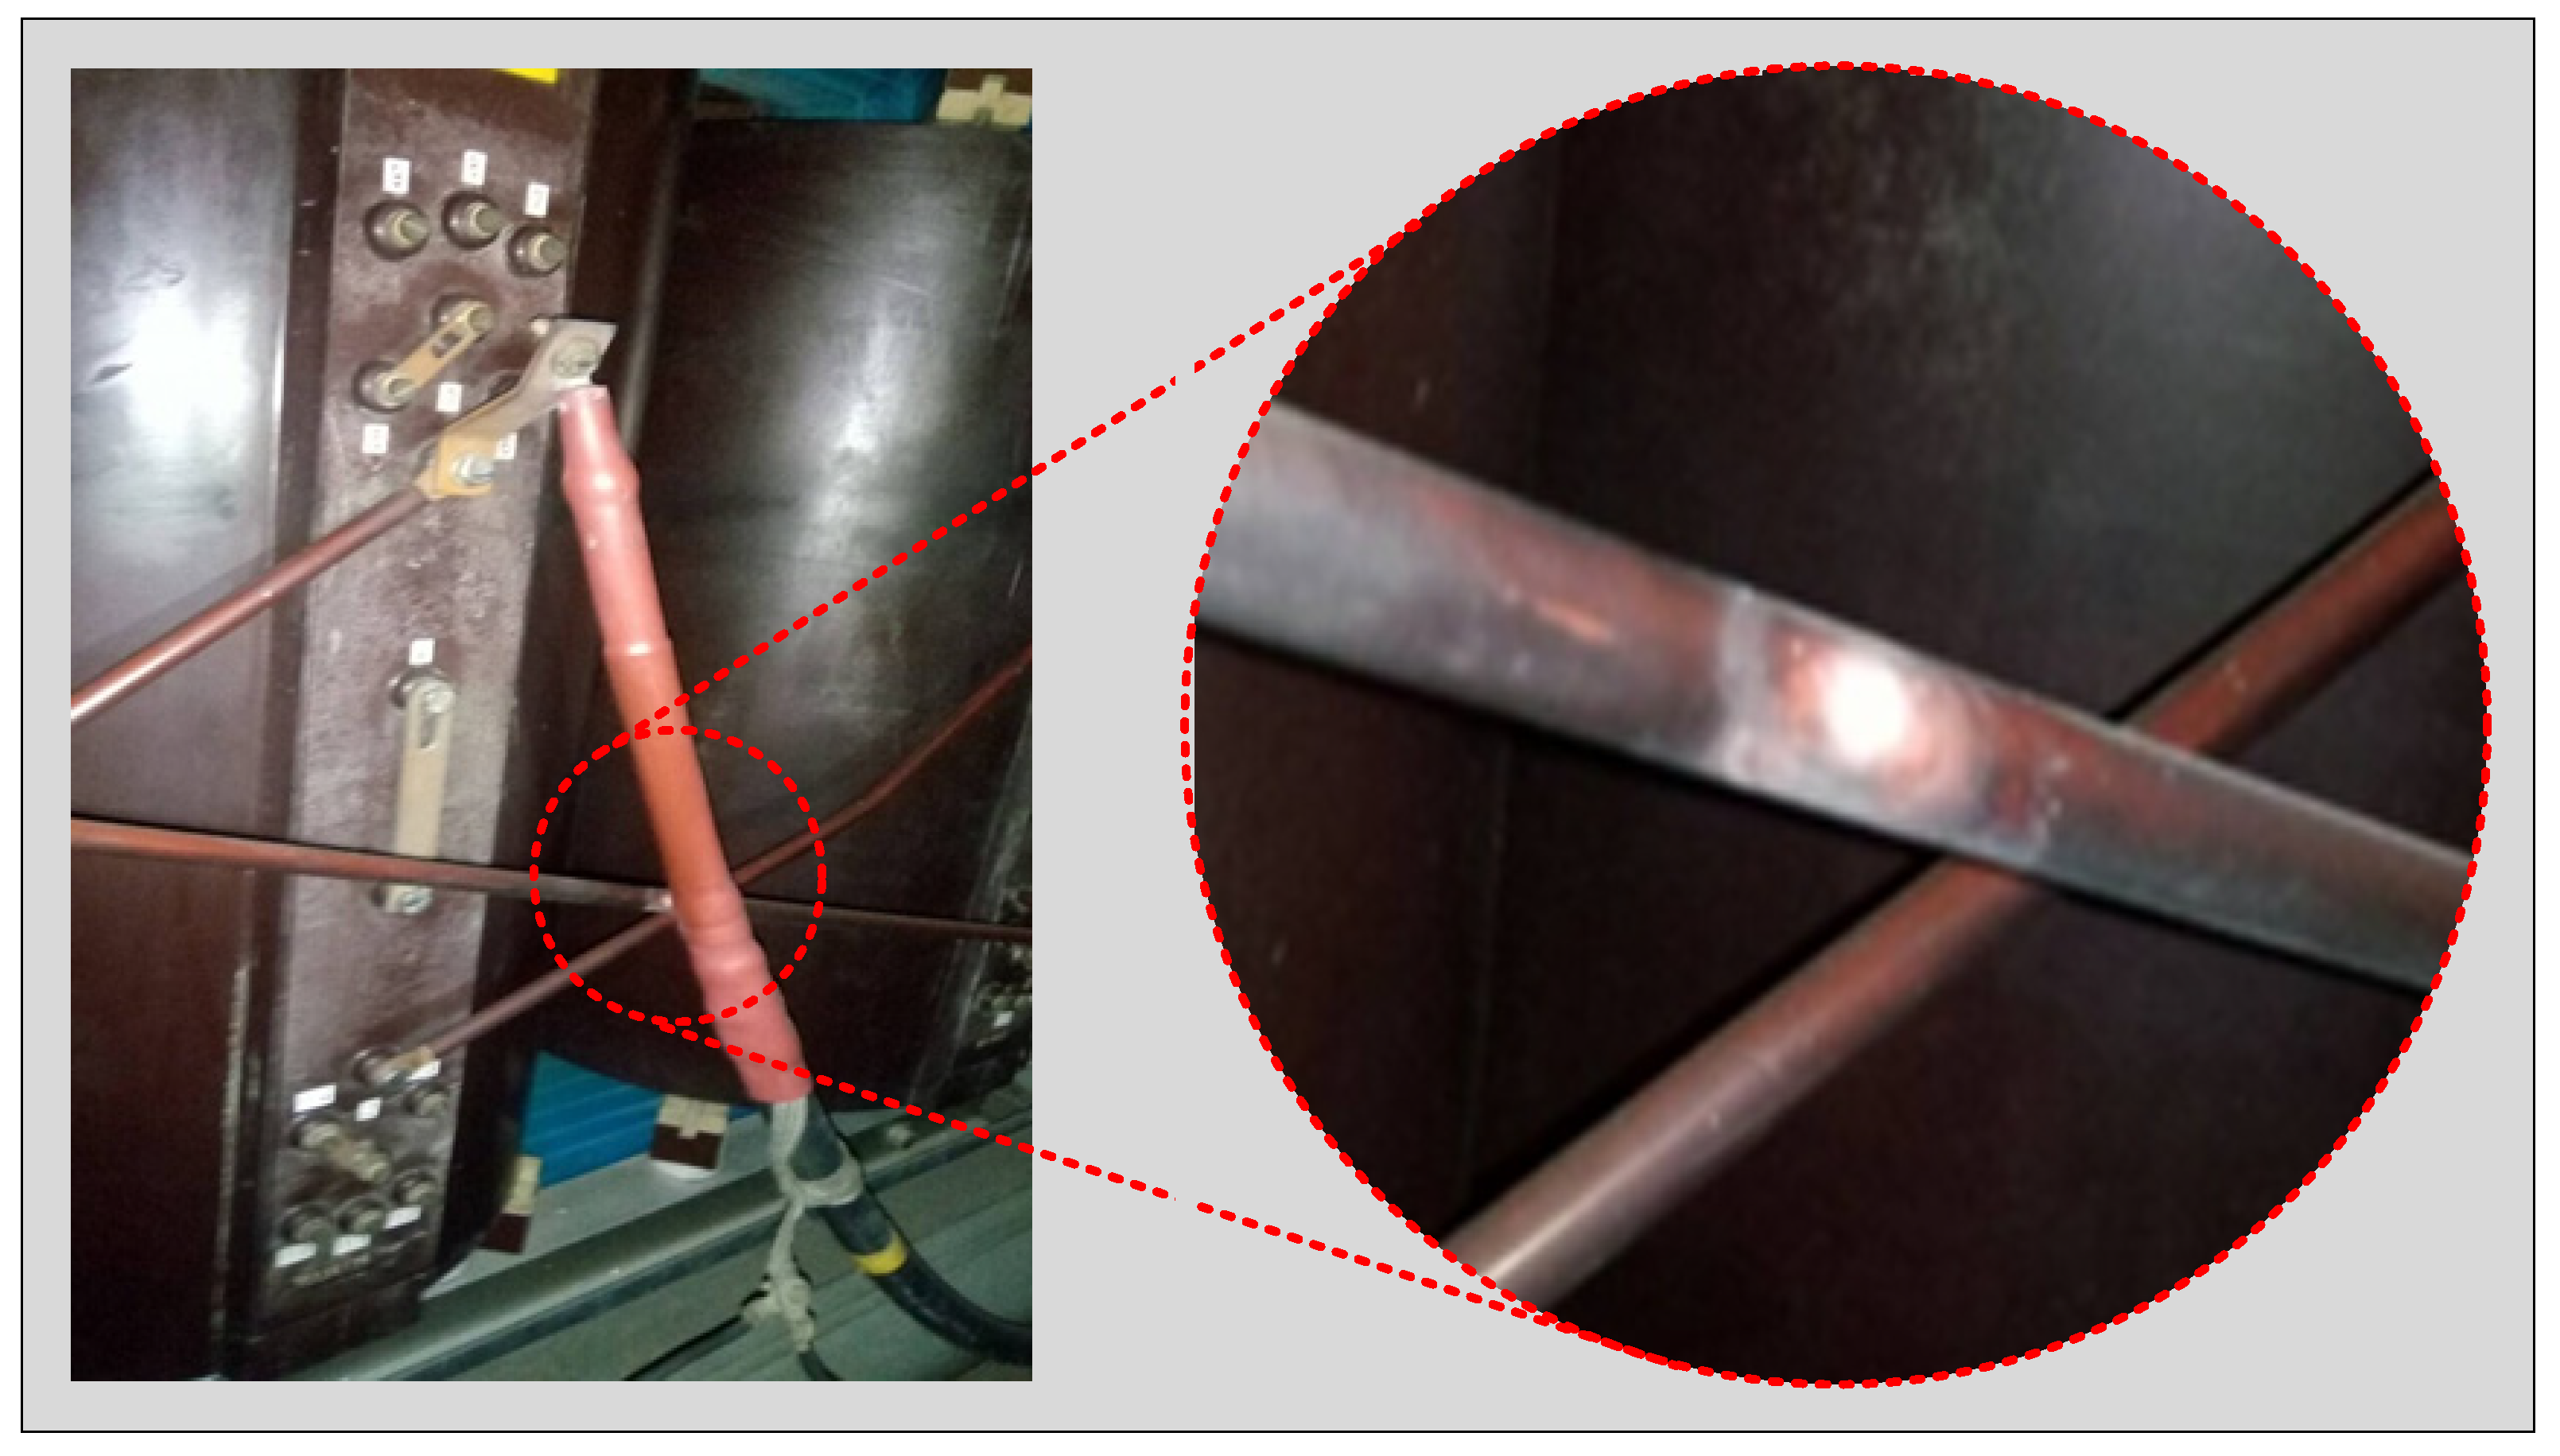
4.3. The Position Examination of Partial Discharge Source

Verify the position of the PD source of cast-resin transformer to confirm the inspection results and analyze from AE sensor and HFCT sensor detection from the primary examination of partial discharge and the insightful examination of Partial Discharge. Figure 12 shows installation of AE sensor and HFCT sensor without housing of transformer. The cast-resin transformer has been removed housing, next, installation of two AE sensor and HFCT sensor. Since there is confirmation of the occurrence of partial discharge on the high-voltage side of cast-resin transformer. Thus, the 1st AE sensor was installed on the high-voltage side approximately 1.9 m from the center of the transformer. The 2nd AE sensor was installed in the opposite direction to the 1st AE sensor approximately 1.2 m from the center of the transformer on the low-voltage side. The two AE sensors have been located at approximately a distance of about 1.9 m. The HFCT sensor was installed at the ground wire of the cast-resin transformer.
Figure 13 shows partial discharge when AE1, AE2 and HFCT sensor (UHF1, UHF2 and HFCT4, respectively) detection. The point in the graph was detection of partial discharge, which also shows a sinusoidal waveform for comparison. It was found that all sensors have detected PD, whereas the detection of AE1 sensor and AE2 sensor can have been more than HFCT sensor, which it was observed from point in graph. Furthermore, the distance of partial discharge calculation using the sensor input time difference (TDoA) method [25,26]. From the PD detection results to be processed to find the PD source, it was found that the distance between the PD source and the AE1 sensor was approximately 0.9 m.
Figure 14 shows the distance of the PD source obtained from the two AE sensors. When using software analysis of PD distance, it was found that PD source distance was 0.87 to 0.92 m, which obviously that distance value between calculation with TDoA method and software analysis have been similar. It also confirmed the use of the AE sensor to accurately determine distance from the PD source. In addition, the AE sensor for PD detecting was able to accurately determine the location of the PD source even, in case of housing of transformer [27,28,29].
Figure 15 shows evidence of partial discharge on the insulator surface of the high-voltage side. From the primary and insightful examination of partial discharge using AE sensor with HFCT sensor with housing or tank of transformer which it which could not see any vestige of damage from partial discharge. Therefore, in order to confirm that the AE sensor and HFCT sensor have been, an ability to located, the housing of transformer was removed. It was found that there is the PD on the surface of the insulation between the terminal of phase B and the high-voltage tap bar. Furthermore, it has been found that it was detected obviously of partial discharge on the surface and inside in the insulation of transformer; consequently, this is a significant effect on the result. Thus, the equipment would be immediately shut down, correction would be carried out, and the transformer would be put to normal use.

5. Conclusions

This research has been very successful with the Investigation of Detecting Position of Partial Discharge in Cast-Resin Transformer using Frequency and Acoustic Sensors. The four AE sensors were used with one HFCT sensor for analysis of PD in cast-resin transformers by PowerPD software. All these devices could be installed while the transformer was working, which does not necessarily require to turn off or shutdown the equipment and separate it from the electrical part system. This system could detect and analyze problems occurring within the transformers in the initial conditions and notify them of severe problems. This PD analysis method could accurately detect and locate the PD position within the transformer, which enables timely and efficient maintenance.
This research uses the AE and HFCT sensors to measure and determine the position of partial discharge in the transformers. The experimental has been three parts was the primary and insightful examination of partial discharge, for Identify the possibility of partial discharge, which includes the position of partial discharge in first part and second part. The final part was the position examination of partial discharge source which it was the verify the position of the PD source of cast-resin transformer to confirm the inspection results and analyze from AE sensor and HFCT sensor detection in the first two parts. The AE and HFCT sensors could certainly be used for detecting the location of the PD source, which confirmed by calculation using TDoA method and software analysis, have been 0.9 m and 0.87–0.92 m, respectively. In addition, the evident partial discharge on the insulator surface of the high-voltage side could also confirm this very well.
Online partial discharge measurement was a method to prevent transformer damage caused by the explosion and provides guidelines for determining the maintenance of transformers for safe use. The method has been completely prevented the erosion of transformers which it could reduce the cost of some serious repairs which can cause damage to transformers. Furthermore, the data could also be used for planning the maintenance of planned transformers. To solve the problem of electrical instability which causes the electrical insulation of the transformer to be damaged as a result of the partial discharge in the transformer system.

Author Contributions

Conceptualization, N.T. and S.A.; methodology, S.A., N.M. and K.T. (Khanchai Tunlasakun); validation, N.T., A.S. and K.T. (Kittimasak Tikakosol); formal analysis, N.T., S.N. and K.B.; investigation, T.Y. and H.K.; writing—original draft preparation, N.T. and S.A.; writing—review and editing, N.T.; visualization, N.T., A.S.; supervision, N.M. and S.A.; project administration, N.T. All authors have read and agreed to the published version of the manuscript.

Funding

This work was supported by King Mongkut’s University of Technology Thonburi (KMUTT), Thailand, and under the project of the Research, Innovation, and Partnerships Office (RIPO) with Faculty of Industrial Education and Technology Research Funding.

Institutional Review Board Statement

Not applicable.

Informed Consent Statement

Not applicable.

Data Availability Statement

The data presented in this study are available on request from the corresponding author.

Conflicts of Interest

The authors declare no conflict of interest.

References

  1. Guozhi, Z.; Xiaoxing, Z.; Ju, T.; Hongtu, C. Study on localization of transformer partial discharge source with planar arrangement UHF sensors based on singular value elimination. AIP Adv. 2018, 8, 105232–105243. [Google Scholar] [CrossRef] [Green Version]
  2. Junhyuck, S.; Hui, M.; Tapan, K.S. An Improved Spatial Intersectional Method for Partial Discharge (PD) Source Localization in Power Transformer. In Proceedings of the IEEE International Conference on the Properties and Applications of Dielectric Materials, Xi’an, China, 20–24 May 2018. [Google Scholar] [CrossRef]
  3. Poungsri, P.; Meesomphong, C. An Analysis and Location of Partial Discharges in Power Transformers by Acoustic Emission Sensor. In Proceedings of the 16th International Conference on Electrical Engineering/Electronics, Computer, Telecommunications and Information Technology, Pattaya, Thailand, 10–13 July 2019; pp. 293–296. [Google Scholar] [CrossRef]
  4. Rutgers, W.R.; Fu, Y.H. UHF PD-Detection in a Power Transformer. In Proceedings of the 10th International Symposium on High Voltage Engineering, Montreal, QC, Canada, 24–30 August 1997; pp. 219–222. [Google Scholar]
  5. Judd, M.D.; Li, Y.; Hunter, I. Partial Discharge Monitoring for Power Transformers using uhf Sensors Part I: Sensors and signal interpretation. IEEE Electr. Insul. Mag. 2005, 21, 5–14. [Google Scholar] [CrossRef]
  6. IEC60270 Standard; High-Voltage Test Techniques—Partial Discharge Measurements; IEC: Geneva, Switzerland, 2000.
  7. IEEE Standard C57.127-2007; IEEE Guide for the Detection and Location of Acoustic Emissions from Partial Discharges in Oil-Immersed Power Transformers and Reactors; Transformer Committee; IEEE: Piscataway, NJ, USA, 2007. [CrossRef]
  8. Howells, E.; Norton, E.T. Parameters affecting the velocity of sound in transformer oil. IEEE Trans. Power Appar. Syst. 1984, PAS-103, 1111–1115. [Google Scholar] [CrossRef]
  9. Lundgaard, L.E. Partial Discharge—Part XIV: Acoustic Partial Discharge Detection—Practical Application. IEEE Electr. Insul. Mag. 1992, 8, 34–43. [Google Scholar] [CrossRef]
  10. Urairat, F.; Winai, P.; Promsak, A. Partial Discharge Analysis for Power Distribution Transformer Model. In Proceeding of the 46th Kasetsart University Annual Conference, Bangkok, Thailand, 29 January–1 February 2008; pp. 72–80. [Google Scholar]
  11. Kumar, A.S.; Gupta, R.P.; Udayakumar, K.; Venkatasami, A. Online Partial Discharge Detection and Location Techniques for Condition Monitoring of Power Transformers: A Review. In Proceedings of the IEEE International Conference on Condition Monitoring and Diagnosis, Beijing, China, 21–24 April 2008. [Google Scholar] [CrossRef]
  12. Varlow, B.R.; Auckland, D.W.; Smith, C.D. Acoustic Emission Analysis of High Voltage Insulation. IEE Proc.-Sci. Meas. Technol. 1990, 146, 260–263. [Google Scholar] [CrossRef]
  13. IEC 60270:2000; High-Voltage Test Techniques-Partial Discharge Measurements; IEC: Geneva, Switzerland, 2001.
  14. Kuffel, E.; Zaengl, W.S. High Voltage Engineering Fundamentals; Newnes: London, UK; Elsevier: Woburn, MA, USA, 1984. [Google Scholar]
  15. Hirschler, M.M. Electrical Insulating Materials: International Issues; Hirschler, M.M., Ed.; ASTM: West Conshohocken, PA, USA, 2000; pp. 82–95. ISBN 978-0-8031-2613-8. [Google Scholar]
  16. Harold, R.T. Acoustical Technology Applications in Electrical Insulation and Dielectrics. IEEE Trans. Electr. Insul. 1985, 20, 1–3. [Google Scholar] [CrossRef]
  17. Li, Y. Ultrasonic Detection Power Transformer Partial Discharge; North Electric Power University: Beijing, China, 2003. [Google Scholar]
  18. Markalous, S.; Tenbohlen, S.; Feser, K. New Robust Non-Iterative Algorithms for Acoustic PD Localization in Oil/Paper-Insulated Transformers. In Proceedings of the 14th International Symposium High Voltage Engineering, Beijing, China, 25–29 August 2005. [Google Scholar]
  19. McShane, C.P. Relative properties of the new combustion-resistant vegetable oil-based dielectric coolants for distribution and power transformers. IEEE Trans. Ind. Appl. 2001, 37, 1132–1139. [Google Scholar] [CrossRef]
  20. Xu, Y. Partial discharge measurement and optical pulse and electrical measurement method. High-Volt. Technol. 2002, 27, 3–5. [Google Scholar]
  21. Zhao, X. Oil partial discharge detection pulse current method compared with UHF method. High-Volt. Technol. 2008, 34, 1401–1404. [Google Scholar]
  22. Chen, Q. Transformer oil UHF partial discharge detection test study. High-Volt. Technol. 2002, 28, 23–25. [Google Scholar]
  23. Plueksawan, W.; Apiratikul, P.; Fuangsoongnern, U. Partial Discharge Analysis for Power Distribution Transformer Model. In Proceedings of the EECON-31. 31st Electrical Engineering Conference, Nakornnayok, Thailand, 29–31 October 2008; pp. 299–302. [Google Scholar]
  24. Gupta, R.K.K.; Jaswal, R.A. Partial Discharge Test in Power Transformer Against Winding Insulation: A Review. Int. J. Appl. Eng. Res. 2014, 9, 1087–1090. [Google Scholar]
  25. Wu, P.; Su, S.; Zuo, Z.; Guo, X.; Sun, B.; Wen, X. Time Difference of Arrival (TDoA) Localization Combining Weighted Least Squares and Firefly Algorithm. Sensors 2019, 19, 2554. [Google Scholar] [CrossRef] [PubMed] [Green Version]
  26. Ricardo, A.-S.; Fernando, Á.-G.; Carlos, A.V.-R.; Johnatan, M.R.-S. Separation of Partial Discharge Sources Measured in the High-Frequency Range with HFCT Sensors Using PRPD-teff Patterns. Sensors 2020, 20, 382. [Google Scholar] [CrossRef] [PubMed] [Green Version]
  27. Xiaoli, Z.; Yong, Q.; Muqing, L. The Application of Partial Discharge Detection for the condition assessment of XLPE Power Cables. Prz. Elektrotech. 2012, 88, 313–316. [Google Scholar]
  28. Li, J.; Luo, Y.; Li, J.; Li, Y. The study of phased-ultrasonic receiving-planar array transducer for PD location in power transformer. Prz. Elektrotech. 2011, 87, 324–328. [Google Scholar]
  29. Tikakosol, K.; Tanitteerapa, T.; Mungkung, N. Application of the integrated AE and HFCT sensors for online Dry-type Transformer Partial Discharge Monitoring. Prz. Elektrotech. 2021, 97, 105–111. [Google Scholar] [CrossRef]
Figure 1. The relationship between PD source and AE sensor. (a) Radical PD sound wave propagation patterns. (b) various parameters characterizing PD wave propagation paths [14].
Applsci 12 01310 g001
Figure 2. The severity criteria of partial discharge; Gap time.
Applsci 12 01310 g002
Figure 3. Schematic diagram of experimental installation.
Applsci 12 01310 g003
Figure 4. Installation of Acoustic Emission Sensor (AE1–AE4) with housing of transformer.
Applsci 12 01310 g004
Figure 5. The PD signal waveform obtained from each sensor by four directions installation.
Applsci 12 01310 g005
Figure 6. The comparation PD signal waveform with AE1–AE4.
Applsci 12 01310 g006
Figure 7. Installation of HFCT at ground wire of transformer.
Applsci 12 01310 g007
Figure 8. The PD signal waveform from HFCT sensor.
Applsci 12 01310 g008
Figure 9. The four AE sensor installation on housing of high side transformer.
Applsci 12 01310 g009
Figure 10. The comparation PD signal waveform when all AE sensor installation on housing of high side transformer.
Applsci 12 01310 g010
Figure 11. The PD signal waveform from HFCT sensor when all AE sensor installation on housing of high side transformer.
Applsci 12 01310 g011
Figure 12. Installation of AE sensor and HFCT sensor without housing of transformer.
Applsci 12 01310 g012
Figure 13. Partial discharge when AE1, AE2 and HFCT sensor detection.
Applsci 12 01310 g013
Figure 14. The distance of the PD source obtained from the two AE sensors. (a) partial discharge from AE1 (b) partial discharge from AE2 (c) distance of sensor detection.
Applsci 12 01310 g014
Figure 15. The evident of partial discharge on the insulator surface of high voltage side.
Applsci 12 01310 g015
Table 1. The risk level of PD according to the PowerPD reference.
Gap Time/dT
(ms, Milliseconds)
Condition LeveRecommended Action
No partial Partial Discharge SignalAcceptableContinue normal operation
Monitoring every 12 months
Gap time > 7 msSmall PDSatisfactory (May be non-damaging PD)
Monitoring every 6 months
3 ms < Gap time < 7 msMajor PDEngineering review and evaluation need if the trend is increasing consider removal from service in near future
Monitoring every 3 months
Gap time < 3 msSonous PDUnsatisfactory, make plans to remove and repair now
Monitoring every 1 week or continuous monitoring should be installed
Arcing SignalSonousEngineering review and evaluation need if the arc source is important point of equipment, consider removal from service in near future
Mechanical SignalAbnormalEngineering review and evaluation need other technologies should be performed to combining to data
Publisher’s Note: MDPI stays neutral with regard to jurisdictional claims in published maps and institutional affiliations.

