
Impact of Environmental Conditions on the Degree of Efficiency and Operating Range of PV-Powered Electric Vehicles


Abstract
:1. Introduction
- (1)
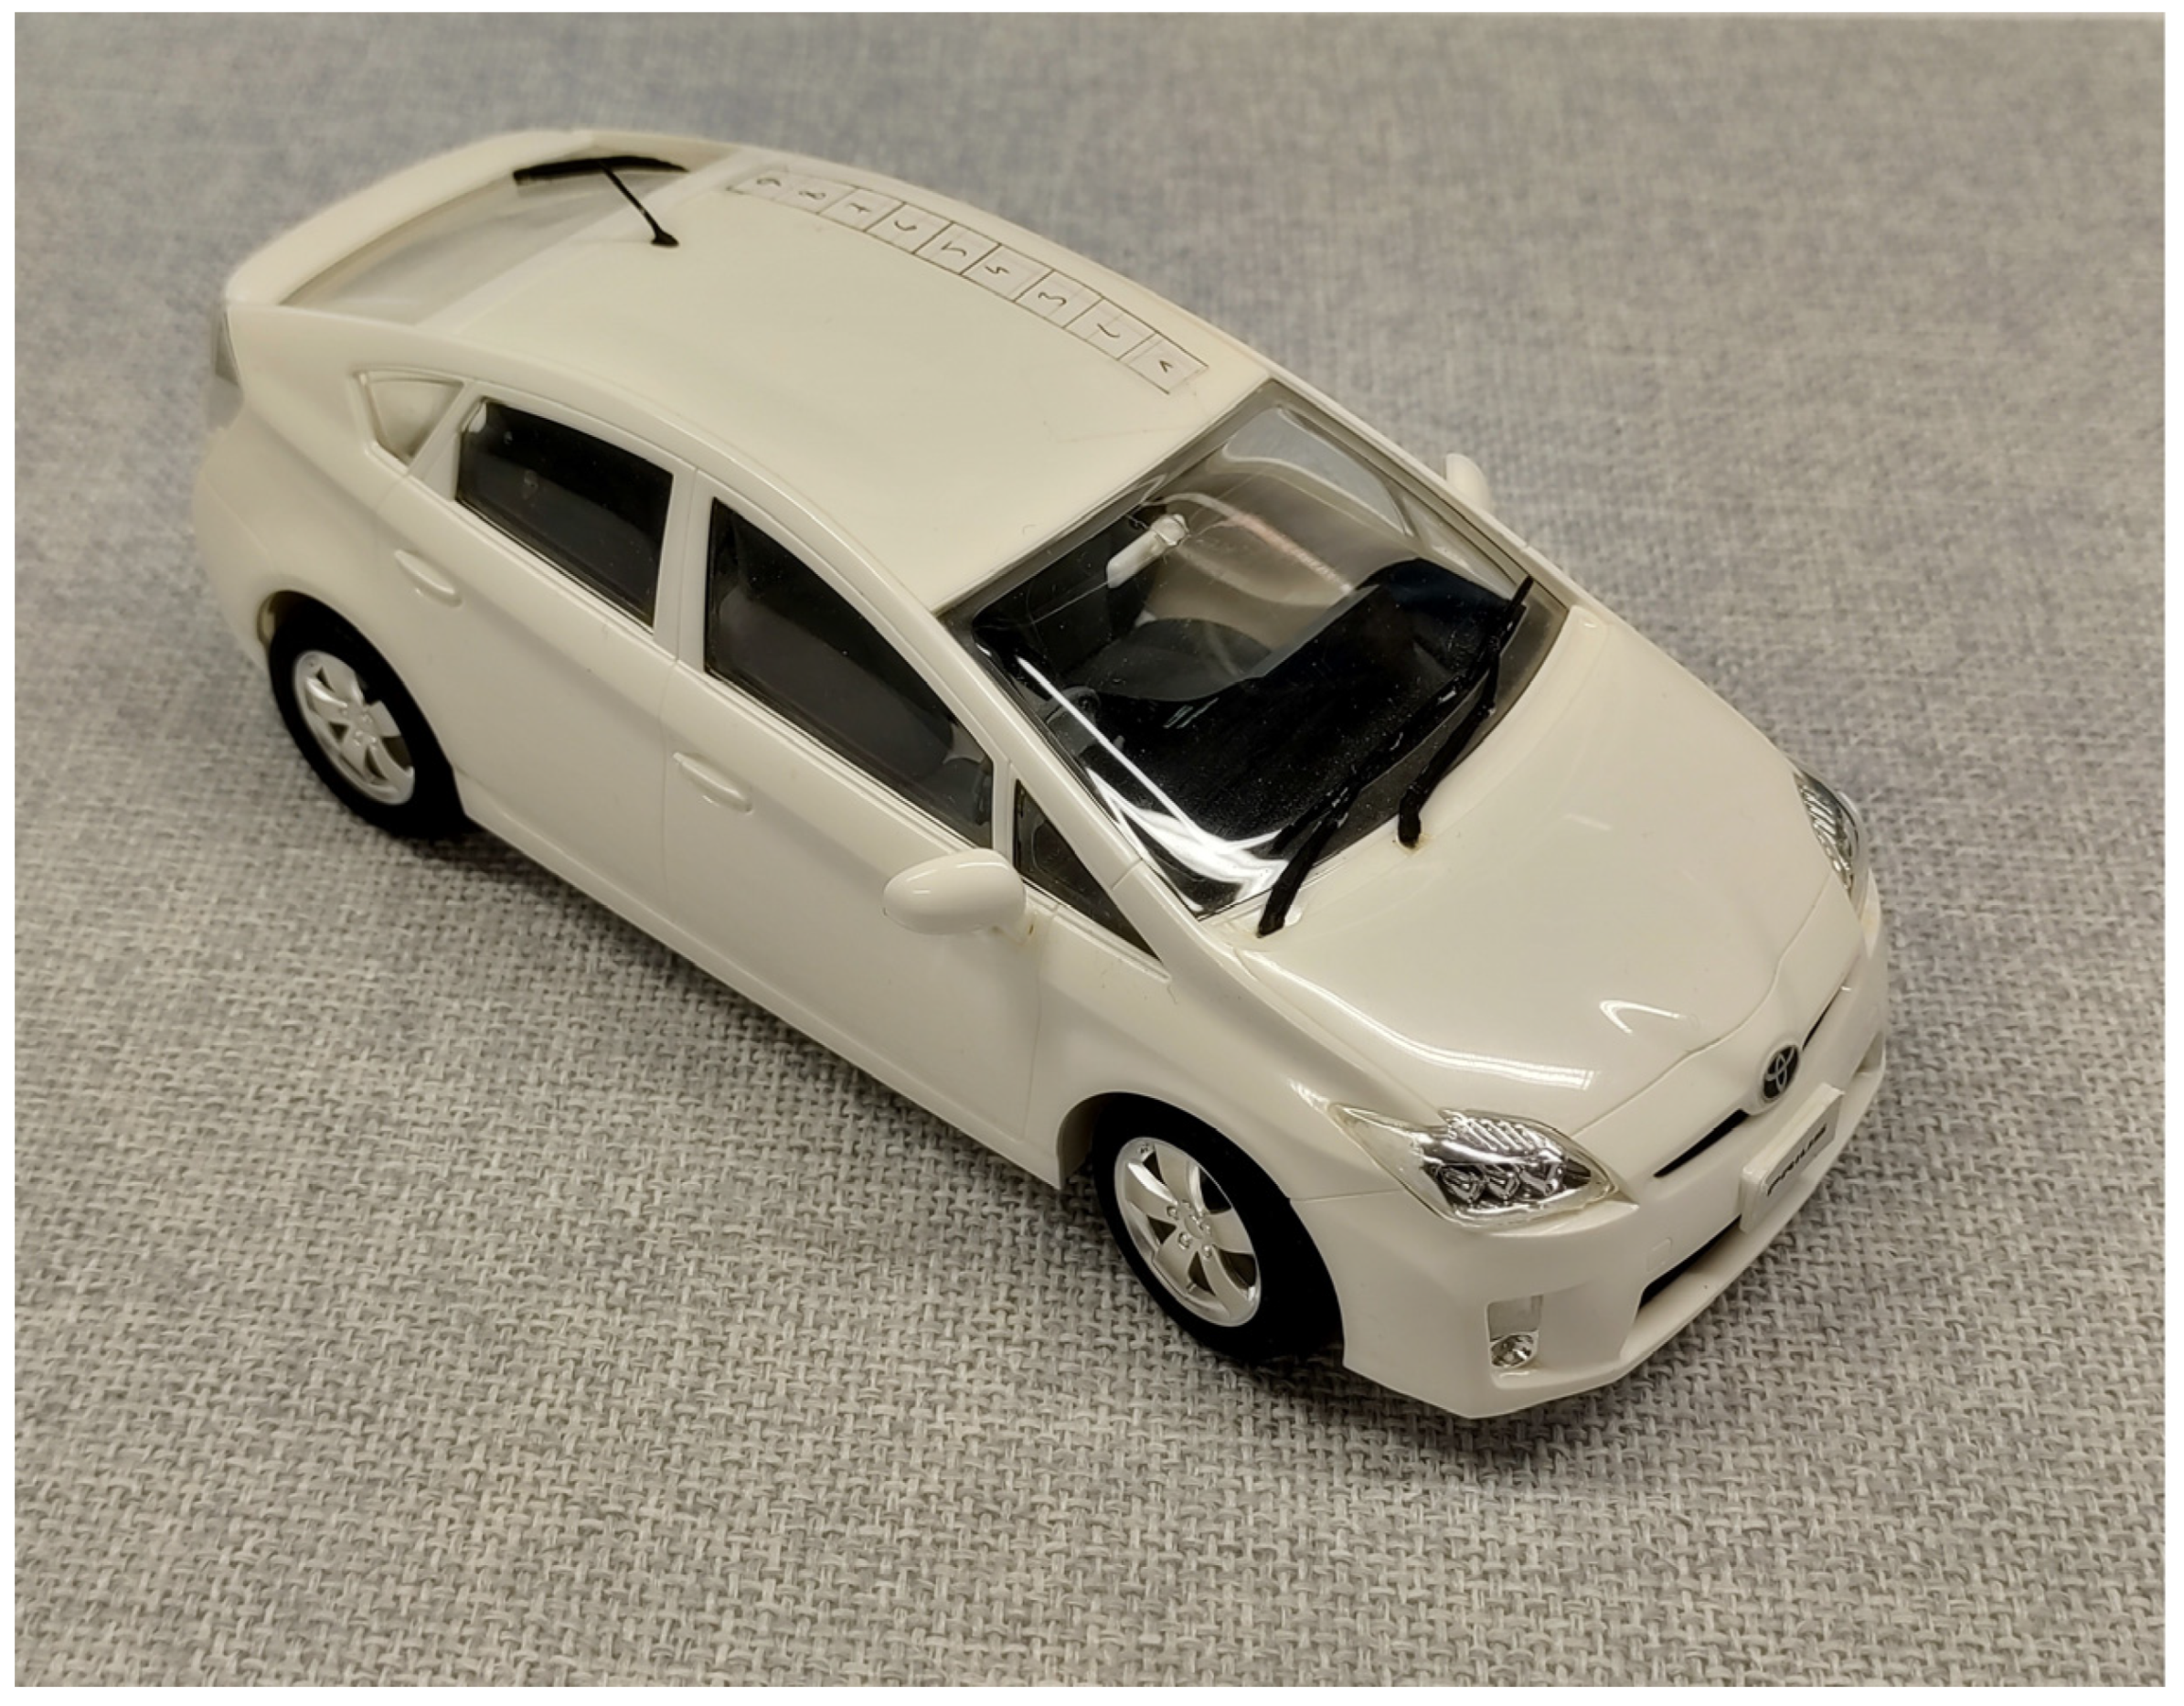
- A PV simulation model is proposed which allows us to take into consideration the different alignment of PV cells on top of curved surfaces, such as the vehicle’s roof, and the vehicle’s cardinal orientation towards the sun. In contrast to other models in the available literature, the proposed model in this work allows us to estimate and predict accurately the potential energy of PV-powered electric vehicle.
- (2)
- The impact of environmental conditions on PV-powered electric vehicles was studied. While in parking conditions, the circumstances are comparable to PV-powered charging stations, in driving conditions, the available irradiation is changing quickly and rapidly. Example data are presented for PV-powered vehicles in both parking and driving conditions.
- (3)
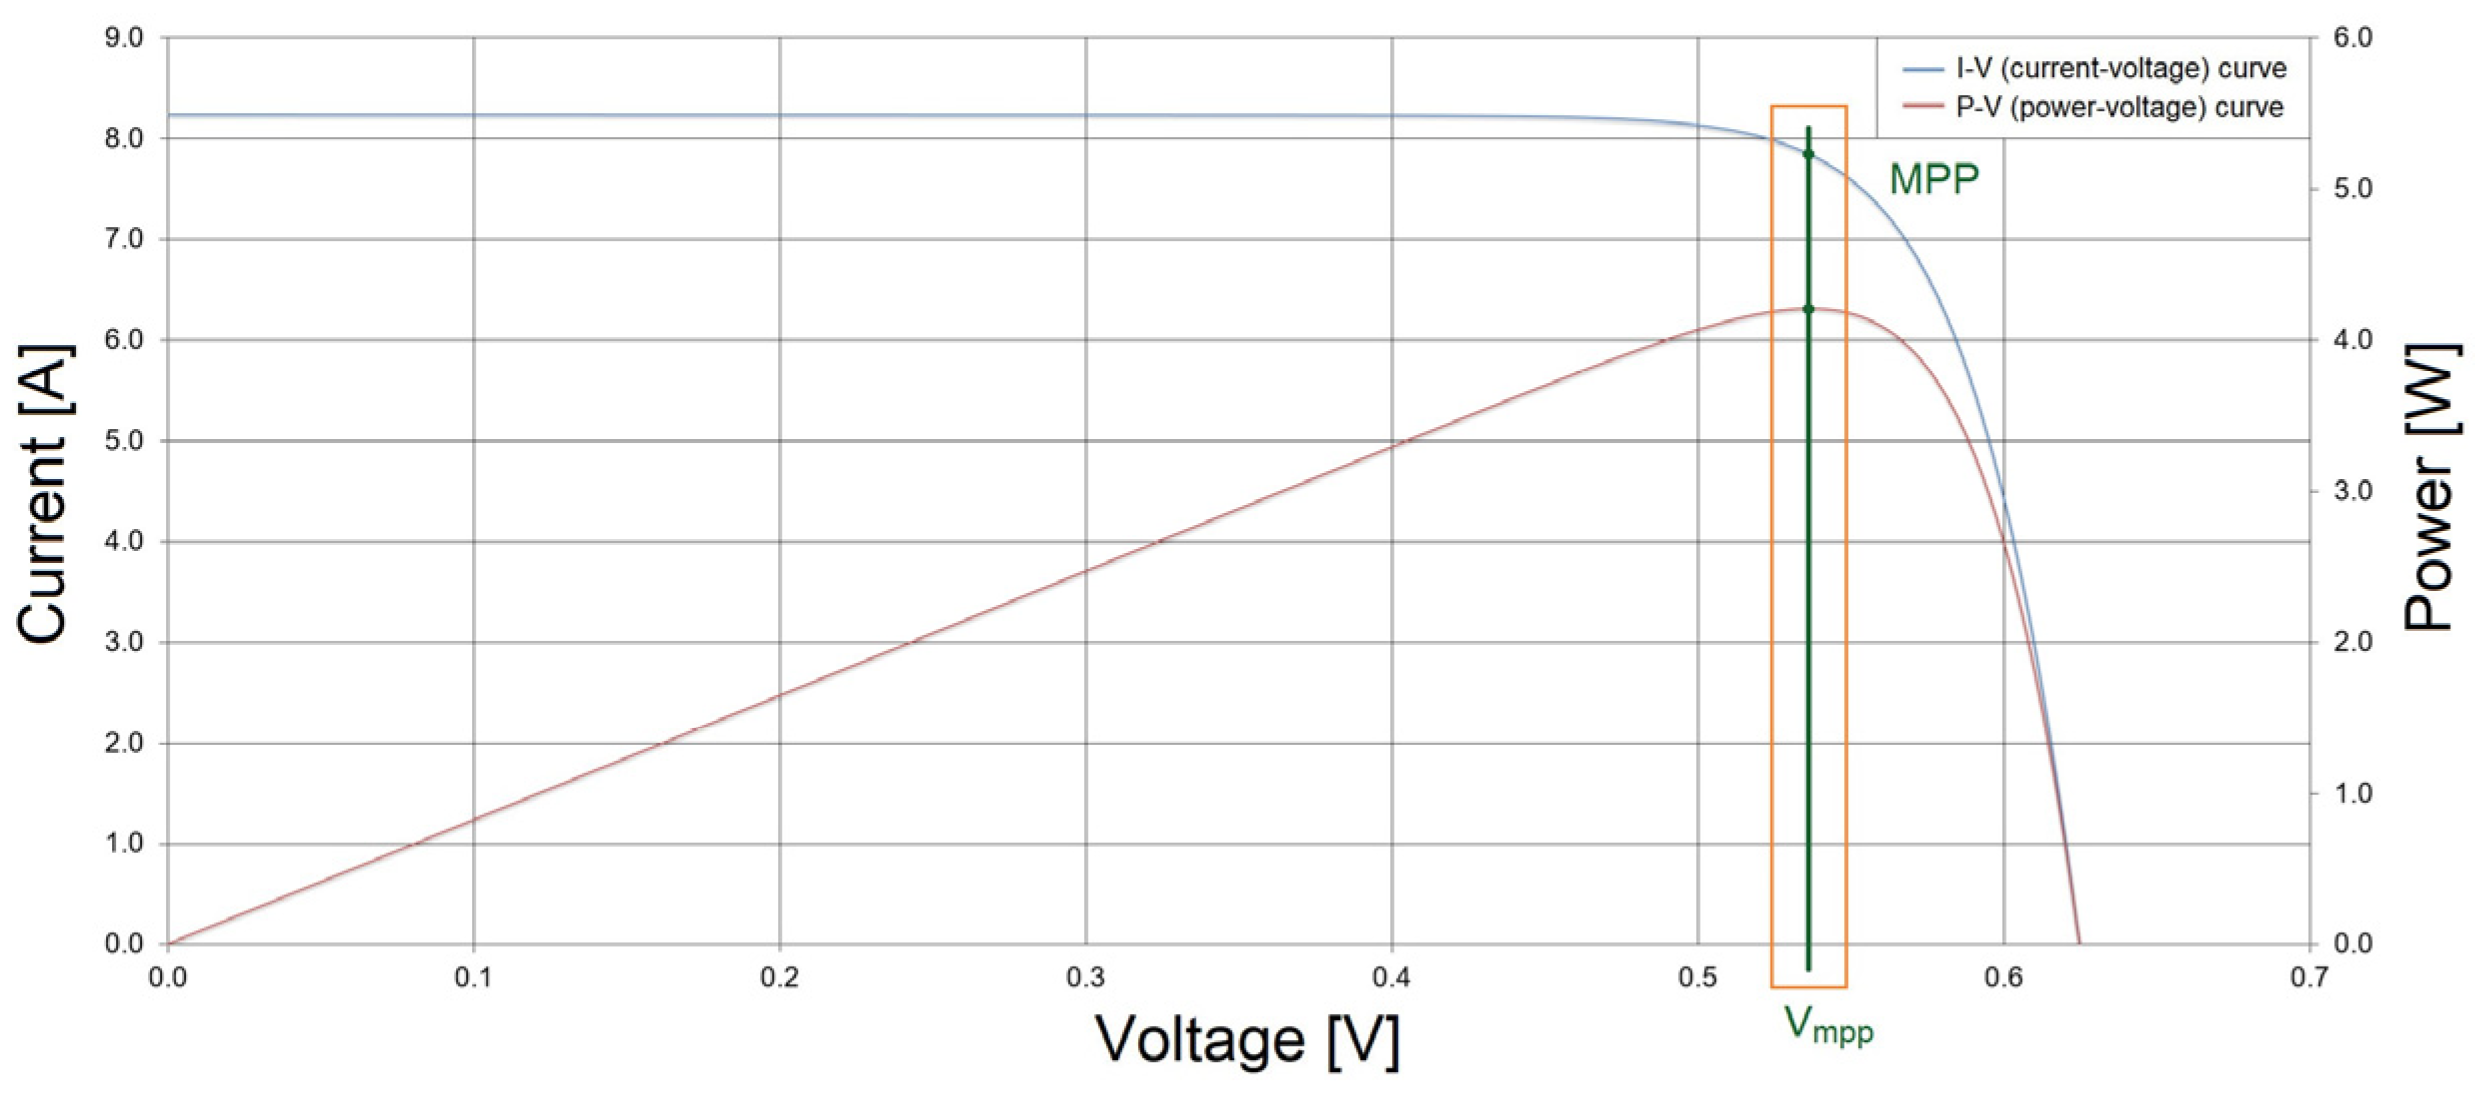
- The challenges to optimize and maximize the degree of efficiency of PV-powered electric vehicles are elaborated. On the example of maximum power point tracking (MPPT) in driving conditions, in comparison to vehicles in parking conditions, the potential reduction in system efficiency is analyzed. A possible solution is proposed to control the operating voltage of PV cells on top of curved surfaces in an effective way.
2. Characteristic Output Behavior of a PV Cell
3. Computer Simulation of PV Cell and Panel
3.1. Purpose of Computer Simulations
3.2. Review of PV Simulation Models
3.2.1. Parameters for the Models
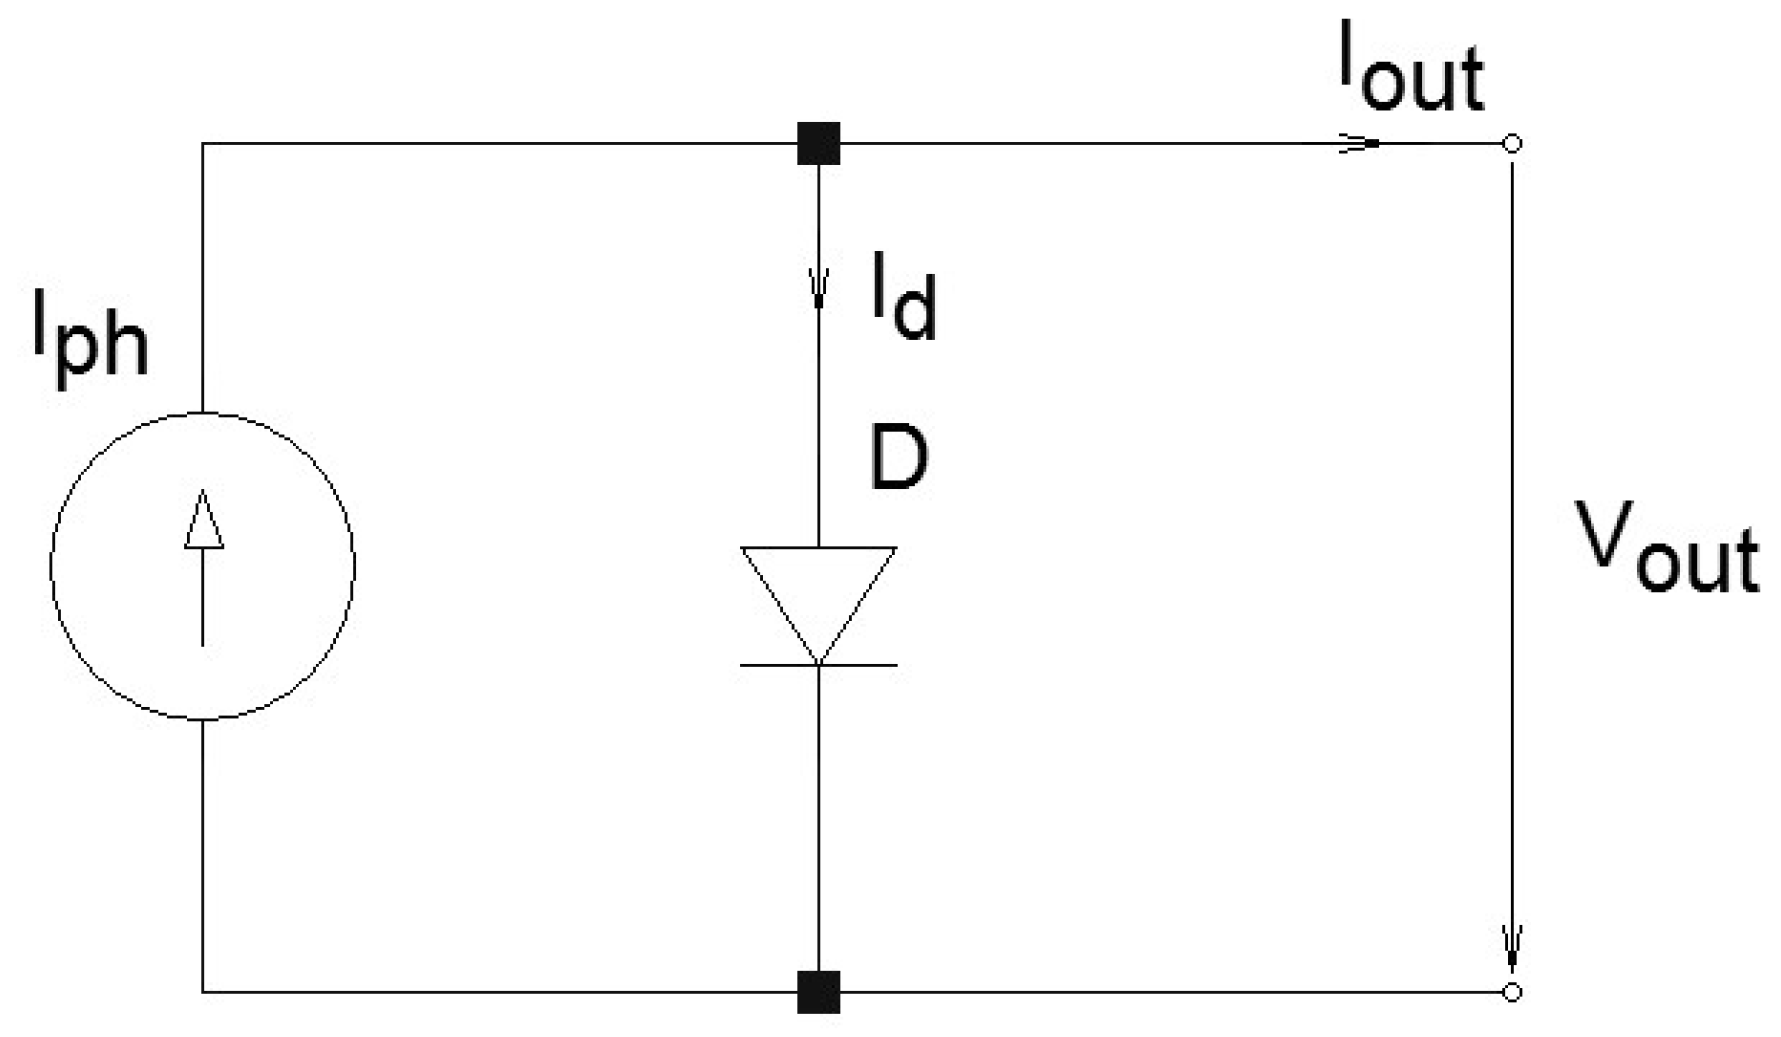
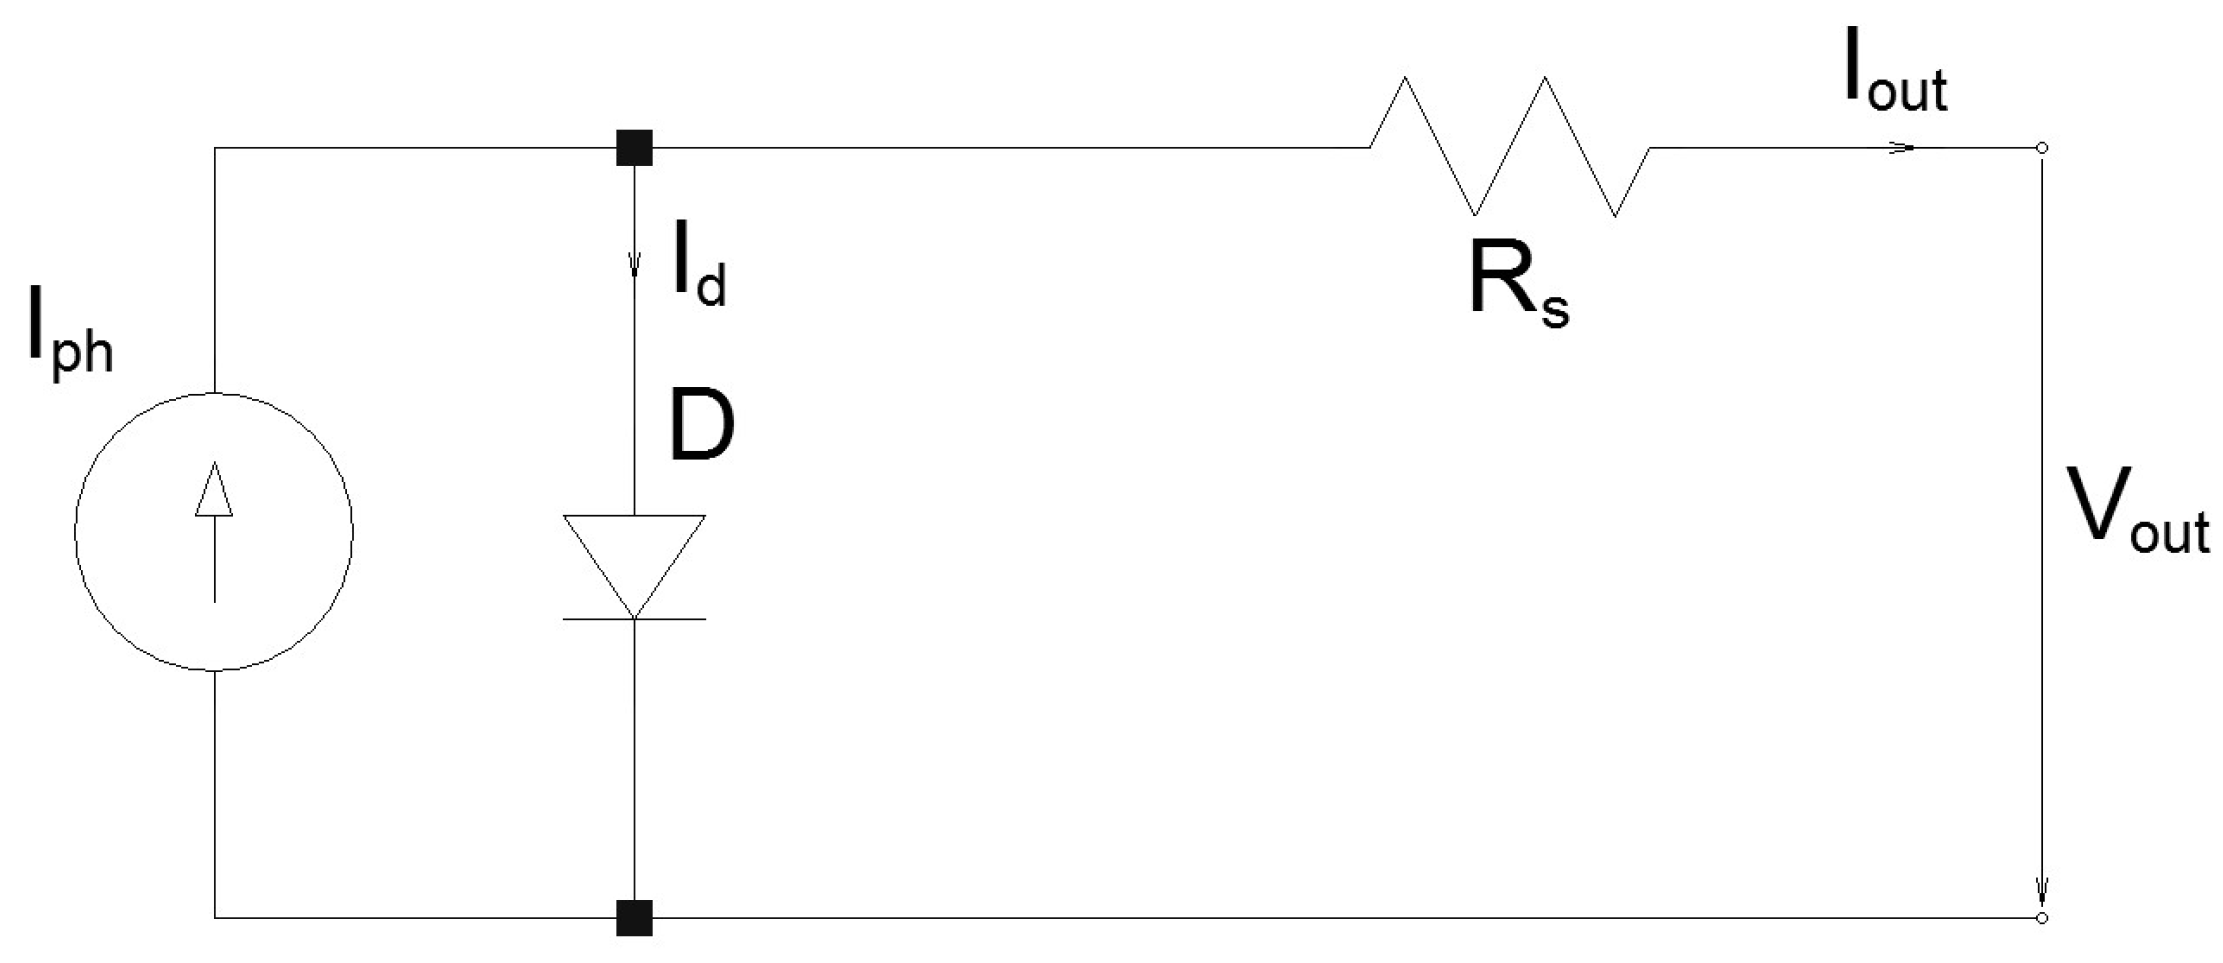
3.2.2. Ideal Model
3.2.3. Simplified Model
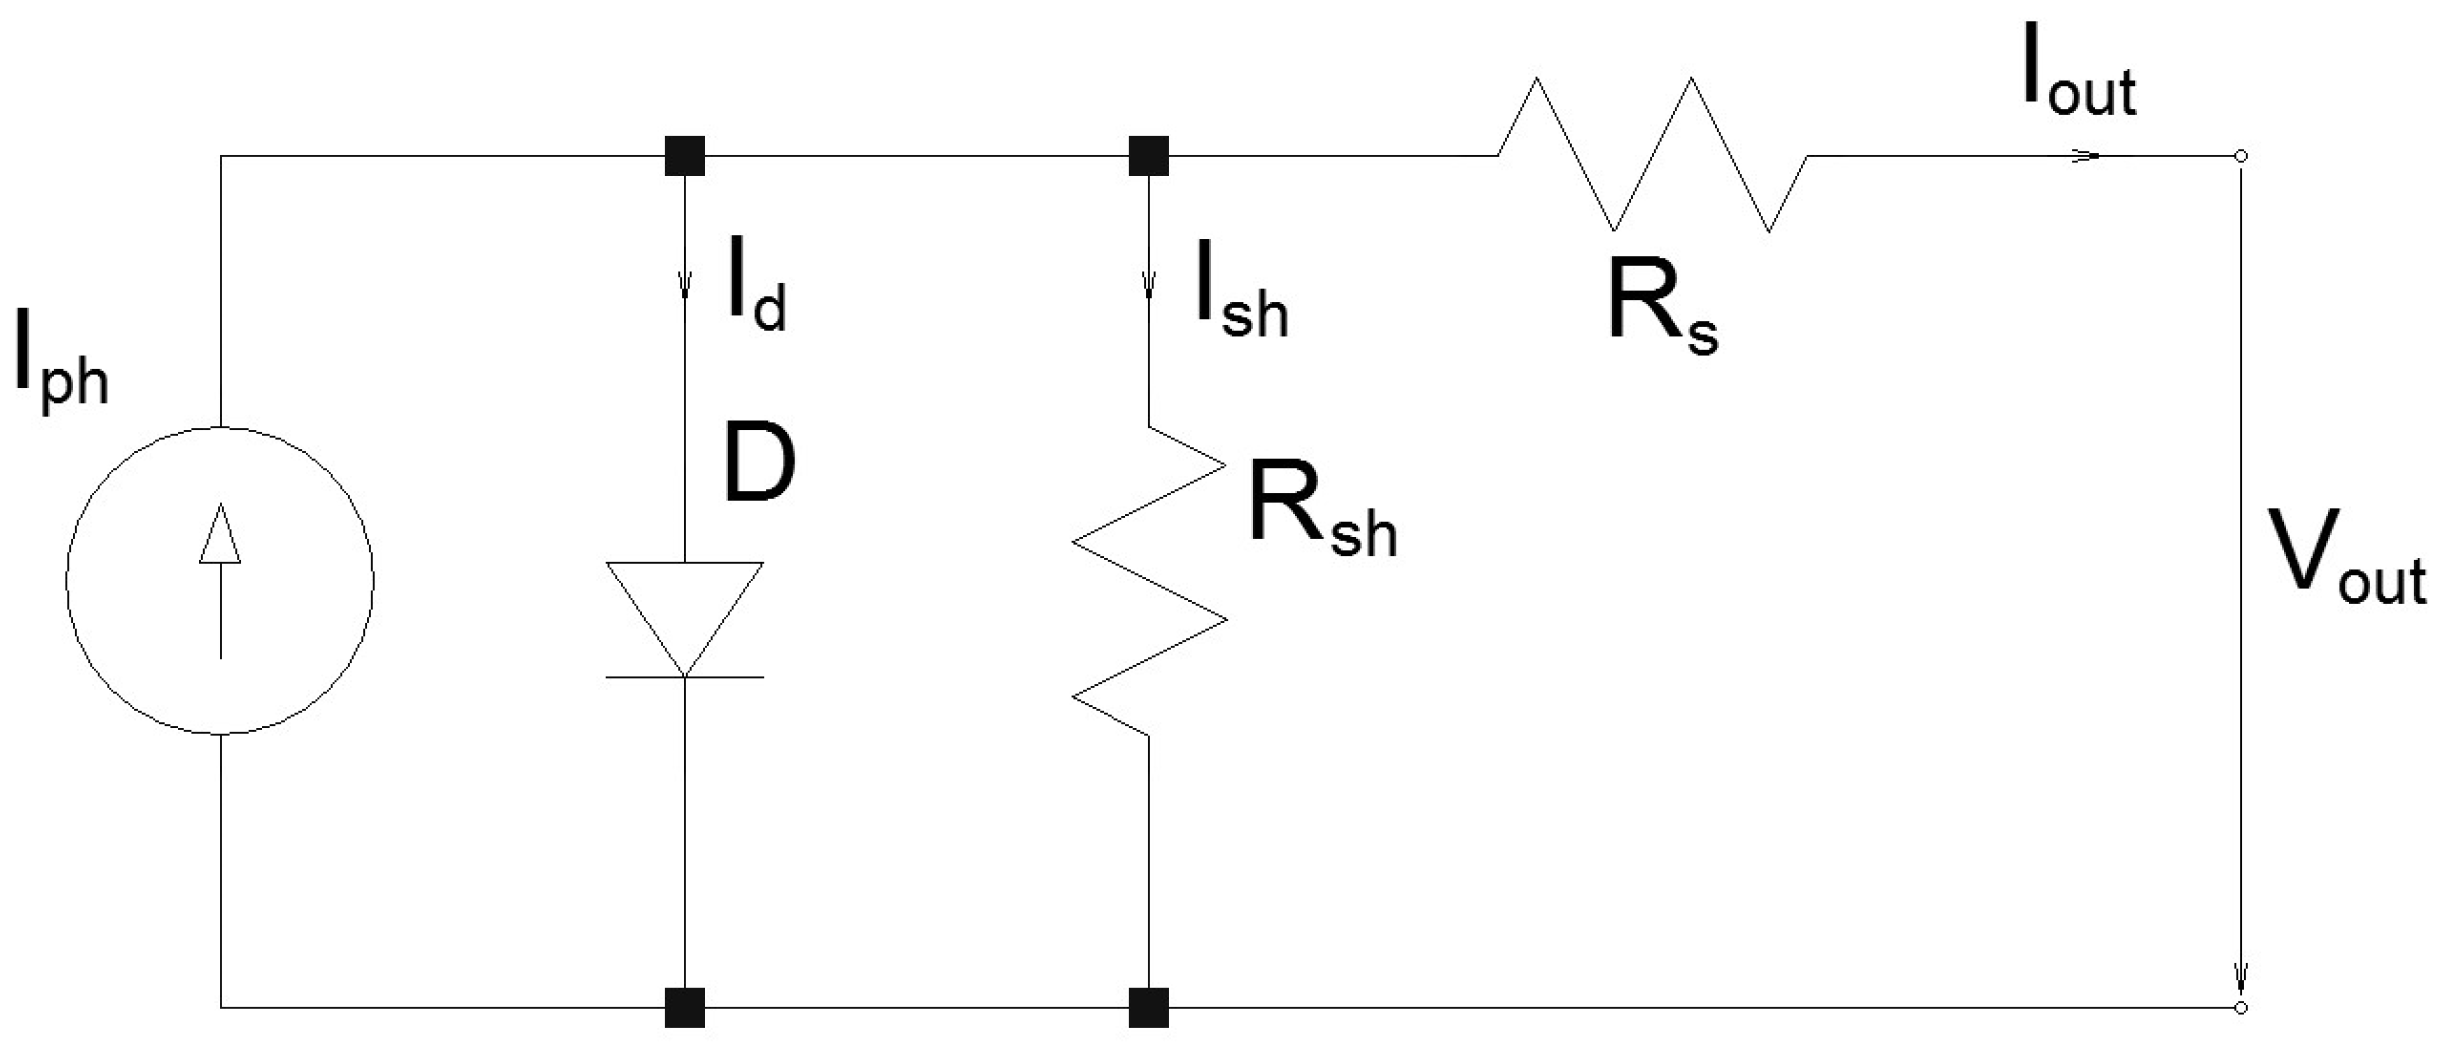
3.2.4. Advanced or Practical Model
3.2.5. Used Simulation Model in this Research
4. Environmental Conditions for PV-Power Electric Vehicles
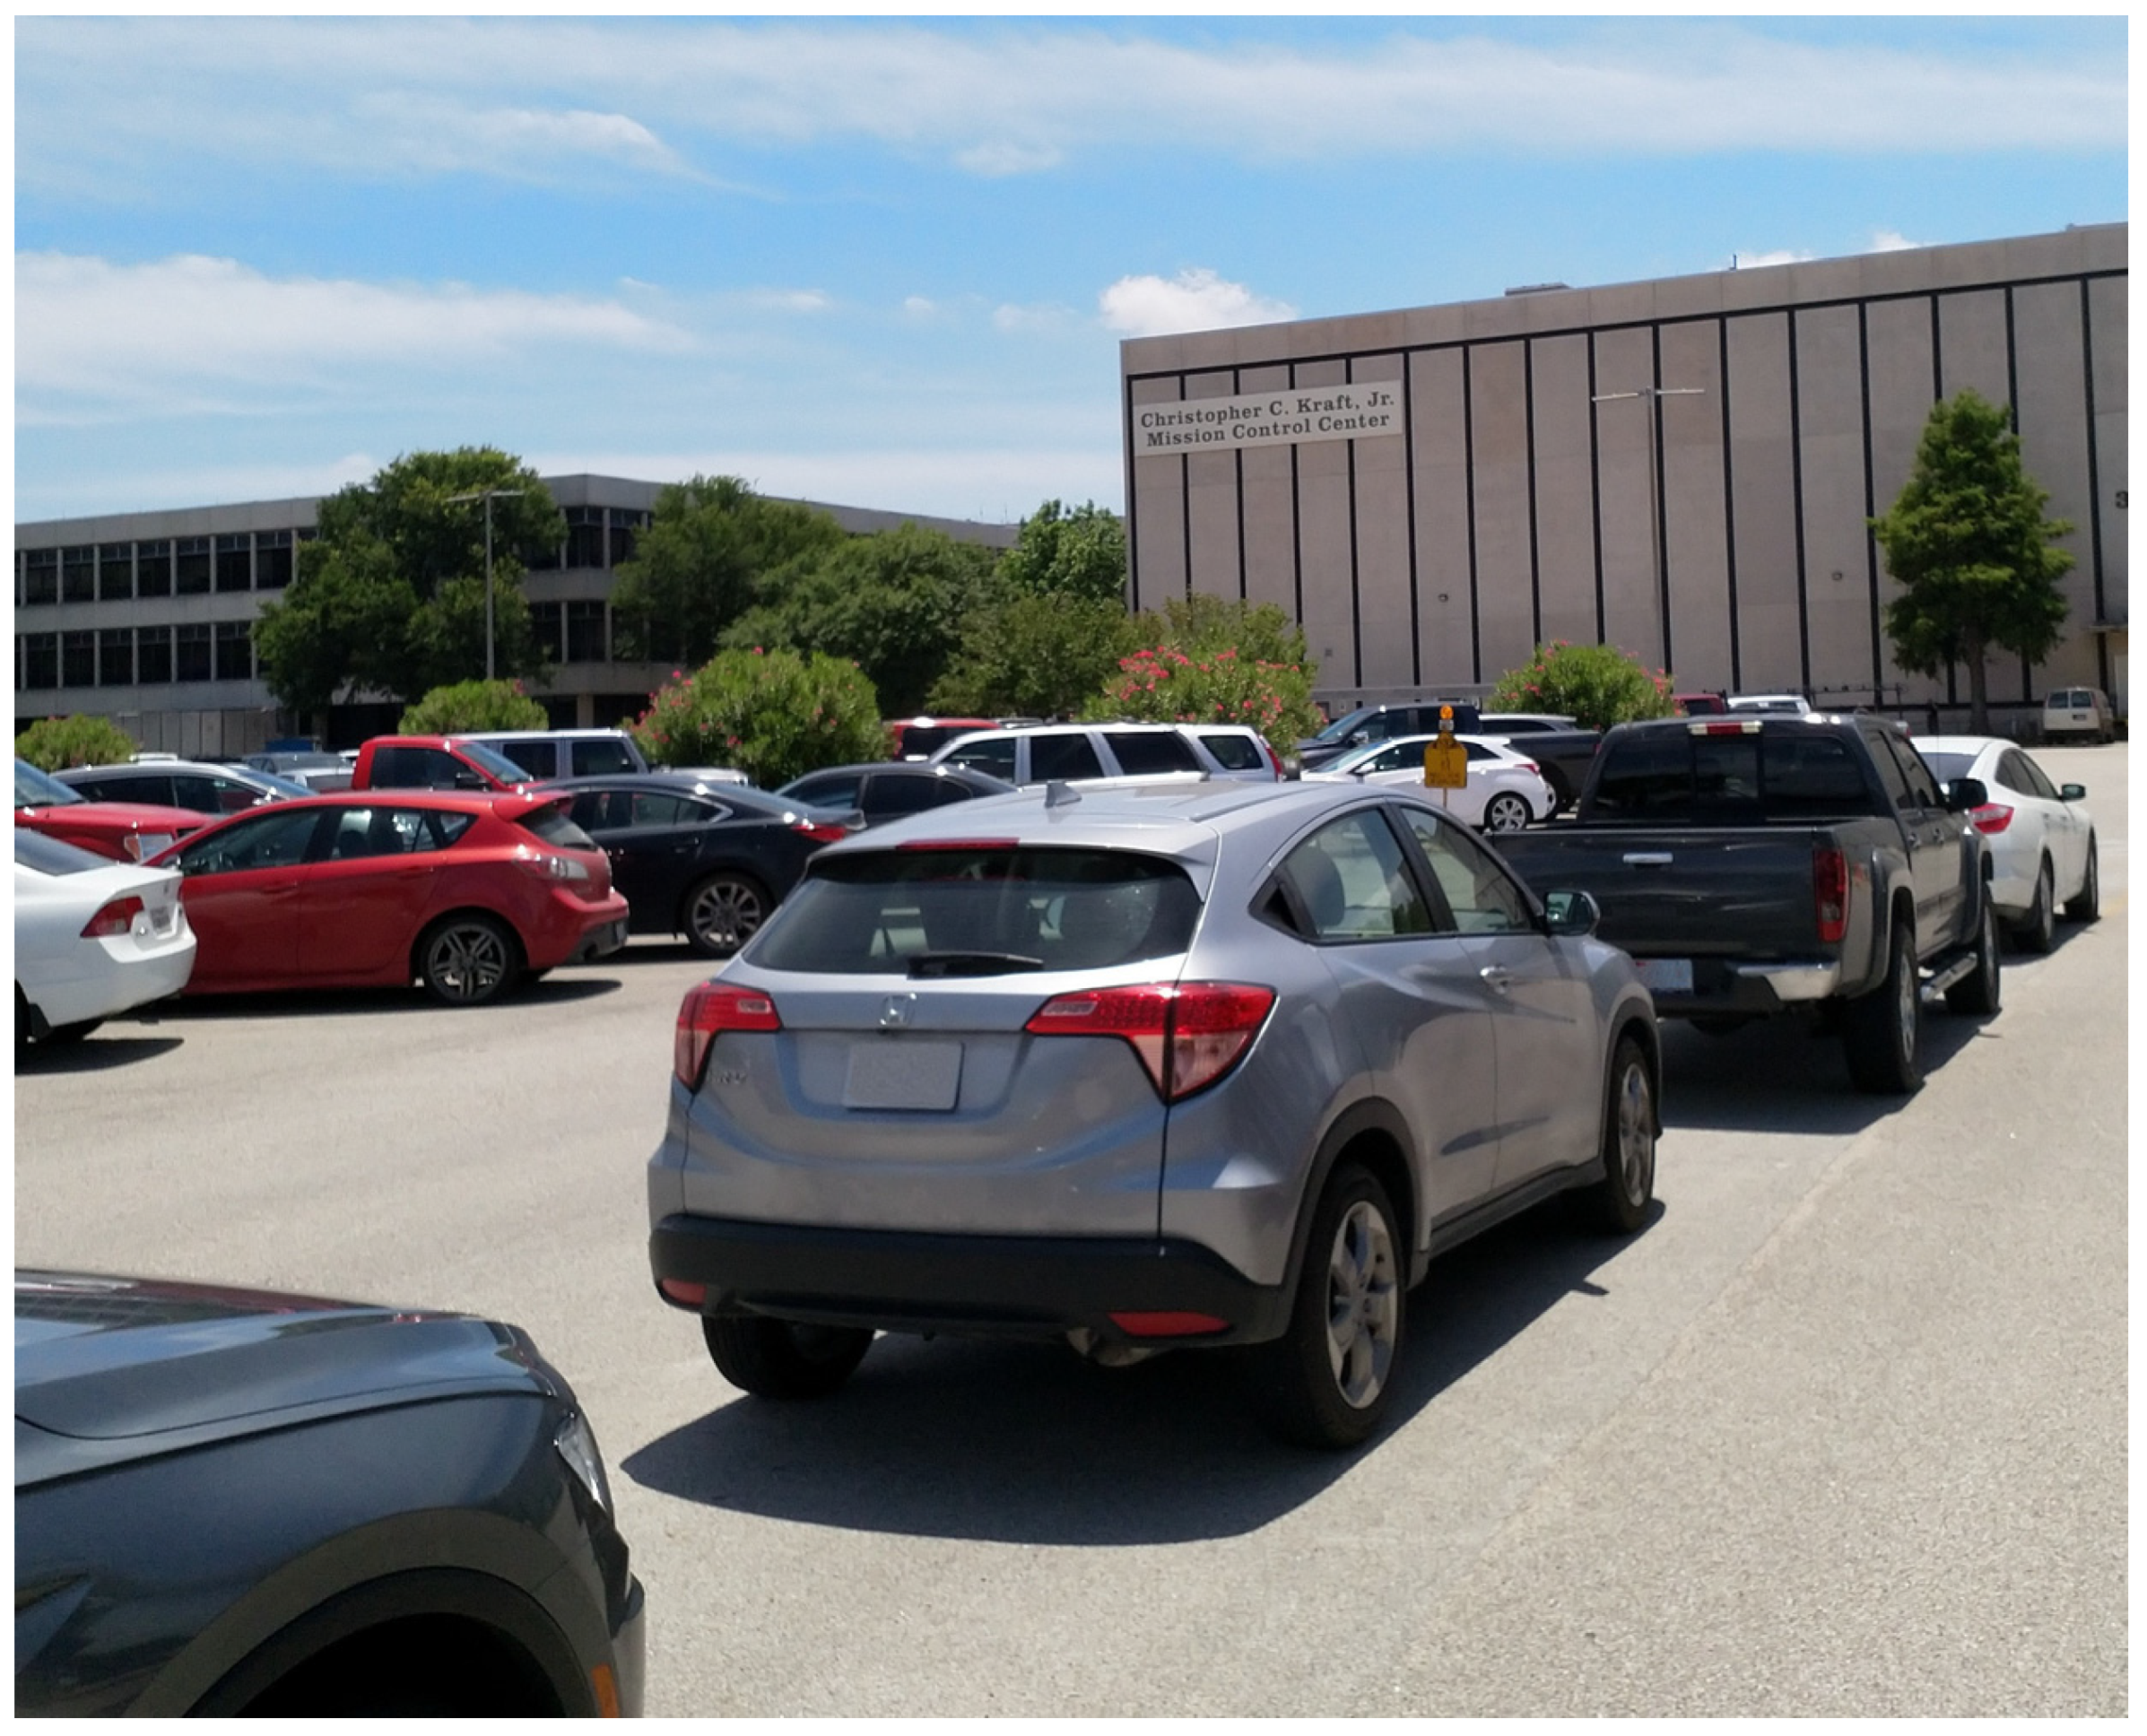
4.1. Parking Conditions
4.2. Examples of Environmental Data in Parking Conditions
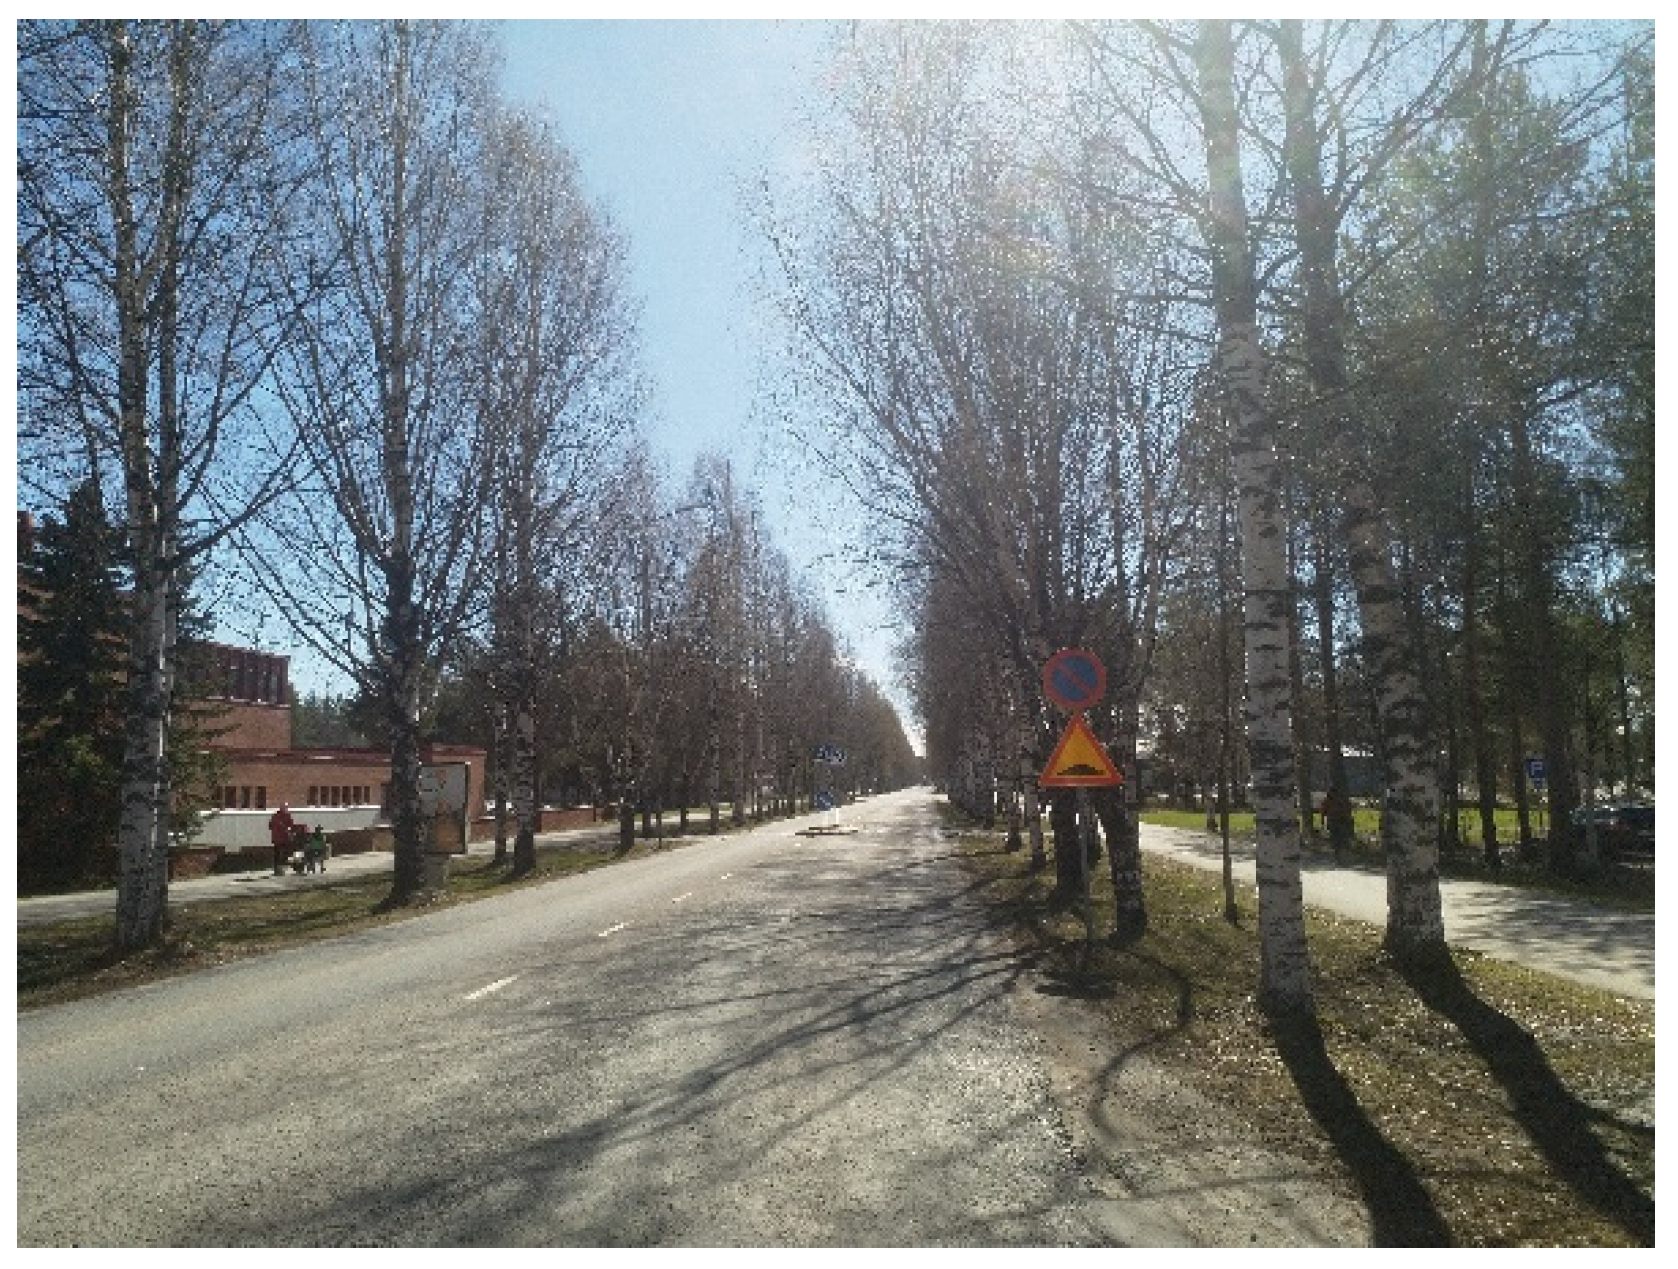
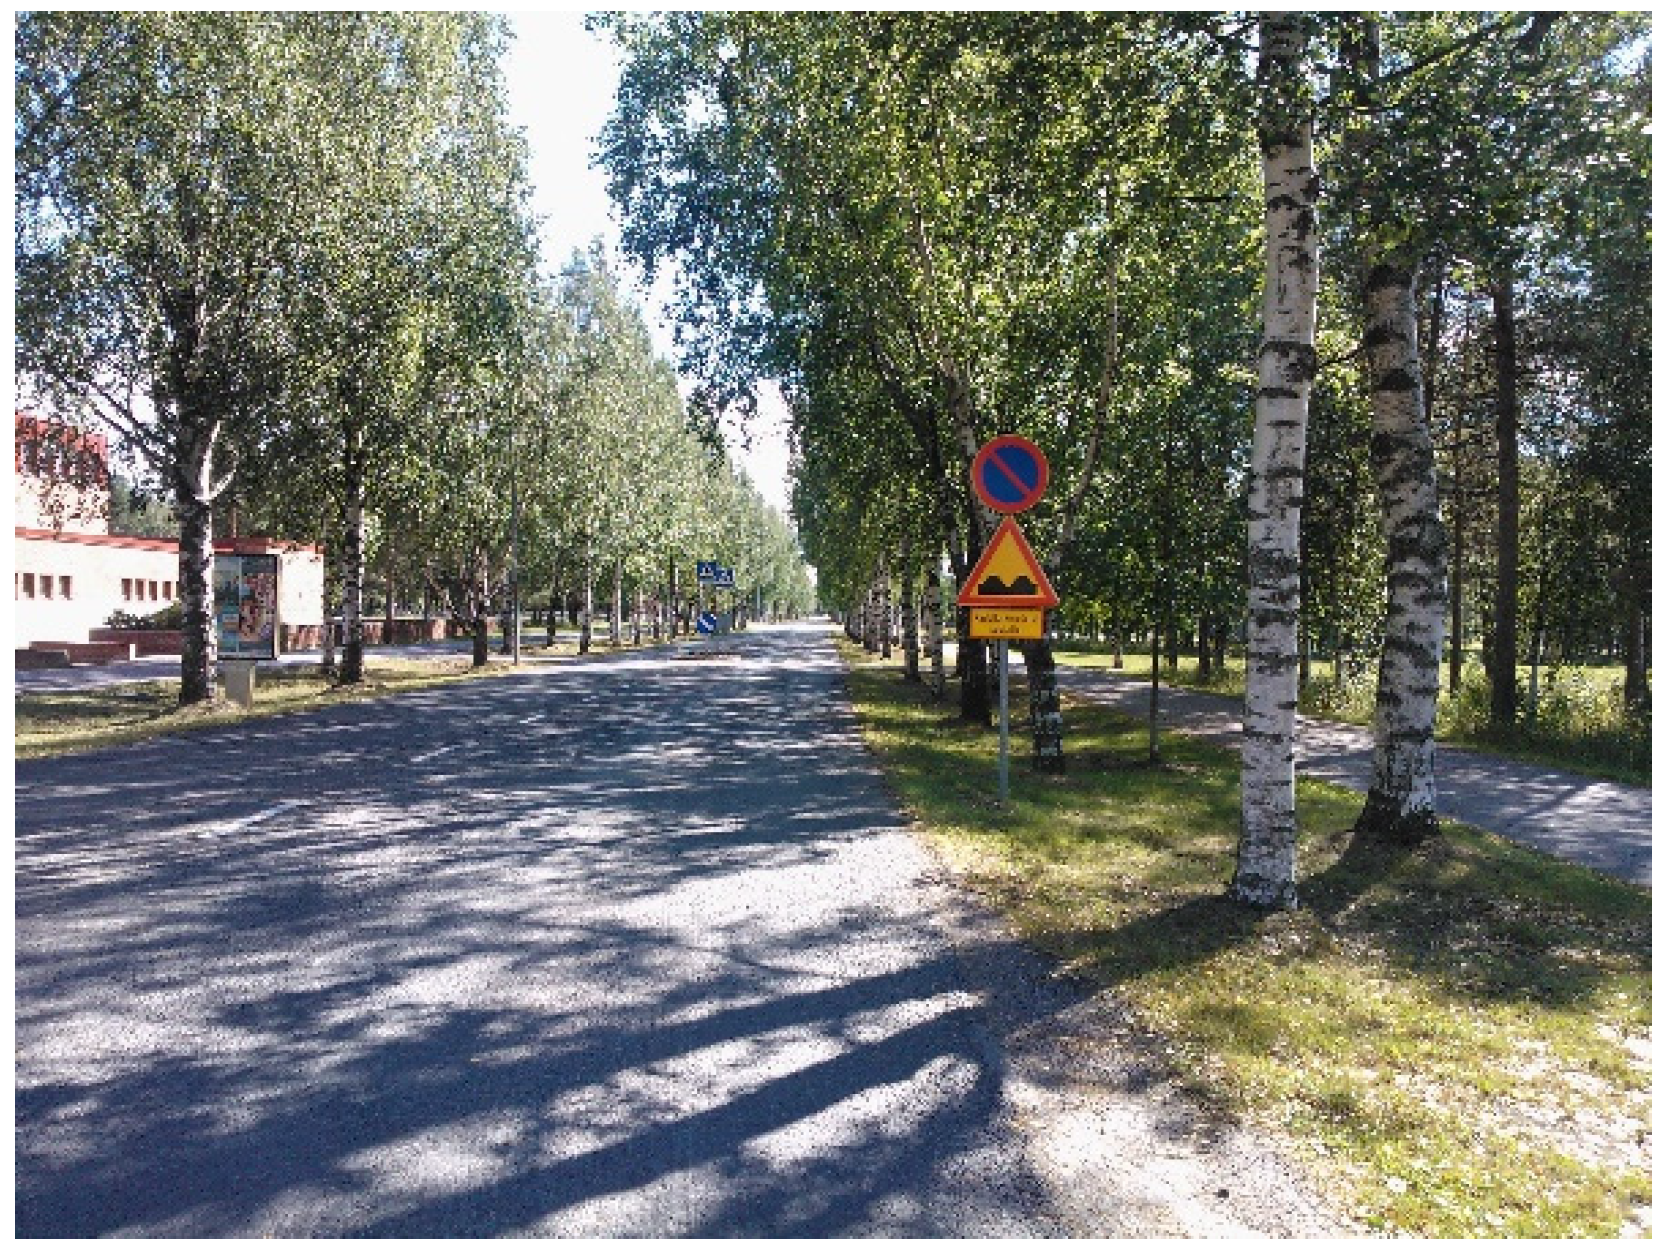
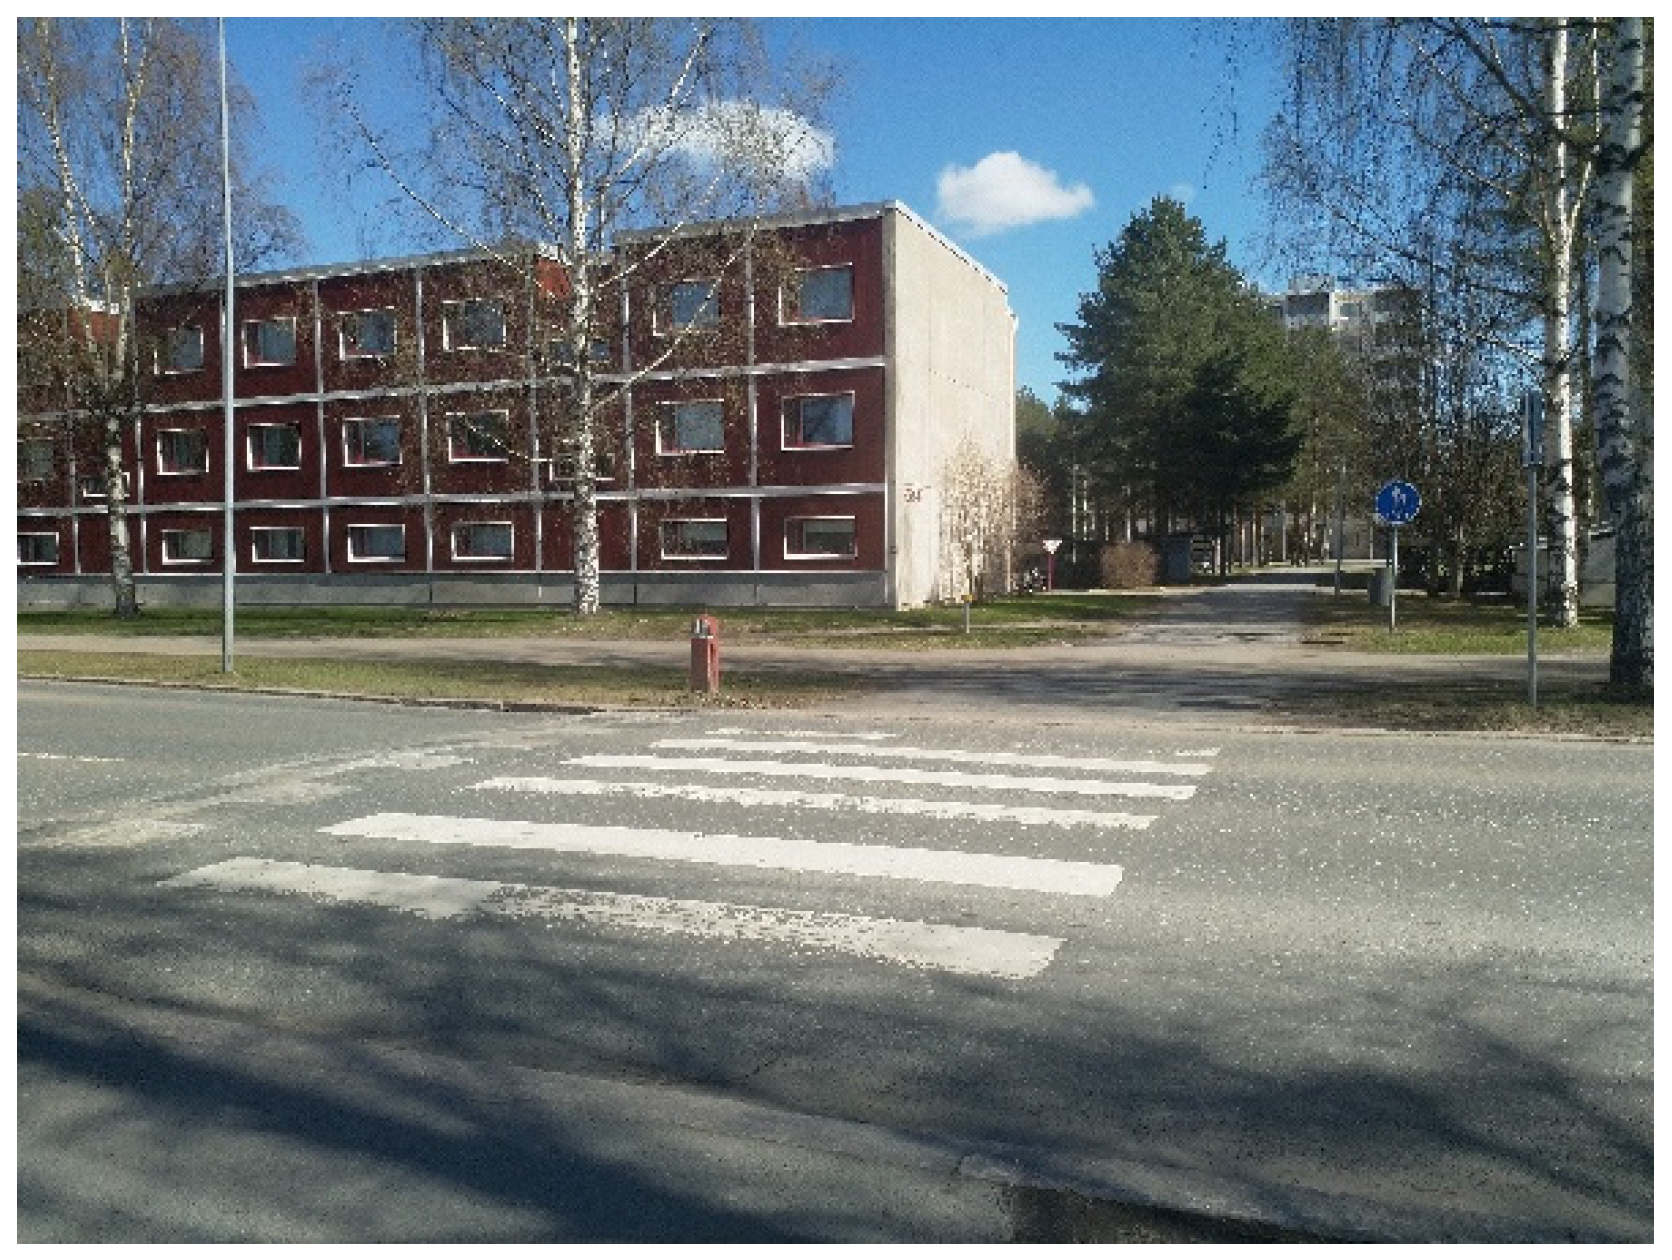
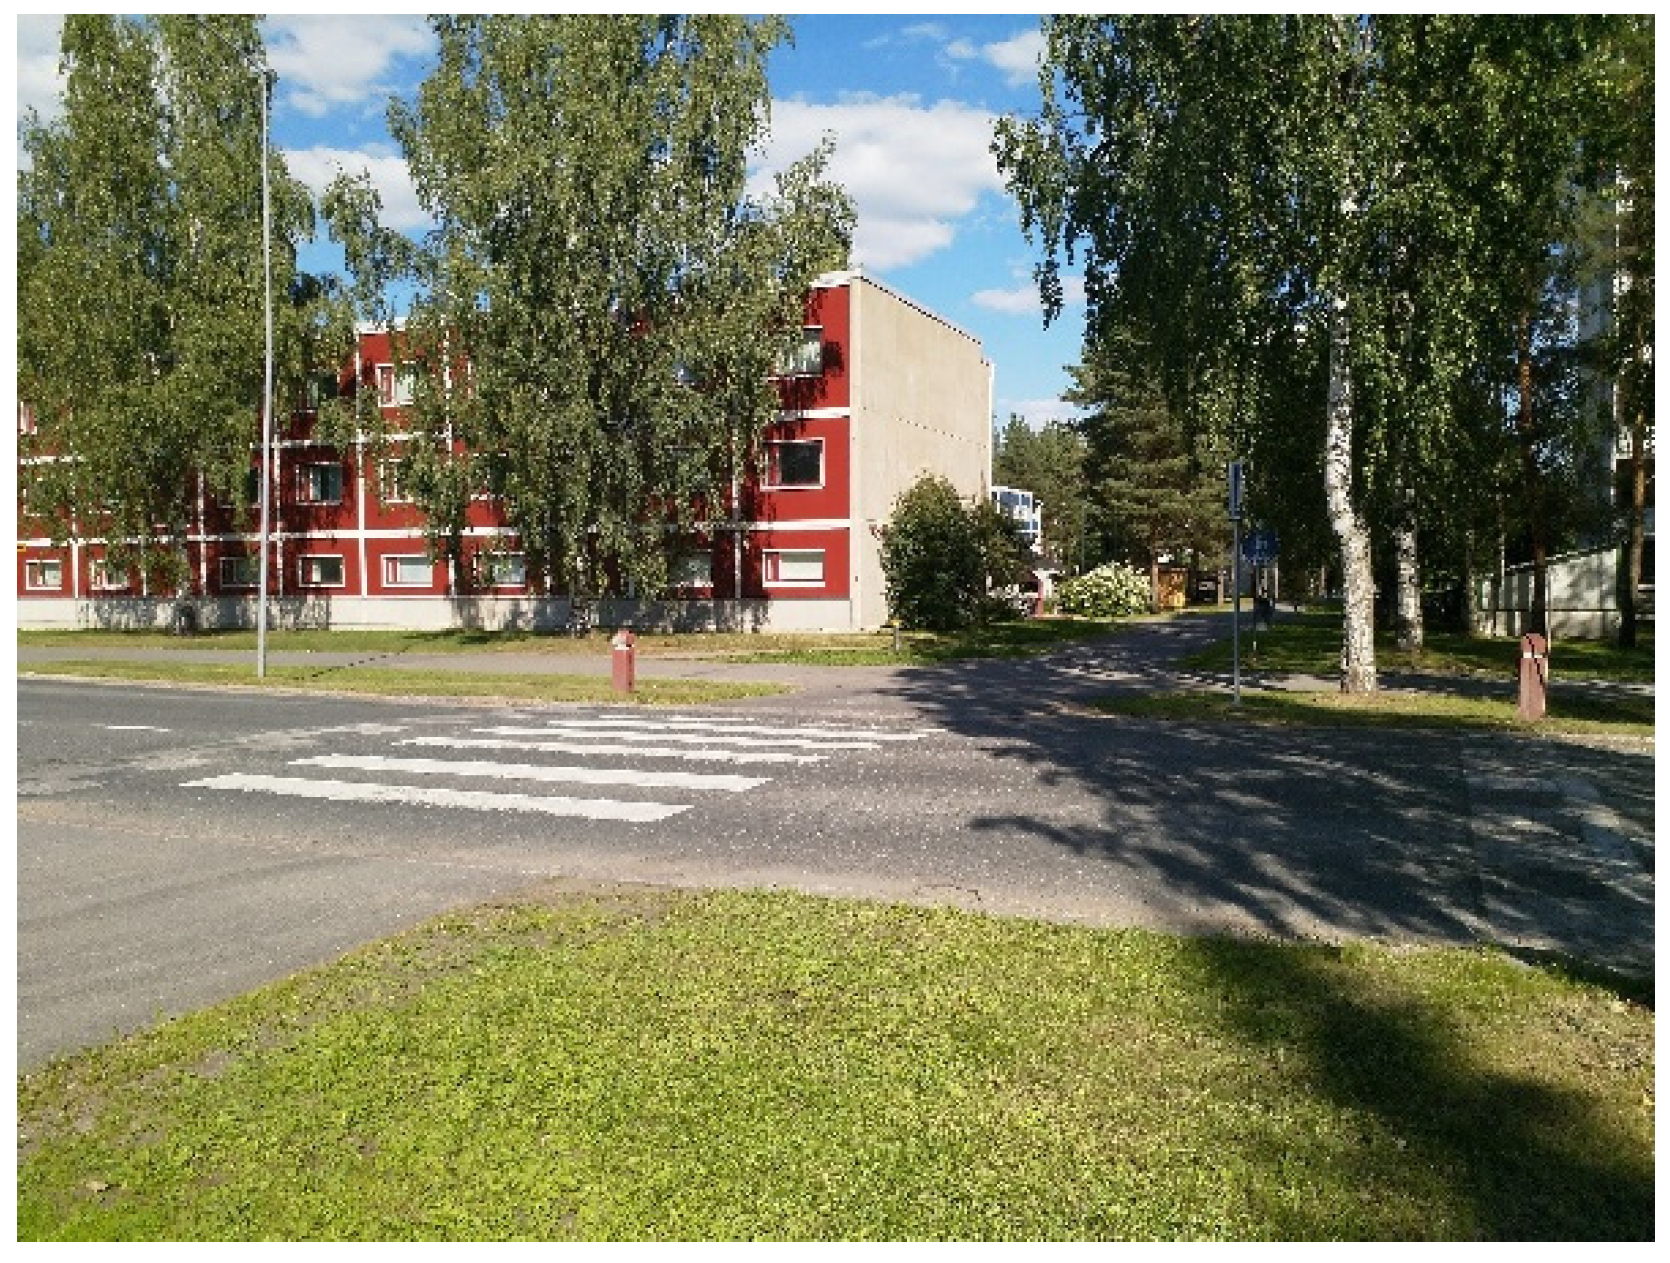
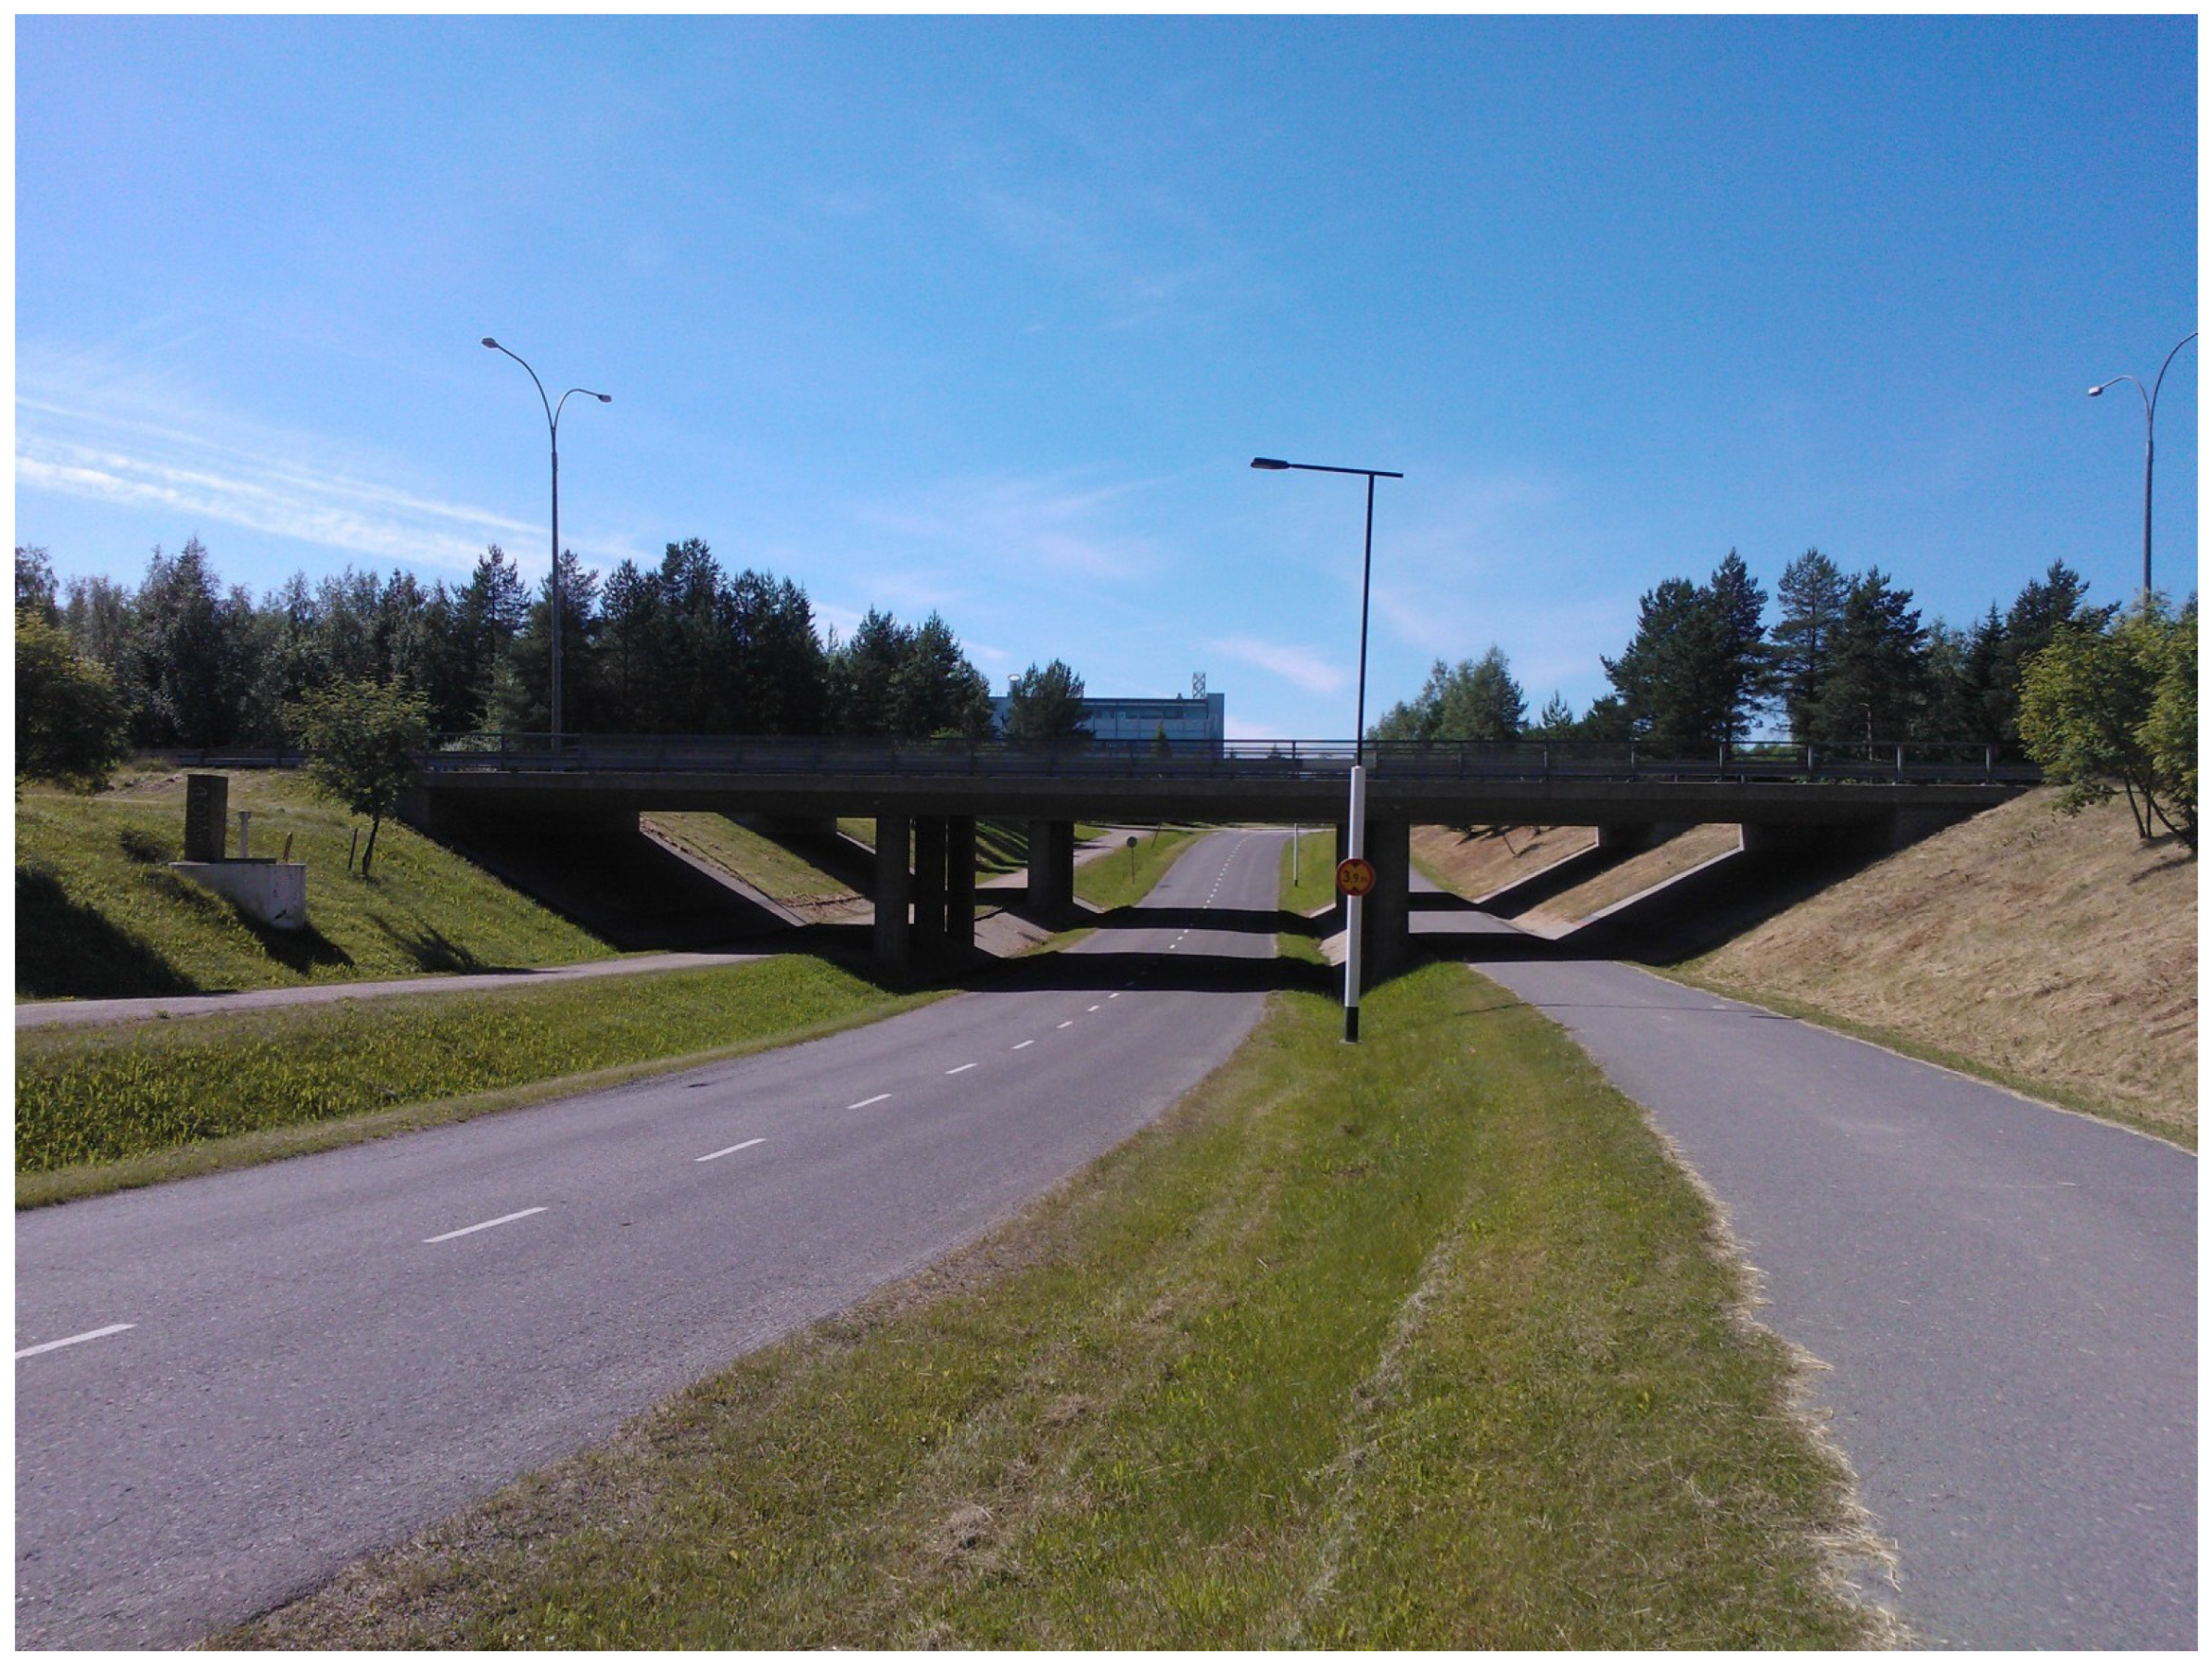
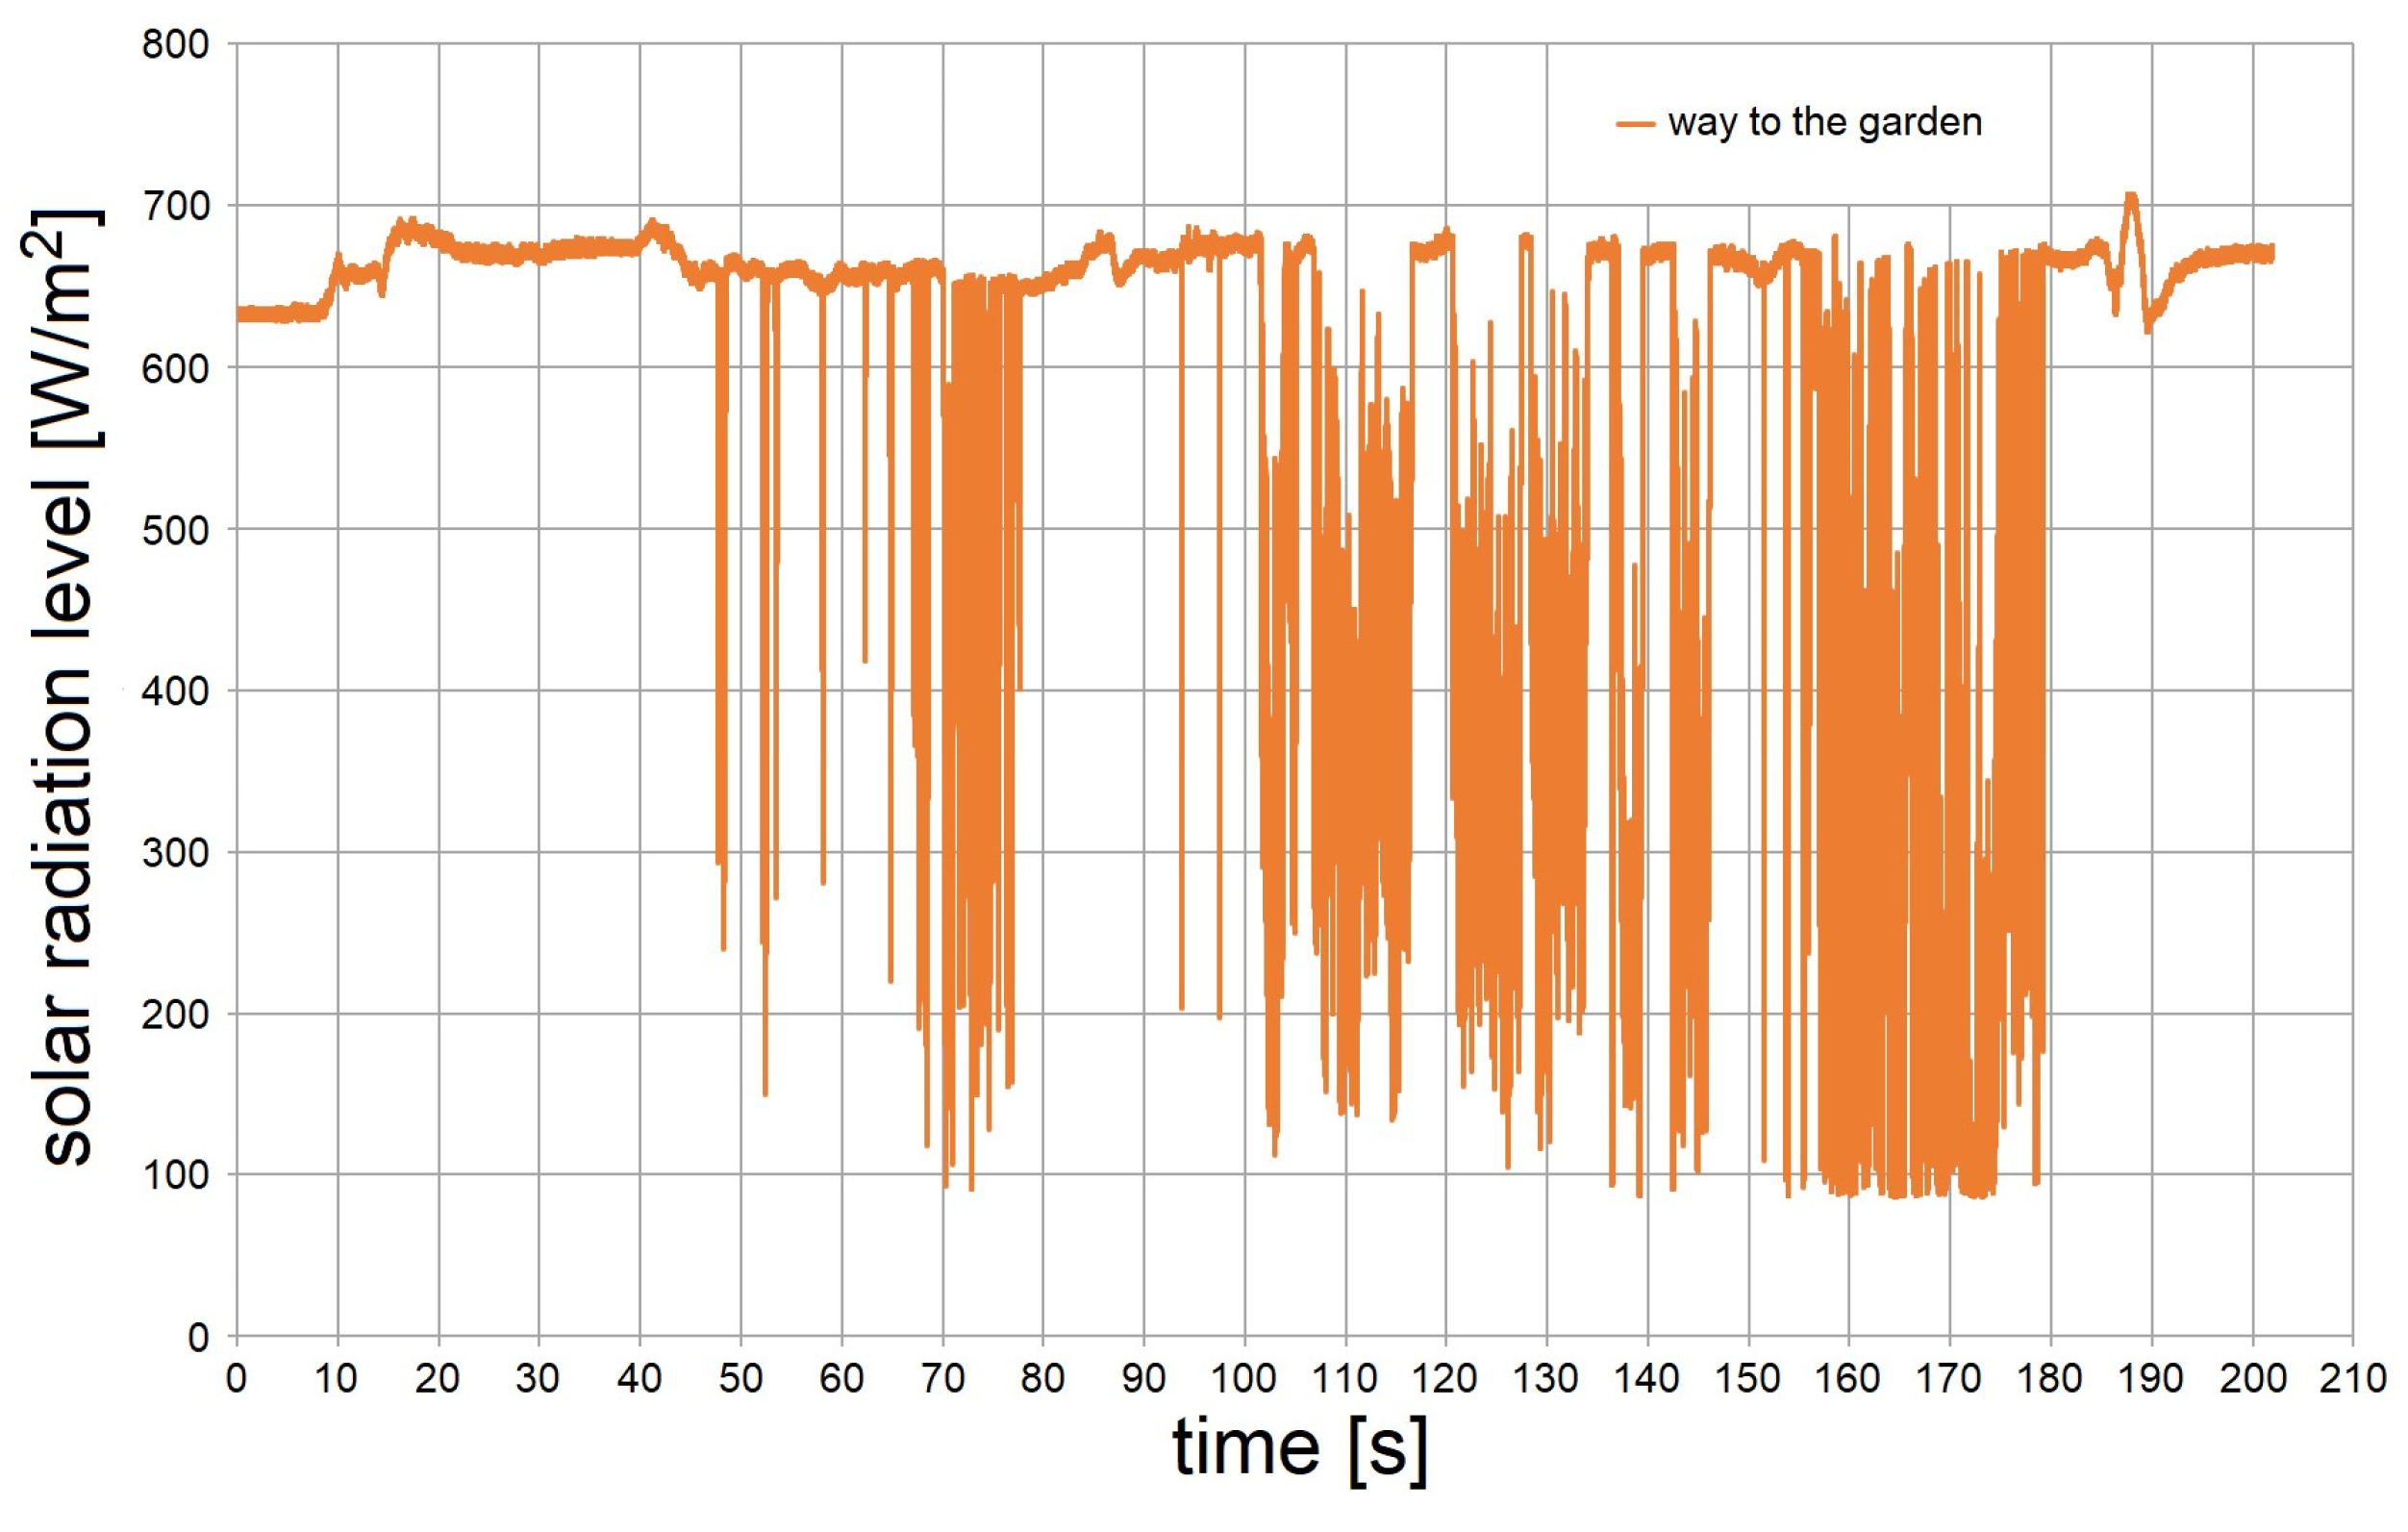
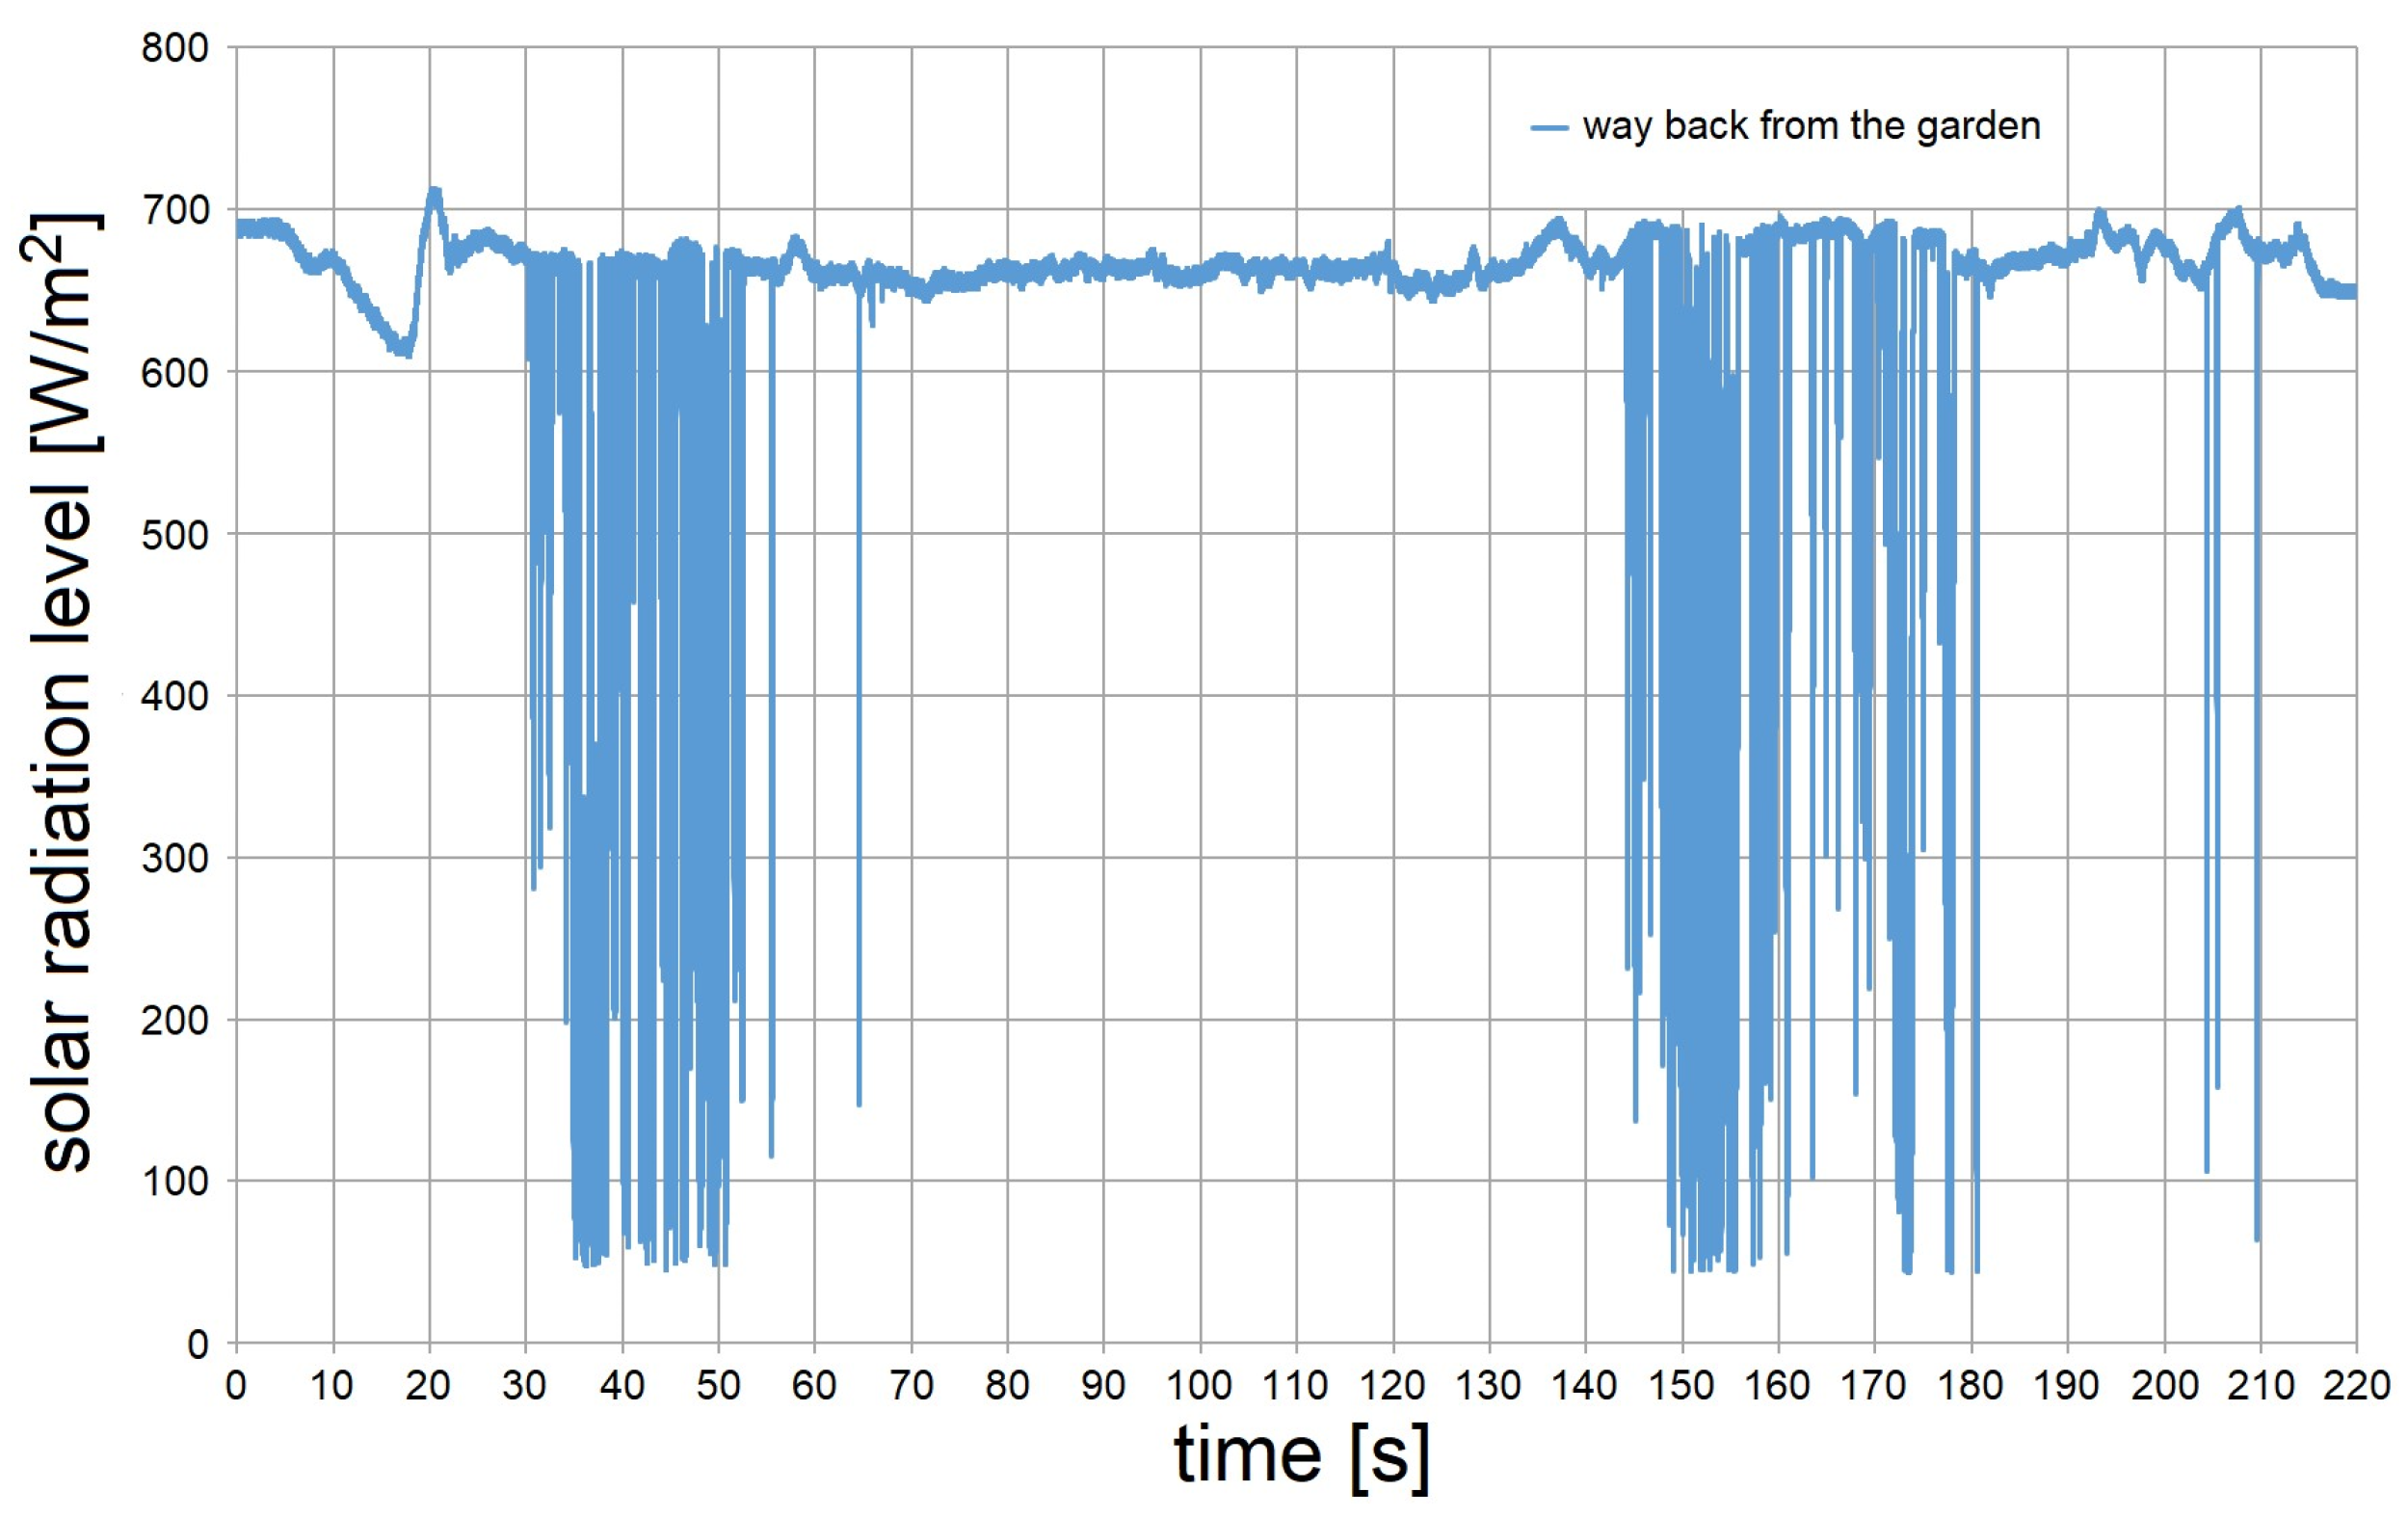
4.3. Driving Conditions
4.4. Examples of Environmental Data in Driving Conditions
5. Analyses and Discussion
5.1. Analyses of the Impacts on the Degree of Efficiency of PV-Powered Vehicles
5.2. Discussion of the Impacts on the Degree of Efficiency of PV-Powered Vehicles
6. Conclusions
Author Contributions
Funding
Institutional Review Board Statement
Informed Consent Statement
Acknowledgments
Conflicts of Interest
References
- Taiebat, M.; Brown, A.L.; Safford, H.R.; Qu, S.; Xu, M. A review on energy, environmental, and sustainability implications of connected and automated vehicles. Environ. Sci. Technol. 2018, 52, 11449–11465. [Google Scholar] [CrossRef] [PubMed]
- Canter, N. How will the growing use of plug-in electric vehicles affect the power grid? TLT 2018, 74, 12–13. [Google Scholar]
- Wang, D.; Sechilariu, M.; Locment, F. PV-powered charging station for electric vehicles: Power management with integrated V2G. Appl. Sci. 2021, 10, 6500. [Google Scholar] [CrossRef]
- Today in Energy. EIA Projects World Energy Consumption Will Increase 56% by 2040. Available online: https://www.eia.gov/todayinenergy/ (accessed on 17 December 2021).
- van Vuuren, D.P.; Nakicenovic, N.; Riahi, K.; Brew-Hammond, A.; Kammen, D.; Modi, V.; Smith, K. An energy vision: The transformation towards sustainability—Interconnected challenges and solutions. Curr. Opin. Environ. Sustain. 2012, 4, 18–34. [Google Scholar] [CrossRef]
- Mekhilef, S.; Saidur, R.; Safari, A. A review on solar energy use in industries. Renew. Sustain. Energy Rev. 2011, 15, 1777–1790. [Google Scholar] [CrossRef]
- Mouli, G.R.C.; Bauer, P.; Zeman, M. System design for a solarpowered electric vehicle charging station for workplaces. Appl. Energy 2016, 168, 434–443. [Google Scholar] [CrossRef] [Green Version]
- Cai, L.; Dai, N.; Tan, Z. Research on mathematical model and calculation simulation of wireless sensor solar cells in Internet of Things. J. Wirel. Commun. Netw. 2018, 1, 116. [Google Scholar] [CrossRef] [Green Version]
- Commault, B.; Duigou, T.; Maneval, V.; Gaume, J.; Chabuel, F.; Voroshazi, E. Overview and Perspectives for Vehicle-Integrated Photovoltaics. Appl. Sci. 2021, 11, 11598. [Google Scholar] [CrossRef]
- Schuss, C.; Gall, H.; Eberhart, K.; Illko, H.; Eichberger, B. Alignment and interconnection of photovoltaics on electric and hybrid electric vehicles. In Proceedings of the IEEE International Instrumentation and Measurement Technology Conference (I2MTC), Montevideo, Uruguay, 12–15 May 2014. [Google Scholar]
- Krim, Y.; Sechilariu, M.; Locment, F. PV Benefits Assessment for PV-Powered Charging Stations for Electric Vehicles. Appl. Sci. 2021, 11, 4127. [Google Scholar] [CrossRef]
- Cheikh-Mohamad, S.; Sechilariu, M.; Locment, F.; Krim, Y. PV-Powered Electric Vehicle Charging Stations: Preliminary Requirements and Feasibility Conditions. Appl. Sci. 2021, 11, 1770. [Google Scholar] [CrossRef]
- Schuss, C.; Fabritius, T.; Eichberger, B.; Rahkonen, T. Moving Photovoltaic Installations: Impacts of the Sampling Rate on Maximum Power Point Tracking Algorithms. IEEE Trans. Instrum. Meas. 2019, 68, 1485–1493. [Google Scholar] [CrossRef]
- Birnie, D.P., III. Analysis of energy capture by vehicle solar roofs in conjunction with workplace plug-in charging. Sol. Energy 2016, 125, 219–226. [Google Scholar] [CrossRef]
- Schuss, C.; Kotikumpu, T.; Eichberger, B.; Rahkonen, T. Impact of Dynamic Environmental Conditions on the Output Behaviour of Photovoltaics. In Proceedings of the 20th IMEKO TC4 International Symposium and 18th International Workshop on ADC Modelling and Testing, Benevento, Italy, 15–17 September 2014. [Google Scholar]
- Araki, K.; Ji, L.; Kelly, G.; Yamaguchi, M. To Do List for Research and Development and International Standardization to Achieve the Goal of Running a Majority of Electric Vehicles on Solar Energy. Coatings 2018, 8, 251. [Google Scholar] [CrossRef] [Green Version]
- Number of Passenger Cars and Commercial Vehicles in Use Worldwide from 2006 to 2015 in (1000 units). Available online: https://www.statista.com/statistics/281134/number-of-vehicles-in-useworldwide/ (accessed on 17 December 2021).
- Schuss, C.; Fabritius, T.; Eichberger, B.; Rahkonen, T. Energy-efficient Routing of Electric Vehicles with Integrated Photovoltaic Installations. In Proceedings of the IEEE International Instrumentation and Measurement Technology Conference (I2MTC), Dubrovnik, Croatia, 25–28 May 2020. [Google Scholar]
- Schuss, C.; Rahkonen, T. Adaptive photovoltaic cell simulation with maximum power point tracking simulation for accurate energy predictions. In Proceedings of the NORCHIP, Lund, Sweden, 14–15 November 2011. [Google Scholar]
- Tsai, H.-L. Insolation-oriented model of photovoltaic module using Matlab/Simulink. Solar Energy 2010, 84, 1318–1326. [Google Scholar] [CrossRef]
- Schuss, C.; Eichberger, B.; Rahkonen, T. Measurement and verification of photovoltaic (PV) simulation models. In Proceedings of the IEEE International Instrumentation and Measurement Technology Conference (I2MTC), Minneapolis, MN, USA, 6–9 May 2013. [Google Scholar]
- Cristaldi, L.; Faifer, F.; Rossi, M.; Ponci, F. A simple photovoltaic panel model: Characterization procedure and evaluation of the role of environmental measurements. IEEE Trans. Instrum. Meas. 2012, 61, 2632–2641. [Google Scholar] [CrossRef] [Green Version]
- Villalva, M.G.; Ernesto Ruppert, F. Analysis and simulation of the P&O MPPT algorithm using a linearized PV array model. In Proceedings of the 35th Annual Conference of IEEE Industrial Electronics, Porto, Portugal, 3–5 November 2009. [Google Scholar]
- Schuss, C.; Eichberger, B.; Rahkonen, T. Impact of sampling interval on the accuracy of estimating the amount of solar energy. In Proceedings of the IEEE International Instrumentation and Measurement Technology Conference (I2MTC), Taipei, Taiwan, 23–26 May 2016. [Google Scholar]
- Ota, Y.; Masuda, T.; Araki, K.; Yamaguchi, M. Curve-correction factor for characterization of the output of a three-dimensional curved photovoltaic module on a car roof. Coatings 2018, 8, 432. [Google Scholar] [CrossRef] [Green Version]
- Toyota Is Testing a New Solar-Powered Prius. Available online: https://www.popularmechanics.com/cars/hybridelectric/a28322554/toyois-testing-a-new-solar-powered-prius/ (accessed on 17 December 2021).
- Chau, K.T.; Wong, Y.S. Overview of power management in hybrid electric vehicles. Energy Convers. Manag. 2002, 43, 1953–1968. [Google Scholar] [CrossRef]
- Aharon, I.; Kuperman, A. Topological Overview of Powertrains for Battery-Powered Vehicles With Range Extenders. IEEE Trans. Power Electron. 2011, 26, 868–876. [Google Scholar] [CrossRef]
- Karden, E.; Ploumen, S.; Fricke, B.; Miller, T.; Snyder, K. Energy storage devices for future hybrid electric vehicles. J. Power Sources 2007, 168, 2–11. [Google Scholar] [CrossRef]
- Hall, R.N. Silicon Photovoltaic Cells. Solid-State Electron. 1981, 24, 595–616. [Google Scholar] [CrossRef]
- Green, M.A. General solar cell curve factors including the effects of ideality factor, temperature and series resistance. Solid-State Electron. 1977, 20, 265–266. [Google Scholar] [CrossRef]
- Esram, T.; Chapman, P.L. Comparison of Photovoltaic Array Maximum Power Point Tracking Techniques. IEEE Trans. Energy Convers. 2007, 22, 439–449. [Google Scholar] [CrossRef] [Green Version]
- Schuss, C.; Eichberger, B.; Fabritius, T. An Advanced PV Simulation Model for Electric Vehicles with Photovoltaic Installations. In Proceedings of the IEEE International Instrumentation and Measurement Technology Conference (I2MTC), Glasgow, Scotland, 17–20 May 2021. [Google Scholar]
- Schuss, C.; Fabritius, T.; Eichberger, B.; Rahkonen, T. Calculating the output power of photovoltaic cells on top of electric and hybrid electric vehicles. In Proceedings of the IEEE International Instrumentation and Measurement Technology Conference (I2MTC), Auckland, New Zealand, 20–23 May 2019. [Google Scholar]


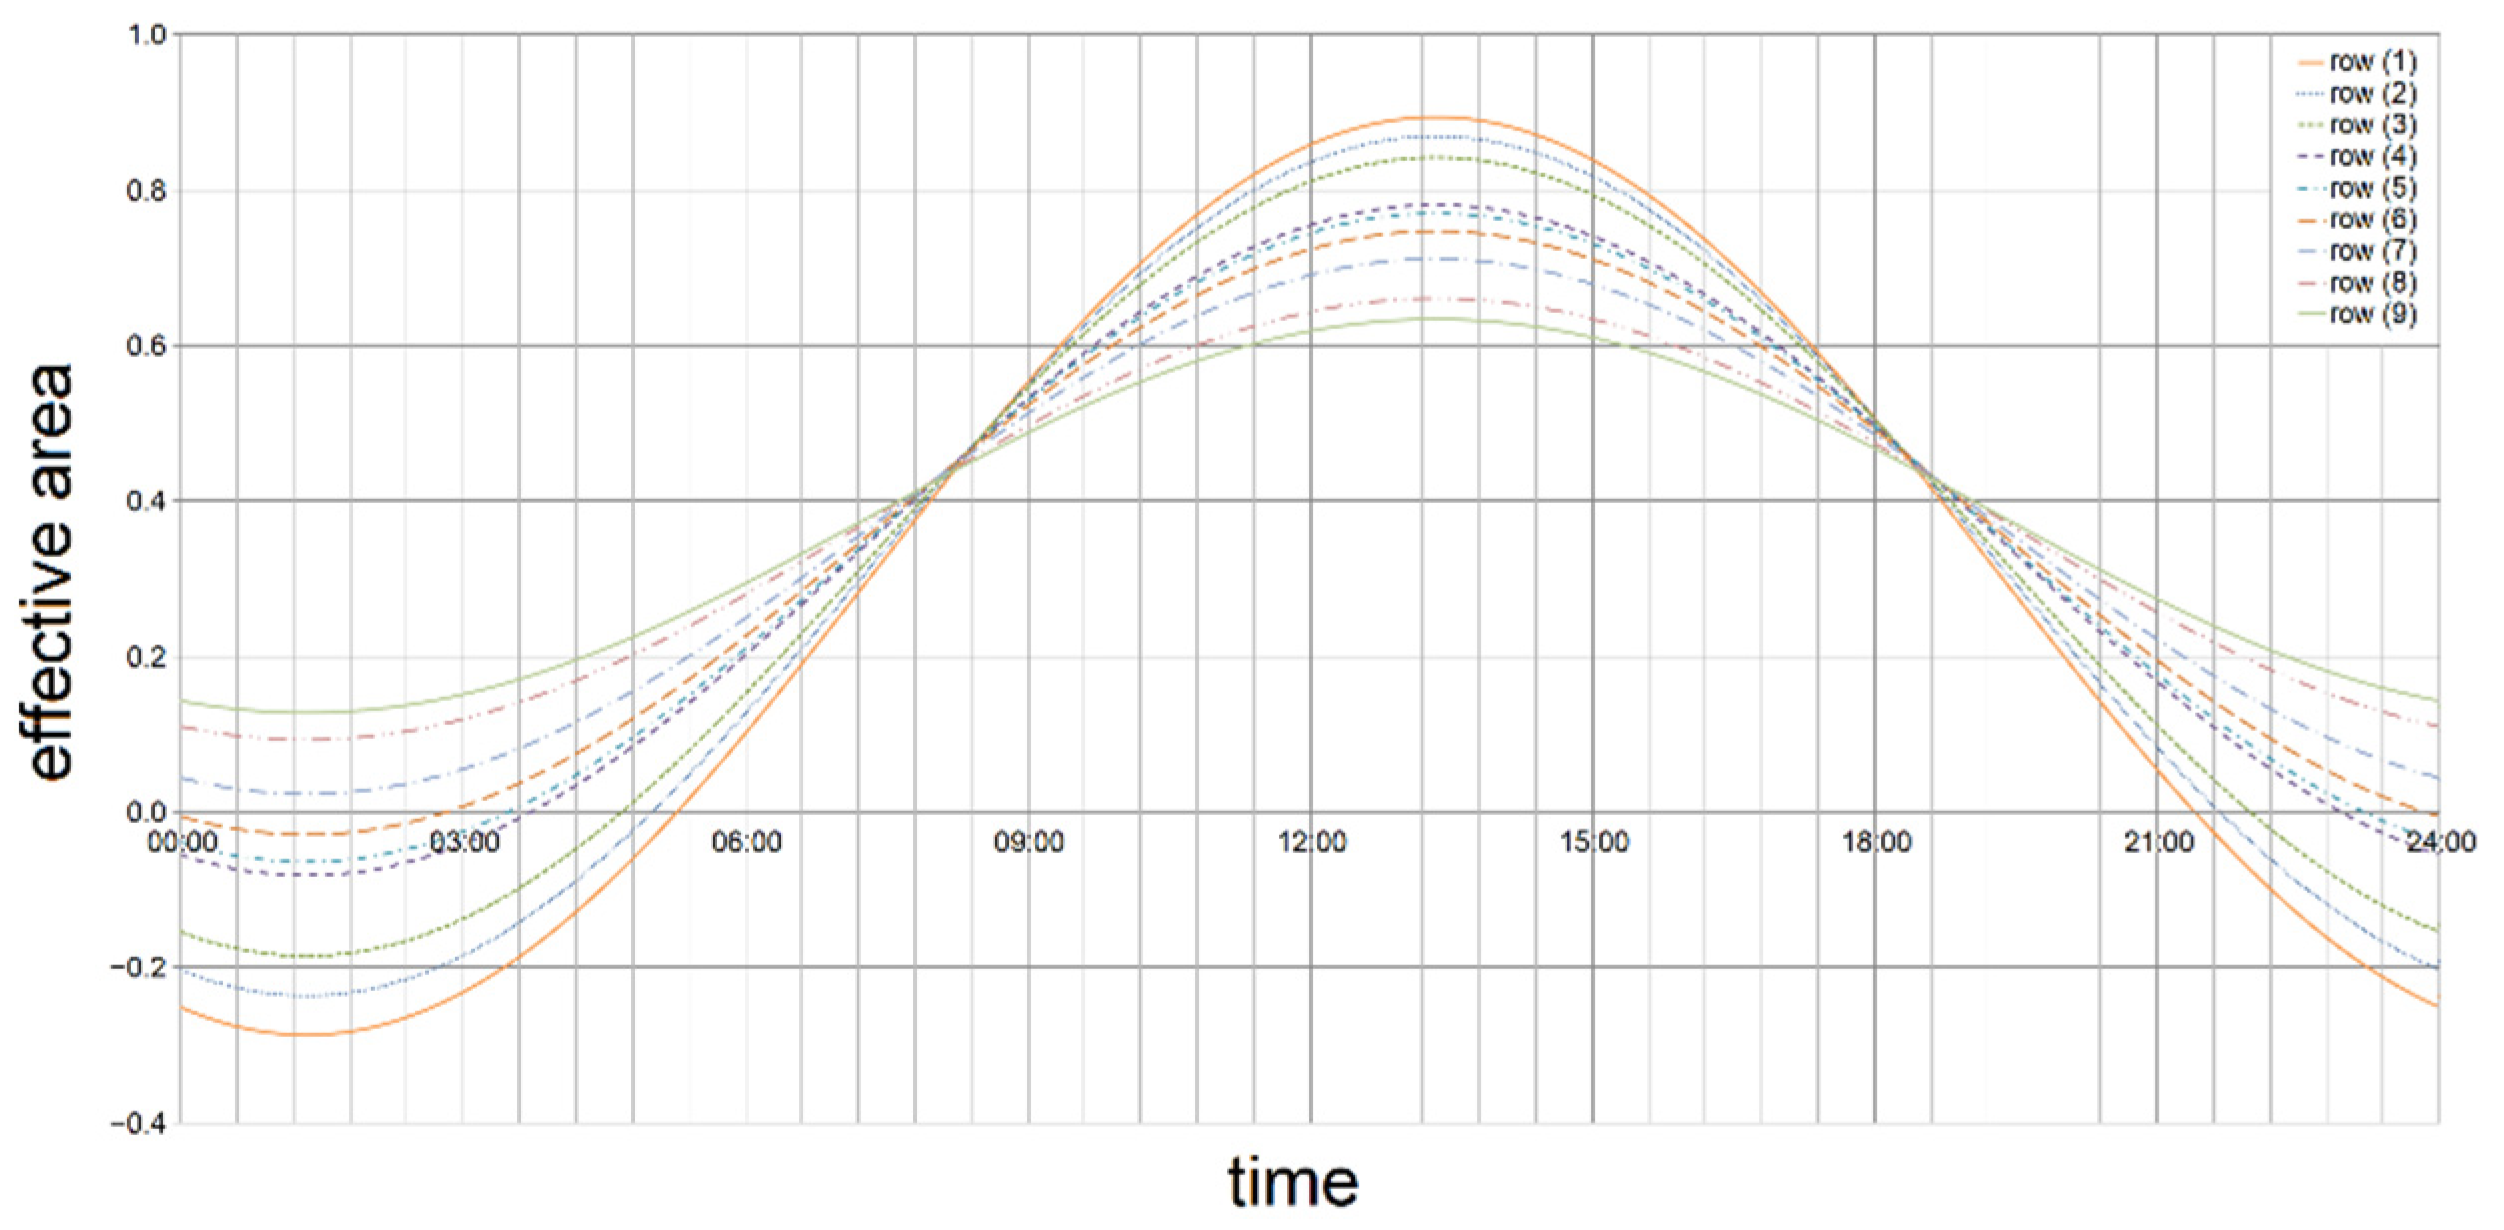
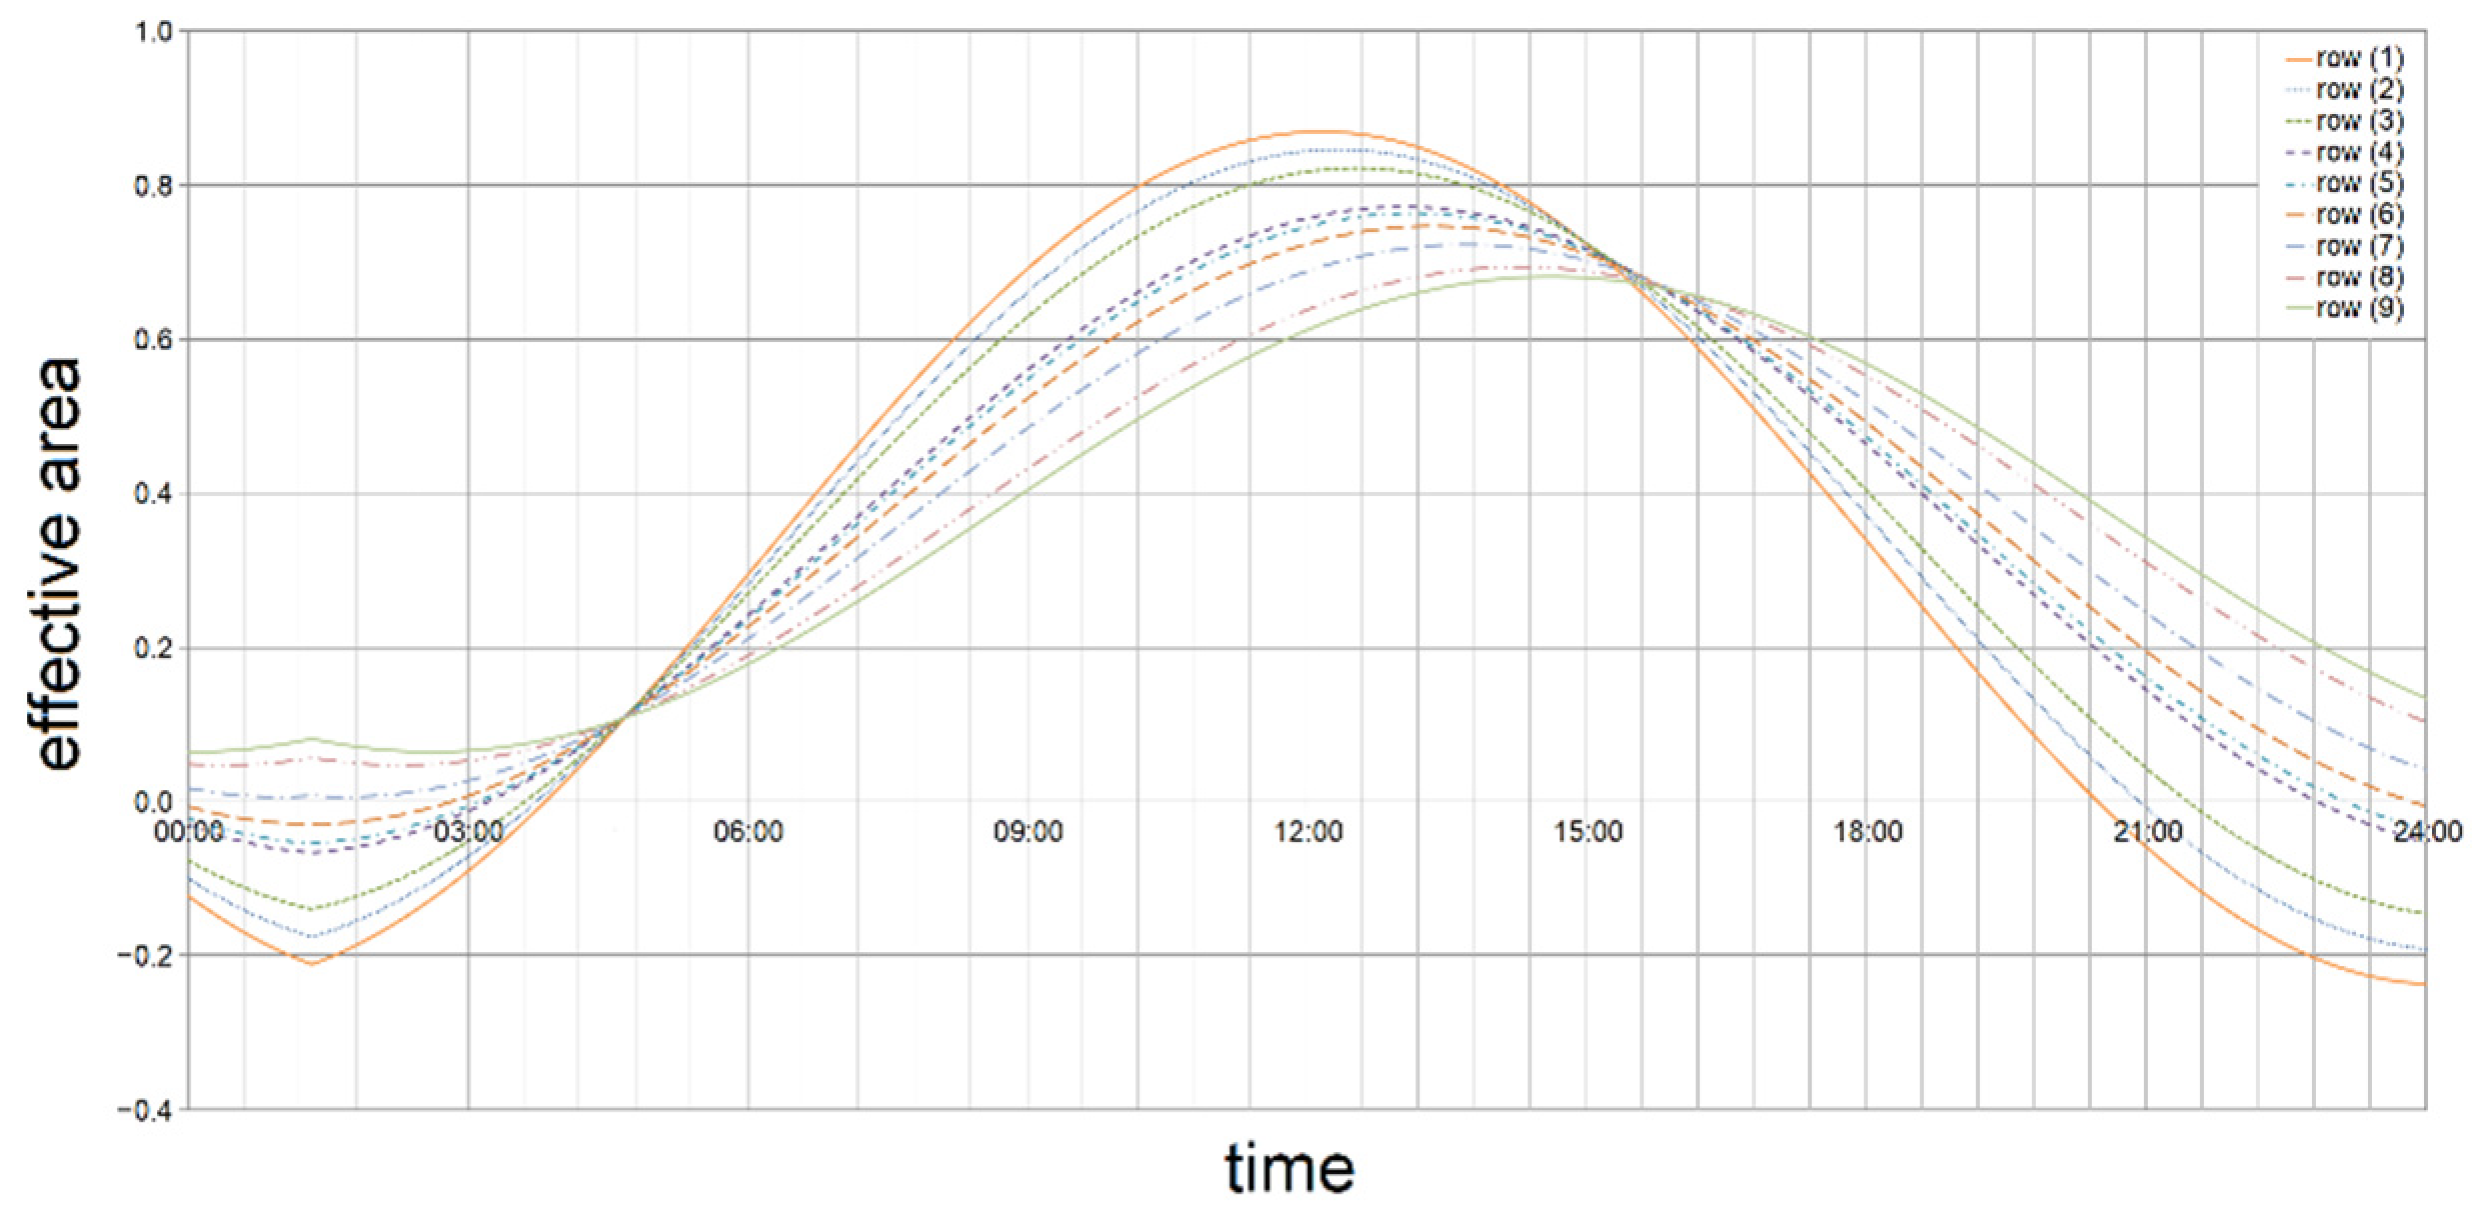
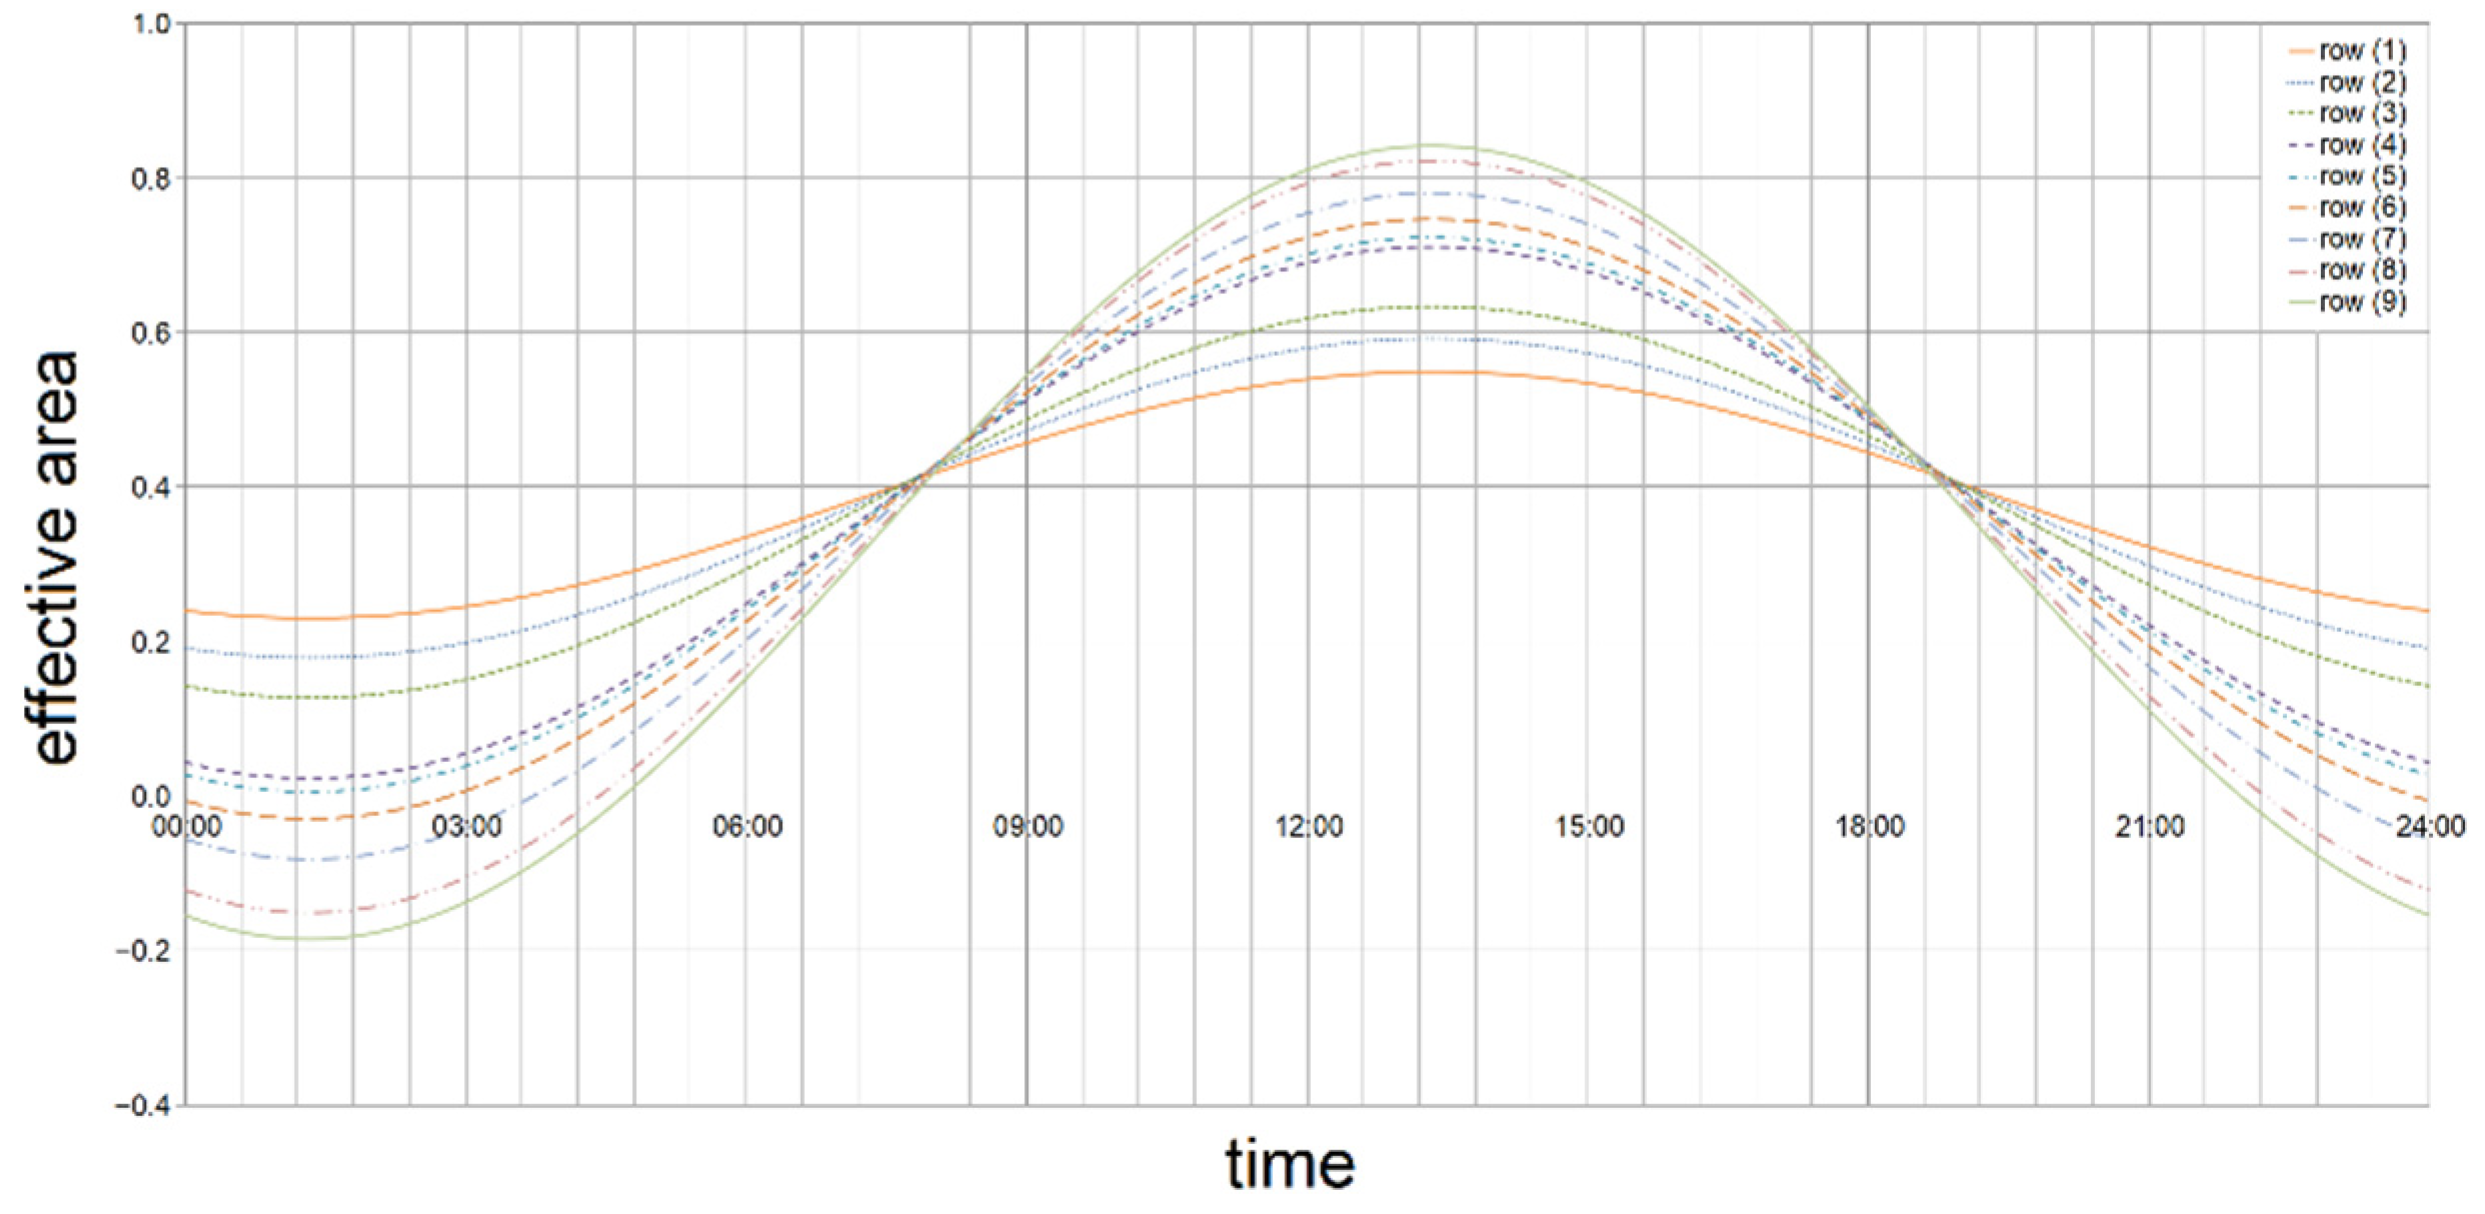
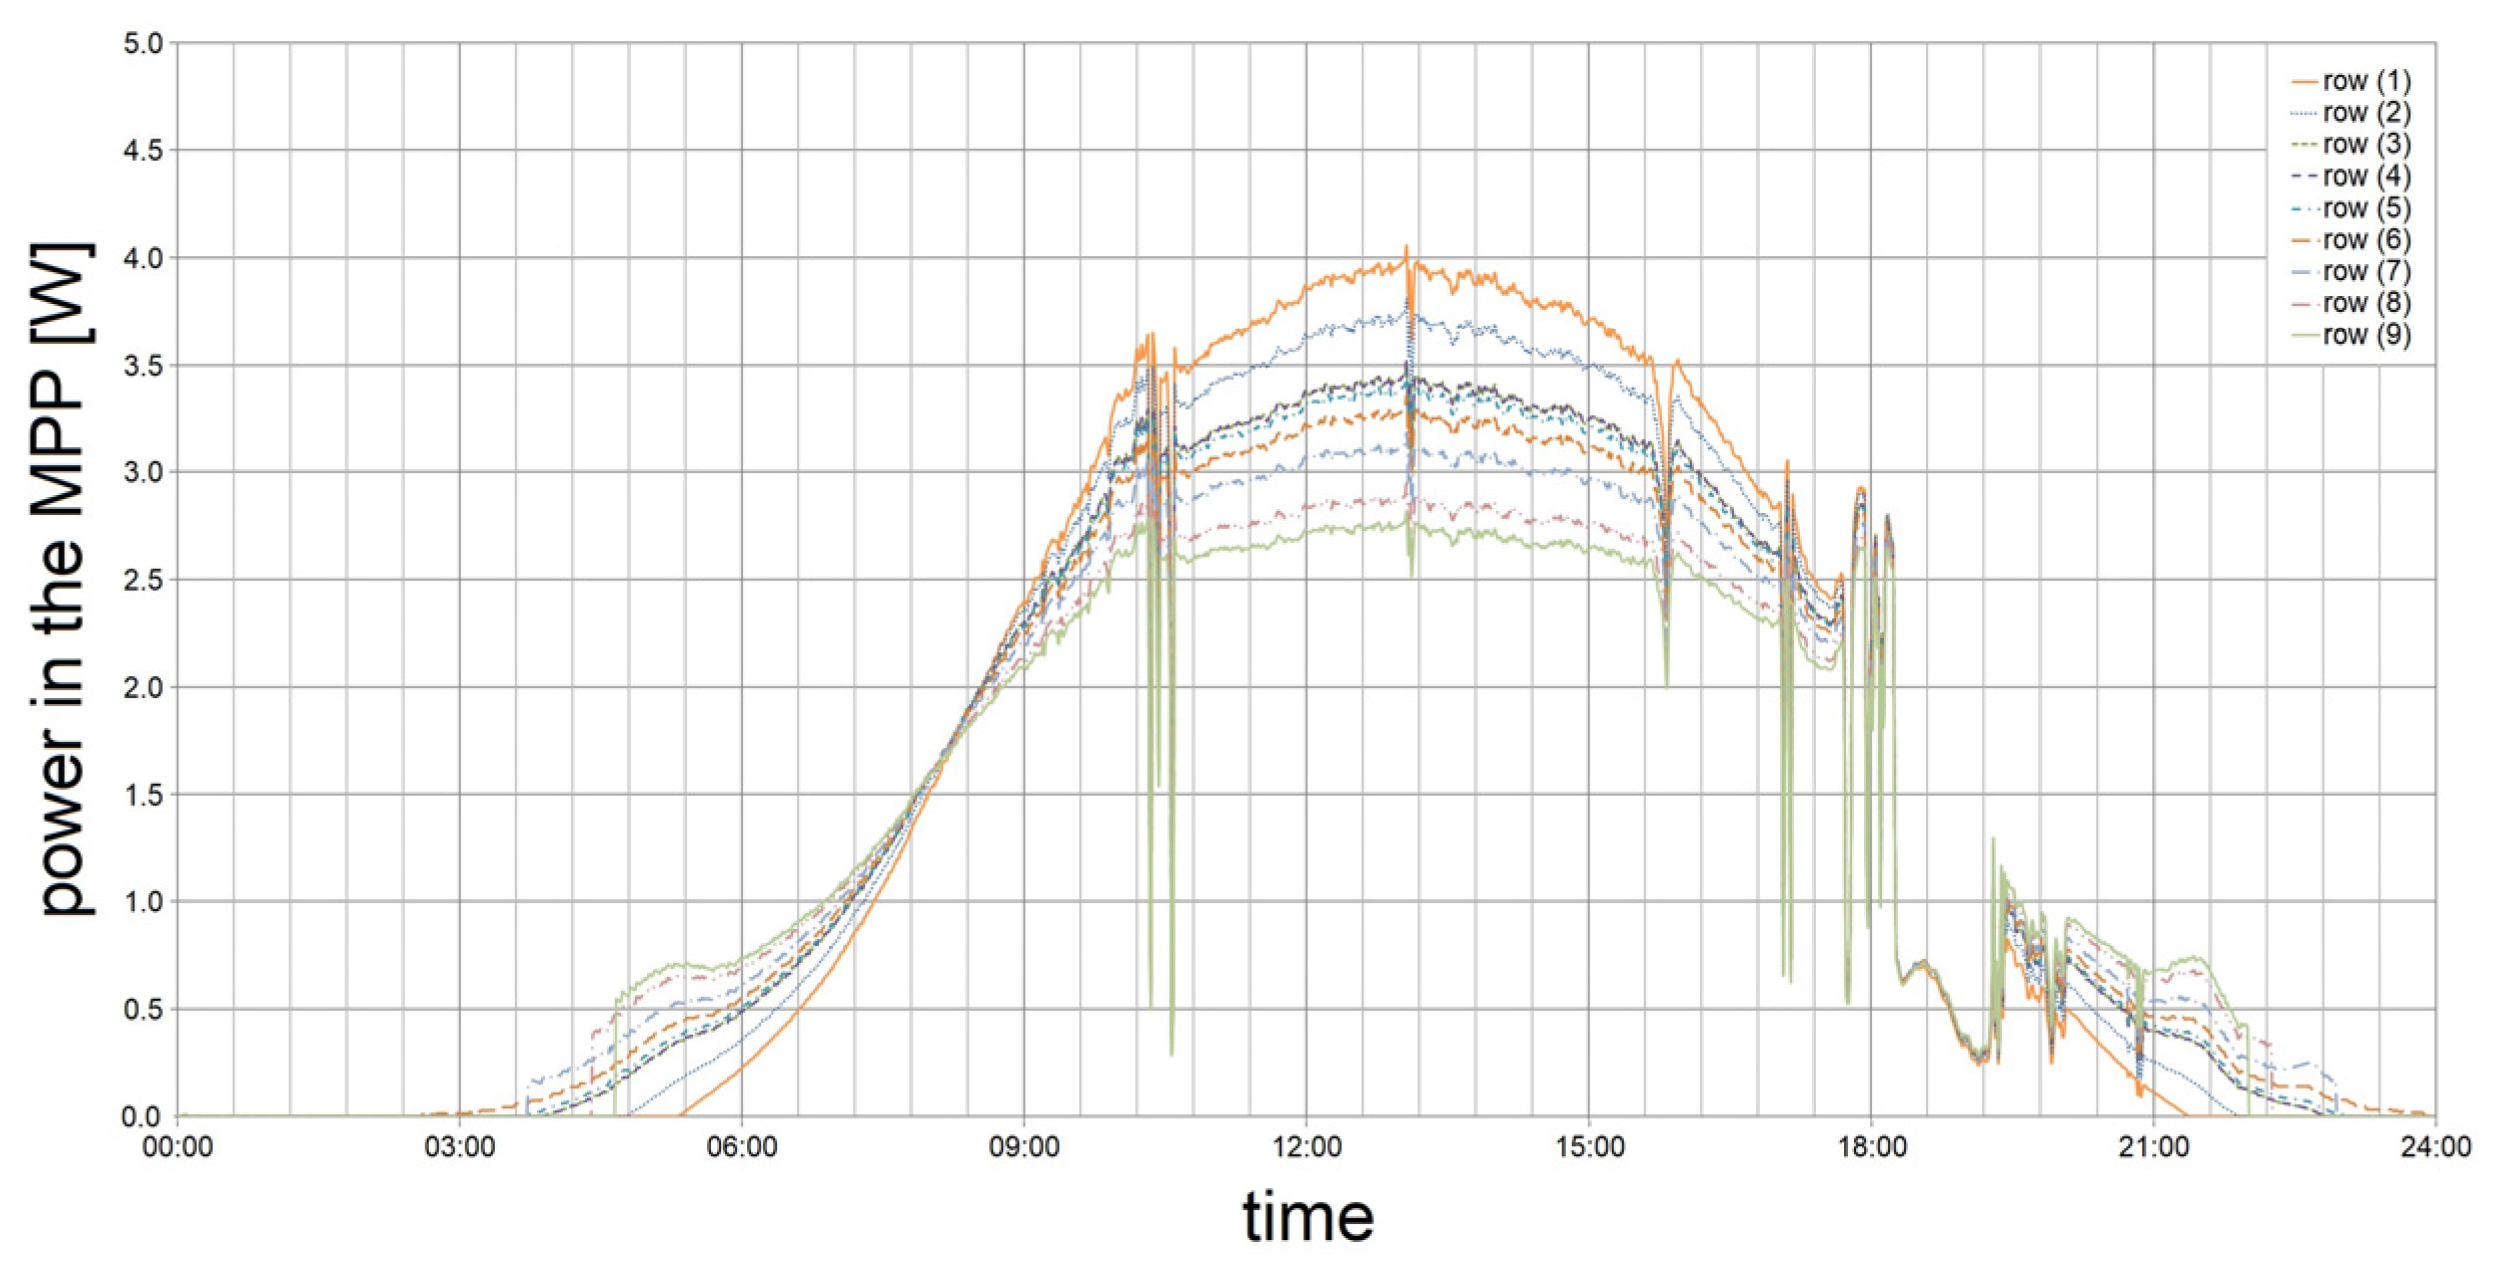
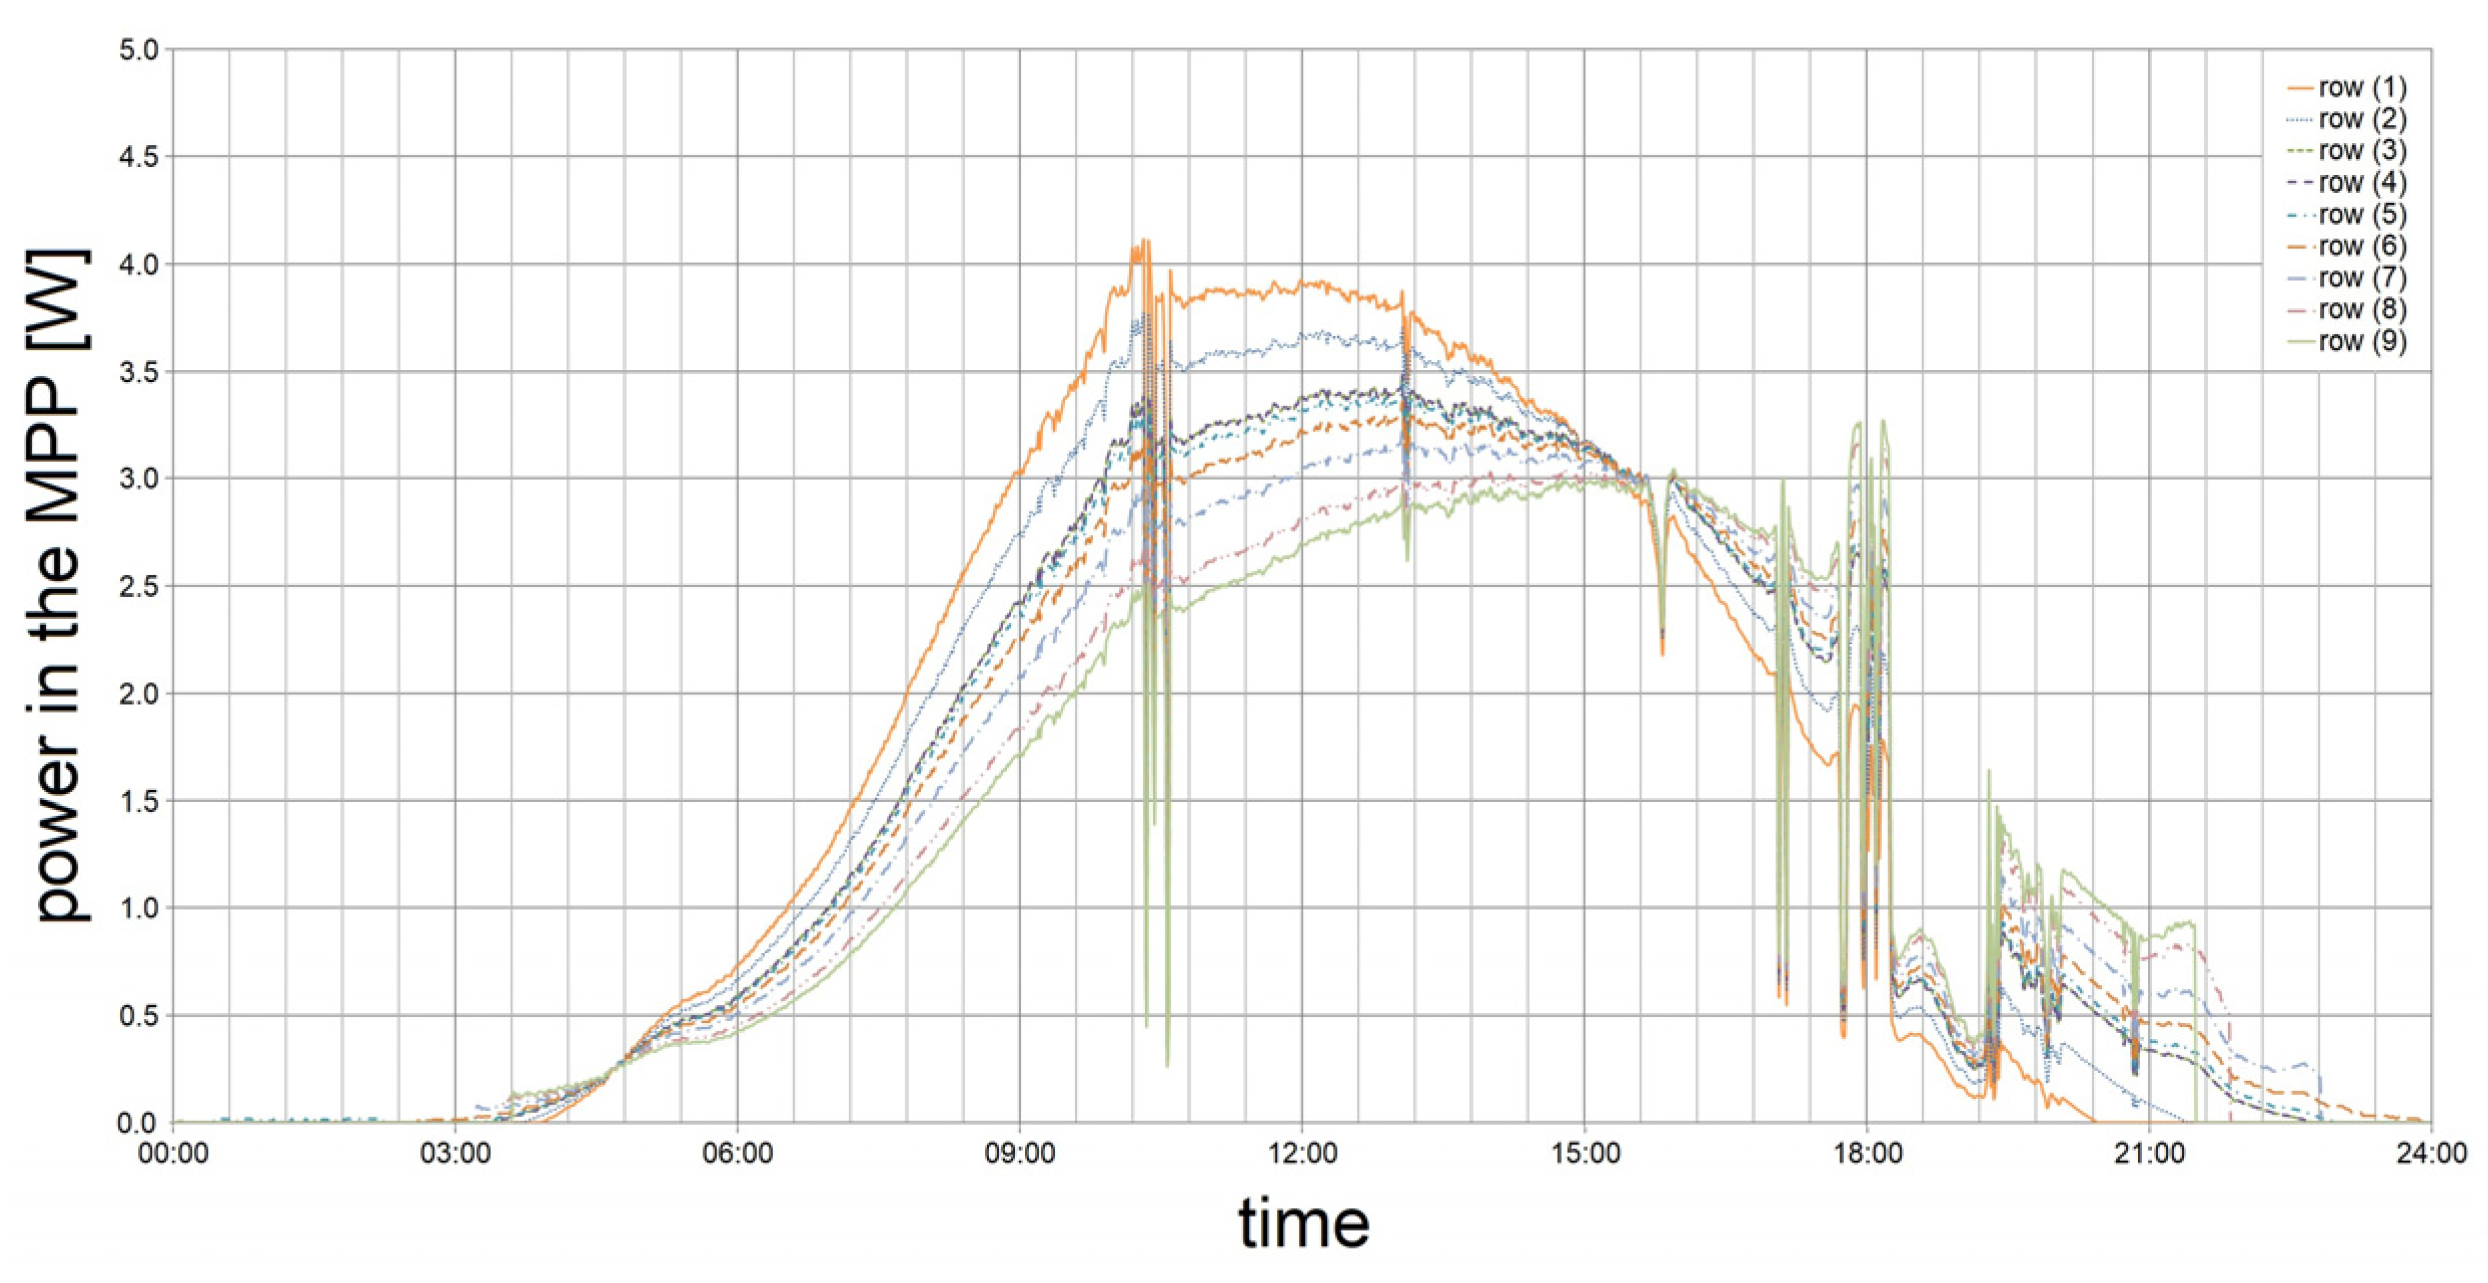
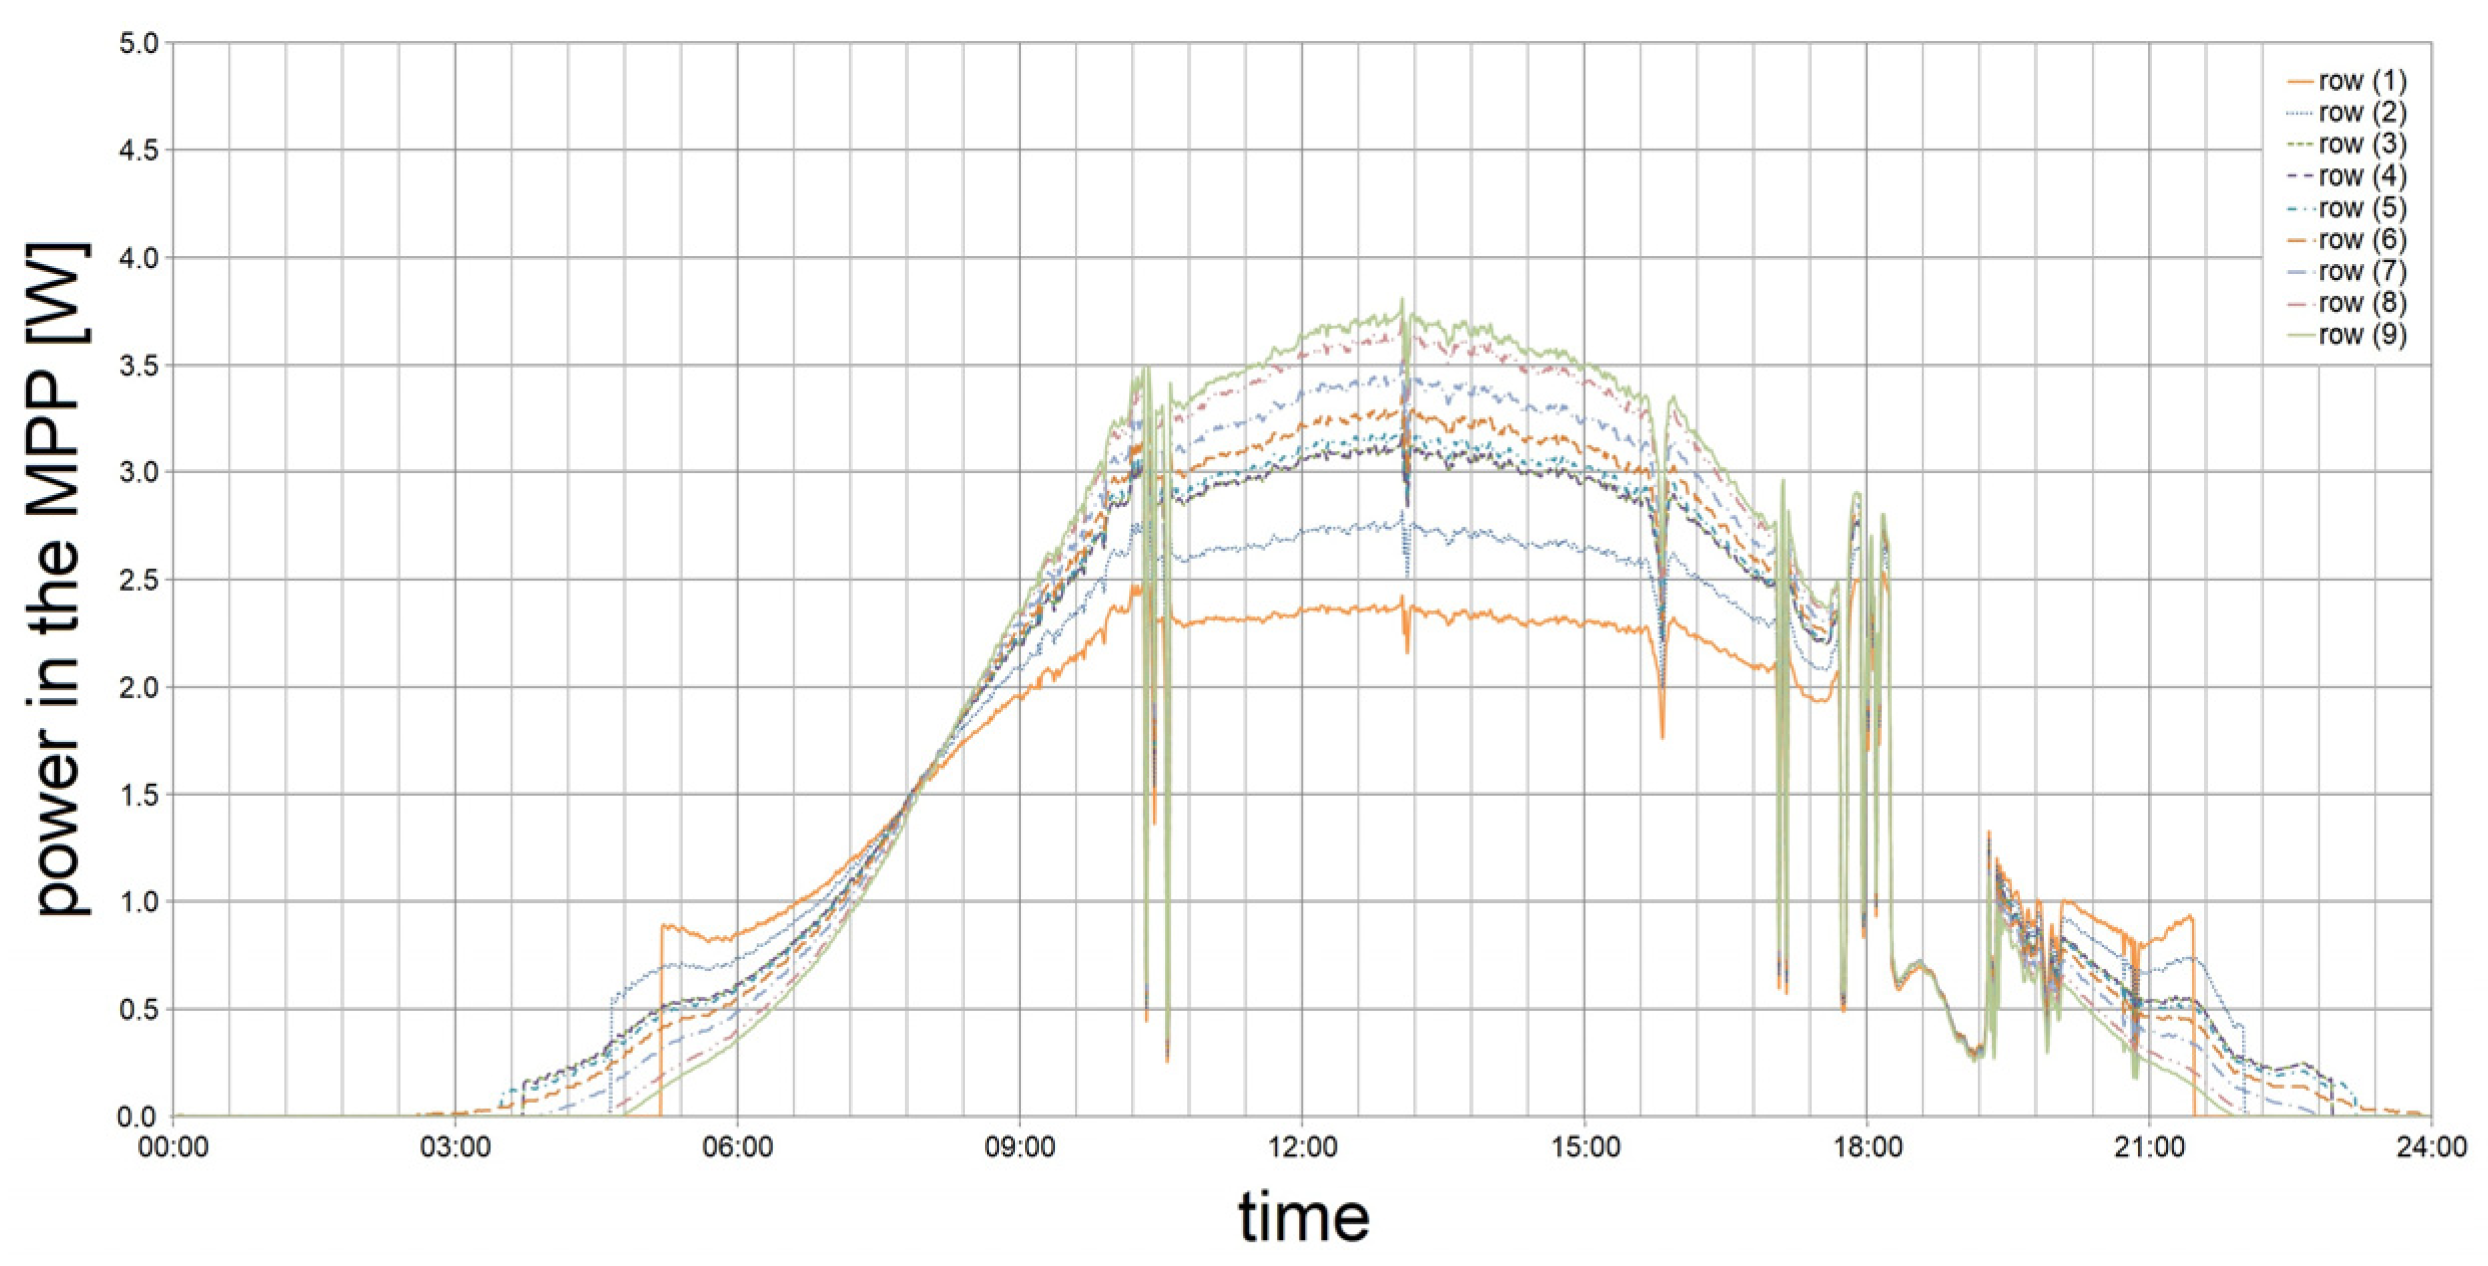
| Row (1) | Row (2) | Row (3) | Row (4) | Row (5) | Row (6) | Row (7) | Row (8) | Row (9) | |
|---|---|---|---|---|---|---|---|---|---|
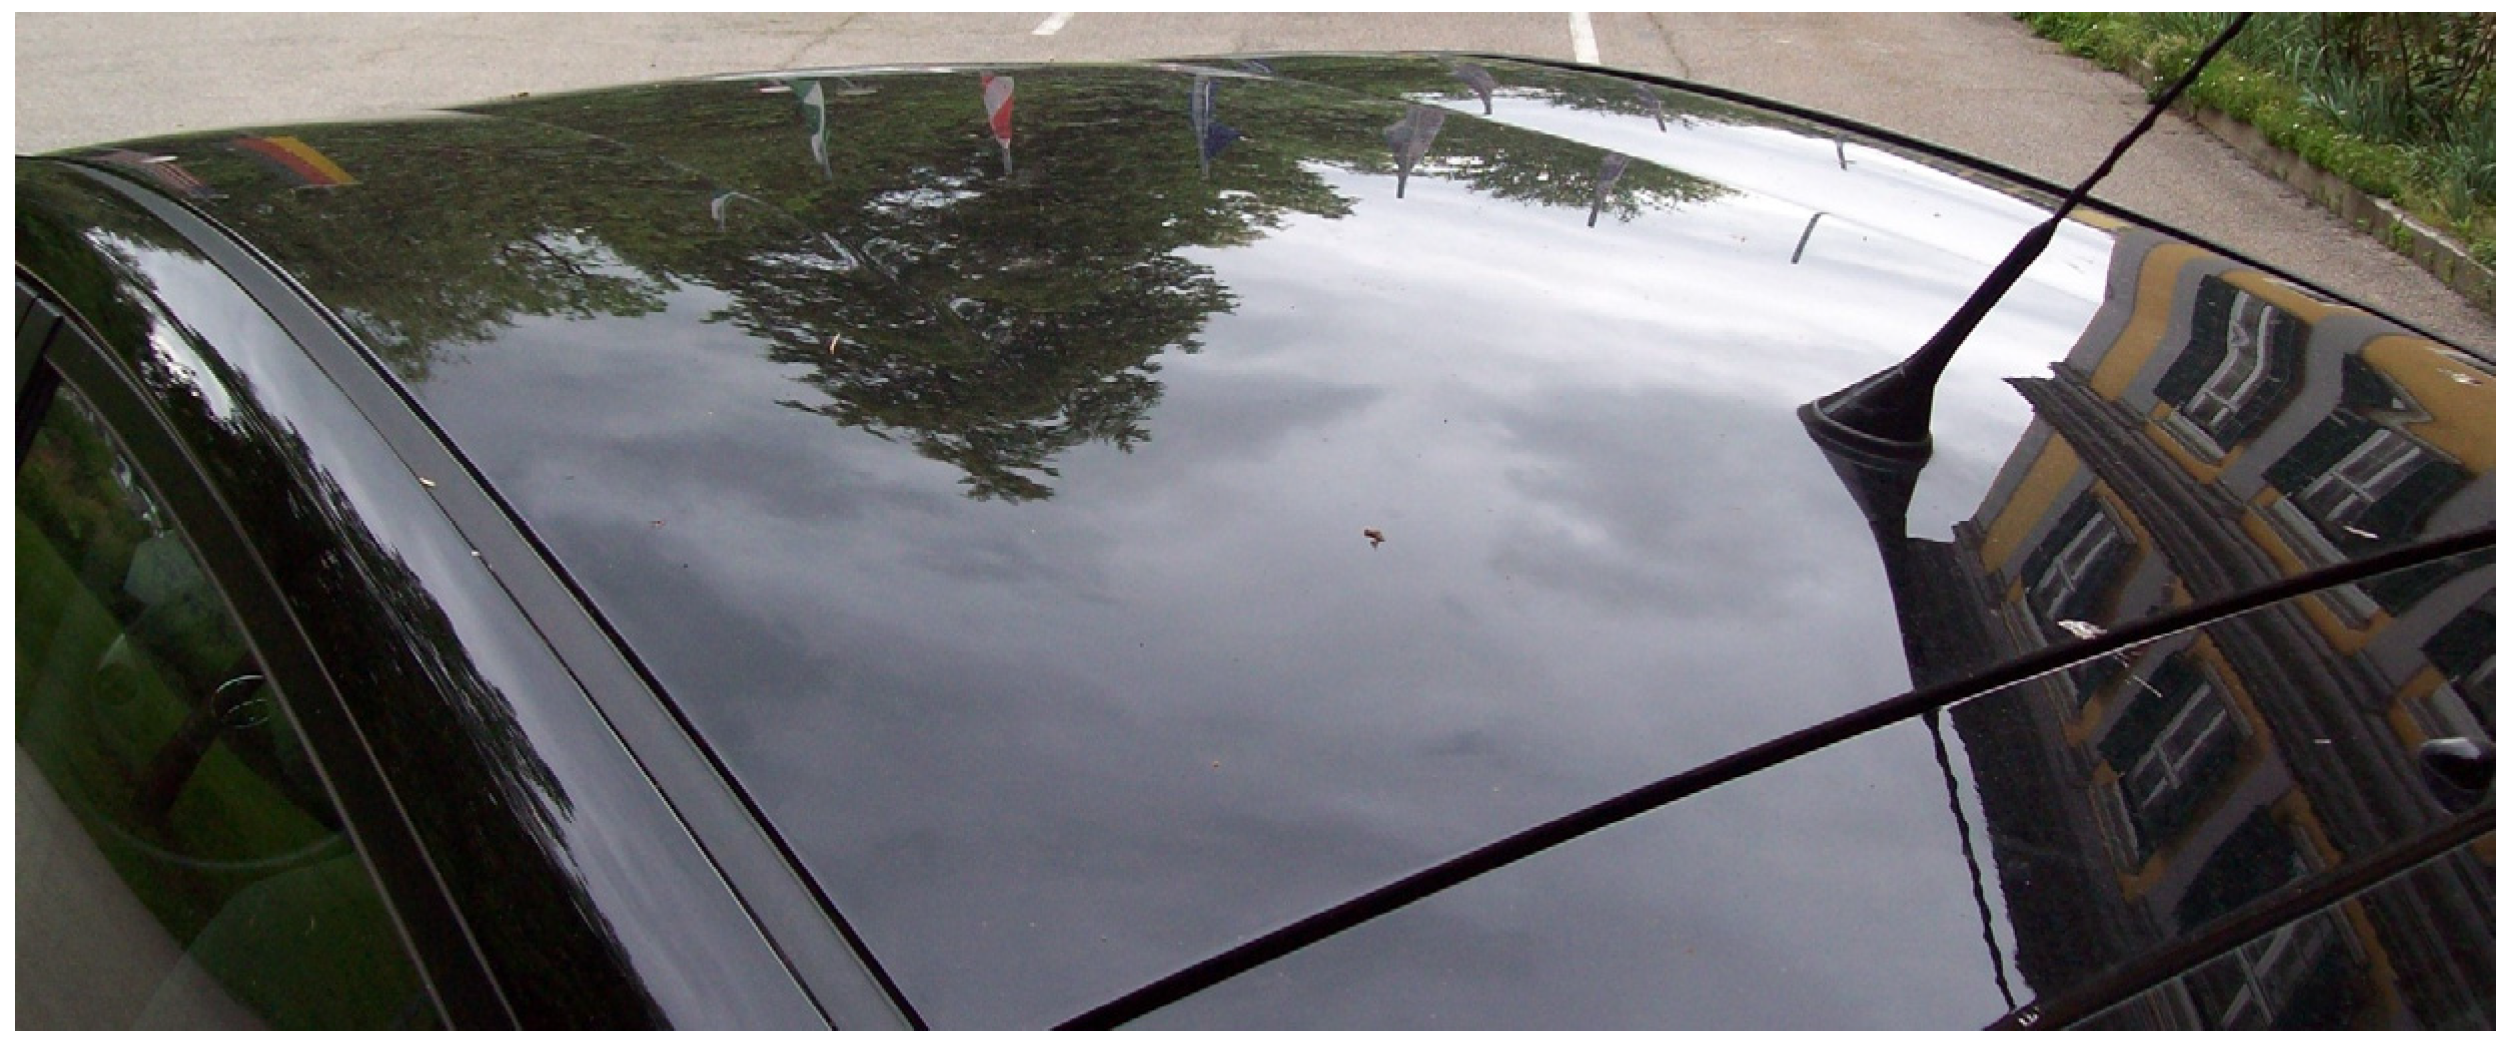
| angle | 15° | 12° | 9° | 3° | 2° | 0° | −3° | −7° | −9° |
Publisher’s Note: MDPI stays neutral with regard to jurisdictional claims in published maps and institutional affiliations. |
© 2022 by the authors. Licensee MDPI, Basel, Switzerland. This article is an open access article distributed under the terms and conditions of the Creative Commons Attribution (CC BY) license (https://creativecommons.org/licenses/by/4.0/).
Share and Cite
Schuss, C.; Fabritius, T. Impact of Environmental Conditions on the Degree of Efficiency and Operating Range of PV-Powered Electric Vehicles. Appl. Sci. 2022, 12, 1232. https://doi.org/10.3390/app12031232
Schuss C, Fabritius T. Impact of Environmental Conditions on the Degree of Efficiency and Operating Range of PV-Powered Electric Vehicles. Applied Sciences. 2022; 12(3):1232. https://doi.org/10.3390/app12031232
Chicago/Turabian StyleSchuss, Christian, and Tapio Fabritius. 2022. "Impact of Environmental Conditions on the Degree of Efficiency and Operating Range of PV-Powered Electric Vehicles" Applied Sciences 12, no. 3: 1232. https://doi.org/10.3390/app12031232