Article

Evaluation of Multi-Source High-Resolution Remote Sensing Image Fusion in Aquaculture Areas

1
Key Laboratory of Fishery Resources Remote Sensing and Information Technology, Chinese Academy of Fishery Sciences, Shanghai 200090, China
2
East China Sea Fisheries Research Institute, Chinese Academy of Fishery Sciences, Shanghai 200090, China
3
College of Mathematics and Information, Zhejiang Ocean University, Zhoushan 316022, China
*
Author to whom correspondence should be addressed.
Appl. Sci. 2022, 12(3), 1170; https://doi.org/10.3390/app12031170
Submission received: 24 November 2021 / Revised: 17 January 2022 / Accepted: 19 January 2022 / Published: 23 January 2022

Abstract

:
Image fusion of satellite sensors can generate a high-resolution multi-spectral image from inputs of a high spatial resolution panchromatic image and a low spatial resolution multi-spectral image for feature extraction and target recognition, such as enclosure seines and floating rafts. However, there is currently no clear and definite method of image fusion for different aquaculture areas distribution extraction from high-resolution satellite images. This study uses three types of high-resolution remote sensing images, GF-1 (Gaofen-1), GF-2 (Gaofen-2), and WV-2 (WorldView-2), covering the raft and enclosure seines aquacultures in the Xiangshan Bay, China, to evaluate panchromatic and multispectral image fusion techniques to determine which is the best. This study applied PCA (principal component analysis), GS (Gram-Schmidt), and NNDiffuse (nearest neighbor diffusion) algorithms to panchromatic and multispectral images fusion of GF-1, GF-2, and WV-2. Two quantitative methods are used to evaluate the fusion effect. The first used seven statistical parameters, including gray mean value, standard deviation, information entropy, average gradient, correlation coefficient, deviation index, and spectral distortion. The second is the CQmax index. Comparing the evaluation results by these seven common statistical indicators with the results of the image fusion evaluation by index CQmax, the results prove that the CQmax index can be applied to the evaluation of image fusion effects in different aquaculture areas. For the floating raft cultured area, the conclusion is consentaneous; NNDiffuse was also optimal for GF-1 and GF-2 data, and PCA was optimal for WV-2 data. For the enclosure seines culture area, the conclusion of quantitative evaluations is not consistent and it shows that there is no definite good method that can be applied to all areas; therefore, careful evaluation and selection of the best applicable image fusion method are required according to the study area and sensor images.

1. Introduction

Recent developments in remote sensing technology offer a high spatial, spectral, and temporal resolution. Most of the operating Earth observation satellites provide both high-resolution panchromatic (Pan) images and low-resolution multi-spectral (MS) images. However, it is difficult to acquire high-quality spatial and hyperspectral remote sensing data simultaneously [1]. The difference in spatial resolution between the panchromatic and the multispectral mode can be measured by the ratio of their respective ground sampling distances (GSD), which may vary between 1:2 and 1:5 [2]. The image fusion of combining multispectral and panchromatic images to produce an enhanced multispectral image of high spatial resolution can improve the efficiency and robustness of information extraction, thereby improving data. Research on image fusion techniques in remote sensing started as early as the late 1980s and early 1990s [3,4,5,6]. Many fusion techniques have been developed [7,8], such as PCA, GS, and NNDiffuse.
With the development of these fusion methods, the problem of determining which method is the perfect one for specific data arises. How to effectively evaluate image fusion quality to provide convincing evaluation results is the key point when using image fusion products. In the IEEE GRSS 2006 Data Fusion Contest, the seven indexes of mean bias, variance difference, standard deviation difference, correlation coefficient, spectral angle mapper, relative dimensionless global error, and Q4 quality index were used [9]. Ojeda [10] introduced a structural similarity variable under the framework of image quality assessment (the CQ index), which can effectively quantify the spatial correlation between two images. This metric was later used for elapsed AR-2D image similarity assessment. Then, Pistonesi et al. [11] proposed the target image fusion performance index (CQmax) based on maximum co-divergence, which exhibited a high degree of similarity during subjective evaluation. However, this method is not specifically applied to the evaluation of image fusion results containing water information. Ojeda et al. also used the CQmax coefficient as an intermediate step to develop a recovery algorithm, generating an original image from two distorted images. These results suggest the CQmax index outperformed the SSIM [12,13] and CQ indices, without comparing the image fusion results with traditional statistical parameters.
China is the world’s largest producer of aquaculture. It accounts for a third of fish production, and two-thirds of the production of aquaculture worldwide [14]. In 2018, one-third of Chinese aquaculture production comes from saltwater [15]. However, aquaculture development faces major threats and challenges, such as the increasing competition for land, water, as well as water pollution, harmful algal blooms (HABs), and other threats [16,17]. Due to its ability to map essential variables at multiple scales and resolutions, Earth observation (EO) can help to comprehensively optimize aquaculture location and type in both the nearshore and offshore oceans [18]. Xiangshan Bay is one of the important sites of salt aquaculture, which is located on the coast of Zhejiang Province in southeastern China. There are floating raft culture of oysters, enclosure seine culture of crab, and cage culture of fish in Xiangshan Bay. We investigated the changes in the number of floating rafts of the oyster culture using the archive WorldView satellite data [19], and we found it seems that not all image fusion methods achieve the same ideal fusion effect [20]. Therefore, we tried to use three different types of satellite images, Gaofen-1 (GF-1), Gaofen-2 (GF-2), and WorldView-2 (WV-2), to conduct the test to answer the question ‘Is there a universally good method for high spatial resolution images?’. We carried out image fusion and evaluated it, hoping to find the best image fusion method for subsequent information extraction.
This article evaluates the quality of the fused satellite images and compares the results with seven traditional statistics indexes of gray mean value, standard deviation, entropy, average gradient, correlation coefficient, spectral distortion, and bias index. Then, we apply the CQmax index to the same work to determine whether CQmax can replace these seven statistics parameters. A brief description of the main acronyms used in this paper is listed in Appendix A.

2. Materials and Methods

2.1. Study Area

Figure 1 gives the geographical position information of Xiangshan Bay. Figure 2 shows scenes of different types of aquaculture areas in Xiangshan Bay. The enclosure seine aquaculture (Figure 2a) adopts local culture, combining timber from a closed aquaculture area. In this region, fishing nets are positioned underwater and 10 cm of fine sand is placed in the bottom of the enclosure seine. The fence around the nursery area encompasses 50~200 square meters. Discrete circles and polygons visible in the remote sensing images represent bodies of water. These shapes are the result of morphological structures used in the seine culture. The floating rafts in the breeding area (Figure 2b) included a polyethylene rope of length 60 m, serving as the primary stalk. This structure was bound to plastic foam at both ends of the floating piling rope, which was fixed to the seabed. The distance between adjacent rafts was 4–6 m. Hundreds of these structures were arranged side-by-side to form floating strips hundreds of meters in length. The distance between each group of floating rafts varied from 20 to 40 m.

2.2. Image Data

Three types of high-resolution remote sensing data were used in this study to conduct a series of fusion evaluation experiments in aquaculture areas. Descriptions of these data types are listed in Table 1.
China launched six HDEOS (high-resolution Earth observation system) space crafts between 2013 and 2016 [21]. GF-1 is the first of a series of high-resolution optical Earth observation satellites of the CNSA (China National Space Administration), Beijing, China; GF-2 is a follow-up mission of GF-1 with the objective to provide high accuracy geographical mapping, land and resource surveying, environment change monitoring, and near-real-time observation for disaster prevention and mitigation, as well as agriculture and forest estimation [22]. As listed in Table 1, GF-1 and GF2 have the same spectral resolution but different spatial resolutions. The WV-2 sensor provides a high-resolution panchromatic band and eight (8) multispectral bands—four (4) standard colors (red, green, blue, and near-infrared 1) and four (4) new bands (coastal, yellow, red edge, and near-infrared 2)—and full-color images for enhanced spectral analysis, mapping and monitoring applications, land-use planning, disaster relief, exploration, defense and intelligence, and visualization and simulation environments [23].
Figure 3 shows the flow chart of this study. PCA (principal component analysis), GS (Gram–Schmidt), and NNDiffuse (nearest neighbor diffusion) algorithms using ENVI software were applied to PAN and MS images fusion of GF-1, GF-2, and WV-2 in the areas of seine culture and floating rafts. PCA is a statistical technique that transforms multivariate data with correlated variables into uncorrelated variables [24,25]. The GS orthogonalization procedure is a powerful pan sharpening method [26]. NNDiffuse assumes that each pixel spectrum in the pan-sharpened image is a weighted linear mixture of the spectra of its immediate neighboring super pixels; it treats each spectrum as its smallest element of the operation, which is different from the most existing algorithms that process each band separately [27]. Two quantitative methods are used to evaluate the fusion effects. One uses the seven traditional statistics indexes, and the other compares the CQmax index to find which image fusion method is the best for each type of satellite sensor and to answer the question of whether there is a universally good method for high spatial resolution images.

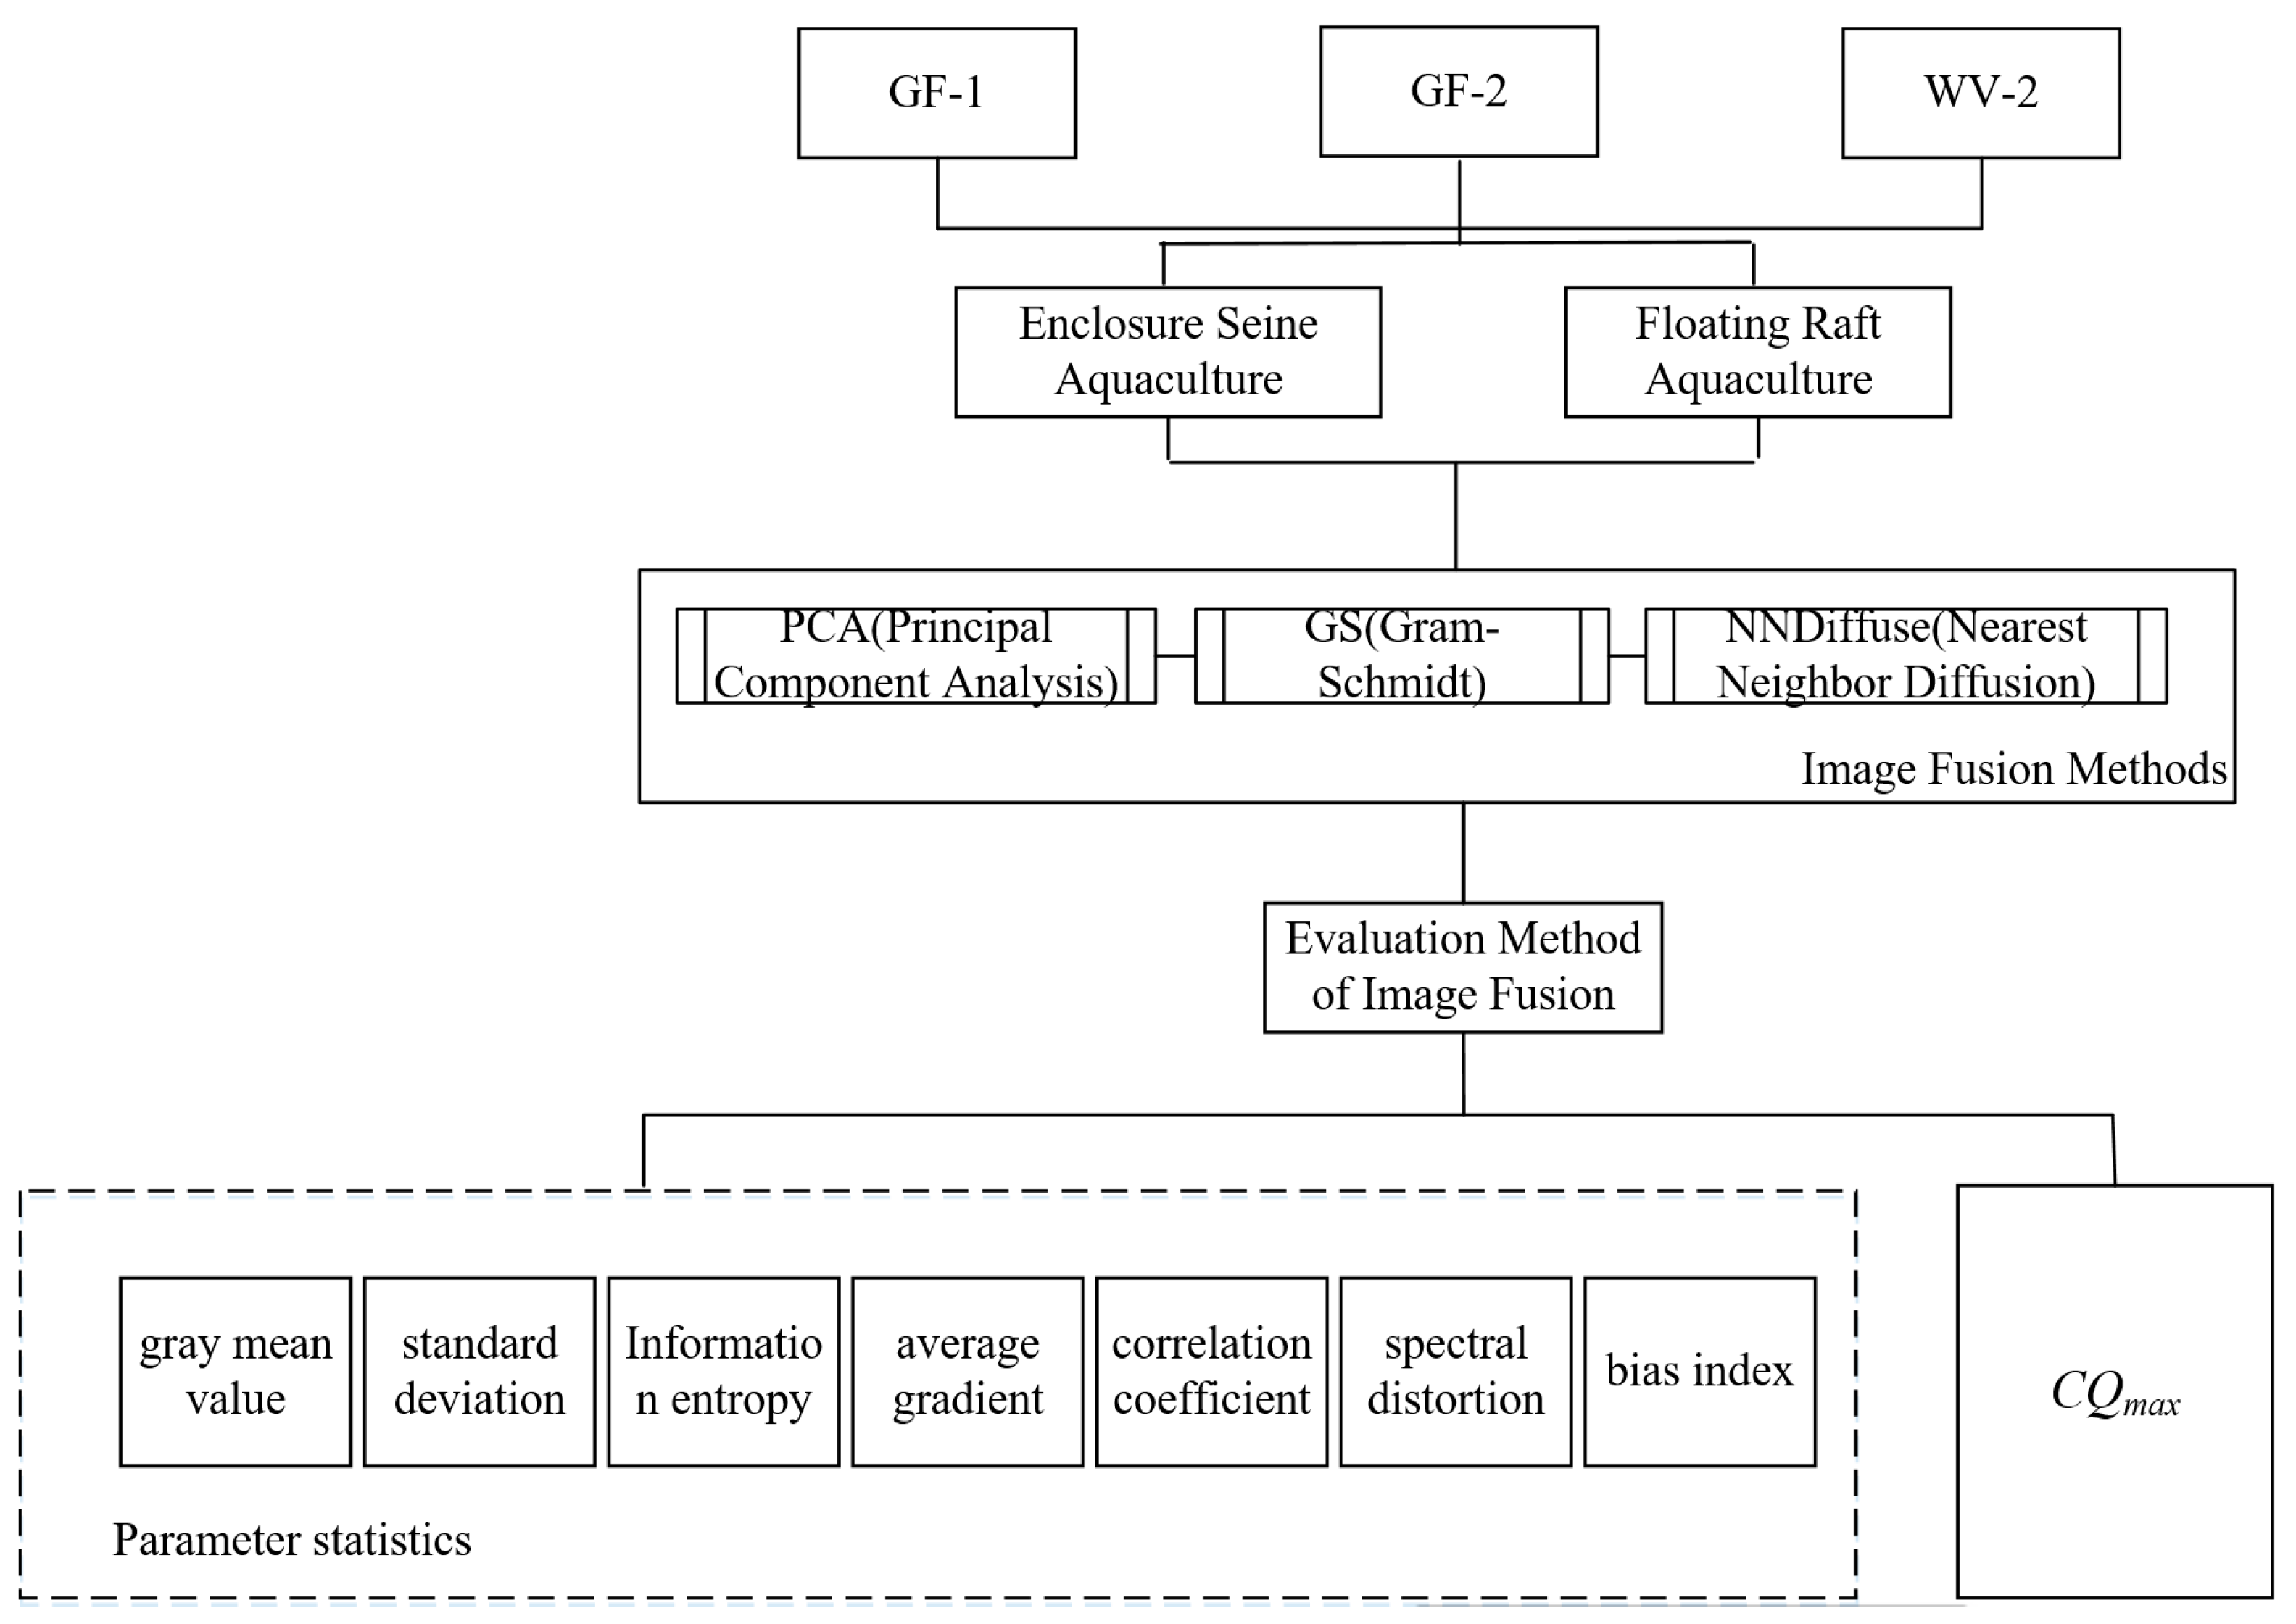
2.3. Evaluation Methodology

The effect of image fusion can be judged by visual and quantitative evaluation. Visual evaluation refers to judging the image after fusion through visual interpretation and combining it with operating experience, to draw a conclusion. Visual evaluation has the advantage of being more intuitive and easygoing but it is difficult to describe precisely. The quantitative evaluation is more objective and comparative to describe and judge the characteristics of the fusion images with numerical values. The quantitative evaluation in this study includes statistical parameters and the CQmax index.

2.3.1. Statistical Parameters

The statistical parameters of image quality can be divided into two categories according to the number of factors involved in the evaluation [28]: one is the single-factor evaluation index, including gray mean value, standard deviation, sharpness, and various entropy values of the image. The other is the comprehensive evaluation indicators, including spectral distortion, correlation coefficient, bias index, etc.
All seven parameters’ calculation formulas and descriptions, which are used in this study, are shown in Appendix B. Gray mean value is calculated by the sum of the gray values of all the pixels in the image divided by the number of pixels. The closer the gray average value to the multi-spectral image average, the smaller the spectral distortion; standard deviation provides a measure of the dispersion of image gray level intensities. The larger the standard deviation, the more scattered the gray level distribution, and the larger the contrast of the image, the more convenient the information extraction. The concept of information entropy describes how much information is provided by the image. Average gradient measures the gradient magnitude of an image and takes the variation of each of the adjacent pixels into account. The larger the average gradient, the higher the sharpness of the image.
Correlation coefficient is the correlation between images, which is a statistical measure of the strength of the relationship. The larger the correlation coefficient between the fused image and the multi-spectral image indicates that the higher the degree of integration of high-frequency information, the smaller the degree of image spectral variation. Spectral distortion is a measure of mismatch between two signals based on their spectral properties. The greater the degree of distortion, the higher the degree of spectral distortion of the image. Bias index is an index of the deviation degree between the fused image and the low-resolution multispectral image. The smaller the deviation index, the higher the spectral information retention of the image before and after fusion.

2.3.2. CQmax Index

This study applies a novel methodology for image quality evaluation based on the coefficient, namely, the CQmax index [29], to evaluate the fused image. The approach includes limited space lag coefficients and uses space lag quantities (h) to calculate the maximum value of the CQ coefficient [10]. The coefficient must be larger than a specified threshold provides a coefficient that is independent of the direction as is stated in the following definition:
C Q max ( x , y ) = max { h H W : p ( h ) p 0 } | C Q ( x , y , h ) |
where p 0 ( 0 , 1 ) is a known threshold, typically p 0 = 0.75 , and p (·) is the proportion of pixels in the image associated with the computation of CQ in the direction h. This CQ coefficient depends on the spatial lag, h, a separation vector between observations X (s) and X (s + h) in an image, defined as:
C Q ( x , y , h ) = l ( x , y ) α c ( x , y ) β s c ( x , y , h ) γ
l ( x , y ) = 2 x ¯ y ¯ + c 1 x ¯ 2 + y ¯ 2 + c 1
c ( x , y ) = 2 s x s y + c 2 s x 2 + s y 2 + c 2
s c ( x , y , h ) = A h x , A h y + c 3 | | A h x | | | | A h y | | + c 3
Here, l ( x , y ) c ( x , y ) and s c ( x , y , h ) are functions describing the similarity of brightness, contrast, and structural components, respectively [30]. The parameters α, β, and γ indicate the weights of these components, respectively. In general, α = β = γ = 1 . In addition, x ¯ and y ¯ denote the mean values of the image. Let x, y ∈RN+ be two images. s x and s y are the variance of the image, and A h x = ( x k x k + h )   A h y = ( y k y k + h ) are the spatial lag in the h direction. There are at least two ways of choosing suitable values of h depending on the available knowledge about a certain direction of interest. If there is information about h, the CQ index can be computed in that particular direction. The constants c 1 , c 2 , and c 3 are non-negative small real numbers included to avoid instability when x ¯ + y ¯ is close to zero [31]. If x and y respectively represent fusion and reference images, the resulting CQ value serves as an evaluation index for fusion quality. The CQmax term quantifies the similarity between images based on the maximum co-scattering coefficient. Larger values of CQmax indicate a higher degree of similarity and more accurate fusion results.

3. Results

Panchromatic and multispectral images from these three different satellite sensors were used for fusion covering the same aquaculture culture site. All the images produced and reported in the following Figures are natural color or true color, combined with RGB bands and displayed with 2% linear stretching in ENVI. The images provide an intuitive visual experience of the fusion effect.

3.1. Enclosure Aquaculture Fusion Evaluation

Fusion results using GF-1, GF-2, and WV-2 data from the seine culture area exhibited improved spatial resolution, compared with the original multispectral data, as seine nets are more visible in the images. Spectral preservation is also evident as the color of each fused image is closer to the original multispectral data. Color saturation and contrast have also been improved to varying degrees. For the GF-1 (see Figure 4), PCA and NNDiffuse results are slightly brighter than the original multispectral images. Texture and edge details are also more prominent in the NNDiffuse results, which is conducive to information extraction. For the GF-2 (see Figure 5), the color and contrast of the GS fusion images are higher than in the original multispectral data. The NNDiffuse results also exhibit clear texture, obvious edges, and an enclosure seine structure that appears bright in the image. The image produced by PCA fusion is also bright overall. For the WV-2 (see Figure 6), the color of the NNDiffuse results is closest to the original multispectral images. The contrast between the floating rafts and the bodies of water is obvious. GS and PCA fusion results are generally bright and the water is a light green color.

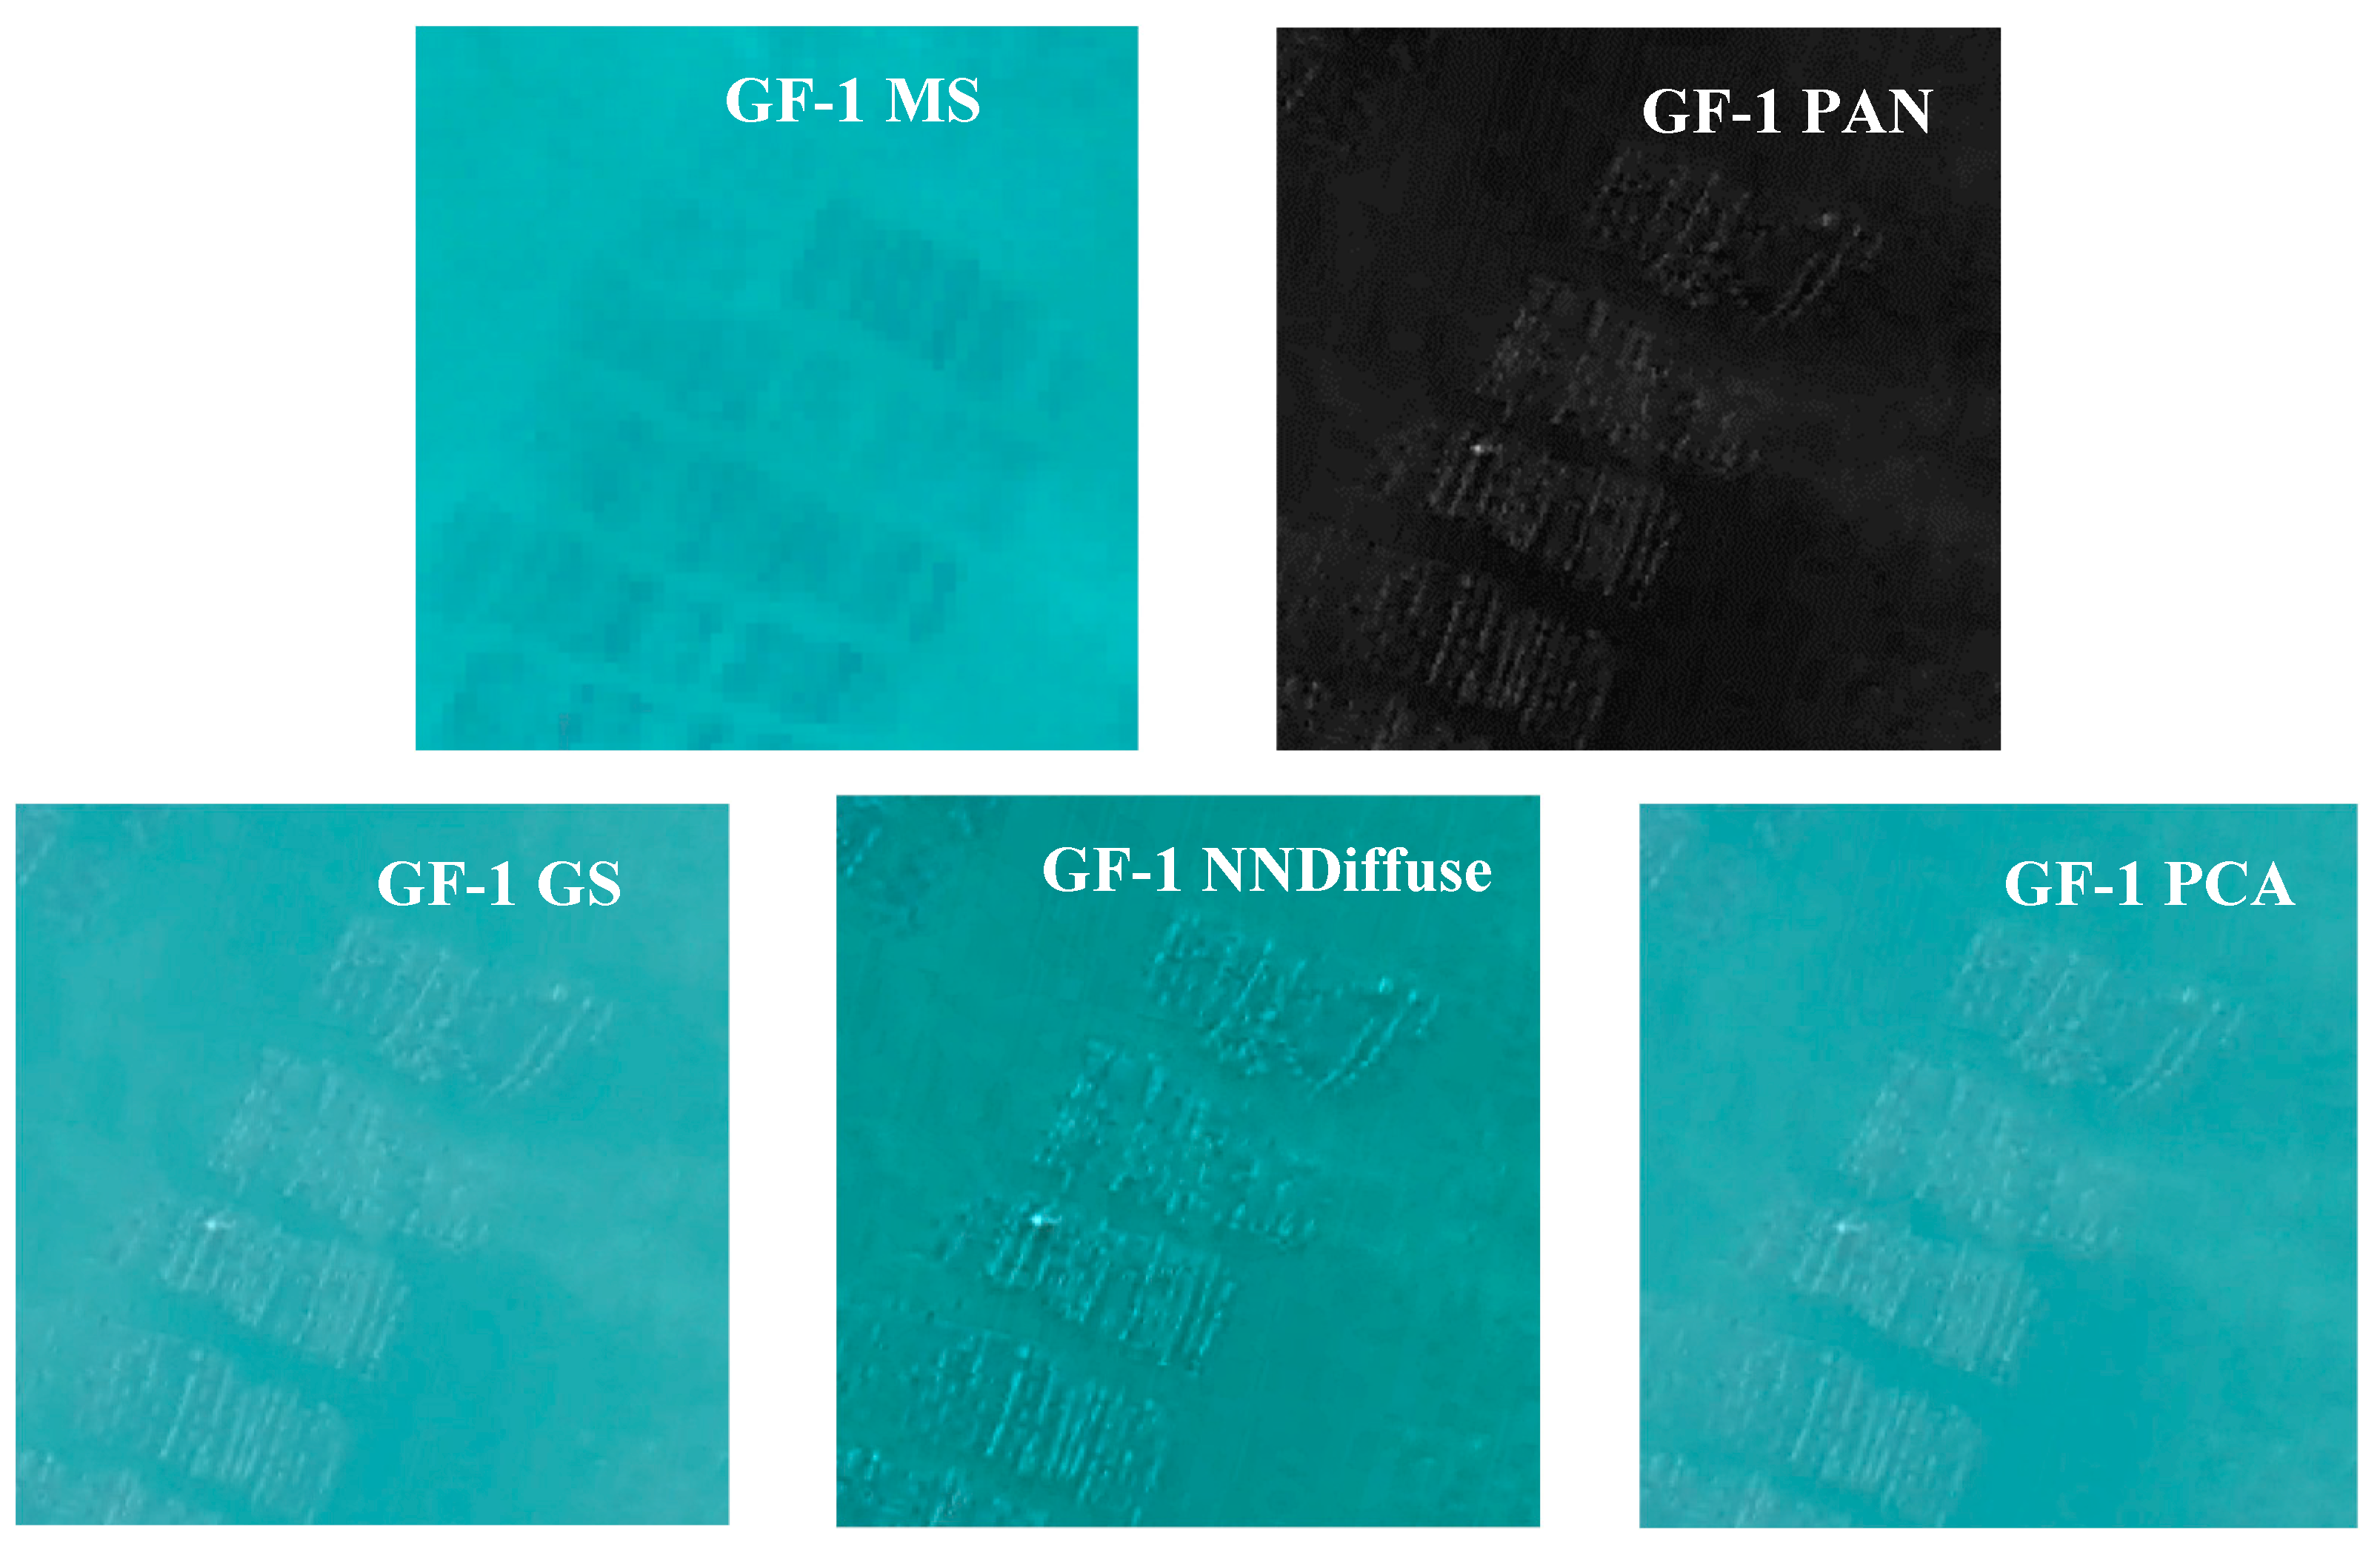
3.1.1. GF-1 Fusion Evaluation

Fused GF-1 images (Figure 4) from the enclosed aquaculture area were assessed using seven indicators (Appendix B). The amount of information in the entropy values is mainly used to observe the ability to maintain details before and after image fusion. The information entropy in an image quantifies the richness and diversity of data in the form of feature statistics. Table 2 shows that the information entropy in the GS fusion images was higher than in the original multispectral data, indicating that the information contained in the GS fusion image is richer. In contrast, the entropy of the PCA and NNDiffuse results is zero. This is likely because the GF-1 grayscale values and range are too large and the bands are too interdependent.
Standard deviation was used to evaluate grayscale divergence in the images. As seen in Table 2, the standard deviation of PCA and NNDiffuse results was similar to that of the original data, producing a single image level. In contrast, the GS fusion images are colorful, contain more information, and exhibit a larger standard deviation. The texture in the image is clear, the features of the ground are obvious, and the imaging effect is excellent. The average gradient of each band in the GS images is larger than in the original fusion data. The gray level difference is also large in Band 4 and the information is diverse. Based on this, it can be applied to image feature extraction or color synthesis. The grayscale mean and standard deviation followed a similar pattern, with larger gray levels in the GS images producing richer image levels.
Spectral fidelity is primarily used to compare original multi-spectral images with fused results. This study investigated the effects of bias index and the degree of spectral distortion present in the fused data. Table 2 shows that the bias index and spectral distortion of the fused images are much larger than the original multispectral data, with varying degrees of spectral distortion present in each band. It is evident that spectral distortion is higher because the fusion will cause spectral distortion, and the image fidelity will be affected, but the degree of influence is different. This value is smaller in B1, B3 (GS fusion), and B4 (PCA fusion), indicating these bands preserved spectral fidelity. The bias index was smaller in B1, B2, and B3 (GS fusion) than with other fusion techniques, indicating high spectral retention. Correlation coefficients in the B3 (GS) and B4 (PCA) bands were large, indicating image information was uniform after image fusion. This coefficient was negative for the GS and NNDiffuse techniques in B2, but other bands showed a higher correlation. The gray mean value in B4 was particularly high, suggesting the image was disturbed by noise during phase formation. In general, GS fusion is optimal for GF-1 data.

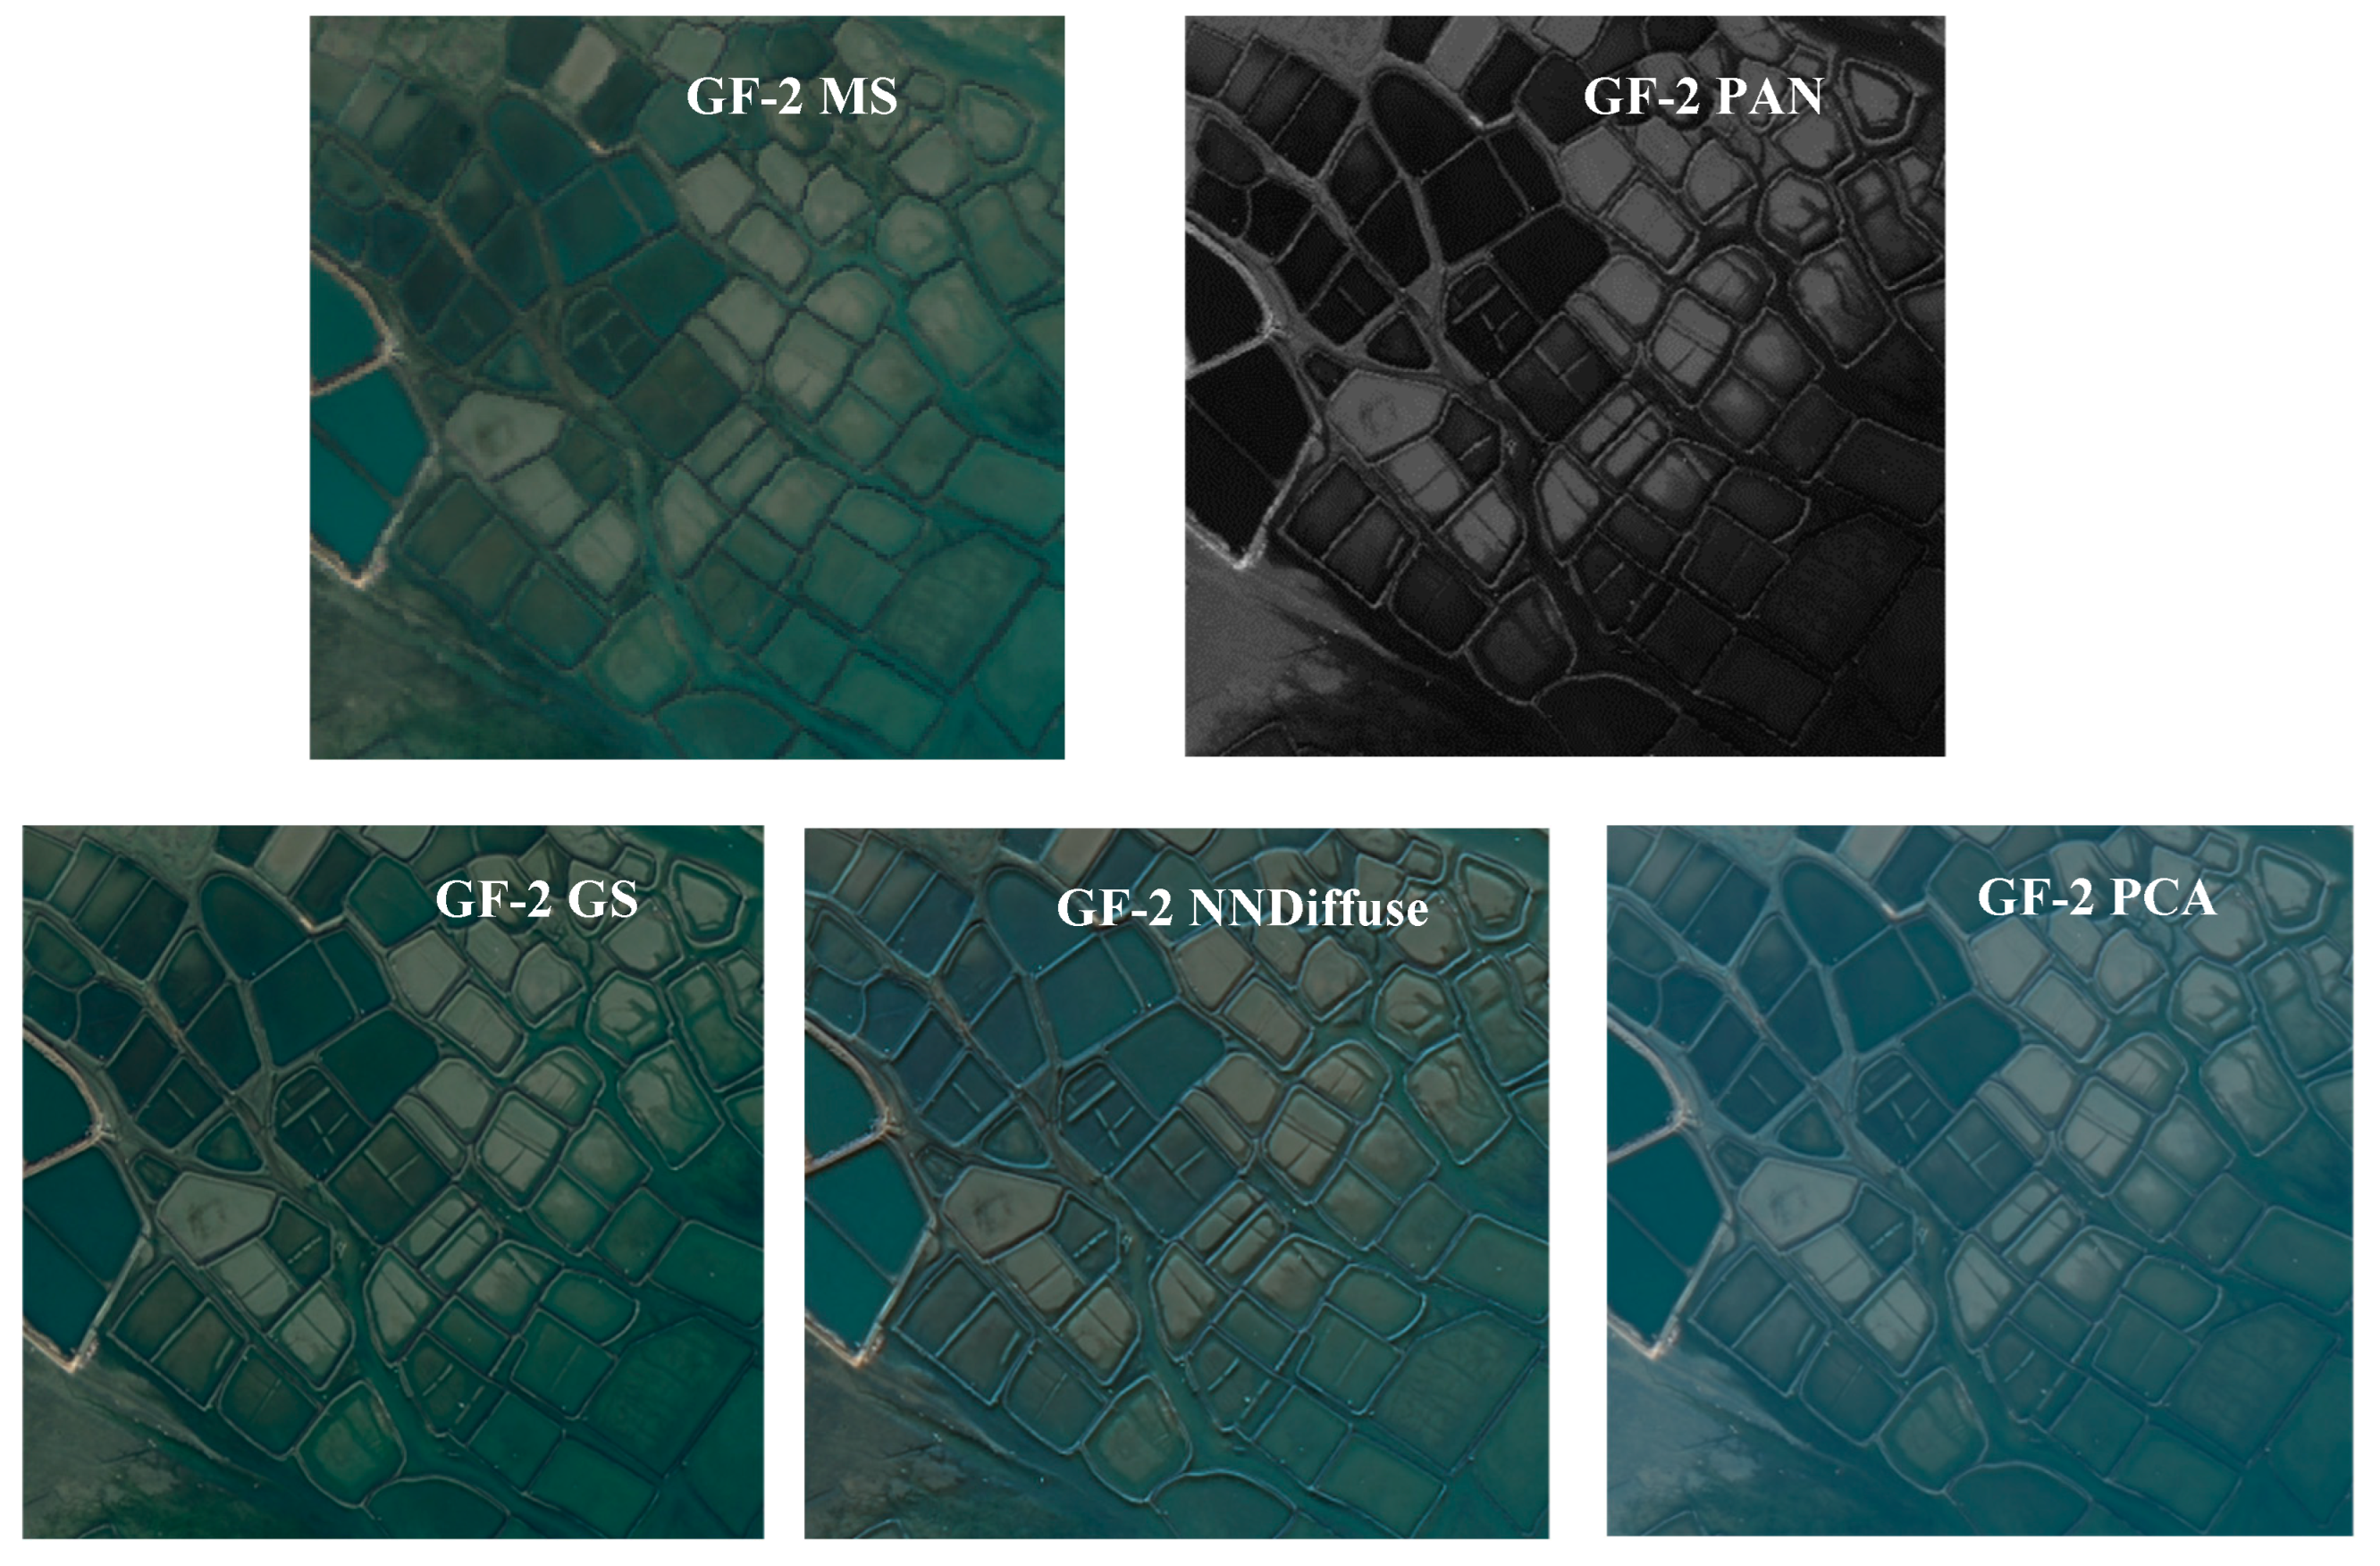
3.1.2. GF-2 Fusion Evaluation

Table 3 shows the quantitative results of seven statistical indexes for GF-2 fusion images (Figure 5). In Table 3, the standard deviation in the four PCA bands is higher than that of other fusion techniques. The grayscale divergence produced by PCA fusion is also high, suggesting these images contain the most spatial information. The NNDiffuse results also exhibit high divergence and include more information in each band. It is evident that the information entropy in each band of the fused images is higher than that of the corresponding multi-spectral data. The four PCA bands exhibit the highest information entropy, indicating the information contained in each band is richer than in other fused images. The correlation coefficient is also higher in the fused images than in the original multispectral data. Specifically, PCA fusion produced the highest correlation coefficients in each band (among fusion techniques), suggesting the information is more uniform in these results.
According to the value of the correlation coefficient, PCA fusion also produced the highest information retention rates in each band to the original multispectral data, although PCA can result in a loss of spectral information. In contrast, the spectral distortion and deviation index produced in each band by GS fusion were the lowest among fusion techniques, suggesting spectral information retention to be higher with GS fusion. The gray mean value of B1 and B2 in the NNDiffuse results was closest to that of the original multispectral images. The same was true for B3 and B4 in the PCA fusion results. The result shows that NNDiffuse and PCA are similar. Comprehensively considering the amount of information included in the image and the degree of spectrum retention, NNDiffuse could be considered more optimal for GF-2 data in the enclosure seine farming area.

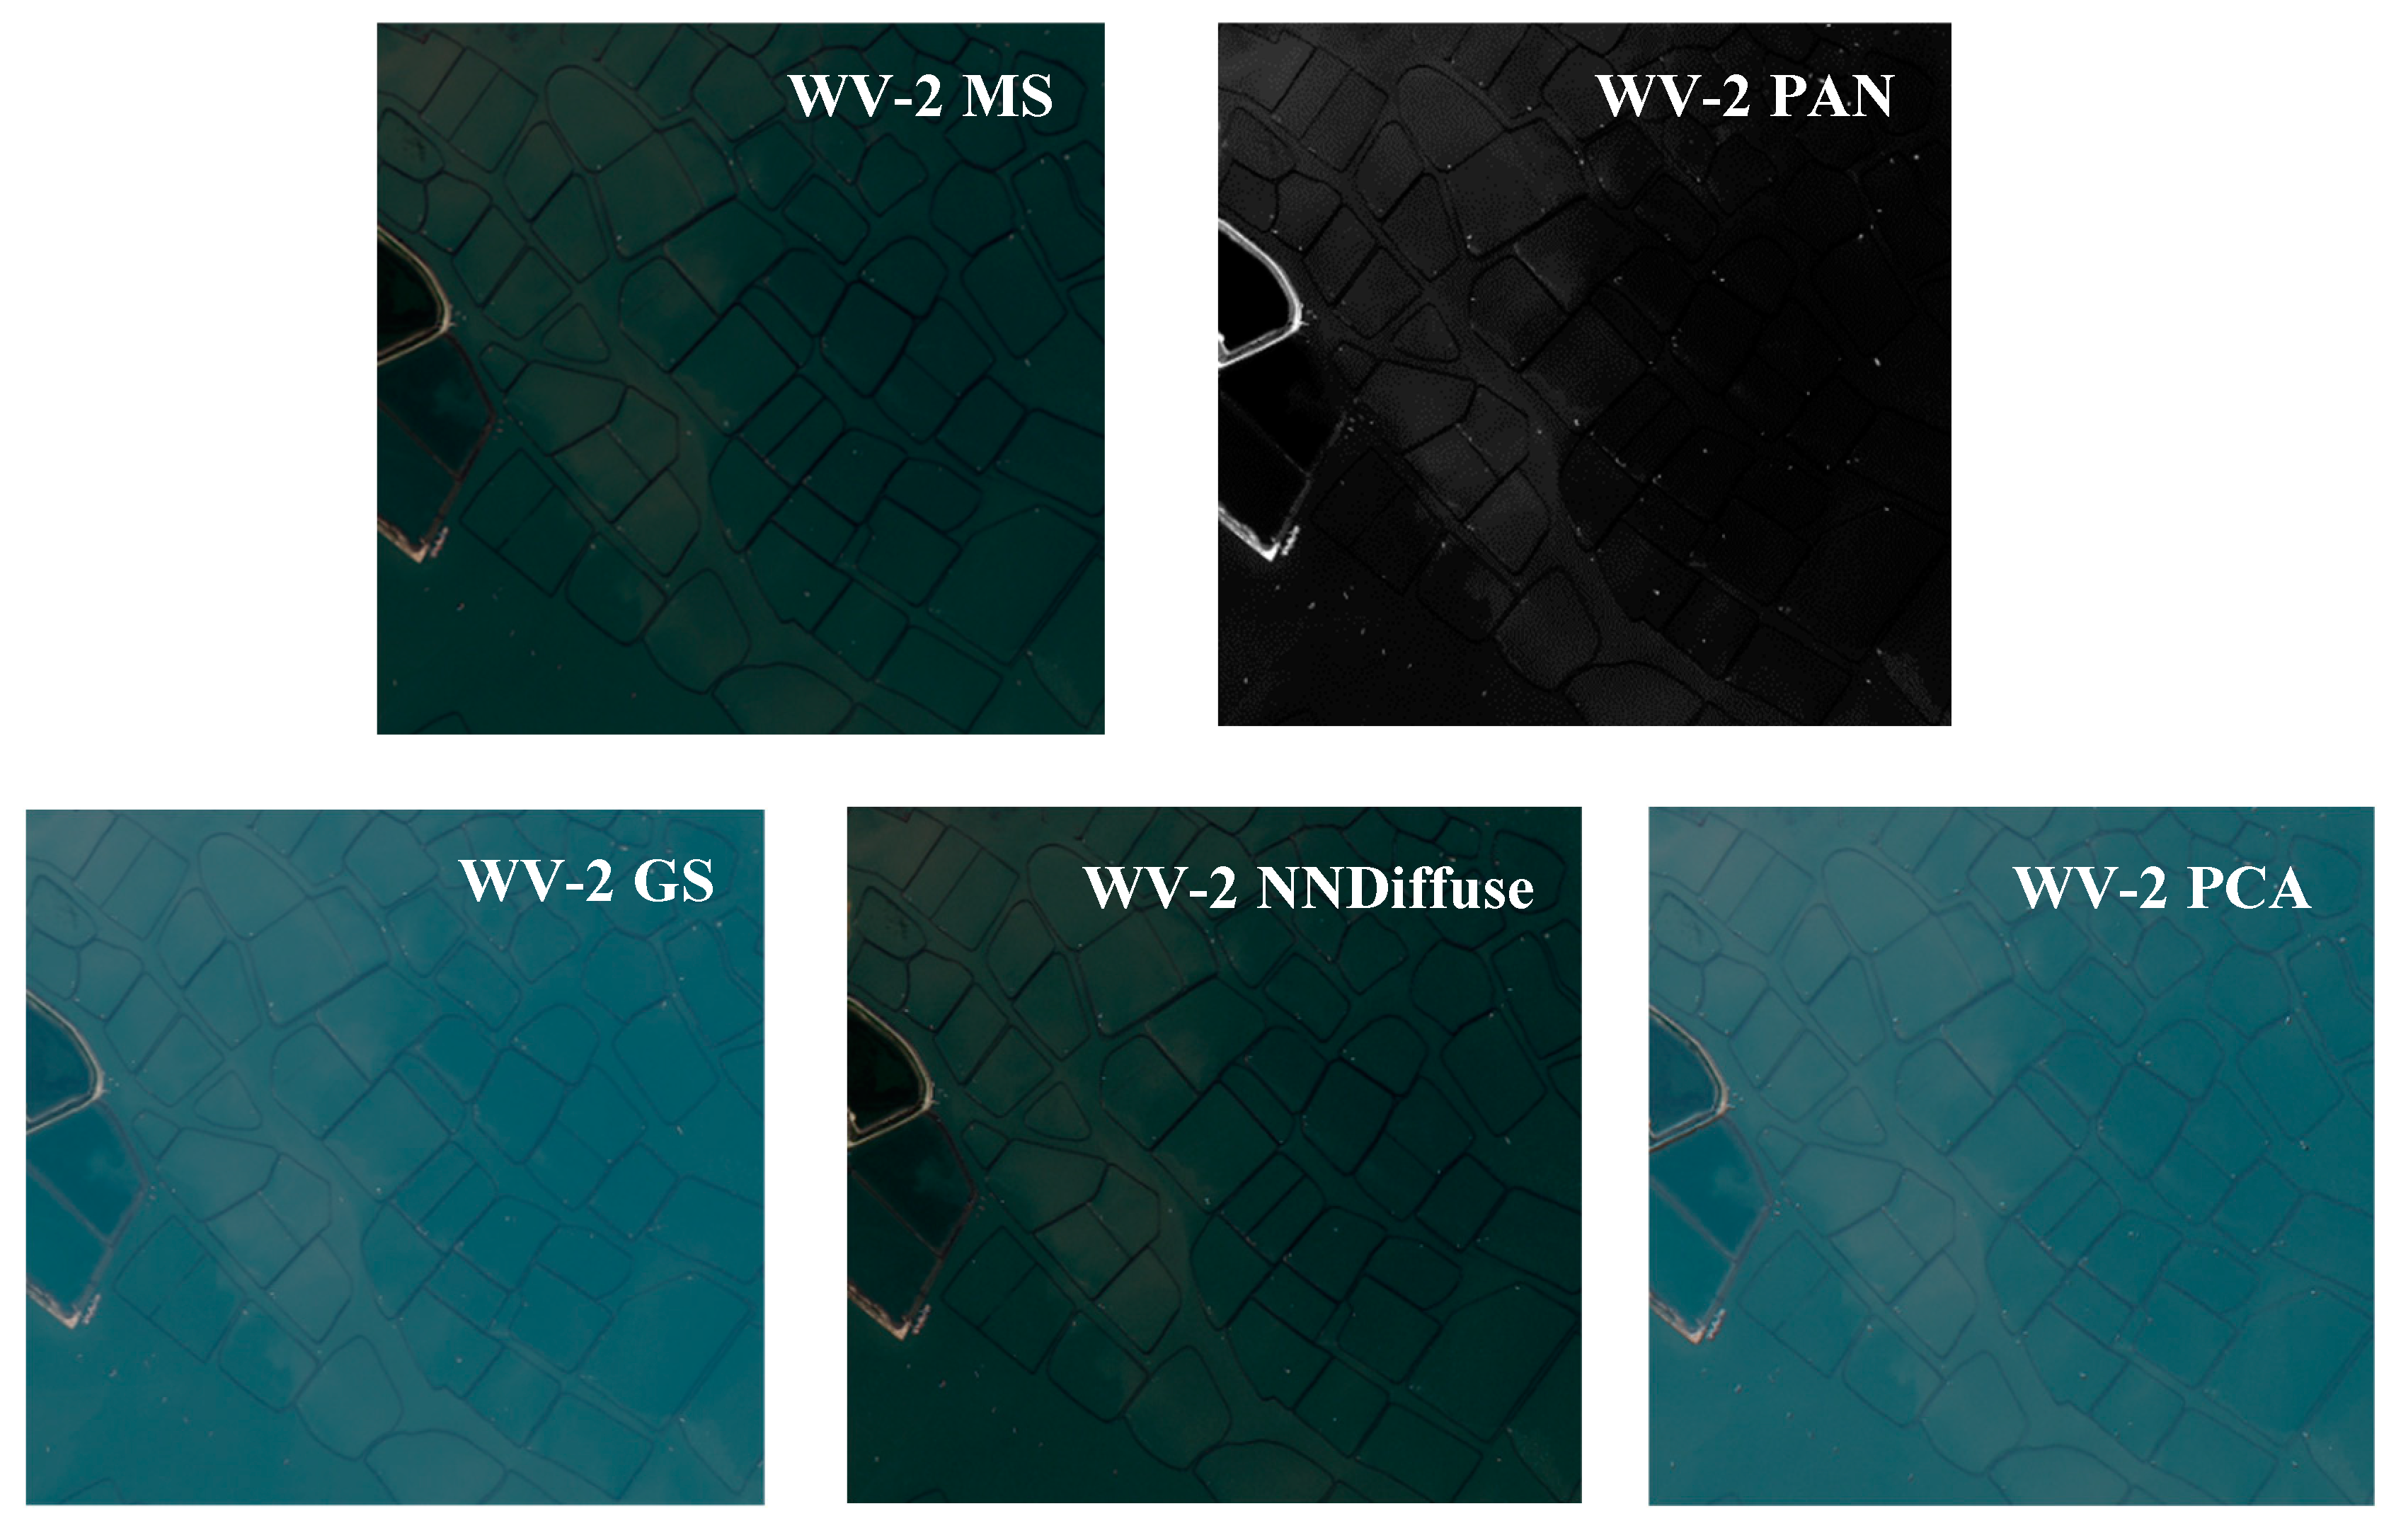
3.1.3. WV-2 Fusion Evaluation

As shown in Table 4, the gray mean values in B1, B3, and B4 (GS fusion) are larger and contain more information. The gray mean value in each band of the NNDiffuse results is closer to each band of the original multispectral data, indicating the information content is closer to the original multispectral images. The standard deviation in the B1, B2 (PCA), B3, and B4 (NNDiffuse) bands is high, indicating the grayscale divergence is also high. The contrast is relatively high, particularly in the B2, B3, and B4 bands where the average gradient, layering, and image sharpness are high. The information entropy value in each PCA band is also higher than in other images, indicating more information content. The correlation coefficients in B1 and B2 are higher and the information is more uniform.
Although each fused image (Figure 6) exhibited a certain degree of spectral deviation and information loss, GS and PCA fusion generally produced the least spectral distortion. This effect was minimal in NNDiffuse results, which is evident from the visual content interpretation and spectral retention analysis. As such for WV-2, PCA fusion is optimal for identifying and extracting coastal zone aquacultures.

3.1.4. Image Fusion Evaluation Index—CQmax

All the fusion results were evaluated using the CQmax index (see Figure 7). As shown in Figure 7, larger values of CQmax indicated better fusion results, in which the fused image was more similar to the original multispectral image. The figure shows fusion results produced by three different methods applied to GF-1 data: PCA (0.0281), NNDiffuse (0.0257), and GS (0.0154). The CQmax values for PCA and NNDiffuse results are similar, indicating the two techniques are superior, with PCA slightly outperforming NNDiffuse. These panchromatic and multispectral fusion methods were also applied to GF-2 data, producing the following CQmax values: NNDiffuse (0.0322), PCA (0.0312), and GS (0.0307). These effects are similar, with NNDiffuse producing the best results. Results using WV-2 data were as follows: NNDiffuse (0.0427), GS (0.0177), and PCA (0.0176). In this case, the NNDiffuse technique produced the best results, indicating the fused image was closest to the original multispectral data.
The CQmax index was used to evaluate fused enclosure seine images for comparison with the initial multispectral images. As shown in Figure 7, PCA produced the best fusion results for GF-1 data, while NNDiffuse produced the best results for GF-2 and WV-2 images. Among these, NNDiffuse applied to WV-2 data produced the best results. However, this result is not completely consistent with the previous ones.

3.2. Raft Culture Zone Fusion Evaluation

The applied fusion techniques have improved the spatial information in the floating raft areas of the GF-1, GF-2, and WV-2 data. The rafts can be clearly seen in each of the fused images and the outline of the breeding area can be easily distinguished. However, the contrast is poor between the floating rafts and the bodies of water, which are connected in the breeding area. The number of rafts cannot be identified, primarily because the resolution of the GF-1 data is lower than that of the GF-2 and WV-2 images. Each fused image has maintained its spectrum, resembling the color of the original multispectral data, for the GF-1 (see Figure 8), GS and PCA fusion results are closer to the original images. Water in the NNDiffuse results appears dark green, which is more prominent than the floating raft cultures in the image. For the GF-2 (see Figure 9), the color and texture of the image after GS and NNDiffuse fusion is closest to the original multispectral images. The contrast is also higher and some brighter spots have been added to the edges of the floating rafts in the NNDiffuse results. In comparison, the PCA fusion result is dark and the contrast is poor between floating rafts and water, which is not conducive to object identification or extraction. For the WV-2 (see Figure 10), the color in the GS and PCA fusion images is brighter. The water is dark blue in the GS results and light blue in the PCA results. The color in the NNDiffuse images is closest to the original multispectral data, with high contrast between the water and the floating rafts.

3.2.1. GF-1 Fusion Evaluation

As shown in Table 5, the average gradient of the rafts in each band of the fusion images (Figure 8) is higher than that of the original multi-spectral data, indicating the definition of each fused image has been improved to some degree. The standard deviation, information entropy, and average gradient of the B1, B2, and B3 bands in the NNDiffuse results are higher, indicating clear detail and diverse textural information. The standard deviation and information entropy in the B4 band of the PCA fusion results are higher than with other techniques. The average gradient in the B4 band of the GS fusion results is also higher than with other techniques. Correlation coefficients in the B3 and B4 bands of the NNDiffuse results are higher, indicating the gray levels of each band are scattered and the information is uniform. The spectral distortion and the deviation index were the smallest in each NNDiffuse band, indicating lower spectral information loss and higher spectral fidelity. The spectral retention produced by GS fusion is lower than with NNDiffuse and the gray mean value of each NNDiffuse band is closest to the gray mean value in the original multispectral images. This suggests the NNDiffuse method is capable of maintaining spectral characteristics, producing the best overall effect.
The NNDiffuse technique produces the best fusion results for GF-1 data in floating raft culture areas, as measured by qualitative and quantitative comprehensive evaluations.

3.2.2. GF-2 Fusion Evaluation

As shown in Table 6, the standard deviation, information entropy, and the average gradient of B1, B2, and B3 bands in the NNDiffuse results are higher than in other fused images (Figure 9). This indicates the three bands include the highest number of gray levels, the most spatial information, and the most detailed texture. The maximum standard deviation, information entropy, and average gradient occurred in B4 of the GS fusion results. The correlation coefficients in the fused bands were higher than in the original multispectral bands, indicating the information to be more uniform. Information inclusion was highest with the NNDiffuse algorithm, which produced the lowest spectral distortion and deviation index in each band. It also produced the highest levels of spectrum preservation, as the gray mean value in each band of the fused images was closest to the original multispectral data. These results suggest NNDiffuse is the most capable of maintaining spectral characteristics, particularly for GF-2 data, followed by GS fusion.

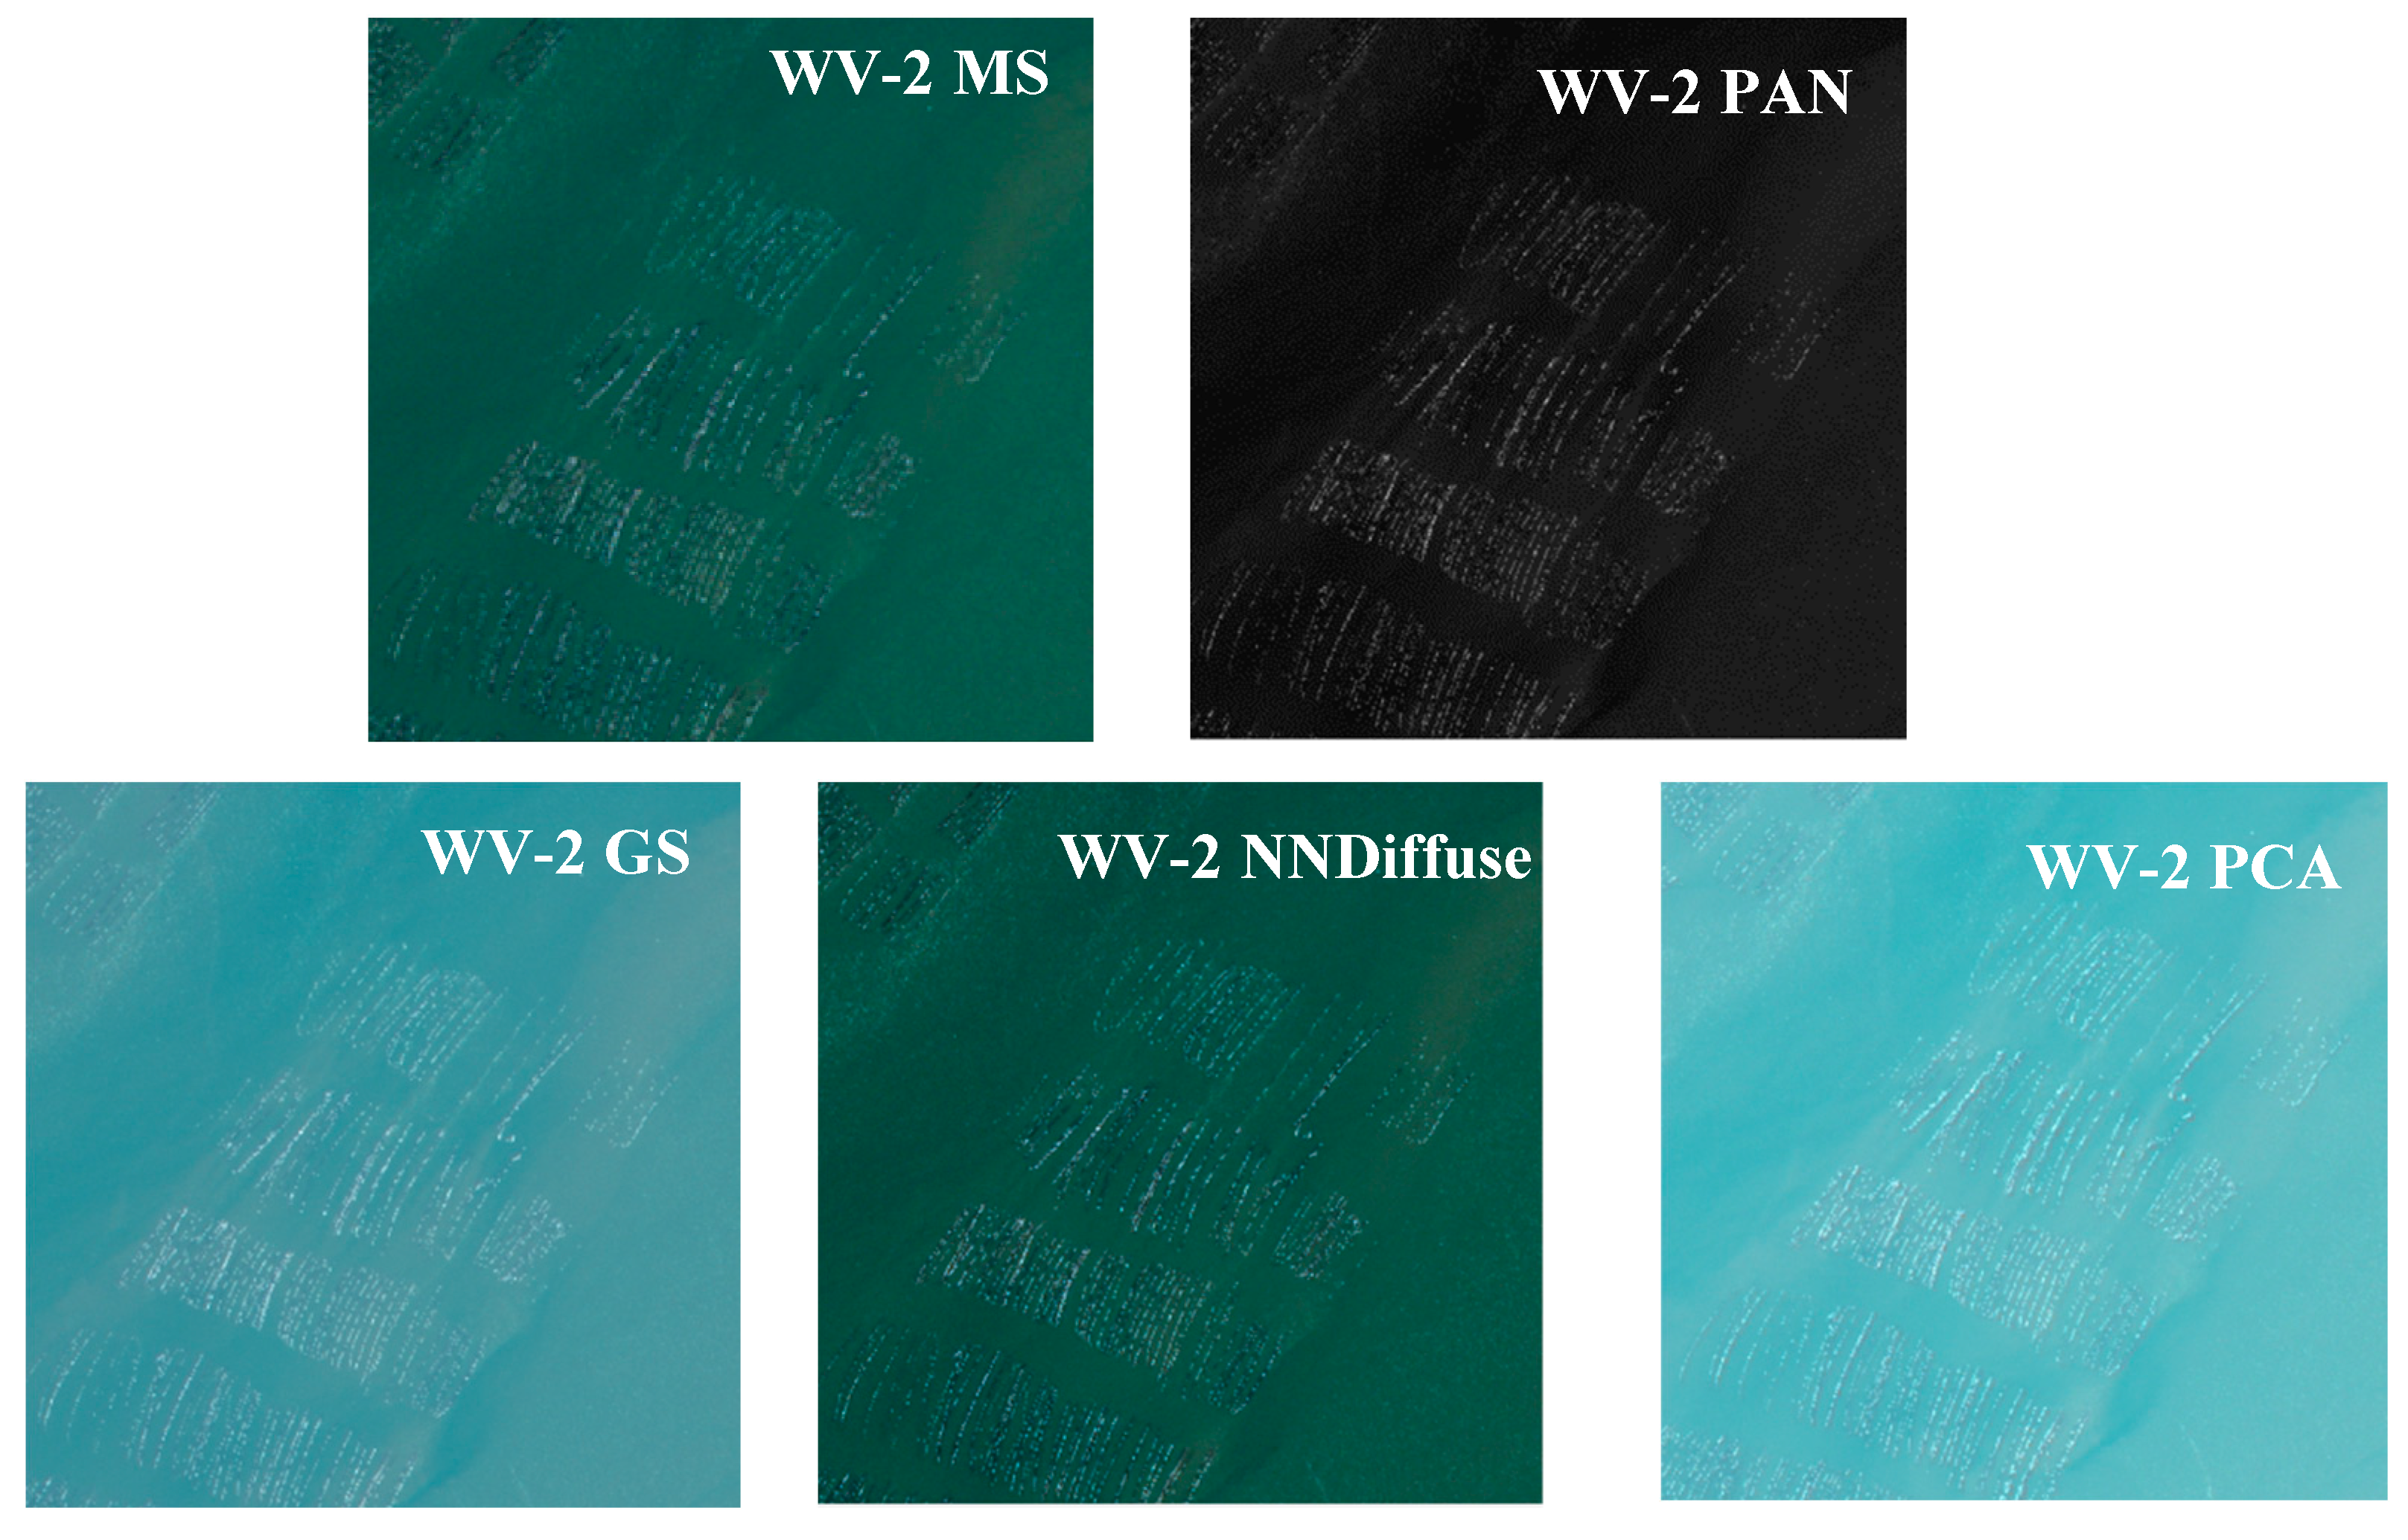
3.2.3. WV-2 Fusion Evaluation

Figure 10 shows the fusion results of WV-2 for a floating raft culture area. Table 7 gives the quantitative evaluation results for WV-2 fusion data.
The standard deviation, information entropy, and average gradient in each band of the fused images (Figure 10) are higher than in the original multispectral data, indicating that each image contains more information after fusion. The standard deviation in the B1 and B2 bands of the PCA results is higher than with other fusion modalities. The standard deviation in the B3 and B4 bands of the GS results is also higher, indicating increased grayscale contrast. The information entropy, average gradient, and correlation coefficient in each band of the PCA fusion results are higher than in other fusion images, indicating the PCA data contain diverse and well-distributed information. These images exhibit higher definition and the best fusion effects.
The fused images exhibit varying degrees of spectral distortion, deviation, and information loss. The spectral distortion and the deviation index of each band are the smallest in the NNDiffuse results. The spectrum remains unaltered, which is consistent with a visual inspection. Gray mean values in the B1, B2, and B3 bands of the NNDiffuse results are closest to the original multispectral data. Although the PCA results exhibit a little larger degree of spectrum distortion, PCA is more suitable for WV-2 because the information retention of PCA is higher than the NNDiffuse images, which is more important to information extraction.

3.2.4. Image Fusion Evaluation Index—CQmax

Figure 11 shows the CQmax values of three fusion algorithms applied to the floating raft culture area. Results from panchromatic and multispectral GF-1 data were: PCA (0.0163), NNDiffuse (0.0171), and GS (0.0173). The CQmax values for NNDiffuse and GS were relatively close, indicating the GF-1 fusion effects were similar. Evaluation results were highly similar to qualitative and quantitative assessments. Results for panchromatic and multispectral images from GF-2 data sources were as follows: PCA (0.0338), NNDiffuse (0.0429), and GS (0.0364). In this case, the CQmax value was the largest for NNDiffuse, indicating the best fusion effect. The CQmax values for PCA, NNDiffuse, and GS from panchromatic and multispectral WV-2 data were 0.0498, 0.0458, and 0.0489, respectively. The CQmax value was the largest for PCA, indicating the best fusion effect. Therefore, the CQmax index was successfully used to evaluate fusion results for multispectral images of a cultured floating raft area, validating the feasibility of the proposed methodology.

4. Conclusions

Remote sensing technology is gradually replacing manual field surveys as high-resolution data are applied to aquaculture at multiple levels. China’s ground observation system acquires high-resolution data in an attempt to modify conventional optical remote sensing technology. This study used GF-1, GF-2, and WV-2 remote sensing data to perform PCA, GS, and NNDiffuse fusion for images from enclosure seine and floating raft culture areas. Quantitative evaluations with seven statistic indexes and CQmax were performed separately for the different data sources and aquiculture areas with qualitative evaluations.
The experimental analysis shows that the fusion processed images are clearer in spatial structure than the original image and provide more information after fusion, which illustrates the importance of fusion. Various methods can improve the spatial resolution of the original image but can also cause changes to the spectral information of the original image. The application background for this study is aquaculture information extraction, especially enclosure seine culture areas and floating raft culture areas. In addition to water, aquaculture facilities on the water are the targets to be identified, even a single culture raft. The distance between the features is close and the distribution is dense, so the boundary feature extraction is very important. This study not only uses statistical quantitative methods but also the CQmax index and visual interpretation to evaluate the fusion image, comparing and analyzing the evaluation results of the three image fusion methods. Visual interpretation is more intuitive and simpler but lacks data support, whereas the statistical method can comprehensively evaluate the impact after the fusion (seven statistical indicators introduced). The statistical evaluation is objective and accurate, but its calculation and process are cumbersome. The CQmax index is applied to image evaluation. Although the calculation process is simple, the evaluation results are not based on specific indicators but are instead directly obtained by program algorithms [29]. The study results show that the conclusion of the CQmax evaluation and the evaluation results of statistical parameters are not completely consistent.
As shown in Table 8, according to the quantitative evaluation results of seven statistic indexes for the enclosure seine culture area, the optimal fusion methodology varied with the data type. GS fusion produced the best results for GF-1 images, and PCA fusion was optimal for GF-2 and WV-2 data sources. In the background of floating raft culture areas, NNDiffuse produced the best fusion results for GF-1 and GF-2 data sources, and PCA fusion was optimal for integrating WV-2 data. The CQmax metric was used to compare image quality for three multispectral data sources fused with varying modalities [29]. For the enclosure seine culture area, the results showed PCA to be optimal for GF-1 data. NNDiffuse was optimal for GF-2 and WV-2 data, with little variation in the GF-2 results. For the floating raft culture area, NNDiffuse was also optimal for GF-1 and GF-2 data, and PCA was optimal for WV-2 data, which is consistent with the results of qualitative and subjective evaluations. Therefore, we can see that the two conclusions of quantitative evaluations are different for the enclosure seine culture area, while for the floating raft culture area, the two conclusions are the same.
In terms of improving the spatial resolution of the image, PCA and NNDiffuse perform better in spatial detail enhancement, which has a high degree of image definition and information. The GS fusion method is not very effective and should not be used as a basic image for classification. Note that no matter what kind of remote sensing data source, the image will be distorted to a certain degree after fusion. Therefore, in all, NNDiffuse and PCA have some extent of advantage in high-resolution image fusion, being better in both spatial information enhancement and spectral preservation. The edges of the cultured floating raft and enclosure seine are clear on the fusion image of these two methods, and both the spatial texture and spectral information preservation are better. For WV-2, PCA is better.
This study shows that no image fusion method is suitable for all remote sensing data. The so-called “best” fusion method is relative. Different fusion methods should be considered for each data type and image acquisition area. Preferred fusion techniques can perform better in spectral inheritance, spatial resolution, and information diversity. As such, at the same time in practical applications, the time efficiency of the algorithm and the accuracy of the evaluation results are comprehensively considered to select the best evaluation index. Meanwhile, for high-resolution remote sensing image fusion, there is currently no standard for evaluating fusion quality.

Author Contributions

Conceptualization, W.Z.; methodology, F.W.; software, X.W. and F.W.; validation, F.W., F.T. and J.L.; formal analysis, X.W.; investigation, F.T. and J.L.; resources, W.Z.; data curation, W.Z.; writing—original draft preparation, X.W.; writing—review and editing, W.Z.; visualization, X.W.; supervision, W.Z.; project administration, W.Z.; funding acquisition, W.Z. All authors have read and agreed to the published version of the manuscript.

Funding

This research was financially supported by Shanghai Sailing Program (NO. 19YF1460000) and National Key Research and Development Project of China (2019YFD0901405).

Institutional Review Board Statement

Not applicable.

Informed Consent Statement

Not applicable.

Data Availability Statement

Not applicable.

Conflicts of Interest

The authors declare no conflict of interest.

Appendix A

List of the main acronyms used in this paper
DescriptionAcronym
Remote sensingRS
Ground sampling distances GSD
MultispectralMS
PanchromaticPAN
HyperspectralHS
Principal component analysisPCA
Gram–SchmidtGS
Nearest neighbor diffusionNNDiffuse
Gaofen-1GF-1
Gaofen-2GF-2
WorldView-2WV-2

Appendix B

Quantitative evaluation indexes of gray mean value, standard deviation, information entropy, average gradient, correlation coefficient, spectral distortion, and bias index.
NameExpressionFeature
Gray mean Value A ( M e a n ) = 1 M × N i = 1 M j = 1 N A ( i , j )
M and N are the numbers of image rows and columns, and A (i, j) is the gray value of the corresponding pixel.
The closer the average value is to the multi-spectral image average, the smaller the spectral distortion.
Standard deviation S ( s t d ) = i = 1 M j = 1 N ( A ( i , j ) A ¯ ( i , j ) ) 2 M × N
M and N are the numbers of   rows   and   columns   of   the   image   and   A ( i , j ) A ¯ ( i , j ) is the difference between the gray level and average gray level of each pixel.
The larger the standard deviation, the more scattered the gray level distribution, the larger the contrast of the image, and the more convenient the information extraction.
Information entropy H ( e n t r o p y ) = i = 1 M P i ln P i
M is the maximum gray level of the image, and Pi is the probability of gray level i.
The larger the entropy value of the fused image, the more the information of the fused image increases.
Average gradient G ( g r a d ) = 1 ( M 1 ) × ( N 1 ) i = 1 M 1 j = 1 N 1 · · = [ | F ( x , y ) x | 2 + | F ( x , y ) y | 2 ] 2
M and N are the numbers of   rows   and   columns   of   the   image .   F   ( i ,   j )   is   the   gray   value   at   ( i ,   j ) .   F ( x , y ) x   and   F ( x , y ) y are the gray value changes of the fusion image in the x and y directions, respectively.
The larger the average gradient, the clearer the layers of the image and the higher the sharpness of the image.
Correlation coefficient C ( f , g ) = i = 0 M 1 j = 0 N 1 [ ( f ( i , j ) e f ) ( g ( i , j ) e g ) ] i = 0 M 1 j = 0 N 1 [ ( f ( i , j ) e f ) 2 ] × i = 0 M 1 j = 0 N 1 [ ( g ( i , j ) e g ) 2 ] ef and eg are the averages of the two images, and M and N are the height and width of the images, respectively.The larger the correlation coefficient between the fused image and the multi-spectral image indicates that the higher the degree of integration of high-frequency information, the smaller the degree of image spectral variation.
Spectral distortion W ( w a r p ) = 1 M × N i = 1 M j = 1 N | F ( i , j ) A ( i , j ) |
M and N are the numbers of rows and columns of the image, F (i, j) represents the gray value of the fusion image, and A (i, j) is the gray value of the original multispectral image.
The greater the degree of distortion, the higher the degree of spectral distortion of the image.
Bias index D ( b r a s ) = 1 M × N i = 1 M j = 1 N | F ( i , j ) A ( i , j ) | A ( i , j )
M and N are the numbers of rows and columns of the image, F (i, j) represents the gray value of the fused image, and A (i, j) represents the gray value of the original multispectral image.
The smaller the deviation index, the higher the spectral information retention of the image before and after fusion.

References

  1. Tan, Y.; Shen, Z.; Jia, C.Y.; Wang, X.H.; Deng, J.S. The Study on Image Fusion for Medium and High Spatial Resolution Remote Sensing Images. Remote Sens. Technol. Appl. 2007, 22, 536–542. (In Chinese) [Google Scholar]
  2. Ehlers, M.; Jacobsen, K.; Schiewe, J. High resolution image data and GIS. In ASPRS Manual of GIS; Madden, M., Ed.; American Society for Photogrammetry and Remote Sensing: Bethesda, MD, USA, 2009; pp. 721–777. [Google Scholar]
  3. Cliche, G.; Bonn, F.; Teillet, P. Integration of the SPOT pan channel into its multispectral mode for image sharpness enhancement. Photogramm. Eng. Remote Sens. 1985, 51, 311–316. [Google Scholar]
  4. Welch, R.; Ehlers, M. Merging multiresolution SPOT HRV and Landsat TM data. Photogramm. Eng. Remote Sens. 1987, 53, 301–303. [Google Scholar]
  5. Chavez, W.J.; Sides, S.C.; Anderson, J.A. Comparison of three different methods to merge multiresolution and multispectral data: TM and SPOT pan. Photogramm. Eng. Remote Sens. 1991, 57, 295–303. [Google Scholar]
  6. Ehlers, M. Multisensor image fusion techniques in remote sensing. ISPRS J. Photogramm. Remote Sens. 1991, 46, 19–30. [Google Scholar] [CrossRef] [Green Version]
  7. Ghassemian, H. A review of remote sensing image fusion methods. Inf. Fusion 2016, 32, 75–89. [Google Scholar] [CrossRef]
  8. Basaeed, E.; Bhaskar, H.; Al-Mualla, M. Beyond Pan-sharpening: Pixel-level Fusion in Remote Sensing Applications. In Proceedings of the International Conference on Innovations in Information Technology, Abu Dhabi, United Arab Emirates, 18–20 March 2012; pp. 139–144. [Google Scholar]
  9. Zhang, Y. Methods for image fusion quality assessment-A review, comparison and analysis. Remote Sens. Spat. Inf. Sci. 2008, B7, 1101–1109. [Google Scholar]
  10. Ojeda, S.M.; Lamberti, W.P.; Vallejos, O.R. Measure of similarity between images based on the co-dispersion coefficient. J. Electron. Imaging 2012, 21, 023019. [Google Scholar] [CrossRef]
  11. Pistonesi, S.; Martinez, J.; Ojeda, S.M.; Vallejos, R. A Novel Quality Image Fusion Assessment Based on Maximum Codispersion. In Progress in Pattern Recognition, Image Analysis, Computer Vision, and Applications. CIARP 2015: Lecture Notes in Computer Science; Pardo, A., Kittler, J., Eds.; Springer: Cham, Switzerland, 2015; Volume 9423, pp. 383–390. [Google Scholar]
  12. Wu, R.; He, X.; Wang, J. Quality assessment of fusion of ZY-3 multispectral and panchromatic images for coastal wetland areas. High Technol. Lett. 2015, 25, 157–162. [Google Scholar]
  13. Wei, W.; Wang, Z.; Wang, C. A Quality Assessment for Remote Sensing Image Fusion. J. Image Graph. 2009, 14, 1488–1493. [Google Scholar]
  14. Cao, L.; Naylor, R.; Henriksson, P.; Leadbitter, D.; Metian, M.; Troell, M.; Zhang, W. China’s aquaculture and the world’s wild fisheries. Science 2015, 347, 133–135. [Google Scholar] [CrossRef] [PubMed]
  15. Agriculture Organization of the United Nations. Fisheries Department. The State of World Fisheries and Aquaculture; Food & Agriculture Organization: Rome, Italy, 2000; Volume 3. [Google Scholar]
  16. Froehlich, H.E.; Gentry, R.R.; Halpern, B.S. Global change in marine aquaculture production potential under climate change. Nat. Ecol. Evol. 2018, 2, 1745–1750. [Google Scholar] [CrossRef] [PubMed]
  17. Soto, D.; Ross, L.G.; Handisyde, N.; Bueno, P.B.; Beveridge, M.C.; Dabbadie, L.; Aguilar-Manjarrez, J.; Cai, J.N.; Pongthanapanich, T. Climate Change and Aquaculture: Vulnerability and Adaptation Options. In Impacts of Climate Change on Fisheries and Aquaculture; FAO Fisheries and Aquaculture Technical Paper No. 627; FAO: Rome, Italy, 2019; pp. 65–490. [Google Scholar]
  18. Meaden, G.J.; Aguilar-Manjarrez, J. (Eds.) Advances in Geographic Information Systems and Remote Sensing for Fisheries and Aquaculture; FAO Fisheries and Aquaculture Technical Paper No. 552; FAO: Rome, Italy, 2013. [Google Scholar]
  19. Cao, L.; Gu, W.J.; Li, X.S.; Hua, C.J.; Zhou, W.F. Remote sensing investigation on the distribution of oyster culture based on WorldView Satellite data in the Iron Bay of Zhejiang Province. Fish. Inf. Strategy 2016, 31, 286–292. (In Chinese) [Google Scholar]
  20. Zhou, W.F.; Cao, L.; Li, X.S.; Cheng, T.F. Assessments of Fusion Methods Using WorldView-2 Satellite Images for Coastal Oyster Culture Observation. Remote Sens. Technol. Appl. 2018, 33, 103–109. (In Chinese) [Google Scholar]
  21. González-Audícana, M.; Saleta, J.L.; Catalán, R.G.; García, R. Fusion of multispectral and panchromatic images using improved IHS and PCA mergers based on wavelet decomposition. IEEE Trans. Geosci. Remote Sens. 2004, 42, 1291–1299. [Google Scholar] [CrossRef]
  22. Liu, L.; Wang, Y.; Wang, Y. Adaptive steepest descent method for pan-sharpening of multispectral images. Opt. Eng. 2011, 50, 62–65. [Google Scholar] [CrossRef]
  23. Laben, C.A.; Brower, B.V. Process for Enhancing the Spatial Resolution of Multispectral Imagery Using Pan-Sharpening. U.S. Patent 6011875A, 4 January 2000. [Google Scholar]
  24. Sun, W.H.; Chen, B.; Messinger, D. Nearest-neighbor diffusion-based pan-sharpening algorithm for spectral images. Opt. Eng. 2014, 53, 013107. [Google Scholar] [CrossRef] [Green Version]
  25. Available online: https://directory.eoportal.org/web/eoportal/satellite-missions/g/gaofen-1 (accessed on 10 January 2022).
  26. Available online: https://directory.eoportal.org/web/eoportal/satellite-missions/g/gaofen-2 (accessed on 10 January 2022).
  27. Available online: https://www.satimagingcorp.com/satellite-sensors/worldview-2/ (accessed on 10 January 2022).
  28. Zhou, J.; Ai, H.; Zhang, L. A Comparative Study of Method of GF-1 Remote Sensing Image Fusion. Geospat. Inf. 2016, 14, 47–49. (In Chinese) [Google Scholar]
  29. Ojeda, S.; Britos, G.; Vallejos, R. An image quality index based on coefficients of spatial association with an application to image fusion. Spat. Stat. 2018, 23, 1–16. [Google Scholar] [CrossRef] [Green Version]
  30. Jin, X.; Jiang, G.; Chen, F.; Yu, M.; Shao, F.; Peng, Z.J. Adaptive image quality assessment method based on structural similarity. J. Optoelectron. Laser 2014, 25, 378–385. [Google Scholar]
  31. Wang, Z.; Bovik, A.; Sheikh, H.R.; Simoncelli, E.P. Image quality assessment: From error visibility to structural similarity. IEEE Trans. Image Process. 2004, 13, 1–14. [Google Scholar] [CrossRef] [PubMed] [Green Version]
Figure 1. Location map of the study area.
Applsci 12 01170 g001
Figure 2. The scenes of different types of aquaculture areas. (a) Enclosure seines culture area; (b) floating rafts culture area.
Applsci 12 01170 g002
Figure 3. The flow chart of image fusion evaluation in aquaculture areas.
Applsci 12 01170 g003
Figure 4. Comparison of fusion effects for GF-1 data for enclosure seine culture.
Applsci 12 01170 g004
Figure 5. Comparison of fusion effects for GF-2 data for enclosure seine culture.
Applsci 12 01170 g005
Figure 6. Comparison of fusion effects for WV-2 data for enclosure seine culture.
Applsci 12 01170 g006
Figure 7. CQmax of fusion results in the enclosure seine culture area.
Applsci 12 01170 g007
Figure 8. Comparison of fusion effects for GF-1 data for floating raft culture.
Applsci 12 01170 g008
Figure 9. Comparison of fusion effects for GF-2 data for floating raft culture.
Applsci 12 01170 g009
Figure 10. Comparison of fusion effects for WV-2 data for floating raft culture.
Applsci 12 01170 g010
Figure 11. CQmax of fusion results in the floating raft culture area.
Applsci 12 01170 g011
Table 1. The sample image data description of GF-1, GF-2, and WV-2.
Data TypeBand (μm)Spatial ResolutionImage Date
GF-1Band1—blue 0.45–0.52
Band 2—green 0.52–0.59
Band 3—blue 0.63–0.69
Band 4—near infrared 0.77–0.89
Panchromatic (2 m)
Multi-spectral (8 m)
15 February 2016
GF-2Band1—blue 0.45–0.52
Band 2—green 0.52–0.59
Band 3—blue 0.63–0.69
Band 4—near infrared 0.77–0.89
Panchromatic (1 m)
Multi-spectral (4 m)
15 February 2016
WV-2Band 1—coast 0.40–0.50
Band 2—blue 0.45–0.51
Band 3—green 0.51–0.58
Band 4—yellow 0.58–0.62
Band 5—red 0.63–0.69
Band 6—red edge 0.70–0.74
Band 7—near infrared 0.77–0.89
Band 8—near infrared 2 0.86–1.04
Panchromatic (0.5 m)
Multi-spectral (2 m)
13 April 2017
Table 2. Quantitative evaluation results for GF-1 data for enclosure seine culture.
GF-1BandGray Mean ValueStandard DeviationInformation EntropyAverage GradientCorrelation CoefficientSpectral DistortionBias Index
MSBand1241.3127.526.296.30000
Band2240.1333.846.679.77000
Band3170.8142.016.888.45000
Band4121.7255.787.098.77000
GSBand1460.57208.459.4741.50−0.01184.010.76
Band2609.64249.439.7747.57−0.03376.000.79
Band3687.72291.969.9351.420.09136.170.76
Band41181.08450.3110.6361.660.151059.3610.43
NNDiffuseBand157.2513.8103.97−0.02234.530.99
Band249.6013.4803.52−0.02190.531.60
Band339.1912.6902.870.06131.621.17
Band420.5310.4901.660.14101.180.80
PCABand150.7617.4003.48−0.03190.550.79
Band243.8516.8703.01−0.03196.280.81
Band334.6415.5802.490.09517.240.79
Band417.4313.4101.860.15104.290.84
Table 3. Quantitative evaluation results for GF-2 data for enclosure seine culture.
GF-2BandGray Mean ValueStandard DeviationInformation EntropyAverage GradientCorrelation CoefficientSpectral DistortionBias Index
MSBand1369.5852.787.1412.44000
Band2283.3354.657.4016.08000
Band3213.5066.097.6816.38000
Band4162.6268.527.8915.11000
GSBand1348.3137.996.997.060.0444.900.11
Band2256.7046.077.388.110.0350.510.17
Band3200.0560.687.669.410.1360.170.27
Band4162.6262.71 7.73 6.78 0.22 63.73 0.47
NNDiffuseBand1365.3568.597.7818.690.0357.280.15
Band2282.4263.907.8114.900.0257.620.20
Band3203.1672.567.9412.390.1265.150.30
Band4173.0065.937.819.710.2365.960.50
PCABand1338.8580.128.0617.240.0573.680.19
Band2262.3777.438.0813.640.0470.820.24
Band3217.9384.438.1711.280.1473.960.34
Band4160.7983.768.1611.280.2375.440.56
Table 4. Quantitative evaluation results for WV-2 data for enclosure seine culture.
WV-2BandGray Mean ValueStandard DeviationInformation EntropyAverage GradientCorrelation
Coefficient
Spectral DistortionBias Index
MSBand1242.7847.586.2410.51000
Band2413.8177.757.1818.17000
Band3230.29106.687.7121.73000
Band4239.77216.107.8030.44000
GSBand1241.0440.816.765.26−0.0639.240.15
Band2319.4871.537.587.58−0.0466.970.20
Band3250.67100.537.937.360.0196.350.41
Band4285.53218.188.079.580.25180.011.06
NNDiffuseBand1241.3035.116.265.15−0.0132.940.12
Band2320.5667.187.177.600.0159.790.18
Band3247.81104.897.637.620.0791.090.38
Band4252.25224.587.6110.340.25168.680.85
PCABand1238.5347.766.988.44−0.0642.040.16
Band2315.8472.577.7010.74−0.0468.030.20
Band3248.2397.657.979.830.0196.150.41
Band4283.60215.128.2213.880.25179.631.05
Table 5. Quantitative evaluation results for GF-1 data from a floating raft culture area.
GF-1BandGray Mean ValueStandard DeviationInformation EntropyAverage GradientCorrelation CoefficientSpectral DistortionBias Index
MSBand1256.574.534.200.78000
Band2246.706.614.761.21000
Band3143.396.554.690.88000
Band467.994.874.290.97000
GSBand1195.624.824.271.430.1750.950.21
Band2195.486.084.611.490.2851.220.21
Band3102.915.064.351.130.2940.470.28
Band426.524.534.161.260.1241.470.61
NNDiffuseBand1245.116.814.732.430.146.740.03
Band2245.427.884.962.420.239.060.04
Band3141.545.564.491.430.287.630.05
Band467.823.813.950.800.205.420.80
PCABand1190.014.814.281.420.1856.580.23
Band2189.886.024.591.460.2856.820.23
Band398.575.054.351.140.2844.820.31
Band422.514.624.201.240.1245.480.67
Table 6. Quantitative evaluation results for GF-2 data from a floating raft culture area.
GF-2BandGray Mean ValueStandard DeviationInformation EntropyAverage GradientCorrelation CoefficientSpectral DistortionBias Index
MSBand1365.224.653.991.38000
Band2281.025.774.251.38000
Band3157.289.094.321.26000
Band458.1510.603.750.28000
GSBand1279.7812.89 4.59 5.280.0485.560.23
Band2213.619.974.474.070.0367.490.24
Band3103.828.703.963.210.0853.560.34
Band481.638.804.012.050.03 9.78 0.16
NNDiffuseBand1361.9723.595.589.930.0413.870.04
Band2277.3917.975.297.570.0311.670.04
Band3150.2010.684.284.270.038.730.05
Band456.265.783.641.170.032.050.03
PCABand1261.1413.144.565.30 0.01104.130.29
Band2199.0410.174.494.16 0.0382.020.29
Band393.108.654.043.240.0964.220.41
Band425.897.751.921.890.0311.560.20
Table 7. Quantitative evaluation results for WV-2 data from a floating raft culture area.
WV-2BandGray Mean ValueStandard DeviationInformation EntropyAverage GradientCorrelation CoefficientSpectral DistortionBias Index
MSBand1231.593.453.622.24000
Band2302.747.414.673.51000
Band3198.279.085.103.36000
Band497.9910.614.735.20000
GSBand1219.4312.874.574.580.0316.070.07
Band2286.3817.475.406.120.0221.700.07
Band3186.2917.565.684.910.0719.290.10
Band492.0123.745.795.390.0419.340.19
NNDiffuseBand1235.5512.834.805.060.027.320.03
Band2307.9617.385.566.730.0212.170.04
Band3202.2717.015.694.910.1015.740.08
Band4105.7621.355.494.490.0414.030.14
PCABand1241.8813.935.135.080.0411.700.05
Band2314.9419.255.856.730.0116.010.05
Band3207.9017.435.795.140.0115.740.08
Band4118.1622.765.956.900.0622.700.23
Table 8. The results of quantitative evaluations.
Aquaculture TypeQuantitative Evaluation MethodGF-1GF-2WV-2
Enclosure seine cultureSeven statistic indexesGSPCAPCA
CQmaxPCANNDiffuseNNDiffuse
Floating raft culture areaSeven statistic indexesNNDiffuseNNDiffusePCA
CQmaxNNDiffuseNNDiffusePCA
Publisher’s Note: MDPI stays neutral with regard to jurisdictional claims in published maps and institutional affiliations.

