Article

Seismic Response Analysis of High-Voltage Bushings and Down Lead Transmission Line Systems in Substations

School of Civil Engineering, Zheng Zhou University, Zhengzhou 450001, China
*
Author to whom correspondence should be addressed.
Appl. Sci. 2022, 12(3), 1118; https://doi.org/10.3390/app12031118
Submission received: 23 December 2021 / Revised: 15 January 2022 / Accepted: 16 January 2022 / Published: 21 January 2022
(This article belongs to the Special Issue New Achievements in Structural Dynamics Analysis)

Abstract

:
Based on an actual ultra-high voltage (UHV) substation, a finite element (FE) model for a high-voltage (HV) bushing, arrester, and down lead transmission line (DLTL) system was built using ANSYS software. The dynamic responses of the system under different seismic intensities were analyzed and compared with those of the corresponding single bushing and arrester. On this basis, the coupling vibration influence of the upper DLTL on the responses of the HV bushing and arrester is discussed. The results indicate that the DLTL adversely affects the responses of the HV bushing and arrester under seismic loading. As the seismic intensity increases, the structural displacements at the top of the HV bushing and arrester increase, accompanied by a reduction in the geometric length redundancy of the DLTL, resulting in a mutual pulling effect between the HV bushing and the arrester and the quick amplification of their respective dynamic responses in a nonlinear form. Under the action of an earthquake with a peak ground acceleration (PGA) of 0.4 g, the maximum stresses at the roots of the HV bushing and the arrester in the system separately increase by approximately 13.02% and 7.80% compared to the corresponding single HV bushing and the arrester. Overall, a geometric length redundancy of at least 200 mm in the DLTL in engineering design is recommended.

1. Introduction

Electric power systems involve all aspects of people’s lives and are the main energy supply system in modern society [
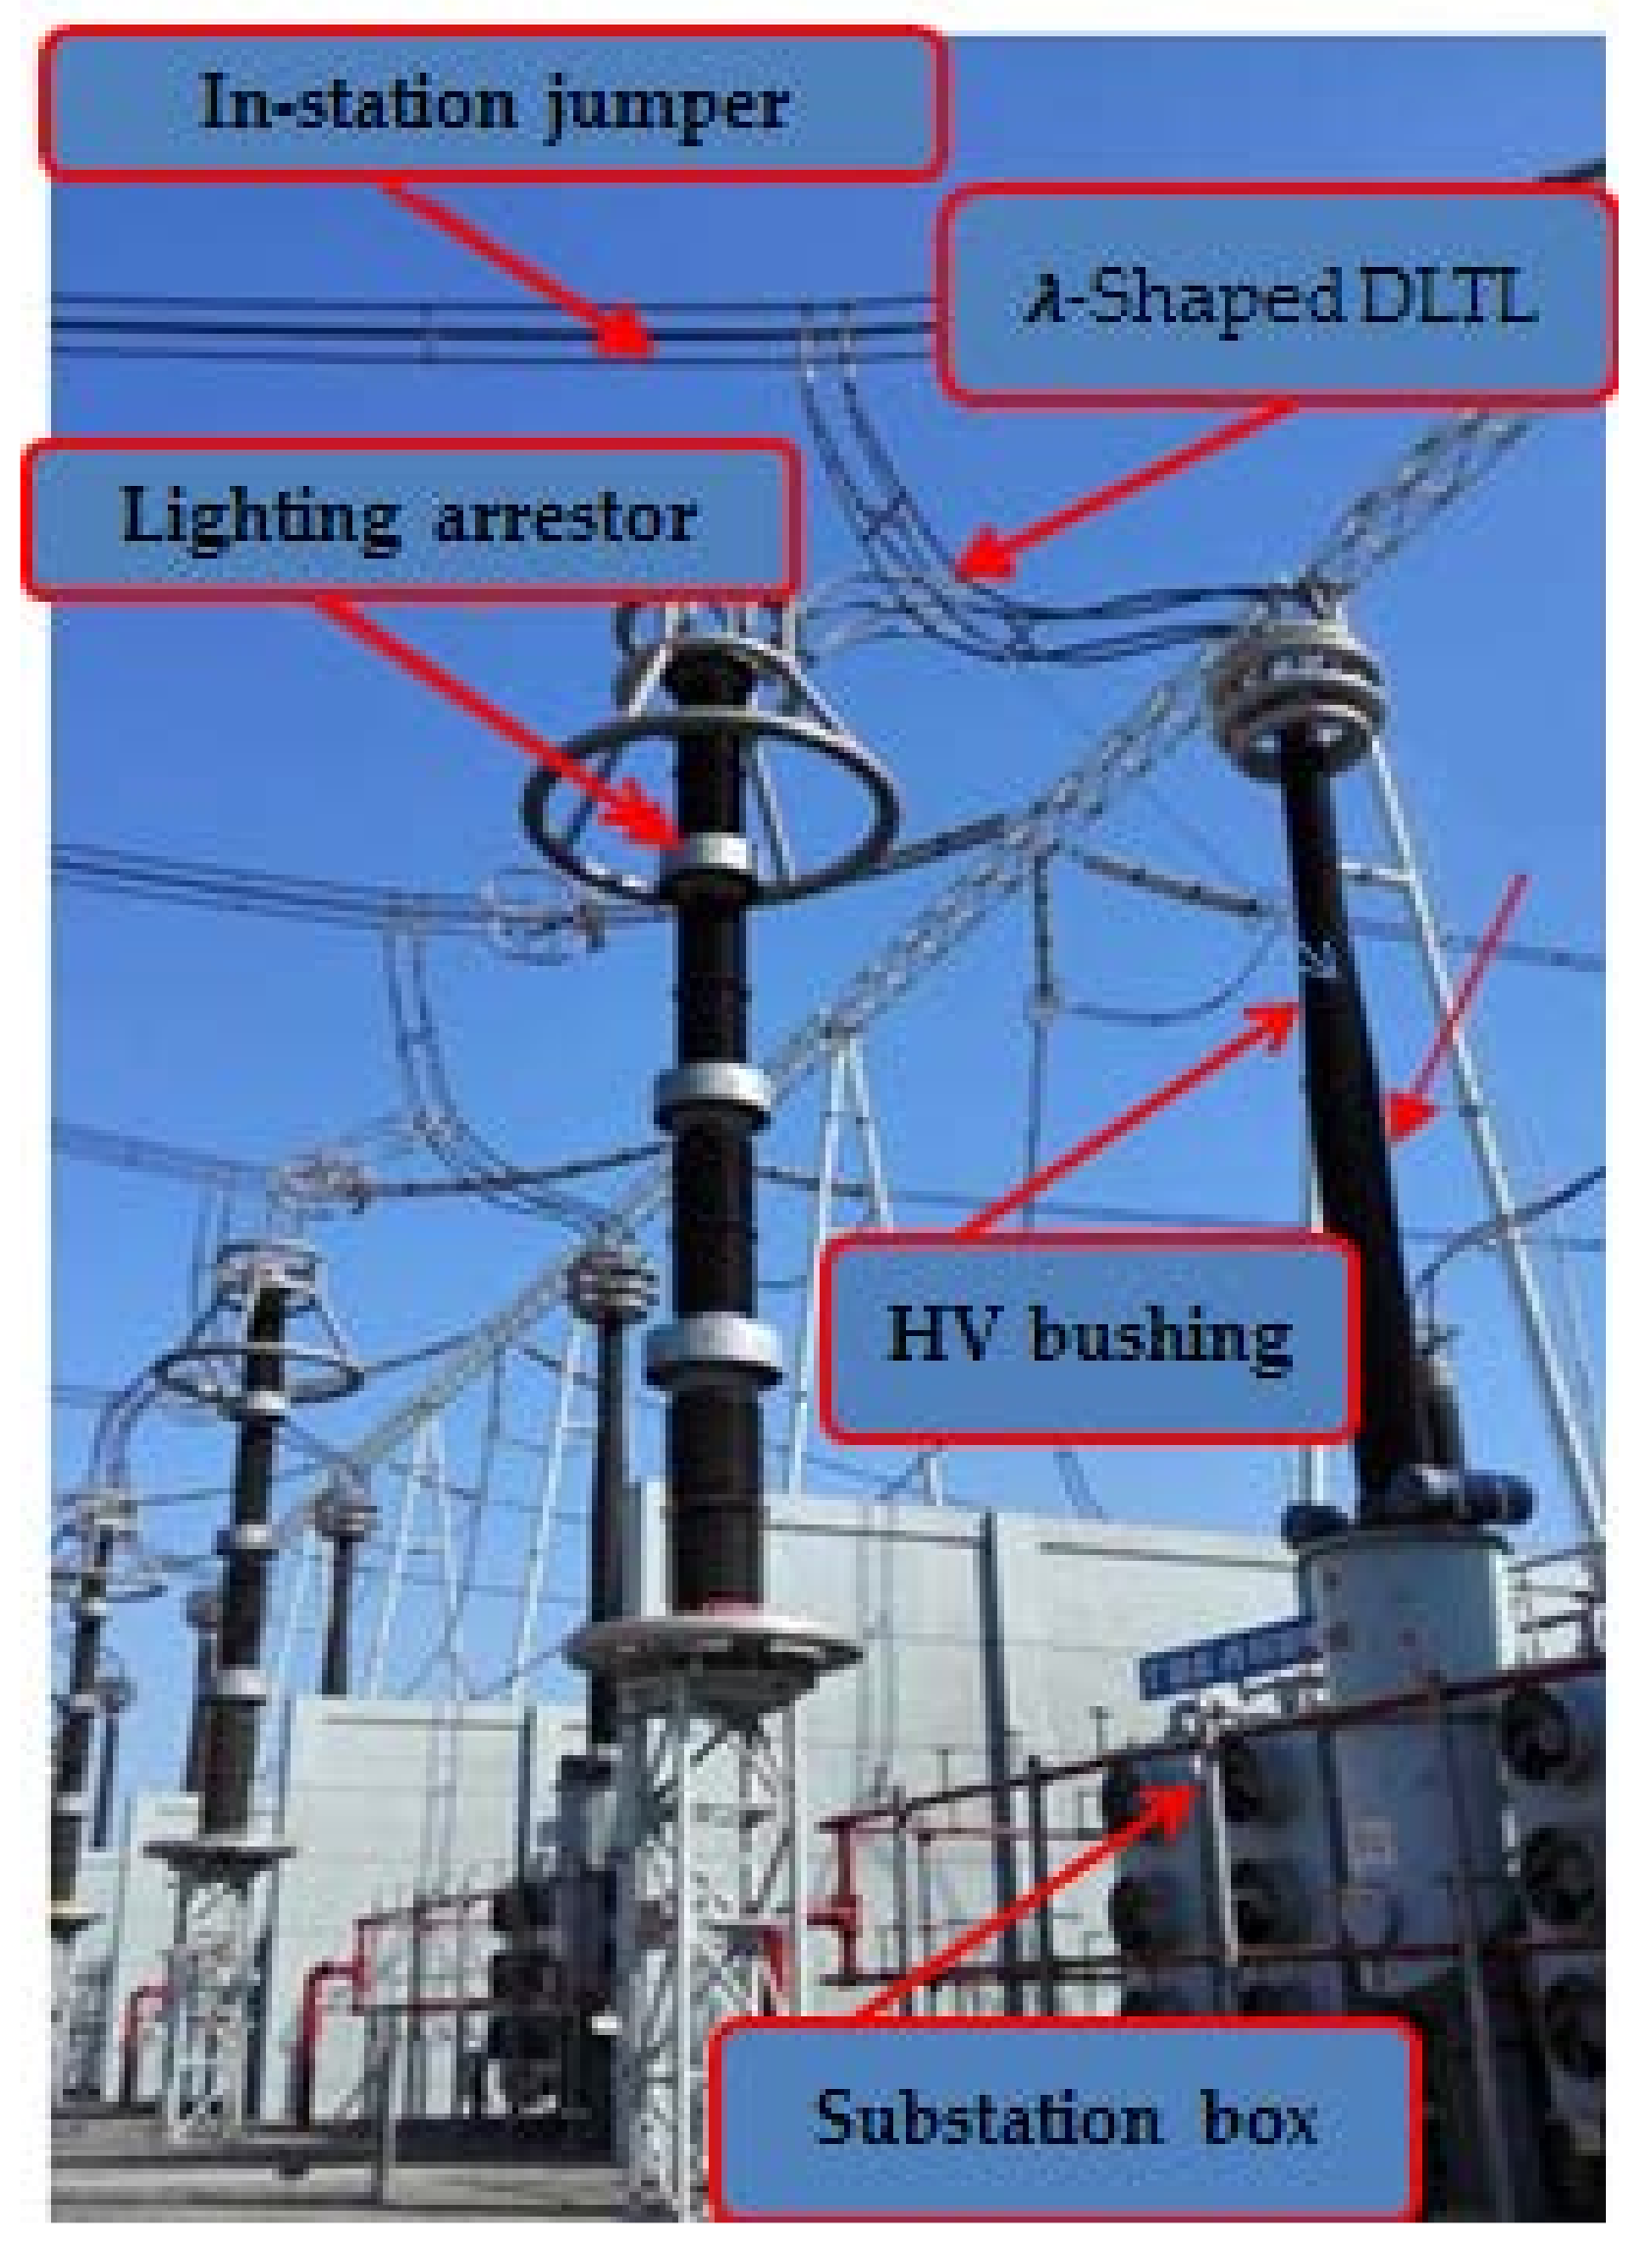
1]. Once a power system is damaged, it has a major impact on daily life and productivity and it even endangers the national economy and social security. In electric power systems, a substation is a part of an electrical transmission and distribution system that can transform (raise or lower) voltage and perform other important functions. A typical substation structure system includes transformers, bushings, lightning arresters, switches, circuit breakers, and other devices that may be interconnected by air-insulated bare conductors strung on support structures. Among them, a high-voltage (HV) bushing is an outlet device that guides the lead lines of the high-voltage and low-voltage windings in a transformer to the outside of the fuel tank, and a line entrance surge arrestor protects substation equipment. In substations, HV bushings and lightning arrestors are often connected to in-station jumpers by “λ”-shaped down lead transmission lines (DLTLs) (Figure 1). HV bushings and lightning arresters not only insulate DLTLs against the ground but also immobilize them, so the working performance of HV bushings and arrestors directly affects the long-term reliable operation of the whole transformer substation system.
In practical engineering, HV bushings, lightning arrestors, and the other electric devices mentioned above feature relatively heavy, high, and large structures and are mostly made of brittle ceramics, which are easily damaged under the action of earthquakes [2]. In recent years, damage to substation facilities caused by earthquakes has occurred from time to time [3]. In 2007, the Niigata earthquake in Japan caused a transformer to catch fire and affected the operation of the nuclear power plant nearby. In 2008, a large amount of porcelain switchgear equipment was damaged in the Wen Chu earthquake [4]. In 2010, earthquakes in Mexico and New Zealand caused serious damage to electrical equipment such as broken insulators. In 2011, the Tohoku earthquake caused a total of 621 electrical equipment damage events [5,6]. On 20 April 2013, a 7.0-magnitude earthquake occurred in Lu Shan County, Ya’an City, Sichuan Province, China and caused serious losses, including damage to a total of 626 substations. It was necessary to shut down 34 substations of 35 kV and above [7]. On 15 November 2019, an earthquake of magnitude 5.2 occurred in Jing xi City, Guangxi Province, China, which caused displacements between the porcelain jacket and flange of a main transformer HV bushing [8]. Oil seepage occurred at the neutral point of the high- and medium-voltage sides of the bushings [9]. Therefore, earthquake-induced failure of HV electrical equipment has become a common issue around the world.
Researchers in China and other countries have performed experimental research and theoretical analyses regarding the dynamic response of HV electrical devices under seismic loading. Gilani et al. [10] conducted static and seismic simulator tests on two 230 kV, U-shaped transformer bushings to evaluate the seismic performance of the bushings. The Pacific Earthquake Engineering Research (PEER) Center, headquartered at the University of California, Berkeley, evaluated the standard industry procedures for seismic identification of substation equipment based on seismic simulator analysis and triaxial tests and gave some suggestions on the suitability of in-service HV transformer bushings. Wilcoski et al. proposed a Construction Engineering Research Laboratory (CERL) equipment fragility and protection program, CERL Equipment Fragility and Protection Procedure (CEFAPP), for large-scale power transformer bushing tests. Ersoy et al. simulated the interactions between transformers and bushing structures in detail using the finite element (FE) method and noted the problems warranting attention in practical engineering applications. Bellorini et al. conducted on-site dynamic tests and a numerical FE analysis on a 160 MVA 230/135 kV power transformer, evaluated the coefficients (K and R) defined by IEC 61463 and calculated the natural frequency and seismic response of the entire transformer under different seismic loads. Whittaker et al. experimentally studied the seismic performance of 196, 230, and 550 kV porcelain transformer bushings and noted the difference between the good performance of HV bushings in the laboratory and the poor performance of outdoor bushings in service. Filiatrault et al. [11] conducted a study on four transformer bushing models through a shaking table experiment and an FE simulation and noted that HV bushings installed on transformer cover plates were more susceptible to seismic loads than those installed on a rigid foundation. This conclusion is consistent with the conjectures and research results of many other scholars. Wang et al. [12] used a shaking table and a group of artificial seismic waves to experimentally study a certain model of a 1100 kV ultra-high voltage (UHV) gas-insulated switchgear porcelain bushing based and obtained the acceleration, displacement, and strain responses of key parts of the porcelain bushing. Sun et al. [13] conducted a shaking table test on a 1100 kV UHV bushing and obtained the acceleration and stress responses at the most unfavorable position of the casing. Li et al. [14,15] studied the seismic response of surge arresters by considering the influence of the interaction of 220, 500, 750, and 1000 kV ceramic surge arresters with steel supporting structures. Jean-Bernard et al. [16] proposed a simple and practical method for estimating the expected displacement of the interconnection points of substation equipment under earthquake action. Ghalibafian H et al. [17] experimentally studied the dynamic characteristics of flexible conductors and the interactions between conductors and interconnection equipment using the shaking table test. Ma et al. [18] clarified the importance of dynamic interactions between high-voltage bushings, turrets, and power transformer tanks through numerical simulations.
These studies are of great importance for the seismic analysis and optimal design of HV substation structures. However, the existing research has mostly focused separately on the dynamic characteristics or seismic responses of HV bushings, HV bushing-transformer systems, and other devices, which means that those studies do not consider the adverse impacts of coupling vibrations on HV bushings and lightning arresters in whole systems under seismic loadings. Therefore, even when HV bushings, arresters and other substation devices meet standards for design and manufacturing, their mechanical characteristics and fatigue properties may not tolerate actual complex stress states in engineering practice. However, due to the limits of laboratory test conditions and the structural complexity of the actual HV bushings, arresters, and DLTL-connection systems, the current shaking table test studies of the interactions between flexible conductors and interconnection substation equipment are based on some simple test models that are quite different from actual structures. To date, there have been very few studies on the specific characteristics and influence of the coupled vibration responses of HV bushings, lightning arresters, and DLTL (HVB-LA-DLTL) systems.
To address the topics discussed above, this study takes a 1000 kV UHV substation in Central China as an engineering example and uses ANSYS software to build an FE model of the HVB-LA-DLTL system. The time–history responses of the system under different seismic intensities are analyzed based on two groups of actual seismic records and one set of artificial earthquake waves. The results for the HVB-LA-DLTL system are compared with those for the corresponding single bushing and arrester under seismic loads. On this basis, the influence of the coupling vibration of the upper DLTL on HV bushing and lightning arrester is discussed. The purpose of this study is to provide technical support for the optimal design, maintenance, and strengthening of HVB-LA-DLTL systems in UHV substations.
Targeting the shortcomings of the abovementioned research status, this paper mainly studies the bearing performance of a certain high-voltage casing lead structure system under earthquake action. Previously, relevant research was conducted on a high-voltage casing system under wind loads on the basis of the actual engineering of a 1000 kV UHV substation in Central China. This article continues to use the same engineering background from the literature [19], selects El Centro waves, Taft waves, and artificial standard time–history waves from the PEER database, applies X, Z one-way and three-way input. The acceleration response, displacement response, and stress response of the key parts of the high-voltage casing system under the action of three different peaks of 0.07, 0.2, and 0.4 g, are used to determine the safety factor and compare the safety factor with the seismic design code for power facilities GB50260 required in 2013.

2. Establishment and Verification of an FE Model for HVB-LA-DLTL Systems

2.1. Engineering Background

Taking an actual project related to the evaluation of a 1000 kV UHV substation in Central China as a background, a complete structural analysis model including HV bushings, lightning arresters, upper jumpers, down lead transmission lines and connection fittings is established. The high-voltage bushing lead structure system of the substation is composed of the upper station jumper, down lead, connecting clamp, connection fittings, high-voltage bushing terminal, high-voltage bushing, and lightning arrester. The lower ends of the high-voltage bushing and lightning arrester are connected to the transformer and the lightning arrester, respectively. Figure 1 shows a schematic diagram of the substation.
Modern engineering already depends on numerical modeling. Among the various methods of numerical modeling that can be used in modern engineering, the most common is the FE method due to its universal nature and the relatively simple preparation of models [20]. Numerical modeling methods can directly calculate the acceleration, displacement, and stress response of a structure under continuous dynamic loading, and can also effectively simulate crack growth under dynamic loading conditions in continuous media in the field of computational fracture mechanics (CFM) [21]. In this paper, ANSYS FE software was used to establish an FE model of the high-voltage casing lead structure system. The overall size of the model is determined according to the original design drawings of a certain substation, and 1:1 scaling is conducted for solid modeling. The jumper and the down conductor in the station are 4-split conductors, and the single conductor is an expanded, heat-resistant aluminum alloy conductor of model JLHN58K1600, and linear density is 4475 kg/m3. According to the principle of equivalent effect and moment of inertia, the conductor is simplified as equivalent to a round pipe section with an inner diameter of 50 mm and an outer diameter of 70 mm, as shown in Figure 2.
The mass of the high-voltage bushing is approximately 7135 kg, the length is approximately 13.315 m, and the total weight of the arrester is approximately 9800 kg. It is divided into four sections with a length of approximately 12 m. The detailed dimensions are shown in Figure 3.
The JLHN58K-1600 expanded-diameter wire used in the high-voltage casing lead system has greater rigidity than ordinary wires. To accurately simulate the forces applied by terminals and other components in the structural system, Solid186 solid elements are used in the modeling in this paper. The transformer box is modeled with a shell unit of appropriate thickness. For complex structures such as bushings and arresters, the influence of sheds on the structure is ignored and auxiliary structures such as pressure-equalizing rings are attached as concentrated masses to the structure. The component grid and overall model are shown in Figure 4 and Figure 5, and the material properties and element types of each component are shown in Table 1.

2.2. Verification of the FE Modeling

Because the high-voltage casing lead structure system studied in this paper is complex, there is a lack of reliable test results to verify the correctness of the model; thus, results from the literature [19] are chosen as the basis for validating this work. For an accurate comparison with the existing loading method, the same loading method is chosen to compare the stress values at the same location and the results are shown in Table 2. The area where the UHV substation is located belongs to Class B terrain, the basic wind pressure (determined by the 100-year recurrence period) is 0.35 kN/m2, and the design wind speed at a height of 10 m above the ground is obtained by a logarithmic law as 25.3 m/s, which corresponds to the equivalent static wind loads at different heights of the “λ”-shaped lead wire model.
According to the above comparison results, the maximum error of 7.98% between the simulation results and the test results of the model in this paper occurs at the high-voltage bushing side wire clamp. The error is caused by the bending and the distortion of the finite element mesh. The remaining stresses are in agreement with the experimental and simulation results from the literature, and the model can be considered to have high accuracy, which provides the basis for further analysis.

2.3. Modal Analysis

Modes are the inherent vibration characteristics of a structure and the specific inherent frequency, damping ratio, and modal vibration pattern of each mode can be obtained by calculation or experiment. The vibrator experiment is a common method for structural modal analysis [22]. Building up a database of the real forcing functions applied by a vibrodyne plays a key role when conducting dynamical tests on a composite structure. Modal analysis is the basic method for studying the dynamic properties (vibration pattern, frequency, etc.) of a structure and is also the basis for other dynamic analyses such as time-distance analysis. Through modal analysis, the vibration response of the system can be predicted when it is subjected to an applied dynamic excitation. To further analyze the influence of the force on the performance of the high-voltage casing lead structure system, the ”λ”-shaped lead structure system is used as an example, and the effects of the lower electrical and the specific modal vibration characteristics are shown in Table 3 and Table 4.
According to the modal analysis results above, the natural frequencies of vibration of the HVB-LA-DLTL systems in this paper are lower than those in the literature. The model in the literature [19] contains only the upper span line, lead wire, and connection gold specific system. Given that the upper span line and lead wire are considered fixed ends, the overall stiffness of the system is high. The model in this paper is closer to actual engineering applications. Compared with the literature, [23] shows that HVB-LA-DLTL systems and substation boxes have a large impact on the overall system stiffness. Thus, the overall stiffness of the system decreases, the natural frequencies of vibration become lower, and the dynamic effect of the system under dynamic load is greater, which is consistent with the characteristics of the lead structure system in the actual substation. Due to space limitations, Figure 6 shows the first six orders of the vibration pattern of the model modal analysis in this paper.

3. Seismic Waveform Selection and Working Condition Setting

3.1. Seismic Waveform Selection

The time–history response of the structure is quite different due to the input of various seismic acceleration waveforms. Thus, when designing and selecting the acceleration time–history curve, the influential factors should be comprehensively considered. Therefore, in this paper, strong earthquake records, such as EL Centro waves and Taft waves [24,25], are selected according to the IEEE 693 standard for seismic inspection and verification and a set of artificial seismic waves are used for time–history analysis. The acceleration time–history of the EL Centro waves were recorded at the EL Centro station in the Imperial Valley earthquake (M7.1) in the United States on 18 May 1940. It is a classic seismic record widely used in structural testing and seismic response analysis. The Taft seismic wave was recorded in 1952. The earthquake that occurred in Kern County, California on 21 July 2005 was recorded at Taft Lincoln School. The artificial standard time–history wave was fitted according to the artificial standard response spectrum. Figure 6, Figure 7 and Figure 8 show the time–history curves of the three waves with a peak value of 0.1 g.

3.2. Working Condition Setting

To fully study the response characteristics of the high-voltage casing lead structure system under different peak ground accelerations, this section considers six working conditions of PGA: 0.035, 0.07, 0.1, 0.2, 0.22, and 0.4 g.
Given the complexity of the structural system and an irregular spatial structure system, the analysis in this chapter is carried out with one-way input of seismic waves from the X-direction and Z-direction, and then three-way seismic wave input is performed on the structure, as shown in Figure 9. According to the building anti-seismic design code, when considering the three-way earthquake input, the proportional relationship of the input three-way acceleration peak value is X:Z:Y = 1:0.85:0.65 and the three-way input schematic is shown in Figure 10. Due to the low tensile bearing capacity of the ceramic components of the casing and the arrester, the analysis focused on the stress response of the root of the high-voltage casing while taking into account the acceleration and displacement response of the casing and the top of the arrester. To facilitate comparison, this chapter defines the ratio of casing and arrester top acceleration to ground PGA as the acceleration amplification factor [26], and defines the ratio of high-voltage casing ceramic material strength (45 MPa) to casing root stress as a safety factor. The code for seismic design of power facilities GB50260-2013 requires that the safety factor during seismic design should be greater than 1.67.

4. Response Analysis of a High-Voltage Casing Lead Structure System under Different Seismic Acceleration Peaks

4.1. Vibration Response Analysis of the Lead System under Different PGAs

4.1.1. Analysis of the Top Displacement of the Lead System

Figure 11 and Figure 12 are diagrams showing the variation in the maximum displacement of the top of the high-voltage casing side and the arrester side with the peak seismic acceleration in the high-voltage casing lead system. According to Figure 11 and Figure 12, the maximum top displacement of the high-voltage bushing side and the arrester side under different PGAs both increase with increasing PGA. The lead system has different responses to various input directions of seismic waves. For seismic waves input from the X- and Z-directions, the top displacement of the structure is considerably larger than the Y-direction displacement response when the seismic waves are input in three directions. The displacement response of X-direction is slightly larger than the displacement response of Y-direction and Z-direction when seismic waves are input in three directions. Under the action of the same PGA but different types of seismic waves, the displacement response of the structure is largest for the EL wave, followed by the artificial wave, and the Taft wave has the smallest influence.

4.1.2. Top Acceleration Analysis of Lead System

Figure 13 and Figure 14 are diagrams showing the variation in the maximum acceleration at the top and the arrester side, respectively, of the high-voltage casing lead system with the peak value of seismic acceleration. The maximum top accelerations of the high-voltage casing side and the arrester side under different PGAs all increase with increasing PGA. The overall top acceleration of the structure varies with PGA, seismic wave input mode, and seismic wave type.

4.1.3. The Root Stress Analysis of the Lead System

Figure 15 and Figure 16 show the variation in the root stress of the high-voltage bushing side and arrester side with the peak value of seismic acceleration in the high-voltage bushing lead system. The results show that the response relationships for the root stress of the high-voltage bushing side and arrester side under different PGAs, seismic wave input directions, and seismic wave types are consistent with the former two. The response of the structure under the three-way seismic wave input is larger than that under the one-way seismic wave input. From Figure 11, Figure 12, Figure 13, Figure 14, Figure 15 and Figure 16, when the system is in a specific condition, the vibration response of the high-voltage bushing side is smaller than that of the arrester, which is mainly because the lower bracket of the arrester is less stiff than that of the bottom of the bushing.

4.1.4. Safety Factor Analysis of Lead System

Figure 17 and Figure 18 are regular diagrams of the safety factors of the high-voltage casing side and the arrester side in the high-voltage casing lead system in the peak value of seismic acceleration. The safety factor is the ratio of the material strength (45 MPa) of the high-pressure casing ceramic specified in GB50260-2013 to the stress at the root of the casing. The safety factor should be greater than 1.67 during seismic design. It can be seen from Figure 17 and Figure 18 that only when the PGA of the structure is 0.4 g, the safety factors of the casing and the arrester are both less than 1.67 and the rest are consistent with the requirements of GB50260-2013.

5. The Influence of the down Conductor on the Lower Electrical Equipment

The high-voltage bushing and the arrester are connected by down conductors. Under the action of strong earthquakes, the soft bus bars may be connected to pull, push, and pull to generate dynamic interactions [17]. As the voltage level increases, the size of the related electrical equipment increases. The flexible bus bars used to connect UHV electrical equipment often have larger diameters and are smaller in pitch, so these kinds of flexible bus bars can resist bending and compression. During an earthquake, they may have a great impact on the seismic performance of the equipment. This section separately extracts models of high-voltage bushings and arresters and conducts a dynamic analysis on them under seismic loads to understand the impact of down conductors on the seismic performance of the lower electrical equipment. According to the analysis in the previous section, the structure is in its most unfavorable state when it undergoes three-way seismic action. Therefore, this section uses three-way input when studying the influence of the upper down conductor on the lower arrester and high-voltage casing. The selection of seismic waves and amplitude modulation are the same as those in the previous section. Figure 19 is the finite element model diagram of the lower electrical equipment monomer model.

5.1. Mechanical Properties of a Soft Bus

5.1.1. Soft Bus Bars with Different Slack

The slackness k is defined as the ratio of the length s of the generatrix to the length p in the chord direction. Previous Studies [27] have shown that the slopes of the internal force curves of soft buses with different relaxation ratios (Figure 20) are almost all close to 0 at the initial stage. However, the inflection point of the internal force curve is very different for various relaxation ratios. The larger the relaxation ratio is, the later the inflection point of the internal force curve appears. After the inflection point appears, the slopes of the internal force curves of the soft bus bars with different relaxation degrees are very similar (as shown in Figure 21). Therefore, the greater the degree of slack, the more the position of the inflection point can be delayed to prevent insufficient bus redundancy due to the relative displacement between the equipment under the action of the earthquake, and then they can pull each other to amplify their respective dynamic responses. However, when the inflection point appears, the difference in the growth rate of the internal force of the soft bus with different slack is not large.

5.1.2. Flexible Bus Bars with Different Connection Forms

EEE 1527 proposes four types of soft bus connections: reverse parabolic connection C1, hyperbolic connection C2, overhanging connection C3, and three-curve connection C4. Different flexible bus connection forms have their own characteristics. The C1-type connection is more suitable for connecting equipment with a large relative displacement; however, because it is easily affected by external loads such as icing during use and becomes unstable and deforms into a C3-type connection, it is not suitable for a large connection span. The C2 connection is very suitable for the situation where one end connection must be horizontal. This type of connection is not affected by the span but may have a large overhang, which affects the safety clearance. The C3 connection is the simplest form of the four methods, and the disadvantage is also obvious; that is, it does not easily meet the requirement for a safe clear distance between the equipment and the bus bar, and the bus bar and the ground. The safety clearance problem is easier to meet with the C4-type connection, and the slack is greater than that of the C3-type connection when the drape is the same.
Studies [27] have shown that when the degree of relaxation is the same for the four types of soft bus bars, then the end force of the C4 connection increases the fastest, while the end force of the C3 connection increases the slowest.

5.1.3. Analysis of the Response of a High-Voltage Casing and a Single Structure Lightning Arrester under Different Seismic Peak Accelerations

To study the influence of down conductors on lower electrical equipment, seismic wave input is now performed on the high-voltage bushing and the single structure of the arrester. According to the previous chapter, the vertical vibration response of the lead system is very small compared to other directions regardless of the working condition of the lead system, and the vibration response of the structure is slightly larger when the seismic wave is input from three directions rather than one direction. Considering that the main purpose of this chapter is to study the influence of down conductors on the system, the vertical input is ignored when the seismic wave input is performed for the high-voltage bushing and arrester unit, only three-way input is used, and the vibration response of the unit is the same as the PGA. The following lead systems are compared (as shown in Table 5 and Table 6).
The comparison charts of the stress and the displacement amplification ratio of the high-voltage bushing and the lightning arrester are shown in Figure 22 and Figure 23. When the PGA is small, the down-lead redundancy is sufficient and it has little impact on the lower electrical equipment. With increasing PGA, the structural displacement increases, the redundancy of the down conductor is insufficient, and the lower high-voltage bushing and the arrester pull against each other, resulting in a rapid increase in the influence of the down conductor on the lower electrical equipment. The influence of down conductors on lower electrical equipment exhibits nonlinear growth. Comparing the stress increase of the high-voltage casing and the arrester shows that although the displacement and stress of the high-voltage casing are smaller than that of the arrester, the power amplification effect of the down conductor on the high-voltage casing is much greater than that of the arrester.

6. Conclusions

HVB-LA-DLTL systems are complex coupling systems. The coupling effect between the HV bushings, lightning arresters, and DLTL under seismic loadings has a great influence on the force applied on the HV bushings and lightning arresters. However, the existing studies do not consider the adverse impacts of coupling vibrations on HV bushings and lightning arresters in whole systems under seismic loadings.
This paper analyzes the bearing performance of a certain high-voltage casing lead structure system and single structure electrical equipment under seismic loads. El Centro waves, Taft waves, and artificial standard time–history waves were selected for one-way and three-way input tests. The PGA is obtained from the response of the structure under six working conditions: 0.035, 0.1, 0.22, 0.07, 0.2, and 0.4 g. The following conclusions are drawn regarding the load-bearing performance:
(1) Under the action of earthquake loading, the down conductor of the upper part of the structural system has a very strong adverse effect on the lower electrical equipment. As the seismic intensity increases, the structural displacement increases, and a lack of redundancy of the down conductor causes the high-voltage casing and the arrester to pull against each other and quickly amplifies their respective dynamic responses in a nonlinear form;
(2) The down conductor has a greater impact on the high-voltage casing than on the arrester. When the structure is under the influence of the PGA = 0.4 g earthquake, the maximum stress at the root of the high-voltage casing in the system increases by approximately 13.02% compared to that of the single body. The maximum stress at the root of the arrester increases by approximately 7.80%. The down line has a considerably greater effect on the magnification of the structure in the X-direction than in the Z-direction. Sufficient redundancy during the design of the down conductor is recommended;
(3) When the PGA is 0.4 g, the safety factor of the root stress of the high-voltage casing under horizontal input is less than the 1.67 specification required by the standard GB50260-2013. According to the particular features of the high-voltage casing lead system and local seismic fortification requirements, the adoption of appropriate dampers and other shock-absorbing equipment are recommended;
(4) In response to the application of one-way and three-way seismic inputs in the X- and Z-directions, the most vulnerable location in the structure under earthquake action is at the root of the high-pressure casing. Comparing the three-way and the one-way inputs shows that the response of the structure greatly increases under three-way input, and the structure deforms substantially. In the design process, three-way and one-way inputs should be calculated separately for envelope design.

Author Contributions

Conceptualization, M.Z. and G.Z.; methodology, M.Z. and R.W.; software, M.Z. and G.Z.; validation, R.W., Y.D. and G.Z.; formal analysis, R.W. and Y.D.; investigation, R.W. and Y.D.; resources, M.Z. and G.Z.; data curation, R.W.; writing—original draft preparation, M.Z. and R.W.; writing—review and editing, Y.D. and G.Z. All authors have read and agreed to the published version of the manuscript.

Funding

This research was funded by the National Natural Science Foundation of China (Grant no. 51578512) and the Cultivating Fund Project for Young Teachers of Zhengzhou University (Grant no. JC21539028).

Institutional Review Board Statement

Not applicable.

Informed Consent Statement

Not applicable.

Data Availability Statement

Data are contained within this article.

Conflicts of Interest

The authors declare no conflict of interest.

References

  1. Ma, K.; Ye, P.; Li, J.; Han, Y.; Zhang, T. Research on Operating and Control of the UHV Power Grid. Northeast. Electr. Power Technol. 2017, 38, 54–59. [Google Scholar]
  2. Cheng, Y.; Zhu, Z.; Lu, Z.; Liu, Z.; Zhang, S. Research state and development of seismic performance of substation electrical equipment. Build. Struct. 2008, 32, 84–89. [Google Scholar]
  3. Cao, Y.; Deng, H.; Cai, W.; Liu, Y.; Wu, C.; Wu, X. Research Progress in Prevention of Earthquake and Secondary Disasters on Power Facilities. High Volt. Eng. 2019, 45, 1962–1974. [Google Scholar]
  4. Fujisaki, E.; Takhirov, S.; Xie, Q.; Mosalam, K.M. Seismic Vulnerability of Power Supply: Lessons Learned from Recent Earthquakes and Future Horizons of Research. In Proceedings of the 9th international conference on structural dynamics (EURODYN 2014), Porto, Portugal, 30 June–2 July 2014. [Google Scholar]
  5. Goodno, B.J.; Gould, N.C.; Caldwell, P.; Gould, P.L. Effects of the January 2010 Haitian Earthquake on Selected Electrical Equipment. Earthq. Spectra 2011, 27, 251–276. [Google Scholar] [CrossRef]
  6. Eidinger, J.; Kwasinski, A.; Tang, A.; Tudo-Bornarel, C. Performance of Electric Power Systems in the 2010–2011 Christchurch, New Zealand, Earthquake Sequence. Earthq. Spectra 2014, 30, 205–230. [Google Scholar]
  7. Liu, R.; Liu, J.; Yan, D.; Ye, F.; Lin, J.; Li, J. Seismic damage investigation and analysis of electric power system in Lushan Ms 7.0 earthquake. J. Nat. Disasters 2013, 22, 83–90. [Google Scholar]
  8. Chen, L.; Li, D.; Yu, Z.; Zhao, J. Damage Analysis of a Transformer Porcelain High Voltage Bushing in a Low Intensity Earthquake. Guangxi Electr. Power 2020, 43, 53–56. [Google Scholar]
  9. Shi, Y.; Zhou, G. Analysis on 220 KV Transformer Fault Caused by Sealing Failure of Bushing. Sichuan Electr. Power 2021, 5, 87–90. [Google Scholar]
  10. Gilani, A.S.; Whittaker, A.S.; Fenves, G.L. Seismic evaluation and retrofit of 230-kV porcelain transformer bushings. Earthq. Spectra 2001, 17, 597–616. [Google Scholar] [CrossRef]
  11. Filiatrault, A.; Matt, H. Seismic Response of High Voltage Electrical Transformer–Bushing Systems. J. Struct. Eng. 2006, 132, 287–295. [Google Scholar] [CrossRef]
  12. Wang, H.; Cheng, Y.; Sun, Y.; Wang, N.; Zhicheng, L.U.; Qiao, Z. Seismic Performance of Ultra High Voltage Gas Insulated Switchgear Porcelain Bushing. China Earthq. Eng. J. 2018, 40, 406–412. [Google Scholar]
  13. Sun, Y.; Zhicheng, L.U.; Liu, Z.; Lin, S.; Wang, X.; Zhong, M. Earthquake Simulation Shaking Table Test for 1100 kV UHV Bushing. High Volt. Eng. 2017, 43, 4139–4144. [Google Scholar]
  14. Li, S.; Tsang, H.H.; Cheng, Y.; Lu, Z. Considering seismic interaction effects in designing steel supporting structure for surge arrester. J. Constr. Steel Res. 2017, 132, 151–163. [Google Scholar] [CrossRef]
  15. Cheng, Y.; Li, S.; Lu, Z.; Liu, Z.; Zhu, Z. Seismic risk mitigation of cylindrical electrical equipment with a novel isolation device. Soil Dyn. Earthq. Eng. 2018, 111, 41–52. [Google Scholar] [CrossRef]
  16. Dastous, J.B.; Filiatrault, A.; Pierre, J.R. Estimation of Displacement at Interconnection Points of Substation Equipment Subjected to Earthquakes. IEEE Trans. Power Deliv. 2004, 19, 618–628. [Google Scholar] [CrossRef]
  17. Ghalibafian, H.; Bhuyan, G.S.; Ventura, C.; Rainer, J.H.; Borthwick, D.; Stewart, R.P.; Zhai, E. Seismic behavior of flexible conductors connecting substation equipment-part II: Shake table tests. IEEE Trans. Power Deliv. 2004, 19, 1680–1687. [Google Scholar] [CrossRef]
  18. Ma, G.; Xie, Q.; Zhuo, R.; Luo, B.; Luo, Y.; Fu, M. Dynamic Interaction of High-Voltage Power Transformer Bushings, Turrets, and Tanks. Earthq. Spectra 2018, 44, 3966–3972. [Google Scholar] [CrossRef]
  19. Zhang, M.; Shang, R.; Lu, Z.; Zhang, X.; Xie, K.; Zhang, B. Analysis of wind-induced response of down lead transmission line-connection fitting systems in ultrahigh-voltage substations. Eng. Struct. 2020, 206, 110144. [Google Scholar] [CrossRef]
  20. Krawczuk, M.; Palacz, M. Special Issue “Applications of Finite Element Modeling for Mechanical and Mechatronic Systems”. Appl. Sci. 2021, 11, 5170. [Google Scholar] [CrossRef]
  21. Fabbrocino, F.; Farina, I.; Modano, M. Loading noise effects on the system identification of composite structures by dynamic tests with vibrodyne. Compos. Part B Eng. 2017, 115, 376–383. [Google Scholar] [CrossRef]
  22. Fabbrocino, F.; Funari, M.F.; Greco, F.; Lonetti, P.; Luciano, R.; Penna, R. Dynamic crack growth based on moving mesh method. Compos. Part B Eng. 2019, 174, 107053. [Google Scholar] [CrossRef]
  23. Shang, R. Study on the Bearing Capacity of Down Lead Transmission Line-Connection Fitting and Bushing Systems under Dynamic Loads in Ultrahigh-Voltage Substations; Zhengzhou University: Zheng Zhou, China, 2020. [Google Scholar]
  24. Cao, M.G.; Zhou, F.L.; Tan, P.; Fan, R.Q.; Lu, Z.C.; Zhang, X.S. Shaking table test on seismic performance of large power transformer with bushings. J. Vib. Shock. 2011, 30, 122–129. [Google Scholar]
  25. Xie, Q.; Wang, Y. Shake-table Test on Earthquake Simulation of Substation Equipment Interconnected by Flexible Bus. Proc. Chin. Soc. Electr. Eng. 2011, 31, 112–118. [Google Scholar]
  26. Villaverde, R.; Pardoen, G.C.; Carnalla, S. Ground motion amplification at flange level of bushings mounted on electric substation transformers. Earthq. Eng. Struct. D 2001, 30, 621–632. [Google Scholar] [CrossRef]
  27. Bai, W.; Dai, J.; Ning, X.; Zhou, H.; Yang, Y. Study on Required Flexible Conductor Slack of Connecting High-voltage Electrical Equipment Under Earthquakes. Proc. CSEE 2018, 38, 10. [Google Scholar]
Figure 1. HV bushings, lightning arrestors, and DLLs in a certain HV substation.
Applsci 12 01118 g001
Figure 2. Schematic diagram of the equivalent simplified cross-section of a DLTL.
Applsci 12 01118 g002
Figure 3. Structural dimensions of casing and arrester.
Applsci 12 01118 g003
Figure 4. Finite element model of some components of the HV bushing lead structure system.
Applsci 12 01118 g004
Figure 5. Finite element model diagram of the structure system of the HV bushing lead.
Applsci 12 01118 g005
Figure 6. The first six modes of the structure.
Applsci 12 01118 g006
Figure 7. Time–history of EL Centro wave acceleration.
Applsci 12 01118 g007
Figure 8. Time–history of Taft wave acceleration.
Applsci 12 01118 g008
Figure 9. Time–history diagram of artificial wave acceleration.
Applsci 12 01118 g009
Figure 10. Three-way input schematic.
Applsci 12 01118 g010
Figure 11. Top displacement on the side of the high-voltage casing.
Applsci 12 01118 g011
Figure 12. Top displacement on the side of the arrester.
Applsci 12 01118 g012aApplsci 12 01118 g012b
Figure 13. Top acceleration on the side of the high-voltage bushing.
Applsci 12 01118 g013
Figure 14. Top acceleration on the side of the arrester.
Applsci 12 01118 g014
Figure 15. The stress on the side root of the high-voltage bushing.
Applsci 12 01118 g015
Figure 16. Root stress of arrester side.
Applsci 12 01118 g016
Figure 17. Safety factor on the side of the high-voltage bushing.
Applsci 12 01118 g017
Figure 18. Safety factor on the side of the arrester.
Applsci 12 01118 g018
Figure 19. A single model of lower electrical equipment.
Applsci 12 01118 g019
Figure 20. Soft bus model with different relaxation ratios.
Applsci 12 01118 g020
Figure 21. Flexible bus bars of different connection forms.
Applsci 12 01118 g021
Figure 22. Stress amplification under different seismic waves.
Applsci 12 01118 g022
Figure 23. Displacement amplification under different seismic waves.
Applsci 12 01118 g023
Table 1. Properties of the components of the finite element model.
Part NameMaterialElastic Modulus (GPa)Poisson’s RatioElement TypeMesh Density (mm)
Down Conductor SystemAluminum500.33Solid18650
Clamps on High-Voltage BushingAluminum700.33Solid18610
Terminal Board on High-Voltage BushingBrass1100.32Solid18610
Connecting Terminal on High-Voltage BushingRed Copper116 (104)0.34Solid1865
Clamps on Lightning ArresterAluminum700.33Solid18610
Bolt/Steel BarsStainless Steel2050.3Beam188-
SpacerAluminum700.33Solid18620
High-Voltage BushingCeramics (composites)1100.3Solid18620
Lightning ArresterCeramics (composites)1100.3Solid18620
Transformer TankQ235 steel2000.3Shell181100
Arrester SupportQ235 steel2000.3Solid18640
Table 2. Comparison of finite element model node stresses with results from the literature.
ComponentFE Simulation Results (MPa)Reference [19] FE Simulation Result (MPa)Reference [19] Result (MPa)Relative Difference
Clamps on the bushing side12.8813.6813.20−6.21%−2.42%
Terminal board on the bushing side39.6236.7142.687.34%−7.7%
Terminal board on the lightning arrestor21.0622.74−21.53−7.98%−2.23%
Table 3. Comparison of natural frequencies of vibration and characteristics of the first 6 modes.
ModeThe Natural Frequency of Vibration (Hz)Characteristics of the Mode of Vibration
Reference [23] ResultReference [19] ResultReference [23] ResultReference [19] Result
11.08771.7885The HV bushing bends along the negative Z-axisThe upper jumper bends along the positive Z-axis
21.22272.7206The HV bushing bends along the positive Z-axisThe lower “λ”-shaped structure bends along the positive Z-axis
31.77113.8658The upper jumper bends along the negative Z-axisThe upper jumper twists along the Z-axis
42.07763.8845The arrester bends along Z positive axisThe upper jumper twists along the Y-axis the lower “λ”-shaped structure twists along the Z-axis
52.25644.1287The arrester bends along Z negative axisThe upper jumper twists along Y-axis the lower “λ”-shaped structure bends along the X-axis
62.73314.1368The lower” λ”-shaped bends along the Z-axisThe lower “λ”-shaped structure twists along the Y-axis
Table 4. Natural frequencies of vibration and characteristics of the first 6 modes of the FE model for the HVB-LA-DLTL systems.
ModeThe Natural Frequency of Vibration (Hz)Characteristics of the Mode of Vibration
11.2827The upper jumper bends along the negative Z-axis
21.4931The arrester bends along X positive axis
31.5538The arrester bends along Z negative axis
41.8996The upper jumper twists along the X-axis
52.4006The HV bushing bends along the positive X-axis
62.4715The HV bushing bends along the positive Z-axis
Table 5. Comparison of the seismic dynamic response of the single high-voltage casing and the overall model.
PGAX-Direction Displacement Increase the PercentageZ-Direction Displacement Increase the PercentageStress Increase Percentage
EL wave0.035 g0.380.150.20
0.1 g1.630.810.86
0.22 g5.382.622.81
0.07 g0.900.450.48
0.2 g4.462.252.35
0.4 g28.138.1113.02
Taft wave0.035 g0.350.130.18
0.1 g1.410.410.42
0.22 g4.762.452.52
0.07 g0.790.750.76
0.2 g3.922.052.08
0.4 g24.037.5311.11
Artificial wave0.035 g0.370.150.19
0.1 g1.480.790.80
0.22 g5.022.512.63
0.07 g0.880.440.46
0.2 g4.122.152.20
0.4 g27.167.5312.49
Table 6. Comparison of the seismic dynamic response of a single arrester and the overall model.
PGAX-Direction Displacement Increase the PercentageZ-Direction Displacement Increase the PercentageStress Increase Percentage
EL wave0.035 g0.300.110.15
0.1 g1.030.720.60
0.22 g3.382.512.00
0.07 g0.650.390.36
0.2 g2.902.151.72
0.4 g15.057.537.80
Taft wave0.035 g0.290.100.14
0.1 g0.940.730.56
0.22 g3.202.341.89
0.07 g0.580.360.32
0.2 g2.731.981.60
0.4 g13.526.386.91
Artificial wave0.035 g0.270.110.13
0.1 g0.980.720.58
0.22 g3.262.471.94
0.07 g0.600.380.34
0.2 g2.822.071.66
0.4 g13.496.957.22
Publisher’s Note: MDPI stays neutral with regard to jurisdictional claims in published maps and institutional affiliations.

