Article

Test and Numerical Simulation of Pressure Pulsation under the Forward and Reverse Working Conditions of a Horizontal Axial Flow Pump

1
School of Aeronautics, Nanjing University of Aeronautics and Astronautics, Nanjing 210016, China
2
School of Energy and Electrical Engineering, Hohai University, Nanjing 210016, China
*
Author to whom correspondence should be addressed.
Appl. Sci. 2022, 12(24), 12956; https://doi.org/10.3390/app122412956
Submission received: 28 October 2022 / Revised: 28 November 2022 / Accepted: 5 December 2022 / Published: 16 December 2022

Abstract

:
In daily operation, the flow state in the runner chamber of an axial flow pump is extremely complex, and the pressure pulsation caused by the vibration of the unit and the hydraulic excitation is also extremely complex. The pressure pulsation will also greatly damage the flow components of the unit. In this paper, a pressure pulsation test and research on an axial flow pump in a pumping station are conducted. The research results indicate that the pressure pulsation at the inlet of the runner and the inlet of the front guide vane are basically consistent with the numerical simulation results under the rated operating conditions, and the external characteristic curves are basically consistent. When running in the forward direction, the pressure pulsation at the inlet of the runner periodically changes, and the main frequency is the rotational frequency. In the reverse operation, the main frequency of the pressure pulsation at the outlet of the runner is the rotational frequency, and the main frequency of the pressure pulsation at the outlet of the movable guide vane is the pilot frequency; the pressure coefficient changes under different flow conditions. The distribution trends are consistent and decrease with the increase in flow rate; the velocity streamlines are evenly distributed near the design flow rate but are sparse and uneven under low flow conditions. Deviation from the design flow rate should be avoided during normal operation of the unit conditions to ensure safe and stable operation.

1. Introduction

Axial flow pumps are widely put into service and distributed worldwide. The superiorities of large flow rate and low head of delivery make them widely put into service in drought prevention and drainage, farmland irrigation, etc. In its normal operation, with the change in flow rate, the stability of the unit must be considered, and the hydraulic excitation existing in the operational process also affects the operation efficiency of the pump. The unique hydraulic excitation of the pump and the resulting pressure pulsations are necessary.
To date, many scholars have devoted themselves to researching related hydraulic machinery such as pumps, turbines, and pump-turbines, and they have achieved significant results. Meng et al. [1] took the centrifugal pump as the research object and used the SST k-w turbulence model for numerical simulation to obtain the flow inside the pump. The research results showed that the asymmetric pressure changes in the flow passage were the main cause of the radial force of the impeller; Li et al. [2] conducted research on unstable phenomena such as rotational stall inside the mixed-flow pump. When the unit stalls, vortices appear inside to block the flow passage, causing unstable pressure. It is believed that the flow conditions are the direct factors that cause such phenomena, and the number of blades, rim clearance, etc., are also important factors. Guo [3] and others studied an effective way to improve the anti-cavitation performance of centrifugal pumps. The three-blade inducer can reduce the cavitation of centrifugal pumps well. Xu et al. [4] designed nine groups of impellers with different blade angles to study the influence of the distribution of the edge angle on the cavitation of the pump. The experiments verified that the change in the blade angle can change the flow of the pump and affect its cavitation performance. The cavitation performance of the pump is closely related to the flow rate at the inlet. Keeping the uniform flow at the inlet can reduce the cavitation well. Yang [5] took an S-shaped axial-flow pump as the research object and adopted three-dimensional numerical simulation method to calculate three different operating conditions to obtain the flow field distribution under the unsteady flow of the pump. At the same time, experiments were used to verify the simulation results. The results show that this method can effectively predict the unsteady flow characteristics in the pump. Song [6] conducted pressure pulsation tests to obtain the real flow situation in axial flow pump by means of tests. The test results show that the presence of bottom vortices affects the flow in the pump and has a huge impact on the pressure pulsation in the impeller, but the influence is small at the outlet of the guide vane, which may be due to the rectifier effect of the guide vane. Zhou Ying et al. [7] carried out different directions from traditional research, explored the distribution law of the internal pressure pulsation of the pump when running in reverse, and obtained the simulation results through the numerical calculation of the full flow channel. Fan [8] the research object is an axial flow pump, in order to study the change in internal flow field and pressure pulsation, they focus on the timing effect of the impeller relative to the flow channel and guide vane, and the study finds that the rotation of the impeller is the main reason for the pressure pulsation change at the impeller, and the pressure pulsation is constantly decreasing as the flow rate increases. wu et al. [9] studied the influence of different guide vane relative distances on the pressure pulsation of the pump device, and determined an optimal working condition by comparing four different guide vane relative distances through numerical simulation. Chen Yujie et al. [10] established a mixed-flow pump model to explore the influence of pressure pulsation changes on flow-induced noise. They carried out unsteady numerical calculation on the mixed-flow pump. On this basis, unsteady pressure pulsation on the blade surface was taken as the sound source, and the indirect boundary element method was used to numerically calculate the external noise caused by the rotating dipole source of the blade. Yao Zhifeng et al. [11] concluded that the flow path spraying technology can effectively improve the anti-wear ability of the flow parts of the pump and reduce hydraulic loss, but its influence on the pressure pulsation characteristics is not clear. Zhou Qin et al. [12] used dynamic grid technology to carry out a three-dimensional numerical simulation of the load rejection transition process of a model pump-turbine and analyzed the pressure pulsation of the turbine and the change characteristics of the runner force and the internal flow mechanism of the evolution. Li Qifei et al. [13] conducted non-steady constant value calculations for four operating points of the pump-turbine operating at low head and obtained four values at the inlet of the volute, the front of the runner after the guide vane, the upstream of the taper tube of the draft tube, and the inner side of the elbow tube. The pressure signal of the monitoring point was compared with the test results, and the pressure pulsation of the pump-turbine when the water head was abnormally low was studied. Fan [14] measured the pressure pulsation at different positions of the vertically placed axial flow pump by experiment, and measured the pulsation under the working conditions of forward operation and reverse operation, and the study showed that under different operating conditions, the axial force of the impeller also changed as the speed at the inlet changed.
The internal flow field of the pump is complex, and pressure pulsation testing has the disadvantages of difficult measurement, a long period, and high cost. The above research on the pressure pulsation and internal flow characteristics of pumps mainly focused on centrifugal pumps [1,3,4,11], axial flow pumps [6,7,8,14,15,16,17,18], pump turbine [19,20] and mixed flow pumps [10,21,22,23]. Some research has also focused on turbines [24]. There are relatively few studies on the shaft-extension tubular pump [5,9], especially research on the pressure pulsation of the internal flow field of the shaft-extension tubular pump under multiple working conditions. In this paper, the axial flow pump of a pumping station in Nanjing, Jiangsu Province, is used for experimental research, and the three-dimensional turbulent flow numerical simulation and the actual machine test are used to study the pressure pulsation and flow characteristics of the axial flow pump under multiple working conditions. The internal pressure pulsation changes of the pump are analyzed, and the internal pressure pulsation characteristics of the pump are analyzed to reveal the real pressure pulsation distribution characteristics inside the axial flow pump to explain the influence of the pressure pulsation changes on the operation of the unit, so as to provide a reference for the stable operation and safety protection of the unit.

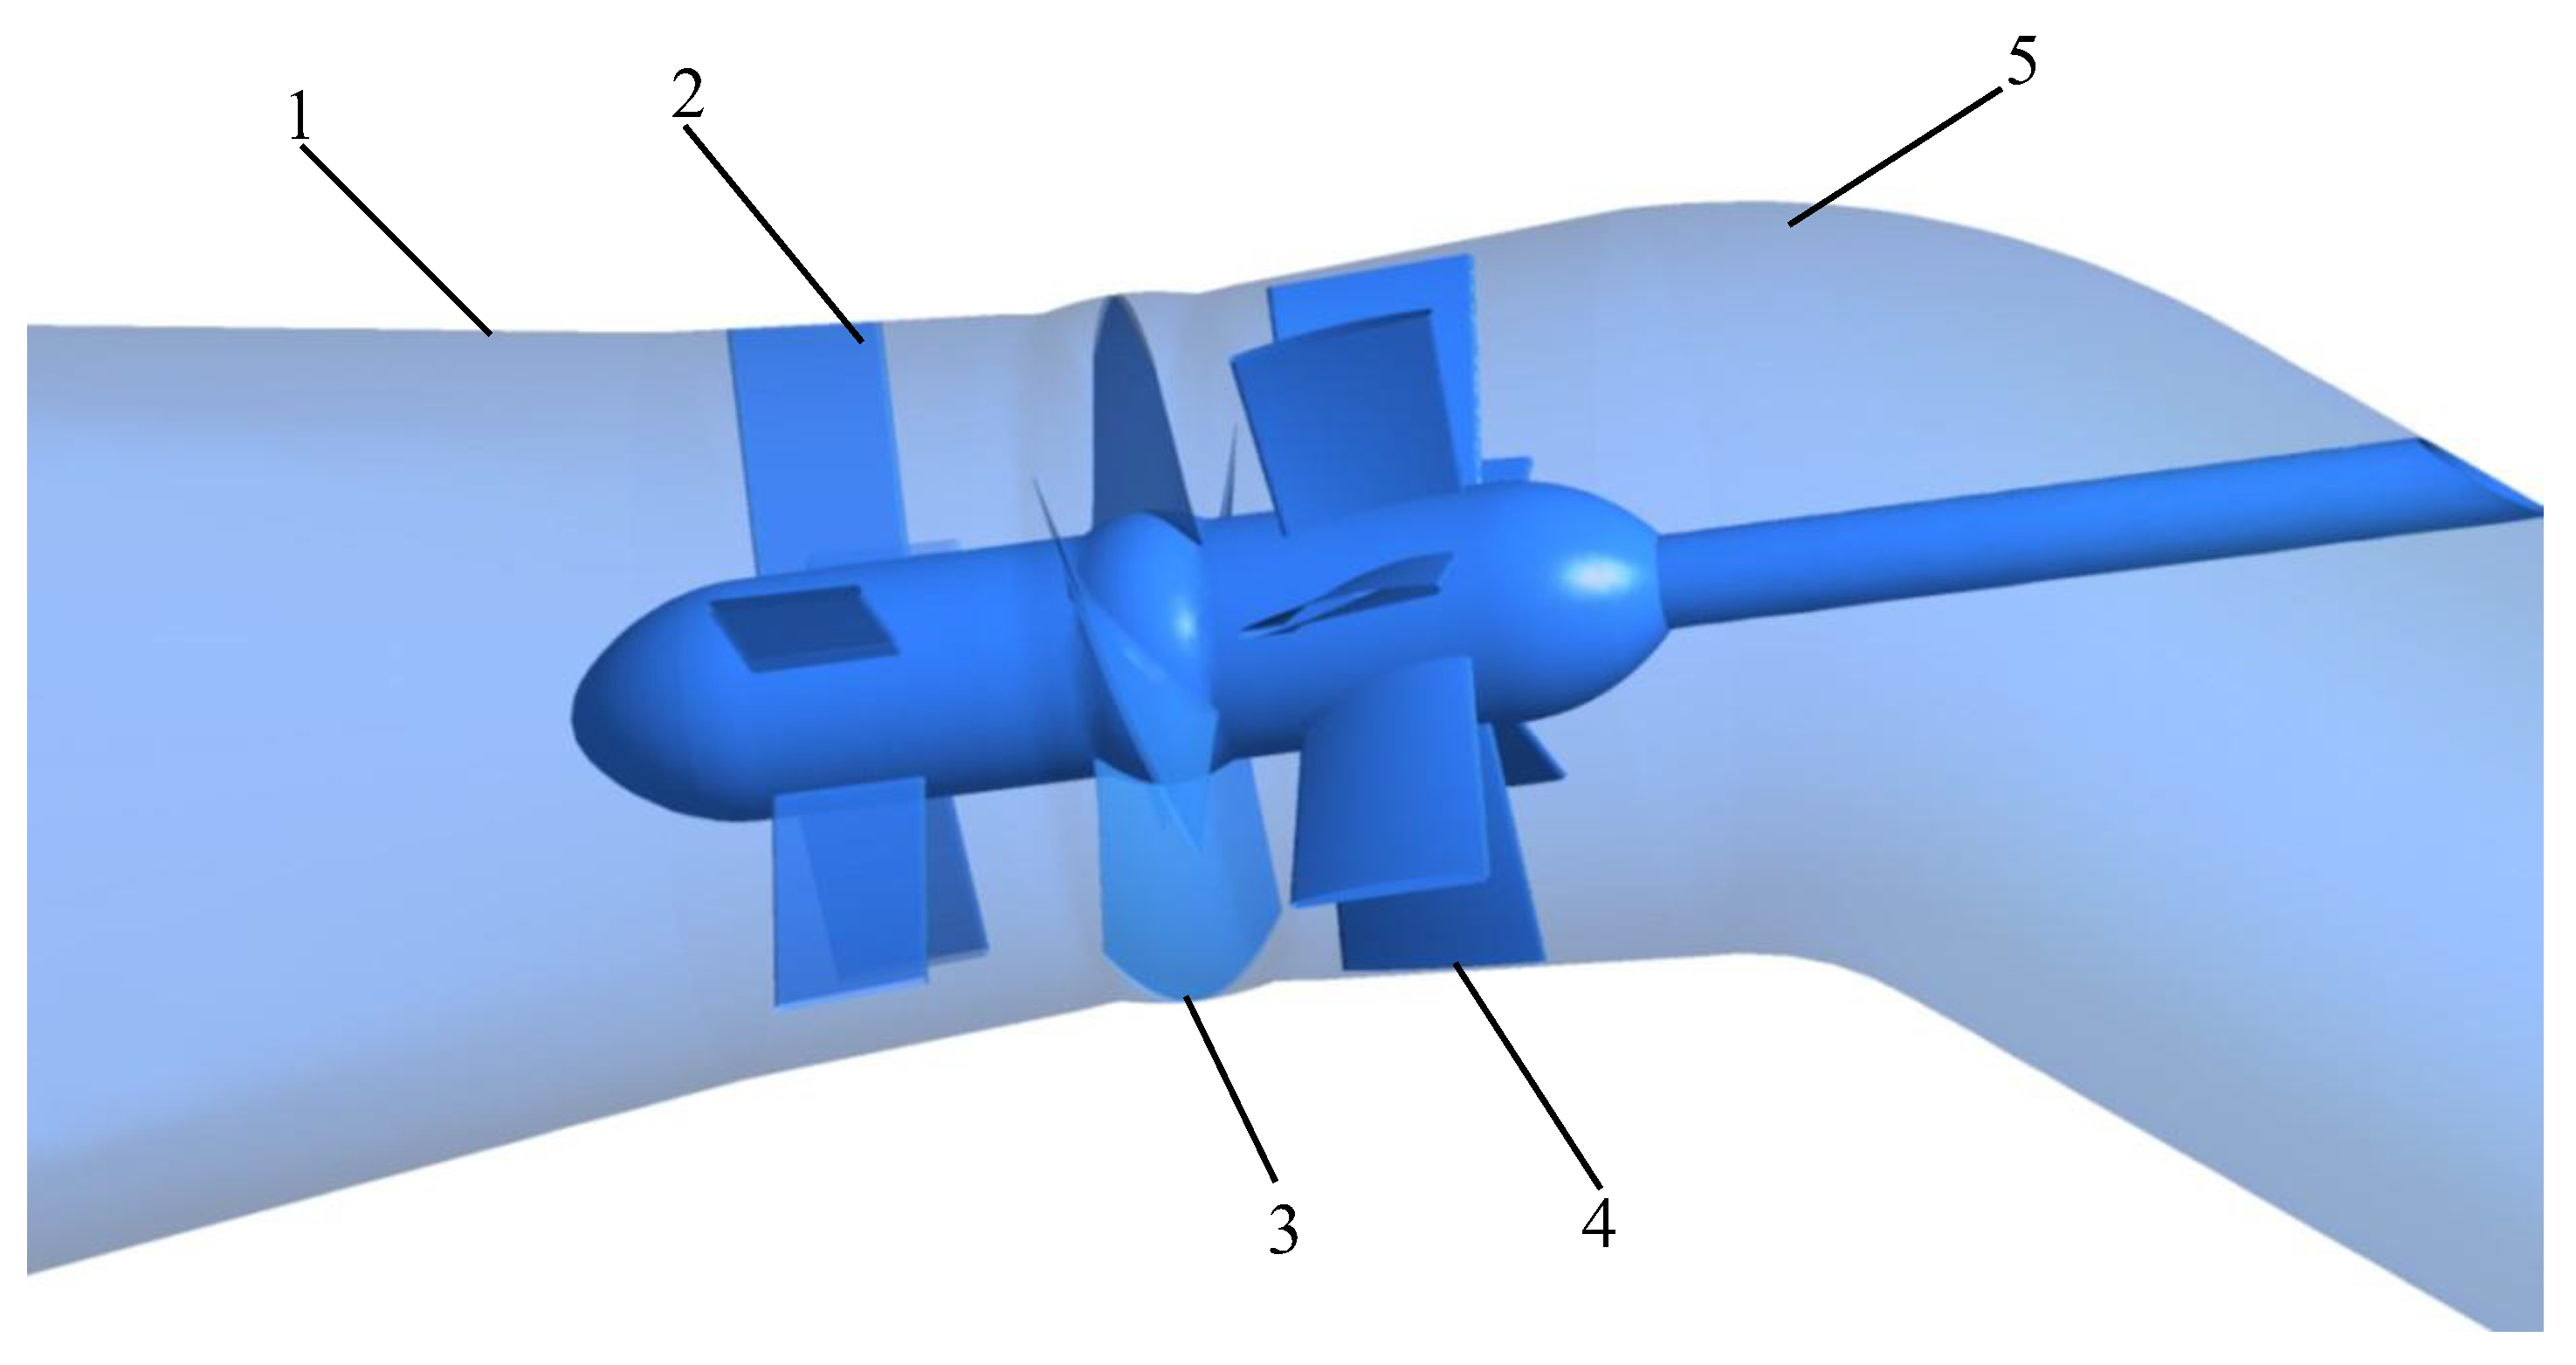
2. Numerical Simulation

2.1. Governing Equations

In actual operation, the water flow inside the pump can be considered as an incompressible fluid, and it operates at room temperature without considering the heat exchange with the outside world. Fluid governing equations mainly include a continuity equation and the Navier–Stokes equation. The continuity equation is
ρ t + · ( ρ u ) = 0
where ρ is the fluid density, and u is the velocity vector.
The Navier–Stokes equation is
u t + ( u   · ) u = f   1 ρ p + ν 2 u
where u is speed, p is pressure, f is mass force, and ρ is density.

2.2. Calculation Method
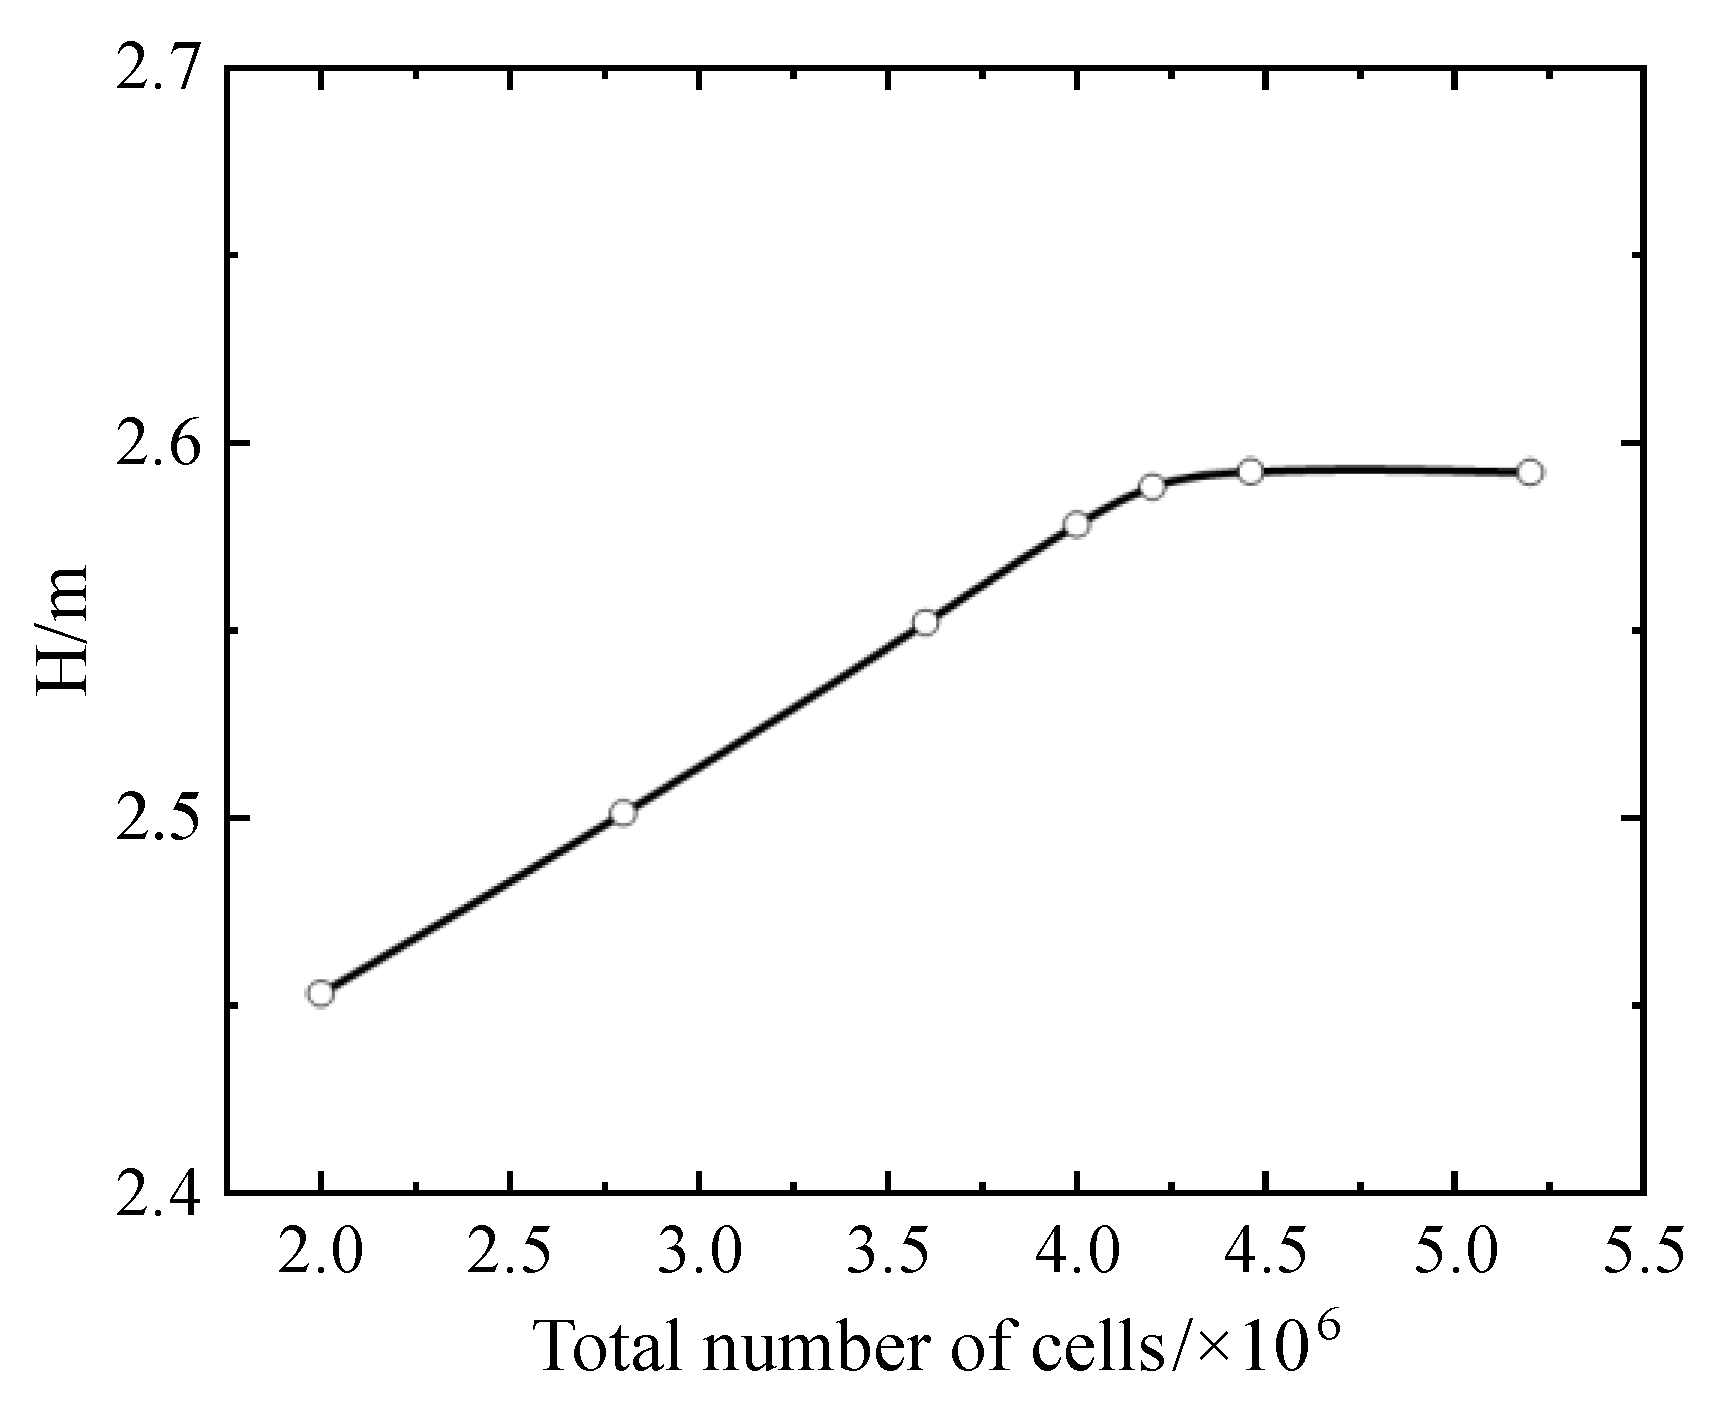
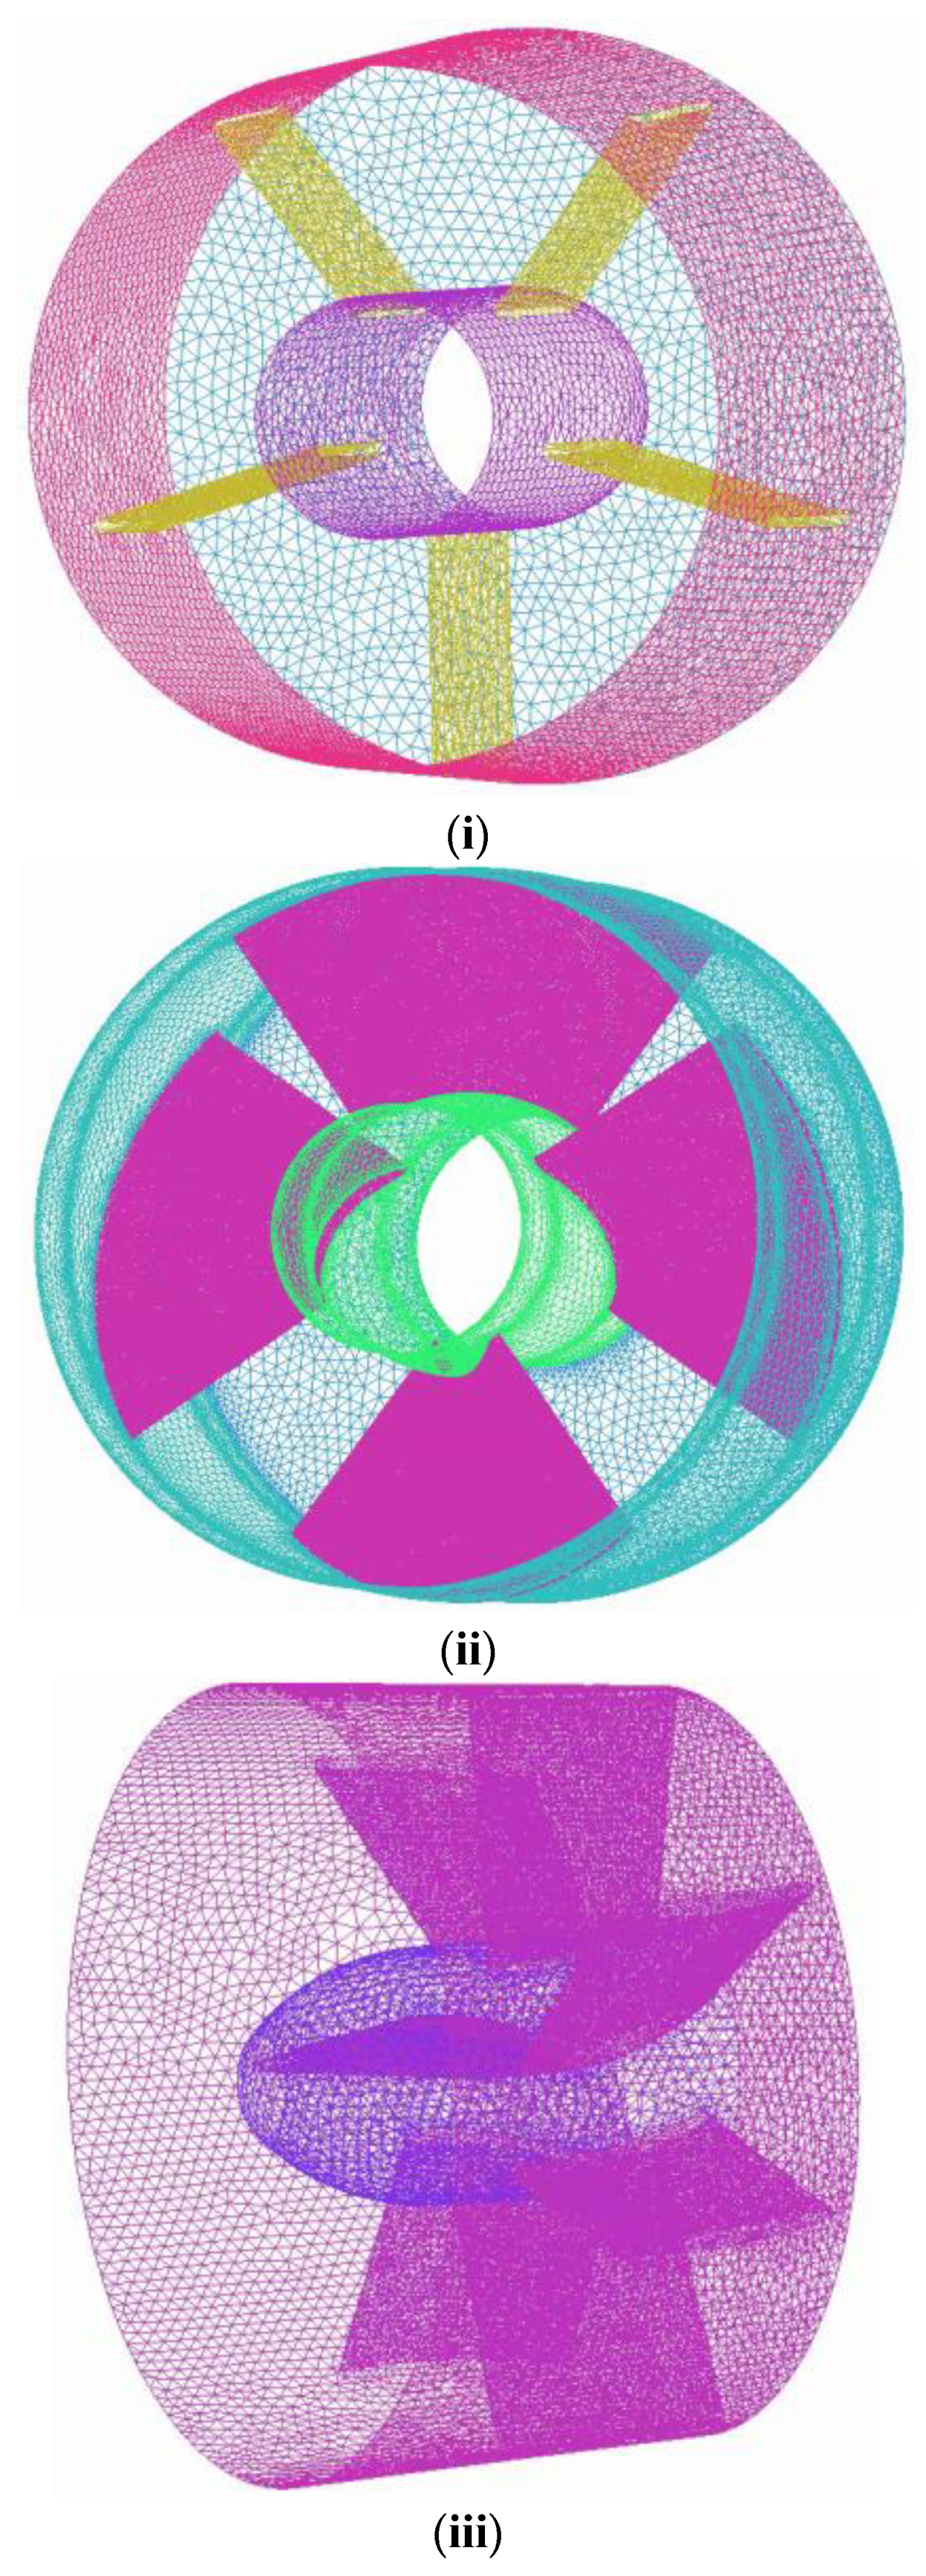
The calculation model software of this paper was the Siemens modeling software ug10.0. The model was divided into three parts, namely, the inlet flow channel, the overflow part, and the outlet flow channel. Among them, the overcurrent component included a front guide vane body, a runner body, and a movable guide vane body. Figure 1 shows some overflow parts of the pump. Table 1 shows the relevant design parameters of the pump. The impeller diameter was 1.7 m, the design flow was 10 m3/s, the design head was 2.5 m, the rated speed was 250 r/min, and there were 4 runner blades, 5 front guide vanes, and 7 active guide vanes.

2.3. Meshing

For the accuracy of the calculated values and the rational use of computing resources, a total of 7 grids with different grid numbers were designed using ICEM software, and the design water head was selected as the reference to verify the grid independence. As shown in Figure 2. The fluctuation error of the head was already within 1% when the number of elements reached 4.1 million. When considering factors such as computing resources, the final selection grid was 4.32 million. Of them, the impeller area was 2 million, the front guide vane area was 700,000, the rear guide vane area was 800,000, the inlet section was 600,000, and the outlet section was 300,000. The grid of some overflow parts is shown in Figure 3.

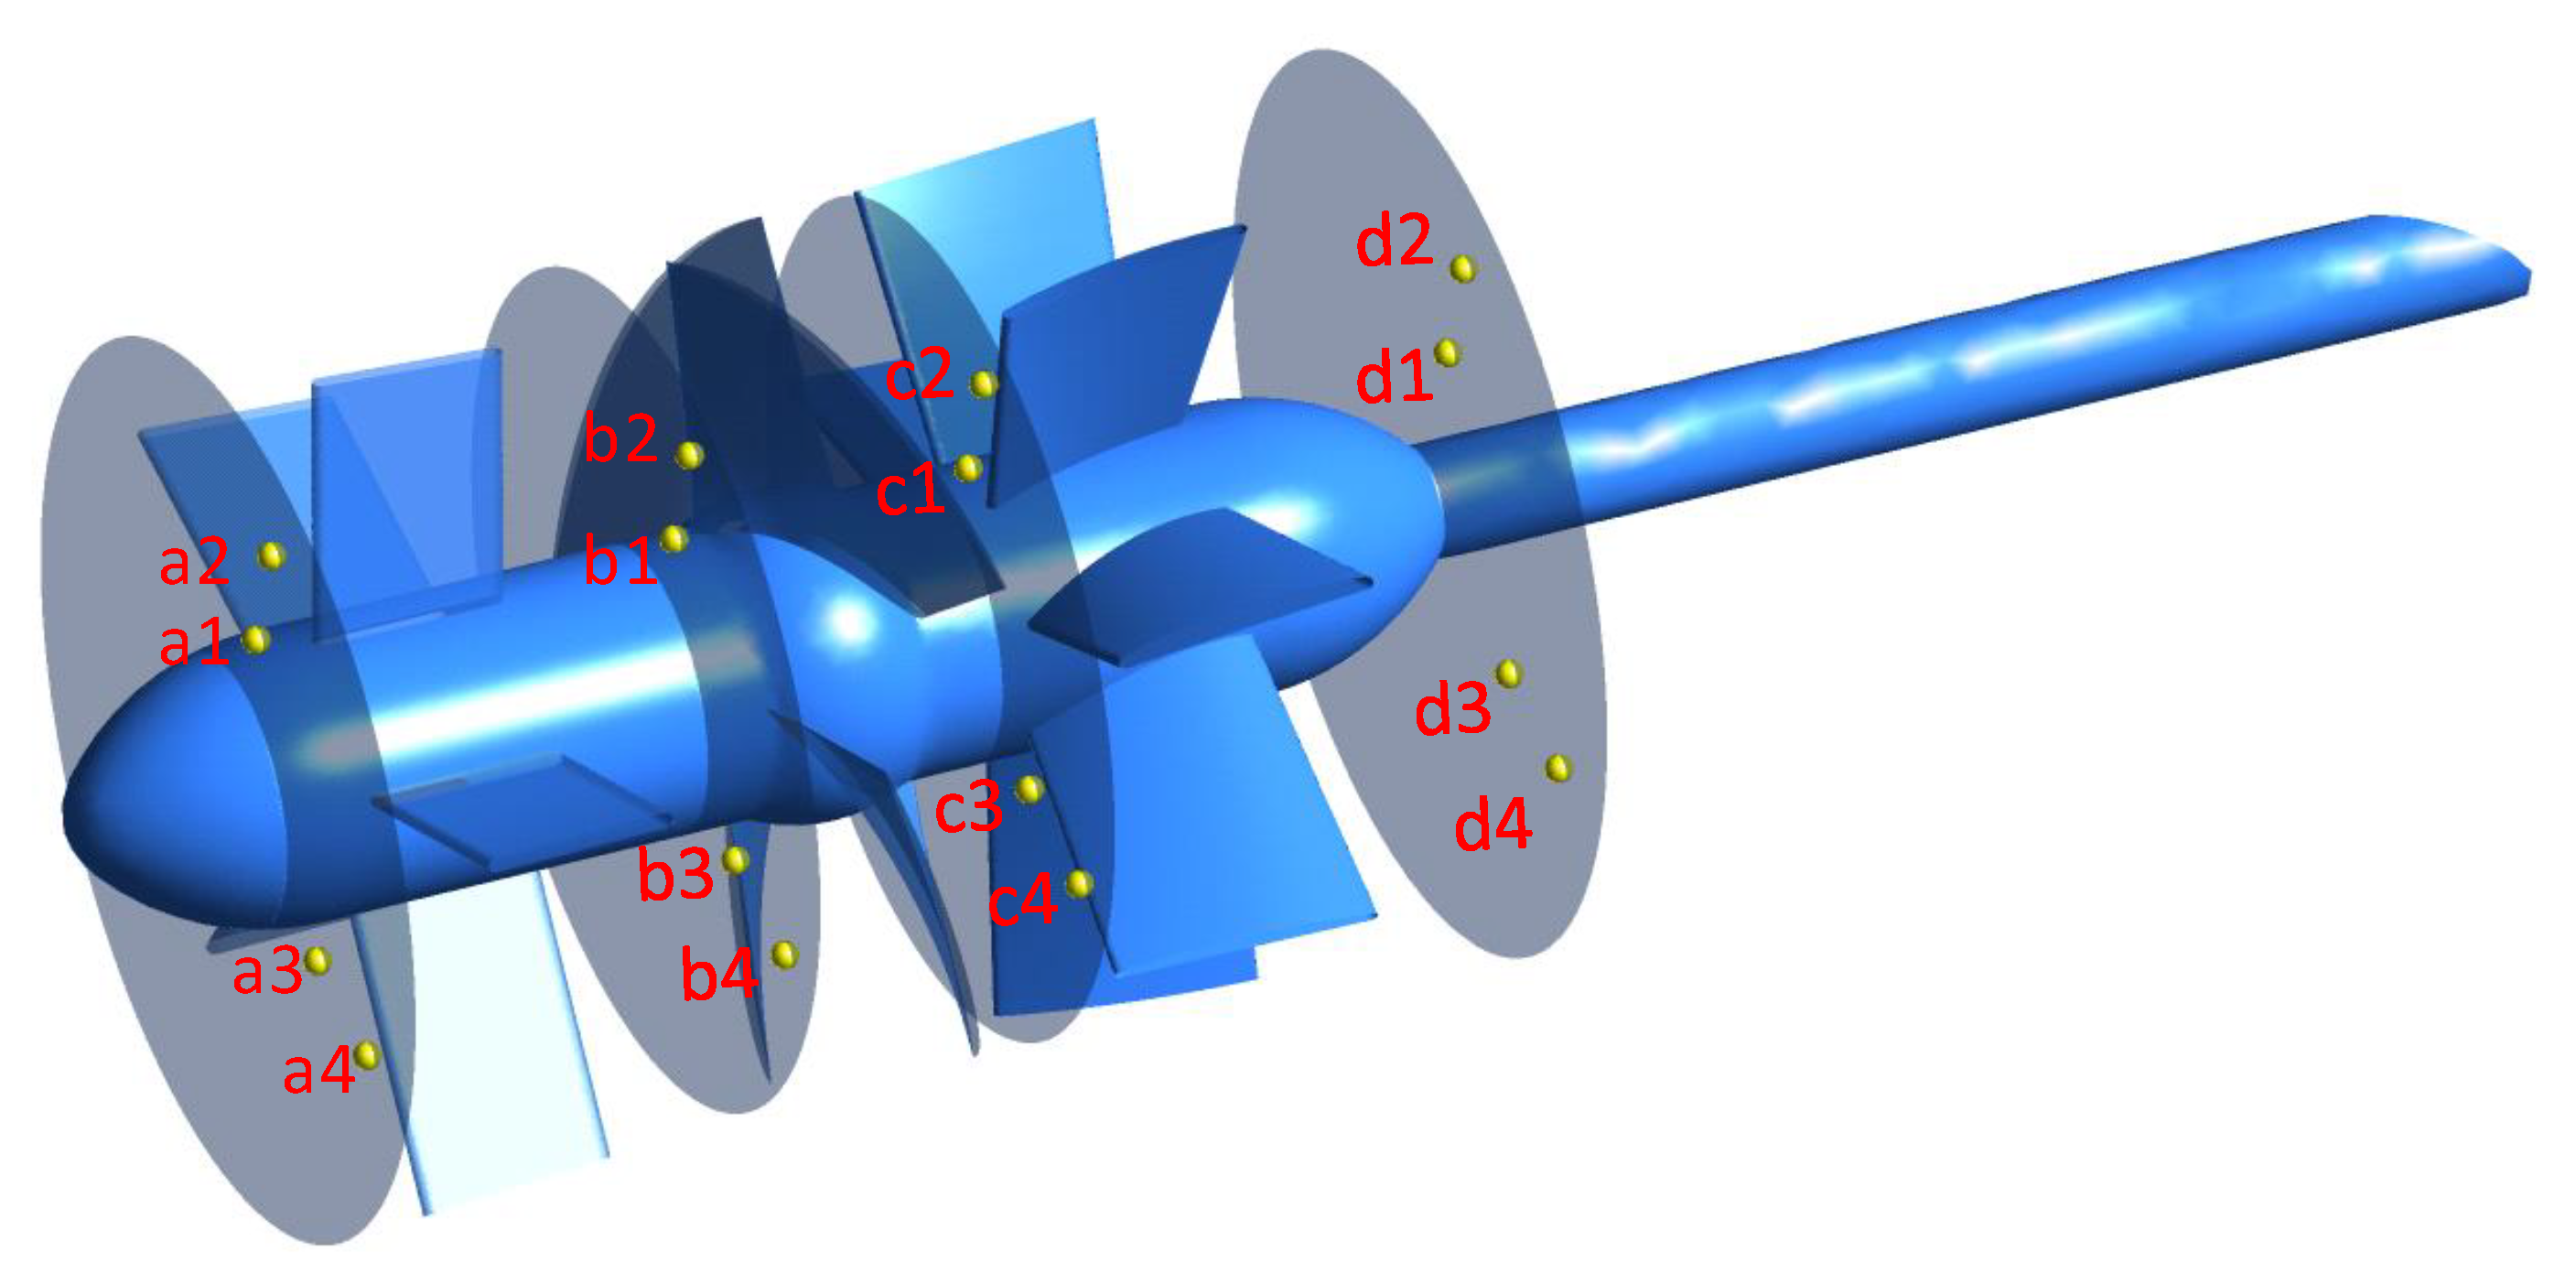
2.4. Solving for Control and Monitoring Points

Figure 4 shows the setting of the monitoring points of the computational model. In the figure, four monitoring surfaces were set, which were located at the inlet of the front guide vane, the inlet, and outlet of the runner chamber, and the outlet of the movable guide vane. A total of 16 monitoring points were set that can monitor the changes in the pressure pulsation on different interfaces in more detail. On different monitoring surfaces, the monitoring points were distributed along the radial direction, and the angle between the two groups of monitoring points was 90°. Among them, the monitoring points a2 and b3 were located at the outer edge positions of each monitoring surface, which was consistent with the monitoring positions of the test arrangement.
In this paper, FLUENT software was used for numerical simulation. The three-dimensional Reynolds time-averaged N-S equation was chosen as the basic governing equation to describe the turbulence in the pump. Using the RNG k-ε turbulence model can effectively improve the computational efficiency. We used the automatic wall function to set the wall as a no-slip wall. The numerical calculation precision was set to 10−4. The inlet boundary conditionwas set as mass inlet and the outlet boundary condition was set as free outflow boundary conditions, respectively. When calculating the working conditions of the turbine in reverse, we chose the total pressure inlet at the inlet and the static pressure outlet at the outlet. In Table 2, some turbulence models are listed.
In order to obtain accurate numerical simulation results, a suitable turbulence model must be selected according to different research conditions [25,26,27]. After referring to the literature, it was found that the RNG k–ε turbulence model had a good effect on the calculation of the pressure pulsation and internal flow in the axial flow pump and could achieve accurate results. In the simulation, the RNG k-ε turbulence model was selected for the numerical simulation based on the comprehensive consideration of computational resources, main research directions, and previous research results. The calculated results were consistent with the test.
The stable state computation was performed on the model first, and then the non-stable state computation was performed on the stable state computation results. In the unsteady calculation, the sliding mesh technology was used in the area of the runner body. The rotating speed of the runner was 250 r/min, and one cycle was T = 1/n = 0.24 s. For ensuring the stability of setting analysis and to facilitate calculation and analysis, the time step of unsteady calculation was set to 0.005 s. For ensuring the stability of the unsteady calculation results, the sampling time of the unsteady calculation in this paper was 10 cycles.

3. Test Verification

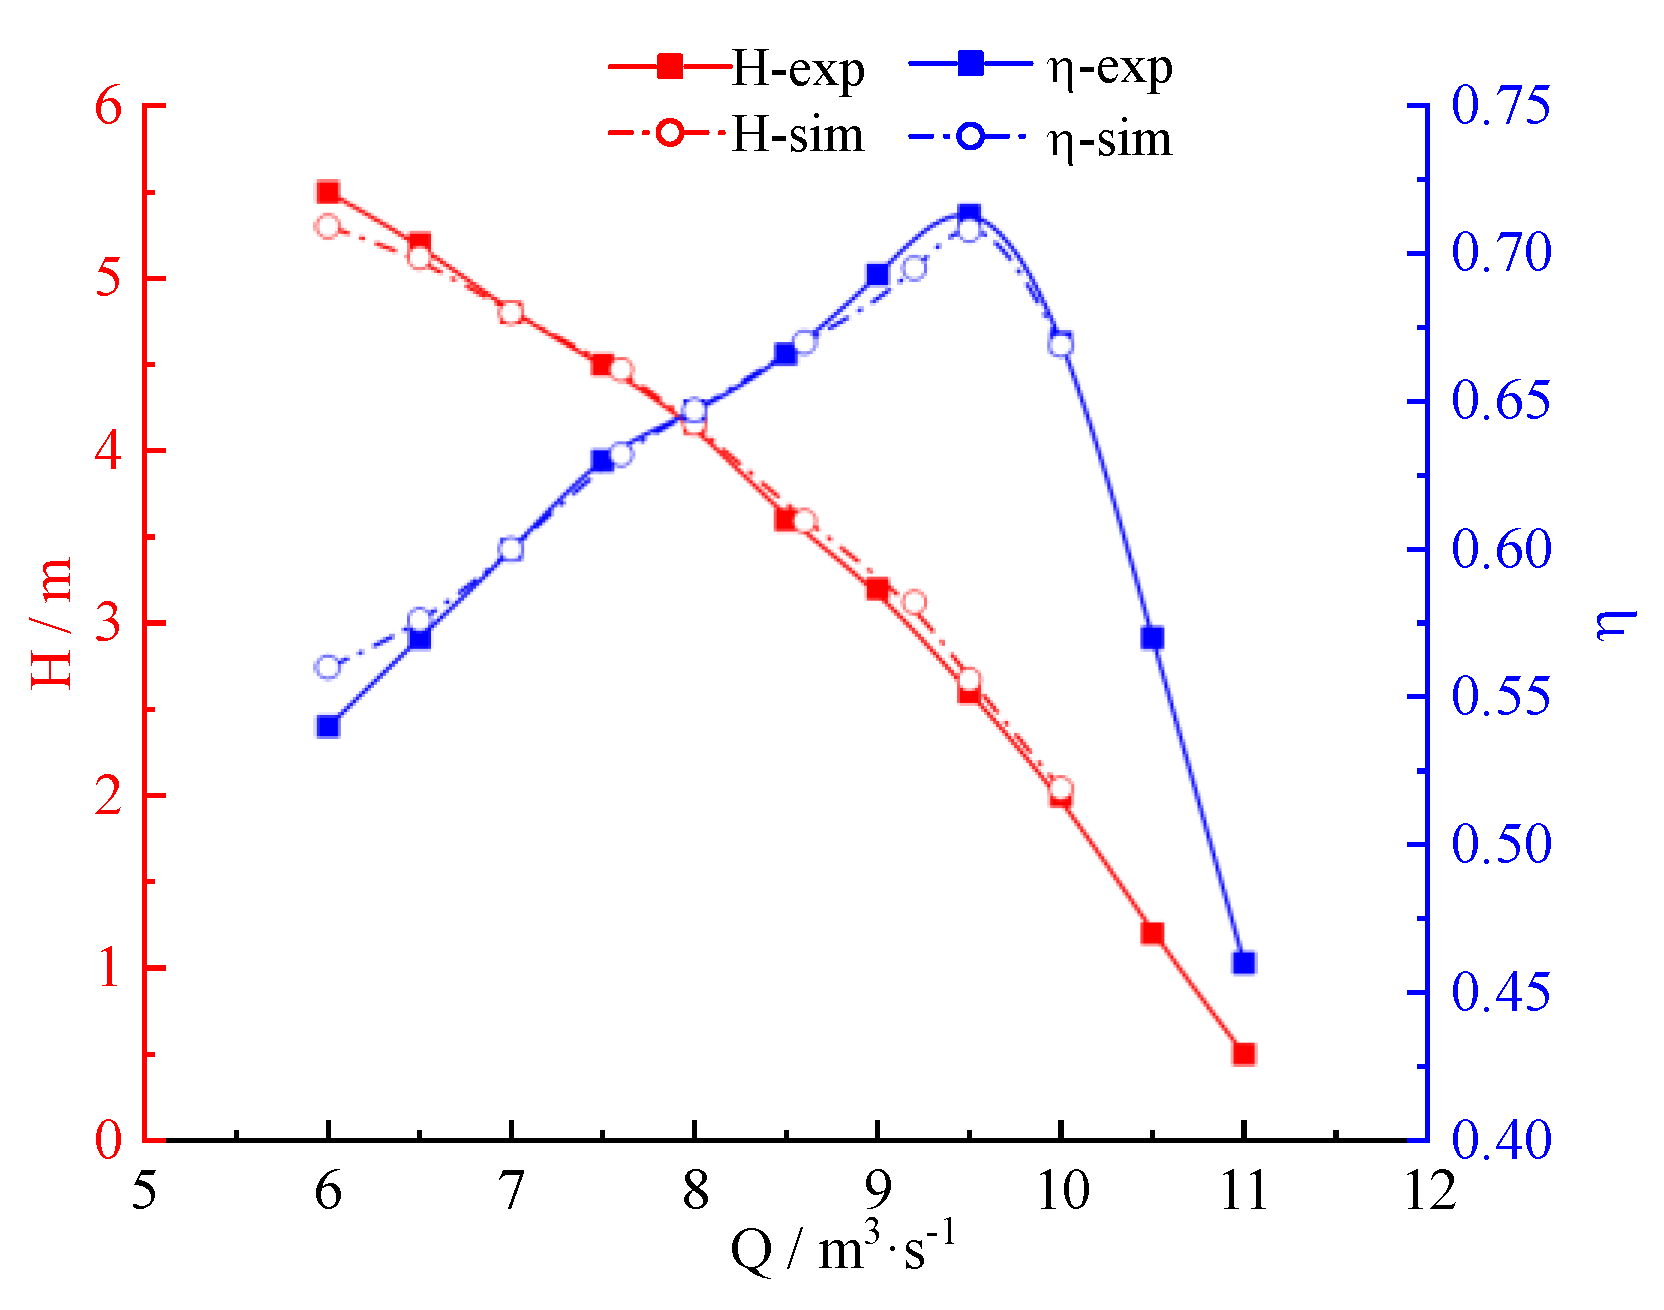
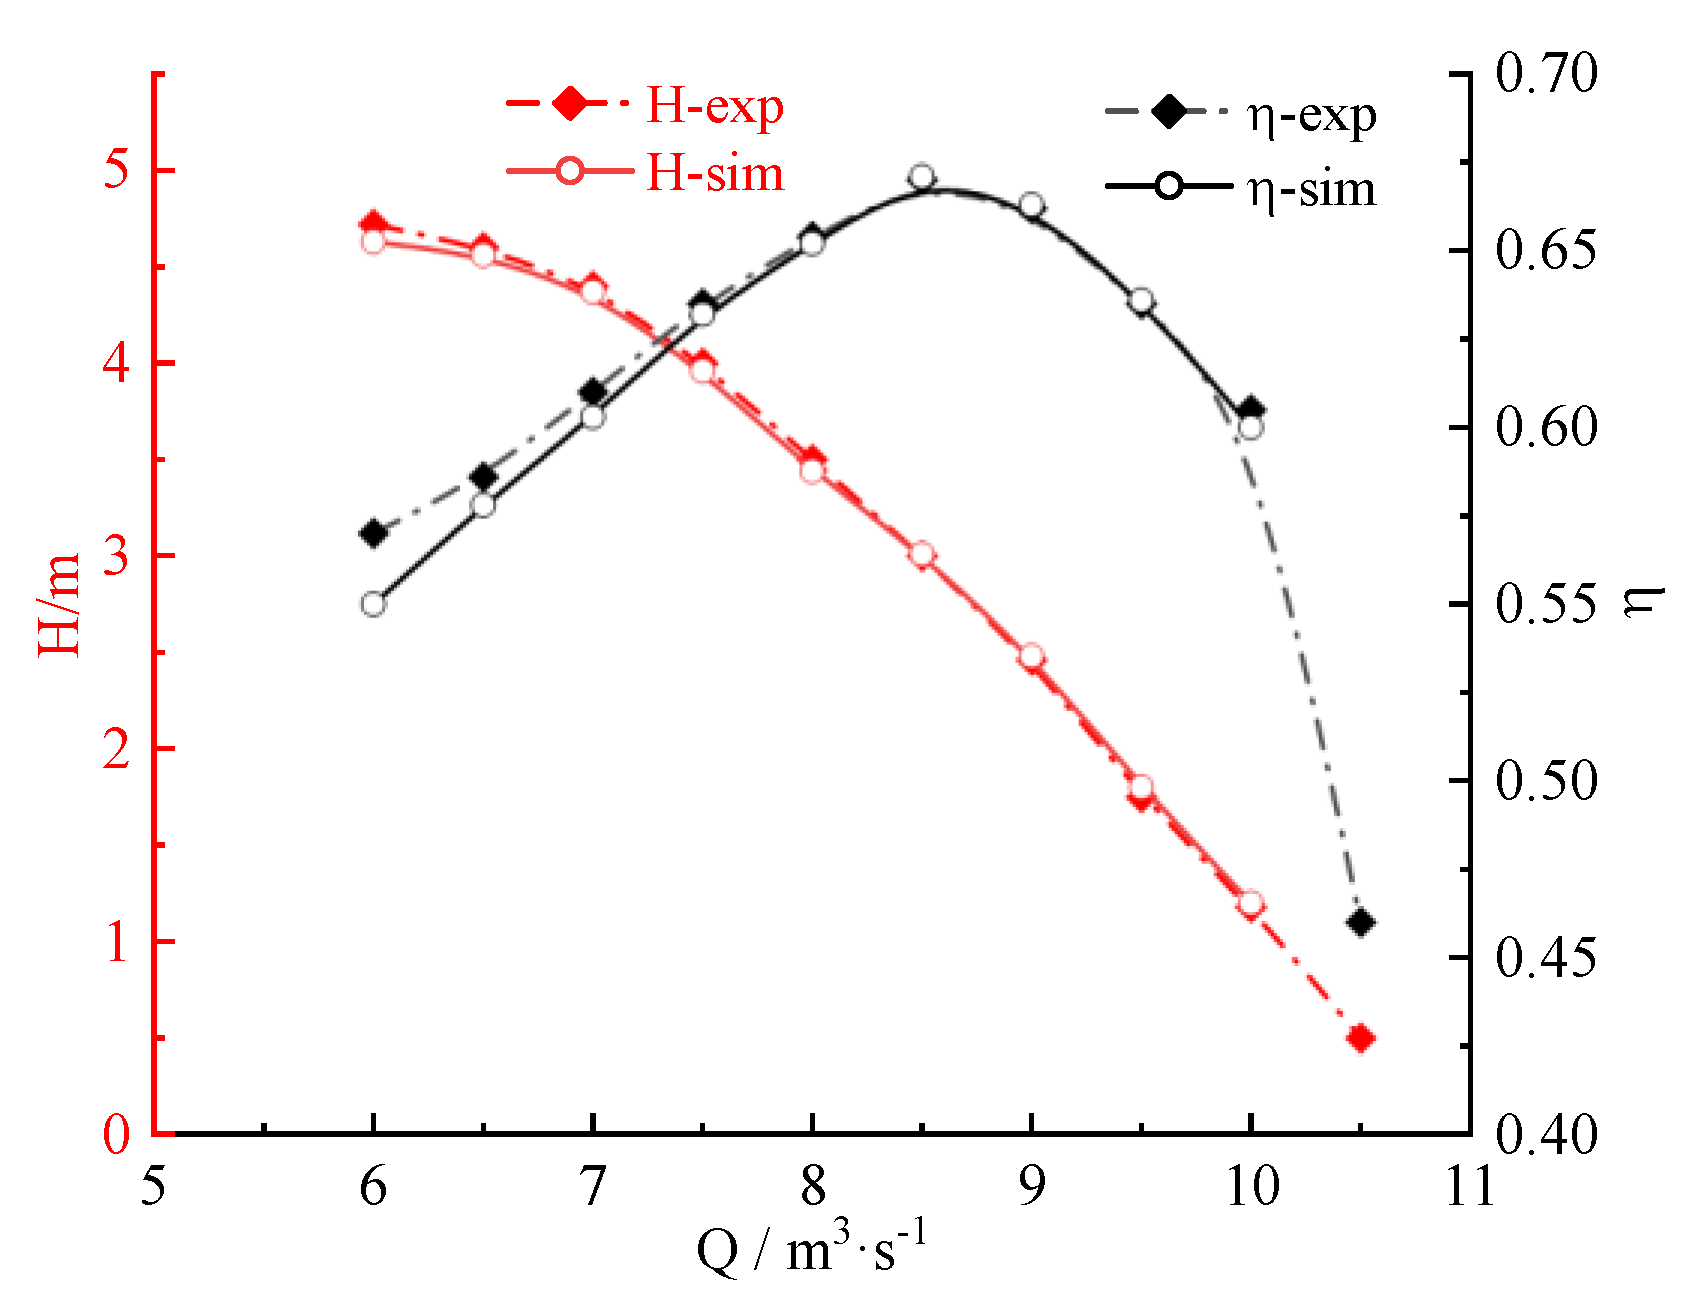
3.1. External Characteristic Test

Several operating points under the pump condition and the turbine condition were selected to verify the accuracy of the numerical simulation, and the external characteristic curve obtained by the numerical simulation was drawn. Figure 5 and Figure 6 show the external characteristic curves of the pump under forward and reverse working conditions respectively. Compared with the characteristic curve of the prototype unit obtained from the experiment, it can be found that there is a certain deviation in the efficiency at low flow rate, the maximum deviation was within 3%, and the head was slightly lower than the experimental result. Considering the deviation of the calculation model and the local structure of the prototype pump and the influence of the number of meshes, some deviations in the numerical simulation results were inevitable. In general, the deviation between simulation results and experiment is small, and the trend is the same for both. Therefore, the numerical simulation results in this paper have a certain credibility.

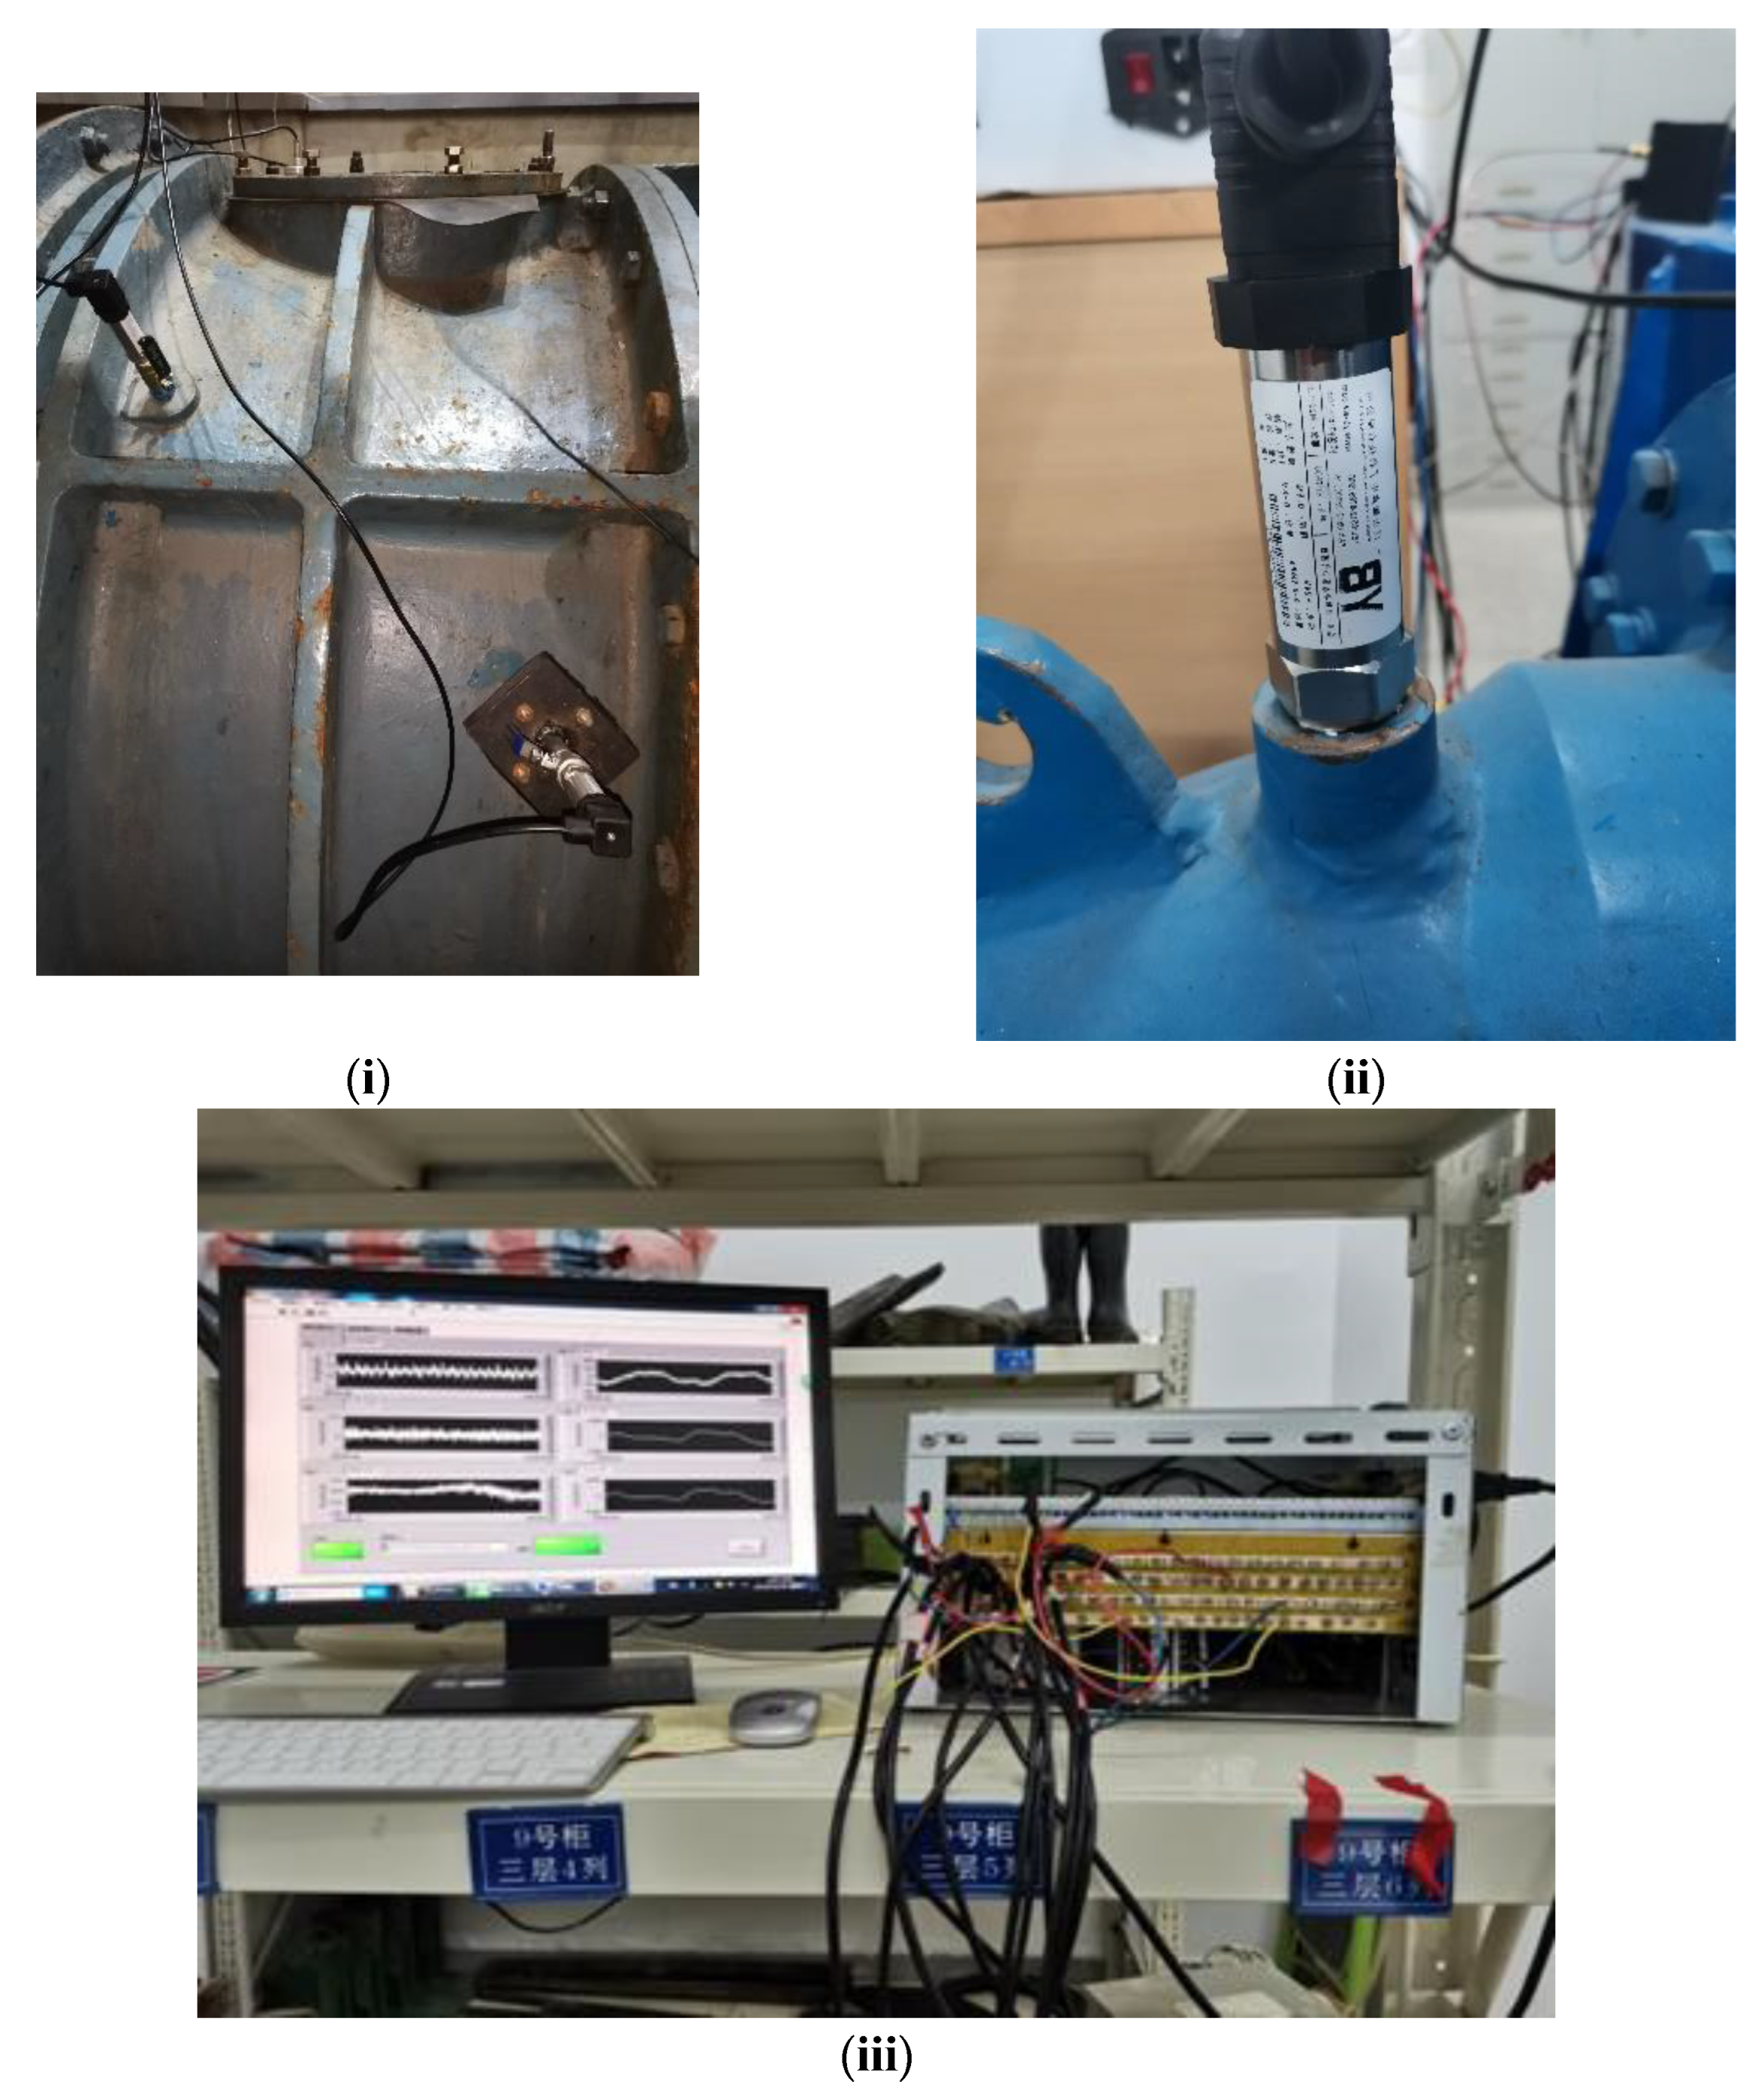
3.2. Pressure Pulsation Test

Figure 7 shows the site layout during the test of a pumping station, including the layout of the monitoring points, the selected pressure pulsation sensor, and the on-site measuring instruments. Restricted by the natural environment and working environment, the real machine test selected the test when the speed was 250 r/min. Since the real machine test could not open holes at random in the unit, according to the characteristics of the unit itself, holes were opened at the front end of the front guide vane and the front end of the runner to conduct the pressure pulsation test. During the test, we ensured that the pressure sensor was placed vertically with the pipeline. In this paper, the HPT900 high-frequency dynamic pressure sensor provided by Kunshan Yubin Electronic Technology Co., Ltd. was selected, with an accuracy of 0.5%. The pressure sensor arrangement is shown in Figure 7ii.
The sampling frequency of the pressure pulsation test was 1000 Hz, so the sampling time interval was 0.001 s. Since it was a real machine test measurement, after debugging the instrument, we first measured the non-running state of the unit for 30 s, then turned on the unit and directly recorded the pressure pulsation over the entire process from startup to shut down.

4. Results

4.1. Comparison of Experiment and Simulation

For eliminating the influence of position, the local average pressure and impeller parameters were normalized to the pressure data, and the formula is as follows:
C p = p   p ¯ 1 2 ρ u 2
where p is the pressure, Pa; p ¯ is the average pressure, Pa; u is the peripheral velocity of the impeller outlet, m/s; and ρ is the density of water, 1000 kg/m3.
The pressure pulsation was measured by the real machine test, the monitoring points were arranged at the outer edge of the inlet position, and the numerical simulation results were compared with the measured values of the real machine test. The comparison results are shown in Figure 8, which contains the time-domain and frequency domain graphs of the pressure pulsation obtained from the experiment and numerical simulation, respectively. It can be seen from the figure that the results of the real machine test were in good agreement with the results obtained by the numerical simulation. Figure 8i,ii show that there was still a certain error between the test and the simulation, and there was a certain difference in the amplitude when changing with time. It can be seen from Figure 8iii,iv that the frequency domain distribution of the pressure pulsation obtained by simulation was basically the same with the test. Among them, the main frequency at the leading position was the rotation frequency; the frequency at the inlet of the runner was the BPF, and the rotation frequency was twice the secondary frequency. Considering that there may be a little deviation in the position of the monitoring points, the influence of the elements on the results and the related disturbances on the site may have caused deviations in the results, but the deviation of the amplitude was within 5%, which was within a reasonable range and acceptable error. Therefore, we considered the numerical simulation results to be consistent with the experiments, and the numerical simulation results were trustworthy.

4.2. Pressure Pulsation Analysis

The numerical simulation of this paper was calculated by FLUENT software, and four monitoring surfaces were set along the overcurrent components; each monitoring surface had four sets of monitoring points, and a total of 16 sets of monitoring data were obtained. Considering that there were many monitoring points, this paper selected only some points for the pressure pulsation analysis. In order to study the distribution of the pressure pulsation along the axial direction, the outer edge points a3, b3, c3, and d3 were selected on the four monitoring surfaces. Figure 9 is the time-domain diagram of the pressure pulsation distribution under different working conditions. In the figure, the pressure pulsation coefficient at the inlet of the runner chamber obviously changed, and its amplitude change was much larger than that at the inlet of the front guide vane and the interface between outlet and guide vane. This indicated that the change in the pressure pulsation was obviously affected by the dynamic and static interference. Figure 9 is the time-domain distribution diagram of the pressure pulsation of each monitoring surface under the working condition of the pump. Because of the dynamic and static interference, the water body flowing into the runner chamber was more violently excited, the pressure pulsation changed more, and the change in the pressure pulsation coefficient at the runner outlet was more severe than that at the outlet of the runner. This demonstrated that although there was static and dynamic interference, the blade rotation greatly influenced the pressure pulsation; however, the movable guide vane had a good combing effect on the water flow, which greatly reduced the amplitude of the coefficient, improved the flow state, and better converted the kinetic energy of the water flow into pressure energy. The data of the last two result cycles after stabilizing the analysis were selected for analysis. We found that the pressure pulsation exhibited a certain periodic change, especially the pressure pulsation change in the runner area, and there were four peaks and troughs in a single cycle, which was closely related to the number of blades; this fully illustrated the influence of blades on the pressure pulsation. It was not only related to the structure of the flow parts, but also significantly influenced by the rotation of the blades and closely related to the flow rate. When operating under flow conditions, the change in the pressure pulsation with time appeared not only extremely disordered, but also its amplitude of change was much larger than that of the operation under design conditions, indicating that the deviation from design conditions was extremely unstable and prone to occur. Larger pressure pulsation is not conducive to the stable operation of the unit and will also cause different degrees of damage to the overcurrent components. The existence of hydraulic excitation is a hidden danger to the safe operation of the unit.
Figure 10 is a time-domain diagram when the turbine is running. The pressure pulsation changed periodically with time. At the outlet of the runner, there were four peaks and troughs in a single cycle, while at the outlet of the movable guide vane, there were seven peaks and troughs in a single cycle. The number of runner blades was four and the number of movable guide vanes was seven, which indicated that the periodic change in the pressure pulsation was related to the number of blades. In the figure, the amplitude of the pressure pulsation coefficient at the inlet and outlet of the runner was much larger than that at the other two interfaces. The effect of rotation on the pressure pulsation was extremely pronounced. As opposed to the operation of the unit under the pump condition, the pressure pulsation change at the interface between the front guide vane and the runner was also quite severe when it was operated under the turbine condition, and its periodic change was obviously related to the number of movable guide vanes. When the pump was running in the forward direction, it was running under the pump condition. Inside the runner chamber, the flow was influenced by the axial water thrust. At this time, the mechanical energy was converted into the kinetic energy of the water body. When it flowed into the guide vane area after passing through the movable guide vane, kinetic energy was converted into pressure energy. When the pump was running in reverse, the unit was equivalent to a water turbine. The fluid flowed through the guide vanes and entered the runner chamber, converting kinetic energy into mechanical energy so the impeller rotated. In the guide vane area, it was regulated by the movable guide vanes. The pressure energy was converted into kinetic energy, so the pressure pulsation changes were also very obvious and related to the number of guide vanes.
A Fourier transform was performed on the pressure pulsation coefficient data obtained by numerical simulation, and the distribution of the pressure pulsation coefficients on the frequency spectrum was obtained. Figure 11 and Figure 12 are the frequency domain diagrams of the pressure pulsation under the pump condition and the pressure pulsation under the turbine condition, respectively.
It can be seen from the figure that when the unit was running under the pump condition, under different flow conditions, the frequency at the inlet of the runner was the BPF and its multiplier, in which the main frequency was the BPF, and the secondary frequency was the rotation frequency. Under the design flow condition and the large flow condition, the primary and secondary frequencies of the pressure pulsation frequency distribution of each monitoring surface were obvious, and there was no obvious clutter. Under the small flow condition, however, especially deviation from the design flow under the low flow condition in the low frequency band, there were a many secondary frequencies and clutter, the spectrum was extremely complex, and there was no obvious main frequency, indicating that the internal flow state of the unit was poor at this time, with serious decurrent, backflow, etc. Comparing the frequency domain diagrams under different flow conditions, it can be found that on the monitoring surface of the runner chamber, the main frequency was the BPF, and when it was far away from the runner chamber, the main frequency was the rotation frequency. This indicated that the dynamic and static interference area was obviously affected by the rotation of the blades, while in the non-blade area, it was mostly influenced by the rotation.
When the pump was running under turbine condition, the amplitude of the pressure pulsation coefficient under the low flow rate condition was larger than that under the design flow rate condition, but the frequency domain distribution of the pressure pulsation was basically the same, reflecting the influence of the flow on the pressure pulsation. In Figure 12, when in the reverse operation, at the outlet of the guide vane, the main frequency was the guide vane passing frequency, the secondary frequency was the rotation frequency and the multifold vane passing frequency. At the outlet of the runner, the main frequency of the pressure pulsation was BPF. On the interface at the inlet of the movable guide vane, the main frequency of the pressure pulsation was the vane passing frequency, and the secondary frequency was the rotational frequency; while at the outlet of the guide vane, the main frequency of the pressure pulsation was the rotational frequency, and the secondary frequency was the vane passing frequency.
Combining Figure 11 and Figure 12, the pressure pulsation in the vaneless area was mainly influenced by the rotation frequency, while in the dynamic and static interference area, the main and secondary frequencies of the pressure pulsation were influenced by the number of vanes. The influence was obvious, the main frequency was generally the multiplier of the rotation frequency, and the multiplier was equal to the number of blades. The most direct impact of the change in flow rate was the change in the amplitude of the pressure pulsation. Whether it was running in the forward direction or in the reverse direction, when the flow rate decreased, the amplitude of the pressure pulsation coefficient kept increasing, which meant that the lower the flow rate, the less the unit operated. The worse the flow state was, the stronger the hydraulic excitation, and the greater the pressure pulsation at this time. Influenced by blade rotation and adjustment, the number of blades can directly affect the distribution of the dominant frequency.

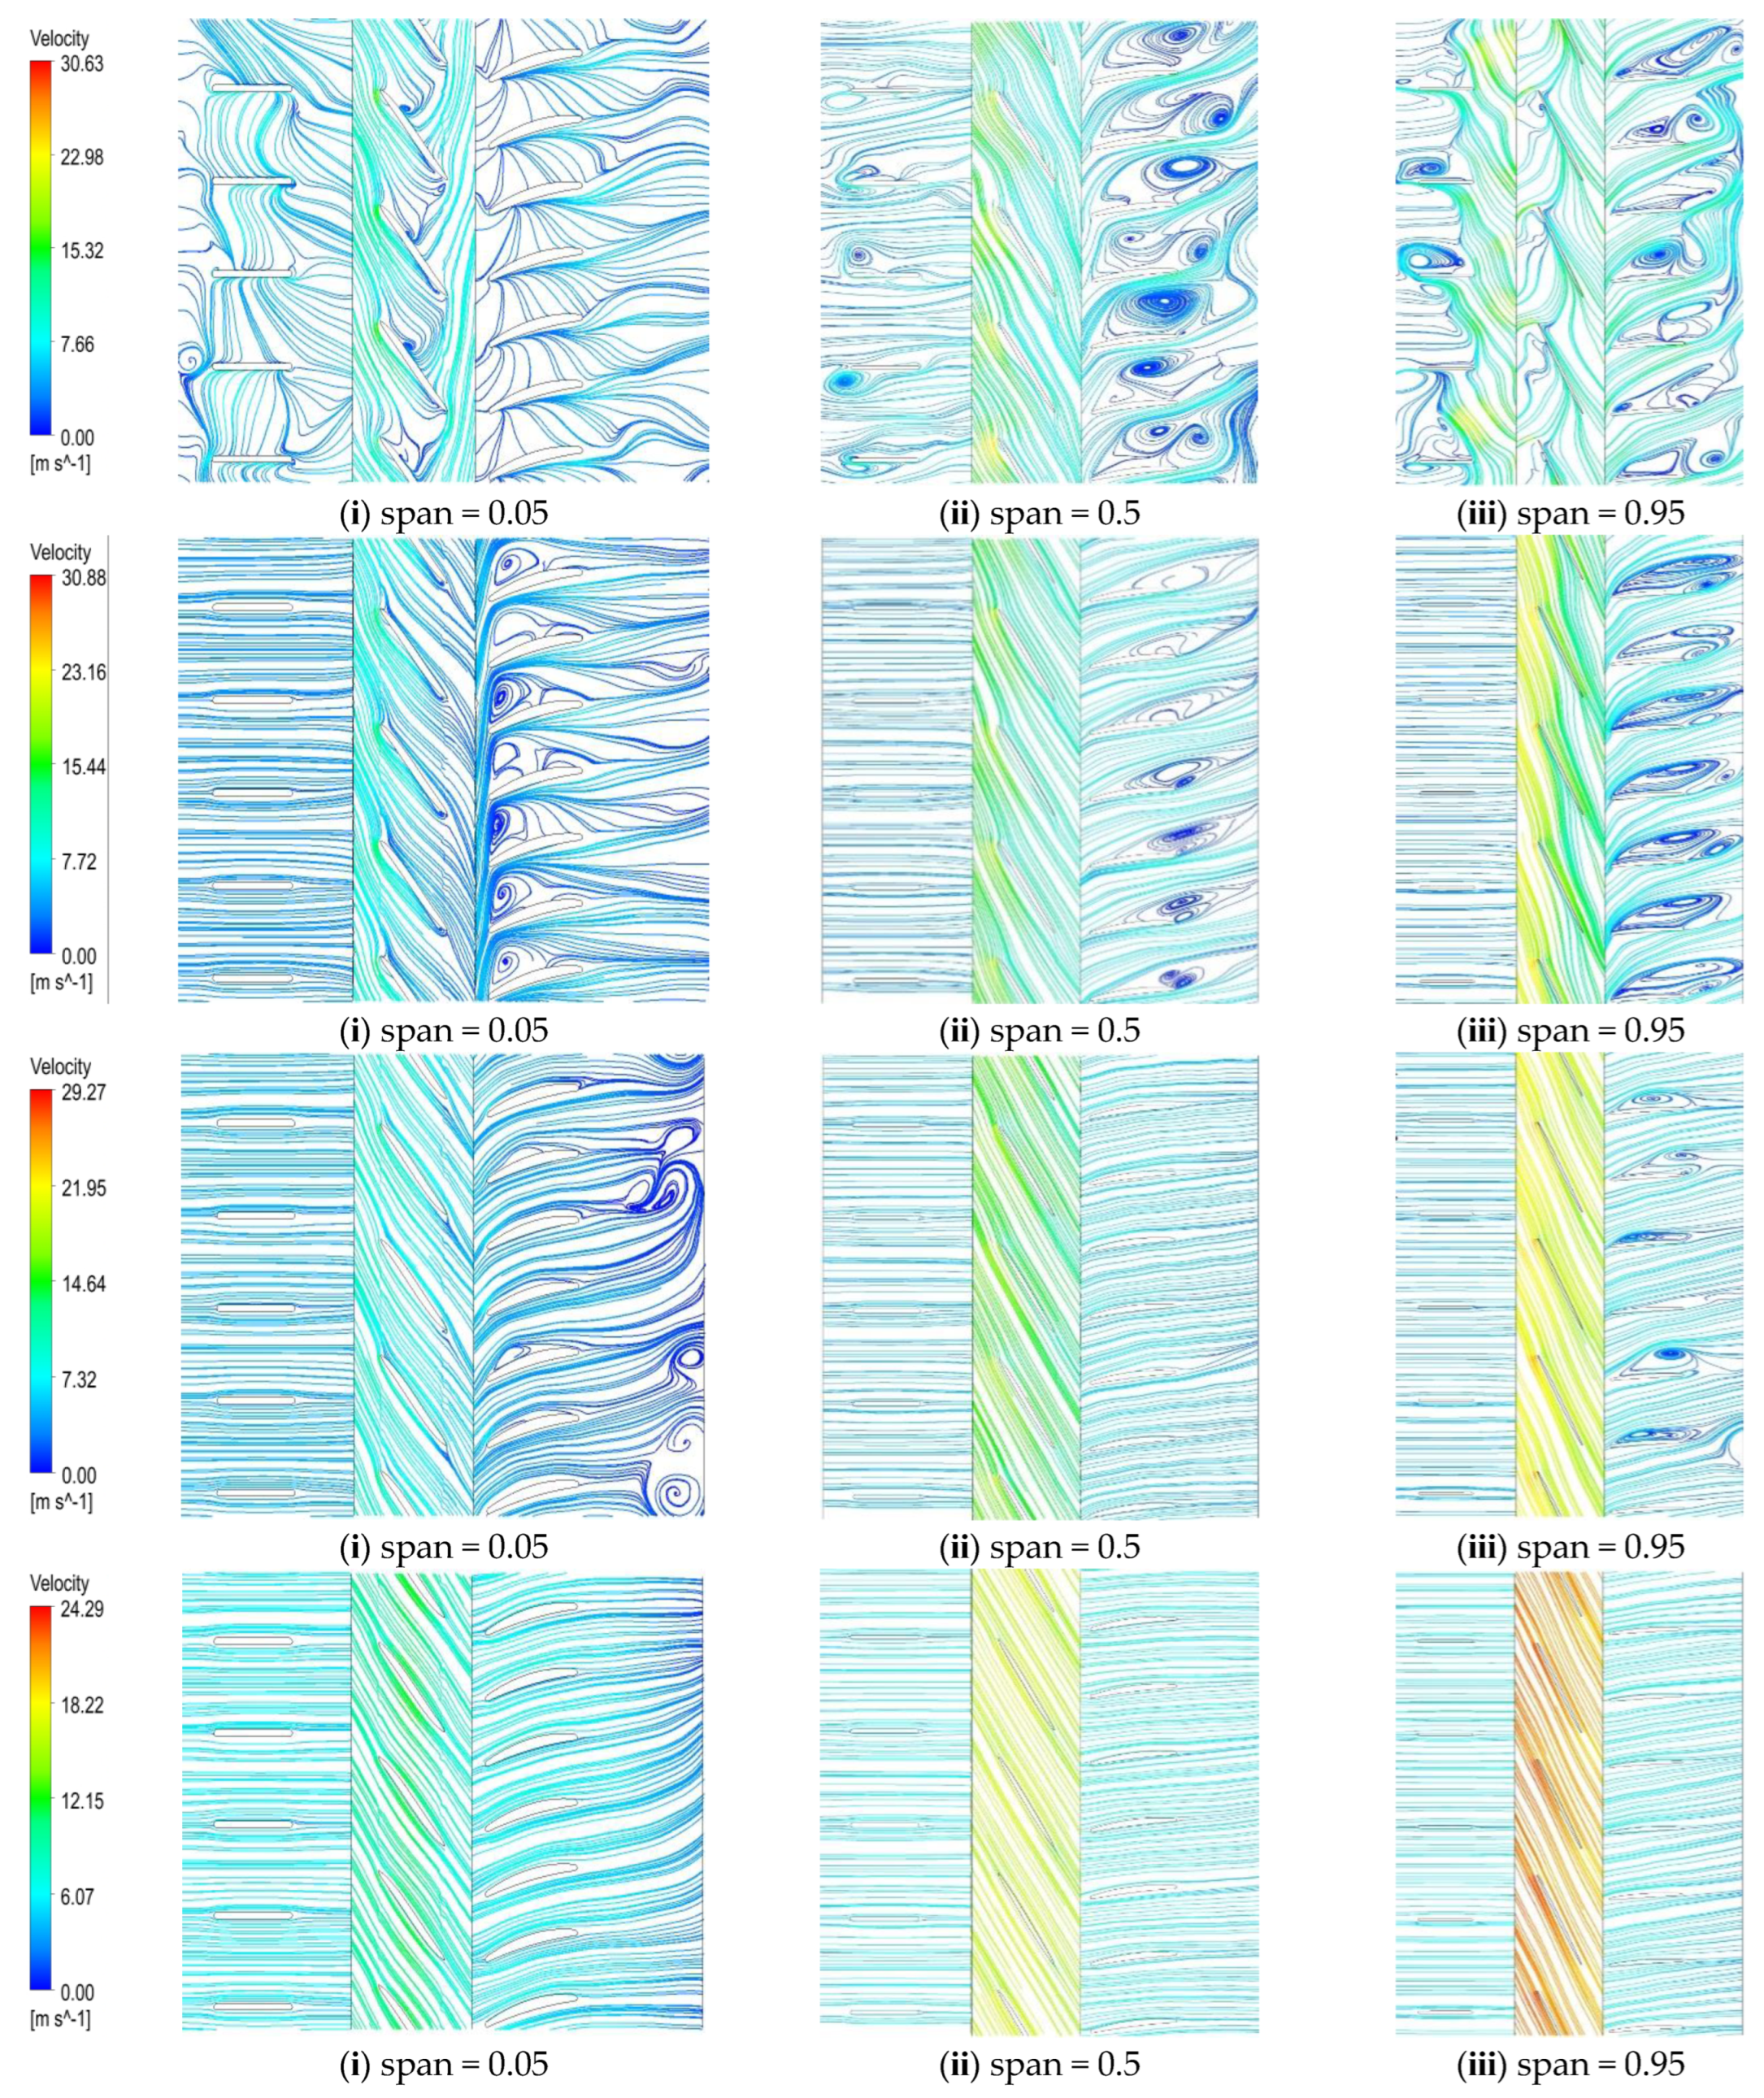
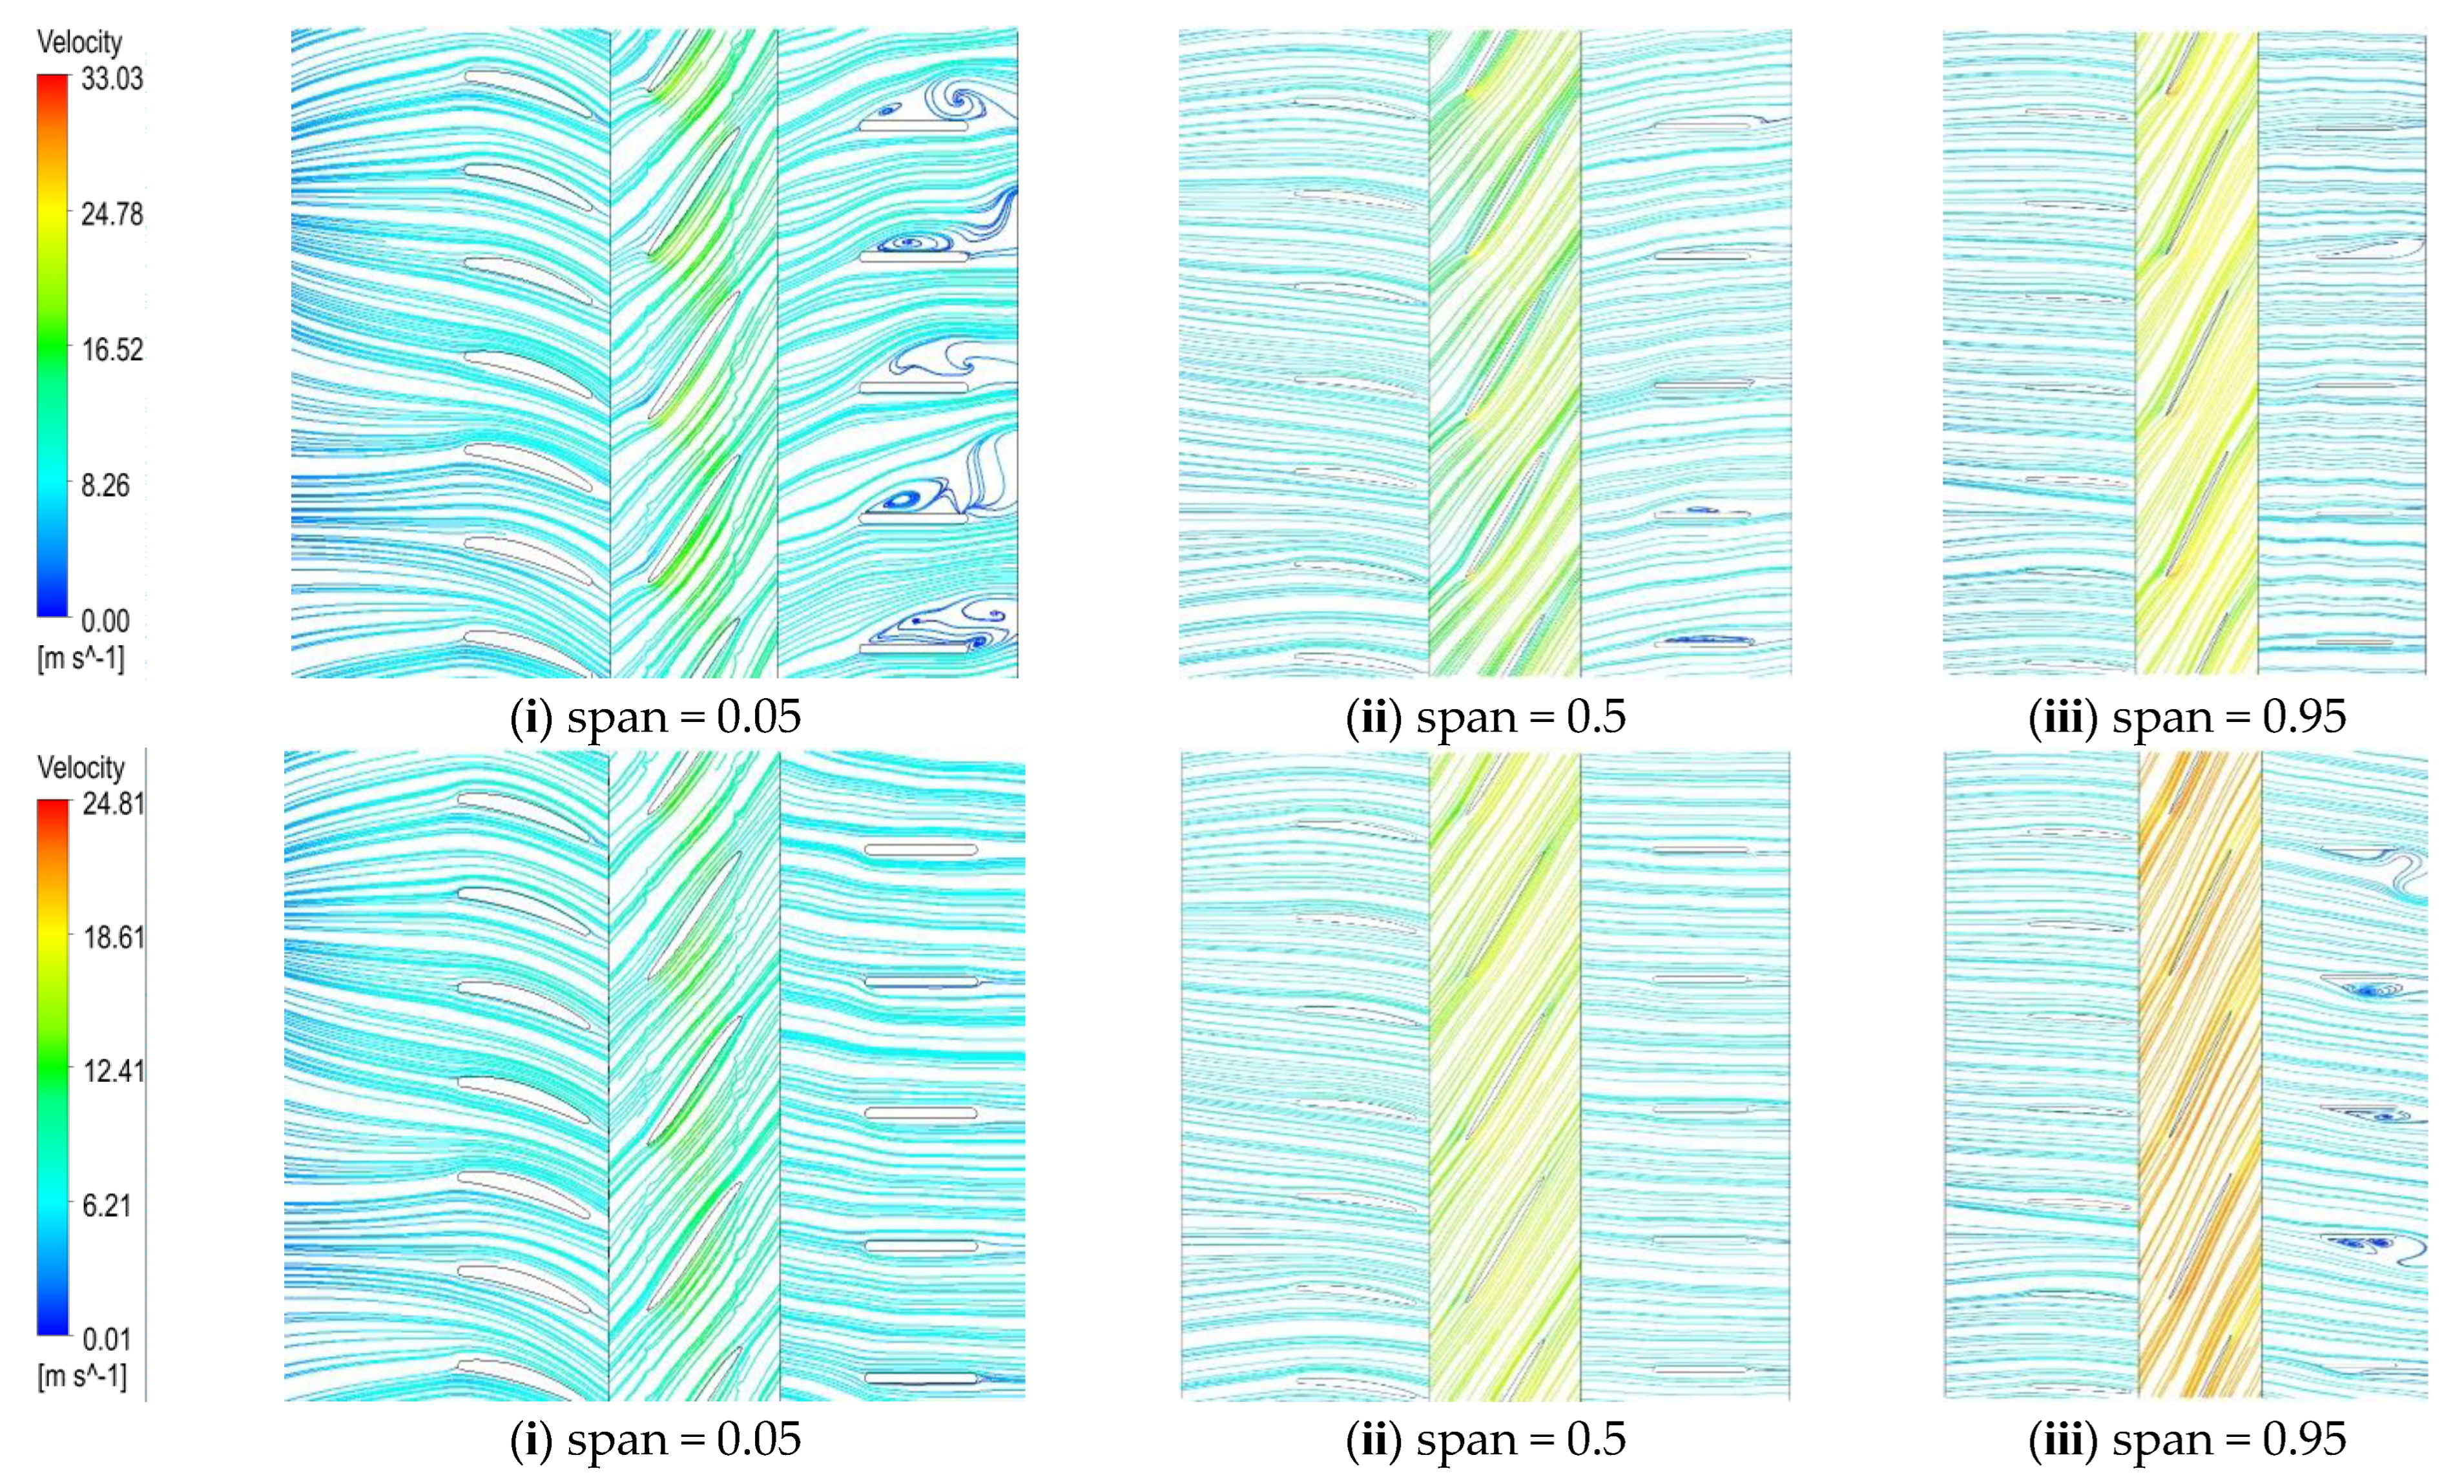
4.3. Flow between Ye Shan

For studying the pressure coefficient distribution along the blade at different blade heights in the runner chamber and the flow velocity distribution in the impeller and guide vane areas, three annular sections with different blade heights were chosen from the hub to the rim in the runner and guide vane areas. The span values were 0.05, 0.2, and 0.95, representing near the hub, the mid-section of the blade, and near the rim, respectively, as shown in Figure 13.
Figure 14 and Figure 15 are the distribution diagrams of the pressure coefficients at different blade heights under pump and turbine conditions, respectively. The horizontal axis Z represents the distance along the axis, and the vertical axis Cp represents the pressure pulsation coefficient. Considering that the four runner blades of the research object in this paper were exactly the same, only the data on one blade were selected for separate study when considering the pressure coefficient distribution at different blade heights. In the figure, except for small flow conditions, when operating near the design flow, the pressure coefficients at different blade heights were basically the same along the blade distribution trend. With the increase in the span value from the hub to the rim, the pressure coefficient also increased, and under the small flow rate condition, the distribution curve of the pressure coefficient Cp at different blade heights changed greatly, indicating that the change in flow had a larger influence on the flow field. When the flow rate was low, the flow state of the internal flow field was poor, the energy loss was serious, and there were even de-flow and backflow phenomena at the blade. Therefore, the pressure coefficient curve along the blade surface changed greatly.
When operating under the turbine condition, as shown in Figure 15, under a different flow condition, the distribution trends of the pressure coefficient Cp curves at different blade heights were consistent. Under low flow conditions, the overall distribution of the pressure coefficient Cp near the rim was higher than that at the hub and the middle of the blade. As the flow rate increased, the value of the blade surface pressure coefficient Cp also decreased, indicating that under the design flow condition, the pressure variation on the entire blade was small, and the flow state was more stable at this time.
We found that under the pump condition and turbine condition, the variation trend of the pressure coefficient distribution curve on the blade surface was basically the same, and the value of the pressure coefficient Cp decreased with the increase in the flow rate.
We expanded the annular cross-sections divided according to different leaf height values to obtain the velocity streamline distribution diagrams, which are shown in Figure 16 and Figure 17. Figure 16 is the velocity streamline distribution diagram under the pump condition, and Figure 13b is the velocity streamline distribution diagram under the turbine condition. From left to right are the velocity streamlines at the hub, the middle of the blade, and the rim, corresponding to span values of 0.05, 0.5, and 0.95, respectively. It can be seen from the figure that the velocity curves in the runner chamber are uniformly distributed on different annular sections, except for the small flow condition of forward running. Under the condition of small flow, it can be clearly seen that the streamline distribution on different annular sections was sparse and irregular, and there was a local backflow phenomenon at the inlet of the blade, indicating that the flow state was poor at this time. Under large flow conditions, from the inlet of the front guide vane to the outlet of the movable guide vane, the streamline distribution was uniform on the annular section, corresponding to different span values; there was also a local backflow phenomenon on the section of the blade. The backflow area mainly occurred at the outlet of the guide vane, which deviated from the runner chamber. The streamline distribution in the middle section of the blade was quite uniform, and the flow state was better while the operating flow was 0.8 times the design flow. When operating under working conditions, there was a backflow phenomenon between the movable guide vanes at different sections, the streamline became uneven, and the flow pattern deteriorated. When the operating flow was in the small flow range, the guide vane section and the runner section both experienced the backflow phenomenon, and the streamline distribution was irregular and uneven, indicating that the flow pattern had become poor. Therefore, avoiding the small flow range operation will protect the overcurrent components of the unit, and it is also a necessary condition for the pump to operate safely and stably. As the span value increased, the speed value increased. That is, the closer to the rim, the greater the speed, and the closer to the hub, the lower the speed.
When operating under the turbine condition, as shown in Figure 17 that compared with the pump condition under the same flow rate, the flow state in the unit was better. The higher the number of blades, the better the combing effect of the overflowing water body, which improves the internal flow state and stabilizes the operation.
When running under the turbine condition and the pump condition, the change in speed was consistent with the change in the span value, and they all increased with the increase in the span value from the hub to the rim. The speed value changed constantly. When running at different flow rates, the streamlines on different annular sections in the runner chamber were evenly distributed. Under low flow conditions, the movable guide vanes had different degrees of backflow near the hub, indicating that when running at low flow rates, the flow of the flow regime was still relatively poor, and operation under low flow conditions should be avoided.

5. Conclusions

In this paper, the pressure pulsation at the inlet of the front guide vane and the outer edge of the inlet of the runner was measured by means of a real machine test when the axial flow pump was running under the design conditions. The pressure pulsations on the interface and the flow state of the runner chamber were compared, and the test results were used to verify the feasibility of the numerical simulation. At the same time, the external characteristic curve of the unit was also measured to verify the stability of its operation. In the future, if scientific research conditions allow, the model can be used to test the pressure pulsation value under reverse operation and the internal flow state of the pump unit under two-way operation, so as to better verify the reliability of the numerical simulation. The conclusions are as follows:
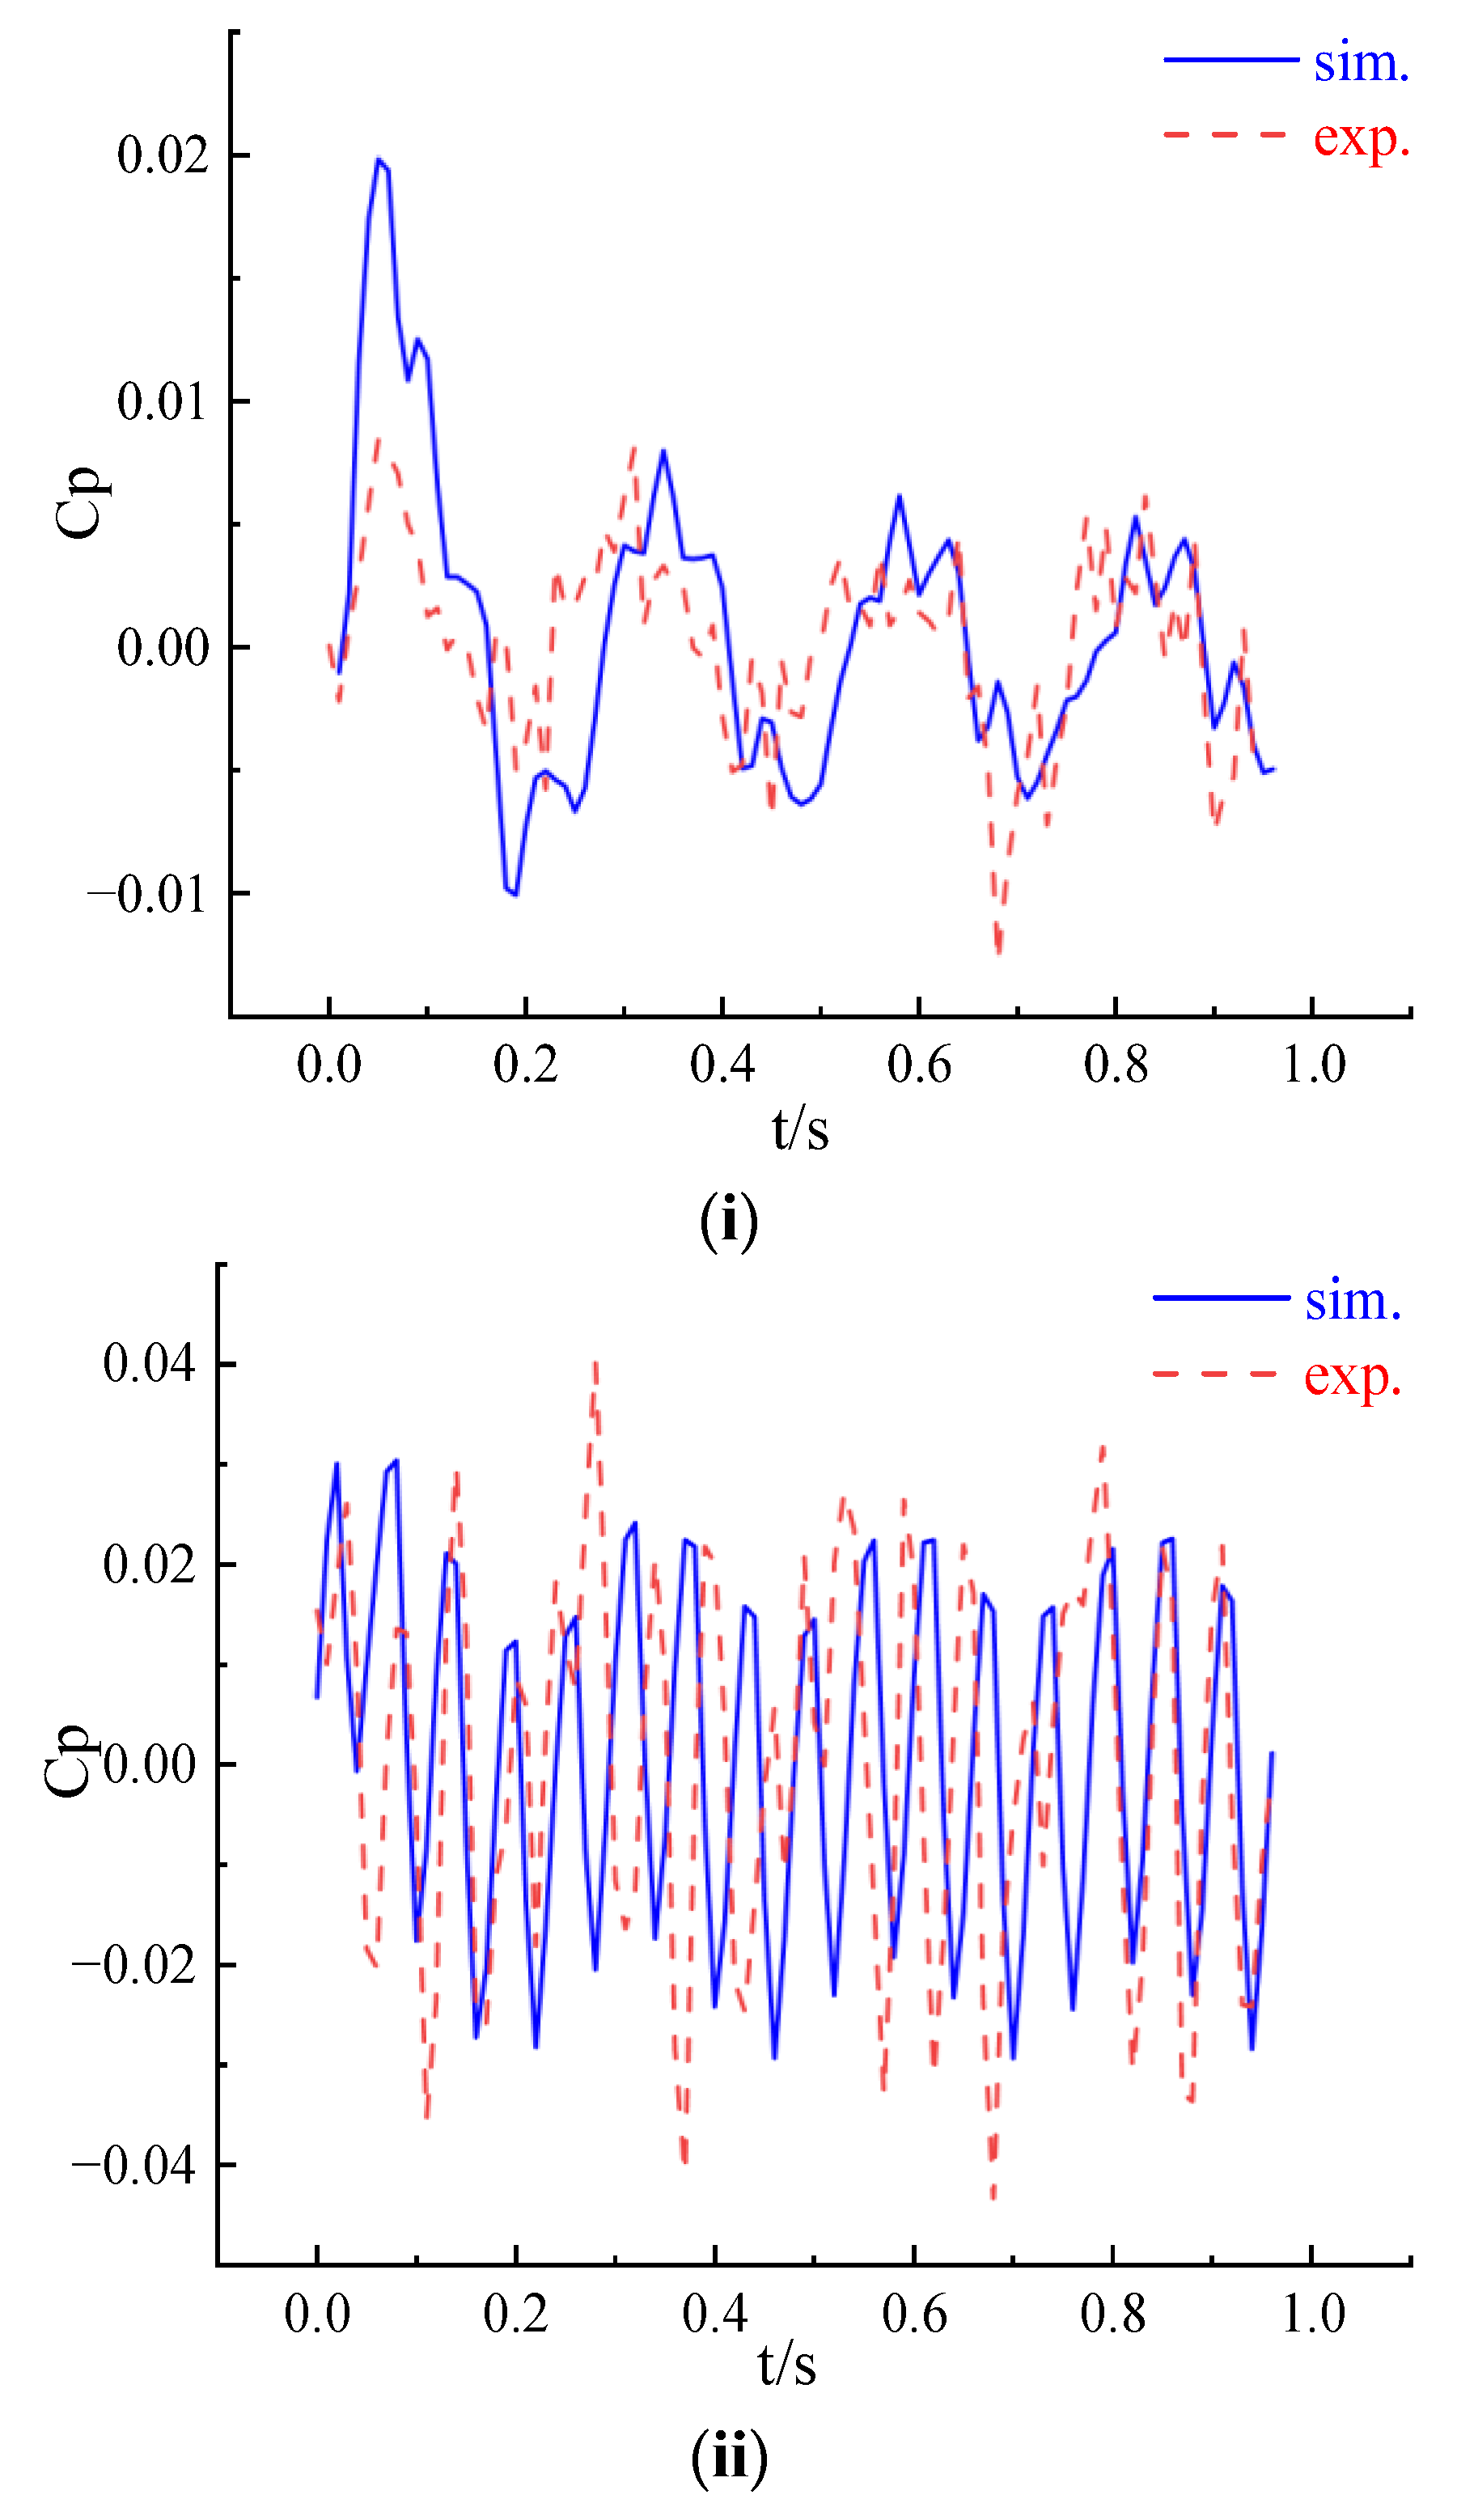
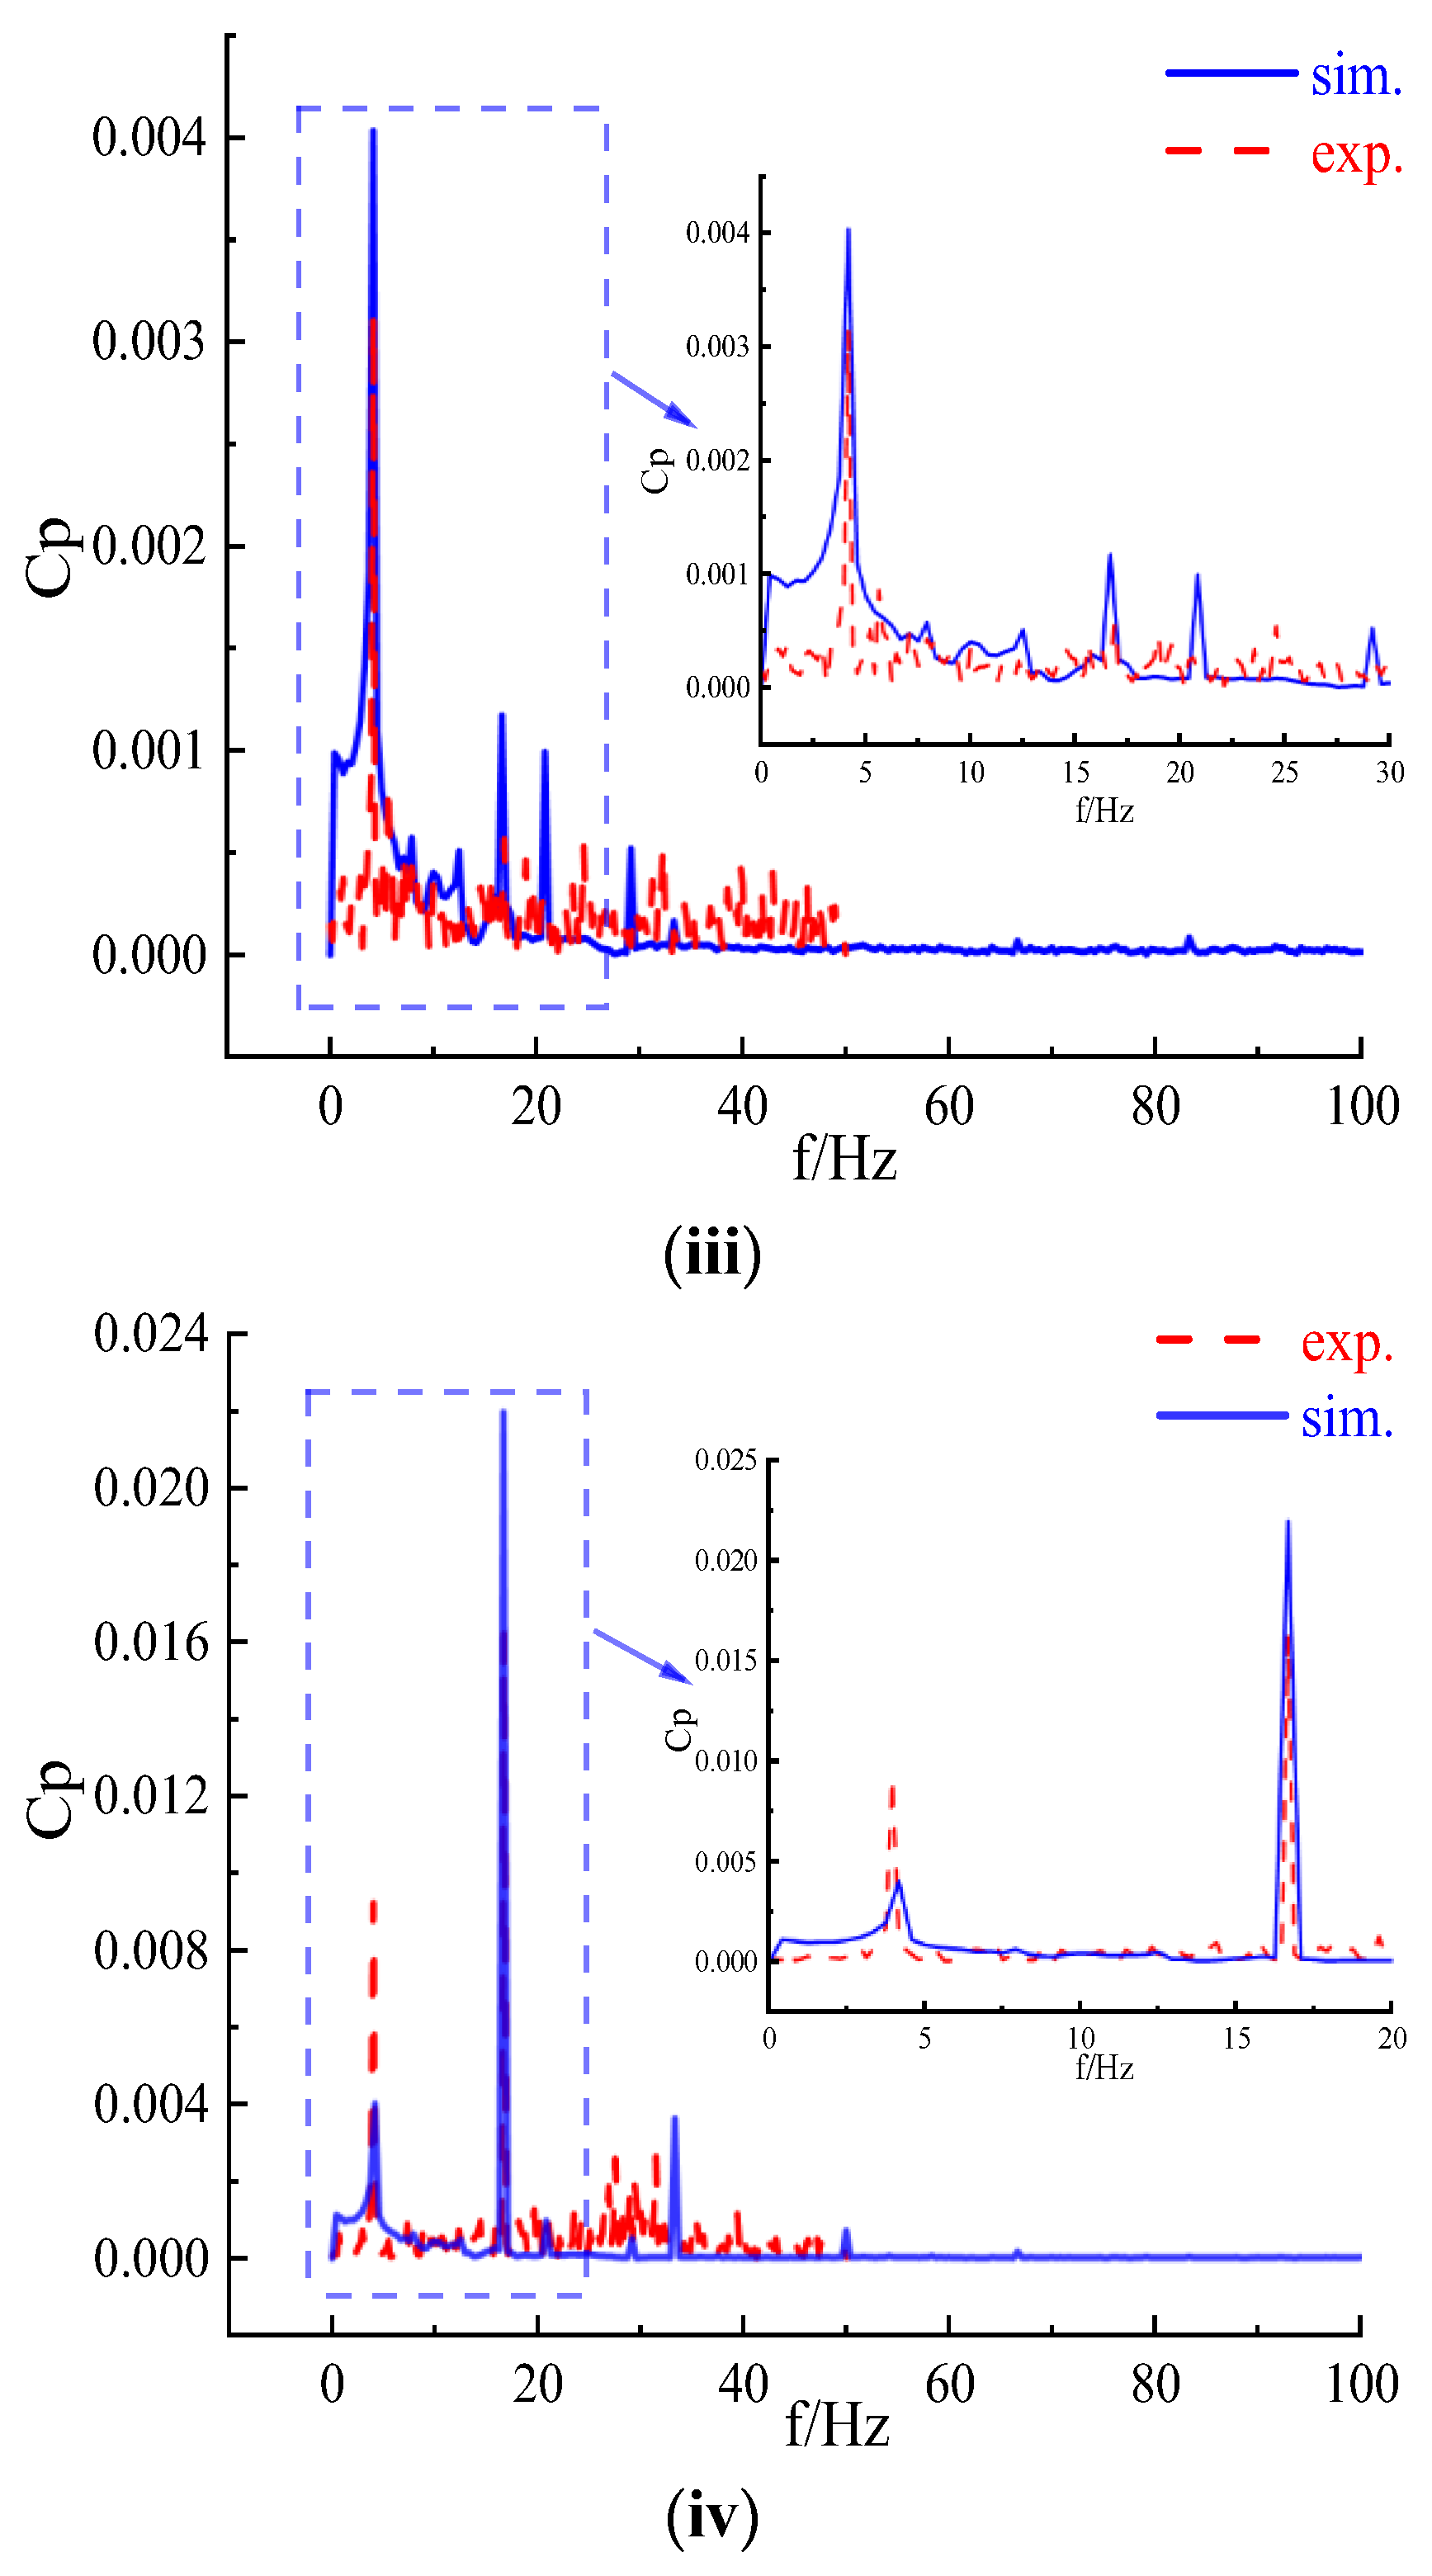
  • The external characteristic curve of the pump unit measured by the test was compared with the characteristic curve of the pump unit obtained by numerical simulation. Although there was a certain deviation at low flow, the error was within 3%, and the test value of the external characteristic curve and the simulated value were basically consistent, proving that the numerical simulation results using this model are credible. When running under the design flow conditions of the real machine test, the pressure pulsation at the inlet of the front guide vane and the inlet of the runner was measured, and the comparison with the numerical simulation monitoring value was also very consistent. The accuracy of the numerical simulation was fully demonstrated.
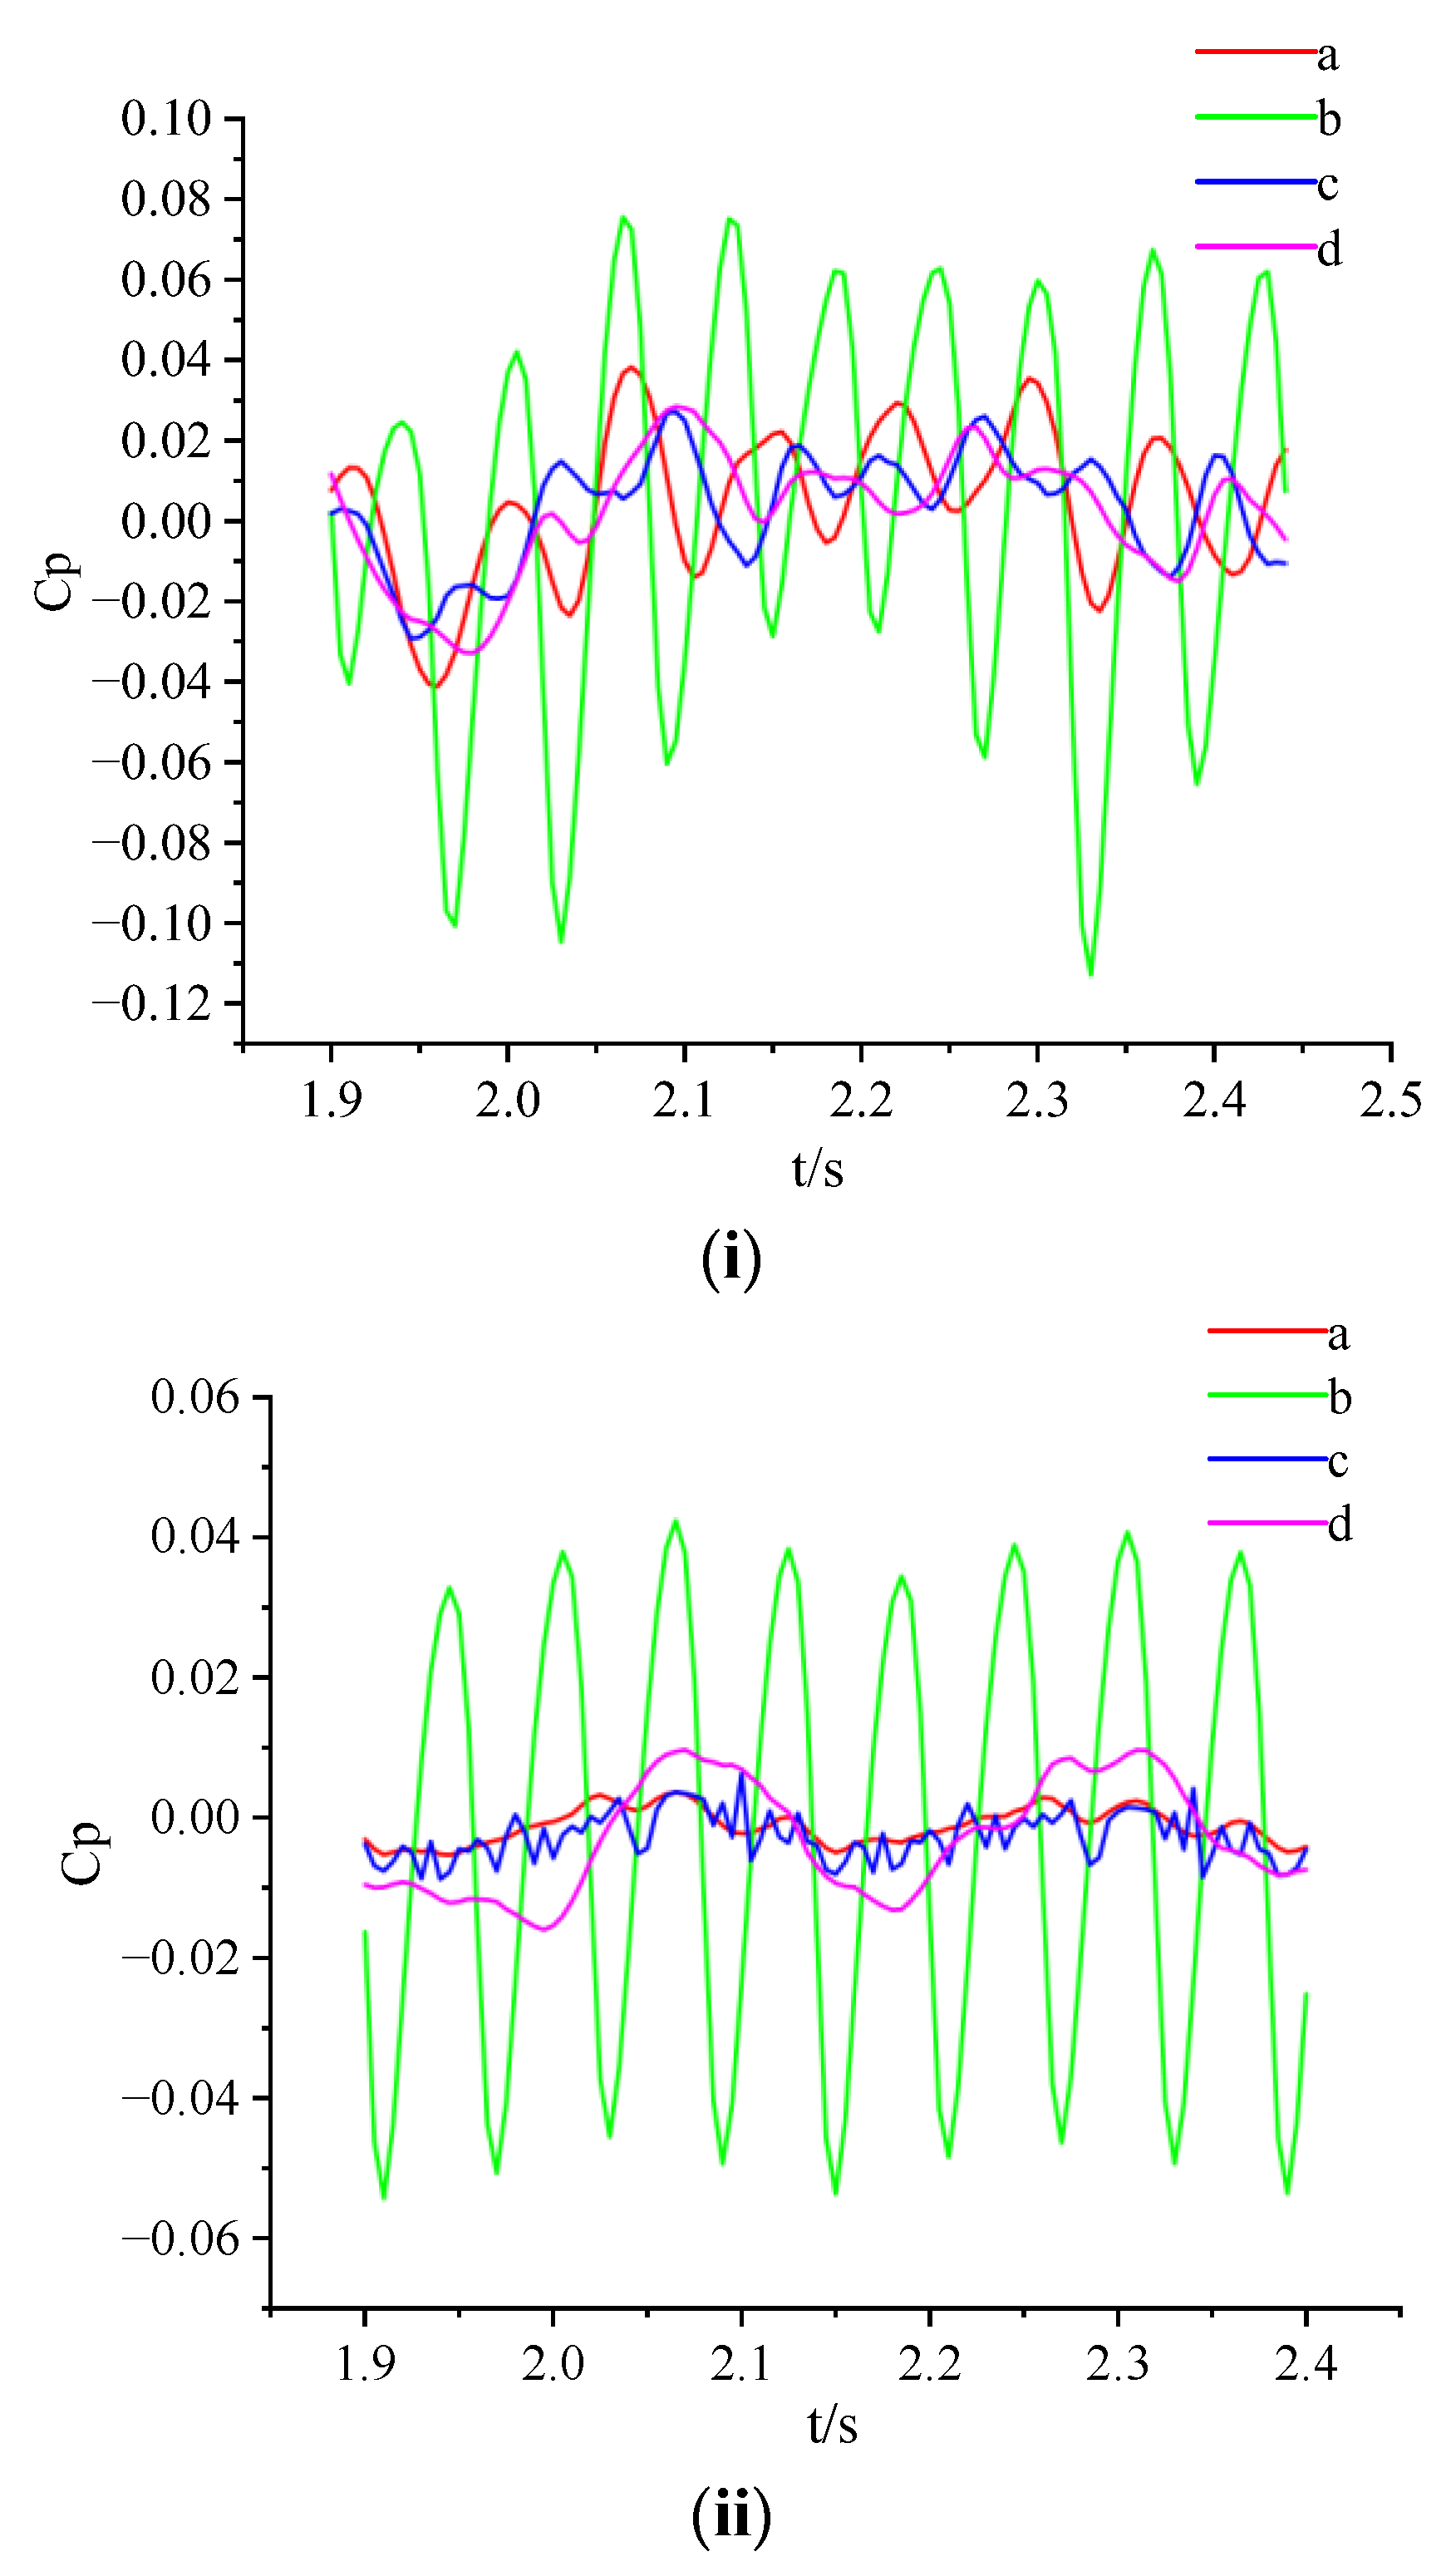
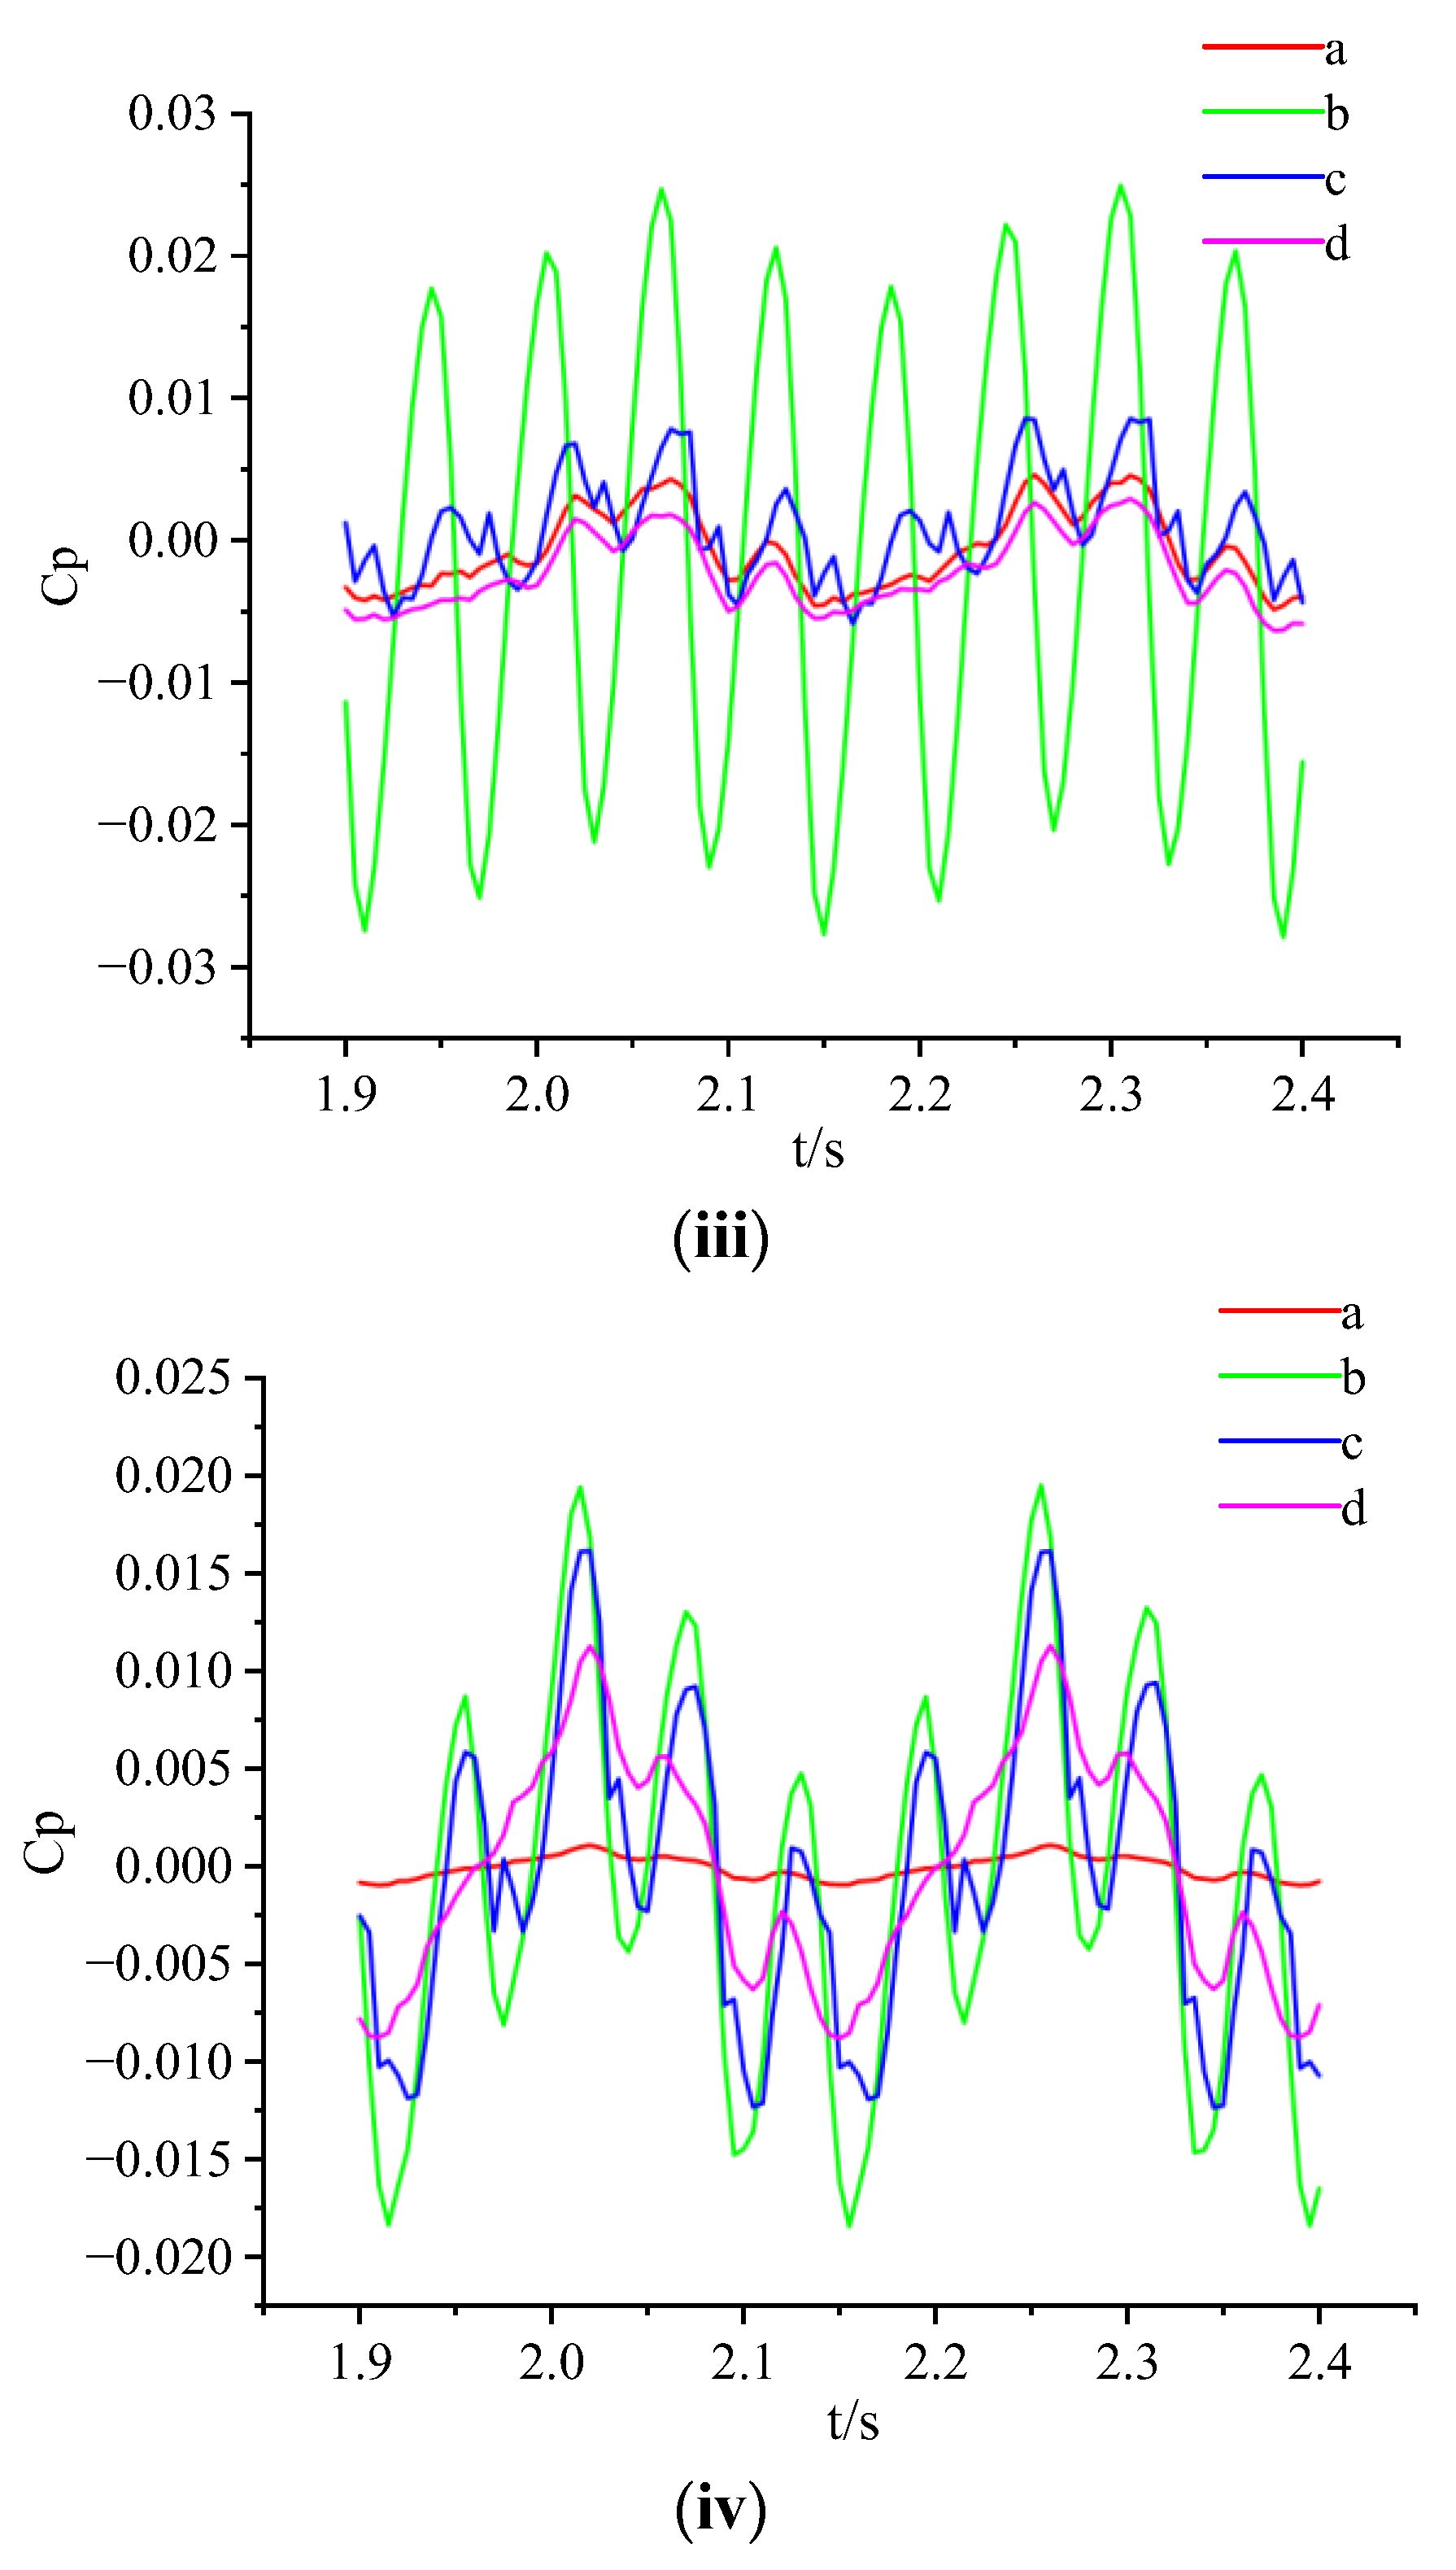
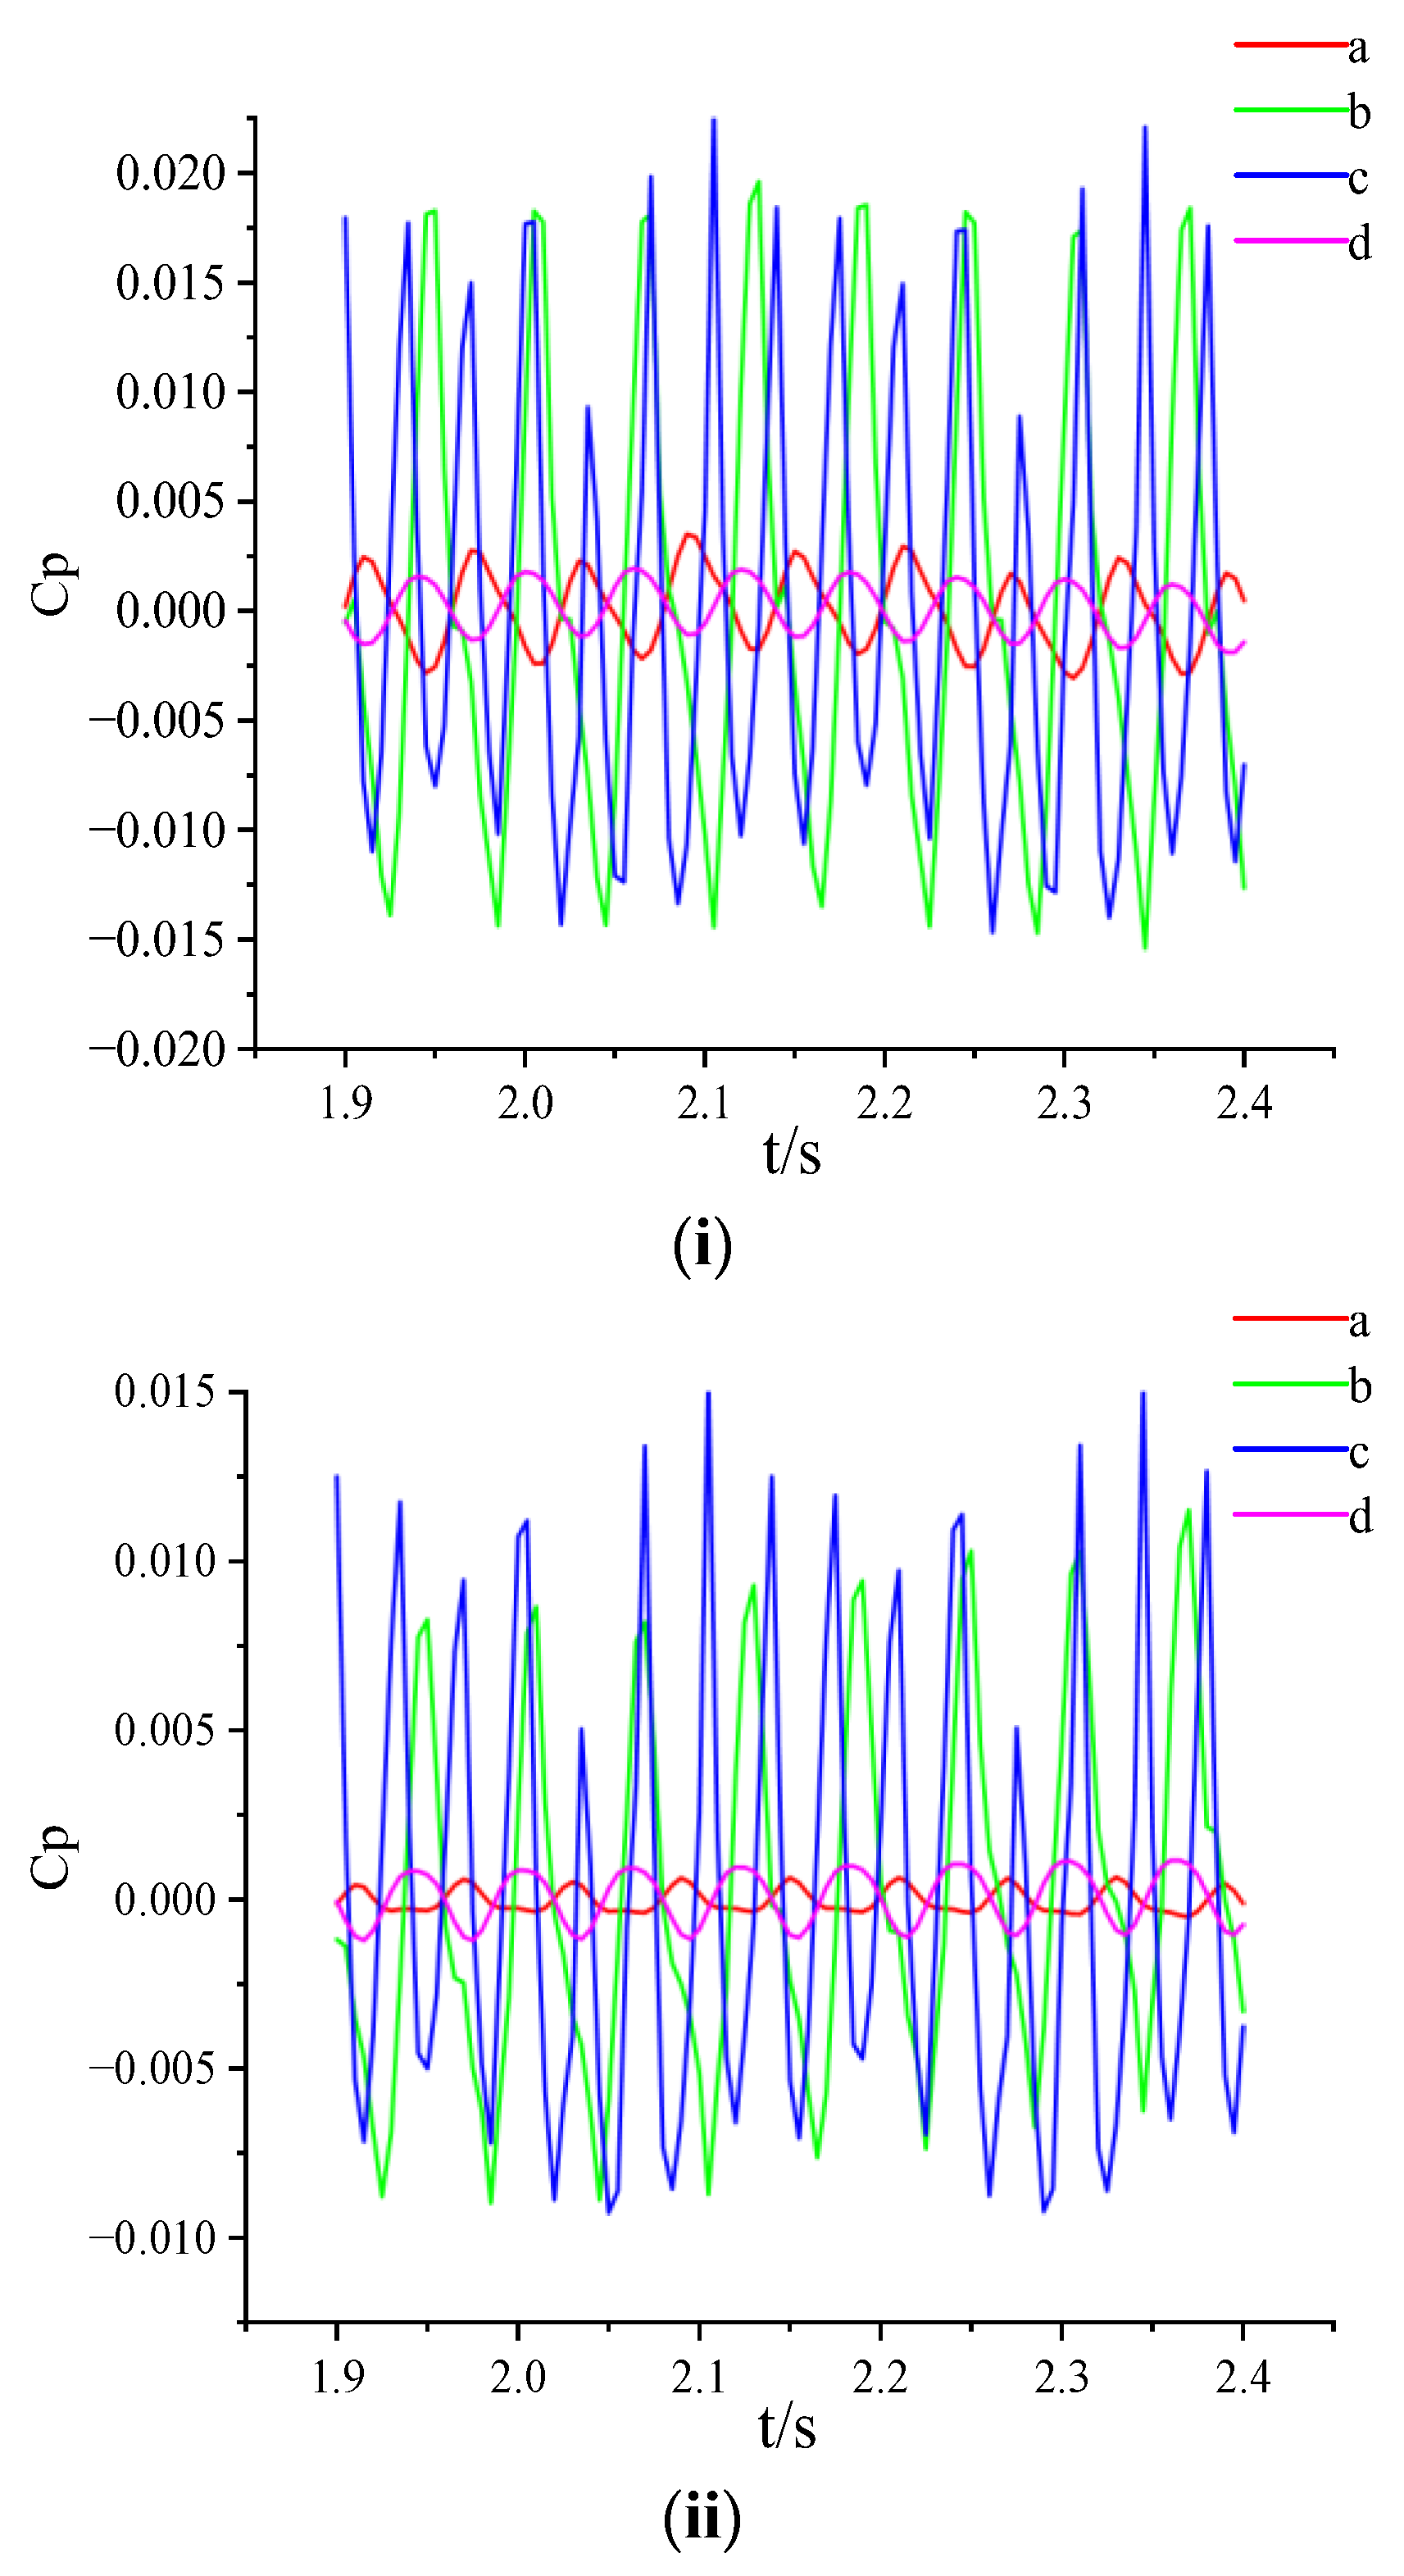
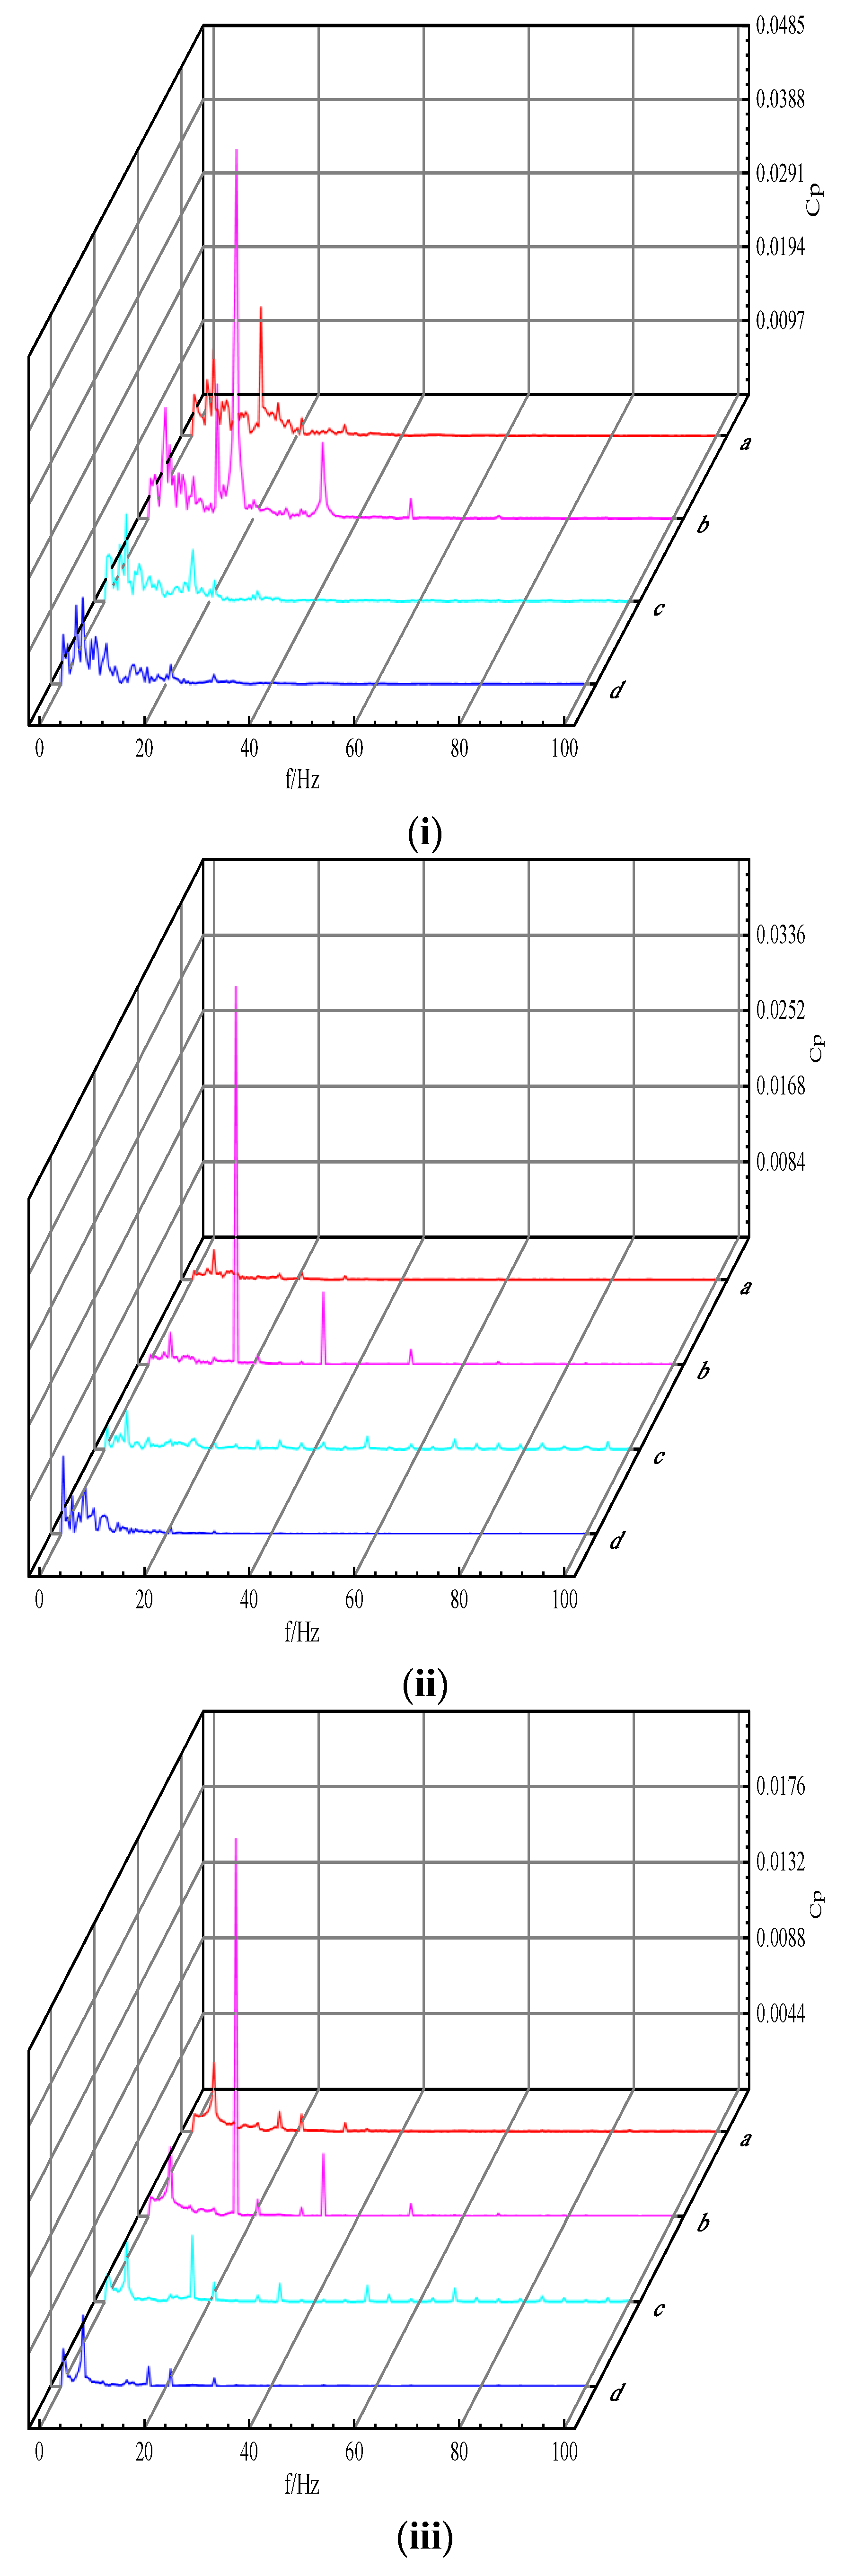
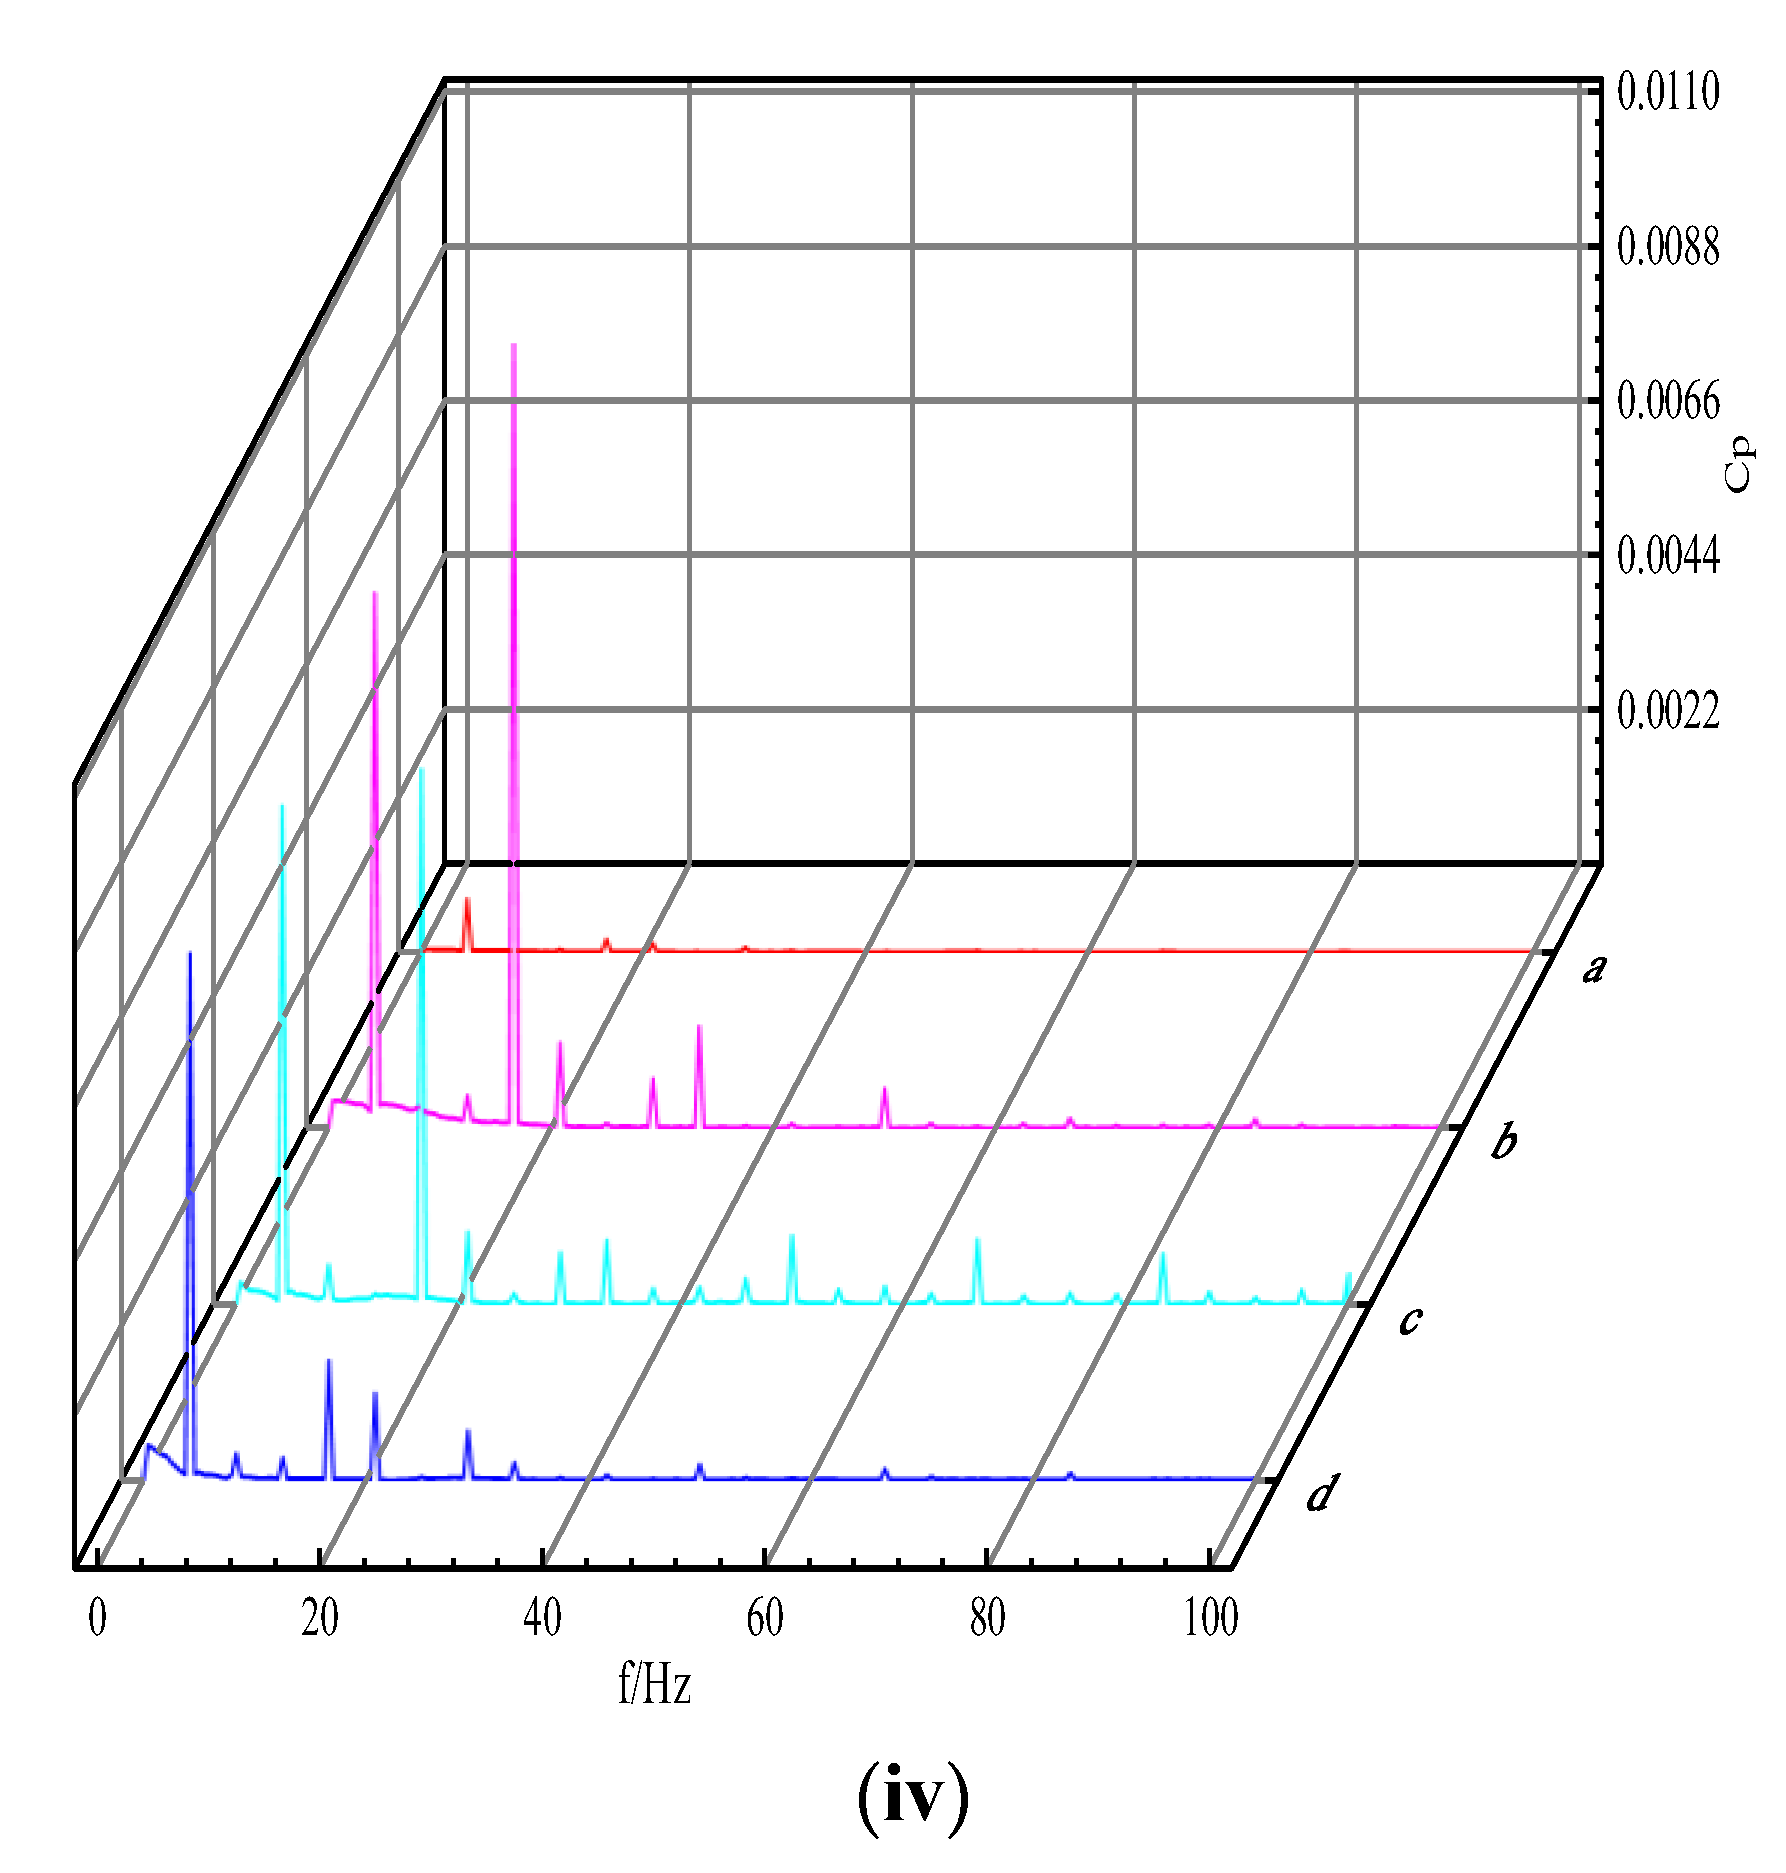
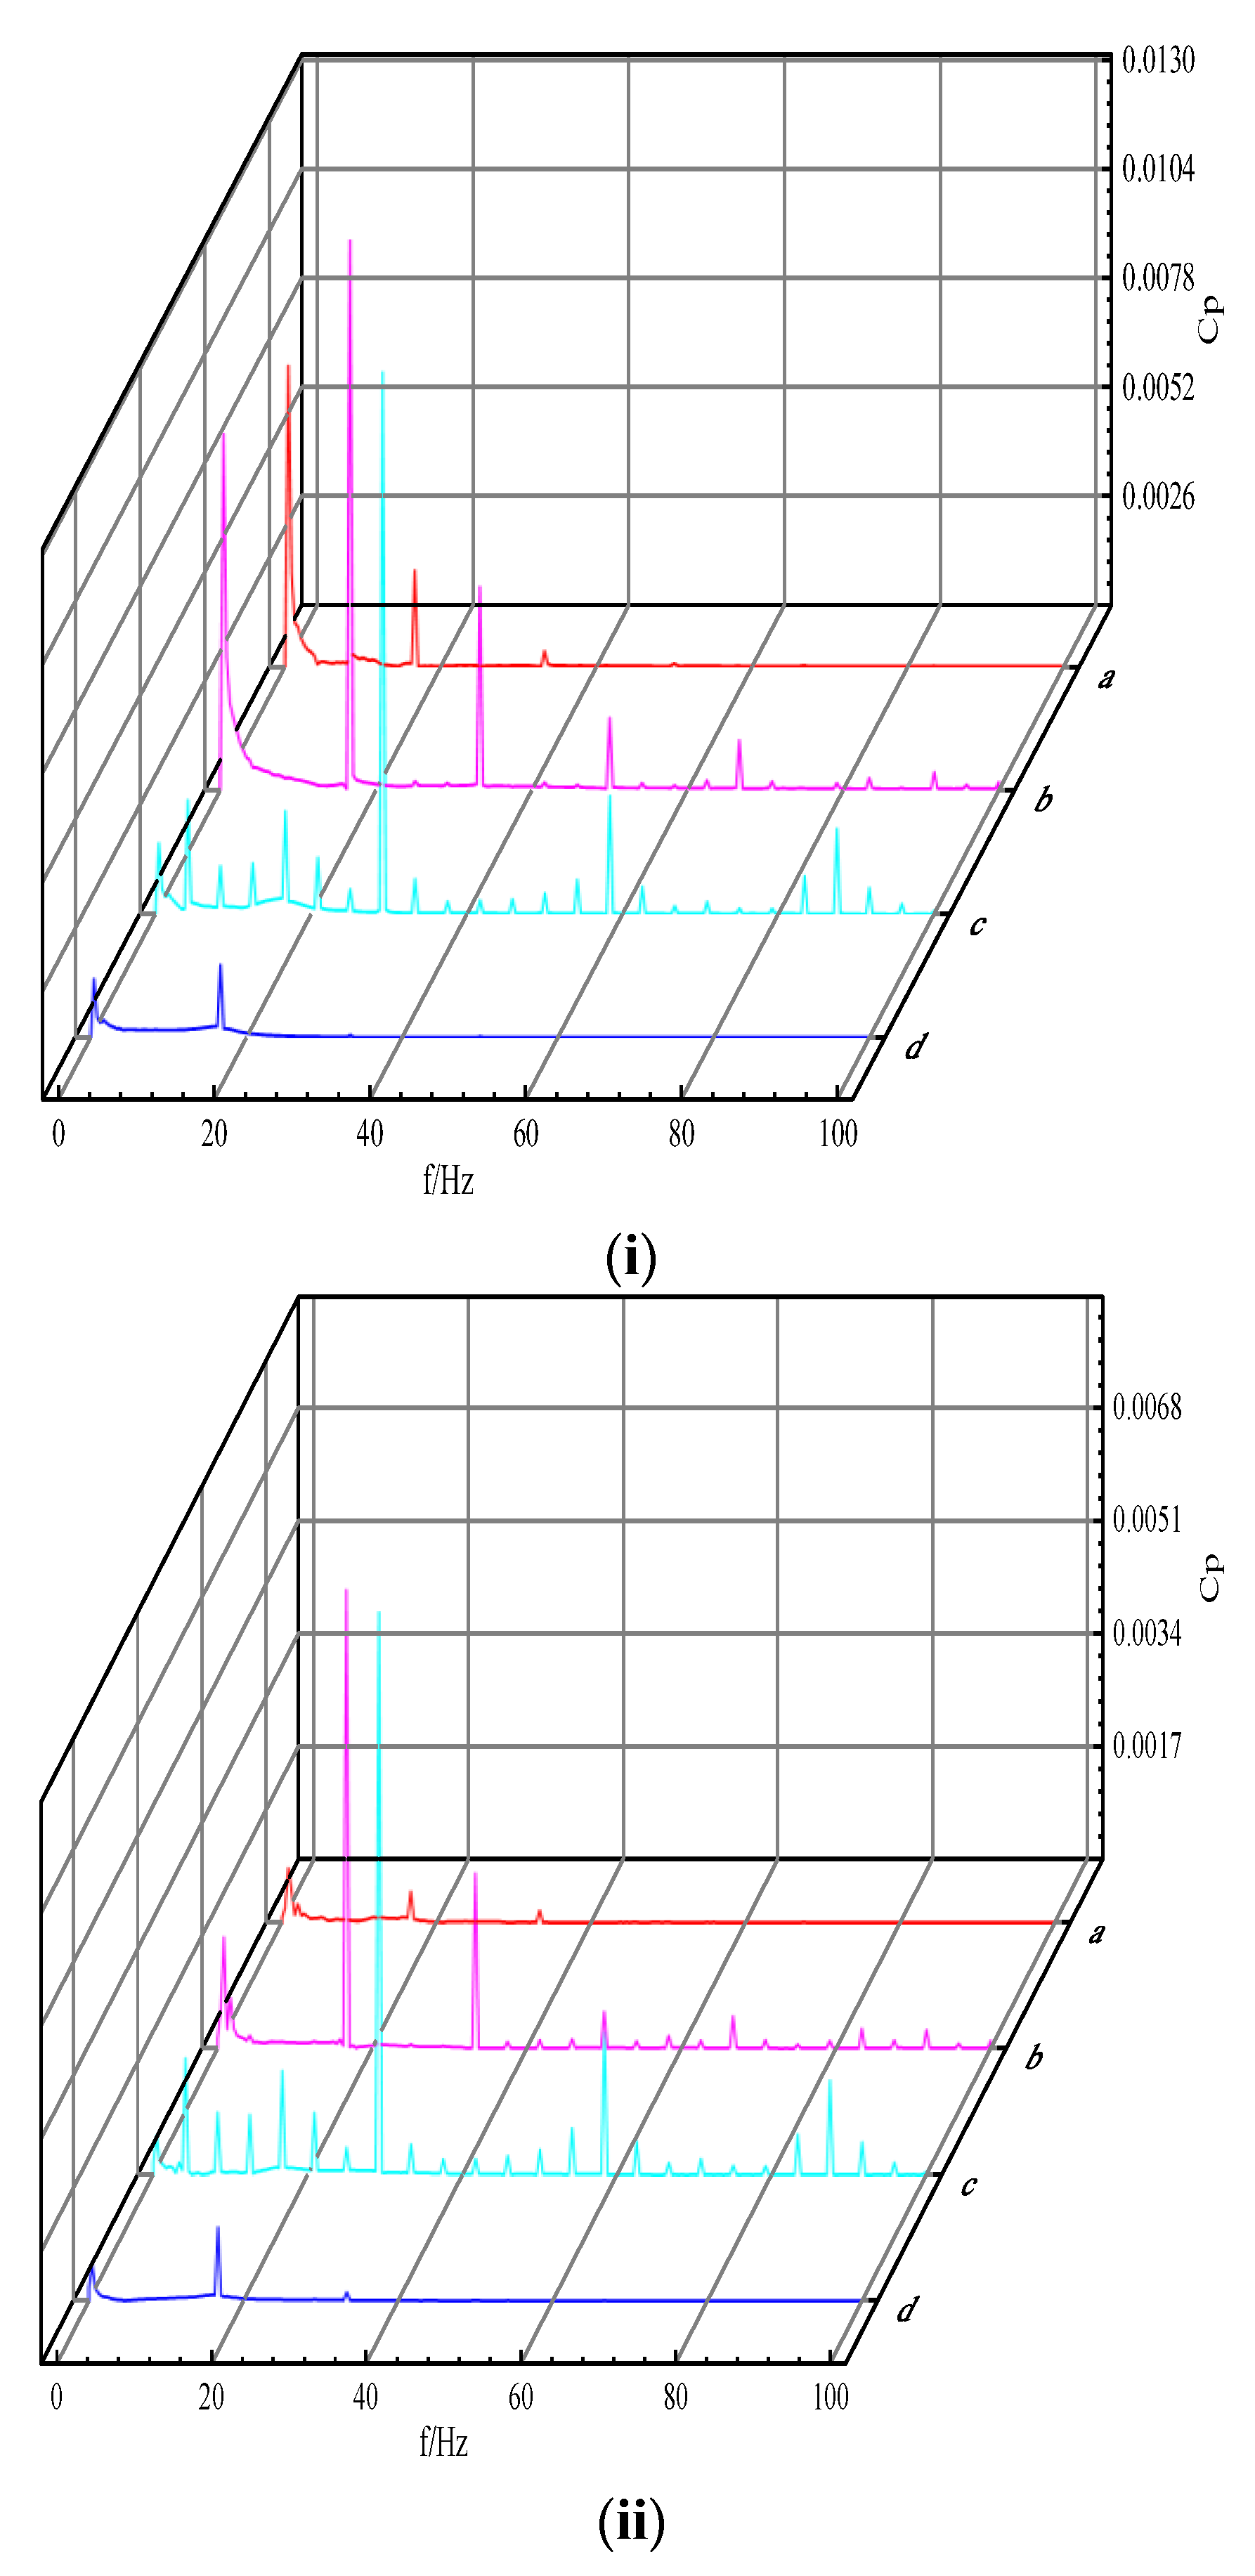
  • When the pump was running under the working condition, the amplitude of the pressure pulsation coefficient decreased with the increase in the flow rate. Under the same flow conditions, along the flow direction, the pressure pulsation coefficient had the largest amplitude and the largest change range at the inlet of the runner. There were four peaks and troughs in a single cycle, indicating that the change in the pressure pulsation was obviously affected by the dynamic and static interference. The periodic change law was closely related to the number of blades. When the flow rate was low, different degrees of the sub-frequency spectrum appeared in the low frequency band, indicating that the flow state was poor; when operating under the turbine condition, with the flow rate increasing, the amplitude of the pressure coefficient also decreased.
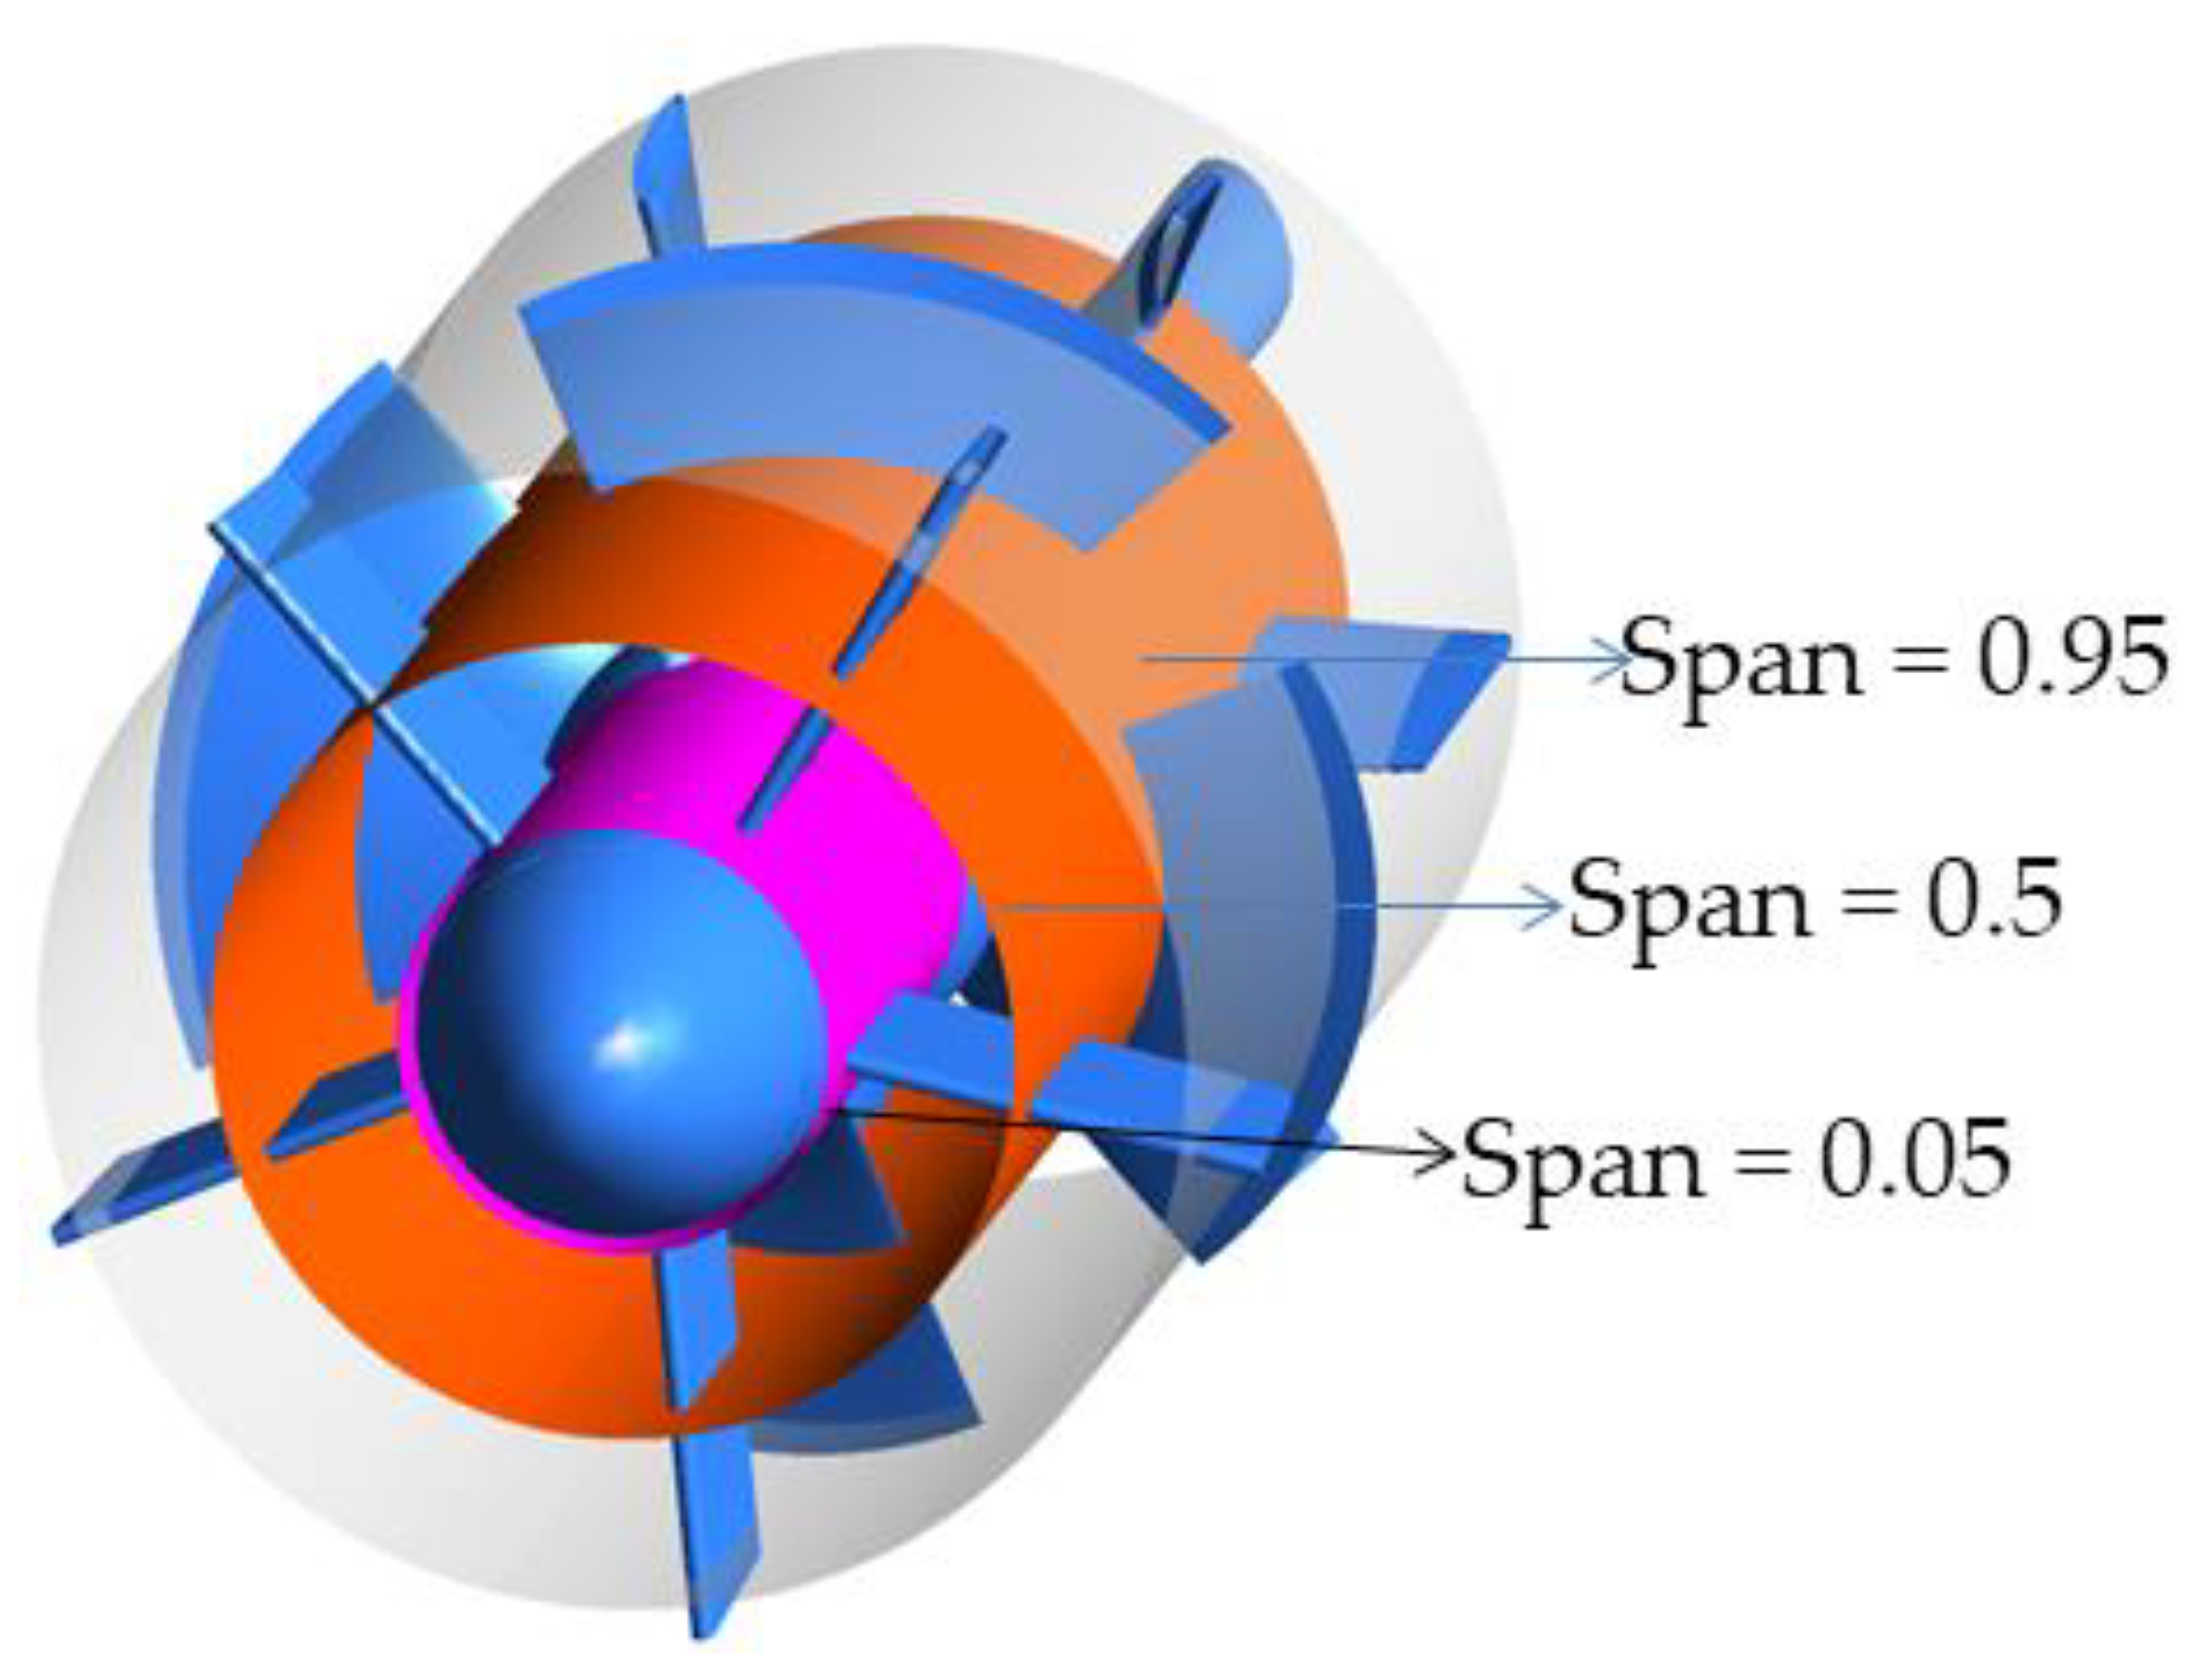
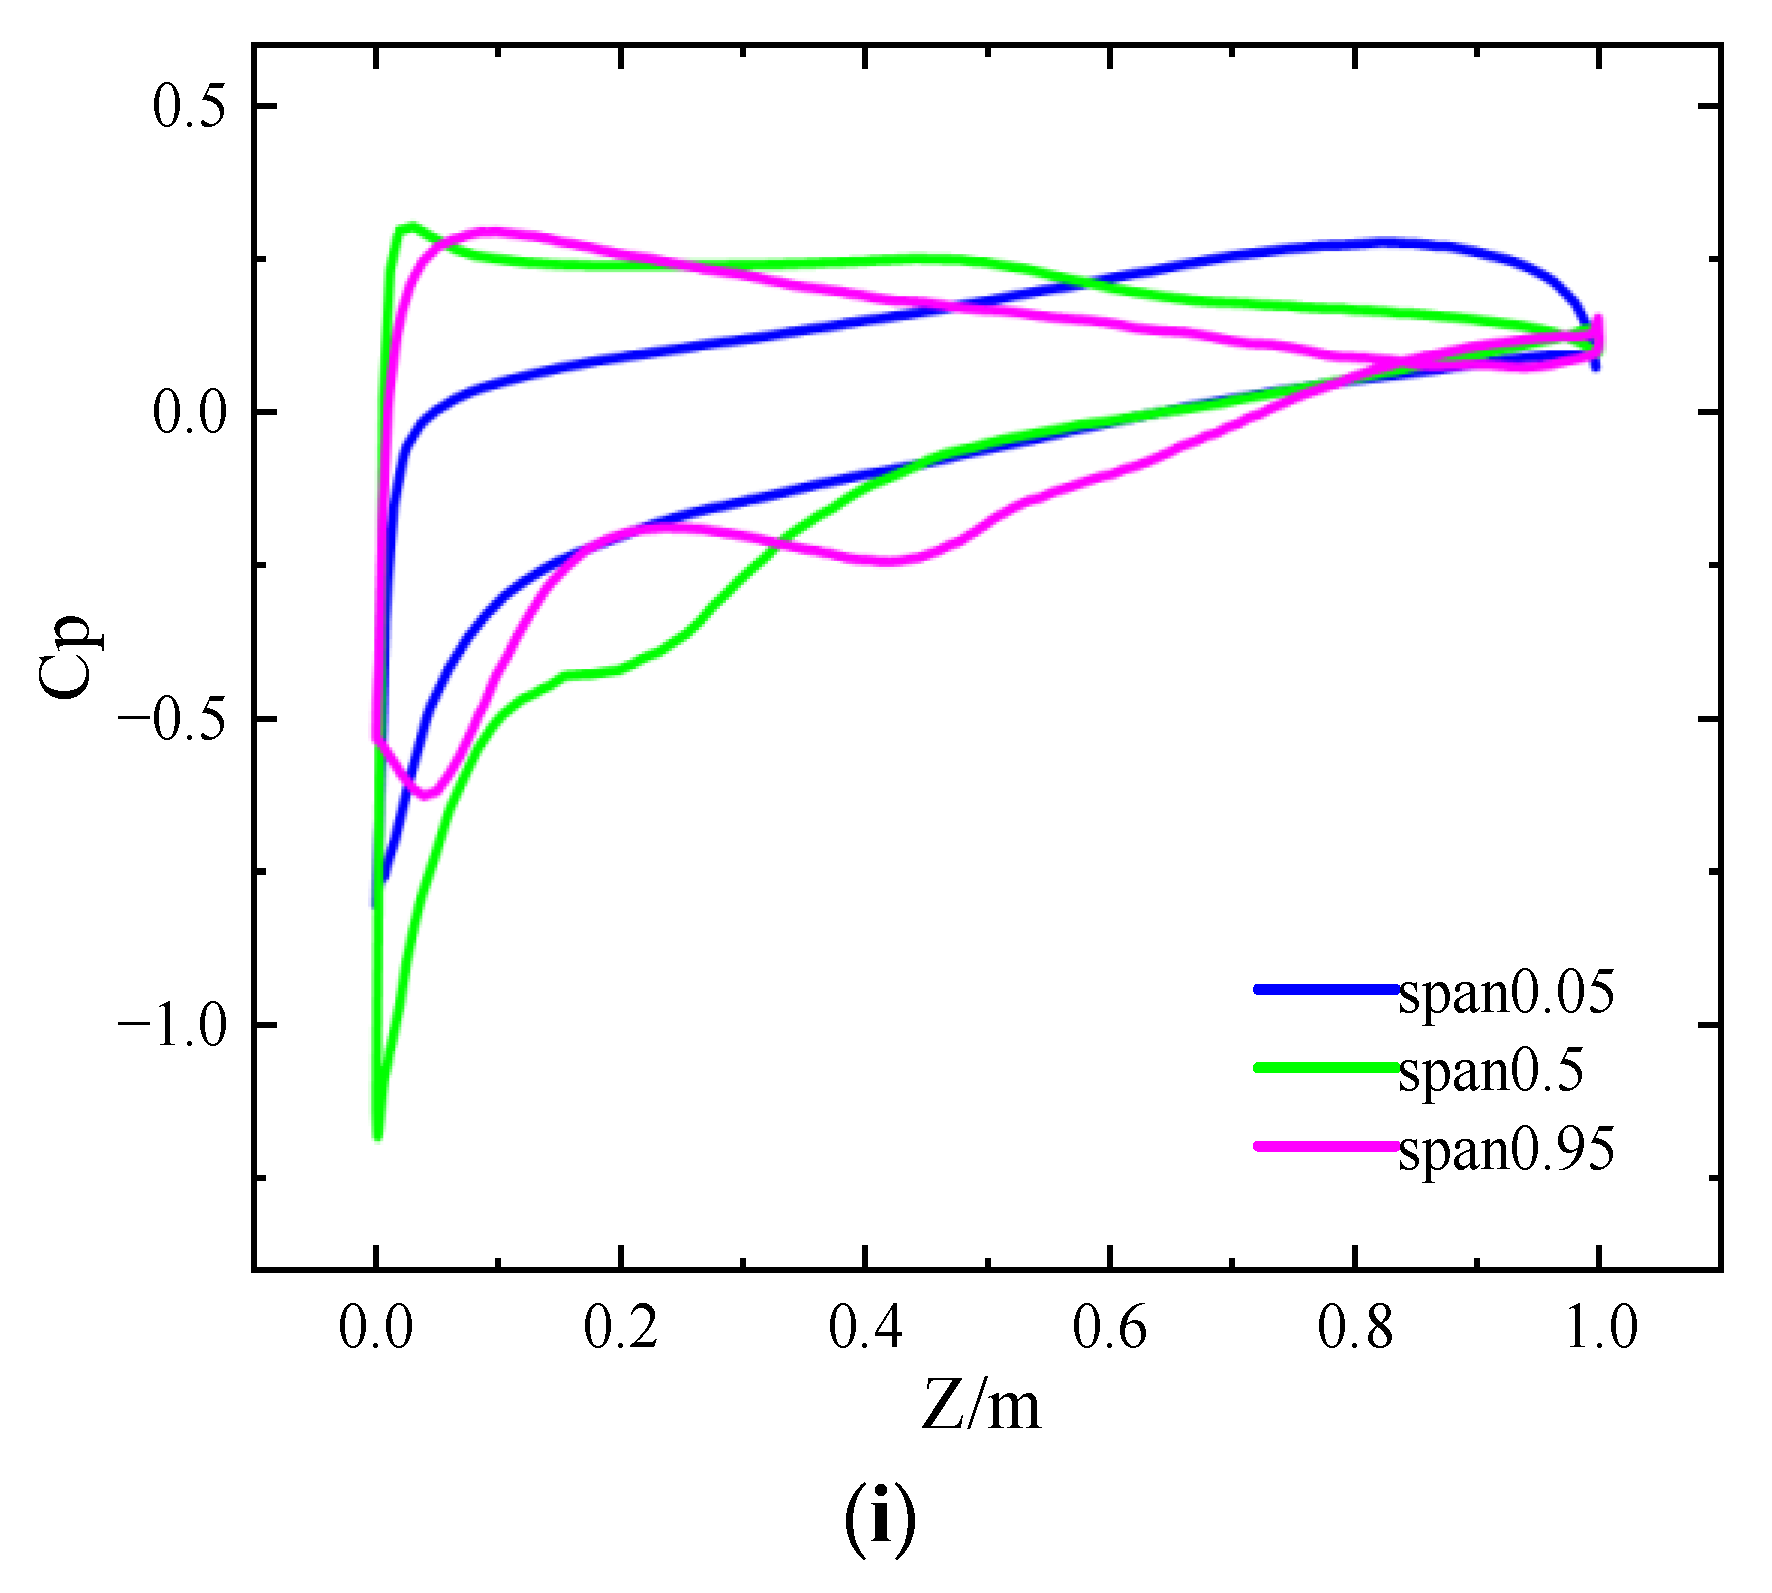
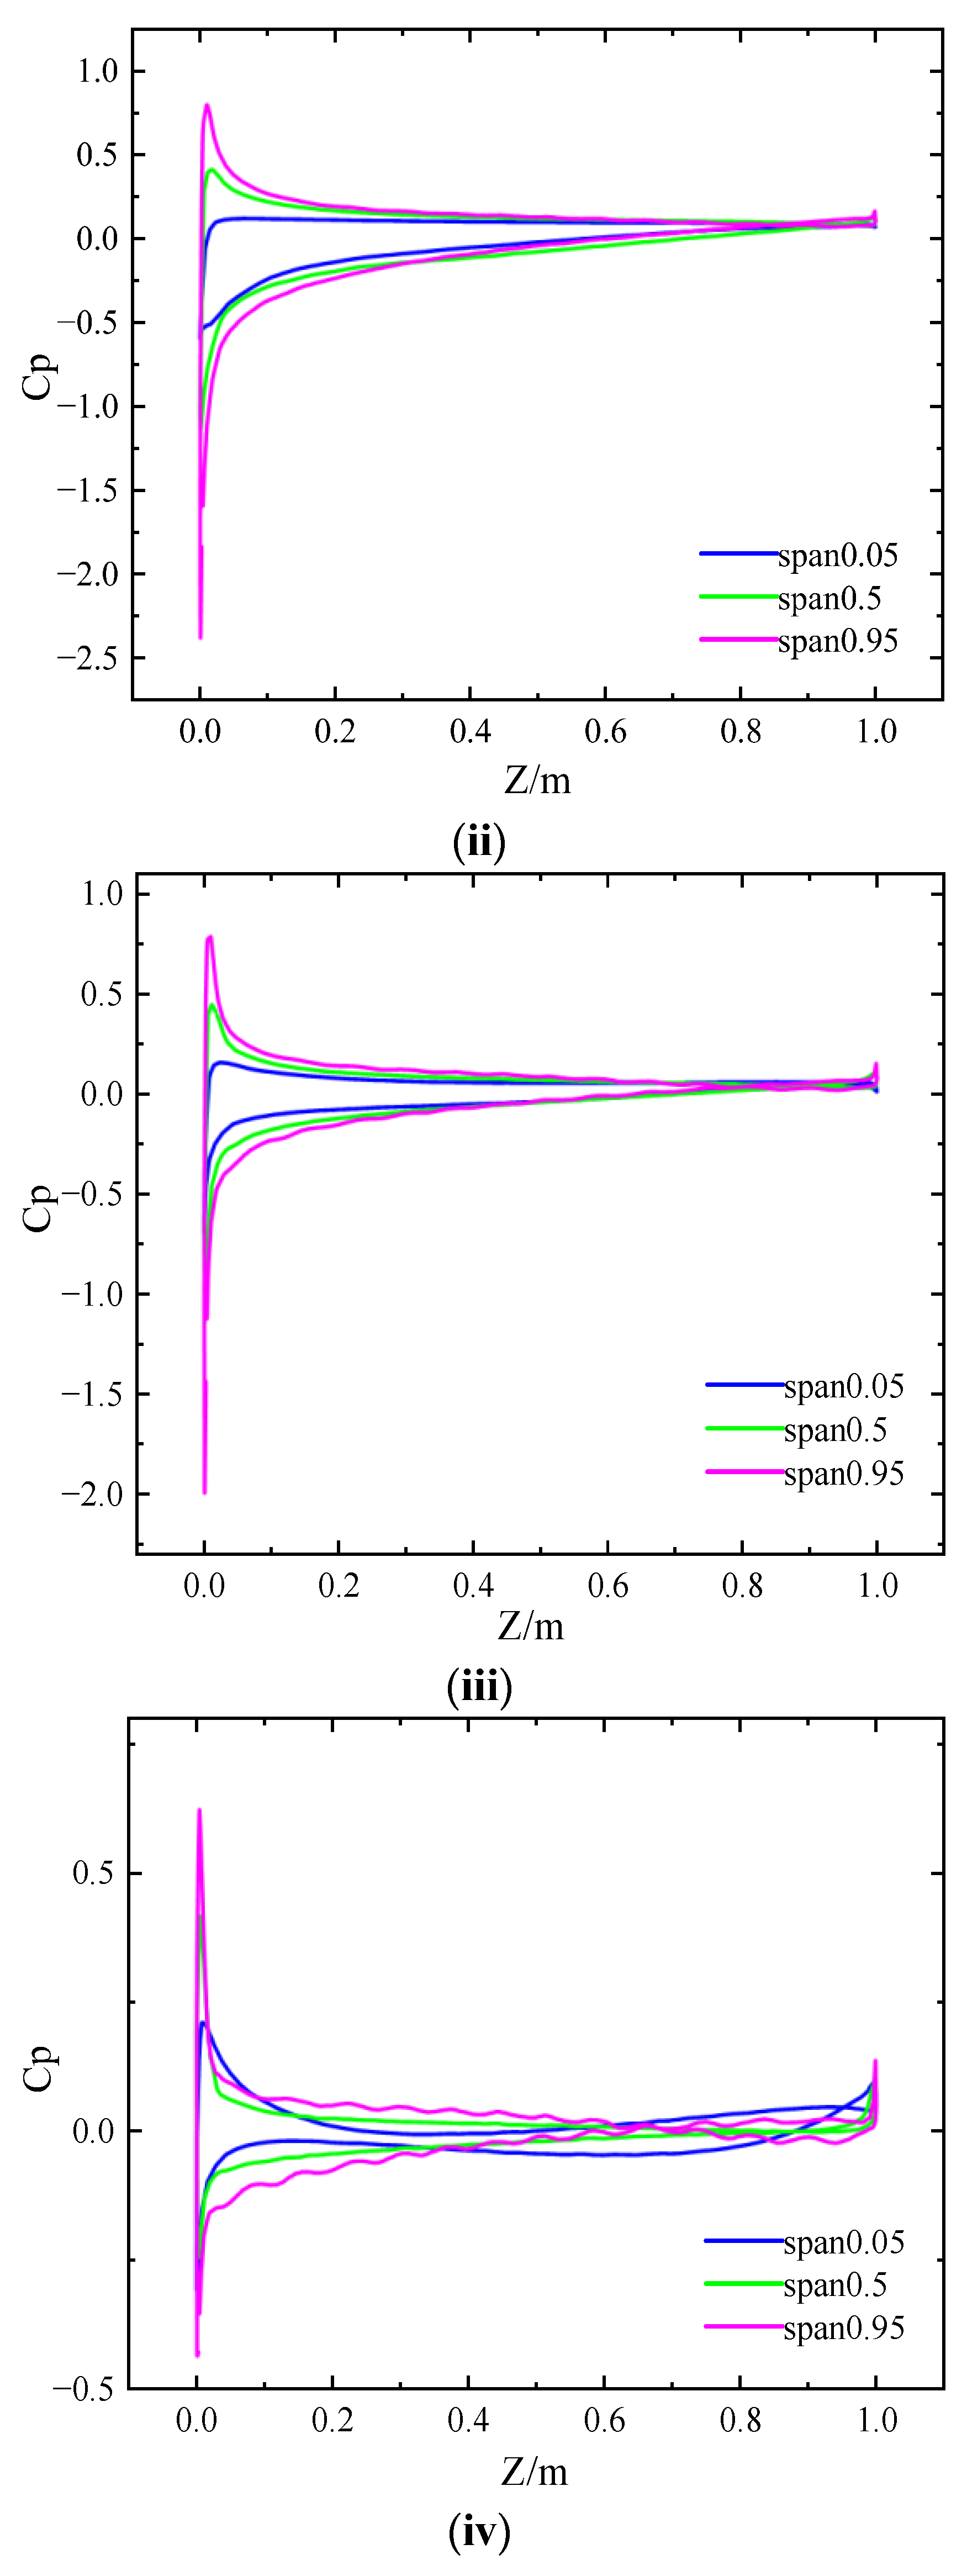
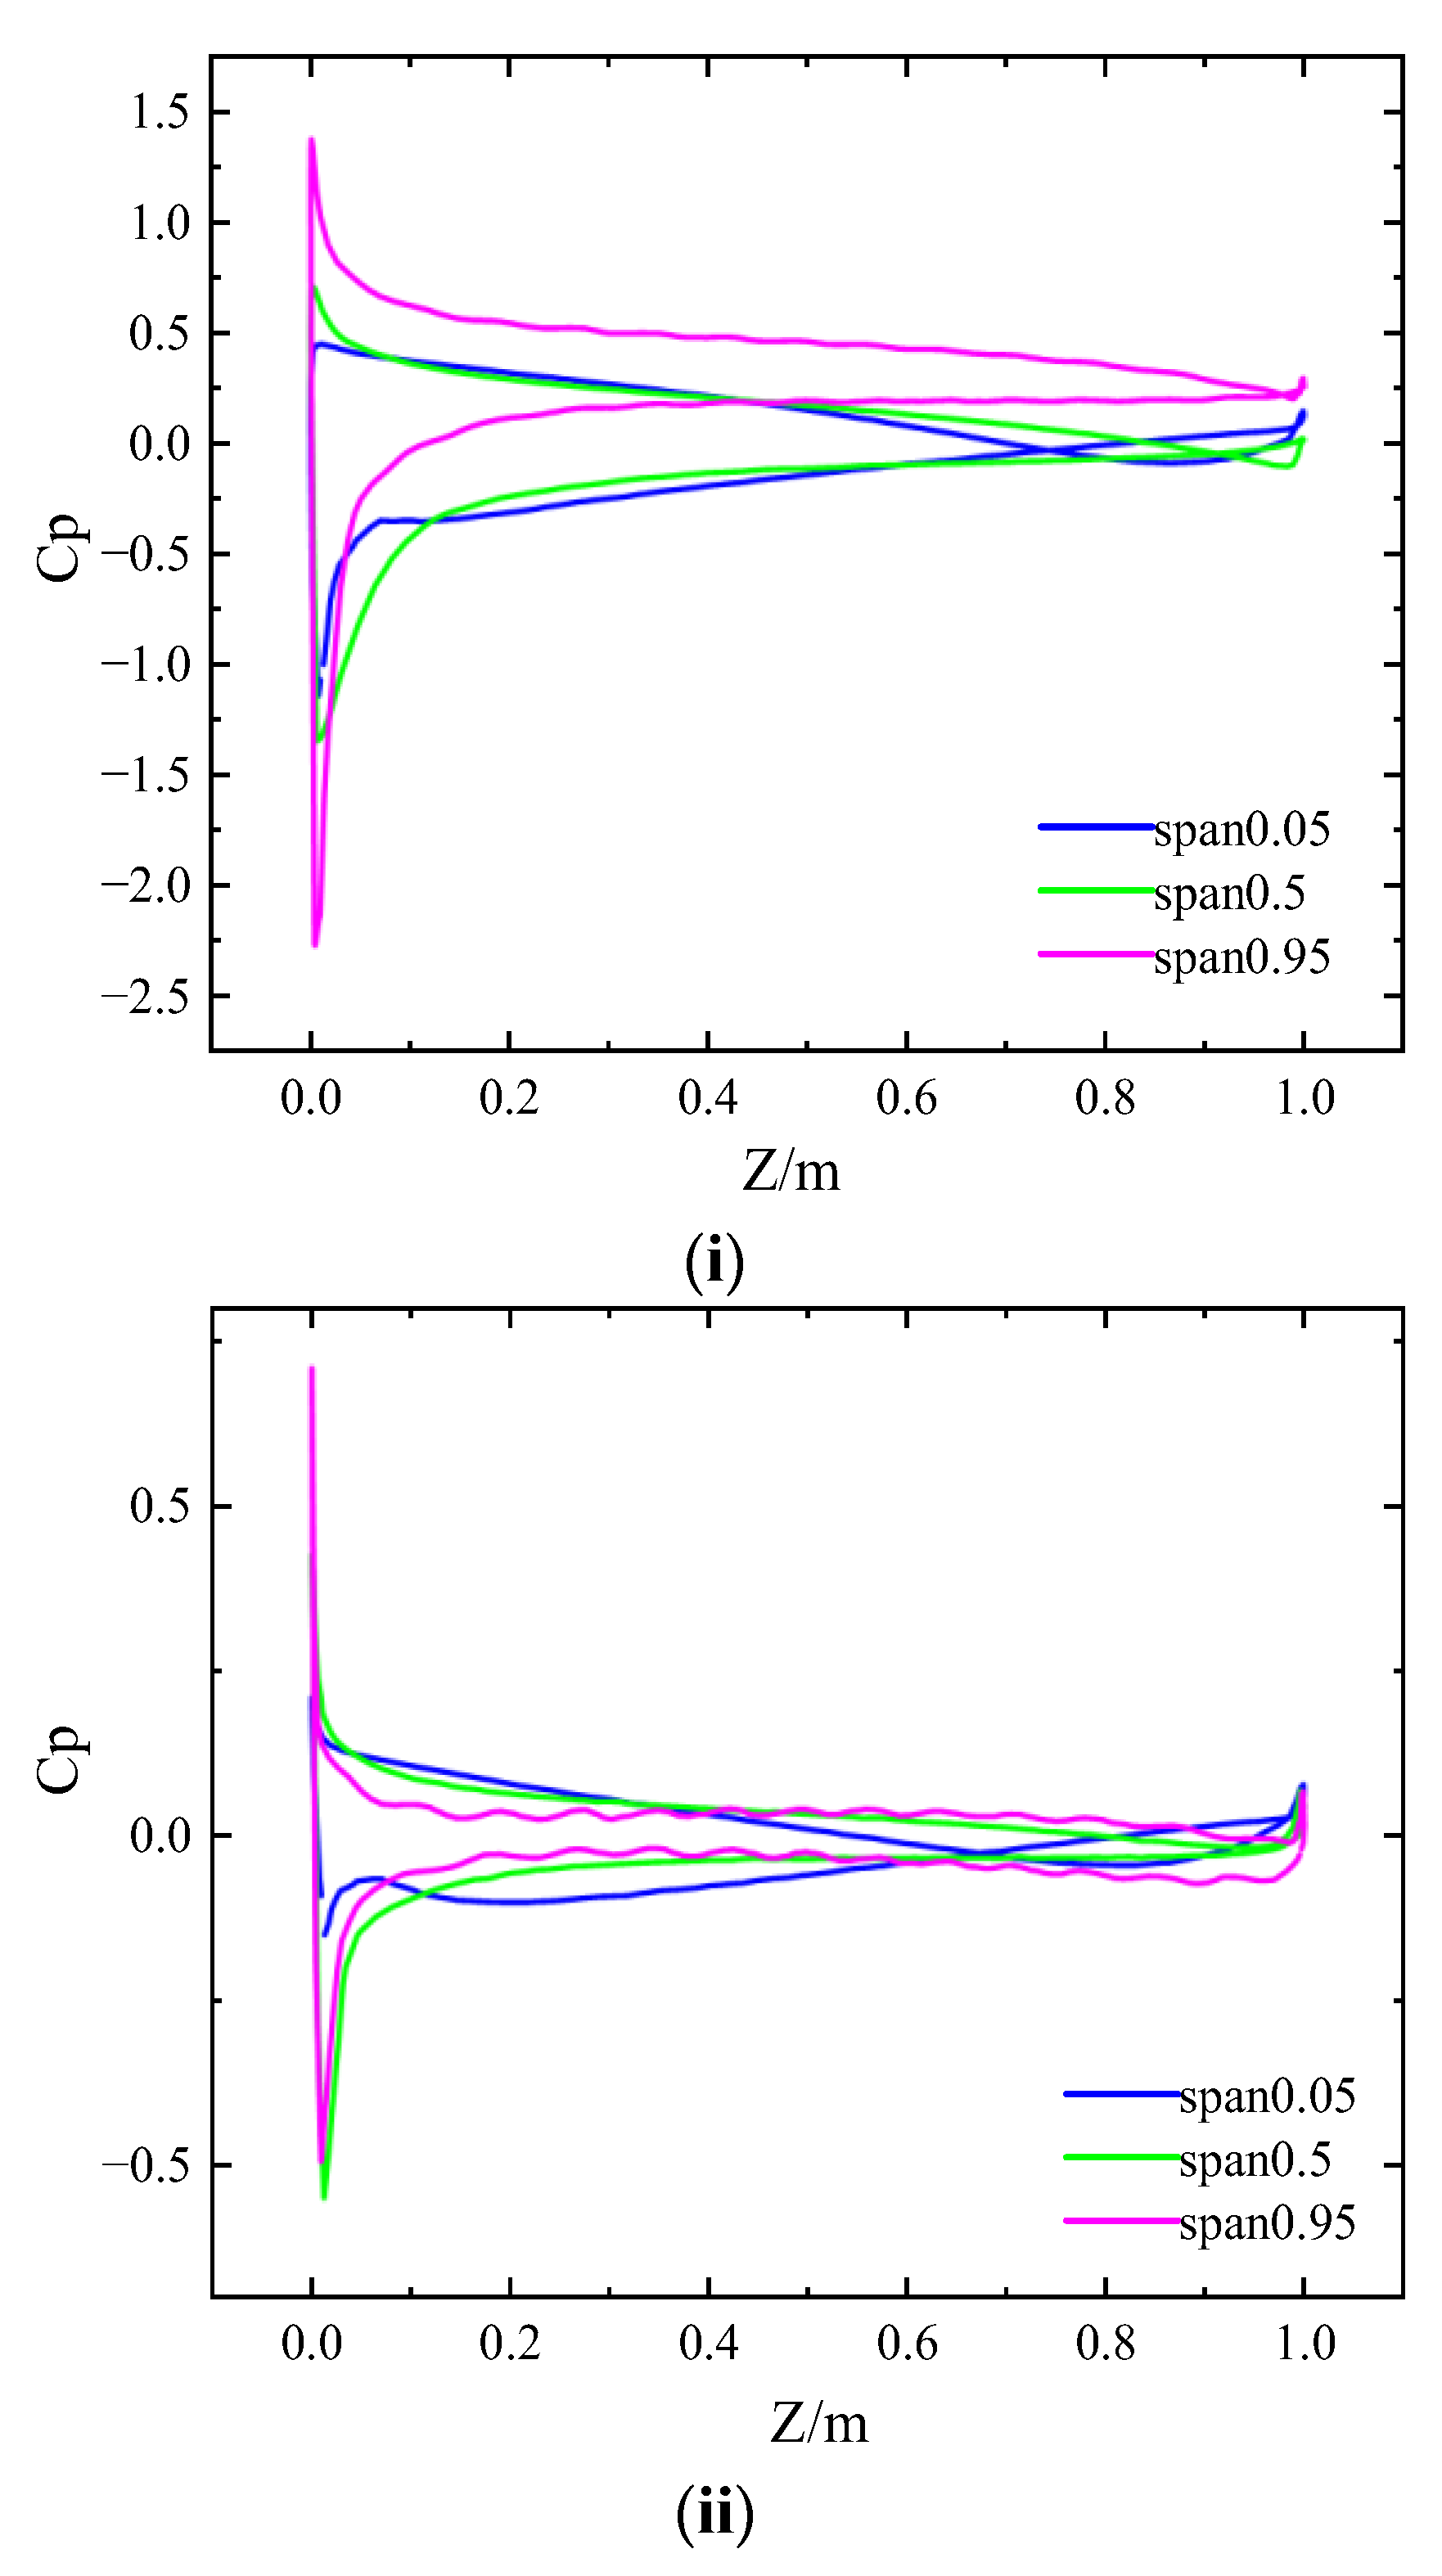
  • Under the pump condition and the turbine condition, the distribution trend of the pressure coefficient was consistent under different flow rates. With the flow rate increasing, the amplitude decreased constantly, indicating that when the blade operated near the design flow rate, the change in the blade surface pressure was small, and the flow was more stable.

Author Contributions

Conceptualization, D.W.; methodology, D.W.; formal analysis, D.W.; investigation, D.W.; resources, D.W.; data curation, D.W.; writing—original draft preparation, D.W.; writing—review and editing, Y.B.; visualization, D.W.; project administration, Y.B. All authors have read and agreed to the published version of the manuscript.

Funding

This research was supported by the National Natural Science Foundation of China (11402115) and the Jiangsu Province Natural Science Foundation of China (BK20130782).

Institutional Review Board Statement

Not applicable.

Informed Consent Statement

Not applicable.

Conflicts of Interest

The authors declare no conflict of interest.

Nomenclature

List of Symbols
Qflow rate
fmass force
uvelocity vector
ppressure
ρfluid density
p ¯ the average pressure
C p Coefficient of pressure
N-S equationNavier–Stokes equations
CFDcomputational fluid dynamics
3Dthree-dimensional
BPFblade passing frequency

References

  1. Meng, D.; Jiang, T.; Deng, H.; Hou, G. Numerical Simulation Research on Radial Force of Centrifugal Pump with Guide Vanes. Shock Vib. 2021, 2021, 1–10. [Google Scholar] [CrossRef]
  2. Li, W.; Ping, Y.; Shi, W.; Ji, L.; Li, E.; Ma, L. Research progress on rotating stall of guide vane mixed-flow pump. Chin. Drain. Irrig. Mech. Eng. 2019, 37, 737–745. [Google Scholar]
  3. Guo, X.; Zhu, Z.; Cui, B.; Shi, G. Effects of the number of inducer blades on the anti-cavitation characteristics and external performance of a centrifugal pump. Mech. Sci. Technol. 2016, 30, 3173–3181. [Google Scholar] [CrossRef]
  4. Xu, Y.; Tan, L.; Cao, S.L.; Wang, Y.C.; Meng, G.; Qu, W.S. Influence of blade angle distribution along leading edge on cavitation performance of a centrifugal pump. IOP Conf. Ser. Mater. Sci. Eng. 2015, 72, 032019. [Google Scholar] [CrossRef] [Green Version]
  5. Yang, F.; Liu, C.; Tang, F.; Luo, C.; Chen, F. Study on pressure fluctuation characteristics of blade area of S-shaped down horizontal axial-flow pump. Fluid Mach. 2015, 43, 16–22. [Google Scholar]
  6. Song, X.; Liu, C. Experimental investigation of pressure pulsation induced by the floor-attached vortex in an axial flow pump. Adv. Mech. Eng. 2019, 11. [Google Scholar] [CrossRef] [Green Version]
  7. Zhou, Y.; Zheng, Y.; He, Z.; Sun, A.; Zhang, F.; Wang, H. Pressure fluctuation and fluid structure coupling of large axial-flow pump reverse power generation. J. Drain. Irrig. Mech. Eng. 2019, 37, 480–485. [Google Scholar]
  8. Yang, F.; Chang, P.; Yuan, Y.; Li, N.; Xie, R.; Zhang, X.; Lin, Z. Analysis of Timing Effect on Flow Field and Pulsation in Vertical Axial Flow Pump. J. Mar. Sci. Eng. 2021, 9, 1429. [Google Scholar] [CrossRef]
  9. Wu, C.; Tang, F.; Shi, L.; Xie, C.; Zhang, W. Influence of relative distance of guide vane on pressure fluctuation characteristics of S-shaped axial-extension tubular pump. Adv. Sci. Technol. Water Resour. 2019, 39, 63–69. [Google Scholar]
  10. Zheng, Y.; Chen, Y.; Mao, X.; Wang, H.; Shi, W.; Kan, K.; Zhang, Y. Pressure fluctuation characteristics of mixed flow pump and its influence on flow induced noise. Trans. Chin. Soc. Agric. Eng. 2015, 31, 67–73. [Google Scholar]
  11. Yao, Z.; Wang, F.; Xiao, R.; Yang, M.; He, C. Study on the influence of runner spraying on the pressure fluctuation characteristics of double suction centrifugal pump. J. Hydraul. Eng. 2015, 46, 1097–1102. [Google Scholar]
  12. Zhou, Q.; Xia, L.; Zhang, C.; Yuan, Y.; Zhu, Z. Pressure pulsation and runner stress during load rejection transition of pump turbine. J. Hydraul. Eng. 2018, 49, 1429–1438. [Google Scholar]
  13. Li, Q.; Tan, H.; Li, R.; Jiang, L.; Lv, W. Effect of abnormally low water head on pressure fluctuation of pump turbine. J. Drain. Irrig. Mech. Eng. 2016, 34, 99–104. [Google Scholar]
  14. Yang, F.; Chang, P.; Li, C.; Shen, Q.; Qian, J.; Li, J. Numerical analysis of pressure pulsation in vertical submersible axial flow pump device under bidirectional operation. AIP Adv. 2022, 12, 025107. [Google Scholar] [CrossRef]
  15. Zhang, D.; Geng, L.; Shi, W.; Pan, D.; Wang, H. Pressure fluctuation and vibration characteristics test of axial flow pump hydraulic model. Trans. Chin. Soc. Agric. Mach. 2015, 46, 66–72. [Google Scholar]
  16. Zhang, D.; Wang, H.; Shi, W.; Pan, D.; Shao, P. Pressure fluctuation characteristic test of axial flow pump under multiple working conditions. Trans. Chin. Soc. Agric. Mach. 2014, 45, 139–145. [Google Scholar]
  17. Zhang, X.; Tang, F. Investigation on hydrodynamic characteristics of coastal axial flow pump system model under full working condition of forward rotation based on experiment and CFD method. Ocean Eng. 2022, 253, 111286. [Google Scholar] [CrossRef]
  18. Zheng, Y.; Chen, Y.; Zhang, R.; Ge, X.; Lin, G.; Sun, A. Study on unsteady flow characteristics of axial flow pump under stall condition. Trans. Chin. Soc. Agric. Mach. 2017, 48, 127–135. [Google Scholar]
  19. Liu, J.; Cao, Y. Study on the Influence of Compressibility on Pressure Fluctuation Characteristics of Pump Turbine. J. Phys. Conf. Ser. 2020, 1626. [Google Scholar] [CrossRef]
  20. Li, R.; Tan, H.; Li, Q.; Han, W.; Jiang, L. Study on pressure fluctuation of pump turbine under low head. J. Hydroelectr. Eng. 2015, 34, 85–90. [Google Scholar]
  21. Zhai, J.; Zhu, B.; Li, K.; Wang, X.; Cao, S. Study on internal pressure fluctuation characteristics of guide vanes of low specific speed mixed flow pump. Trans. Chin. Soc. Agric. Mach. 2016, 47, 42–46. [Google Scholar]
  22. Lu, D.; Li, W.; Li, S.; Ji, L.; Yang, Y. Research on the Relationship between Stall Propagation and Flange Leakage of Mixed-Flow Pumps. Water 2022, 14, 1730. [Google Scholar] [CrossRef]
  23. Li, W.; Ji, L.; Shi, W.; Yang, Y.; Awais, M.; Wang, Y.; Xu, X. Correlation research of rotor–stator interaction and shafting vibration in a mixed-flow pump. J. Low Freq. Noise Vib. Act. Control 2019, 39, 72–83. [Google Scholar] [CrossRef]
  24. Li, G.; Lu, C. Experimental study on pressure fluctuation of low specific speed axial flow turbine. J. Drain. Irrig. Mech. Eng. 2017, 35, 869–873. [Google Scholar]
  25. Karpenko, M.; Bogdevicius, M. Investigation into the hydrodynamic processes of fitting connections for determining pressure losses of transport hydraulic drive. Transport 2020, 35, 108–120. [Google Scholar] [CrossRef] [Green Version]
  26. Riaz, A.; Abbas, T.; Zeeshan, A.; Doranehgard, M.H. Entropy generation and MHD analysis of a nanofluid with peristaltic three dimensional cylindrical enclosures. Int. J. Numer. Methods Heat Fluid Flow 2021, 31, 2698–2714. [Google Scholar] [CrossRef]
  27. Zeeshan, A.; Riaz, A.; Alzahrani, F. Electroosmosis modulated bio flow of nanofluid through a rectangular peristaltic pump induced by complex travelling wave with zeta potential and Heat source. Electrophoresis 2021, 42, 2143–2153. [Google Scholar] [CrossRef]
Figure 1. Flow channel diagram. (1) Inlet channel, (2) front guide vane, (3) runner, (4) guide vane, (5) outlet channel.
Applsci 12 12956 g001
Figure 2. Grid independence verification.
Applsci 12 12956 g002
Figure 3. Meshing of the axial-flow pump fluid domain. (i) Front guide vane area. (ii) Turbine blade region. (iii) Active guide vane region.
Applsci 12 12956 g003
Figure 4. Layout of monitoring points on different monitoring surfaces.
Applsci 12 12956 g004
Figure 5. Forward characteristic curve.
Applsci 12 12956 g005
Figure 6. Inverse characteristic curve.
Applsci 12 12956 g006
Figure 7. Experimental setup. (i) Monitoring point layout. (ii) Pressure sensor. (iii) Measuring instrument.
Applsci 12 12956 g007
Figure 8. Comparison of experimental and numerical simulation results. (i) Time-domain diagram of the inlet pressure pulsation of pre-guide vanes. (ii) Time-domain diagram of the runner inlet pressure pulsation. (iii) The frequency domain diagram of the inlet pressure pulsation of the front guide vane. (iv) Frequency domain diagram of the runner inlet pressure pulsation.
Applsci 12 12956 g008aApplsci 12 12956 g008b
Figure 9. Time–domain diagram of the pressure pulsation under pump conditions. (i) 0.6Q. (ii) 0.8Q. (iii) 1.0Q. (iv) 1.2Q.
Applsci 12 12956 g009aApplsci 12 12956 g009b
Figure 10. Time–domain diagram of the pressure pulsation under turbine conditions. (i) 0.6Q. (ii) 1.0Q.
Applsci 12 12956 g010
Figure 11. Frequency domain diagram of the pressure pulsation under pump condition. (i) 0.6Q; (ii) 0.8Q; (iii) 1.0Q; (iv) 1.2Q.
Applsci 12 12956 g011aApplsci 12 12956 g011b
Figure 12. Frequency domain diagram of the pressure pulsation under turbine condition. (i) 0.6Q. (ii) 1.0Q.
Applsci 12 12956 g012
Figure 13. Section of the blade ring of the axial flow pump runner.
Applsci 12 12956 g013
Figure 14. Pressure coefficient diagram under pump conditions. (i) 0.6Q. (ii) 0.8Q. (iii) 1.0Q. (iv) 1.2Q.
Applsci 12 12956 g014aApplsci 12 12956 g014b
Figure 15. Pressure coefficient diagram under turbine conditions. (i) 0.6Q. (ii) 1.0Q.
Applsci 12 12956 g015
Figure 16. Velocity streamline distribution under pump condition. (i) span = 0.05. (ii) span = 0.5. (iii) span = 0.95.
Applsci 12 12956 g016
Figure 17. Velocity streamline distribution under turbine condition. (i) span = 0.05. (ii) span = 0.5. (iii) span = 0.95.
Applsci 12 12956 g017
Table 1. Relevant design parameters of the pump.
Pump1700ZWSQ10-2.5Blade Placement Angle−6°~+4°
Diameter of impeller1.7 mImpeller center elevation1 m
Number of impeller blades4Design discharge10 m3/s
Design head2.5 mNumber of front guide vanes5
Number of guide vanes7Design speed250 r/min
Table 2. Comparison of different turbulence models.
ModelReferenceDescription
Standard k–εWu Chenhui (2019) [9]Valid for fully turbulent flows. Better at investigation of flow in pipeline systems.
RNG k–εYang Fan et al. (2015) [5]Valid for fully turbulent flows. Better at handling the flow with large flow curve.
Realizable k–εLi Rennian (2015) [20]Not applicable to near wall-bounded boundary, and effectively used for various types of flow simulation.
SST k–ωZhai Jie (2016) [21], Zheng Yuan (2015) [10]Used for vortex flows. Combined with the characteristics of the k–ε model and k–ω model.
Publisher’s Note: MDPI stays neutral with regard to jurisdictional claims in published maps and institutional affiliations.

