Article

Tension Performance of Precast Bridge Deck Longitudinal Joints with Different Configurations

1
Department of Civil Engineering, Chosun University, Gwangju 61452, Republic of Korea
2
Department of Social Infrastructure Engineering, Kyung Hee University, Seoul 02447, Republic of Korea
3
Sangbo Company, Seoul 415865, Republic of Korea
*
Author to whom correspondence should be addressed.
Appl. Sci. 2022, 12(24), 12892; https://doi.org/10.3390/app122412892
Submission received: 10 November 2022 / Revised: 5 December 2022 / Accepted: 13 December 2022 / Published: 15 December 2022
(This article belongs to the Special Issue Advances in Bridge Design and Structural Performance)

Abstract

:
Cast-in-place bridge decks cause issues such as traffic congestion, dust, noise, and air pollution at the construction site. Precast bridge deck systems address these issues by facilitating the installation of prefabricated concrete units on site. However, as cracking and leakage problems have been recently observed in the longitudinal joints that connect the precast bridge deck units of existing bridges, evaluations of the connectivity and constructability of such joints are essential. Consequently, this study experimentally investigated the structural performance of longitudinal joint configurations of six precast bridge decks with varying joint widths, steel plate configurations, and rebar details to determine the optimal joint configuration. A tensile load was applied to each joint specimen, and the resulting relative displacement across the joint was measured. Subsequently, a finite element model of the optimal joint specimen was developed and determined to exhibit behavior under loads similar to that observed during the test, confirming the ability of finite element analyses to accurately predict the behavior of such joints. The results of this study are expected to improve designs for the longitudinal joints of precast bridge deck systems, facilitating expedited bridge construction, while minimizing construction impacts.

1. Introduction

The construction of cast-in-place (CIP) bridge decks causes traffic congestion, owing to the transportation of equipment and tools to the site and generates dust, noise, and air pollution. Additionally, the inherent need to work on a narrow site prolongs the construction period and increases labor costs [1,2,3,4,5,6,7]. When verifying the structural performance of CIP barrier walls using tensile tests, Cusson and Repette [8] noted the necessity of preventing early thermal cracking using supplementary measures, and Desmettre and Charron [9] reported that early cracking in CIP bridge decks increases the risk of corrosion by water. Problems associated with chlorides and freeze–thaw cycles can further aggravate the damage caused by cracking in bridge decks.
Therefore, several studies [10,11,12,13,14,15,16] have been conducted to develop and evaluate precast concrete bridge deck systems that address the issues associated with CIP bridge decks. Precast concrete bridge deck units are prefabricated, and subsequently transported to the construction site, where they are installed and connected by casting non-shrink concrete in the joint between units. This system reduces traffic congestion and avoids environmental issues associated with new bridge constructions. Moreover, Abokifa and Moustafa [17] observed that precast systems provide an approach that is more suitable for construction than the CIP method when replacing or repairing existing bridge decks. However, in recent years, multiple instances of leakage and cracking have been observed in the longitudinal joints of existing precast bridge decks. These issues occur because the connection between the precast bridge deck units cannot be completed until the non-shrink concrete has cured for 28 days; during this time, the differential displacement between the deck components initiates cracks that propagate when the joint is subjected to tension. As a result, several studies have been conducted to develop the connectivity and constructability of precast bridge deck joints [18,19,20,21,22,23,24,25].
Mander et al. [26] determined which precast bridge deck joints can be assembled within the shortest time in the field and evaluated methods for casting the non-shrink joint concrete to address the cracking problem. Other researchers have investigated methods to increase the connectivity provided by precast bridge deck joints by employing novel materials [27,28,29,30,31,32]. Additionally, researchers have noted that the tensile load transfer performance of the longitudinal joint between precast deck units must be ensured to provide sufficient connectivity and ensure integral deck behavior. Shear keys are typically provided between precast bridge deck units to increase their shear stiffness and capacity. Menkulasi and Roberts-Wollmann [33] proposed a precast bridge deck joint, which was less than 20 mm wide, that employed two shear keys, and conducted direct shear experiments. They determined that it provided optimal shear performance and cross-sectional efficiency. Nasrin et al. [34] reported that the bending resistance increased when ultra-high-performance concrete (UHPC) was placed on the precast bridge deck joint. Sriboonma et al. [35] established that large studs did not significantly affect the shear resistance or flexibility limits in the type of shear connectors. Therefore, they concluded that the connection problem could be solved by fillet welding. Hube et al. [36] demonstrated that finite element analysis is suitable for simulating motion and strength.
In summary, research on precast bridge decks is being actively conducted. However, most of these studies focus on the shear behavior of precast bridges, and studies on the joints of the precast bridge decks are limited. The precast bridge deck is located above the bridge’s piers and girders. These joints on the precast bridge deck produce more tensile loads due to negative moments when the vehicle is under load. To solve this problem, this study conducted a tensile test to analyze and optimize the behavior of the longitudinal joints of the precast bridges. To perform this optimization, a series of specimens that consider the existing CIP bridges were used to evaluate the width of the joints for the structural performance of the proposed joints, the presence of hook or looped rebars, and the presence of steel plates. We then developed and analyzed a finite element model (FEM) to validate the behavior of the simulated optimal junction configurations using experimentally obtained observations.

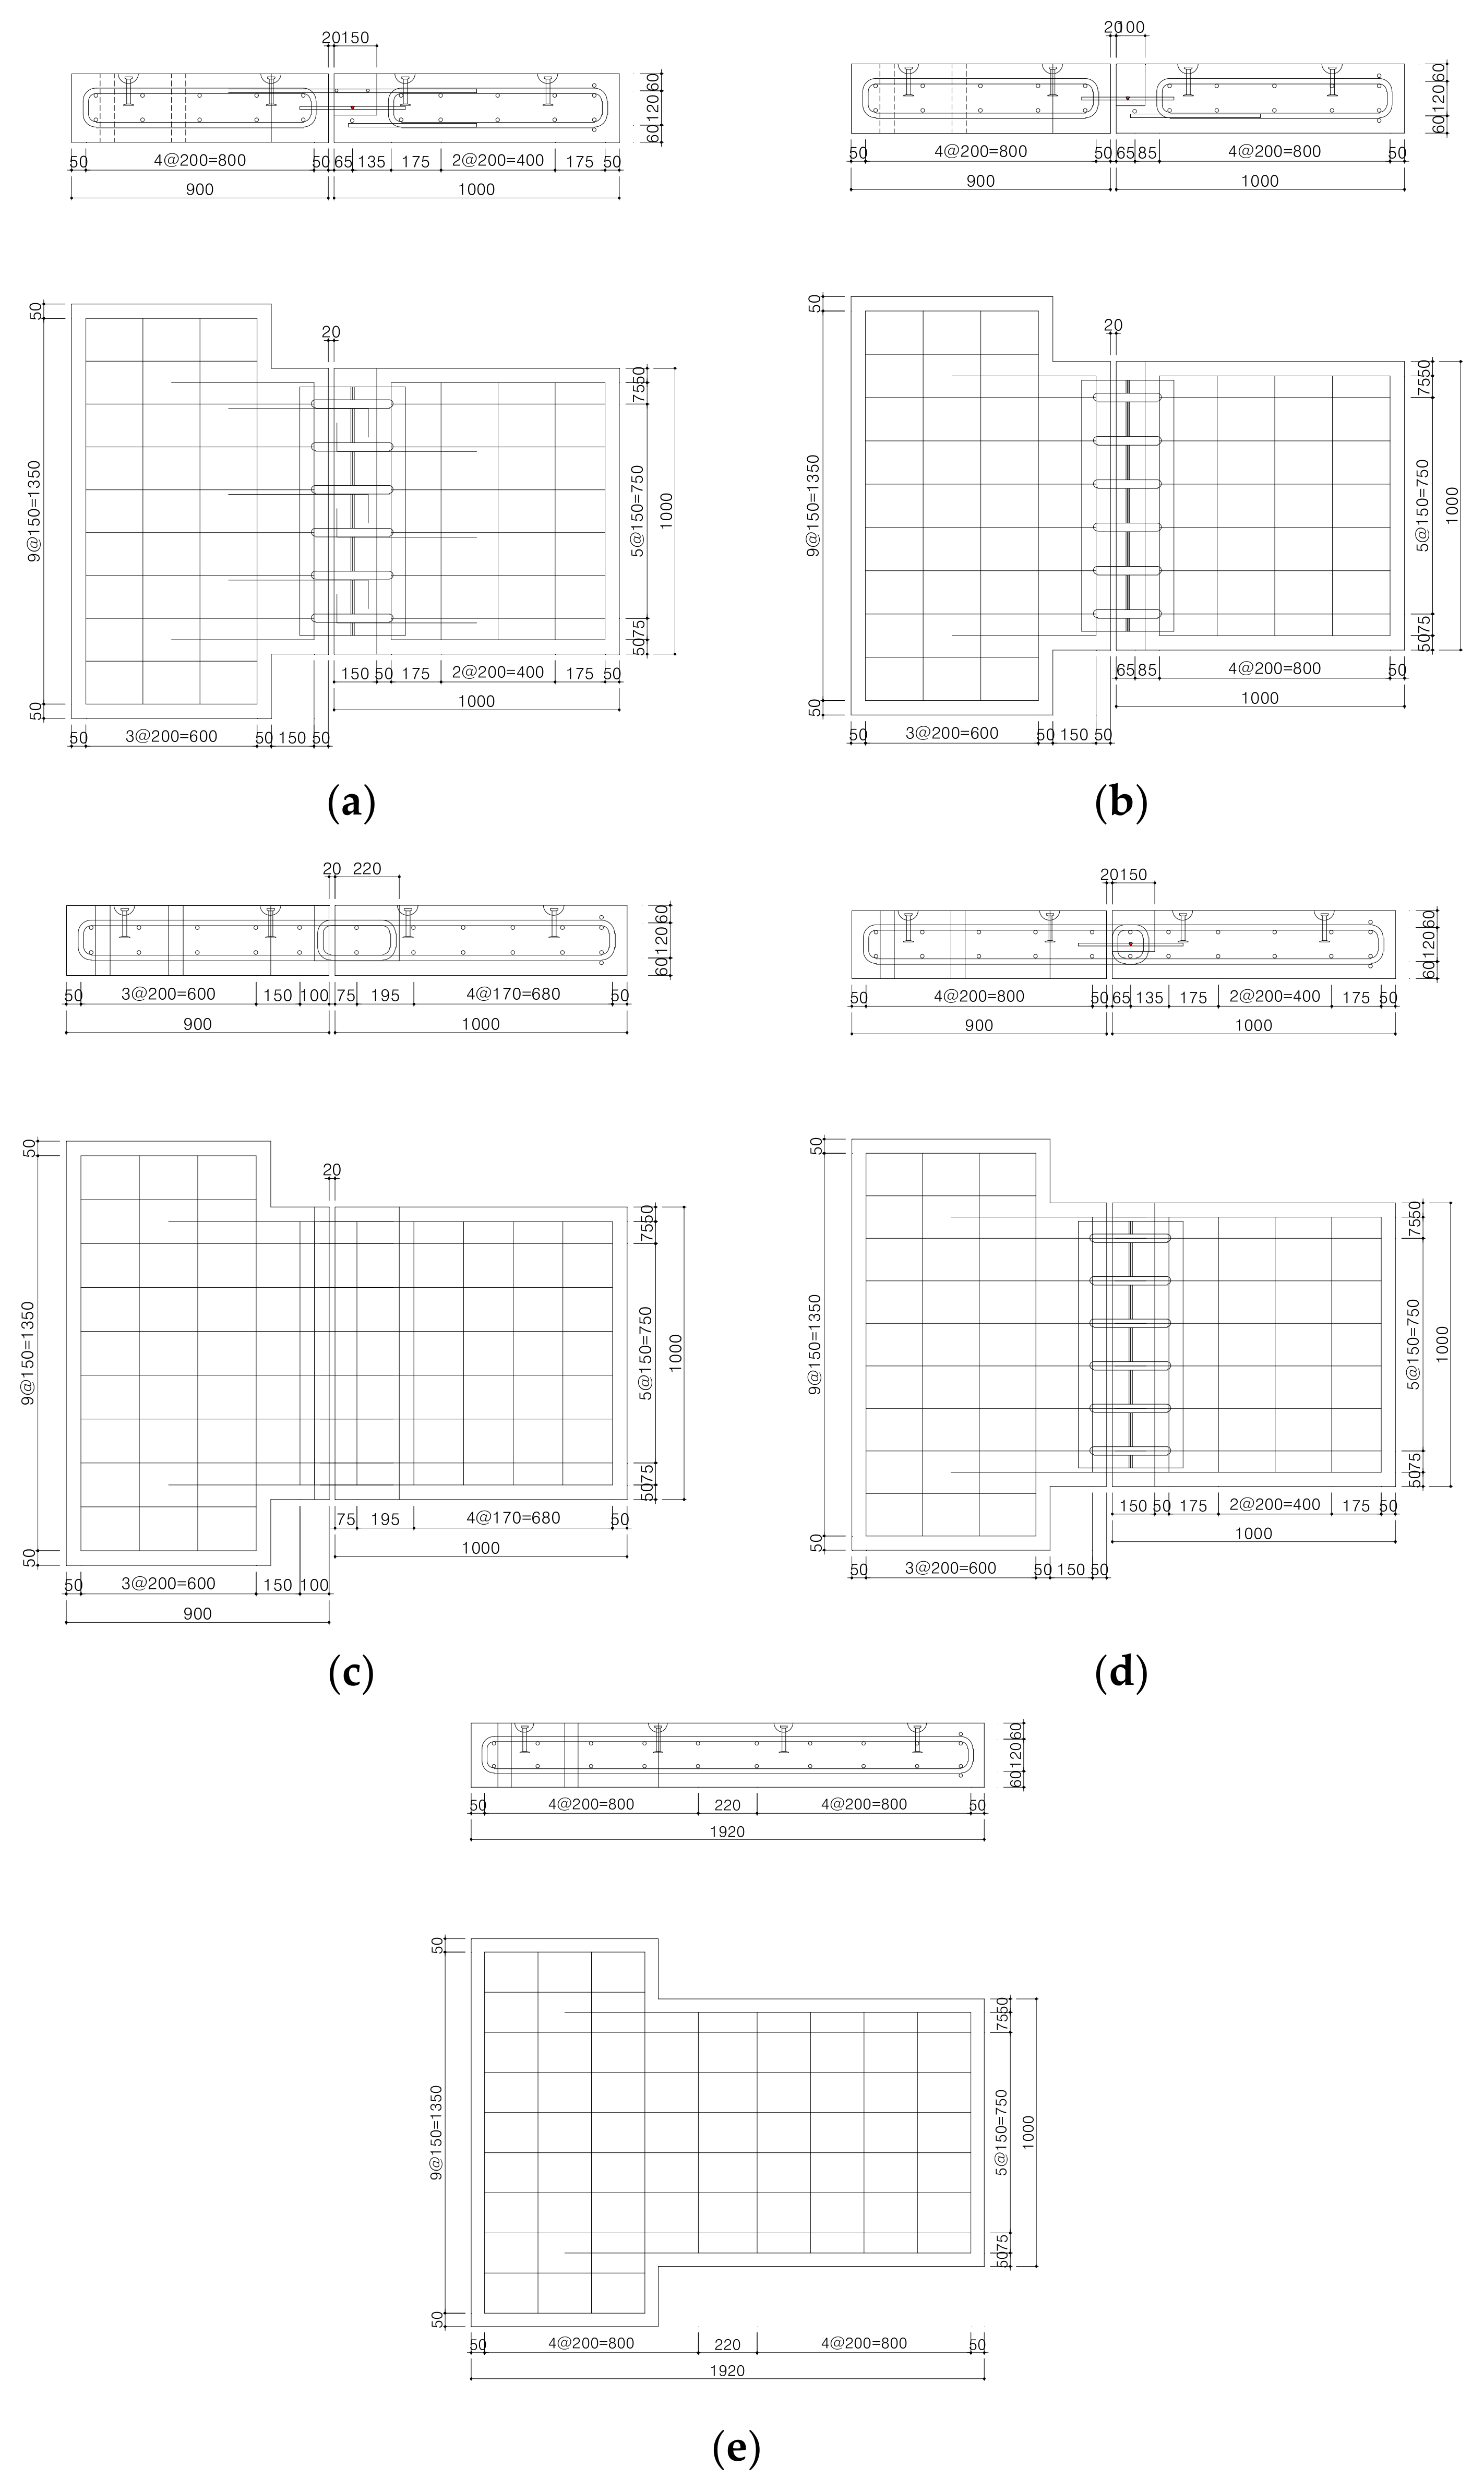
2. Materials and Methods

Six test specimens were fabricated with the joint width, rebar type, and steel plate as the parameters, as presented in Table 1, to evaluate the effects of each parameter on the joint behavior under tension loads. Specimens J100-HB-SP and J150-HB-SP were compared to evaluate the effects of joint width, and specimen J100-NB-SP was evaluated to determine the effects of the presence of rebars. Specimens J0-LB-NP and J0-LB-SP were evaluated to determine the effects of looped rebars and were compared to determine the effects of the presence of steel plates. Finally, C-SB-NP was evaluated to provide a comparison with typical CIP construction. Figure 1 depicts a side and top view of J100-HB-SP, which represents a precast bridge deck joint with a hooked rebar, steel plate, and width of 100 mm. All rebars had an elastic modulus of 200,000 MPa and yield stress of 400 MPa, which met the SD400 specification, and had a diameter (d) of 32 mm, corresponding to the required anchorage development or lap splice length of 15 d = 480 mm. The compressive strength of the deck slab concrete was 43 MPa with an elastic modulus of 30,000 MPa. Figure 2 shows the specific configuration of each test specimen defined in Table 1.
Figure 3 shows the test specimen fabrication process. First, the formwork was constructed by fabricating the rebar (Figure 3a). Each rebar cage was first assembled and placed inside the fabricated formwork (Figure 3b). Next, the concrete for the slabs that represented the deck units was poured and cured for 28 d (Figure 3c). Finally, non-shrink concrete was cast in the joint section and cured for an additional 28 d before testing (Figure 3d).
Figure 4 shows the test setup of this study. A longitudinal load was applied using an actuator to induce tension throughout the joint in each specimen. The capacity of the actuator was set to 200 t. The relative displacement of the joint under a tension load was measured using a displacement transducer connected to the data logger (Figure 4a). The attachment of bridge decks to actuators requires high-strength bolts with a minimum diameter of 24 mm, but the use of bolts to attach concrete specimens to rigid frames and actuators would not provide sufficient bearing strength. Hence, 32 mm diameter reinforcement was used for these joints. To secure the concrete specimens to the test frame and prevent deformation, five 250 mm spaced rebars were arranged in two rows, 200 mm and 700 mm from each specimen end. These bars were inserted into the ducts that were preinjected into the sample. The actuator joints were attached by arranging three rebars 180 mm apart in one row, 300 mm and 320 mm from the other end of each specimen. The bar was embedded in a 50 mm hole drilled in each test sample prior to the test (Figure 4b). In the displacement transducer of the experiment, two attachment points were installed over the joint in the center of the test, which were 600 mm away from the fixed end of the test. The displacement transducer measured the relative displacement (Figure 4c). The tension load applied to the test specimen was gradually increased over time, until it reached a maximum of 800 kN.

3. Results and Discussion
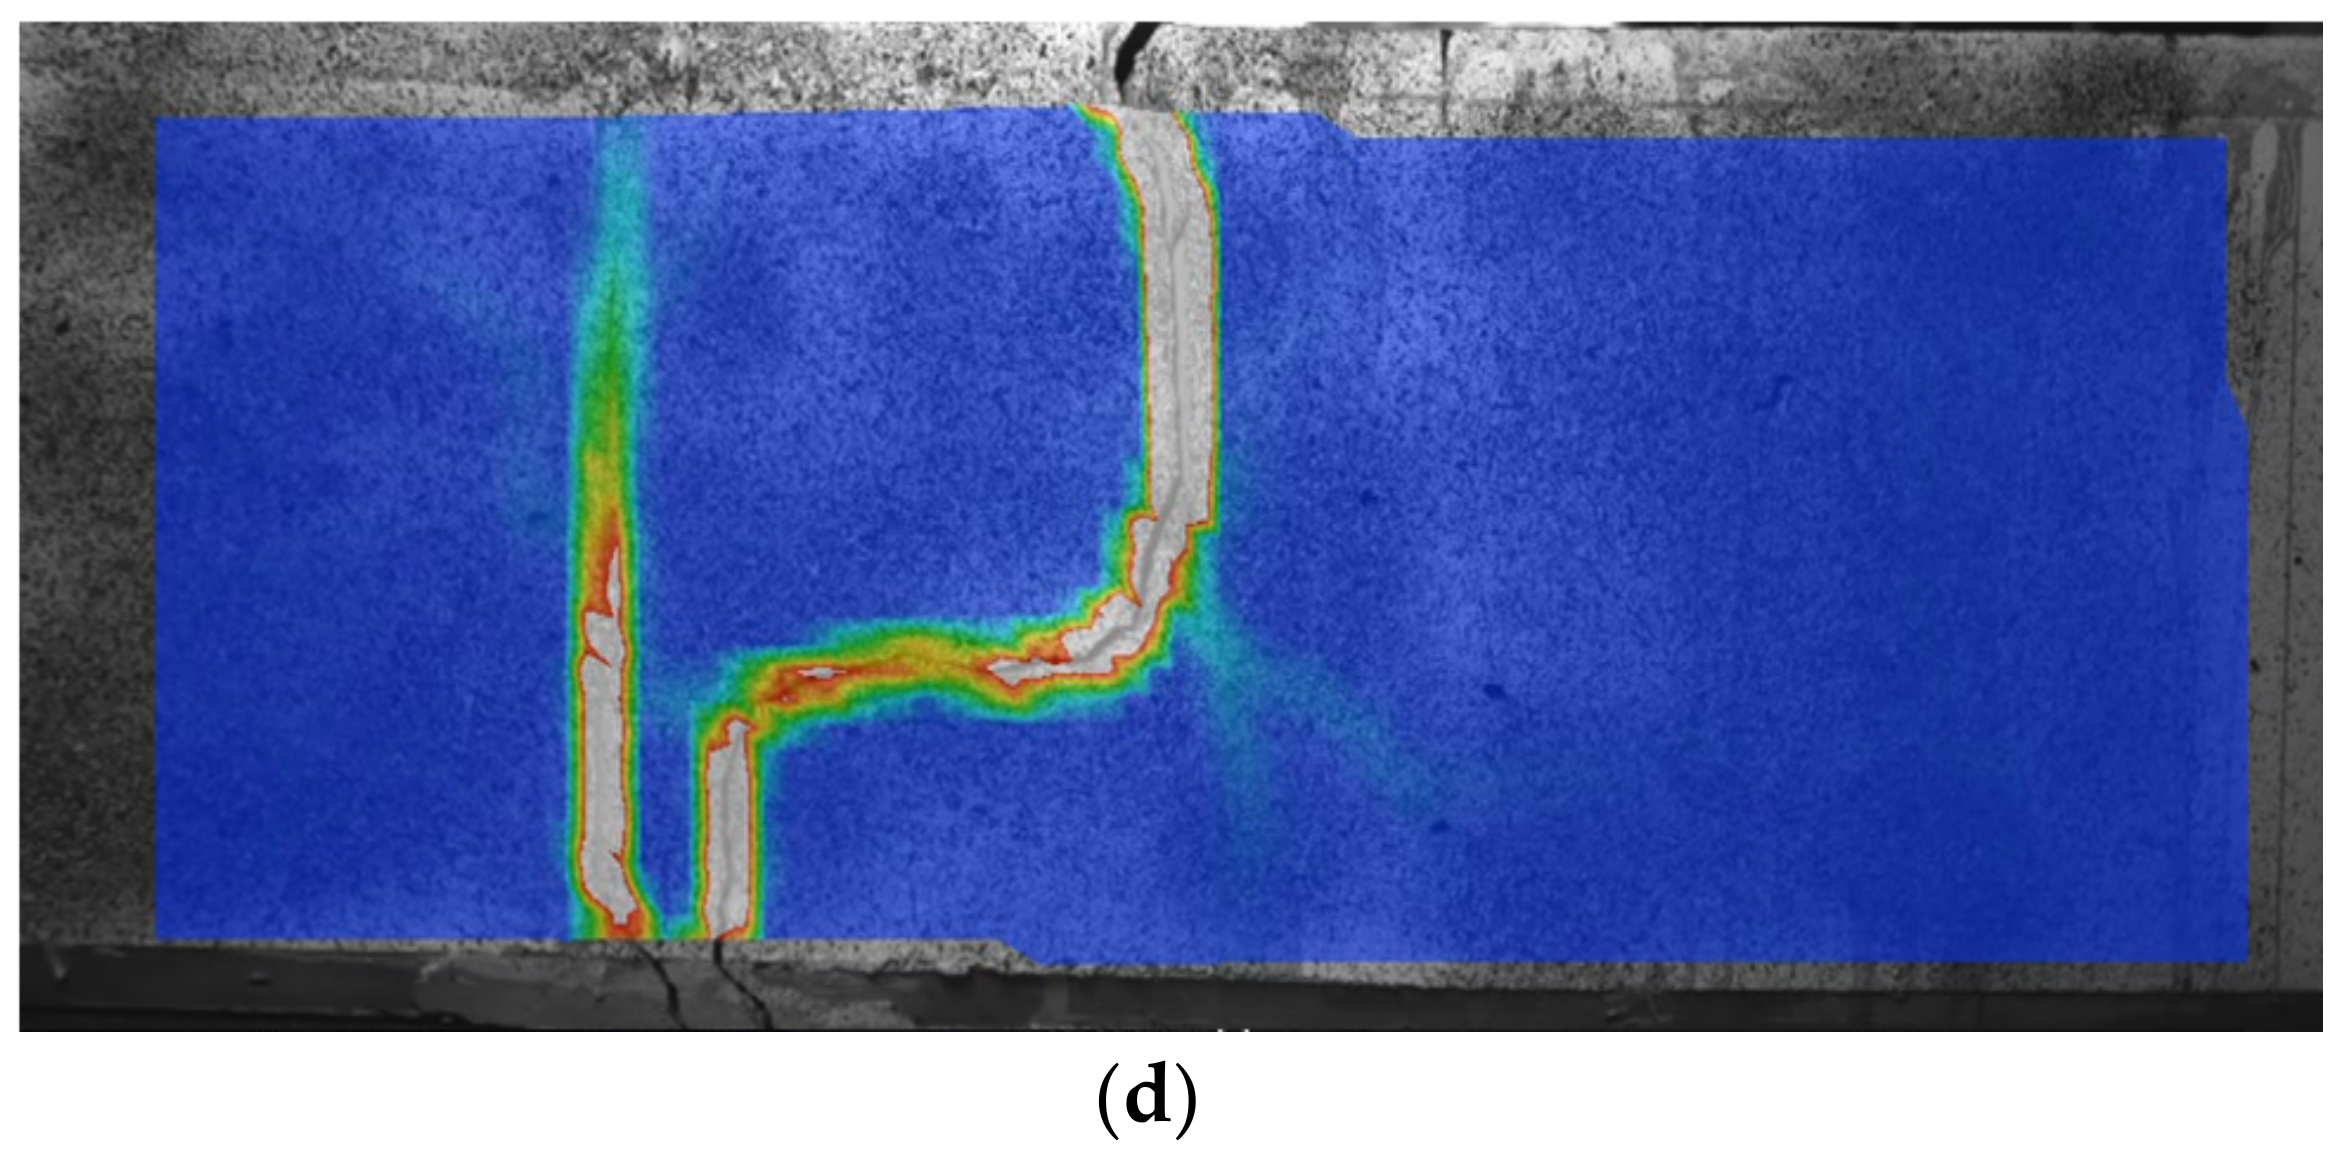
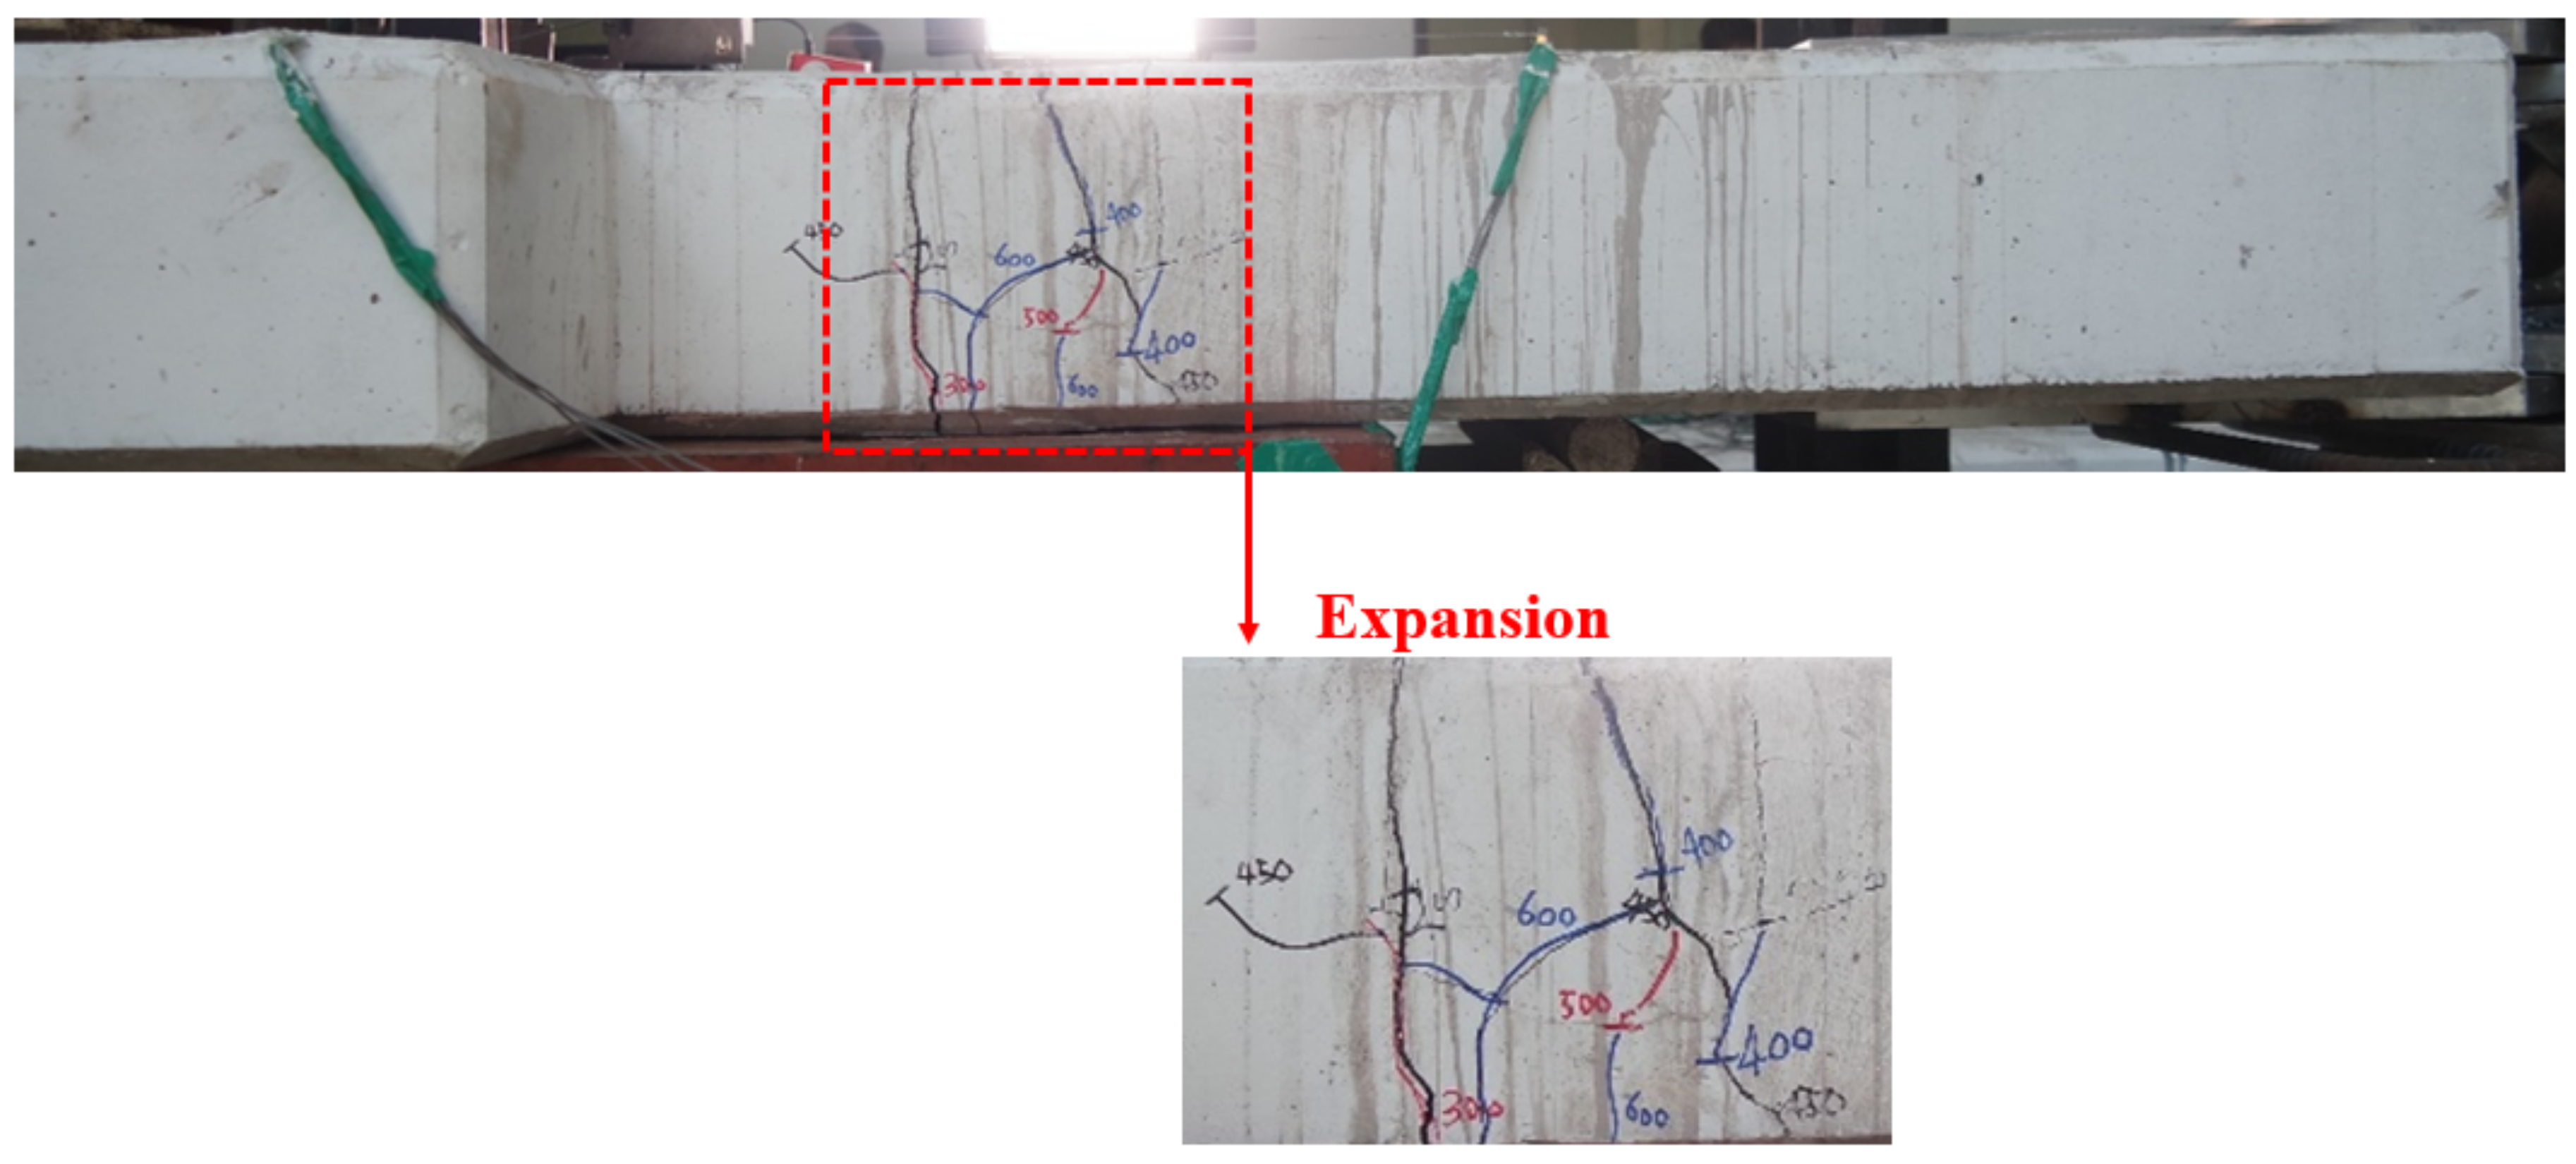
The test results were compared using the following three characteristic values reported in Table 2: the initial cracking load, final load, and final relative displacement. An analysis of the load–relative displacement curves for each specimen was also conducted to determine the effects of each evaluated parameter.
Figure 5 compares the load–relative displacement curves of specimens J100-HB-SP and J150-HB-SP to evaluate the effects of joint widths of 100 mm and 150 mm, respectively. Table 2 shows that the initial cracking load decreased by more than 20%, the final load decreased by 18%, and the final relative displacement increased by 120% when the joint width increased from 100 mm to 150 mm. This suggests that the precast bridge deck joint exhibited less integral behavior as the joint width increased. Therefore, a smaller joint width of 100 mm is preferable to ensure that precast bridge deck joints exhibit high initial cracking and final loads.
Figure 6 compares the load–relative displacement curves of J100-HB-SP and J100-NB-SP to evaluate the effects of the presence of steel rebar. As reported in Table 2, the initial cracking load for J100-NB-SP was considerably lower than that for J100-HB-SP, but both reached the final load value—although J100-NB-SP did so at a much larger final displacement (5.75 mm). Although the two specimens reached the final load, owing to the presence of the steel plate, the initial cracking load was 61% lower in the specimen without hooked rebars. This indicates that steel rebars are required to prevent the initial cracking of precast bridge deck joints.
Figure 7 compares the load–relative displacement curves of J100-HB-SP and J0-LB-NP to evaluate the effects of rebar type and steel plate usage. Overall, the behavior of J0-LB-NP was similar to that of J100-HB-SP; however, as shown in Table 2, the final relative displacement of J0-LB-NP (3.67 mm) was approximately 56% larger than that of J100-HB-SP. It can be concluded that the looped rebars alone were insufficiently connected to the transfer load across the joint, whereas the combination of hooked top-layer rebars and the steel plate ensured integral structural performance. Therefore, hooked rebars are more effective than looped rebars in precast bridge deck joints.
Figure 8 compares the load–relative displacement curves for J100-HB-SP and J0-LB-SP to evaluate the effects of the rebar type. The behavior of J0-LB-SP was similar to that of J100-HB-SP, and their characteristic loads (reported in Table 2) were also similar; however, the final relative displacement of J0-LB-SP (3.23 mm) was approximately 38% larger than that of J100-HB-SP. Overall, J0-LB-SP exhibited better structural performance than J0-LB-SP; however, its performance was poorer than that of J100-HB-SP, owing to the limited connectivity provided by the looped rebars. Thus, looped rebars provide less connectivity than hooked rebars, even when including a steel plate in the precast deck joint.
Figure 9 compares the load–relative displacement curves of J100-HB-SP and C-SB-NP to evaluate the effects of the deck construction method. Both specimens exhibited similar behaviors, and their characteristic results, provided in Table 2, were similar, indicating that the use of hooked rebars and steel plates in a 100 mm wide precast bridge deck joint provides structural performance equivalent to a monolithically cast bridge deck.

Cracking Behavior

Figure 10 depicts the displacement distributions of the J100-SB-SP joint under four characteristic loads obtained during the test, using a high-speed PCIe camera. The joint section exhibited an initial cracking load of 470 kN with a displacement of 0.11 mm; this load was similar to that at which relative displacement was first measured by the displacement transducer (Figure 10a). The geometry of the joint section visibly changes with extensive cracking at a load of 600 kN and has a displacement of 0.13 mm. The interface between the joint and precast deck units can be clearly observed at this load in Figure 10b. Joint section cracking began to accelerate at a load of 750 kN and exhibited a higher displacement of 0.19 mm. Corresponding increases in crack width can be observed at both the upper and lower parts of the joint, with relatively small changes occurring at the center (Figure 10c). At the final load of 800 kN, the displacement was greater than 0.19 mm, the widths and lengths of the cracks clearly expanded to trace the joint geometry, and diagonal cracks developed. Furthermore, because the concrete in the joint has a difference in curing date of 28 days from that of the existing concrete, cracks occurred, as shown in Figure 10d. Notably, the evolution of fracture geometry traced on the test specimen as the applied load increased (shown in Figure 11) was found to be similar to the displacement distributions observed using the high-speed PCIe camera. The goal was to obtain a more detailed view of the cracks through this experiment. However, there was no significant difference between the destruction mode confirmed visually and the destruction mode confirmed by the camera. In addition, in the final destruction mode of the experiment, cracks occurred in the contact part of different concretes due to the difference in their curing date.

4. Finite Element Analysis

In this study, the optimal joint configuration obtained from the experimental analysis (J100-HB-SP) was simulated using a three-dimensional (3D) FEM to analyze its structural behavior. This analysis was conducted using the ABAQUS (2021) [37] general-purpose structural analysis software. The model constructed had the same dimensions as the test specimen, which were as follows: 1450 mm × 1900 mm × 240 mm. The concrete was modeled using C3D8R 3D solid elements. The implementations of the precast concrete bridge deck units and CIP joint section were executed separately; as the contact surface between the two cannot be considered as fully integral, it was modeled using a nonlinear spring element (connecting two nodes) in this study (Figure 12a). The concrete had an elastic modulus of 30,000 MPa and Poisson’s ratio of 0.17, with reference to the ACI 318-19 Building Code Requirements for Structural Concrete [38]. The steel plate in the joint, rebars in the concrete, and steel bars for fixing and loading the specimen were implemented using S4R shell elements, T3D2 truss elements, and B31 beam elements, respectively. The steel plate, rebars, and steel bars had an elastic modulus of 200,000 MPa and Poisson’s ratio of 0.3, with reference to the ASTM A615M Standard Specification for Deformed and Plain Carbon-steel Bar for Concrete Reinforcement [39], ASTM A572M Standard Specification for High-strength Low-alloy Columbium–Vanadium Structural Steel [40], and ASTM E8M Standard Test Methods for Tension Testing of Metallic Materials and Road bridge design standards [41,42,43]. Since the rebars and steel bars were embedded in the concrete, the portions of their lengths within the specimen were placed in the model using the embedded element technique.
Curvature control of the model mesh was applied by setting the ratio of the mesh height to length to 1:1, and the mesh size was set to 50 mm. A structured hex was applied for the mesh geometry to prevent distortion. The total number of mesh cells was 6474 (Figure 12b). Hinges were situated at the lower ends of the fixing steel bars to provide a reaction against the applied load. In the actual tests, the steel loading plate attached to the actuator limited the vertical displacement of the precast bridge deck specimen; therefore, rollers were arranged in the orthogonal direction at the corresponding locations in the model to reflect this condition. The tension load was applied equally to the upper and lower parts of the specimen model at the loading bars (Figure 12c). The relative displacement of the joint was subsequently analyzed at the following four characteristic loads: initial cracking, extensive cracking, accelerated cracking, and final load.
Figure 13 shows the displacement distributions obtained for the FEM under each characteristic load. Initial cracking occurred at a load of 482 kN when nonlinear behavior was first observed, and a relative displacement of 0.12 mm was observed across the joint (Figure 13a). The crack width exceeded the allowable crack width (0.3 mm) with extensive cracking at 600 kN, as the relative displacement across the joint increased beyond 0.5 mm (Figure 13b). At 750 kN, the relative displacement owing to cracking accelerated to 0.63 mm, and the interface between the precast units and joint could be clearly observed (Figure 13c). At a final load of 840 kN, the geometry of the joint was clearly visible, with a final relative displacement of 2.29 mm (Figure 13d). Notably, the final crack geometry obtained using the FEM (Figure 13d), the final crack geometry for the actual test specimen (Figure 11), and the crack development observed using the high-speed PCIe camera (Figure 10) are all quite similar.
Figure 14 compares the FEM- and test-obtained load–relative displacement curves. The relative displacement at the initial cracking of the FEM was 0.12 mm at a load of 482 kN, compared with a relative displacement of 0.11 mm at a load of 470 kN for the test specimen. Notably, the final load applied to the FEM (840 kN) was slightly higher than that applied to the test specimen (800 kN) because the former was stiffer than the latter, and the contact surface was more rigid in the FEM than in reality. As a result, a larger load was required to reach a similar cracking condition. However, given that the initial cracking loads and overall cracking behaviors were similar, the load–relative displacement curves were comparable, and the error between the FEM and test results was less than 2%; the FEM was considered able to accurately predict the structural behavior of the longitudinal precast bridge deck joint.

5. Conclusions

In this study, a tension load was applied to a series of precast bridge deck longitudinal joint specimens to determine the influences of the joint width, rebar type, and steel plate. These influences were evaluated to obtain an optimal joint configuration. Finally, a finite element analysis was conducted, and its similarity to the behavior observed in the tests was verified. The results of this study are as follows:
  • When the width of the precast bridge deck joint using hooked rebars and a steel plate was 100 mm (J100-HB-SP), the initial cracking load was 20% higher, and the final load was 18% higher than when the width of the same joint configuration was 150 mm (J150-HB-SP). Therefore, the joint width should be set to 100 mm to ensure that the precast bridge deck joint has high initial cracking and final loads.
  • The use of hooked rebars and a steel plate in a 100 mm wide precast bridge deck joint (J100-HB-SP) resulted in a 61% higher initial cracking load than when no rebars were provided in an otherwise equivalent joint (J100-NB-SP). Thus, steel rebars are required to prevent precast bridge deck joints from cracking at low loads.
  • Although their behaviors were otherwise similar, the final relative displacement of the precast bridge deck joint was larger when using looped rebars and no steel plate (J0-LB-NP) than when using hooked rebars and a steel plate (J100-HB-SP).
  • Similar precast bridge deck joint behaviors were observed when using looped rebars and a steel plate (J0-LB-SP) or hooked rebars and a steel plate (J100-HB-SP), but the final relative displacement of the latter was 38% smaller, owing to the limited connectivity provided by looped rebars. Therefore, hooked rebars should be used to ensure joint connectivity.
  • The overall structural performance of the optimal precast bridge deck joint (J100-HB-SP) was similar to that of an equivalent monolithic CIP bridge deck (C-SB-NP), indicating that J100-HB-SP is a suitable configuration for a precast bridge deck longitudinal joint.
  • The final crack geometry of J100-HB-SP was similar to the final crack geometry observed using a high-speed PCIe camera. In addition, since diagonal cracks did not occur until the final load of 800 kN, the structural behavior of J100-HB-SP can be confirmed as safe.
  • The load–relative displacement curve and overall crack pattern obtained using the FEM were similar to those observed during the test, and the final relative displacements were within 2%. Therefore, the proposed FEM was able to accurately predict the structural behavior of the precast bridge deck longitudinal joint.
  • The gap between the appropriate longitudinal connections on the bridge deck was 100 mm, and the joint between the installed hook reinforcement and steel plate showed the most optimal longitudinal behavior.

Author Contributions

Conceptualization, S.C.; formal analysis, H.N.; investigation, J.H.; data curation, J.H.; writing—original draft preparation, H.L.; writing—reviewing and editing, S.K. and H.L. All authors have read and agreed to the published version of the manuscript.

Funding

This research was supported by a grant (No. 21TBIP-C160991-01) from the Technology Business Innovation Program funded by the Ministry of Land, Infrastructure and Transport of the Korean government.

Institutional Review Board Statement

Not applicable.

Informed Consent Statement

Not applicable.

Data Availability Statement

No new data were created or analyzed in this study. Data sharing is not applicable to this article.

Conflicts of Interest

The authors declare no conflict of interest. The funders had no role in the design of the study; in the collection, analyses, or interpretation of data; in the writing of the manuscript, or in the decision to publish the results.

References

  1. Yee, A.A. Social and environmental benefits of precast concrete technology. PCI J. 2001, 46, 14–19. [Google Scholar] [CrossRef] [Green Version]
  2. Di, J.; Han, B.; Qin, F. Investigation of U-bar joints between precast bridge decks loaded in combined bending and shear. Structures 2020, 27, 37–45. [Google Scholar] [CrossRef]
  3. Leblouba, M.; Barakat, S.; Ahmed, M.S.; Al-Toubat, S. Shear strength at the interface of precast bridge concrete decks and girders subjected to cyclic loading with varying speeds. Eng. Struct. 2019, 196, 109296. [Google Scholar] [CrossRef]
  4. Hu, M.; Jia, Z.; Han, Q.; Ni, Y.; Jiao, C.; Long, P. Shear behavior of innovative high performance joints for precast concrete deck panels. Eng. Struct. 2022, 261, 114307. [Google Scholar] [CrossRef]
  5. El-Khier, M.A.; Morcous, G. Precast concrete deck-to-girder connection using Ultra-High Performance Concrete (UHPC) shear pockets. Eng. Struct. 2021, 248, 113082. [Google Scholar] [CrossRef]
  6. Li, Q.; Song, Z. Ensemble-learning-based prediction of steel bridge deck defect condition. Appl. Sci. 2022, 12, 5442. [Google Scholar] [CrossRef]
  7. Ma, H.Y.; Shi, X.F.; Zhang, Y. Long-term behavior of precast concrete deck using longitudinal prestressed tendons in composite I-girder bridges. Appl. Sci. 2018, 8, 2598. [Google Scholar] [CrossRef]
  8. Cusson, D.; Repette, W.L. Early-age cracking in reconstructed concrete bridge barrier walls. ACI Mater. J. 2000, 97, 438–446. [Google Scholar]
  9. Desmettre, C.; Charron, J.P. Water permeability of reinforced concrete with and without fiber subjected to static and constant tensile loading. Cem. Concr. Res. 2012, 42, 945–952. [Google Scholar] [CrossRef]
  10. Choi, H.K.; Golewski, G. Parametric analysis on seismic performance of hybrid precast concrete beam-column joint. Adv. Civ. Eng. 2020, 2020, 8856327. [Google Scholar] [CrossRef]
  11. Wang, Y.H.; Yu, J.; Liu, J.P.; Zhou, B.X.; Chen, Y.F. Experimental study on assembled monolithic steel-prestressed concrete composite beam in negative moment. J. Constr. Steel. Res. 2020, 167, 105667. [Google Scholar] [CrossRef]
  12. Liu, H.; Kong, P.; Ye, T. Influence of precast member corbels on seismic performance of precast beam-slab-column joints. Adv. Civ. Eng. 2021, 2021, 7107569. [Google Scholar] [CrossRef]
  13. Shen, C.; Song, Y.; Yan, L.; Li, Y.; Ma, X.; He, S.; Han, X. Experimental and numerical investigation on the bearing behavior of curved continuous twin I-girder composite bridge with precast concrete slab. Adv. Civ. Eng. 2021, 2021, 8872092. [Google Scholar] [CrossRef]
  14. Mitchell, G.; Tolnai, M.; Gokani, V.; Picon, R.; Yang, S.; Klingner, R.E.; Williamson, E.B. Design of Retrofit Vehicular Barriers Using Mechanical Anchors; TRB Report No. FHWA/TX-07/0-4823-CT-1; The University of Texas at Austin: Austin, TX, USA, 2006. [Google Scholar]
  15. Charron, J.; Niamba, E.; Massicotte, B. Static and dynamic behavior of high- and ultrahigh-performance fiber-reinforced concrete precast bridge parapets. ASCE J. Br. Eng. 2011, 16, 413–421. [Google Scholar] [CrossRef]
  16. Rueda-García, L.; Senach, J.L.B.; Sosa, P.F.M.; Prada, M.Á.F. Analysis of the shear strength mechanism of slender precast concrete beams with cast-in-place slab and web reinforcement. Eng. Struct. 2021, 246, 113043. [Google Scholar] [CrossRef]
  17. Abokifa, M.; Moustafa, M.A. Experimental behavior of precast bridge deck systems with non-proprietary UHPC transverse field joints. Materials 2021, 14, 6964. [Google Scholar] [CrossRef]
  18. Abdel-Qader, I.; Abu-Amara, F.; Abudayyeh, O. Fractals and independent component analysis for defect detection in bridge decks. Adv. Civ. Eng. 2011, 2011, 506464. [Google Scholar] [CrossRef] [Green Version]
  19. Al-Fakher, U.; Manalo, A.; Ferdous, W.; Aravinthan, T.; Zhuge, Y.; Bai, Y.; Edoo, A. Bending behaviour of precast concrete slab with externally flanged hollow FRP tubes. Eng. Struct. 2021, 241, 112433. [Google Scholar] [CrossRef]
  20. Mander, T.J.; Henley, M.D.; Scott, R.M.; Head, M.H.; Mander, J.B.; Trejo, D. Experimental performance of full-depth precast, prestressed concrete overhang, bridge deck panels. J. Bridge Eng. 2010, 15, 503–510. [Google Scholar] [CrossRef]
  21. Mohd Radzi, N.A.; Hamid, R.; Mutalib, A.A.; Amrul Kaish, A.B.M. A review of precast concrete beam-to-column connections subjected to severe fire conditions. Adv. Civ. Eng. 2020, 2020, 8831120. [Google Scholar] [CrossRef]
  22. Mander, T.J.; Mander, J.B.; Hite Head, M. Modified yield line theory for full-depth precast concrete bridge deck overhang panels. J. Bridge Eng. 2011, 16, 12–20. [Google Scholar] [CrossRef]
  23. Wells, Z.G.; Barr, P.J.; James, P.H. Performance of posttensioned curved-strand connections in transverse joints of precast deck panels. J. Bridge Eng. 2013, 18, 1062–1073. [Google Scholar] [CrossRef]
  24. Li, J.; Wang, Y.; Lu, Z.; Li, J. Experimental study and numerical simulation of a laminated reinforced concrete shear wall with a vertical seam. Appl. Sci. 2017, 7, 629. [Google Scholar] [CrossRef] [Green Version]
  25. Lu, Z.; Wang, Z.; Li, J.; Huang, B. Studies on seismic performance of precast concrete columns with grouted splice sleeve. Appl. Sci. 2017, 7, 571. [Google Scholar] [CrossRef] [Green Version]
  26. Mander, T.J.; Henley, M.D.; Scott, R.M.; Head, M.H.; Mander, J.B.; Trejo, D. Experimental investigation of full-depth precast overhang panels for concrete bridge decks. In Structures Congress 2009: Don’t Mess with Structural Engineers: Expanding Our Role; American Society of Civil Engineers: Reston, VA, USA, 2009; pp. 1–9. [Google Scholar]
  27. Zhu, P.; Ma, Z.Z.; Cao, Q.; French, C.C. Fatigue evaluation of transverse U-bar joint details for accelerated bridge construction. J. Bridge Eng. 2012, 17, 191–200. [Google Scholar] [CrossRef]
  28. Zafar, M.N.; Saleem, M.A.; Xia, J.; Saleem, M.M. Experimental characterization of prefabricated bridge deck panels prepared with prestressed and sustainable ultra-high performance concrete. Appl. Sci. 2020, 10, 5132. [Google Scholar] [CrossRef]
  29. Badie, S.S.; Tadros, M.K.; Girgis, A.F. Full-Depth Precast Concrete Bridge Deck Panel Systems; NCHRP Report 584; Transportation Research Board: Washington, DC, USA, 2008. [Google Scholar]
  30. Ye, H.; Wang, X.; Fang, N.; Su, Z. Low-temperature performance and evaluation index of gussasphalt for steel bridge decks. Adv. Mater. Sci. Eng. Sci. 2019, 2019, 2951412. [Google Scholar] [CrossRef] [Green Version]
  31. Amini, P.; Moghimbeigi, A.; Zayeri, F.; Tapak, L.; Maroufizadeh, S.; Verbeke, G. Longitudinal joint modelling of ordinal and overdispersed count outcomes: A bridge distribution for the ordinal random intercept. Comput. Math. Methods Med. 2021, 2021, 5521881. [Google Scholar] [CrossRef]
  32. Tan, Y.; Zheng, S.; Xiao, H.; Xing, J. Influencing factors of snow melting and deicing on carbon fiber embedded in bridge decks. Adv. Civ. Eng. 2022, 2022, 8773149. [Google Scholar] [CrossRef]
  33. Menkulasi, F.; Roberts-Wollmann, C.L. Behavior of horizontal shear connections for full-depth precast concrete bridge decks on prestressed I-girders. PCI J. 2005, 50, 60–73. [Google Scholar] [CrossRef]
  34. Nasrin, S.; Ibrahim, A. Flexural response of Ultra-High-Performance Concrete (UHPC) hybrid bridge deck connections made with local materials. Constr. Build. Mater. 2021, 270, 121451. [Google Scholar] [CrossRef]
  35. Sriboonma, K. Effects of fillet weld to large-size stud shear connector in full-depth precast bridge deck panel. Mater. Today Proc. 2022, 52, 2548–2554. [Google Scholar] [CrossRef]
  36. Hube, M.A.; Mosalam, K.M. Experimental and computational evaluation of in-span hinges in reinforced concrete box-girder bridges. J. Struct. Eng. 2011, 137, 1245–1253. [Google Scholar] [CrossRef]
  37. ABAQUS. Abaqus 2021. In Dassault Systems; Simulia Corp: Providence, RI, USA, 2021. [Google Scholar]
  38. ACI Committe 318. Building Code Requirements for Structural Concrete (ACI 318-19) and Commentary (ACI 318R-19); American Concrete Institute: Detroi, MI, USA, 2019. [Google Scholar]
  39. ASTM A615/A615M; Standard Specification for Deformed and Plain Carbon-Steel Bar for Concrete Reinforcement. ASTM International: West Conshohocken, PA, USA, 2016.
  40. ASTM A572/A572M; Standard Specification for High-Strength Low-alloy Columbium–Vanadium Structural Steel. ASTM International: West Conshohocken, PA, USA, 2015.
  41. ASTM E8/E8M; Standard Test Methods for Tension Testing of Metallic Materials. ASTM International: West Conshohocken, PA, USA, 2011.
  42. ASHTO. AASHTO LRFD Bridge Design Specification, 4th ed.; American Association of State Highway and Transportation Officials: Washington, DC, USA, 2007. [Google Scholar]
  43. Ministry of Land Transport and Traffic. Explanation of Design Standards for Highway Bridge; Ministry of Land Transport and Traffic: Seoul, Republic of Korea, 2010.
Figure 1. Dimensions of the J100-HB-SP precast bridge deck longitudinal joint. (a) Side view. (b) Top view.
Applsci 12 12892 g001
Figure 2. Details of precast bridge deck longitudinal joint specimens. (a) J150-HB-SP. (b) J100-NB-SP. (c) J0-LB-NP. (d) J0-LB-SP. (e) C-SB-NP.
Applsci 12 12892 g002
Figure 3. J100-HB-SP fabrication process. (a) Fabricating the rebar. (b) Assembling the rebar and form. (c) Curing specimen concrete. (d) Pouring concrete of longitudinal joint.
Applsci 12 12892 g003
Figure 4. Test setup: (a) experimental view, (b) test setup for loading, and (c) measurement of relative displacement.
Applsci 12 12892 g004
Figure 5. Load–relative displacement curves according to joint width.
Applsci 12 12892 g005
Figure 6. Load–relative displacement curves with respect to the presence of hooked rebars.
Applsci 12 12892 g006
Figure 7. Load–relative displacement curves according to rebar type and presence of steel plate.
Applsci 12 12892 g007
Figure 8. Load–relative displacement curves according to rebar type.
Applsci 12 12892 g008
Figure 9. Load–relative displacement relationships according to the construction method.
Applsci 12 12892 g009
Figure 10. Displacement distributions in joint J100-SB-SP at characteristic loads: (a) 470 kN (initial cracking); (b) 600 kN (extensive cracking); (c) 750 kN (accelerated cracking); (d) 800 kN (final load).
Applsci 12 12892 g010aApplsci 12 12892 g010b
Figure 11. Final crack geometry in J100-HB-SP (800 kN). The numbers in the expansion represent the crack tip locations at that load (in kN).
Applsci 12 12892 g011
Figure 12. Mesh and conditions for FEM of J100-HB-SP. (a) View of model components. (b) Model mesh. (c) Load and boundary conditions.
Applsci 12 12892 g012
Figure 13. Displacement distribution in the FEM of J100-HB-SP: (a) 482 kN (initial cracking); (b) 600 kN (extensive cracking); (c) 750 kN (accelerated cracking); (d) 840 kN (final load).
Applsci 12 12892 g013
Figure 14. Comparison of load–relative displacement curves from the test and FEM analysis results of J100-HB-SP.
Applsci 12 12892 g014
Table 1. Test parameters.
Test Unit NameJoint WidthRebar TypeSteel Plate
J100-HB-SP100 mm (J100)Hooked rebar (HB)Steel plate (SP)
J150-HB-SP150 mm (J150)Hooked rebar (HB)Steel plate (SP)
J100-NB-SP100 mm (J100)No rebar (NB)Steel plate (SP)
J0-LB-NPNA (J0) *Looped rebar (LB)No plate (NP)
J0-LB-SPNA (J0) *Looped rebar (LB)Steel plate (SP)
C-SB-NPCast-in-place (C)Straight rebar (SB)No plate (NP)
* The joint widths for the looped rebar specimens are as shown in Figure 2; these values are not applicable (NA) to the joint width comparison, given the differences between the hooked and looped rebar configurations and are indicated by the specimen nomenclature.
Table 2. Test results.
Test Unit NameInitial Cracking Load (kN)Final Load (kN)Final Relative Displacement (mm)
J100-HB-SP4908002.34
J150-HB-SP3906605.15
J100-NB-SP1908005.75
J0-LB-NP4508003.67
J0-LB-SP4608003.23
C-SB-NP4508003.12
Publisher’s Note: MDPI stays neutral with regard to jurisdictional claims in published maps and institutional affiliations.

