Article

The Influence of Processing Time on Morphology, Structure and Functional Properties of PEO Coatings on AZ63 Magnesium Alloy

by
Sorin Georgian Moga
1,
Denis Aurelian Negrea
1,*,
Catalin Marian Ducu
1,2,*,
Viorel Malinovschi
3,
Adriana Gabriela Schiopu
2,
Elisabeta Coaca
4 and
Ion Patrascu
5,*
1
The R&D Center for Innovative Materials, Processes and Products for the Automobile Industry, University Pitesti, 110040 Pitesti, Romania
2
Department of Manufacturing and Industrial Management, University Pitesti, 110040 Pitesti, Romania
3
Department of Environmental Engineering and Applied Engineering Sciences, University Pitesti, 110040 Pitesti, Romania
4
ELSSA Laboratory SRL, 110109 Pitesti, Romania
5
Interdisciplinary Doctoral School, University Pitesti, 110040 Pitesti, Romania
*
Authors to whom correspondence should be addressed.
Appl. Sci. 2022, 12(24), 12848; https://doi.org/10.3390/app122412848
Submission received: 14 November 2022 / Revised: 5 December 2022 / Accepted: 11 December 2022 / Published: 14 December 2022

Abstract

:
The plasma electrolytic oxidation (PEO) surface modification technique was employed for improving the mechanical and anti-corrosion properties of the AZ63 magnesium alloy. Different PEO processing times (5, 10 and 20 min) in a 10 g/L NaAlO2 electrolyte, with no other additives, led to the formation of ceramic coatings with mean thicknesses between 15 and 37 microns. Scanning electron microscopy (SEM) showed that the porosity of the coatings decreased with processing time, but an increase in roughness was observed. X-Ray diffraction phase analysis indicated a coating structure composed of majority magnesium aluminate spinel. The corrosion rate of the coated samples decreased with an order of magnitude compared with the bare alloy. The average micro-hardness values of the PEO-coated samples was up to five times higher than those of the AZ63 alloy.

Graphical Abstract

1. Introduction

AZ series magnesium alloys, with aluminum and zinc as main alloying elements [1], are widely used as materials for structural elements due, mainly, to their low weight and high strength-to weight-ratio [2]. However, reduced wear resistance [3] and high corrosion rates [4] limit their use in top applications for the automotive, aero-spatial and medical industries [5]. Thus, further applications of magnesium alloys require an improvement of those properties [6]. The mechanical and anti-corrosion properties’ enhancement is usually done by adding new alloying elements or by surface modification (coating or surface treatments) [7]. The surface modification approach can be divided into three major techniques classes [8,9,10]: chemical conversion coating (including PEO), physical or chemical deposition methods and modification of the surface microstructure.
One of the most promising, inexpensive and environmentally friendly surface modification techniques is plasma electrolytic oxidation (PEO) [7,11,12,13]. By using high voltages and, in general, an aqueous alkaline electrolyte, the ceramic PEO-obtained coatings exhibit well improved mechanical and corrosion protection properties compared to the base alloy. Silicates, phosphates and aluminates with a series of additives are often used as base electrolytes for plasma electrolytic oxidation of magnesium and its alloys [14]. According to the reviewed scientific literature [4,15,16], PEO surface modification of AZ magnesium alloy series has focused on AZ91D and AZ31 alloys. Several research groups showed that the nature and composition of the substrate affects the composition and the properties of the PEO coatings [17,18].
A widely used AZ series magnesium alloy is AZ63 [19]. Different approaches for mechanical and corrosion properties’ improvement were studied: heat treatment [20,21], thermomechanical treatment [22], reinforcement by alloying with gallium and adding ZrO2 particles [23], calcium doping [24] and tailoring the microstructure of the AZ63 Mg alloy [25].
Very few studies [26] reported the surface modification of AZ63 by PEO coating. We chose to use the AZ63 magnesium alloy because of its relative high content of aluminum (approx. 6%) and zinc (approx. 3%), which could provide better corrosion and mechanical protection properties for PEO coatings obtained on this kind of substrate, as reported by the above-mentioned authors.
Therefore, this study aims to investigate the influence of processing time on the morpho-structural characteristics and mechanical and anticorrosion properties of the PEO coatings on the AZ63 magnesium alloy in an aluminate-based electrolyte.

2. Materials and Methods

2.1. Materials and PEO Experimental Parameters

Commercial cast AZ63 magnesium alloy (provided by SC iP AUTOMATIC DESIGN SRL, Lunca Corbului, Romania) [27], was cut in disc-shape samples with a diameter of 20 mm and thickness of 4 mm. The electrical contact was made using a 2 mm insulated steel rod threaded into the lateral side of the disc. Before starting the plasma electrolytic oxidation experiments, the specimens were mechanically polished (with sandpaper of different granulation up to 4000) and ultrasonically cleaned in acetone. In this work, the surface modification of the AZ63 magnesium alloy samples was achieved by means of PEO processes in an aqueous electrolyte of 10 g/L NaAlO 2 (conductivity—11.5 mS/cm, pH—12.2), without any additives. The PEO processing durations were 5 min (AZ63_5m), 10 min (AZ63_10m) and 20 min (AZ63_20m). A pulsed DC galvanostatic regime, at a constant 2 A applied current (implying a current density of approx. 0.23   A / cm 2 ), frequency of 150 Hz and a mean duty cycle of 42%, comprised the experimental parameters used for PEO surface processing. The experimental set-up is presented in a previous work [28]. The maximum amplitude of the applied voltage was 570 V and the temperature of the electrolyte was kept below 30   .

2.2. Characterization Methods

SEM-EDS surface and cross-section analysis was performed using a Hitachi SU5000 Schottky Field Emission Scanning Electron Microscope, equipped with both secondary and backscattered electrons detectors (BSE), together with energy dispersive X-ray spectrometry (EDS) module for chemical elemental analysis. Sample surface charging was overcome by employing a Low Vacuum and Variable Pressure module set at 30 Pa, 25 kV accelerating voltage and 125 μA emission current. 3D models of the coated samples’ surfaces were generated by using each of the four channels of the BSE detector and the Hitachi Map 3D software. For cross-section PEO thin film analysis, the samples were cut, embedded in conductive resin, gradually polished with abrasive papers having different grain size and finally polished for one hour using IM4000 Ar+ ion beam milling system.
X-ray diffraction (XRD) patterns of the substrate and coated samples were recorded on a Rigaku Ultima IV diffractometer in Bragg–Brentano geometry, using CuKα radiation ( λ = 0.154   , 45 kV and 40 mA) and a D/teX Ultra one-dimensional detector with graphite monochromator. For the phase analysis of the coated samples, XRD patterns were acquired in the 2 θ range of 15 ° 80 ° , with a step of 0.05 ° and a scanning speed of 3 ° / min . The ICDD PDF4+ 2022 database was used for crystalline phase identification.
Microstructural parameters and quantitative phase analysis were performed by whole powder pattern fitting (Rietveld analysis) [29], using Rigaku’s PDXL2 XRD software. Reliable XRPD (X-Ray powder diffraction) microstructural analysis required the detachment of the PEO coatings from the substrate using a procedure adapted from [30]: the coated samples were mechanically polished on the edges and then submitted in a H 2 SO 4 3M solution. The sulfuric acid reacts preferentially with the magnesium alloy substrate producing MgSO 4 and hydrogen gas, and so in a manner of minutes, the coating was detached from the substrate. After ultrasonically cleaning in acetone, the detached coatings were dried, fine grinded and submitted to analysis. The XRD patterns for Rietveld analysis were acquired in the 2 θ range of [ 15 ° 103 ° ], with a step of 0.02 ° and a scanning speed of 0.5 ° / min . The micro-hardness of the coatings was measured using a FALCON 500 micro-Vickers hardness tester from INNOVATEST.
The corrosion resistance of the uncoated and coated samples was tested in 3.5 wt.% NaCl solution at room temperature by measuring the polarization curves with a PARSTAT 4000 electrochemical system (Princeton Applied Research, Oak Ridge, TN, USA) over a voltage range of −0.25 to −1.5 V at 1.0 mV/s in a conventional three-electrode cell.

3. Results and Discussions

3.1. SEM-EDS Sample Surface Analysis

3.1.1. Morphology and Topography

The surface morphology for the raw Mg alloy and PEO treated samples was observed by SEM in backscattered electrons mode at different magnifications (Figure 1a–d).
Figure 1a presents a typical [18] Mg AZ series alloy surface SEM micrograph, with a majority darker α-Mg matrix and β-Mg17Al12 brighter areas. EDS data (not shown here) indicated that in the beta phase area, a rich Al compound, the mean ratio of Al and Mg (approx. 0.7) is 10 times bigger than average ratio for the entire surface of the alloy (approx. 0.06).
For all the PEO-coated samples (Figure 1b–d), data showed typical PEO “pancake-like” surfaces with different porosity, radial surface cracks and areas with chemical elemental contrast. In addition, in zoom boxes from Figure 1b–d, some sintered particles (or nodules) at the border of the re-solidified melt pool [30] can be seen. Similar structures were reported by other groups dealing with PEO on titanium alloys [31,32]. A representative SEM micrograph in both BSE and SE mode is presented in Figure 2.
The formation of “pancake-like” structures, as in Figure 2, indicates strong penetrating plasma discharges [33] and the dielectric properties of the ceramic PEO coating [5]. In Figure 2a, the main surface morphology characteristics are indicated as follows: 1—“deep-pores”; 2—“shallow pores”; 3—radial micro-cracks; 4—sintered particles on the coating surface; 5—central “sink-hole” of a completely closed pore; 6—the re-solidified melt pool [30]. This characteristic morphology, with deep and shallow pores, was also reported by Arunnellaiappan et al. [34], who studied the surface morphology of PEO AA7075 aluminum alloy.
Using ImageJ software for image processing and analysis on SEM images obtained at ×100 magnification for PEO treated samples, the average apparent surfaces porosity were obtained. A representative example of a used SEM image and its correspondent ImageJ pore identification is presented in Figure 3.
Considering the SEM image resolution capabilities and PEO micro-discharge channels, pore size constrain was introduced to account only for pores with an area above 78.5 μ m 2 , which is equivalent to a round pore with a size (diameter) above 10 μ m . No pore shape constrain was added. The data obtained for pore sizes from surface image analysis were quantitatively analyzed, the porosity for each of the three PEO treated samples being calculated as the ratio between total pores area versus total investigated area. The determination of the average porosity was carried out by using SEM (×100 magnification) micrographs from five randomly chosen areas of each sample, and the obtained mean values are presented in Table 1.
The mean porosity values presented in Table 1 show a decrease of the apparent surface porosity with increasing processing time, reaching a level of approx. 11% for the 20 min PEO surface treatment. Higher values (approx. 27%) were reported by Laleh et al. [35] for the PEO on AZ91D Mg alloy in NaAlO2 without additives. A decrease in porosity with increasing processing time could be explained by the PEO coating formation mechanisms [5]: numerous softer plasma discharges in an early stage, followed by lesser, localized and more powerful events when the PEO coatings develop.
Based on the Hitachi SU5000’s capabilities and Hitachi Map 3D software, the mean height parameters of the PEO coatings were determined in order to perform a comparative analysis of the coatings’ roughness evolution with processing time.
Using four surface profiles taken from each of the five areas used previously for porosity analysis, the surface height parameters were determined, as defined in [36]:
standard deviation of the height distribution, or RMS surface roughness
S q = 1 A A z 2 x , y d x d y
mean surface roughness
S a = 1 A A z x , y d x d y
where A is the area of the investigated surface and z(x,y) is the roughness profile in the x and y direction. The SEM height maps were generated in Hitachi Map 3D software by using each of the four channels of the BSE detector. An example of SEM topographic analysis is presented in Figure 4.
In Figure 4, four directional backscatter images (Figure 4a) recorded for each investigated surface were converted into a 3D surface height map (Figure 4b). Using a Hitachi calibration standard, a 3D surface rendering was obtained from the height maps (Figure 4c). A 2D topographic profile (Figure 4d) illustrates the variation of the peak and pit heights on the x direction of the chosen cross-section (where zero level represents the mean plane).
The results for surface roughness analysis, as defined in [36], are presented in Table 2.
The obtained results show similar roughness values for 5 and 10 min and an increase in surface roughness parameters for the 20 min PEO treated. In the early stages of PEO, well uniform distribution of the discharging channel led to lower values of surface roughness. As the processing time increased, the discharge channels were fewer and more localized, which could be the explanation for the increased roughness values of the AZ63_20m sample [37].

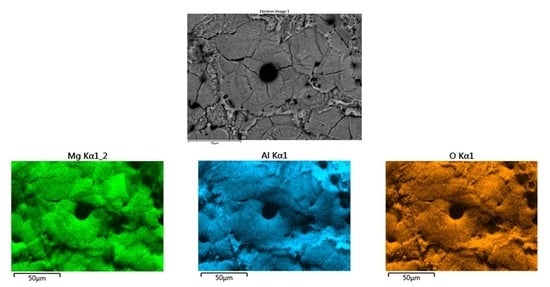
3.1.2. Surface Elemental Composition

First, EDS area scans were performed on a raw Mg alloy in order to extract chemical elemental concentrations. The measured average values (Table 3) from five determinations correspond to an AZ63 Mg alloy [1].
Figure 5 shows the point scans used for identifying the chemical elemental composition corresponding to different surface morphological structures.
Three EDS measurements for each selected structure from representative areas were used to analyze the chemical composition variation of the main elements present in the coatings. The mean values are presented in Table 4.
The qualitative analysis of chemical composition in the measured point scans indicates the formation of magnesium and/or aluminum oxide compounds (a mixture of magnesium oxide, aluminum oxide and magnesium aluminate phases).

3.2. Cross-Section SEM-EDS Analysis

3.2.1. Cross-Section Morphology and Elemental Composition

In order to monitor cross-section chemical elemental distribution for Mg, Al and O, mapping (Figure 6) and EDS line-scan analysis were performed (Figure 7).
The cross-section SEM-EDS analysis show a structure formed by a barrier layer, local Al/Mg rich areas and sandwich structures of alternating Mg and Al increased concentration layers.
Figure 6 indicates a complex, non-uniform structure of the PEO coatings, which evolves with the processing time. Duan et al. [38] showed in their study that the concave regions, rich in aluminum (Figure 6a), appearing in the PEO coatings were the result of the coating formation above the constituent β-phase of the magnesium alloy. They assumed that the coating layers formed above the Mg17Al12 phase were formed by lateral growth of the layers formed above the alpha phase. In Figure 5b,c, it can be seen that areas rich in aluminum are covered by areas rich in magnesium, which is why we believe that a similar growth mechanism is responsible for the formation of PEO coatings on the AZ63 magnesium alloy. The presence of closed cavities in the structure of PEO coatings could be attributed to a mechanism of plastic deformation of the constituent material under the influence of the gas evolution within the coating [32].
Both EDS line-scans and mapping data showed that, for all three investigated samples, there was a non-homogenous ceramic PEO coating with variable cross-section Mg/Al ratios.

3.2.2. Coating Thickness

Coating thickness measurements were performed in cross-section by scanning electron microscopy (SEM) at 300× magnification in 5 different areas. A representative example for each sample is shown in Figure 8.
The obtained mean values are summarized in Table 5.
Figure 8 and Table 5 show that PEO coatings are non-uniform, being thinner in the growth areas above the β-phase (concave regions) and thicker in the areas corresponding to coating formation from the α-Mg matrix. This also explains the high values of mean thickness standard deviations. The barrier layer thickness increased with processing time from a mean value of 0.36 µm for the 5 min PEO treatment, to approx. 0.66 µm for the 10- and 20-min processing times.

3.3. X-Ray Diffraction Analysis

Figure 9 presents the results of the XRD phase analysis of the AZ63 magnesium alloy and of the PEO coatings obtained in 10 g/L NaAlO 2 for a process duration of 5 min (AZ63_5m), 10 min (AZ63_10m) and 20 min (AZ63_20m).
At the bottom of Figure 9, one can see a typical XRD pattern of an AZ63 magnesium alloy, with results consistent with other reports [19,25]. It shows high-intensity lines related to the Mg α-matrix (DB card 04-006-2605) and some Mg17Al12 β-phase (DB card 04-010-7477) less-intense XRD lines.
XRD data show that all the PEO treated samples are composed mainly of MgAl2O4 (DB card 04-007-4175), with a minor contribution from the MgO (DB card 01-076-2583) crystalline phase. Due to the porosity and limited thickness of the coatings, line profiles associated with the substrate are also present in the diffraction patterns of the coated samples. The magnesium alloy diffraction lines’ intensity decreases with processing time, suggesting the formation of thicker coatings. No Zn specific crystalline phase was detected.
The formation of MgAl2O4 as a majority coating constituent is promoted by substrate [26] and electrolyte composition [39].
XRD patterns of the coatings detached from the magnesium alloy according to the procedure described in Section 2.2, are shown in Figure 10.
Better XRD resolution and the powder state of the coatings allowed the identification, aside from the spinel and the oxide crystalline phases, of another possible constituent crystalline phase—γ-Al0.667O (a non-stoichiometric γ-Al2O3 phase, DB card number 04-016-1445).
The position of the diffraction peaks from PDF cards used for qualitative phase analysis are presented in Appendix A (Figure A1, Figure A2, Figure A3, Figure A4, Figure A5, Figure A6 and Figure A7).
Assuming the correct identification of the alumina crystalline phase, the quantitative phase analyses and microstructural parameters refined by the Rietveld method are presented in Table 6.
The Rietveld analysis results indicate an increase in MgAl2O4 coating content with processing time. Li et al. [40] showed that an increased concentration of sodium aluminate in the electrolyte can also lead to the formation of a larger amount of magnesium spinel by PEO processing of the AM50 alloy. Since the hardness of MgAl2O4 is higher than the hardness of the periclase crystalline phase, an increased percent of magnesium spinel at the expense of MgO in the PEO coatings is of interest for applications that require hard coatings [41,42].
There is no correlation between processing time and the mean crystallite size, all the PEO coatings being nanostructured. Table 6 does not include microstructural parameters for magnesium oxide and the supposed gamma-alumina, given the quality and number of XRD line profiles associated with those crystalline phases.
The reaction mechanism for magnesium oxide and magnesium aluminate spinel formation are explained in detail in a 2017 Hussein et al. paper [14].
The presence of aluminum-rich areas can be due to:
-
Decomposition of the electrolyte under the influence of the strong discharges that penetrate the layer, which leads to the presence of electrolyte species on the surface of the pancakes and at the coating/substrate interface after a single discharge [5]. Thus, aluminum ions from the electrolyte and oxygen species present in the pores and discharge channel forms aluminum oxide allotropic forms;
-
Ejecting process of molten magnesium and alloying elements (approx. 6% aluminum), followed by an oxidation process in the discharge channel, and finally quenching and deposition. The formation of γ-alumina is associated with a fast cooling rate [43].
It was shown [26] that the alloying elements of the AZ series can be simultaneously oxidized along with Mg, and the data obtained from the SEM-EDS cross-section analysis support the importance of alloying elements in the formation of the PEO coatings

3.4. Vickers Micro-Hardness

The mean values of Vickers micro-hardness were evaluated as a result of 6 measurements in 6 different areas, with a 300 g applied force and 10 s dwelling time. The 300 g applied force was chosen so that the penetration depth (h) satisfied the relationship h ≤ d/7 (where d is the mean size of the indentation diagonal had a maximal value of 59 μm).
Mean values of the Vickers micro-hardness are presented in Table 7 and show higher micro-hardness values proportional with the plasma electrolytic oxidation process time.
It is believed that this improved hardness is a result of time-related reduced porosity and an increased ratio of crystalline material in the coating, in our case MgAl2O4 spinel [39].
The AZ63_20m coating reached a Vickers micro-hardness of 4.4 GPa, which means that the coating processed for 20 min was five times harder than the AZ63 magnesium alloy substrate, with similar values reported in [40].

3.5. Potentiodynamic Polarization Tests

Potentiodynamic polarization measurements were used to estimate the corrosion behavior of the AZ63 Mg alloy uncoated and PEO-coated samples in 3.5% NaCl solution. A three-electrode conventional electrochemical cell connected to a Parstat 4000 potentiostat system was employed for potentiodynamic polarization tests at a constant 30 °C temperature. After 30 min stabilization, the potentiodynamic polarization curves were measured from la −0.25 V vs. open circuit potential to +1.5 V vs. open circuit potential at a scanning speed of 1 mV/s. The obtained polarization curves (corrosion current density as a function of measured potential vs. saturated calomel electrode—SCE) are shown in Figure 11.
The calculated corrosion parameters—constants anodic Tafel slope βa and cathodic Tafel slope βc—were obtained by Tafel extrapolation from the polarization curves; corrosion potential (Ecorr), corrosion current density (icorr) and corrosion rate (Vcorr), are presented in Table 8.
The cathodic reaction (2H+ + 2e = H2) presents bigger values in all cases in comparison with metal corrosion, typically for Mg alloys [4]. Total cathodic current corresponds to the cumulating of the currents for both hydrogen (H) and oxygen (O) reduction reactions and has to be balanced by the single anodic reaction current. Depending on the level of electrolyte agitation, the magnitude of the limiting current for the oxygen reduction will vary. The Ecorr of the PEO coating was lower than that of the Mg alloy, especially for the AZ63_10m sample. For the thinner layer obtained in the first conditions (AZ63_5m), the Ecorr value was near the base material and this fact can be associated with the micro-pores’ presence on the PEO coating surface. The electrolyte could penetrate into the inner PEO layer through the micro-pores and cause the corrosion starting and occurring [4,44]. Increasing the layer thickness improves the corrosion resistance behavior of the material by sealing part of the pores, and the contact between the base material and saline solution is reduced much more. Values of icorr generally are connected to a possible corrosion rate of the material. All coated samples presented an improvement in corrosion current on the surface with a decrease of 2 order of magnitude. The results confirmed an improvement of corrosion resistance of the material through PEO coatings. Corrosion resistance increased with an increasing cathodic current density, which may be attributed to low porosity and more compactness of the coatings produced [17,45].
In general, the overall protective effectiveness of PEO coatings is determined by [14]:
-
Coating thickness, crystalline phase composition, roughness, level of porosity and defects for mechanical properties;
-
Coating thickness, structure and chemical composition, level of porosity and the integrity of the coating/substrate barrier layer for anti-corrosion properties.
In addition, an important key factor is the structure and chemical composition of the substrate material, in our case the AZ63 Mg alloy, which has a huge influence on the nature of the PEO coating. Krishna et al. [26] reported a strong relationship between the protective properties of the PEO coatings (obtained on binary and ternary magnesium alloys in a mixture of sodium silicate, sodium aluminate and potassium hydroxide electrolyte) and the content of aluminum and zinc in the substrate material. They showed that a high content of aluminum promotes the formation of the MgAl2O4 phase, while the role of the Zn alloying element is to increase the coating formation rate.
A high ratio of aluminum-related crystalline phase, which corresponds to the formation of the coating from the substrate’s β-phase, led to more defective coatings, hence the lower protective properties.
As processing time increases, the α-Mg phase plays a predominant role in coating formation, promoting the increase in MgAl2O4 content.
The reduction of the macro-scale defects and level of porosity, along with the increase in overall and barrier layer thicknesses of the PEO samples with longer processing time, are responsible for better corrosion protection, since it will be harder for corrosive species to reach the substrate. Better corrosion protective properties with increasing processing time could be attributed also to the increase of the MgAl2O4 crystalline phase ratio in the coating with a longer processing time, as shown by XRD analysis. It has been shown [14] that an increase in spinel volume fraction is beneficial for corrosion protective properties, being more stable.
The higher content of the spinel phase with a longer PEO duration, along with the increasing thickness of the coating and reduced porosity, could also be responsible for the increase in micro-hardness. The MgAl2O4 crystalline phase is much harder than MgO [40].
Further research must be carried out to determine the influence of the aluminum-related crystalline phase on the protective properties of obtained PEO coatings. More detailed mechanical properties investigations, such as wear and adherence, are also future targeted in order to test the quality of the coatings.

4. Conclusions

In this paper, the influence of time on the composition, structure and protective properties of PEO coatings on the AZ63 Mg alloy formed in aluminate electrolyte was investigated. The time dependence of the morpho-structural features investigated by SEM-EDS and XRD analysis showed that:
-
The PEO coatings formed on AZ63 magnesium alloy, in NaAlO2 electrolyte without any additives, were mainly composed of Mg, Al and O;
-
Although the PEO coatings have similar characteristic surface structures, a decrease in relative apparent porosity and an increase in surfaces roughness with increasing processing time was observed;
-
The PEO coatings were mainly composed of the MgAl2O4 crystalline phase, with its relative ratio increasing with processing time;
-
The coatings (and barrier layer) thickness and compactness increased with processing time.
The functional surface properties determined by means of Vickers micro-hardness and potentiodynamic polarization measurements were correlated with the time-dependent morpho-structural features, thus:
-
A 2 order of magnitude improvement of the corrosion protective properties was correlated with an increase in MgAl2O4 content, coatings thickness and a decrease in apparent porosity level;
-
A 5 times increase of the Vickers micro-hardness was correlated with an increase in roughness, thickness and crystalline phase composition of the coatings.

Author Contributions

Conceptualization, S.G.M. and V.M.; data curation, A.G.S.; formal analysis, S.G.M.; investigation, S.G.M., D.A.N., A.G.S. and E.C.; supervision, S.G.M., C.M.D. and I.P.; writing—original draft, S.G.M.; writing—review and editing, D.A.N., C.M.D. and I.P. All authors have read and agreed to the published version of the manuscript.

Funding

This research received no external funding.

Institutional Review Board Statement

Not applicable.

Informed Consent Statement

Not applicable.

Data Availability Statement

Not applicable.

Conflicts of Interest

The authors declare no conflict of interest.

Appendix A

The Figure A1, Figure A2, Figure A3, Figure A4, Figure A5, Figure A6 and Figure A7 present the position of the diffraction peaks from PDF cards, as generated by PDXL2 software, used for qualitative phase analysis for all the analyzed samples: AZ63 alloy, AZ63_5m PEO coating (5 min processing time), AZ63_10m PEO coating (10 min processing time), AZ63_20m PEO coating (20 min processing time), 5m_powder (AZ63_5m detached from substrate), 10m_powder (AZ63_10m detached from substrate) and 20m_powder (AZ63_20m detached from substrate). “*DB pattern” annotation means that the position of the peak bars in the presented figures are the exact positions of the corresponding crystalline phases as recorded in PDF4+ database.
Figure A1. AZ63 alloy—XRD qualitative phase analysis with displayed PDF cards peak bars.
Applsci 12 12848 g0a1
Figure A2. AZ63_5m sample—XRD qualitative phase analysis with displayed PDF cards peak bars.
Applsci 12 12848 g0a2
Figure A3. AZ63_10m sample—XRD qualitative phase analysis with displayed PDF cards peak bars.
Applsci 12 12848 g0a3
Figure A4. AZ63_20m sample—XRD qualitative phase analysis with displayed PDF cards peak bars.
Applsci 12 12848 g0a4
Figure A5. AZ63_5m in powder-form sample—XRD qualitative phase analysis with displayed PDF cards peak bars.
Applsci 12 12848 g0a5
Figure A6. AZ63_10m in powder form sample—XRD qualitative phase analysis with displayed PDF cards peak bars.
Applsci 12 12848 g0a6
Figure A7. AZ63_20m in powder form sample—XRD qualitative phase analysis with displayed PDF cards peak bars.
Applsci 12 12848 g0a7

References

  1. Moosbrugger, C. Engineering Properties of Magnesium Alloys; ASM International: Almere, The Netherlands, 2017; pp. 1–12. [Google Scholar]
  2. Trang, T.T.T.; Zhang, J.H.; Kim, J.H.; Zargaran, A.; Hwang, J.H.; Suh, B.-C.; Kim, N.J. Designing a magnesium alloy with high strength and high formability. Nat. Commun. 2018, 9, 2522. [Google Scholar] [CrossRef] [PubMed] [Green Version]
  3. Manroo, S.A.; Khan, N.Z.; Ahmad, B. Study on surface modification and fabrication of surface composites of magnesium alloys by friction stir processing: A review. J. Eng. Appl. Sci. 2022, 69, 25. [Google Scholar] [CrossRef]
  4. Barati Darband, G.; Aliofkhazraei, M.; Hamghalam, P.; Valizade, N. Plasma electrolytic oxidation of magnesium and its alloys: Mechanism, properties and applications. J. Magnes. Alloy. 2017, 5, 74–132. [Google Scholar] [CrossRef]
  5. Tu, W.; Cheng, Y.; Wang, X.; Zhan, T.; Han, J.; Cheng, Y. Plasma electrolytic oxidation of AZ31 magnesium alloy in aluminate-tungstate electrolytes and the coating formation mechanism. J. Alloys Compd. 2017, 725, 199–216. [Google Scholar] [CrossRef]
  6. Tan, J.; Ramakrishna, S. Applications of Magnesium and Its Alloys: A Review. Appl. Sci. 2021, 11, 6861. [Google Scholar] [CrossRef]
  7. Predko, P.; Rajnovic, D.; Grilli, M.; Postolnyi, B.; Zemcenkovs, V.; Rijkuris, G.; Pole, E.; Lisnanskis, M. Promising Methods for Corrosion Protection of Magnesium Alloys in the Case of Mg-Al, Mg-Mn-Ce and Mg-Zn-Zr: A Recent Progress Review. Metals 2021, 11, 1133. [Google Scholar] [CrossRef]
  8. Kaseem, M.; Dikici, B. Optimization of Surface Properties of Plasma Electrolytic Oxidation Coating by Organic Additives: A Review. Coatings 2021, 11, 374. [Google Scholar] [CrossRef]
  9. Daroonparvar, M.; Bakhsheshi-Rad, H.R.; Saberi, A.; Razzaghi, M.; Kasar, A.K.; Ramakrishna, S.; Menezes, P.L.; Misra, M.; Ismail, A.F.; Sharif, S.; et al. Surface modification of magnesium alloys using thermal and solid-state cold spray processes: Challenges and latest progresses. J. Magnes. Alloy. 2022, 10, 2025–2061. [Google Scholar] [CrossRef]
  10. Yan, Y.; Liu, X.; Xiong, H.; Zhou, J.; Yu, H.; Qin, C.; Wang, Z. Stearic Acid Coated MgO Nanoplate Arrays as Effective Hydrophobic Films for Improving Corrosion Resistance of Mg-Based Metallic Glasses. Nanomaterials 2020, 10, 947. [Google Scholar] [CrossRef]
  11. Kaseem, M.; Fatimah, S.; Nashrah, N.; Ko, Y.G. Recent progress in surface modification of metals coated by plasma electrolytic oxidation: Principle, structure, and performance. Prog. Mater. Sci. 2020, 117, 100735. [Google Scholar] [CrossRef]
  12. Štrbák, M.; Kajánek, D.; Knap, V.; Florková, Z.; Pastorková, J.; Hadzima, B.; Goraus, M. Effect of Plasma Electrolytic Oxidation on the Short-Term Corrosion Behaviour of AZ91 Magnesium Alloy in Aggressive Chloride Environment. Coatings 2022, 12, 566. [Google Scholar] [CrossRef]
  13. Esmaeili, M.; Tadayonsaidi, M.; Ghorbanian, B. The effect of PEO parameters on the properties of biodegradable Mg alloys: A review. Surf. Innov. 2021, 9, 184–198. [Google Scholar] [CrossRef]
  14. Hussein, R.O.; Nie, X.; Northwood, D.O. Plasma Electrolytic Oxidation Coatings on Mg-Alloys for Improved Wear and Corrosion Resistance. Corros. Mater. Perform. Cathodic Prot. 2017, 99, 133–147. [Google Scholar]
  15. Fattah-Alhosseini, A.; Chaharmahali, R.; Babaei, K. Impressive strides in amelioration of corrosion and wear behaviors of Mg alloys using applied polymer coatings on PEO porous coatings: A review. J. Magnes. Alloy. 2022, 10, 1171–1190. [Google Scholar] [CrossRef]
  16. Chaharmahali, R.; Fattah-Alhosseini, A.; Nouri, M.; Babaei, K. Improving surface characteristics of PEO coatings of Mg and its alloys with zirconia nanoparticles: A review. Appl. Surf. Sci. Adv. 2021, 6, 100131. [Google Scholar] [CrossRef]
  17. Brady, M.P.; Leonard, D.N.; McNally, E.A.; Kish, J.R.; Meyer, H.M.; Cakmak, E.; Davis, B. Magnesium Alloy Effects on Plasma Electrolytic Oxidation Electro-Ceramic and Electro-Coat Formation and Corrosion Resistance. J. Electrochem. Soc. 2019, 166, C492–C508. [Google Scholar] [CrossRef]
  18. Wei, F.; Zhang, W.; Zhang, T.; Wang, F. Effect of variations of Al content on microstructure and corrosion resistance of PEO coatings on Mg Al alloys. J. Alloys Compd. 2017, 690, 195–205. [Google Scholar] [CrossRef]
  19. Li, J.; Jiang, Q.; Sun, H.; Li, Y. Effect of heat treatment on corrosion behavior of AZ63 magnesium alloy in 3.5 wt.% sodium chloride solution. Corros. Sci. 2016, 111, 288–301. [Google Scholar] [CrossRef] [Green Version]
  20. Incesu, A.; Güngör, A. Effect of different heat treatment conditions on microstructural and mechanical behaviour of AZ63 magnesium alloy. Adv. Mater. Process. Technol. 2015, 1, 243–253. [Google Scholar] [CrossRef]
  21. Liu, C.; Xin, Y.; Tang, G.; Chu, P.K. Influence of heat treatment on degradation behavior of bio-degradable die-cast AZ63 magnesium alloy in simulated body fluid. Mater. Sci. Eng. A 2007, 456, 350–357. [Google Scholar] [CrossRef] [Green Version]
  22. Jafari, H.; Idris, M.; Ourdjini, A.; Payganeh, G. Effect of thermomechanical treatment on microstructure and hardness behavior of AZ63 magnesium alloy. Acta Met. Sin. (Eng. Lett.) 2009, 22, 401–407. [Google Scholar] [CrossRef]
  23. Khokhlova, J.; Khokhlov, M.; Synyuk, V. Magnesium alloy AZ63A reinforcement by alloying with gallium and using high-disperse ZrO2 particles. J. Magnes. Alloy. 2016, 4, 265–269. [Google Scholar] [CrossRef] [Green Version]
  24. Zhang, L.; Cao, Z.; Liu, Y.; Su, G.; Cheng, L. Effect of Al content on the microstructures and mechanical properties of Mg–Al alloys. Mater. Sci. Eng. A 2009, 508, 129–133. [Google Scholar] [CrossRef]
  25. Pei, Y.; Gui, Y.; Huang, T.; Chen, F.; Guo, J.; Zhong, S.; Song, Z. Microstructure and corrosion behaviors of AZ63 magnesium alloy fabricated by accumulative roll bonding process. Mater. Res. Express 2020, 7, 066525. [Google Scholar] [CrossRef]
  26. Krishna, L.R.; Poshal, G.; Jyothirmayi, A.; Sundararajan, G. Relative hardness and corrosion behavior of micro arc oxidation coatings deposited on binary and ternary magnesium alloys. Mater. Des. 2015, 77, 6–14. [Google Scholar] [CrossRef]
  27. IPAD Website. Available online: https://ipad.ro/ (accessed on 1 November 2022).
  28. Malinovschi, V.; Marin, A.H.; Ducu, C.; Moga, S.; Andrei, V.; Coaca, E.; Craciun, V.; Lungu, M.; Lungu, C.P. Improvement of Mechanical and Corrosion Properties of Commercially Pure Titanium Using Alumina PEO Coatings. Coatings 2021, 12, 29. [Google Scholar] [CrossRef]
  29. Rietveld, H.M. Line profiles of neutron powder-diffraction peaks for structure refinement. Acta Crystallogr. 1967, 22, 151–152. [Google Scholar] [CrossRef]
  30. Curran, J. Thermal and Mechanical Properties of Plasma Electrolytic Oxide Coatings. Ph.D. Thesis, University of Cambridge, Cambridge, UK, 2005. [Google Scholar]
  31. Yao, Z.; Jiang, Y.; Jia, F.; Jiang, Z.; Wang, F. Growth characteristics of plasma electrolytic oxidation ceramic coatings on Ti–6Al–4V alloy. Appl. Surf. Sci. 2008, 254, 4084–4091. [Google Scholar] [CrossRef]
  32. Aliasghari, S.; Němcová, A.; Skeldon, P.; Thompson, G. Influence of coating morphology on adhesive bonding of titanium pre-treated by plasma electrolytic oxidation. Surf. Coat. Technol. 2016, 289, 101–109. [Google Scholar] [CrossRef]
  33. Hussein, R.O.; Nie, X.; O Northwood, D.; Yerokhin, A.; Matthews, A. Spectroscopic study of electrolytic plasma and discharging behaviour during the plasma electrolytic oxidation (PEO) process. J. Phys. D Appl. Phys. 2010, 43, 105203. [Google Scholar] [CrossRef]
  34. Arunnellaiappan, T.; Babu, N.K.; Krishna, L.R.; Rameshbabu, N. Influence of frequency and duty cycle on microstructure of plasma electrolytic oxidized AA7075 and the correlation to its corrosion behavior. Surf. Coat. Technol. 2015, 280, 136–147. [Google Scholar] [CrossRef]
  35. Laleh, M.; Kargar, F.; Rouhaghdam, A.S. Formation of a compact oxide layer on AZ91D magnesium alloy by microarc oxidation via addition of cerium chloride into the MAO electrolyte. J. Coat. Technol. Res. 2011, 8, 765–771. [Google Scholar] [CrossRef]
  36. ISO 25178-2; Geometrical Product Specifications (GPS)—Surface Texture: Areal—Part 2: Terms, Definitions and Surface Texture Parameters. International Organization for Standardization: Geneva, Switzerland, 2012.
  37. Mojsilović, K.; Lačnjevac, U.; Stojanović, S.; Damjanović-Vasilić, L.; Stojadinović, S.; Vasilić, R. Formation and Properties of Oxide Coatings with Immobilized Zeolites Obtained by Plasma Electrolytic Oxidation of Aluminum. Metals 2021, 11, 1241. [Google Scholar] [CrossRef]
  38. Duan, H.; Yan, C.; Wang, F. Growth process of plasma electrolytic oxidation films formed on magnesium alloy AZ91D in silicate solution. Electrochim. Acta 2007, 52, 5002–5009. [Google Scholar] [CrossRef]
  39. Sieber, M.; Simchen, F.; Scharf, I.; Lampke, T. Formation of a Spinel Coating on AZ31 Magnesium Alloy by Plasma Electrolytic Oxidation. J. Mater. Eng. Perform. 2016, 25, 1157–1162. [Google Scholar] [CrossRef]
  40. Li, X.; Liu, X.; Luan, B.L. Corrosion and wear properties of PEO coatings formed on AM60B alloy in NaAlO2 electrolytes. Appl. Surf. Sci. 2011, 257, 9135–9141. [Google Scholar] [CrossRef]
  41. Ganesh, I. A Review on Magnesium Aluminate (MgAl2O4) Spinel: Synthesis, Processing and Applications. Int. Mater. Rev. 2013, 58, 63–112. [Google Scholar] [CrossRef]
  42. Wei, Y.; Gu, S.; Fang, H.; Luo, W.; Zhang, X.; Wang, L.; Jiang, W. Properties of MgO transparent ceramics prepared at low temperature using high sintering activity MgO powders. J. Am. Ceram. Soc. 2020, 103, 5382–5391. [Google Scholar] [CrossRef]
  43. Xue, W.; Deng, Z.; Chen, R.; Zhang, T. Growth regularity of ceramic coatings formed by microarc oxidation on Al–Cu–Mg alloy. Thin Solid Film 2000, 372, 114–117. [Google Scholar] [CrossRef]
  44. Dou, J.; Wang, J.; Li, H.; Lu, Y.; Yu, H.; Chen, C. Enhanced corrosion resistance of magnesium alloy by plasma electrolytic oxidation plus hydrothermal treatment. Surf. Coat. Technol. 2021, 424, 127662. [Google Scholar] [CrossRef]
  45. Toulabifard, A.; Rahmati, M.; Raeissi, K.; Hakimizad, A.; Santamaria, M. The Effect of Electrolytic Solution Composition on the Structure, Corrosion, and Wear Resistance of PEO Coatings on AZ31 Magnesium Alloy. Coatings 2020, 10, 937. [Google Scholar] [CrossRef]
Figure 1. SEM images obtained at different magnifications (100× and 700× in zoom box) for raw Mg alloy (a) and PEO treated samples: AZ63_5m (b), AZ63_10m (c) and AZ63_20m (d).
Applsci 12 12848 g001
Figure 2. SEM micrographs in BSE (a) and SE (b) mode of a representative area of the PEO coating surface for the sample AZ63_20m.
Applsci 12 12848 g002
Figure 3. Example of a used SEM image ×100 (a) and ImageJ pore identification (b) of the sample AZ63_10m surface.
Applsci 12 12848 g003
Figure 4. Example of a 3D SEM-BSE topographical analysis performed on sample AZ63_10m: the four BSE images acquired on the same surface by the four channels of the BSE detector (a); generated 2D surface height map (b); 3D surface rendering (c); topographic cross-section profile (d).
Applsci 12 12848 g004
Figure 5. Surface point-scans EDS analysis on “pancake-like” areas: P1—deep pore; P2—shallow pore; P3—re-solidified melt pool; P4—sintered particles for AZ63_5m (a), AZ63_10m (b) and AZ63_20m (c) samples.
Applsci 12 12848 g005
Figure 6. Cross-section morphology and EDS mapping of main coating elements for sample AZ63_5m (a), AZ63_10m (b) and AZ63_20m (c).
Applsci 12 12848 g006
Figure 7. Cross-section EDS line-scan analysis for sample AZ63_5m (a), AZ63_10m (b) and AZ63_20m (c).
Applsci 12 12848 g007
Figure 8. Overall coatings (left) and barrier layer (right) thickness of AZ63_5m (a), AZ63_10m (b) and AZ63_20m (c) samples.
Applsci 12 12848 g008
Figure 9. XRD patterns of AZ63 magnesium alloy and coated samples.
Applsci 12 12848 g009
Figure 10. XRD patterns of the detached PEO coatings (inset: zoom on the 40°–70° 2θ range).
Applsci 12 12848 g010
Figure 11. Polarization curves for AZ63 magnesium alloy in 3.5% NaCl: AZ63 alloy, 5 min PEO processed (AZ63_5m), 10 min PEO processed (AZ63_10m) and 20 min PEO processed (AZ63_20m).
Applsci 12 12848 g011
Table 1. Mean porosity values of the PEO treated surfaces.
Sample CodePorosity ± SD (%)
AZ63_5m19.17 ± 1.96
AZ63_10m14.59 ± 1.40
AZ63_20m11.30 ± 1.36
Table 2. Surface roughness analysis.
Sample CodeSq ± SD (µm)Sa ± SD (μm)
AZ63_5m5.11 ± 2.084.28 ± 2.04
AZ63_10m5.24 ± 0.364.17 ± 0.29
AZ63_20m6.67 ± 1.295.23 ± 1.03
Table 3. EDS area scan quantitative chemical elemental analysis of raw Mg alloy.
Element ± SD (wt%)
MgAlZnMnSi
91.55 ± 0.055.36 ± 0.042.83 ± 0.030.17 ± 0.010.09 ± 0.01
Table 4. Chemical composition of the selected representative PEO coatings’ surfaces.
Sample Point Scan P1Point Scan P2Point Scan P3Point Scan P4
Mg
(wt%)
Al
(wt%)
O
(wt%)
Mg
(wt%)
Al
(wt%)
O
(wt%)
Mg
(wt%)
Al
(wt%)
O
(wt%)
Mg
(wt%)
Al
(wt%)
O
(wt%)
AZ63_5m23.70 ± 0.1130.85 ± 0.1445.44 ± 0.1722.19 ± 0.0932.40 ± 0.2047.36 ± 0.1124.08 ± 0.0630.70 ± 0.0845.22 ± 0.0923.68 ± 0.0530. 59 ± 0.0945.73 ± 0.08
AZ63_10m26.43 ± 0.1329.35 ± 0.1444.22 0.17±27.11 ± 0.1328.53 ± 0.1444.35 ± 0.1732.40 ± 0.0525.16 ± 0.0542.44 ± 0.0627.46 ± 0.0531.53 ± 0.0641.01 ± 0.07
AZ63_20m20.38 ± 0.1033.18 ± 0.1246.44 ± 0.1524.23 ± 0.1230.71 ± 0.1445. 06 ± 0.1725.23 ± 0.0629.88 ± 0.0844.89 ± 0.0923.00 ± 0.0433.47 ± 0.0543.53 ± 0.06
Table 5. Coating and barrier layer mean thickness.
SampleCoating Thickness (µm)Barrier Layer Thickness (µm)
AZ63_5m15.14 ± 4.210.36 ± 0.06
AZ63_10m23.78 ± 11.640.66 ± 0.08
AZ63_20m36.60 ± 9.220.67 ± 0.05
Table 6. Quantitative phase analysis and microstructural parameters of the PEO coatings detached from the substrate (in powder form).
SamplePhase CompositionQuantitative Phase Composition (wt%)—Rietveld Analysis Crystallite Mean Size (nm)
AZ63_5mMgAl2O482.2 ± 0.435.9 ± 1.6
MgO7.5 ± 0.4NA
gamma-Al0.667O10.3 ± 1.2 NA
AZ63_10mMgAl2O489.2 ± 0.333.3 ± 0.3
MgO7.1 ± 0.4NA
gamma-Al0.667O3.7 ± 0.5NA
AZ63_20mMgAl2O491.2 ± 0.235.0 ± 0.3
MgO4.9 ± 0.2NA
gamma-Al0.667O3.8 ± 0.2NA
Table 7. Coating Vickers micro-hardness.
SampleHV/0.3 (GPA)
AZ630.88 ± 0.09
AZ63_5m2.04 ± 0.09
AZ63_10m3.42 ± 0.17
AZ63_20m4.44 ± 0.12
Table 8. Calculated corrosion parameters.
Sampleβa
(mV)
βc
(mV)
Ecorr
(V vs. SCE)
icorr (A/cm2)Vcorr (mmpy)
AZ6320.6222.7−1.4951.0 × 10−511.1
AZ63_5m77.85404.8−1.4815.6 × 10−54.0
AZ63_10m30.01647.5−1.352.91 × 10−52.4
AZ63_20m37.56419.04−1.390.83 × 10−50.8
Publisher’s Note: MDPI stays neutral with regard to jurisdictional claims in published maps and institutional affiliations.

