Article

Monthly Precipitation over Northern Middle Atlas, Eastern Morocco: Homogenization and Trends

1
Department of Geography, FLSH Sais, University Sidi Mohamed Ben Abdallah, Fez 30050, Morocco
2
Department of Geography, Laboratoire Territoire Patrimoine et Histoire, FLSH Dhar El-Mehraz, Sidi Mohamed Ben Abdellah University, Fez 30050, Morocco
3
Department of Civil Engineering, The City College of New York, New York, NY 10031, USA
4
Department of Earth and Environmental Sciences, City University of New York Graduate Center, New York, NY 10031, USA
*
Author to whom correspondence should be addressed.
Appl. Sci. 2022, 12(23), 12496; https://doi.org/10.3390/app122312496
Submission received: 14 November 2022 / Revised: 30 November 2022 / Accepted: 3 December 2022 / Published: 6 December 2022
(This article belongs to the Special Issue Climate Change on Water Resource)

Abstract

:
The lack of a complete and reliable data series often represents the main difficulty in carrying out climate studies. Diverse causes, such as human and instrumental errors, false and incomplete records, and the use of obsolete equipment in some meteorological stations, give rise to inhomogeneities that do not represent climatic reality. This work in the northern part of the Moroccan Middle Atlas used 22 meteorological stations with sometimes-incomplete monthly precipitation data from 1970 to 2019. The homogenization and estimation of the missing data were carried out with the R software package Climatol version 3.1.1. The trends in the series were quantified by the Mann–Kendall nonparametric test. The results obtained show a low root mean square error (RMSE), between the original and homogenized data, of between 0.5 and 38.7 mm per month, with an average of 8.5 mm. Rainfall trends for the months of December through June are generally downward. These negative trends are significantly stronger in the southern and eastern parts of the study area, especially during the month of April (the wettest month). On the other hand, July shows positive trends, with 71% of stations having an increasing precipitation tendency, although only five (or 1/3) of these are statistically significant. From August to November, generally positive trends were also observed. For these months, the percentage of series with a positive and significant trend varied between 55 and 77%.

1. Introduction

Since the early 1970s, the water sector in Morocco has been among the major concerns for public authorities due to its decisive role in the country’s food security [1]. Decision-makers are committed to a water management policy and strategies that allow the country to have a water storage capacity and a significant infrastructure [2]. However, in the context of current climate change, Morocco is strongly confronted with water scarcity [3]. This resource is highly vulnerable to the variability of the climatic conditions. Recent decades seem to have had a significant decrease in rainfall, with an irregular spatio-temporal distribution and more frequent drought seasons [4,5]. The significant contribution of the agricultural sector to employment and gross domestic product makes it the main pillar of the Moroccan economy [6]. Consequently, socio-economic stability in Morocco is also sensitive to climate change, especially since most agricultural activities, especially cereals, are on rainfed land [7]. The rural and poor populations are the most likely to be affected by this change.
Serious concerns have been raised about potential variations in the volumes of water resources and their influence on social and environmental components [8]. Thus, several studies have been carried out on the spatio-temporal evolution of climatic parameters as an indicator of these variations [9,10,11,12].
However, unlike temperatures which exhibit consistently large changes coherent with global warming conditions, precipitation exhibits high temporal variability and inconsistent spatial patterns in terms of trends [13,14]. Yet, precipitation is of great importance in various climatic settings, especially in semi-arid and arid regions where it is the main source of surface water [15].
It is necessary to study the variability of precipitation on a small scale, in order to deepen our knowledge of rainfall patterns and therefore on the availability of water resources in the different territorial units in a given region [16]. Here, we focus on the northern Middle Atlas region. Such work is very interesting for decision-makers and actors in several regions, given that this area is considered a water tower for Morocco, feeding most wadis and rivers.
Particularly in semi-arid areas, rainfall is the most important element of the climate, both for populations and natural environments [17]. The occurrence and variability of rainfall largely determine the availability of water resources, the species that can live and the crops that can grow in different regions of the world. The study of rainfall variability, in the context of climate change, draws its importance from water and food security concerns that are strongly raised today. However, direct analysis of the raw data can be misleading due to non-climatic disturbances (such as errors in the observations or in their transmission) and changes in the instrument used both in the location of the observatory, and in its immediate environment [16,18,19]. Therefore, quality control and the assessment of the homogeneity of climate data are necessary before undertaking climate research [20]. Moreover, series of climatic data may contain gaps, which requires a reconstitution of the missing values.
To avoid erroneous conclusions about the detected changes, the best way to deal with heterogeneity in climatic data series is to examine each station’s metadata for accurate information about the historical context of the station, such as changes in measuring device type and observation site, and other relevant documented information [21]. Unfortunately, it is usually difficult to obtain complete and reliable metadata, especially in developing countries such as Morocco, where even the recorded climate data available are very limited. To identify irregularities in observed climate data sets, and to make their subsequent adjustments, several statistical homogeneity testing techniques are available [22]. These techniques are generally classified into two groups, called absolute and relative methods [23]. The choice of which method to use generally depends on the task and the state of available resources and data [20].
For our study, we opted for the Climatol relative method (version 3.1.1) developed by Guijarro [24]. This is available as an open-source R package and uses an adaptation of the Paulhus and Kohler [25] method. The choice of this method is justified by the simplicity of its software implementation; the short time length it requires; and its robustness in the homogenization of the series and the filling of the climatic gaps [26], even if the different station records do not cover the same observation period [27,28]. We used Climatol here to process the data of 22 stations, without needing to carry out manual homogenization.
The assessment of spatial and temporal trends in precipitation plays an important role for actors and decision-makers in a given region. In this context, several studies have been conducted in many countries and regions to detect spatial and temporal changes in climate parameters [29,30,31,32,33]. Several statistical methods and tests have been defined and used by researchers. A brief literature review of the latter showed the parametric and non-parametric methods widely used to detect significant trends within hydrometeorological series. Among these, the Mann–Kendall test is one of the most frequent non-parametric methods [34,35,36]. This test allows us to show the trend significance of a statistical series, assuming that any trend is monotonic but not necessarily linear.
Therefore, this work aims to homogenize the rainfall series that cover the northern Middle Atlas. Further to this, we evaluated the precipitation trends in the homogenized series at a monthly scale, using the Mann–Kendall test.

2. Materials and Methods

2.1. Study Area Description

The northern Middle Atlas is bounded by the Prerifan hills to the north of the Fez-Taza corridor, the Guercif basin to the northeast, Oued Moulouya river to the east and the central Middle Atlas to the west and southwest (Figure 1). It is located between 33°10′ and 34°20′ north and between 4°50′ and 5°30′ west. This mountain area is classified among the best-watered mountain ranges in Morocco and is of great hydrogeological interest. The annual precipitation varies between 200 and 500 mm in most of the territory, and average annual temperatures are generally higher, reaching 22 °C. The significant elevations and the relatively complex structure of the limestone and dolomitic terrains have allowed the formation of several natural lakes. The particularly favorable climatic factors (precipitation) and the predominance of karst also make it one of the greatest underground water reservoirs, supplying and regulating the upper tributaries of the most important rivers in the country (Sebou and Moulouya) [37].
In the Middle Atlas, agricultural land covers only 20% of the area. This low rate is explained by the fact that the local economy was once linked to pastoralism [38]. Currently, it is based on unsophisticated agriculture associated with extensive livestock farming and the exploitation of the forest (State domain), which occupies 24% of the space (while 56% is occupied by non-forest rangelands).
This territory is very seldom studied from a climatic point of view, despite its importance in terms of the supply of water for both drinking and agriculture.

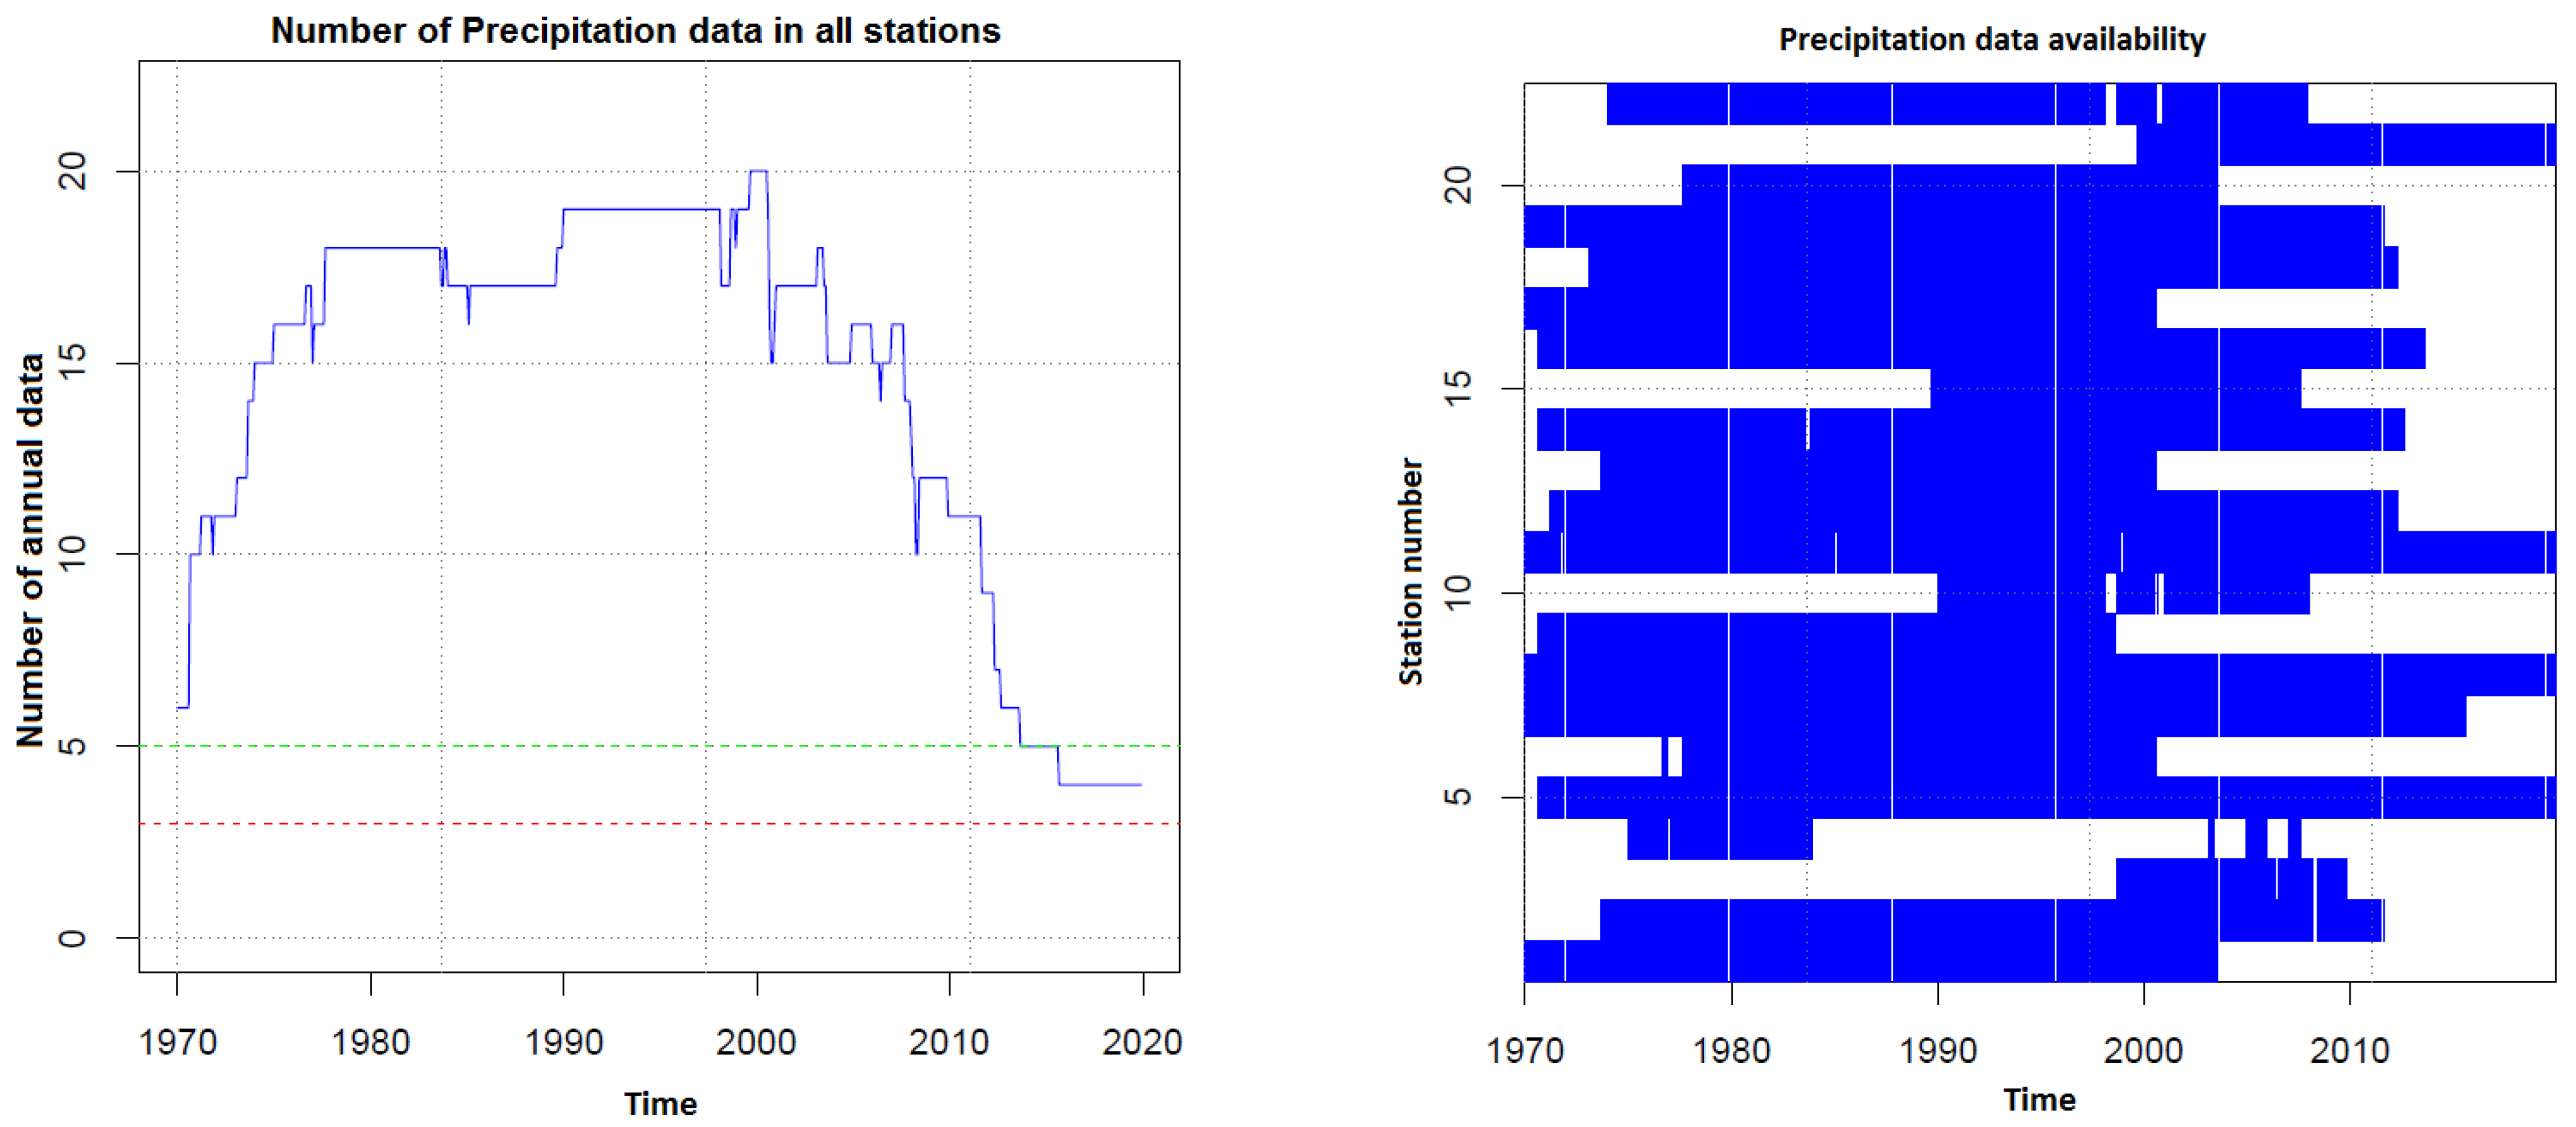
2.2. Observed Climate Data Sources and Station Selection

The climatic data used in this work are monthly rainfall series recorded in 22 observation stations. With the exception of the Taza station, which belongs to the National Directorate of Meteorology (DMN), the other stations belong to the hydraulic basin agencies of Moulouya (ABHM) and Sebou (ABHS). These administrations are responsible for collecting all possible climatic and hydrological data in their respective basins. The records collected do not all cover the same time period (Figure 2). Since the spatial coverage of measurements in the study region is quite low, we have used all available stations in and around the area (Figure 1) in order to fill in the gaps and identify any inhomogeneities, for the period from 1970 to 2019. The geographical coordinates of the stations are given in Table 1.

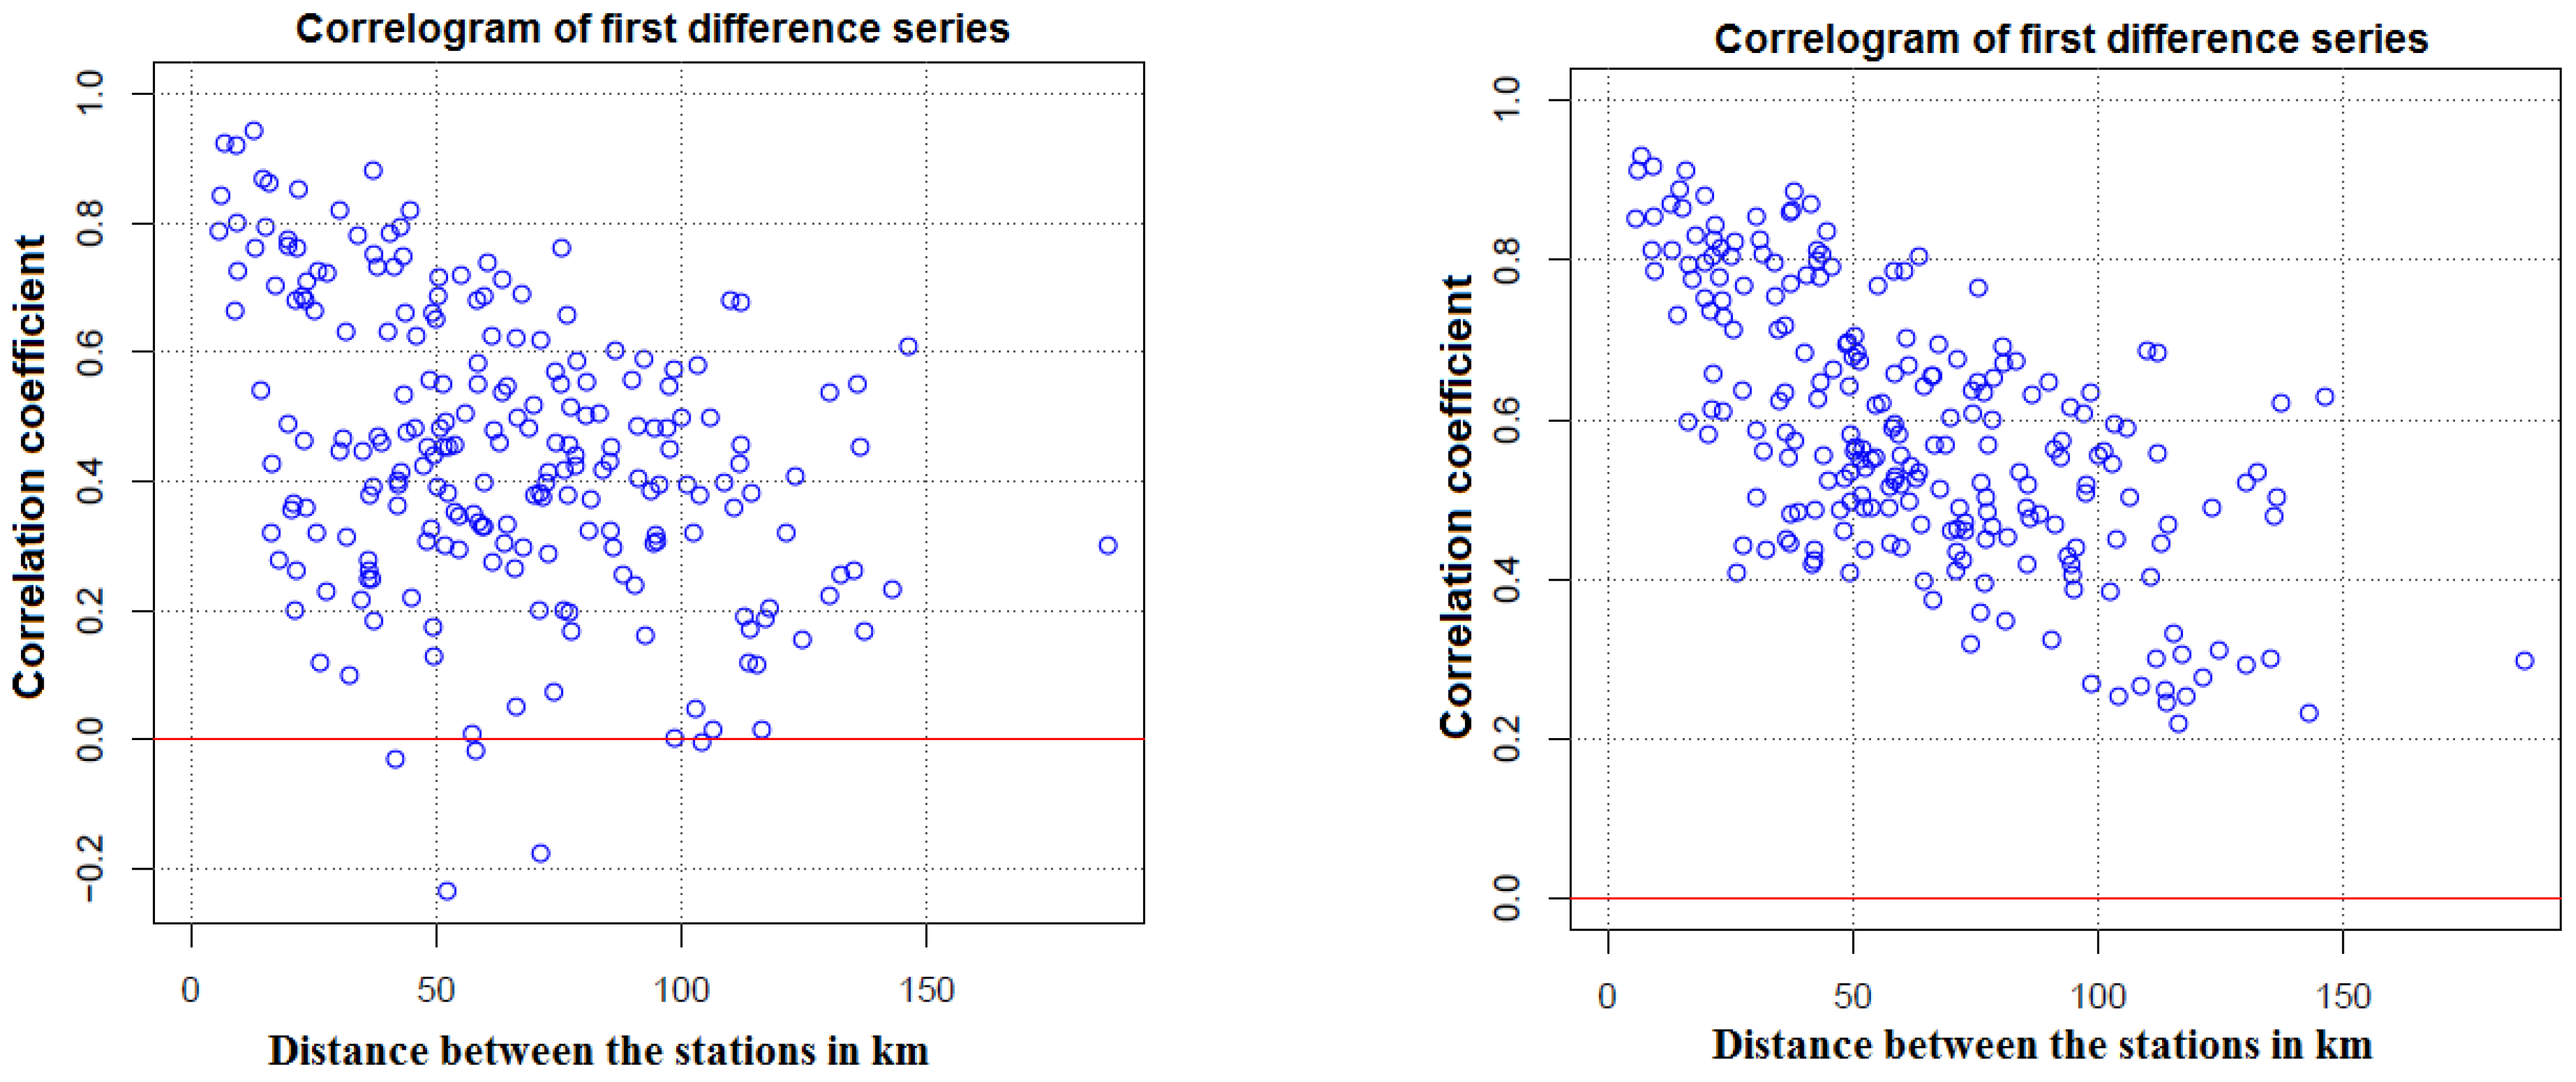
2.3. Quality Controls

Over long periods, it is difficult to find complete climate data series without errors or gaps [27]. In the case of Morocco, the problem of homogenizing climate data is a key one for many kinds of climate research [16]. This situation requires quality control of the statistical series. For this, it is essential to look for a method or tool that can help us solve these different difficulties [22].
The first step was to fill in the missing data. After filling, data were checked both for outliers and/or change points of non-climate origin, and heterogeneity in the data sets.
Although several climate-data quality-control techniques are available, there is no single approach recommended and generally accepted by all researchers [21,39]. The Climatol tool (version 3.1.1) (https://www.climatol.eu/, accessed on 15 June 2022), chosen here, is frequently used in the climate literature for data homogenization, filling in missing data and correcting outliers [16,18,24].

2.4. Methodology

2.4.1. Homogenization of Precipitation Series

Our work begins with the gap-filling and homogenization of the collected precipitation series. This step is based on the Climatol procedure cited in the work of Guijarro [24]. The method used is based on orthogonal regression, widely known as reduced major axis (RMA). It examines the linear relationship between two continuous variables: a response (Y) and a predictor (X). In orthogonal regression, both the response and the predictor are assumed to a contain measurement error, which is not the case in simple linear regression (least squares regression) [40]. Climatol uses RMA for its simplicity, and to allow the use of neighboring series even if they do not have a common observation period with the problem series, which would prevent the fitting of linear regression models [41].
Assuming the linear regression model y = α + βx + ε, where y and x are dependent and independent variables, respectively; α and β are ordinary least squares (OLS) regression coefficients; and ε is a random error term, the RMA slope coefficient is βRMA = β/|ryx|, where ryx is the Pearson correlation coefficient between y and x. The standard error (SE) of βRMA is equal to the SE of β. The RMA intercept coefficient is αRMA = y − βRMAx, and the SE of αRMA is equal to the SE of α [42,43]. The Climatol program first aims to complete the missing data in each series, using the provisional averages and standard deviations, and recalculates them again with the completed series. Then, the originally missing data is recalculated using the new parameters, which will lead to new means and standard deviations; the process is iterated until there are no mean changes to within the initial number of decimal places of the data. Once the means are stabilized, all data (existing or filled-in, in all series) are normalized [24].
The algorithm organizes stations into a tree structure, where clusters that show high correlations are grouped in the same branch. Outlier and artificial break detection are addressed through quality control of anomalies, using a predefined threshold and relative inhomogeneity detection using the Standard Normal Homogeneity Test (SNHT) [44]. In addition, this program builds a tree of clusters of stations with similar rainfall variabilities and monthly regimes. This operation is repeated before and after the homogenization of the data, which allows us to map groups of stations with similar precipitation patterns.

2.4.2. Monthly Trend Analysis

As we mentioned in the introduction, to analyze trends in monthly data series, the classic Mann–Kendall test [45,46] is used. Statistical trend tests identify and/or estimate the existence or non-existence of a trend in a time series according to the desired degree of significance. Mann–Kendall is a nonparametric test requiring only that the data be serially independent, without assuming the normality of the distribution [47]. The Mann–Kendall statistic S is calculated as follows:
S = i = 1 n 1 j = i + 1 n sgn ( x j x i )
where n is the length of the data series, xi and xj are the data values in time series i and j (j > i), respectively, and sgn(xj − xi) corresponds to the following sign function:
sgn ( x j x i ) = { + 1 , if x j x i > 0 0 , if x j x i = 0 1 , if x j x i < 0 }
The variance (V) of S is calculated as:
V ( s ) = n ( n 1 ) ( 2 n + 5 ) k = 1 m t k ( t k 1 ) ( 2 t k + 5 ) 18
In equation number 3, n is the number of data points, m is the number of linked groups, and tk is the number of links of extent k. A related group is a set of data samples with the same value. In cases where the sample size n is greater than 10, the standard normal test statistic ZS is calculated using the following equation:
Z = { S 1 v a r ( s ) , i f S > 0 0 , i f S = 0 S + 1 v a r ( s ) , i f S < 0 }
Positive Z values indicate increasing trends, while negative values indicate decreasing trends. The trend test is performed at a specific α significance level. When |Z| > Z1 − α/2, the null hypothesis is rejected and a significant trend exists in the time series. Z1 − α/2 is obtained from the standard normal distribution table [48]. In this study, the significance levels chosen are α = 0.01 (or 99% confidence intervals), α = 0.05 (or 95% confidence intervals), and α = 0.1 (or 90% confidence intervals). At the levels of significance 1%, 5% and 10%, the null hypothesis “absence of trend” is rejected if |Z| > 2.57, 1.96 ≤ |Z| < 2.57, and 1.64 ≤ |Z| 1.96 [49], respectively. Kisi and Ay [50] stated that in the case of long-term rainfall trend analysis, the MK test performs better than parametric tests.

3. Results

3.1. Data Homogenization

The study area is marked by some of the greatest rainfall variability in North Africa [51]. For this reason, and after reviewing the diagnostic plots of data generated by Climatol, we decided to re-tune the outlier detection threshold. Instead of ±5 standard deviations, the threshold was set to −10 and +14 standard deviations. This was done to avoid suppressing or correcting real data reflecting extreme climate signals and/or microclimate singularities in the context of a high spatial variability of precipitation [40]. After this setting, only four outliers were detected at stations S1, S15, S17 and S21, and they were corrected.
Missing data were estimated by Climatol from nearby stations by adapting the method of Paulhus and Kohler [25]. In all, about 50% of the data were filled in.
The values of the correlation coefficients of the monthly data, as a function of distance, show a remarkable variation between the raw series and the homogenized series. Indeed, before homogenization, the values are more dispersed compared to those after homogenization (Figure 3). Moreover, the two correlograms of the monthly correlations between the stations show relatively high correlations (>0.6) for the stations located within about 25 km of each other. The correlation coefficient decreases progressively with the distance, reaching a low value of 0.22 in the stations located at a distance of approximately 100 km (Figure 3). This is not surprising, given the strong variations in both the geographical location of each station in the topographic context and the exposure of the slopes to moist air masses. Orographic discontinuity can give opposite precipitation regimes over short distances.
It should be noted that for the raw series, where the correlation coefficients reach negative values in stations located at a distance that does not exceed 50 km, the homogenized series’ correlogram looks more physically plausible.

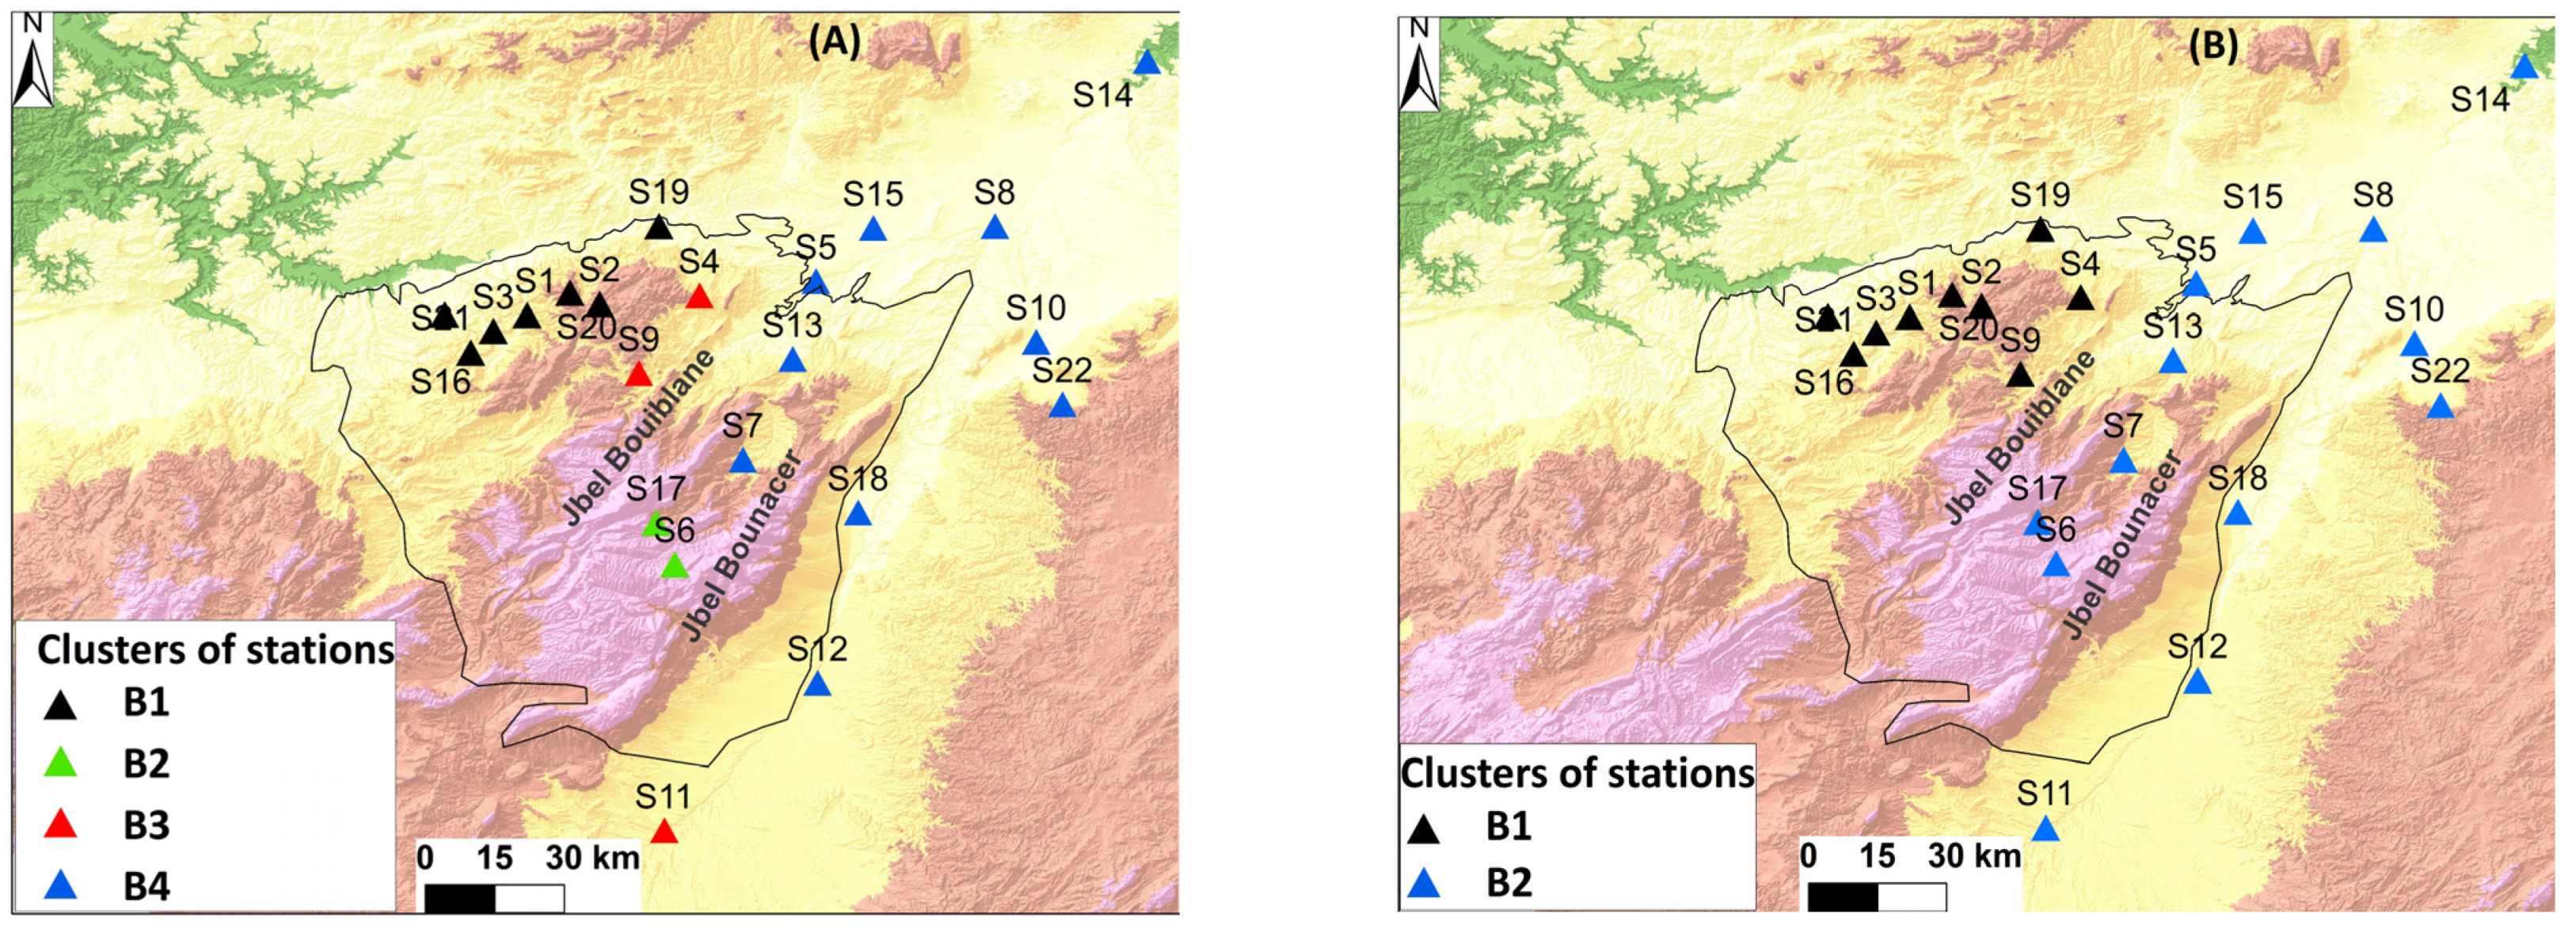
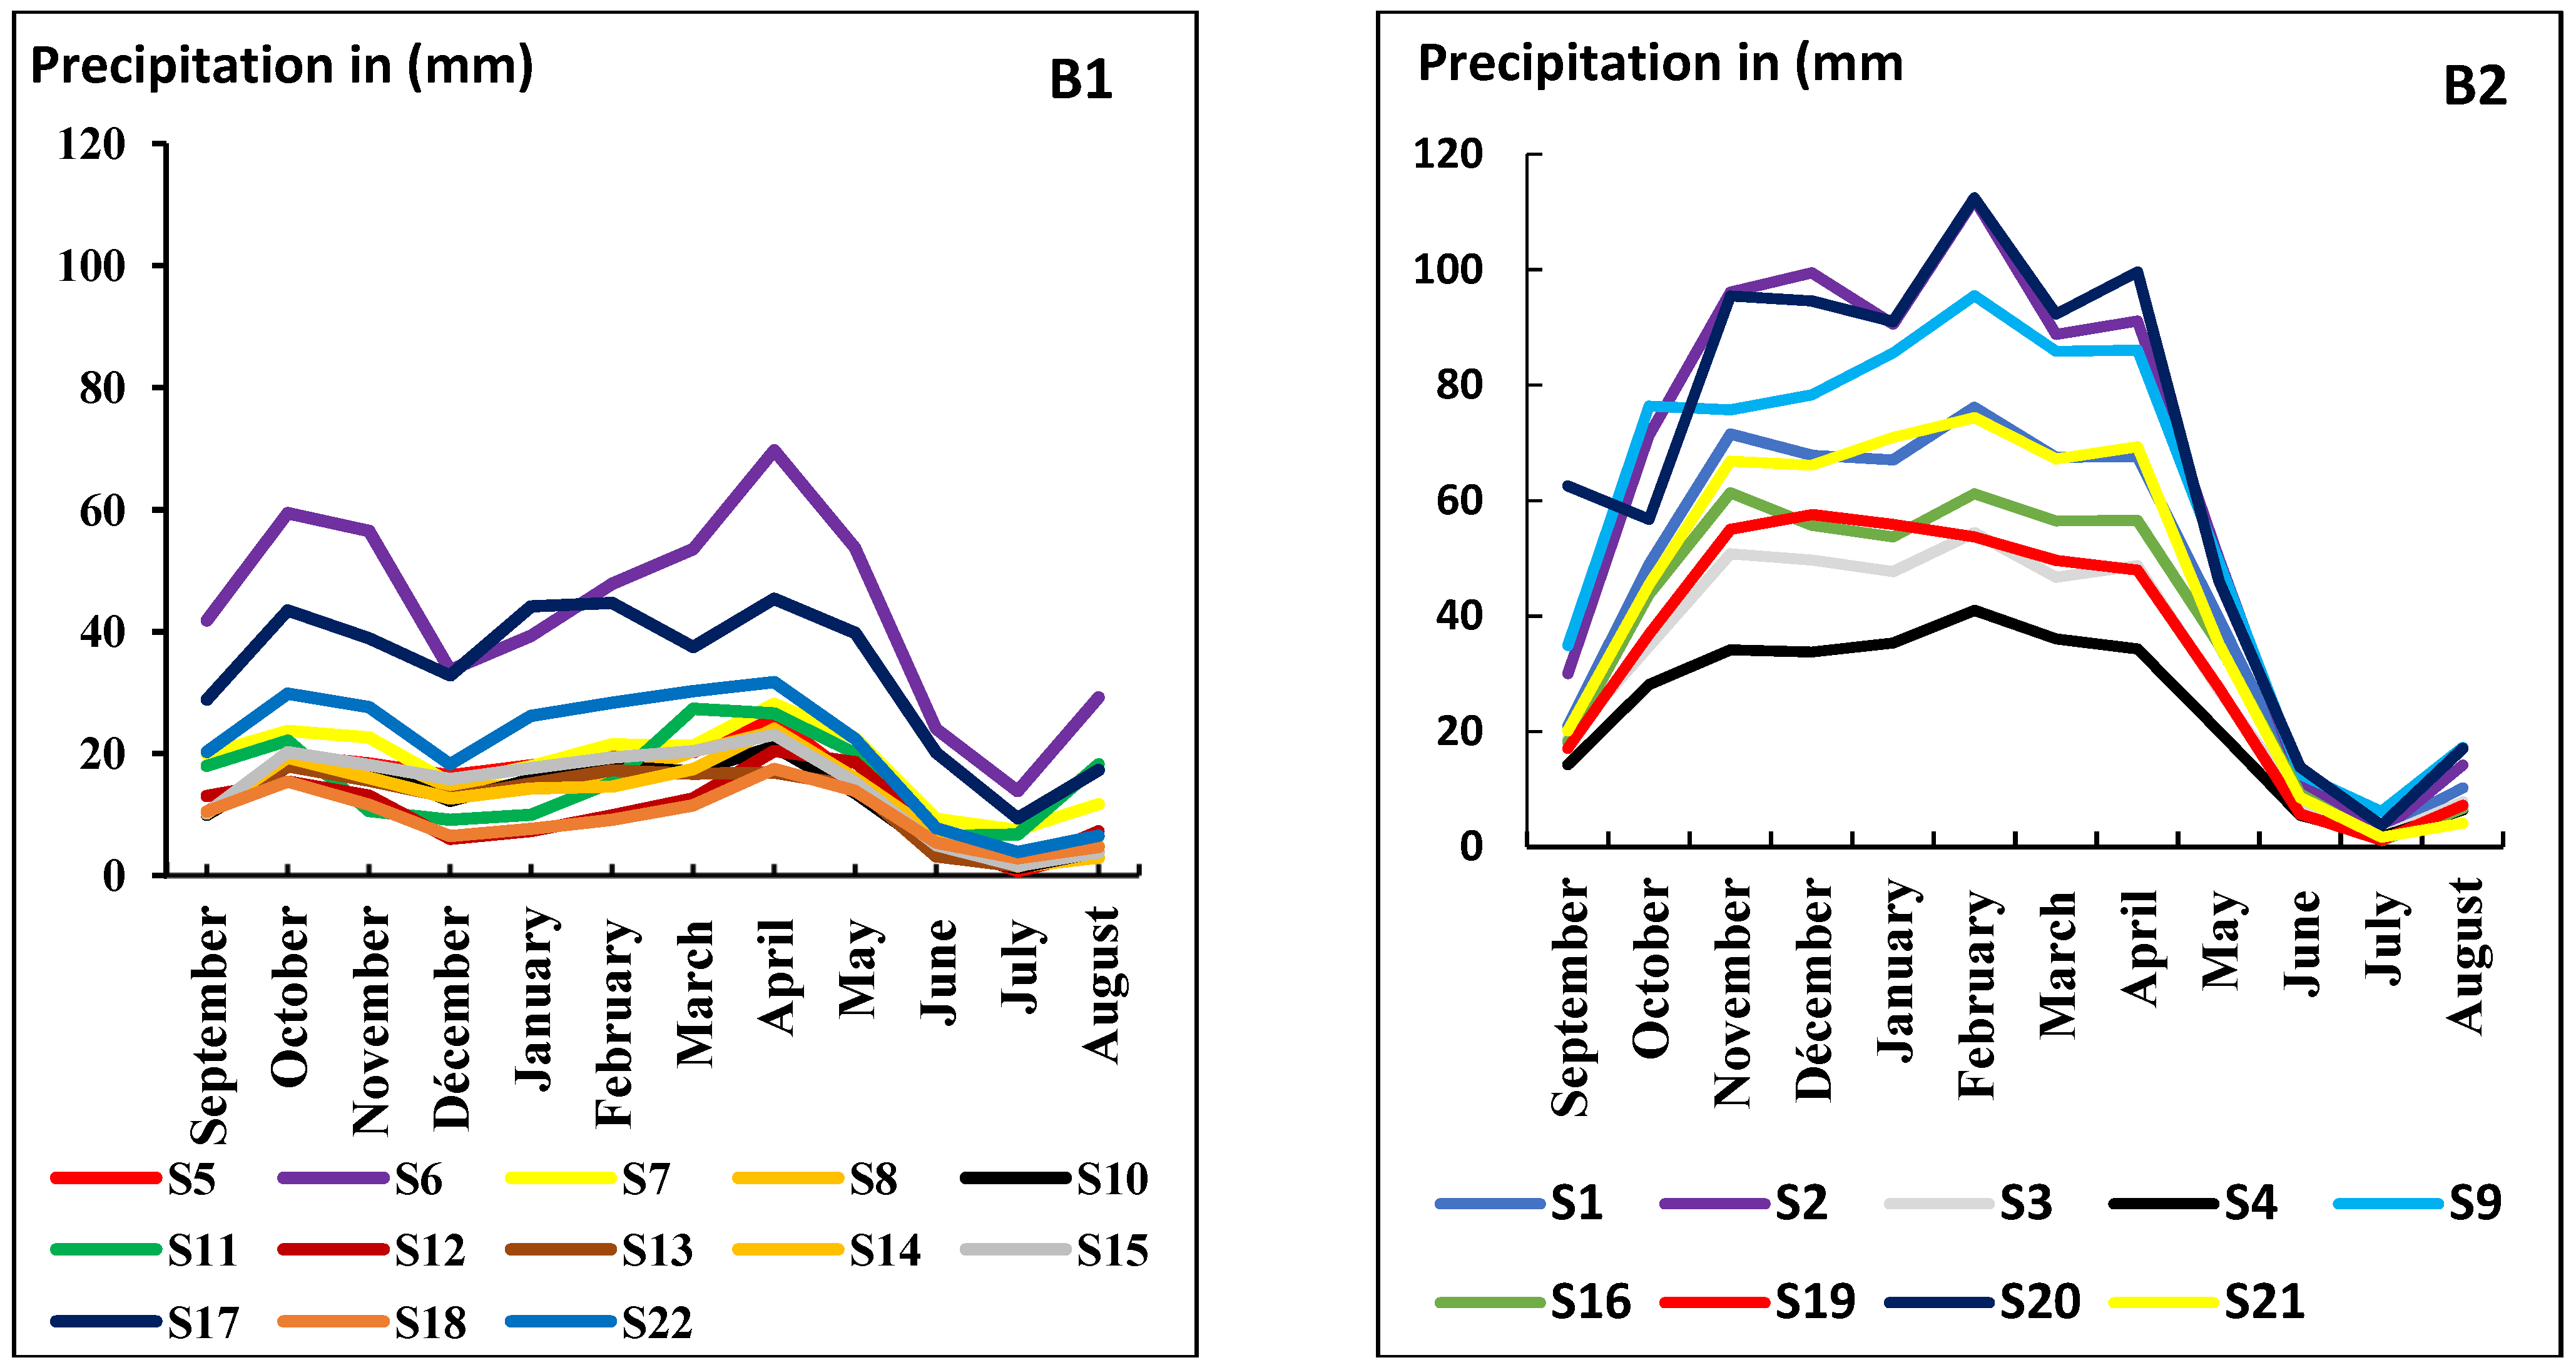
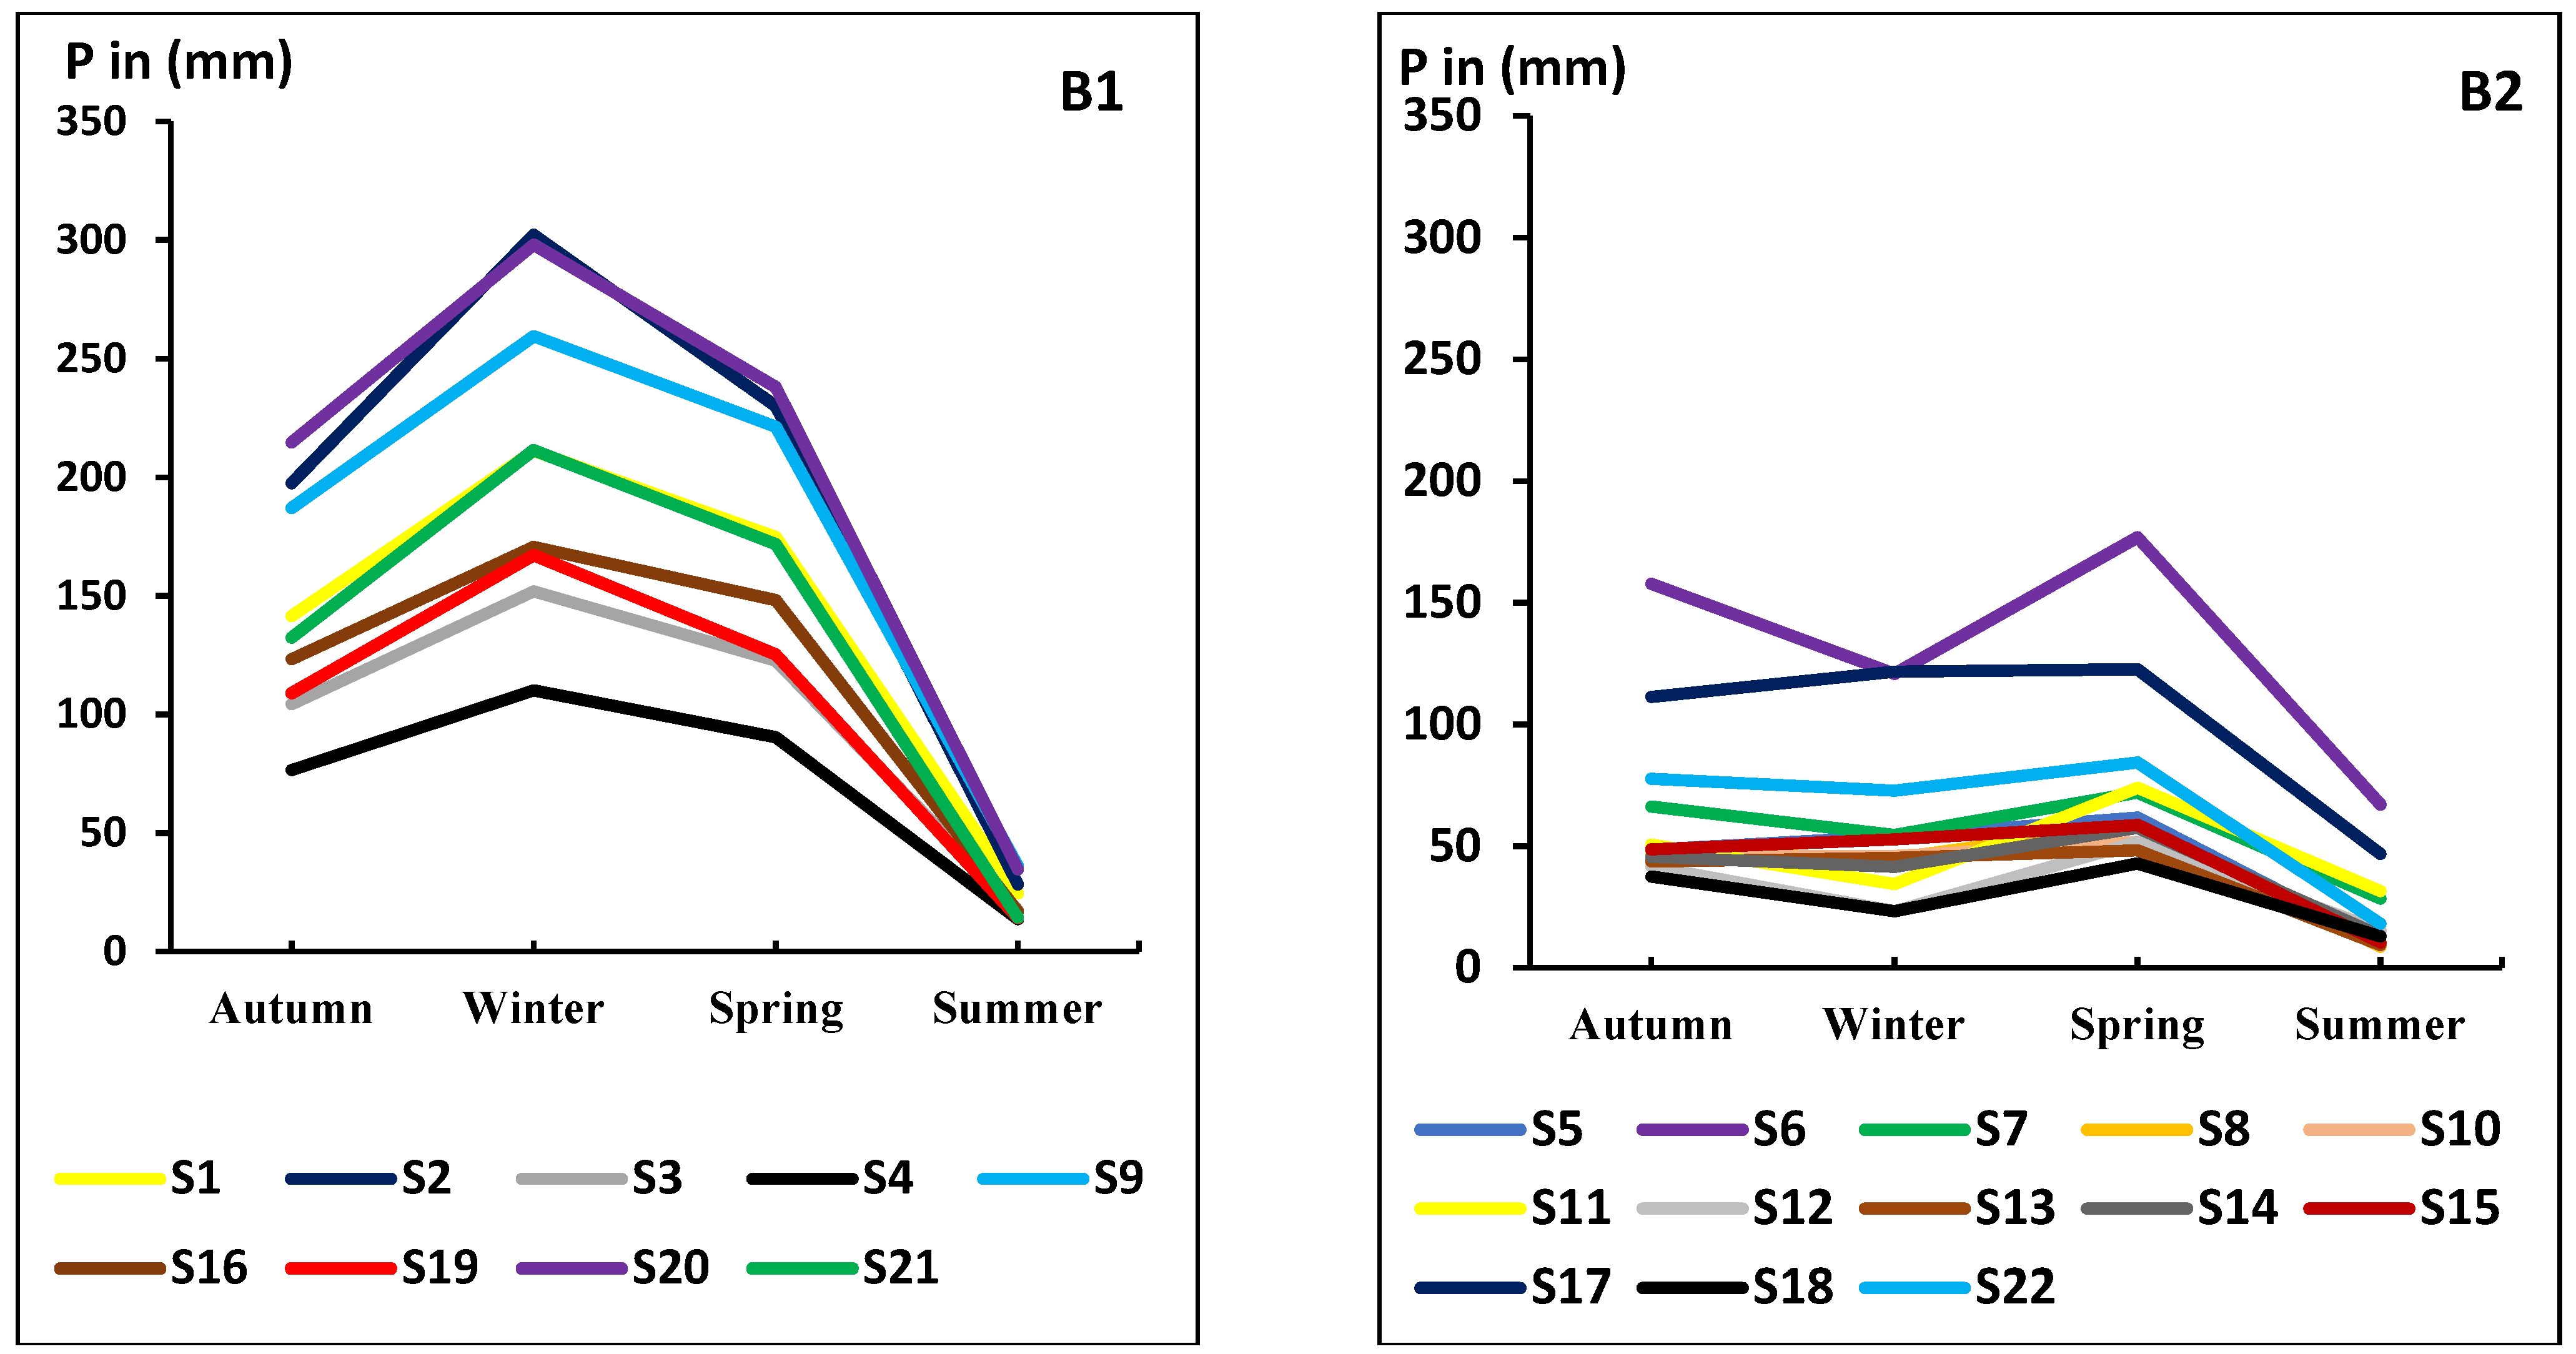
3.2. Regionalization of Stations

The station maps in Figure 4 show the cluster analysis of the rainfall series, giving an idea of the different regions of precipitation at the level of the northern Middle Atlas. Climatol limits cluster analysis to a maximum of 100 stations by default. This makes it possible to avoid dealing with overly large correlation matrices, and also to avoid very dense graphs that are difficult to read. However, this can be changed by the user to include all series in the analysis (using the nclust argument in the homogeneous function). Additionally, Climatol limits the number of clusters to a maximum of nine [19]. Given the limited number of stations (22), these defaults are acceptable.
The results obtained display four clusters for the raw data, and two clusters for the homogenized data. The grouping of the homogenized data follows the exposure of the slopes, and the altitude to a lesser extent (Figure 1 and Figure 4). The two blocks of stations were separated by the mountain range of Jbel Bouiblane, where the altitude reaches 3000 m.
Moreover, the two clusters produced after the homogenization procedure have different monthly and seasonal rainfall regimes. Indeed, the stations in the northwestern part of Jbel Bouiblane generally record maximum rainfall in the month of February. Meanwhile, the stations to the south and southeast parts record peak precipitation in April. Moreover, it is very remarkable that the amount of precipitation falling on the first cluster is higher than the other (Figure 5 and Figure 6).
The figures of the seasonal precipitation regimes also show a spring regime for the southern and southeastern parts, and a winter regime for the northern and northwestern parts (Figure 6).
Method performance and data quality are assessed using the root mean square error (RMSE) values. The RMSE is calculated by comparing the estimated and observed data in each series. High values of this parameter indicate poor quality of the series, or that the station is located in a particular site with a distinct microclimate [19].
The results obtained show RMSE values oscillating between 0.5 and 38.7 mm, with an average of 8.5 mm for all the series studied. These values generally remain low, and indicate a certain reliability of the data (Figure 7). On the other hand, the geographical location of station S21, which recorded the maximum value of RMSE, is in a depression between the mountains, which gives it a somewhat special microclimate compared to neighboring stations. Furthermore, the values of the SNHT oscillate between 2.5 and 26.6, with an average of 6.28 (Figure 7).

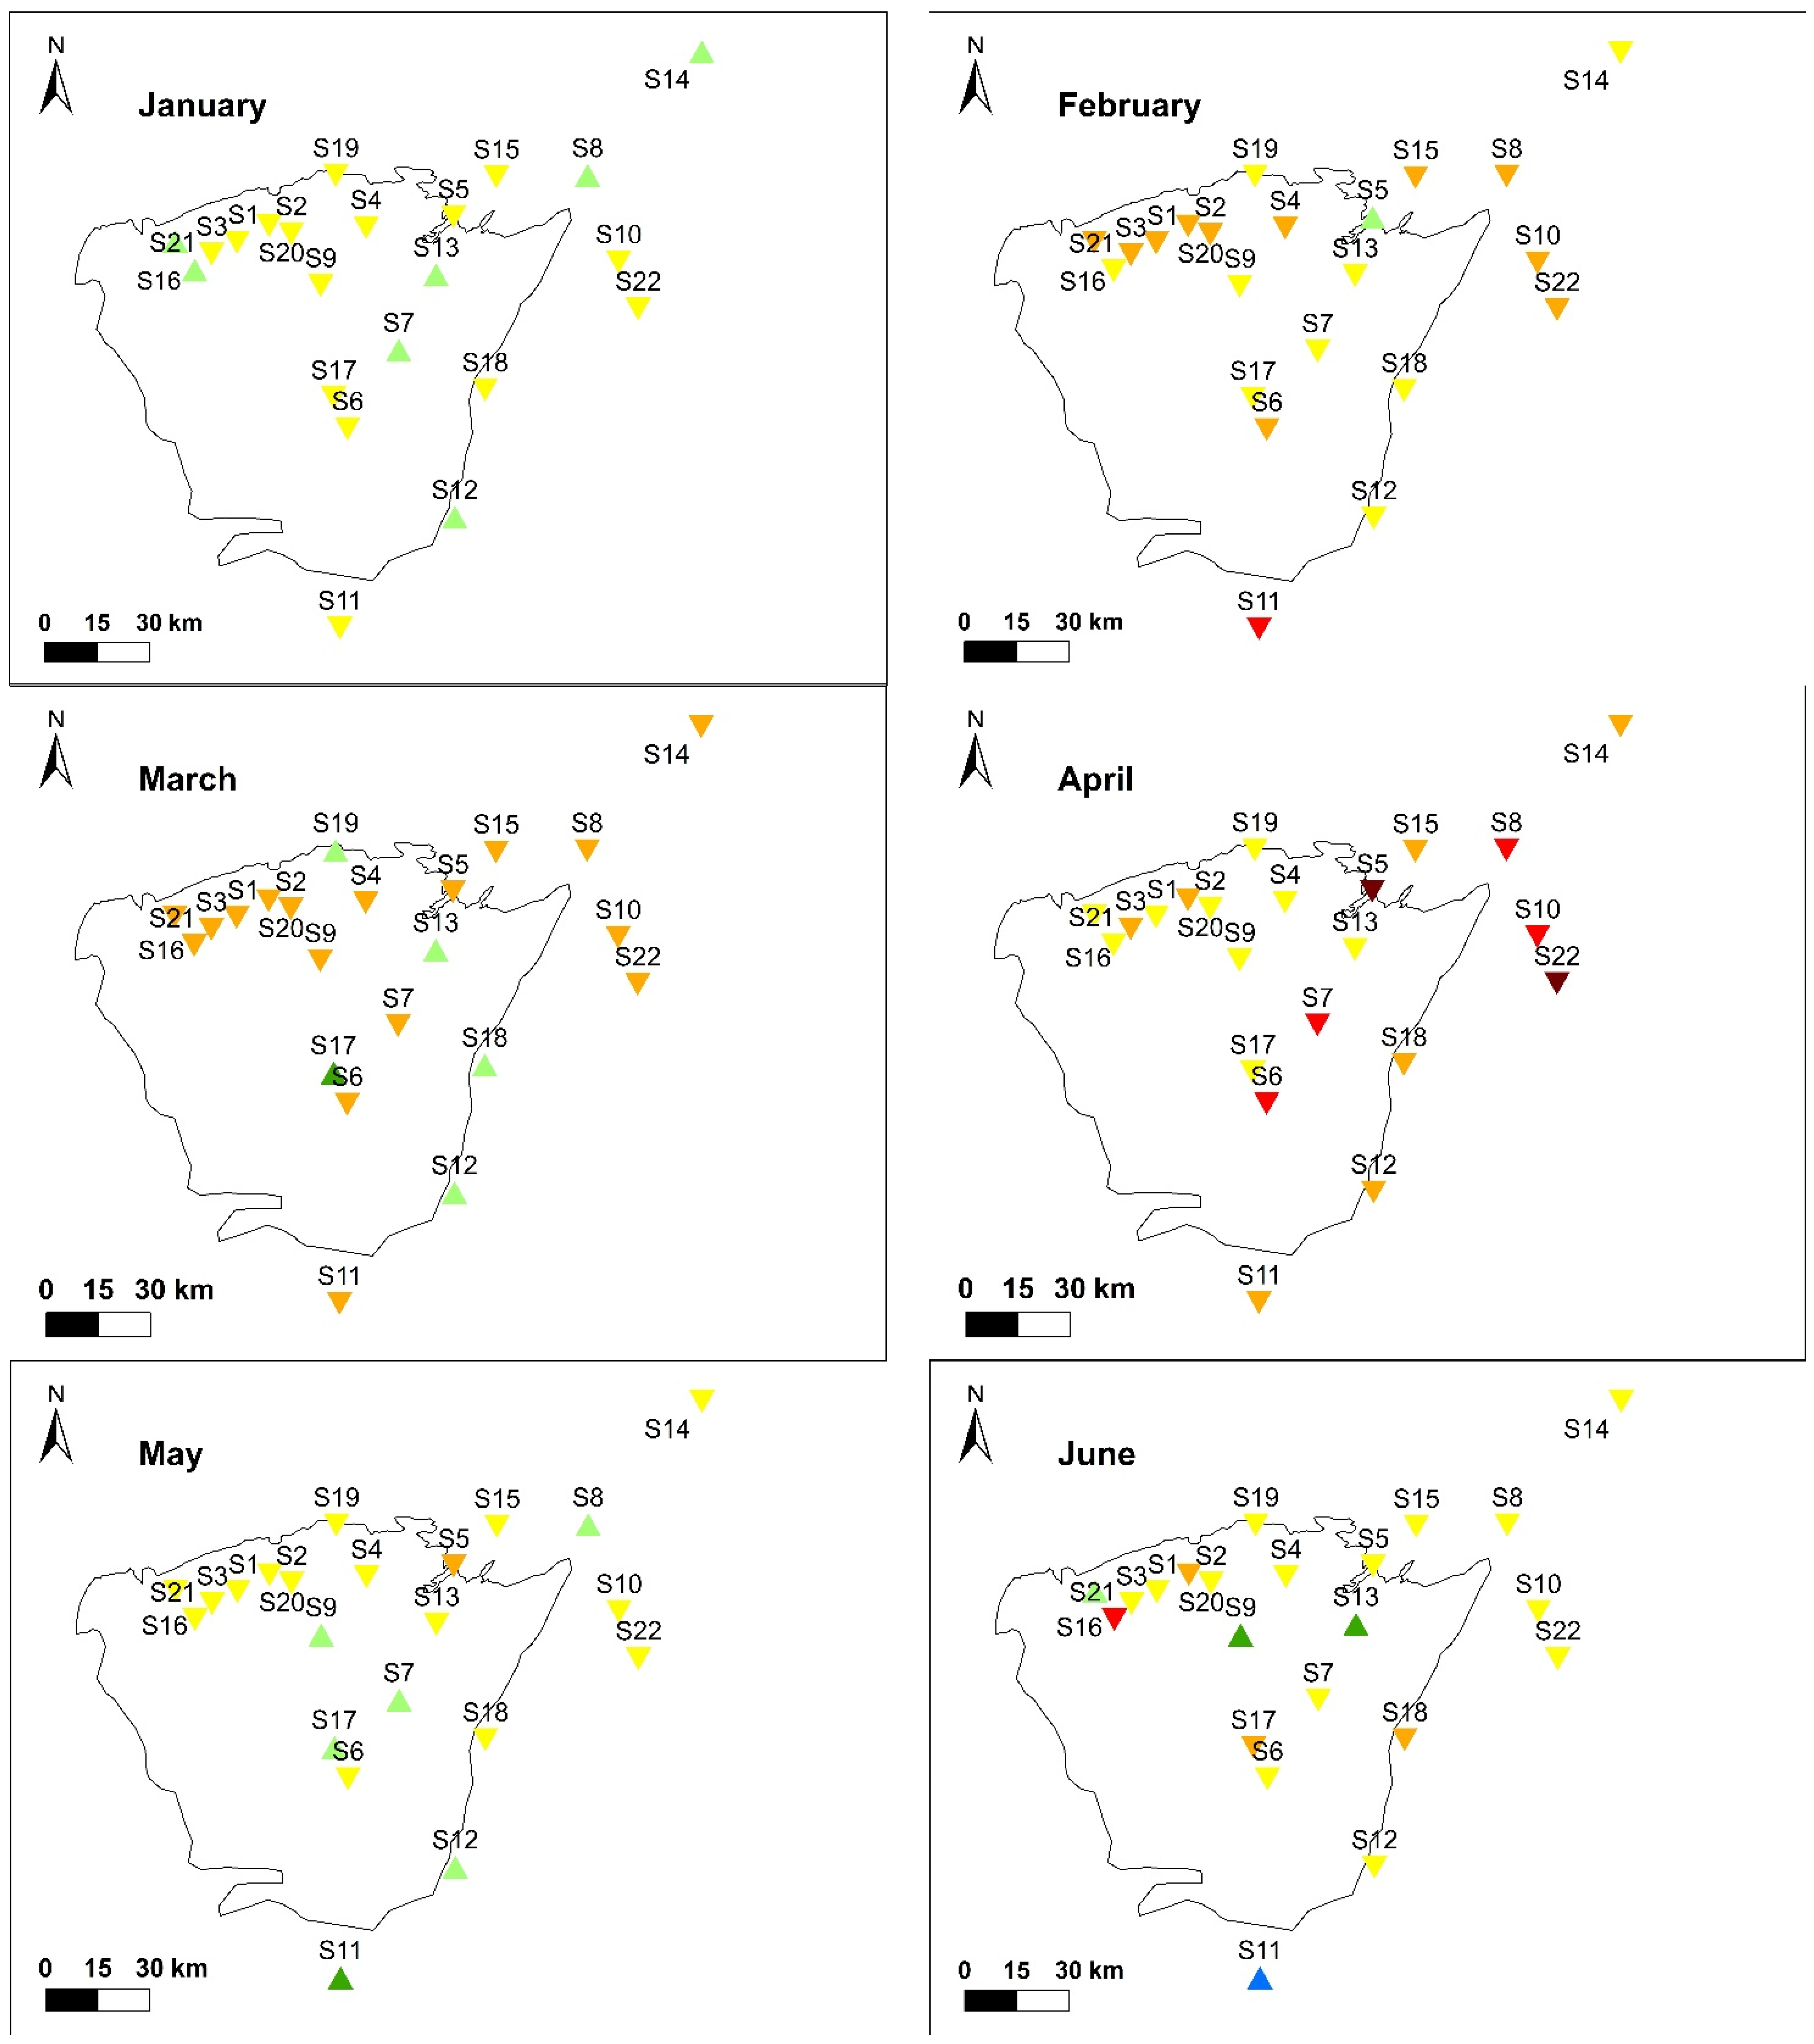
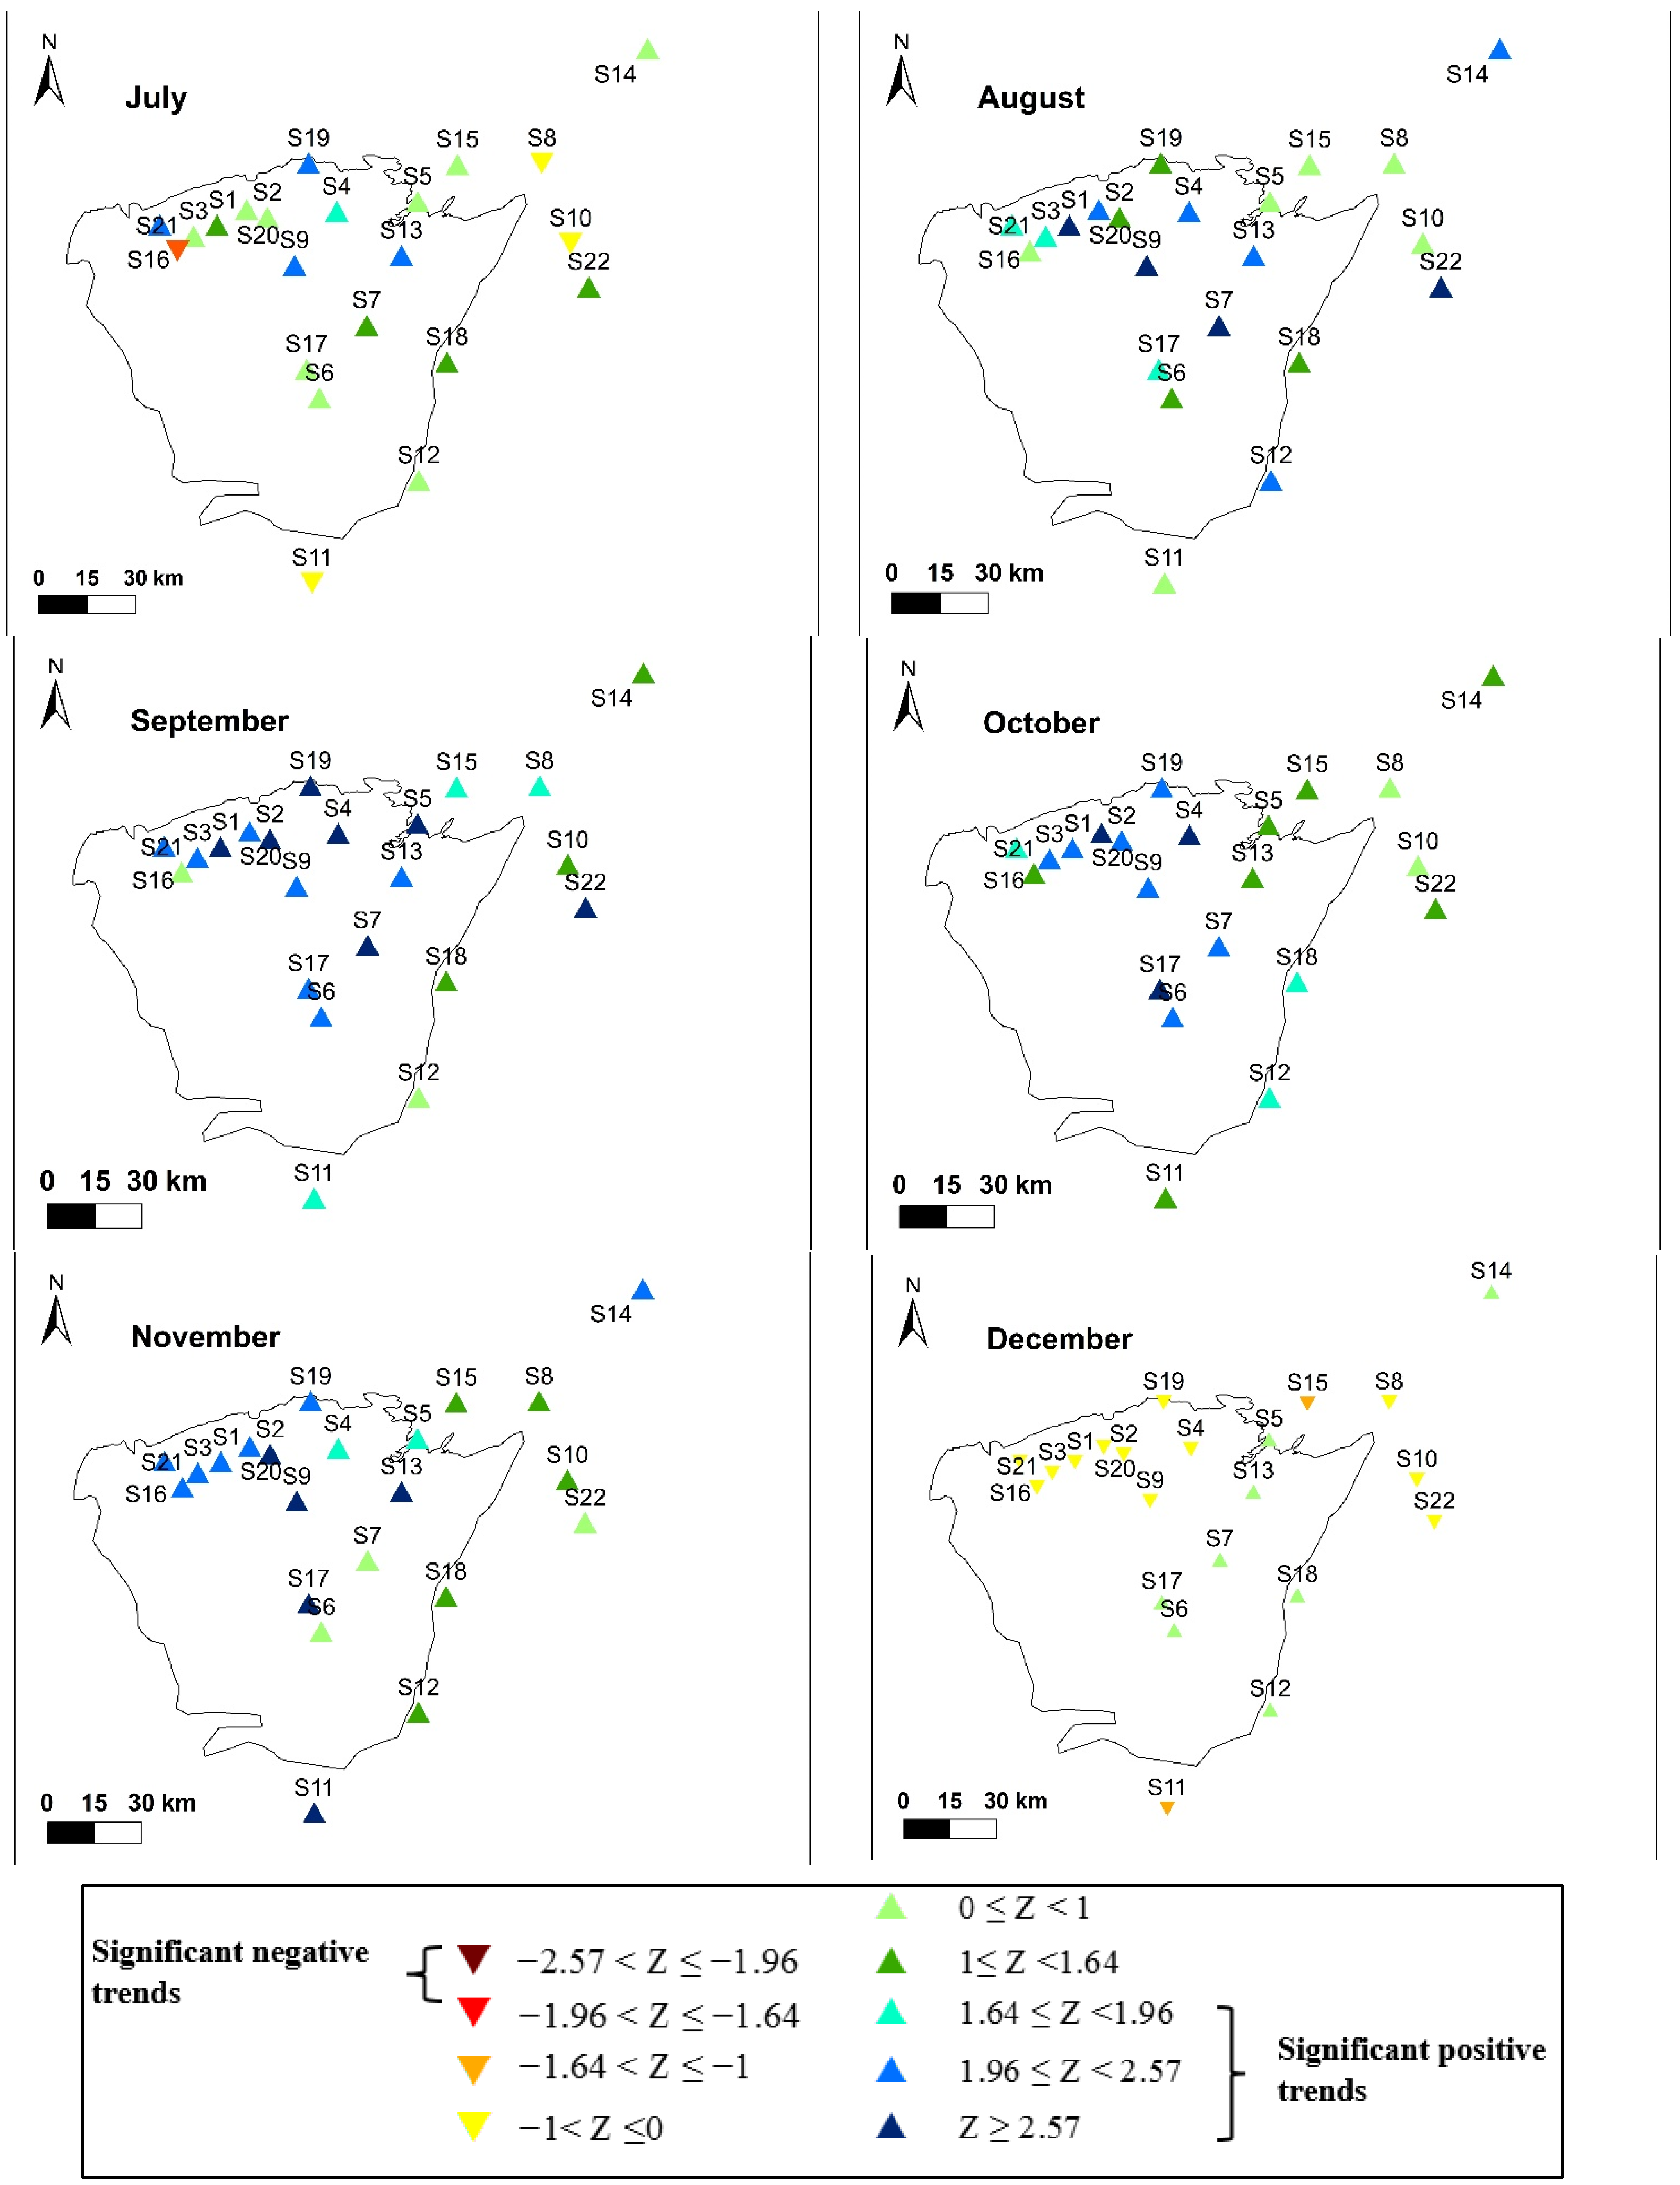
3.3. Monthly Precipitation Trend

The application of the Mann–Kendall test on the monthly rainfall series of 22 stations over a period of 49 years shows generalized downward trends for the months of January, February, March, April, May, June and December (Table 2 and Figure 8). During these months, the percentage of series with a negative trend (not necessarily statistically significant) varies between 68% for the month of January and 100% for the month of April. These trends toward a decrease in rainfall remain insignificant, except for the stations of S5 (Belfarah), S6 (Bni Bouilloul), S7 (Berkine), S8 (Guercif), S10 (Mrija) and S22 (Rechida) (Table 2 and Figure 8), which are significantly different from zero at the 90% confidence level. It should be noted that all of these last rainfall stations are located in the southern and eastern part of the study area, sheltered from the mountain range of Jbel Bouiblane (Figure 1). In this part, April is the wettest month of the year.
The month of July is seen as a transformation point towards positive trends. For July, 71% of the series have an increasing trend, although only five series have statistically significant trends (Table 2). For the months of August, September, October and November, generalized positive trends were observed. The percentage of series with a positive and significant trend varies between 55 and 77% (Table 2). These results show a probable transformation of a winter and spring rainfall regime towards a more autumn regime throughout the northern Middle Atlas.

4. Discussion

The test of the impact of homogenization on the quality of the data used in this study was carried out through the comparison between the results from the raw data and those from the homogenized series. The correlograms of the correlation coefficients show a remarkable change towards more physically plausible correlation patterns related to the correction and the reconstruction of the data. On average, the difference between the originally-recorded and homogenized precipitation is 8.5 mm. This result is consistent with the results of the work of Kessabi et al. [16] carried out in the Fez-Meknes region (very close to our study area), where the average found is 6 mm. The work of Abahous et al. [40], carried out on the Sous Massa basin, displays an RMSE between 11.7 and 23.4. This shows that our data was not strongly affected by homogenization.
The importance of homogenization is observed more in the shortest series, which contain many gaps, particularly in the mountainous part where the density of the network of stations is sparse. On the other hand, this operation has less importance in the correction of the data in our field (given the microclimatic particularities of each group of stations), which required accepting sometimes-large differences in precipitation over small distances. The same result was reported by Abahous et al. [18] and by Kessabi et al. [16].
The power and robustness of the Climatol tool also appear in the regionalization of statistical series using clusters, which groups together stations with similar rainfall variability and precipitation patterns. This technique allowed us to find two different climatic zones. The first one has a winter regime, is located in the west of the mountain range of Jbel Bouiblane, and is exposed to disturbances from the north and west. The second, considered arid to semi-arid, has a spring regime and is located east of Jbel Bouiblane. Our results on regionalization are consistent with those of Kessabi et al. [16], and close to those of Singla et al. [52] who carried out a regionalization of rainfall throughout the country. Despite the low number of stations used in his work compared to the study area size, Hanchane [53] presented similar results on the regionalization of precipitation in Atlantic Morocco, particularly with regard to the western part of Jbel Bouiblane.
The analysis of the monthly rainfall trends of the homogenized data was carried out using the Mann–Kendall test at the alpha thresholds 0.01, 0.05 and 0.1%. The main results show a widespread significant increase in precipitation from August to November. In their work carried out on the Melloulou wadi basin, Addou et al. [54] showed an increase of annual rainfall between 2000 and 2014, directly linked to a significant trend in autumnal rainfall. In addition, the results of a study carried out on the northwestern part of Algeria by Nouacer [55] addressed positive annual rainfall trends. This author explained this increase as the result of the increase in the number days of extreme rainfall events (which generally occur in summer and autumn). Also, Sebbar et al. [56] found similar results in southern Morocco. At the level of the northeastern part of Tunisia, Laignel et al. [57] reported that there had been a return of precipitation since the beginning of the 2000s. These last authors did not determine the month or months of the year that accounted for this increase.
With their stormy character, the autumn precipitations at the level of the study area are very localized in time and space. The violent floods generated cause huge losses of agricultural land, and settle on the low fluvial terraces of the main rivers. Moreover, and in the context of the scarcity of surface water storage units, the autumn rains are unfortunately not effective for agricultural activities, especially for rainfed agriculture that relies on winter and early spring precipitation.

5. Conclusions

Our work aimed to study the rainfall trends in the northern Middle Atlas. This is an important area for precipitation climatology and trend analysis; given its potential in terms of surface and underground water resources, this territory is considered a water tower in the country. The first problem we faced was the temporal heterogeneity of the data and the large number of gaps in the series collected. The research problem therefore became the gap-filling, homogenization and trend analysis of the monthly data at the level of the study area. Indeed, a data quality control and homogenization process, to improve the reliability of monthly rainfall records, was applied initially. Secondly, we analyzed trends in monthly series over the period from 1970 to 2019.
The results obtained show an increase in the quality of the final data, and a good robustness of the chosen Climatol tool for filling gaps and for the regionalization of the data. This step was validated by our knowledge of the climatic characteristics of the terrain. The correlations between stations’ monthly precipitation, using the adjusted data, are relatively high (>0.6) for stations located approximately 25 km apart. The correlation coefficient decreases progressively with the distance, reaching a low value of 0.22 in the stations located at a distance of about 100 km. This is not surprising, given the strong variations in both the geographical location of each station in the topographic context and the exposure of the slopes to moist air masses. Orographic discontinuity can give opposite precipitation regimes.
The RMSE values oscillate between 0.5 and 38.7 mm, with an average of 8.5 mm for all the series studied; the values of the (SNHT) oscillate between 2.5 and 26.6, with an average of 6.28. These low values indicate the reliability and good quality of the data.
Rainfall trends generally show drier conditions for the months of January, February, March, April, May, June and December. These trends are significantly stronger in the southern and eastern parts of the study area, and only during the month of April, the wettest month. It appears that the month of July is seen as a transformation point towards positive trends. Indeed, 71% of the series have a tendency towards the increase of precipitation, although only five (or 1/3) of them have statistically significant increases. From August to November, generalized positive trends were observed. The percentage of series with a positive and significant trend varies between 55 and 77%. These results show a probable transformation of a winter and spring rainfall regime towards an autumn regime throughout the northern Middle Atlas. This change can disrupt an entire agricultural system that depends on water inputs from the Middle Atlas for irrigation.

Author Contributions

Conceptualization, R.A.; methodology, R.A. and M.H.; software, R.A., R.K. and H.A.; formal analysis, R.A.; validation, R.A., M.H. and N.Y.K.; investigation, R.A. and R.K.; data curation, R.A. and H.A.; writing—original draft preparation, R.A. and N.Y.K.; writing—review and editing, R.A., N.Y.K. and M.H.; visualization, K.O. and B.E.K.; supervision, N.Y.K., M.H., K.O. and B.E.K. All authors have read and agreed to the published version of the manuscript.

Funding

This research received no external funding.

Institutional Review Board Statement

Not applicable.

Informed Consent Statement

Not applicable.

Data Availability Statement

The data presented in this study are available on request from the corresponding authors.

Conflicts of Interest

The authors declare no conflict of interest.

References

  1. Ouatiki, H.; Boudhar, A.; Ouhinou, A.; Arioua, A.; Hssaisoune, M.; Bouamri, H.; Benabdelouahab, T. Trend analysis of rainfall and drought over the Oum Er-Rbia River Basin in Morocco during 1970–2010. Arab. J. Geosci. 2019, 12, 128. [Google Scholar] [CrossRef]
  2. D-Dahmouny, H.E. Gestion des ressources en eau au Maroc: D’ une simple lutte contre la dégradation à l ’ étude faisabilité des Paiements pour les Services Environnementaux (PSE). Rev. Int. Sci. Gest. 2019, 2, 675–698. [Google Scholar]
  3. Hanchane, M.; Addou, R.; Khazzan, B.E.L.; Souab, M. Évaluation de la sécheresse climatique et de son impact sur le plan d’eau du barrage Al Wahda (Maroc). In Proceedings of the Actes du XXXIV ème Colloque International de l’AIC, Casablance, Maroc, 7–8 July 2021; pp. 223–227. [Google Scholar]
  4. Esper, J.; Frank, D.; Büntgen, U.; Verstege, A.; Luterbacher, J.; Xoplaki, E. Long-term drought severity variations in Morocco. Geophys. Res. Lett. 2007, 34, 1–5. [Google Scholar] [CrossRef] [Green Version]
  5. Driouech, F. Distribution des précipitations hivernales sur le Maroc dans le cadre d’un changement climatique: Descente d’échelle et incertitudes. Ph.D. Thesis, L’université De Toulouse, Toulouse, France, 2010; pp. 1–164. [Google Scholar]
  6. Kadi, M.A.; Ziyad, A. Integrated water resources management in morocco. Water Resour. Dev. Manag. 2018, 143–163. [Google Scholar]
  7. Schilling, J.; Freier, K.P.; Hertig, E.; Scheffran, J. Climate change, vulnerability and adaptation in North Africa with focus on Morocco. Agric. Ecosyst. Environ. 2012, 156, 12–26. [Google Scholar] [CrossRef]
  8. Conseil Economique Social Environnemental. La gouvernance par la gestion intégrée des ressources en eau au Maroc, Version définitive, Auto-Saisine n° 15/2014; Available online: https://www.cese.ma/media/2020/10/Avis-Gouvernance-des-ressources-en-eau.pdf (accessed on 21 March 2018).
  9. Behnassi, M.; Pollmann, O.; Gupta, H. Climate Change, Food Security and Natural Resource Management: Regional Case Studies from Three Continents. Clim. Chang. Food Secur. Nat. Resour. Manag. Reg. Case Stud. from Three Cont. 2018, 1–362. Available online: https://link.springer.com/book/10.1007/978-3-319-97091-2 (accessed on 13 May 2022).
  10. Ougougdal, H.A.; Khebiza, M.Y.; Messouli, M.; Lachir, A. Assessment of futurewater demand and supply under IPCC climate change and socio-economic scenarios, using a combination of models in Ourika watershed, High Atlas, Morocco. Water 2020, 12, 1751. [Google Scholar] [CrossRef]
  11. Ouhamdouch, S.; Bahir, M.; Ouazar, D.; Carreira, P.M.; Zouari, K. Evaluation of climate change impact on groundwater from semi-arid environment (Essaouira Basin, Morocco) using integrated approaches. Environ. Earth Sci. 2019, 78, 449. [Google Scholar] [CrossRef]
  12. Khomsi, K.; Mahe, G.; Tramblay, Y.; Sinan, M.; Snoussi, M. Regional impacts of global change: Seasonal trends in extreme rainfall, run-off and temperature in two contrasting regions of Morocco. Nat. Hazards Earth Syst. Sci. 2016, 16, 1079–1090. [Google Scholar] [CrossRef] [Green Version]
  13. IPCC (Intergovernmental Panel on Climate Change). Managing the Risks of Extreme Events and Disasters to Advance Climate Change Adaptation; IPCC: Cambridge, UK; New York, NY, USA, 2018; Available online: https://www.ipcc.ch (accessed on 13 January 2018).
  14. IPCC (Intergovernmental Panel on Climate Change). Climate Change 2014 Synthesis Report. Geneva, Switzerland. Available online: https://www.ipcc.ch (accessed on 13 January 2018).
  15. Ahmad, I.; Zhang, F.; Tayyab, M.; Anjum, M.N.; Zaman, M.; Liu, J.; Farid, H.U.; Saddique, Q. Spatiotemporal analysis of precipitation variability in annual, seasonal and extreme values over upper Indus River basin. Atmos. Res. 2018, 213, 346–360. [Google Scholar] [CrossRef]
  16. Kessabi, R.; Hanchane, M.; Guijarro, J.A.; Krakauer, N.Y.; Addou, R.; Sadiki, A.; Belmahi, M. Homogenization and Trends Analysis of Monthly Precipitation Series in the Fez-Meknes Region, Morocco. Climate 2022, 10, 64. [Google Scholar] [CrossRef]
  17. Kouassi, A.M.; Bi, T.M.N.g.; Kouamé, K.F.; Kouamé, K.A.; Okaingni, J.C.; Biemi, J. Application de la méthode des simulations croisées à l’analyse de tendances dans la relation pluie-débit à partir du modèle GR2M: Cas du bassin versant du N’zi-Bandama (Côte d’Ivoire). Comptes Rendus Geosci. 2012, 344, 288–296. [Google Scholar] [CrossRef]
  18. Abahous, H.; Ronchail, J.; Sifeddine, A.; Kenny, L.; Bouchaou, L. Trend and change point analyses of annual precipitation in the Souss-Massa Region in Morocco during 1932–2010. Theor. Appl. Climatol. 2018, 134, 1153–1163. [Google Scholar] [CrossRef]
  19. Aemet, J.A.G. Recommended Homogenization Techniques based on Benchmarking Results. 2020, pp. 1–9. Available online: http://www.indecis.eu/docs/Deliverables/Deliverable_3.2a.pdf (accessed on 22 May 2021).
  20. Peterson, T.C.; Easterling, D.R.; Karl, T.R.; Groisman, P.; Nicholls, N.; Plummer, N.; Torok, S.; Auer, I.; Boehm, R.; Gullett, D.; et al. Homogeneity Adjustments of in Situ Atmospheric Climate Data: A Review. Int. J. Climatol. 1998, 18, 1493–1517. [Google Scholar] [CrossRef]
  21. Mahmood, R.; Jia, S. Quality control and homogenization of daily meteorological data in the trans-boundary region of the Jhelum River basin. J. Geogr. Sci. 2016, 26, 1661–1674. [Google Scholar] [CrossRef] [Green Version]
  22. Yimer, S.M.; Kumar, N.; Bouanani, A.; Tischbein, B.; Borgemeister, C. Homogenization of daily time series climatological data in the Eastern Nile basin, Ethiopia. Theor. Appl. Climatol. 2021, 143, 737–760. [Google Scholar] [CrossRef]
  23. Costa, A.C.M.; Negreiros, J.; Soares, A. Identification of Inhomogeneities in Precipitation Time Series Using Stochastic Simulation. geoENV VI Geostatistics Environ. Appl. 2008, 15, 275–282. [Google Scholar]
  24. Guijarro, J.A. Homogenization of Climatological Series with Climatol, Version 3.1.1. 1, 3.1.1; State Meteorological Agency (AEMET): Balearic Islands, Spain, 2018; Volume 1, p. 20. [Google Scholar]
  25. Paulhus, J.L.H.; Kohler, M.A. Interpolation of Missing Precipitation Records. Monthly Weather Rev. 1952, 80, 129–133. [Google Scholar] [CrossRef]
  26. Ponce-Cruz, R.; Diakite, L.; Monterroso-Rivas, A.I.; Ontiveros-Capurata, R.E.; Crespo-Pichardo, G. Homogenization of Monthly Rainfall Data Series in Lerma-Toluca Watershed with Climatol. Int. J. Sci. Res. 2019, 8, 1533–1538. [Google Scholar]
  27. Guijarro, J.A.; López, J.A.; Aguilar, E.; Domonkos, P.; Victor, K.C.V.; Sigró, J.; Brunet, M. Comparison of homogenization packages applied to monthly series of temperature and precipitation: The MULTITEST project. In Proceedings of the 9th Seminar For Homogenization and Quality Control in Climatological Databases, Budapest, Hungary, 3–7 April 2017; pp. 46–62. [Google Scholar]
  28. Coll, J.; Domonkos, P.; Guijarro, J.; Curley, M.; Rustemeier, E.; Aguilar, E.; Walsh, S.; Sweeney, J. Application of homogenization methods for Ireland’s monthly precipitation records: Comparison of break detection results. Int. J. Climatol. 2020, 40, 6169–6188. [Google Scholar] [CrossRef] [PubMed]
  29. Safavi, H.R.; Sajjadi, S.M.; Raghibi, V. Assessment of climate change impacts on climate variables using probabilistic ensemble modeling and trend analysis. Theor. Appl. Climatol. 2017, 130, 635–653. [Google Scholar] [CrossRef]
  30. Caloiero, T. Analysis of rainfall trend in New Zealand. Environ. Earth Sci. 2015, 73, 6297–6310. [Google Scholar] [CrossRef]
  31. Durand, Y.; Giraud, G.; Laternser, M.; Etchevers, P.; Mérindol, L.; Lesaffre, B. Reanalysis of 47 years of climate in the French Alps (1958-2005): Climatology and trends for snow cover. J. Appl. Meteorol. Climatol. 2009, 48, 2487–2512. [Google Scholar] [CrossRef]
  32. Fan, X.H.; Wang, M.B. Change trends of air temperature and precipitation over Shanxi Province, China. Theor. Appl. Climatol. 2011, 103, 519–531. [Google Scholar] [CrossRef]
  33. Fathian, F.; Morid, S.; Kahya, E. Identification of trends in hydrological and climatic variables in Urmia Lake basin, Iran. Theor. Appl. Climatol. 2015, 119, 443–464. [Google Scholar] [CrossRef]
  34. Adarsh, S.; Reddy, M.J. Trend analysis of rainfall in four meteorological subdivisions of southern India using nonparametric methods and discrete wavelet transforms. Int. J. Climatol. 2015, 35, 1107–1124. [Google Scholar] [CrossRef]
  35. Salehi, S.; Dehghani, M.; Mortazavi, S.M.; Singh, V.P. Trend analysis and change point detection of seasonal and annual precipitation in Iran. Int. J. Climatol. 2020, 40, 308–323. [Google Scholar] [CrossRef]
  36. Ahmed, M.K.; Alam, M.S.; Yousuf, A.H.M.; Islam, M.M. A long-term trend in precipitation of different spatial regions of Bangladesh and its teleconnections with El Niño/Southern Oscillation and Indian Ocean Dipole. Theor. Appl. Climatol. 2017, 129, 473–486. [Google Scholar] [CrossRef]
  37. Chillasse, L.; Dakki, M. Potentialités et statuts de conservation des zones humides du Moyen-Atlas (Maroc), avec référence aux influences de la sécheresse. Sécheresse 2004, 15, 337–345. [Google Scholar]
  38. el Jihad, M.D. Changement climatique et développement rural dans les montagnes du Moyen-Atlas et leurs bordures (Maroc). Rev. Géographie Alp. 2016, 104, 1–16. [Google Scholar] [CrossRef] [Green Version]
  39. González-Rouco, J.F.; Jiménez, J.L.; Quesada, V.; Valero, F. Quality control and homogeneity of precipitation data in the southwest of Europe. J. Clim. 2001, 14, 964–978. [Google Scholar] [CrossRef]
  40. Abahous, H.; Guijarro, J.A.; Sifeddine, A.; Chehbouni, A.; Ouazar, D.; Bouchaou, L. Monthly precipitations over semi-arid basins in Northern Africa: Homogenization and trends. Int. J. Climatol. 2020, 40, 6095–6105. [Google Scholar] [CrossRef]
  41. Leduc, D.J.A. Comparative analysis of the reduced major axis technique of fitting lines to bivariate data. Can. J. For. Res. 1987, 17, 654–659. [Google Scholar] [CrossRef]
  42. Zhang, L.; Bi, H.; Gove, J.H.; Heath, L.S. A comparison of alternative methods for estimating the self-thinning boundary line. Can. J. For. Res. 2005, 35, 1507–1514. [Google Scholar] [CrossRef]
  43. Solomon, D.S.; Zhang, L. Maximum size-density relationships for mixed softwoods in the northeastern USA. For. Ecol. Manag. 2002, 155, 1127. [Google Scholar] [CrossRef]
  44. Alexandersson, H. A homogeneity test applied to precipitation data. J. Climatol. 1986, 6, 661–675. [Google Scholar] [CrossRef]
  45. Mann, H.B. Non-Parametric Test Against Trend. Econometrica 1945, 13, 245–259. [Google Scholar] [CrossRef]
  46. Kendall, M.G. Rank Correlation Methods, 2nd ed.; Hafner: New York, NY, USA, 1970. [Google Scholar]
  47. Gocic, M.; Trajkovic, S. Analysis of precipitation and drought data in Serbia over the period 1980–2010. J. Hydrol. 2013, 494, 32–42. [Google Scholar] [CrossRef]
  48. Douglas, E.M.; Vogel, R.M.; Kroll, C.N. Trends in floods and low flows in the United States: Impact of spatial correlation. J. Hydrol. 2000, 240, 90–105. [Google Scholar] [CrossRef]
  49. Sayemuzzaman, M.; Jha, M.K.; Mekonnen, A. Spatio-temporal long-term (1950–2009) temperature trend analysis in North Carolina, United States. Theor. Appl. Climatol. 2015, 120, 159–171. [Google Scholar] [CrossRef]
  50. Kisi, O.; Ay, M. Comparison of Mann-Kendall and innovative trend method for water quality parameters of the Kizilirmak River, Turkey. J. Hydrol. 2014, 513, 362–375. [Google Scholar] [CrossRef]
  51. Isnard, H. La répartition saisonnière des pluies au Maroc. Ann. Georgr. 1958, 67, 39–42. [Google Scholar] [CrossRef]
  52. Singla, S.; Mahé, G.; Dieulin, C.; Driouech, F.; Milano, M.; el Guelai, F.Z.; Ardoin-Bardin, S. Evolution des relations pluie-débit sur des bassins versants du Maroc. In Proceedings of the Sixth World FRIEND Conference, Fez, Morocco, 25–29 October 2010; AISH Publications: Wallingford, UK, 2010. [Google Scholar]
  53. Hanchane, M. Méthodologie de régionalisation spatio- temporelle pour une analyse des précipitations (1961–1992): Application au Maroc atlantique. In Proceedings of the Actes du Deuxième Colloque International «Eau & Climat: Regards croisés Nord/Sud», Fès, Morocco, 27–28 November 2013. [Google Scholar]
  54. Addou, R.; Hanchane, M.; Obda, K. Impact du Changement Climatique Actuel sur la Variabilité Pluviométrique au Niveau du Bassin Versant de l’oued Melloulou; Changement climatique, potentialités territoriales et justice environnementale. Ouvrage collectif. Imp.; Info-Print: Fes, Morocco, 2021; pp. 99–112. [Google Scholar]
  55. Nouaceur, Z.; Laignel, B.; Turki, I. Changements climatiques au Maghreb: Vers des conditions plus humides et plus chaudes sur le littoral algérien? Physio-Géo 2013, 7, 307–323. [Google Scholar] [CrossRef]
  56. Abdelali, S.; Mohammed, H.; Fougrach, H.; Saloui, A. Retour des pluies au maroc méridional. In Proceedings of the XXVIIe Colloque de l’Association Internationale de Climatologie, Dijon, France, 2–5 July 2014; pp. 596–600. [Google Scholar]
  57. Laignel, B.; Nouaceur, Z.; Abida, H.; Ellouze, M. Vers un retour des pluies dans le nord-est tunisien? In Proceedings of the XXVIIe Colloque de l’Association Internationale de Climatologie, Dijon, France, 2–5 July 2014; pp. 727–732. [Google Scholar]
Figure 1. Geographical location of the northern Middle Atlas.
Applsci 12 12496 g001
Figure 2. Data availability per year. The green and red lines mark the desired and critical number of the data availability threshold, respectively.
Applsci 12 12496 g002
Figure 3. Correlograms of the first differences of the series stations’ raw data (on the left) and adjusted data (to the right).
Applsci 12 12496 g003
Figure 4. Clusters of stations (A) before and (B) after homogenization.
Applsci 12 12496 g004
Figure 5. Monthly rainfall regime of the two clusters (B1, B2) after homogenization.
Applsci 12 12496 g005
Figure 6. Seasonal rainfall regime of the two clusters (B1, B2) after homogenization.
Applsci 12 12496 g006
Figure 7. RMSE and SNHT values after homogenization.
Applsci 12 12496 g007
Figure 8. Spatialization of monthly precipitation trends of all data series.
Applsci 12 12496 g008aApplsci 12 12496 g008b
Table 1. Geographical location of stations; code of the coordinate system used is EPSG:26191.
NameIDLongitude (°W)Latitude (°N)Elevation (m)
Bab AzharS1−4.2659234.04625788
Bab BouidirS2−4.1254434.068101543
Bab LoutaS3−4.3317434.01548575
BechineS4−3.9310734.08458970
BelfarahS5−3.7050534.11262512
Beni BouilloulS6−3.9790033.562501882
BerkineS7−3.8472133.766181287
GuercifS8−3.3573134.21953362
MaghraouaS9−4.0491533.934191140
MrijaS10−3.2769233.99508891
MissourS11−3.9991933.04599667
Outat el hajS12−3.7018433.33271763
Ras laksarS13−3.7501933.96165726
SakaS14−3.0614934.53973240
TaddertS15−3.5935634.21604445
TahlaS16−4.4263434.04774571
TamjiltS17−4.0150933.643431645
TanditS18−3.6229533.66328667
TazaS19−4.0097534.21955522
TazzekaS20−4.1830134.089941971
ZrardaS21−4.3759333.97390841
RechidaS22−3.2261533.873551080
Table 2. Monthly precipitation trends of all data series.
IDJanuaryFebruaryMarchAprilMayJuneJulyAugustSeptemberOctoberNovemberDecember
S1−0.23−1.05−0.92−0.64−0.38−0.641.122.86 ***3.35 ***2.52 **2.53 **−0.8
S2−0.74−1.14−0.49−0.11−0.13−0.390.851.23.24 ***2.33 **2.63 ***−0.54
S3−0.25−1.19−0.97−1.02−0.49−0.710.621.71 *2.02 **2.14 **2.57 **−0.62
S4−0.46−1.59−0.4−0.92−0.31−0.131.75 *2.57 *3.64 ***2.75 ***1.80 *−0.7
S5−0.080.08−0.22−2.01 **−1.18−0.040.510.682.85 ***1.511.70 *0.42
S6−0.15−1−0.44−1.89 *−0.12−0.910.481.592.15 **2.47 **0.690.34
S70.08−0.84−0.38−1.78 *0.04−0.731.062.82 ***2.57 **2.07 **0.720.98
S80.39−1.07−1.04−1.64 *0.31−0.24−0.90.21.95 *0.311.45−0.33
S9−0.03−0.74−0.64−0.460.141.232.57 **3.31 ***2.46 **1.97 **3.11 ***−0.76
S10−0.54−1.16−0.88−1.80 *−0.72−0.87−0.090.591.280.471.36−0.55
S11−0.69−1.95 *−1.34−1.261.212.19 **−0.20.111.89 *1.093.19 ***−1.09
S120.02−0.080.42−1.470.27−0.720.972.29 **0.321.91 *1.480.81
S130.08−0.680.13−0.42−0.671.372.15 **2.42 **2.40 **1.62.59 ***0.01
S140.7−0.69−0.25−1.16−0.33−0.020.692.06 **1.591.232.29 **0.22
S15−0.64−1.46−0.89−1.55−0.81−0.680.030.091.88 *1.271.59−1.05
S160.03−1.04−0.89−0.52−0.730.282.17 **1.75 *2.52 **1.78 *2.33 **−0.23
S17−0.49−0.891.59−0.830.15−1.480.91.81 *2.57 **2.58 ***2.82 ***0.74
S18−0.2−0.830.22−1.22−0.69−1.041.571.261.231.87 *1.30.95
S19−0.6100.04−0.3−0.12−0.561.99 **1.233.28 ***2.09 **2.18 **−0.71
S20−0.33−1.07−0.56−1.29−0.49−1.230.782.54 **1.97 **3.00 ***2.54 **−0.9
S210.81−0.57−0.64−0.24−0.7−1.95 *−1.530.980.531.562.26 **0
S22−0.59−1.18−0.33−2.05 **−0.86−0.141.612.70 ***3.09 ***1.190.06−0.61
* Trends at the 0.1 significance level if 1.64 ≤ Z < 1.96, ** Trends at the 0.05 significance level if 1.96 ≤ Z < 2.57, *** Trends at the 0.01 significance level if 2.57 < Z.
Publisher’s Note: MDPI stays neutral with regard to jurisdictional claims in published maps and institutional affiliations.

