Article

Landslides Triggered by Medicane Ianos in Greece, September 2020: Rapid Satellite Mapping and Field Survey

by
Sotiris Valkaniotis
1,*,
George Papathanassiou
2,
Vassilis Marinos
3,
Charalampos Saroglou
3,
Dimitrios Zekkos
4,
Vasileios Kallimogiannis
3,
Efstratios Karantanellis
5,
Ioannis Farmakis
6,
Georgios Zalachoris
7,
John Manousakis
8 and
Olga-Joan Ktenidou
9
1
Department of Civil Engineering, Democritus University of Thrace, 67100 Xanthi, Greece
2
Department of Geology, Aristotle University of Thessaloniki, 54124 Thessaloniki, Greece
3
School of Civil Engineering, National Technical University of Athens, 10682 Athens, Greece
4
Department of Civil and Environmental Engineering, University of California at Berkeley, Berkeley, CA 94720, USA
5
Department of Earth and Environmental Sciences, University of Michigan, Ann Arbor, MI 48109, USA
6
Department of Geological Sciences and Engineering, Queen’s University, Kingston, ON K7L 3N6, Canada
7
Omikron Kappa Consulting S.A., 15122 Athens, Greece
8
Elxis Group, 10682 Athens, Greece
9
Geodynamic Institute, National Observatory of Athens, 11810 Athens, Greece
*
Author to whom correspondence should be addressed.
Appl. Sci. 2022, 12(23), 12443; https://doi.org/10.3390/app122312443
Submission received: 19 July 2022 / Revised: 1 December 2022 / Accepted: 2 December 2022 / Published: 5 December 2022
(This article belongs to the Special Issue Mapping, Monitoring and Assessing Disasters)

Abstract

:
Medicanes, a type of strong hurricanes/cyclones occurring in the Mediterranean, can be the source of major geohazard events in Mediterranean coastal and inland areas. Medicane Ianos that hit Greece during 17–19 September 2020 caused widespread damage, with numerous landsides and floods being the most prominent. Following the landfall of Medicane Ianos, a series of field surveys were launched together with rapid response through satellite imagery. We focused on two of the areas most affected by Medicane Ianos, Cephalonia island and Karditsa, Thessaly, both in Greece. A rapid landslide inventory for the Karditsa region was prepared using Copernicus Sentinel-2 satellite imagery, the first of its kind for a severe weather event in Greece. The mountainous area of Karditsa region in western Thessaly experienced the unprecedented number of 1696 landslides, mapped through satellite imagery and examined in the field. Cephalonia Island experienced a smaller number of landsides but damaging debris flows and severe structural damages. The rapid landside inventory was then compared to new methods of automated landslide mapping through change detection of satellite imagery.

1. Introduction

As a distinctive part of the geomorphic evolution of active mountain belts, landslides play an important role in gradually changing the landscape. The triggering of landslides is related to earthquake, meteorological and human-induced factors. The former cases are reported in active tectonic zones and are characterized by the sudden occurrence of co-seismic landslides covering large areas close to the earthquake fault rupture. As it has been demonstrated by [1], fault rupture geometry and kinematics plays a significant role to the spatial distribution and density of the coseismic landslides. On the other hand, most of the landslide-related phenomena are generated by intense rainfalls. It is well known that long periods of low intensity rainfall can trigger deep-seated landslides while short duration heavy intensity rainfall is mostly related to shallow mass movements [2]. Climate change, caused by global warming in the recent years, is expected to lead to an increase of the rate of landslide phenomena in the near future [3].
One of the outcomes of climate change is a more frequent occurrence of tropical-like cyclones in areas of dry climate and relatively shallow seas. The Mediterranean Basin is one of the most cyclogenetic regions worldwide as a result of its characteristic morphology [4]. Medicanes, a concatenation of Mediterranean Sea with hurricanes, resemble tropical cyclones but present certain differences. The formation of Medicanes is highly controlled by the air–sea interaction [5]. Generally, high sea surface temperatures favor their formation especially when the air temperature is relatively low [6]. Tropical cyclones emerge when the temperature of the sea surface exceeds 26 °C. Nevertheless, the correspondent temperatures in the Mediterranean range between 18 to 23 °C [7,8], much lower than the threshold required for the tropical cyclone formation. Moreover, the expected lifespan of Medicanes is shorter than that of tropical storms.
The return period of Medicanes is higher in the central and western Mediterranean Sea [9] despite the fact that the eastern basin is warmer (a favorable factor for the development of tropical-like cyclones). This phenomenon is probably related to the fact that the central and western Mediterranean is prone to cold upper-air intrusions from north and central Europe [6]. A Medicane usually carries enough energy to travel large distances (sometimes hundreds of kms) causing torrential rains and strong winds until its deterioration. Its environmental and socioeconomic impact can be devastating.
One of these meteorological events is Medicane “Ianos” that occurred in September 2020 and formed as a result of a cluster of convection off the Libyan coast on 14 September 2020 [10,11,12,13]. Over the following days, it moved to the north and intensified before making landfall over Greece on 17 September 2020. After impacting western and central Greece, it changed its course and reached south Crete island by 20 September 2020. Medicane Ianos triggered intense rainfall at the central and southwestern part of Greece (Figure 1), including the two areas focused in this study; western Thessaly and Ionian Islands. Accumulated rainfall peaked at 769 mm for 17–18 September in Cephalonia island in the Ionian Sea, while Pertouli and Mouzaki stations in western Thessaly peaked at 317 mm and 268 mm [12]. This natural phenomenon induced thousands of mostly shallow landslides, debris flows and floods mainly at Central Greece and particularly at the area of Karditsa, Thessaly, Central Greece [14,15,16]. Landslides blocked most of the narrow mountainous roads and damaged numerous bridges [15,17]. This resulted in the isolation of communities located in higher elevations and delayed emergency response and recovery [14,17].

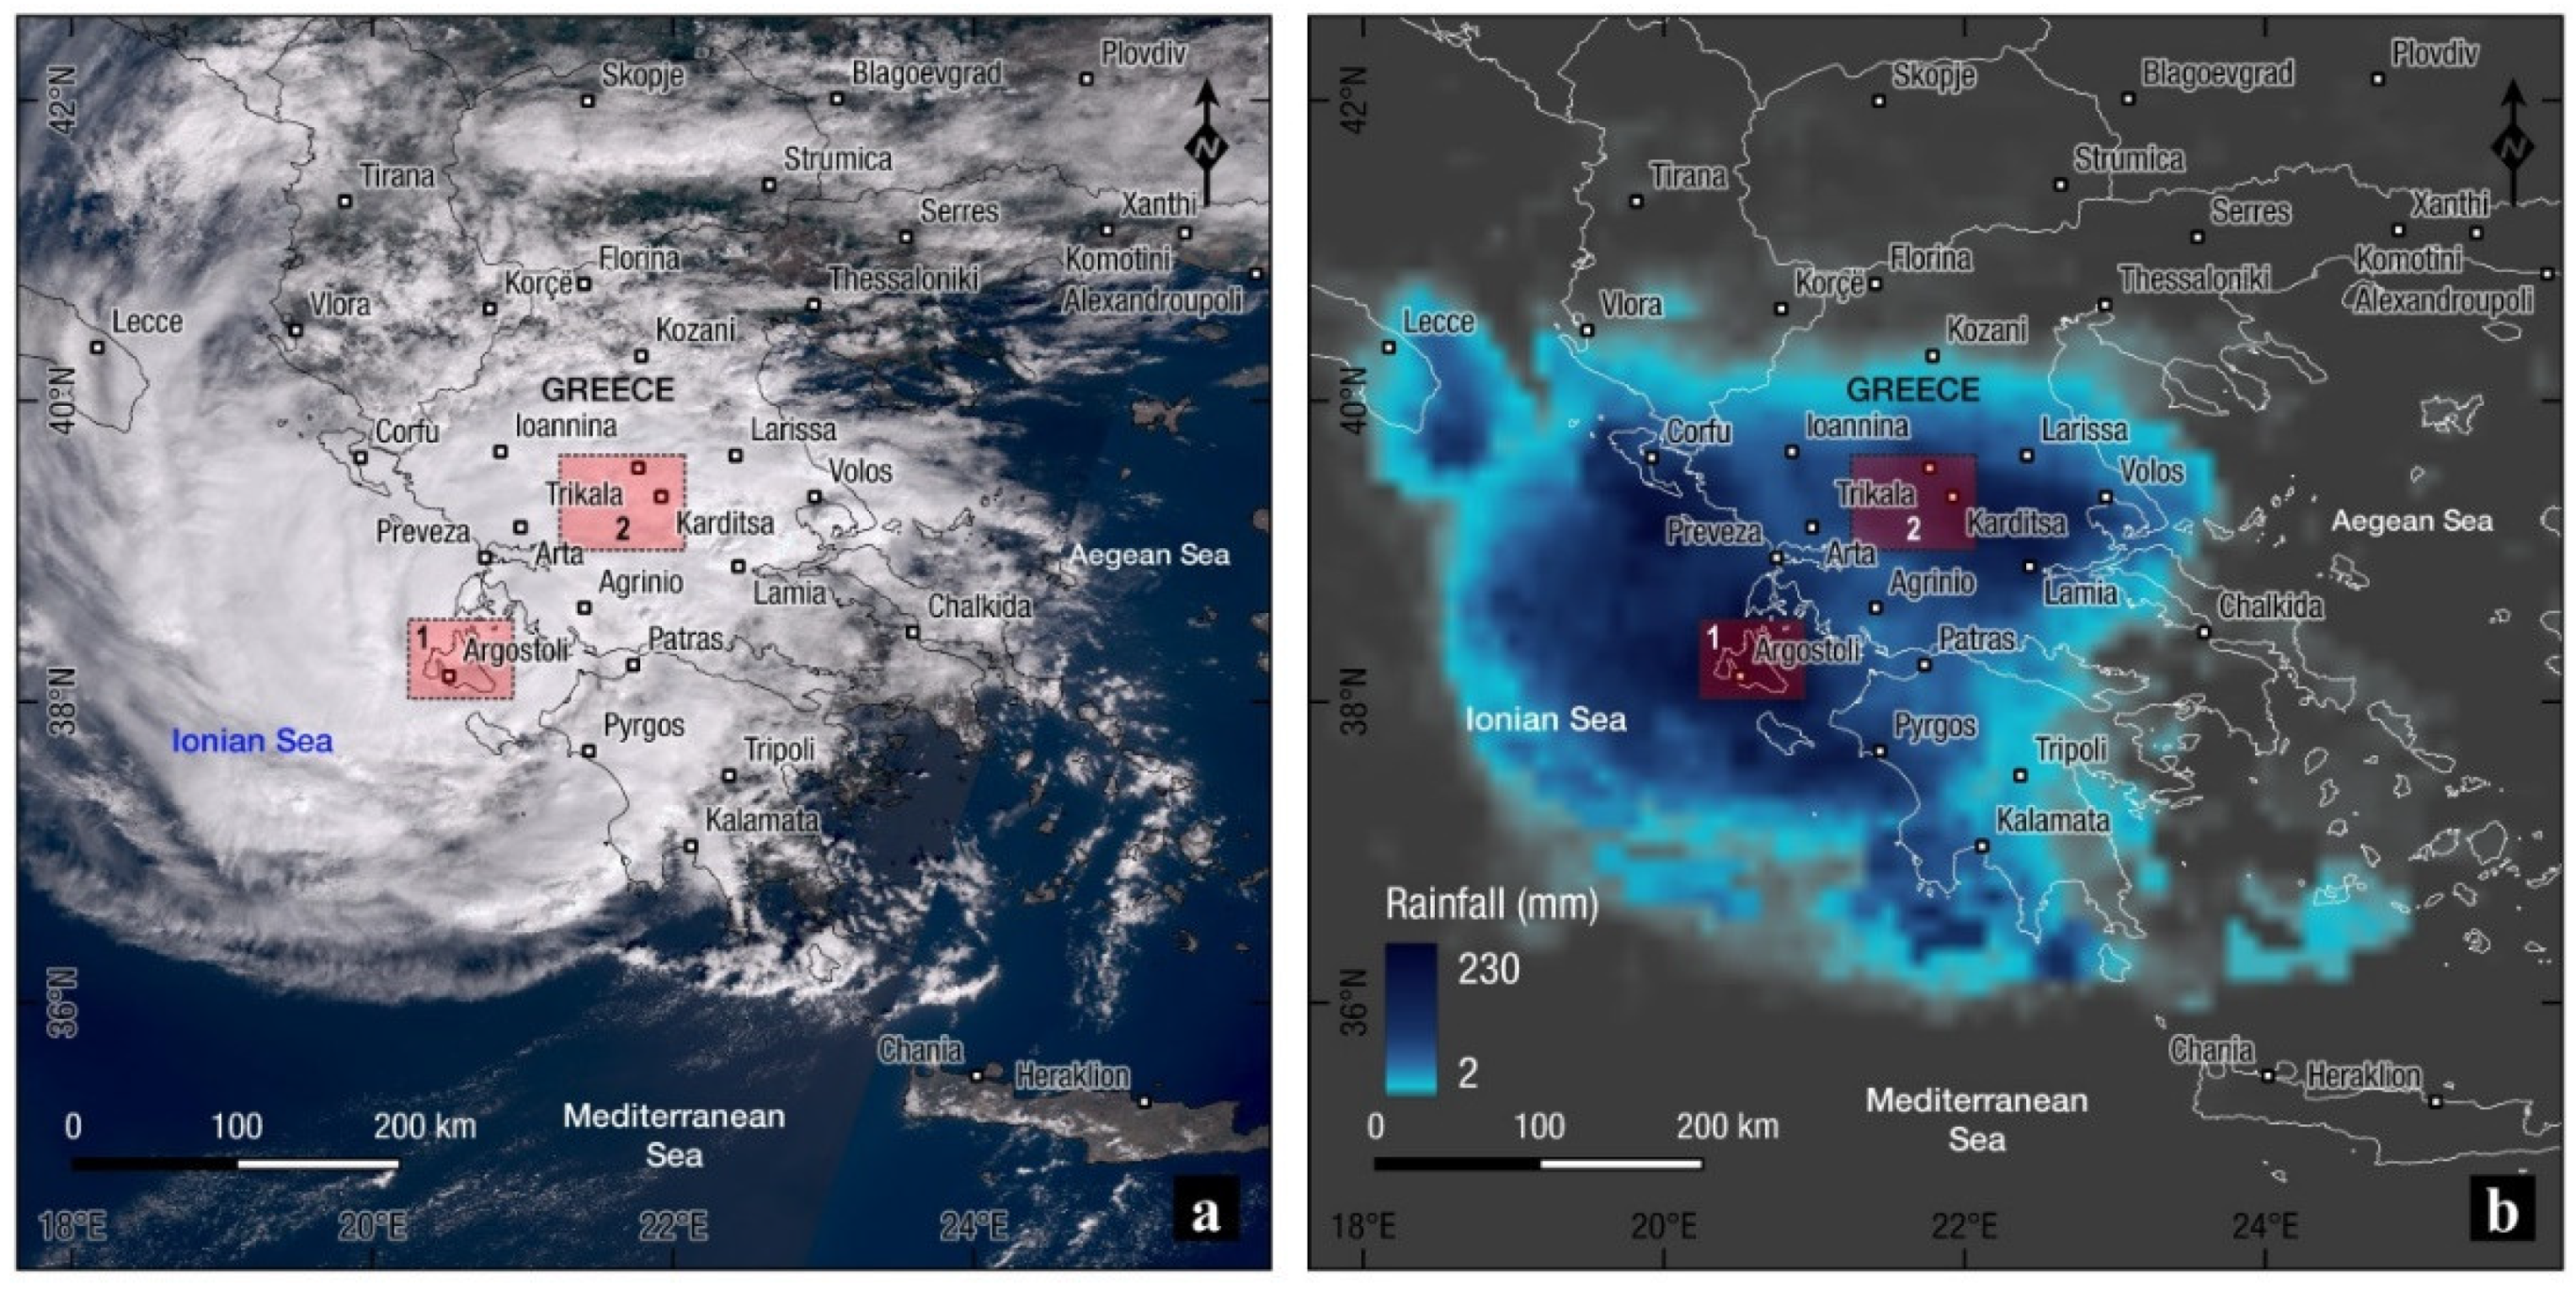
2. Medicane Ianos-Induced Landslides

The first step for understanding the mechanism of the cyclones-induced landslides and to mitigate in near future similar types of catastrophes is to rapidly document them. This can be achieved by immediately organizing a field survey after the event to acquire perishable field data before it disappears. Landslide debris and rockfalls are commonly cleaned out of the road network as part of the recovery operations, but their removal obscures critical information used to analyze the triggers for slope failures. Furthermore, physical processes such as weathering and erosion could additionally alter the landslide-formed landscape after the landslide event, especially concerning small size shallow landslides. Data recovered from landslide studies are essential to understanding landslide mechanisms and the associated risks, which greatly aids in identifying susceptible zones, augmenting emergency response, and mitigating potential property damage and loss of life. This research applies a mixed-method approach, primarily consisting of a desk study followed by a detailed post-event field survey aiming to report the failures in order to compile a landslide-event inventory map.
In this study, the landslide phenomena triggered in the area of Thessaly and Ionian Islands are presented and preliminary analyzed with the aim to relate their spatial distribution with some basic geological and geomorphological parameters, i.e., geology, aspect, slope and elevation. Although large parts of central and western Greece were affected by Medicane Ianos, Karditsa and Cephalonia island are presented here in detail, as they experienced the most dense and severe landslide phenomena. In order to achieve this, we used information obtained during extensive field work and data provided by rapid satellite imagery mapping captured a few hours and days after the event.
Satellite-derived precipitation (e.g., Global Precipitation Measurement–GPM) enables monitoring of rainfall amount and patterns in near real-time (Figure 1b), and precipitation maps can be derived for forecasting or study of landslide events such as hurricanes and Medicanes [18,19]. However, results from Medicane Ianos satellite-derived precipitation showed an inconsistency with ground station measurements, with significantly lower values measured from the satellite sensors [12]. This, in addition to the poor coverage of the affected area (mountainous western Thessaly) by ground stations does not permit us to recreate an accurate map of precipitation during Medicane Ianos.

2.1. Landslides in Thessaly

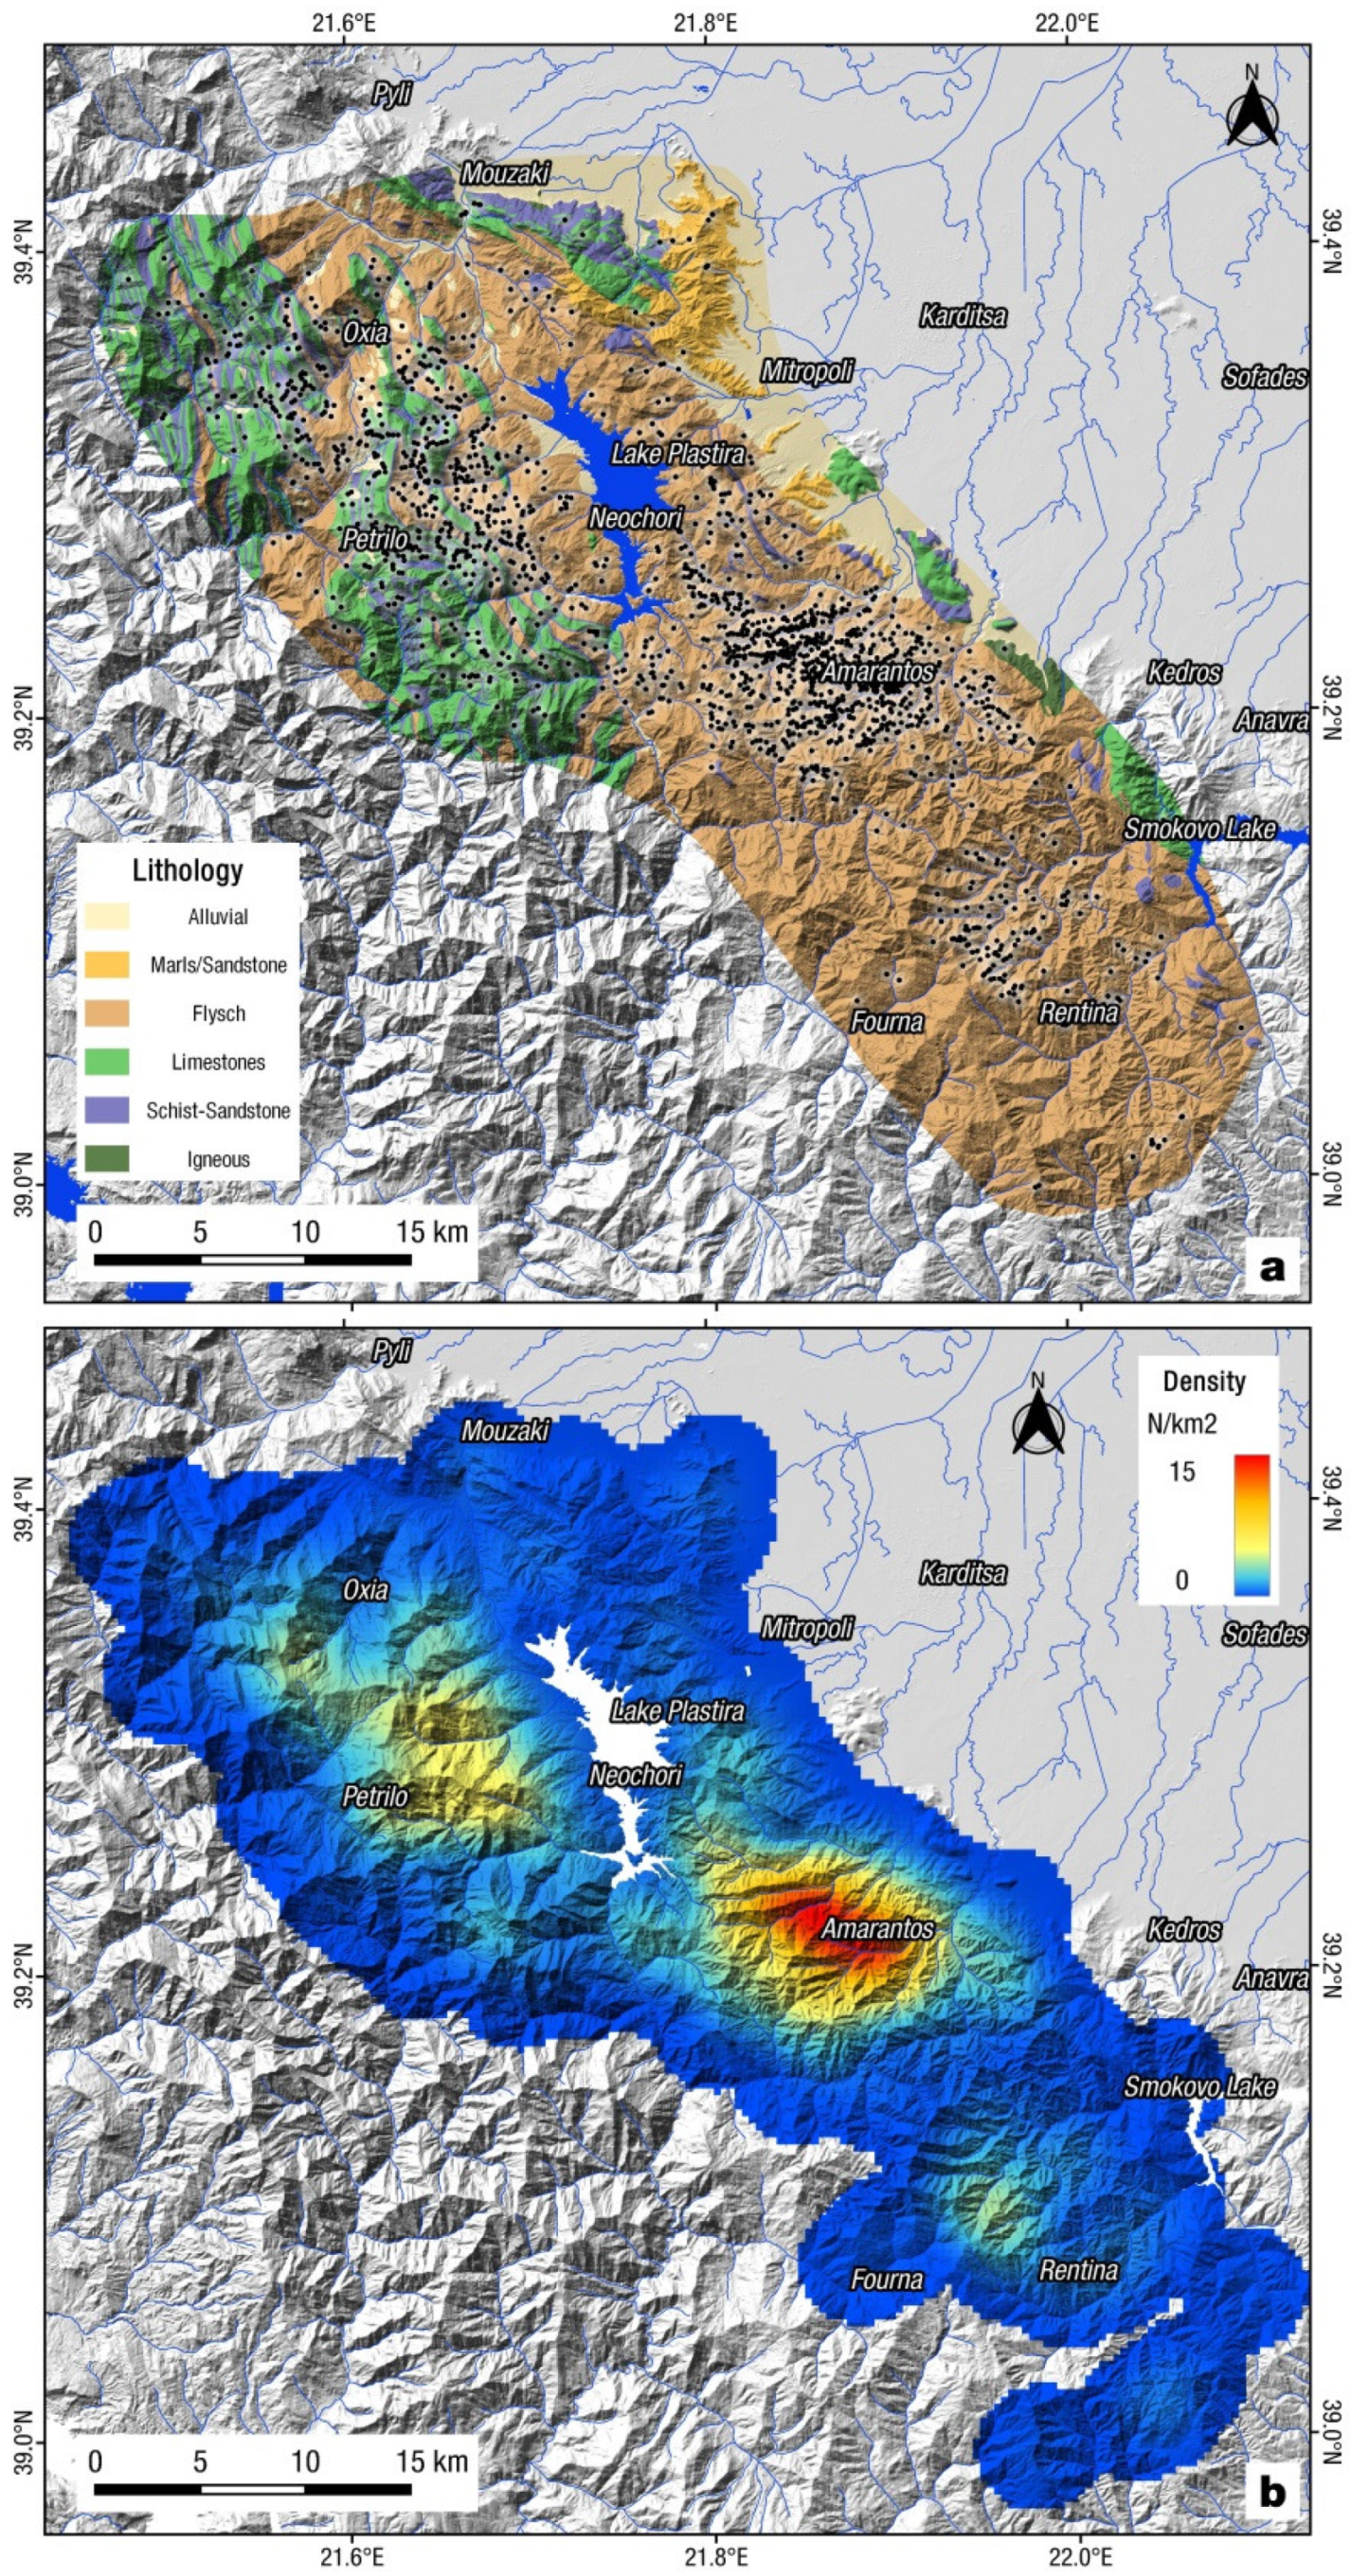
2.1.1. Geologic Setting

Thessaly is the largest plain of central Greece surrounded by mountain ranges, most notably Pindos mountains in the west. The study area is part of the western Karditsa Prefecture and a smaller part of Evritania to the southwest. It includes Plastira dam lake at the center, and the high-elevation Agrafa Mountains (part of Pindos range) in the western part.
The oldest post-alpine sediments in the area are the Molassic formations of the Mesohellenic trench [20,21]. The majority of the area is covered by the flysch formation of the Pindos geotectonic unit [21,22,23]. Flysch formation consists of alternations of shales, sandstones, and limestones that are highly susceptible to slope failures. Bedrock formations of the Alpine units also include limestones and cherts of Pindos, Koziakas and Sub-Pelagionian zones, while ophiolites can be found in the eastern and southwestern border of the area [21,23,24].

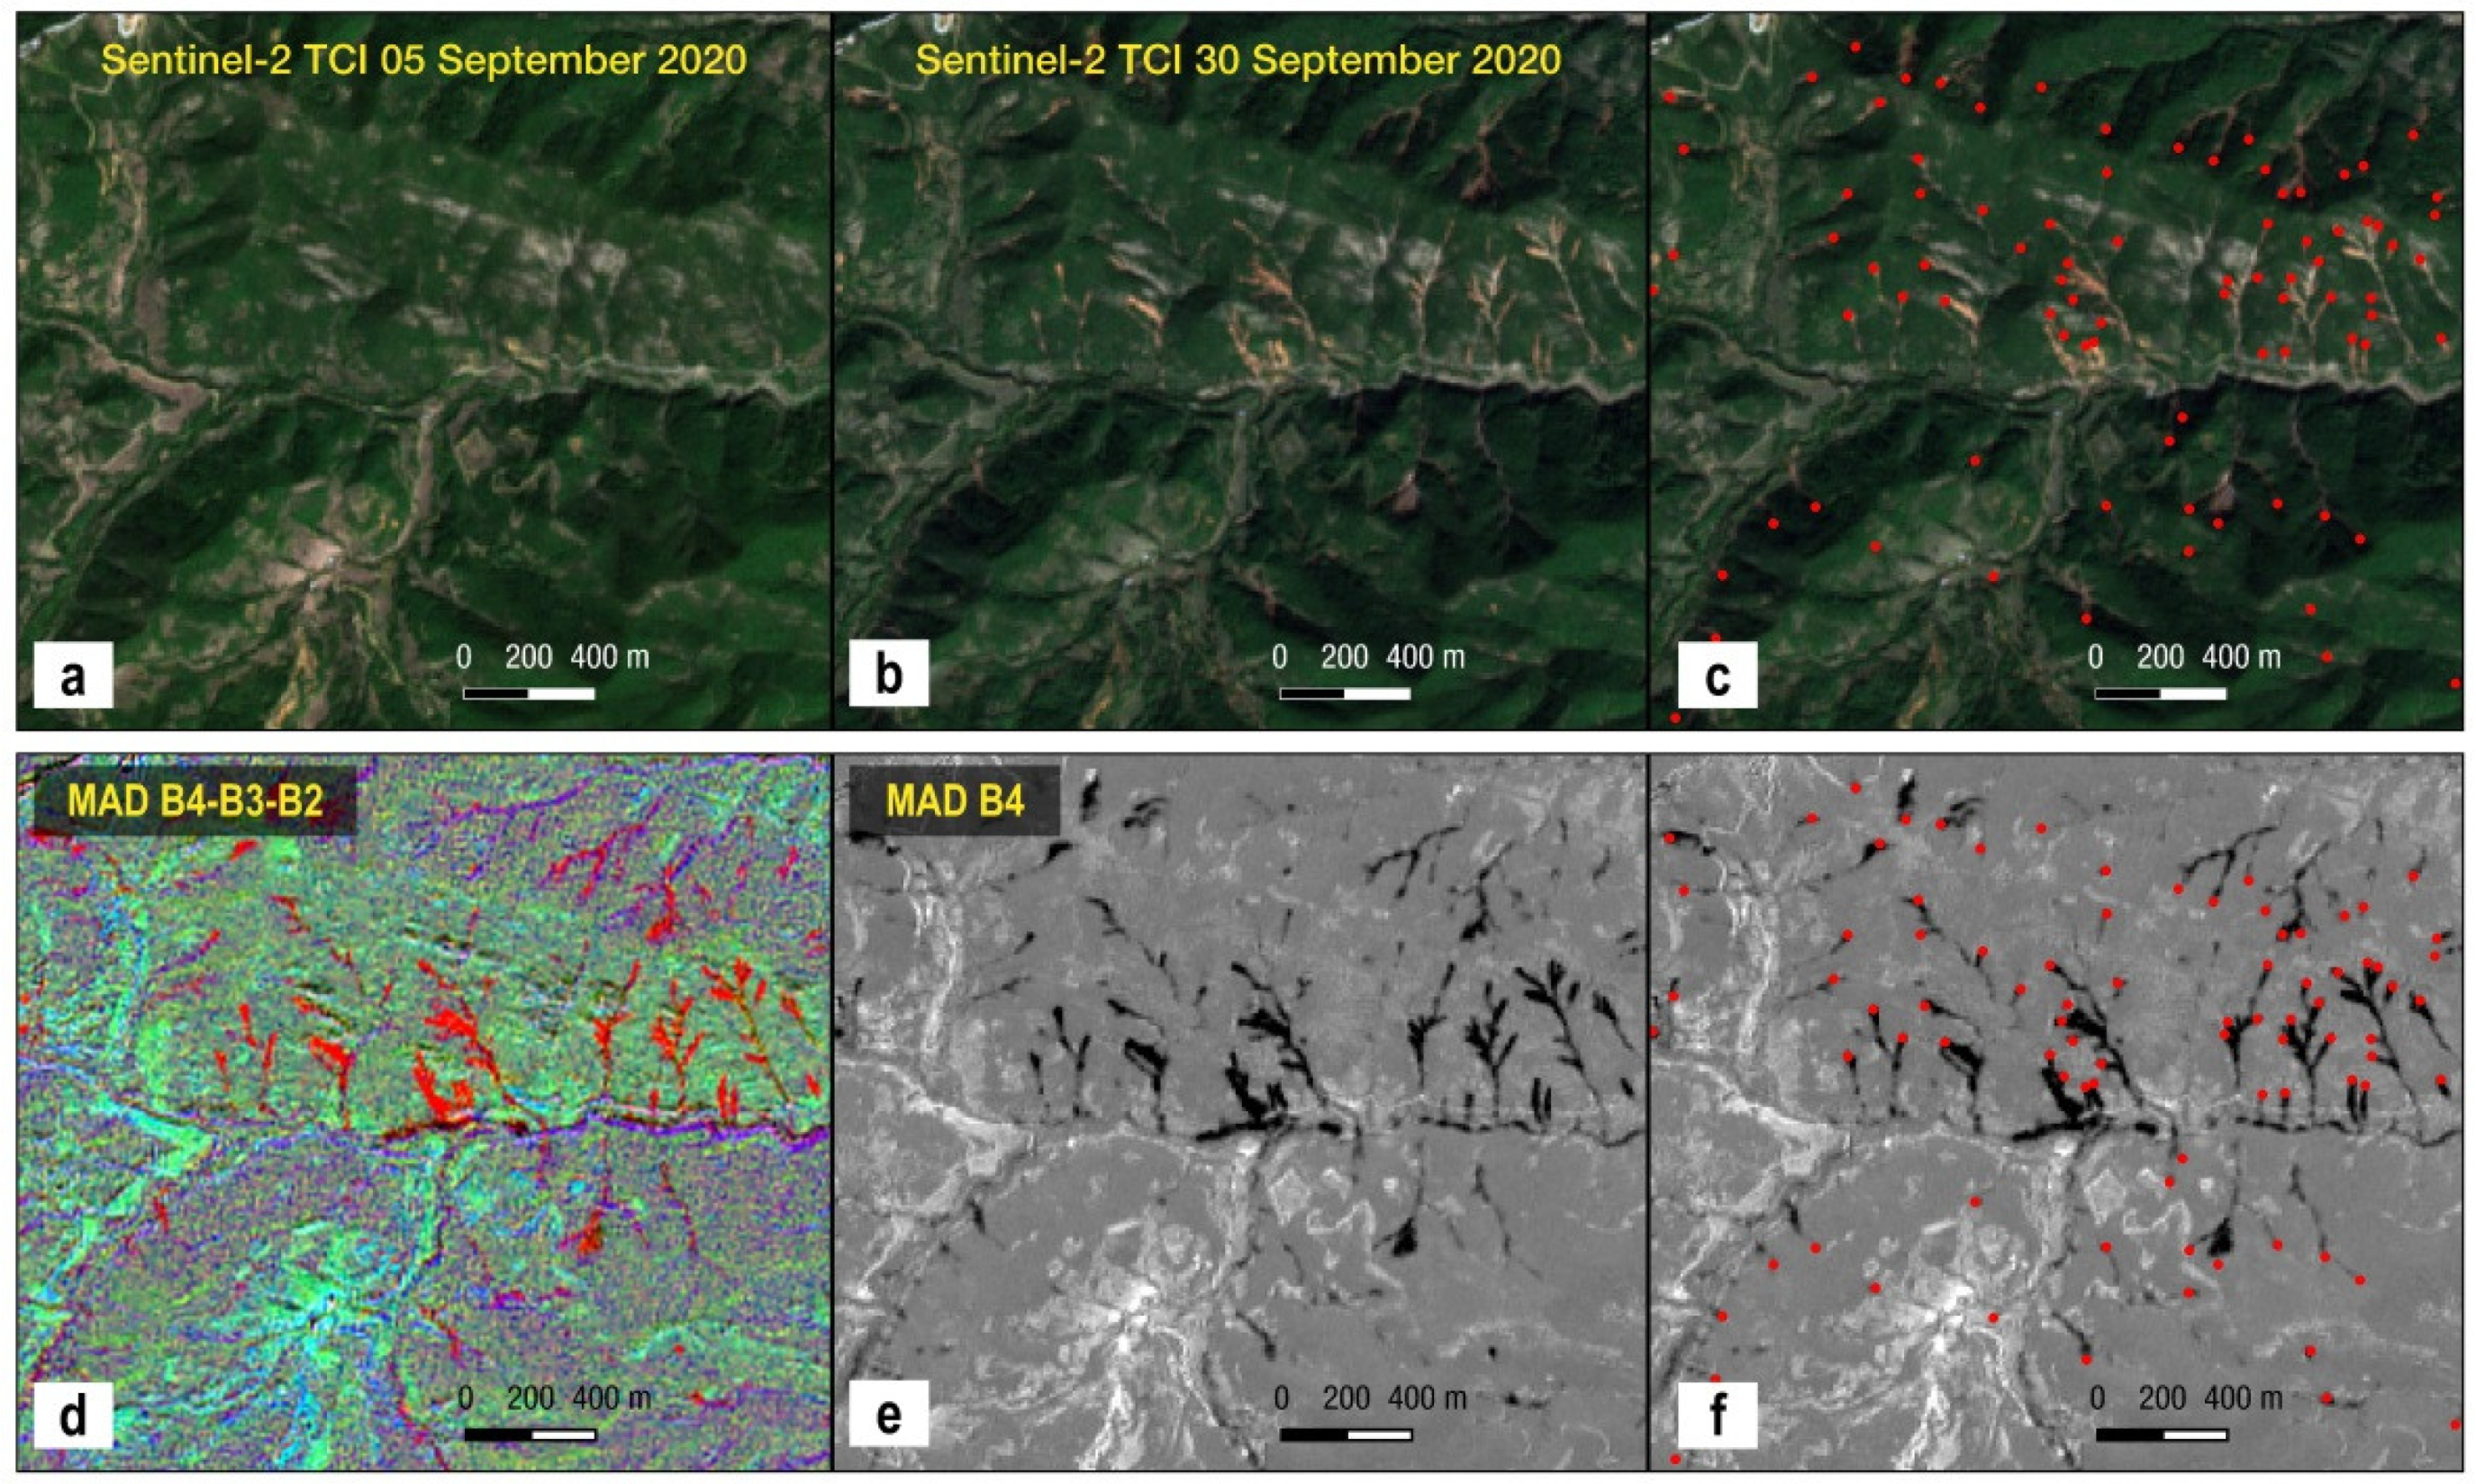
2.1.2. Remote Sensing-Based Landslide Inventory

To investigate and map the distribution of landslides in the Karditsa, Thessaly area, we used post-event acquisitions of Copernicus Sentinel-2 optical satellite imagery. Sentinel-2A/B multispectral imagery has a ground resolution of 10–60 m and covers wide swaths, thus enabling the rapid imaging of the affected area. Multiple Sentinel-2 frames were selected for the post-event period, and acquired 20, 25 and 30 September 2020, as large parts of the area were covered by clouds in the 20 and 25 September frames. Images acquired before the event, on 5, 10 and 15 September 2020, were used as references in order to visually identify and map landslides (Figure 2 and Figure 3). The minimum size of landslides mapped was limited by the satellite imagery resolution (10 m for Sentinel-2), and consequently smaller-sized slides or rockfalls were not possible to identify and were not included. In addition, it was not feasible to classify most of the landslides into different types based on this remote sensing procedure. A small portion of slope failures was classified by the field surveys as presented in following section, validating the outcome of the statistical analysis presented in Figure 4.
Due to the small size of the majority of the identified landslides (most having a size of 2–4 pixels in Sentinel-2 imagery), landslide polygons were not digitized in this preliminary inventory. Digitizing was focused on marking the initiation point/headscarp (long avalanches or earthflows) or the approximate center of the landslide feature when the former was not possible due to small size and image resolution. For assistance during manual picking of landslides, we used additional analysis products, such as change analysis rasters (MAD-Multivariate Alteration Detection Transformation [25]) and multi-temporal single band RGB composites (Figure 2). Co-registration issues present between Sentinel-2 frames were resolved using GeFolki registration algorithm [26].
This preliminary inventory (Figure 3) includes 1697 landslides, limited to a narrow mountainous area of Karditsa and part of Evritania regions. Examination of Sentinel-2 imagery over the Pindos mountain region showed no or few sparse landslides, outside this area. The largest concentration of landslides was found around Amarantos village, southeast of Plastira lake, with up to 15 landslides per square kilometer (Figure 3).

2.1.3. Statistical Analysis of Slope Failures

The spatial distribution of the slope failures was correlated with topographic parameters e.g., slope angle, aspect and elevation and the geologic characteristics of the study area, as provided by the relevant 1:50,000 scale geological maps. In particular, information related to the spatial distribution of the geological formations acquired by the official geological map sheets in 1:50,000 scale available from the Institute of Geological and Mineral Exploration [27,28,29,30,31,32]. Afterwards, we combined those formations into a smaller number of generalized groups based on similar lithological features (Table 1). The topographic parameters were extracted from a digital elevation model (DEM) of 5 m resolution, provided by the Hellenic Cadastre.
As shown in Figure 4, about 40% of the generated landslides were mapped on elevation ranging from 400 to 800 m; approximately 21% of the total number of landslides was documented from 400 to 600 m and 19% was reported on areas located between 600 and 800 m elevation. On higher elevation areas, the percent of slope failures was 13.91% between 800 and 1000 m, 15.26% between 1000 and 1200 m, and 10.49% for areas at elevation from 1200 and 1400 m. A lower percentage of slope failures has been identified at an elevation higher than 1400 m while a sharp decrease of landslides is related to areas located higher than 1800 m and lower than 400 m elevation. These statistics make sense as the areas located at high elevation are limited, while the latter outcome is due to the spatial distribution of geological units. More specifically, the lower parts of the study areas are mostly flat and covered by Quaternary sediments (loose clays, gravel and sand) and not by the flysch formation, which as it is demonstrated next is the predominant unit for landslide triggering among the geological units, along with slope gradient and relief.
The largest part of the study area is covered by the flysch formation (Fo), a generally weak, complex, and of variable rock mass quality unit. Flysch is composed by different rhythmic alternations of competent/strong sandstone layers and is incompetent, of generally low-strength siltstone/clayey schist beds, while it is associated with intensive folding and fracturing. At the mountainous area, Cretaceous carbonates are mapped (K7-9.k), while Quaternary deposits (Q) are concentrated mostly in the basin of Thessaly. These three geological units cover almost 81% of the study area. In particular, the flysch and K7-9.k cover 63% and 9.41%, respectively, and the quaternary deposits 8.5%. As it was expected, most of the landslides, approximately 79%, were reported in the area that is geologically covered by the flysch formation, followed by the geological units of K7-9.k and K9.Pc with 5.6% and 4.37%, respectively. To facilitate the reader, only the geological affected by slope failures are plotted in the relevant diagram.
A strong correlation with landslide occurrence exists for the areas where the slope angle ranges between 25° and 40° (Figure 4c). In these areas, the identified cases of slope failures are 1167, which is approximately 69% of the total failures. On lower (20–25°) and higher (40–45°) slope angle areas, the reported landslides are 139 and 151, respectively and rapidly decrease for slope angles higher than 45° and lower than 20°. The median slope angle of the landslides is approximately 32°, which is in agreement with the one documented by [32] for the slope failures triggered by Hurricane Maria, Puerto Rico 2017.
Analyzing the spatial distribution of slope failures with respect to the aspect of the slopes, a correlation between east-faced slopes and triggering of slope failures is observed (Figure 4d). In particular, considering the slopes with an aspect between 45° and 135°, it was found that 587 (34.5%) cases are identified. A high number of failures (294) was additionally reported on slopes with aspects ranging from 135° to 180°, while the lowest percentage of landslides (5.6%) was identified on areas oriented from 270° to 315°.

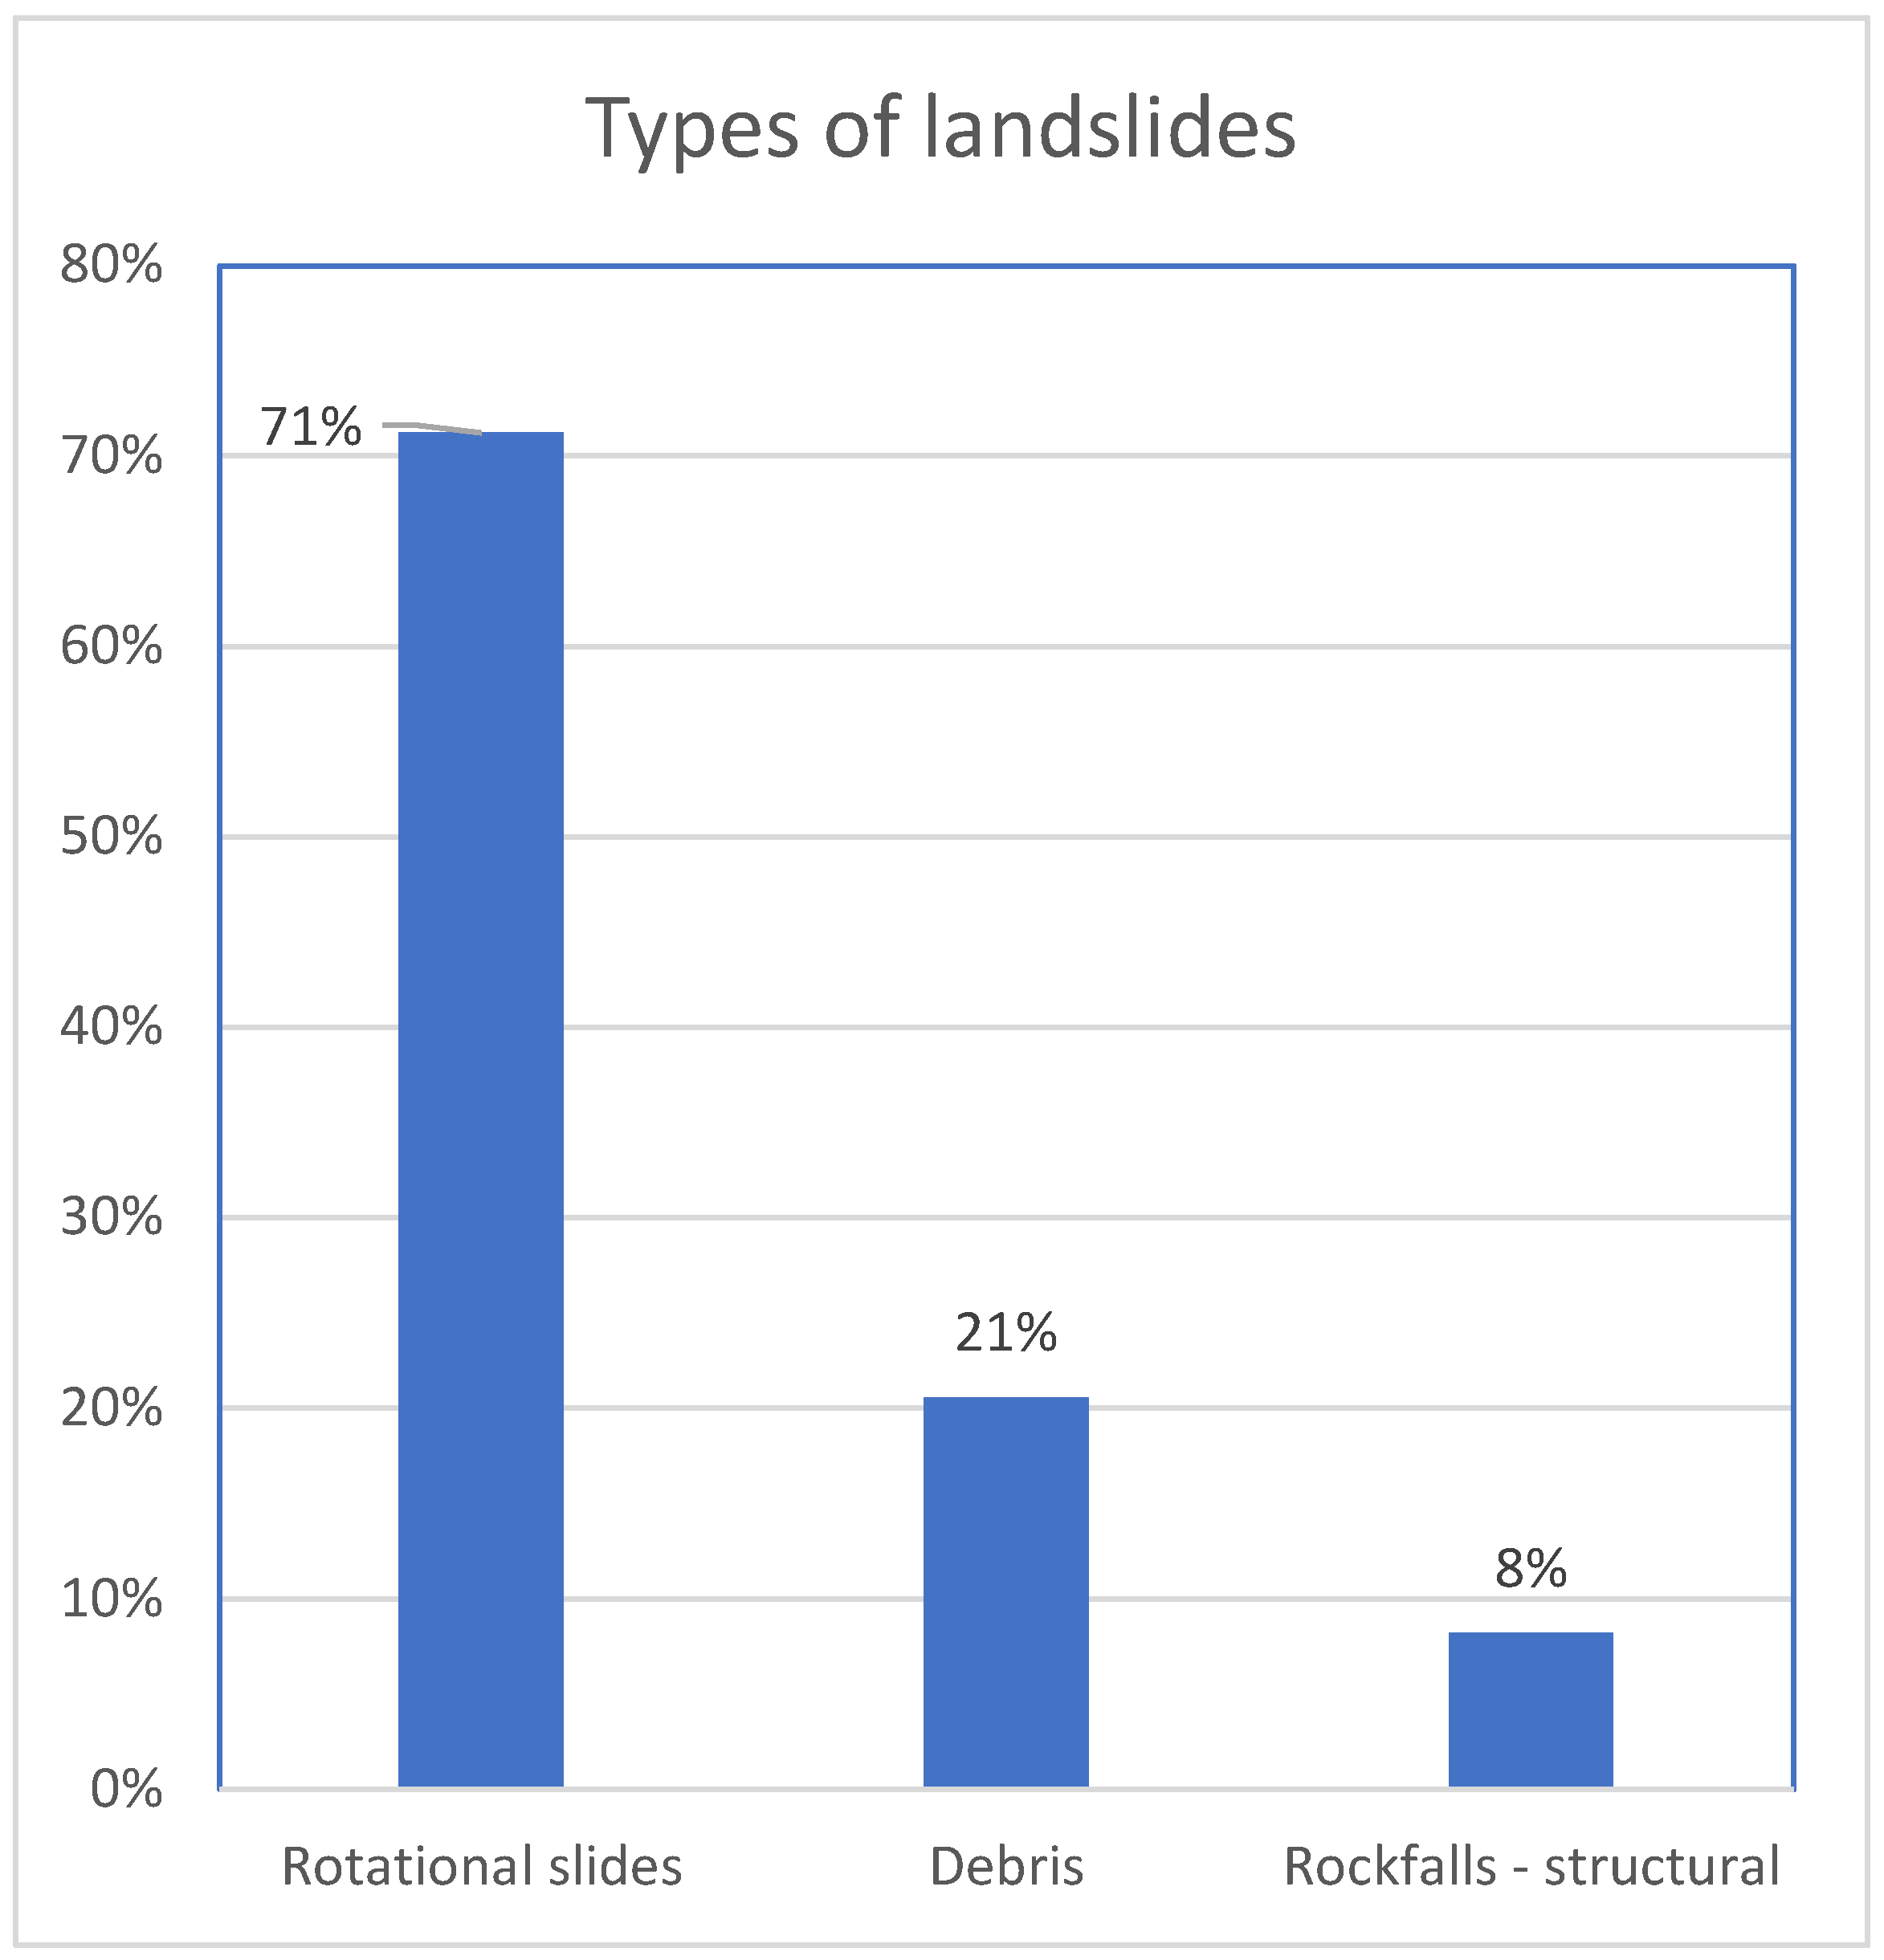
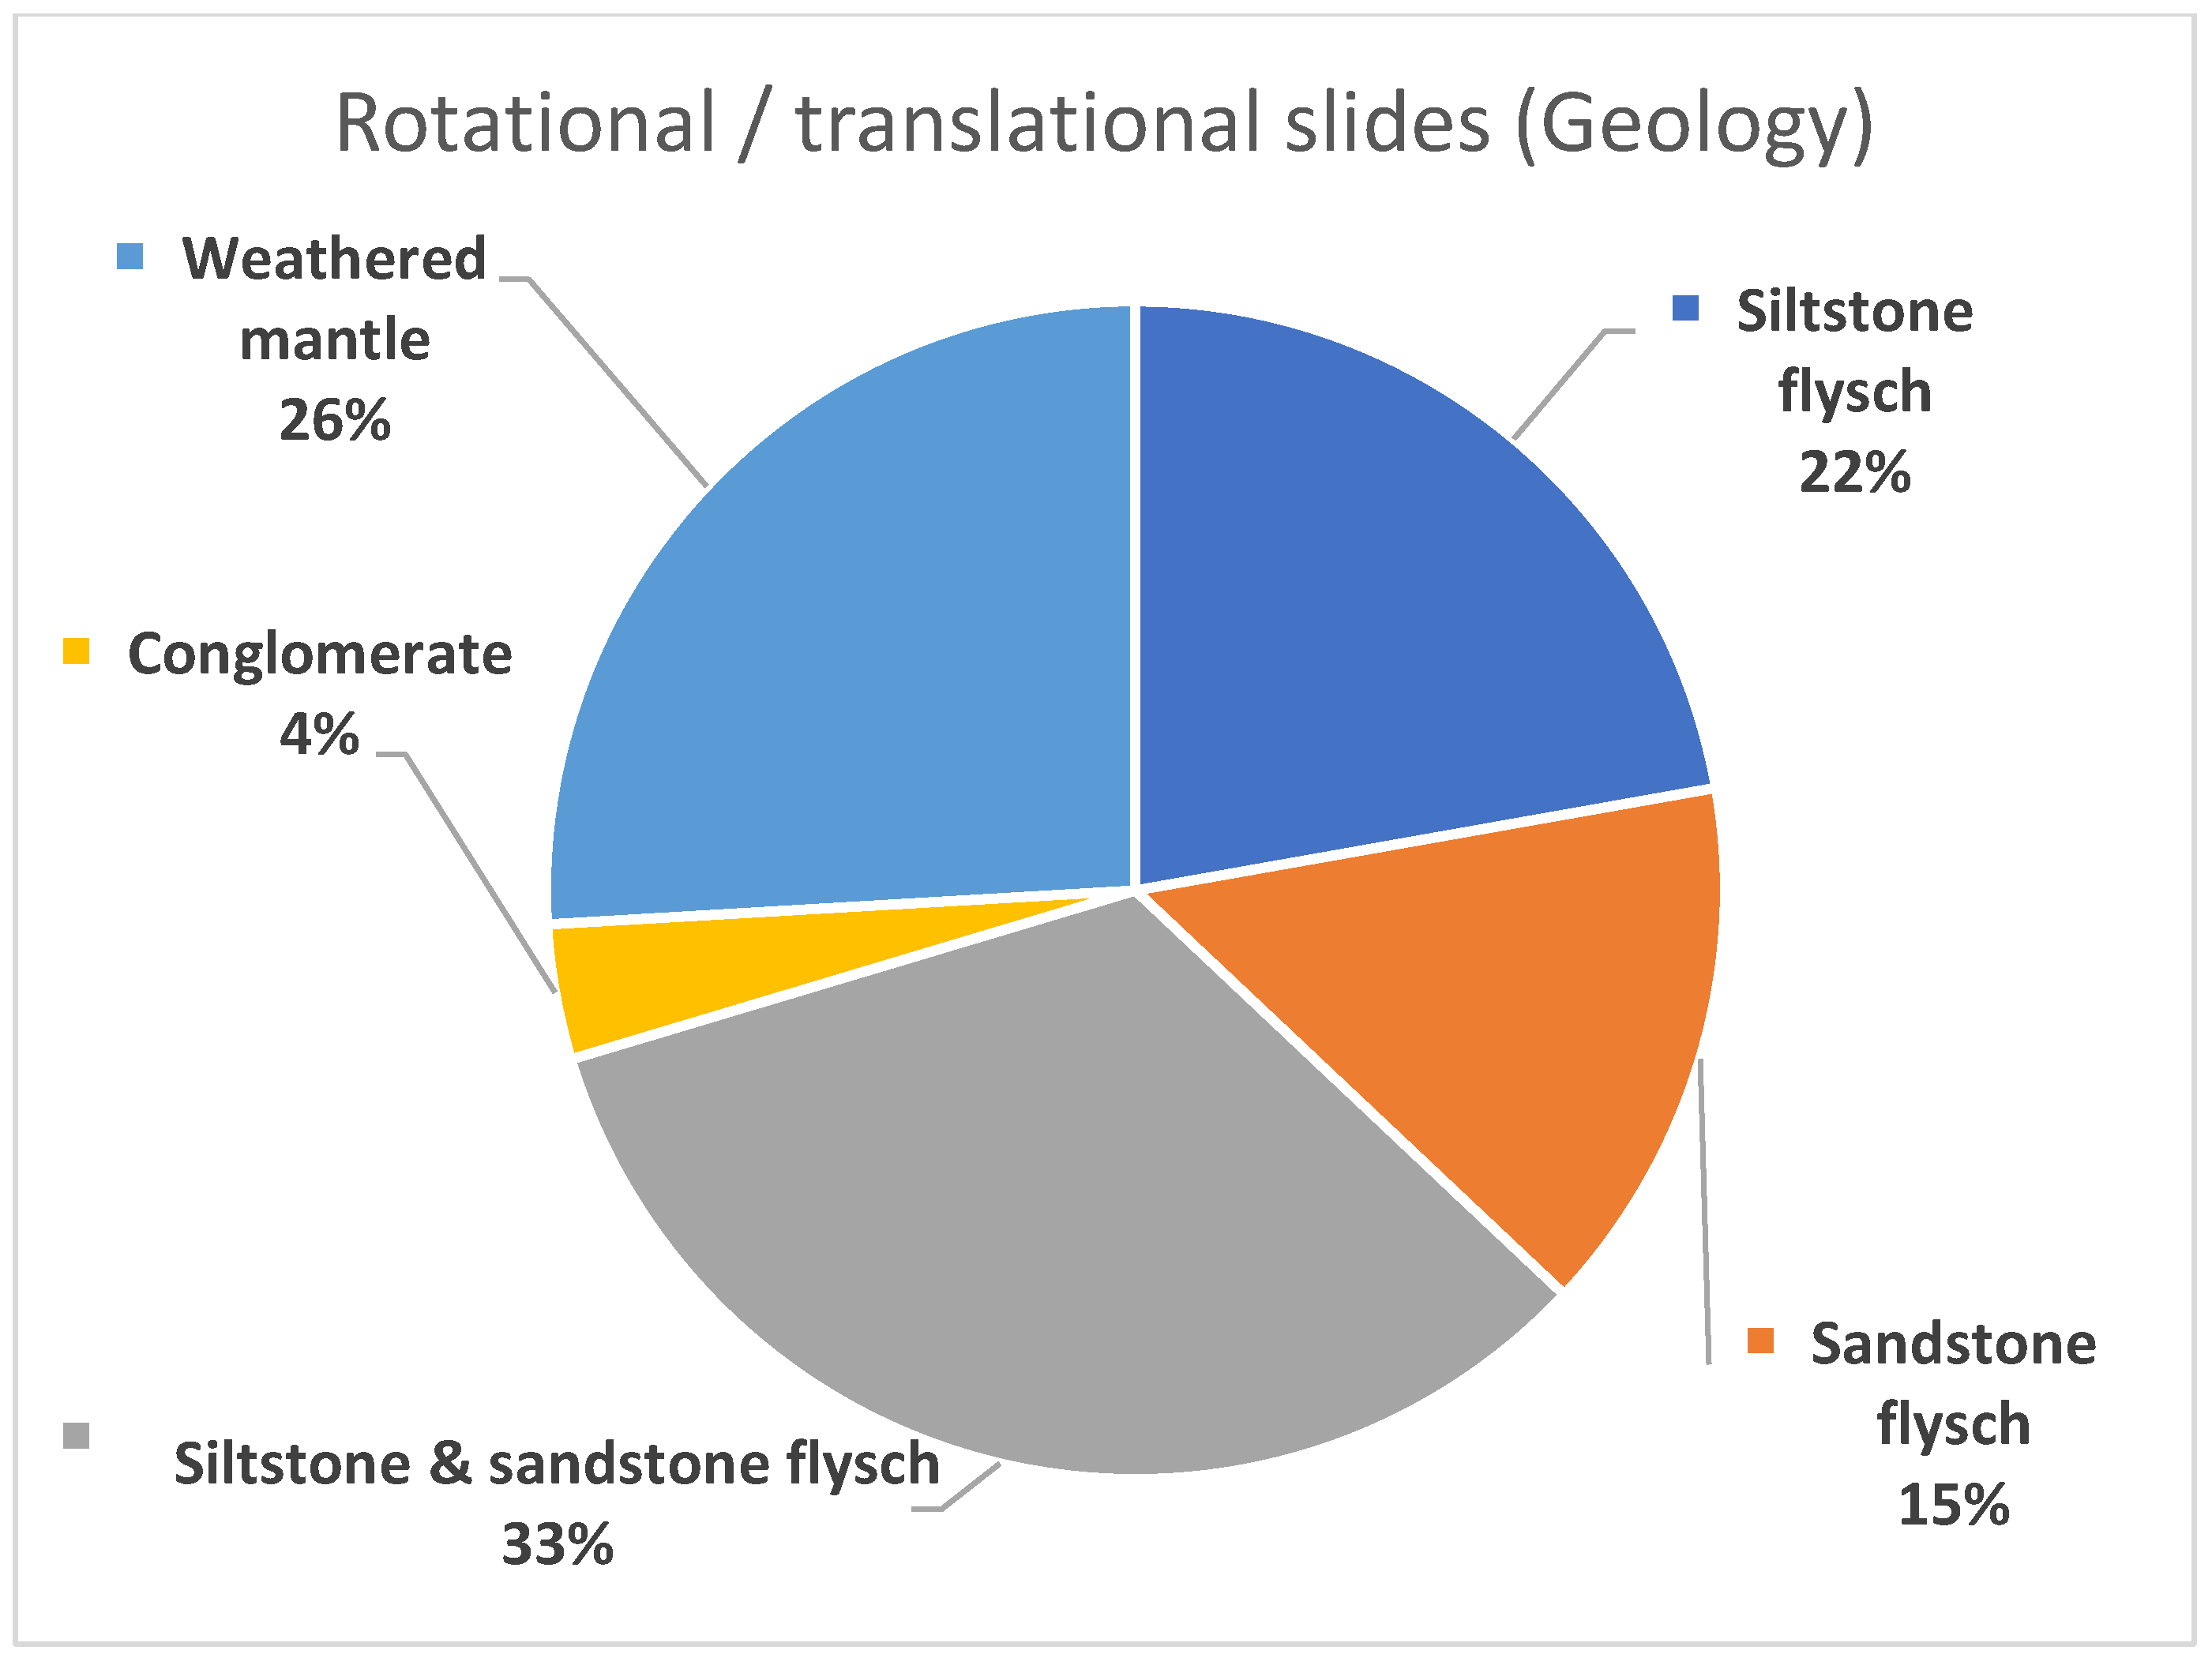
2.1.4. Types of Landslides and Induced Phenomena

Few days after the landfall and occurrence of Medicane Ianos, several teams of engineering geologists and engineers participated in field surveys aiming to map and document as many as possible slope failures, and validate the preliminary inventory produced based on remote sensing techniques [17]. This combination of desktop studies, remote sensing and field survey was also applied for documenting earthquake-induced secondary effects few kilometers to the east of the here study area, triggered by a seismic sequence, which occurred in March 2021 [33].
A total number of 73 landslides were documented during these field reconnaissance surveys in Karditsa Prefecture, which mainly caused partial or total damage to the roads and in some cases caused failures of riverbanks. This remote area is characterized by a combination of weak sedimentary sequences, high elevation deviations and steep slopes, as described in the previous section. The majority of remotely mapped landslides were found away from the local road network or in inaccessible areas, and thus the relative small number of field-surveyed landslides.
The documented landslides were mostly found in flysch formations, validating the outcome of the remote sensing approach, as it was earlier presented. Following the information obtained by these surveys, the failure mechanisms are strongly related to the heterogeneity degree of the flysch formation (siltstone-sandstone participation), the intensity of tectonic disturbance and the weathering degree.
In particular, the main types of landslides that were detected were:
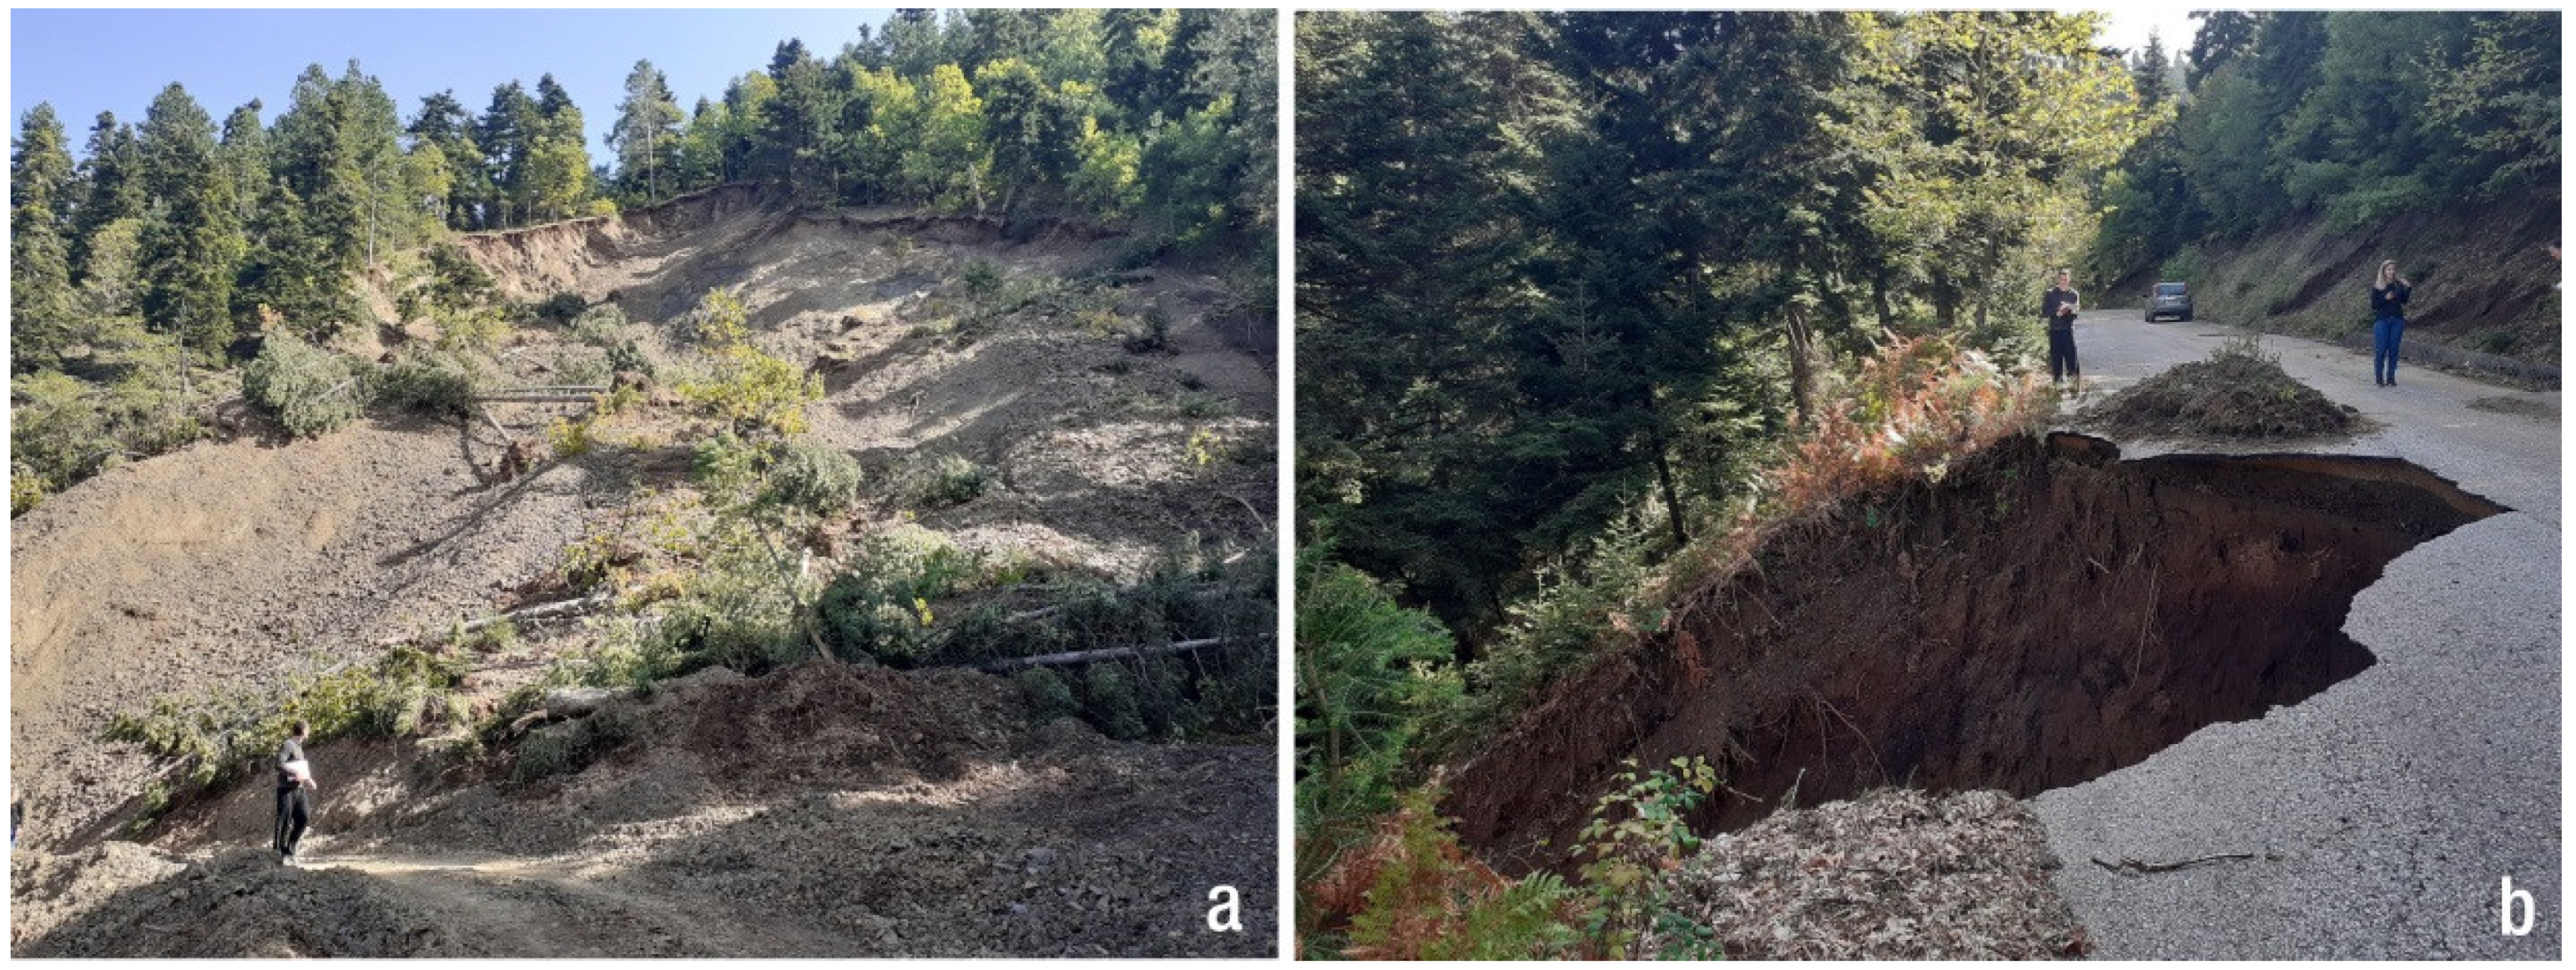
  • Rotational and translational landslides formed mainly in siltstone flysch and siltstone and sandstone flysch in alternations. Those landslides are characterized by a complex geometry with their lower part frequently consisting of a slump that follows the geometry of a stronger underlying bed. In many cases, the accumulated material covered the road without resulting in a complete failure.
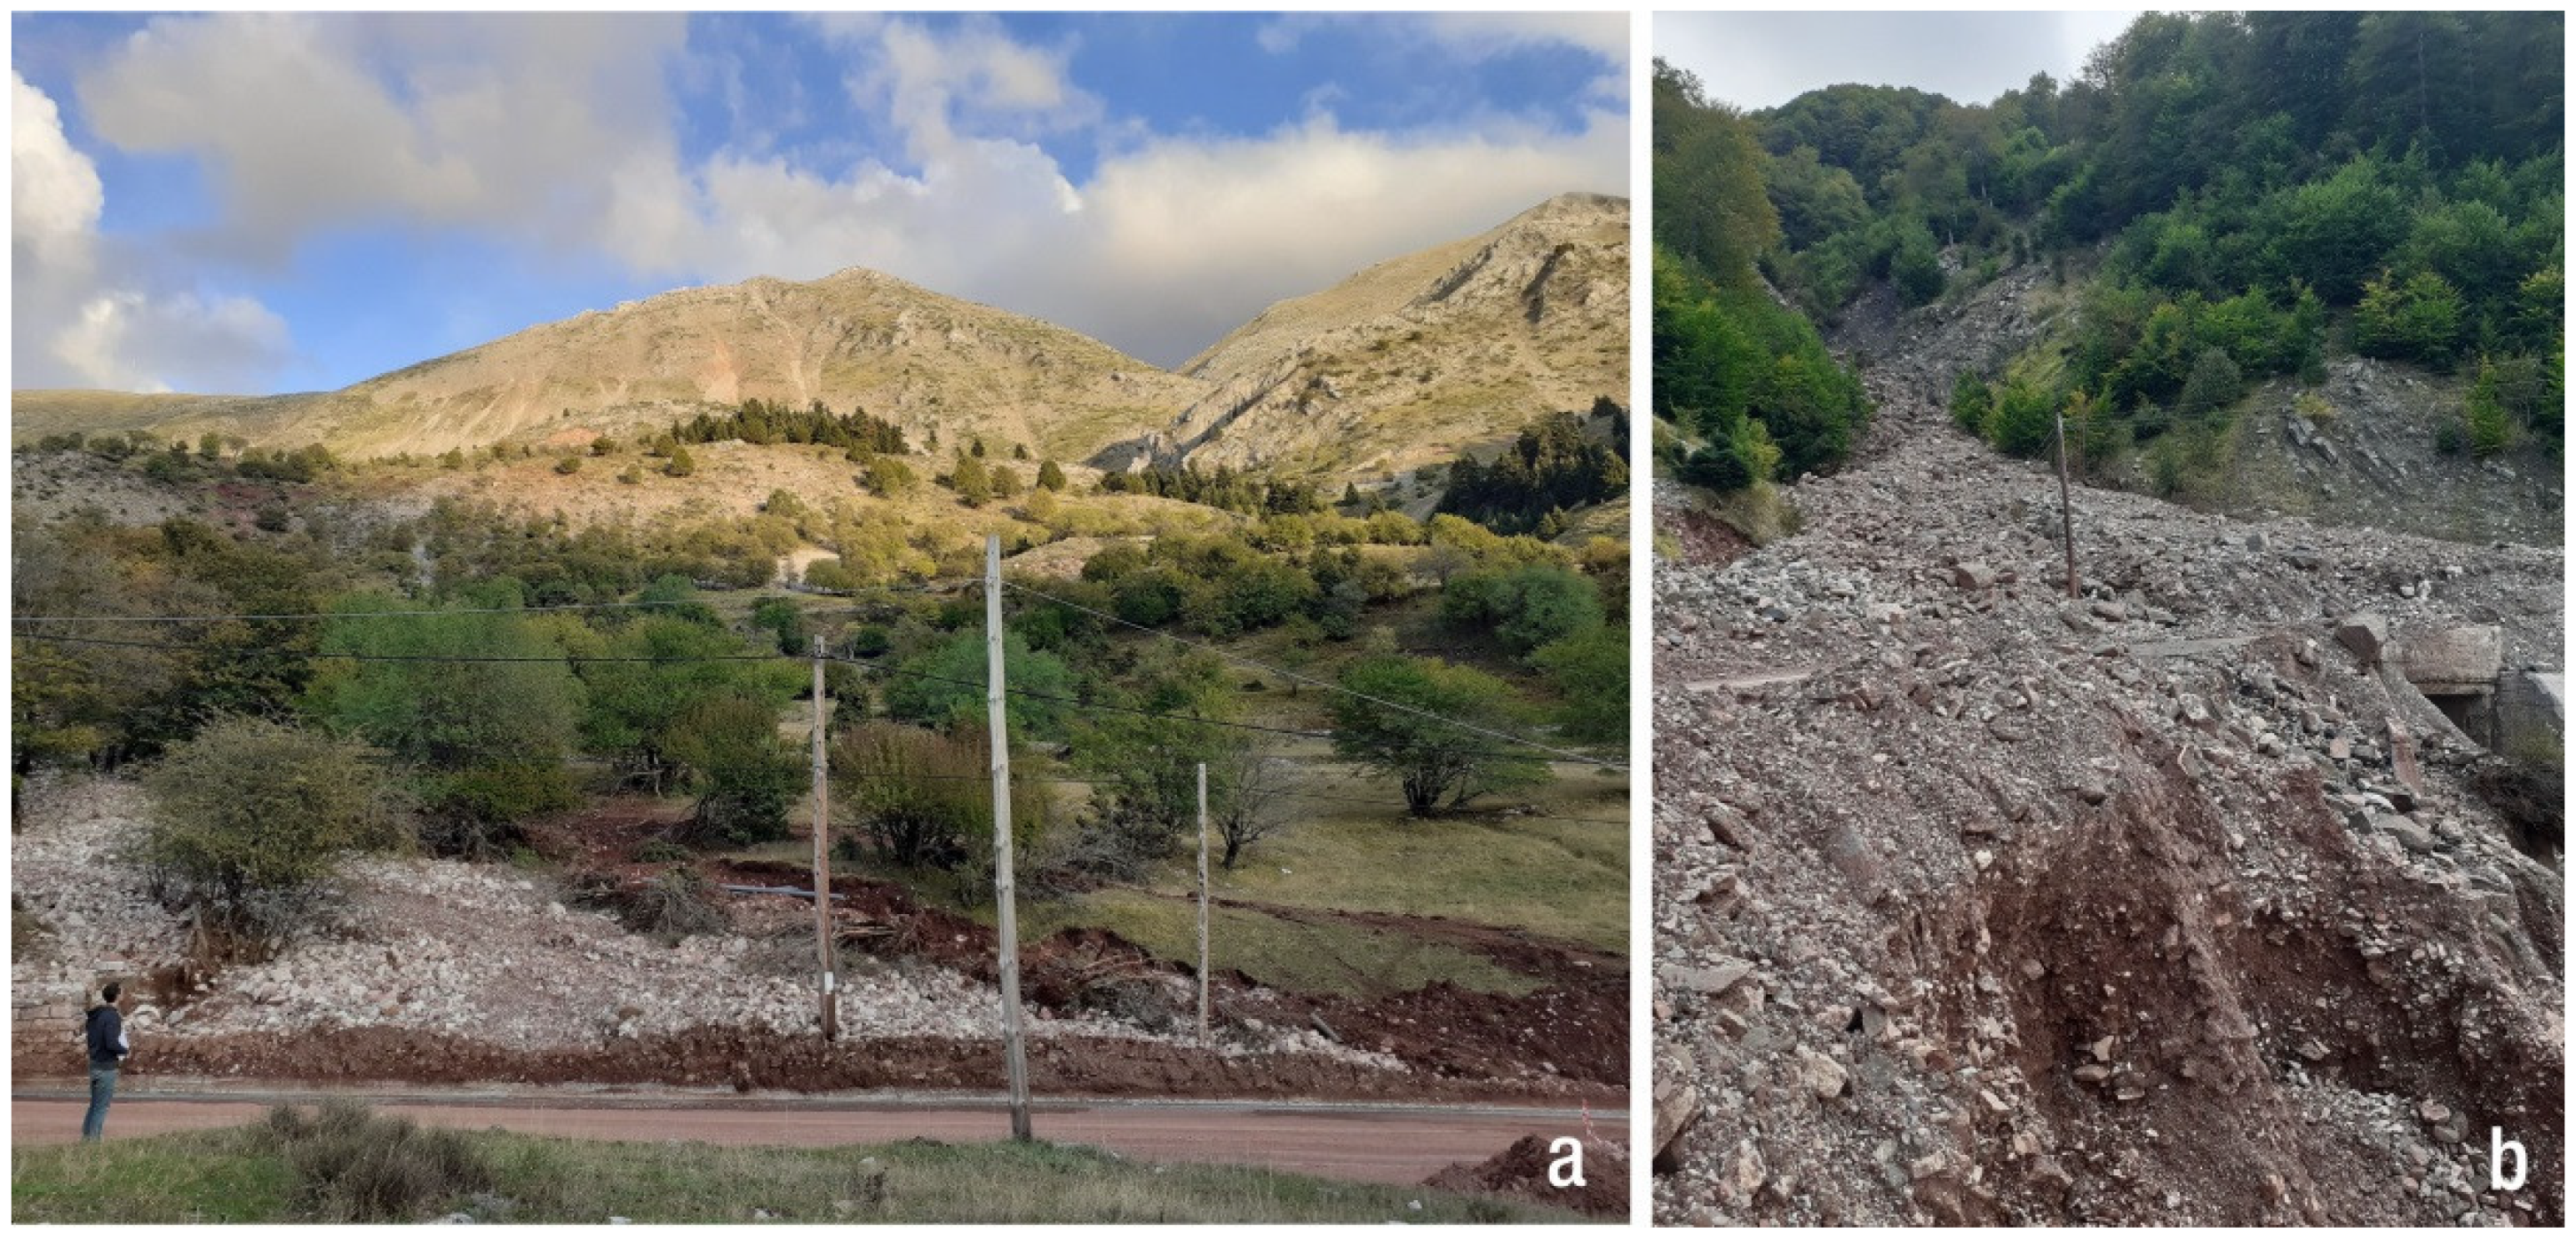
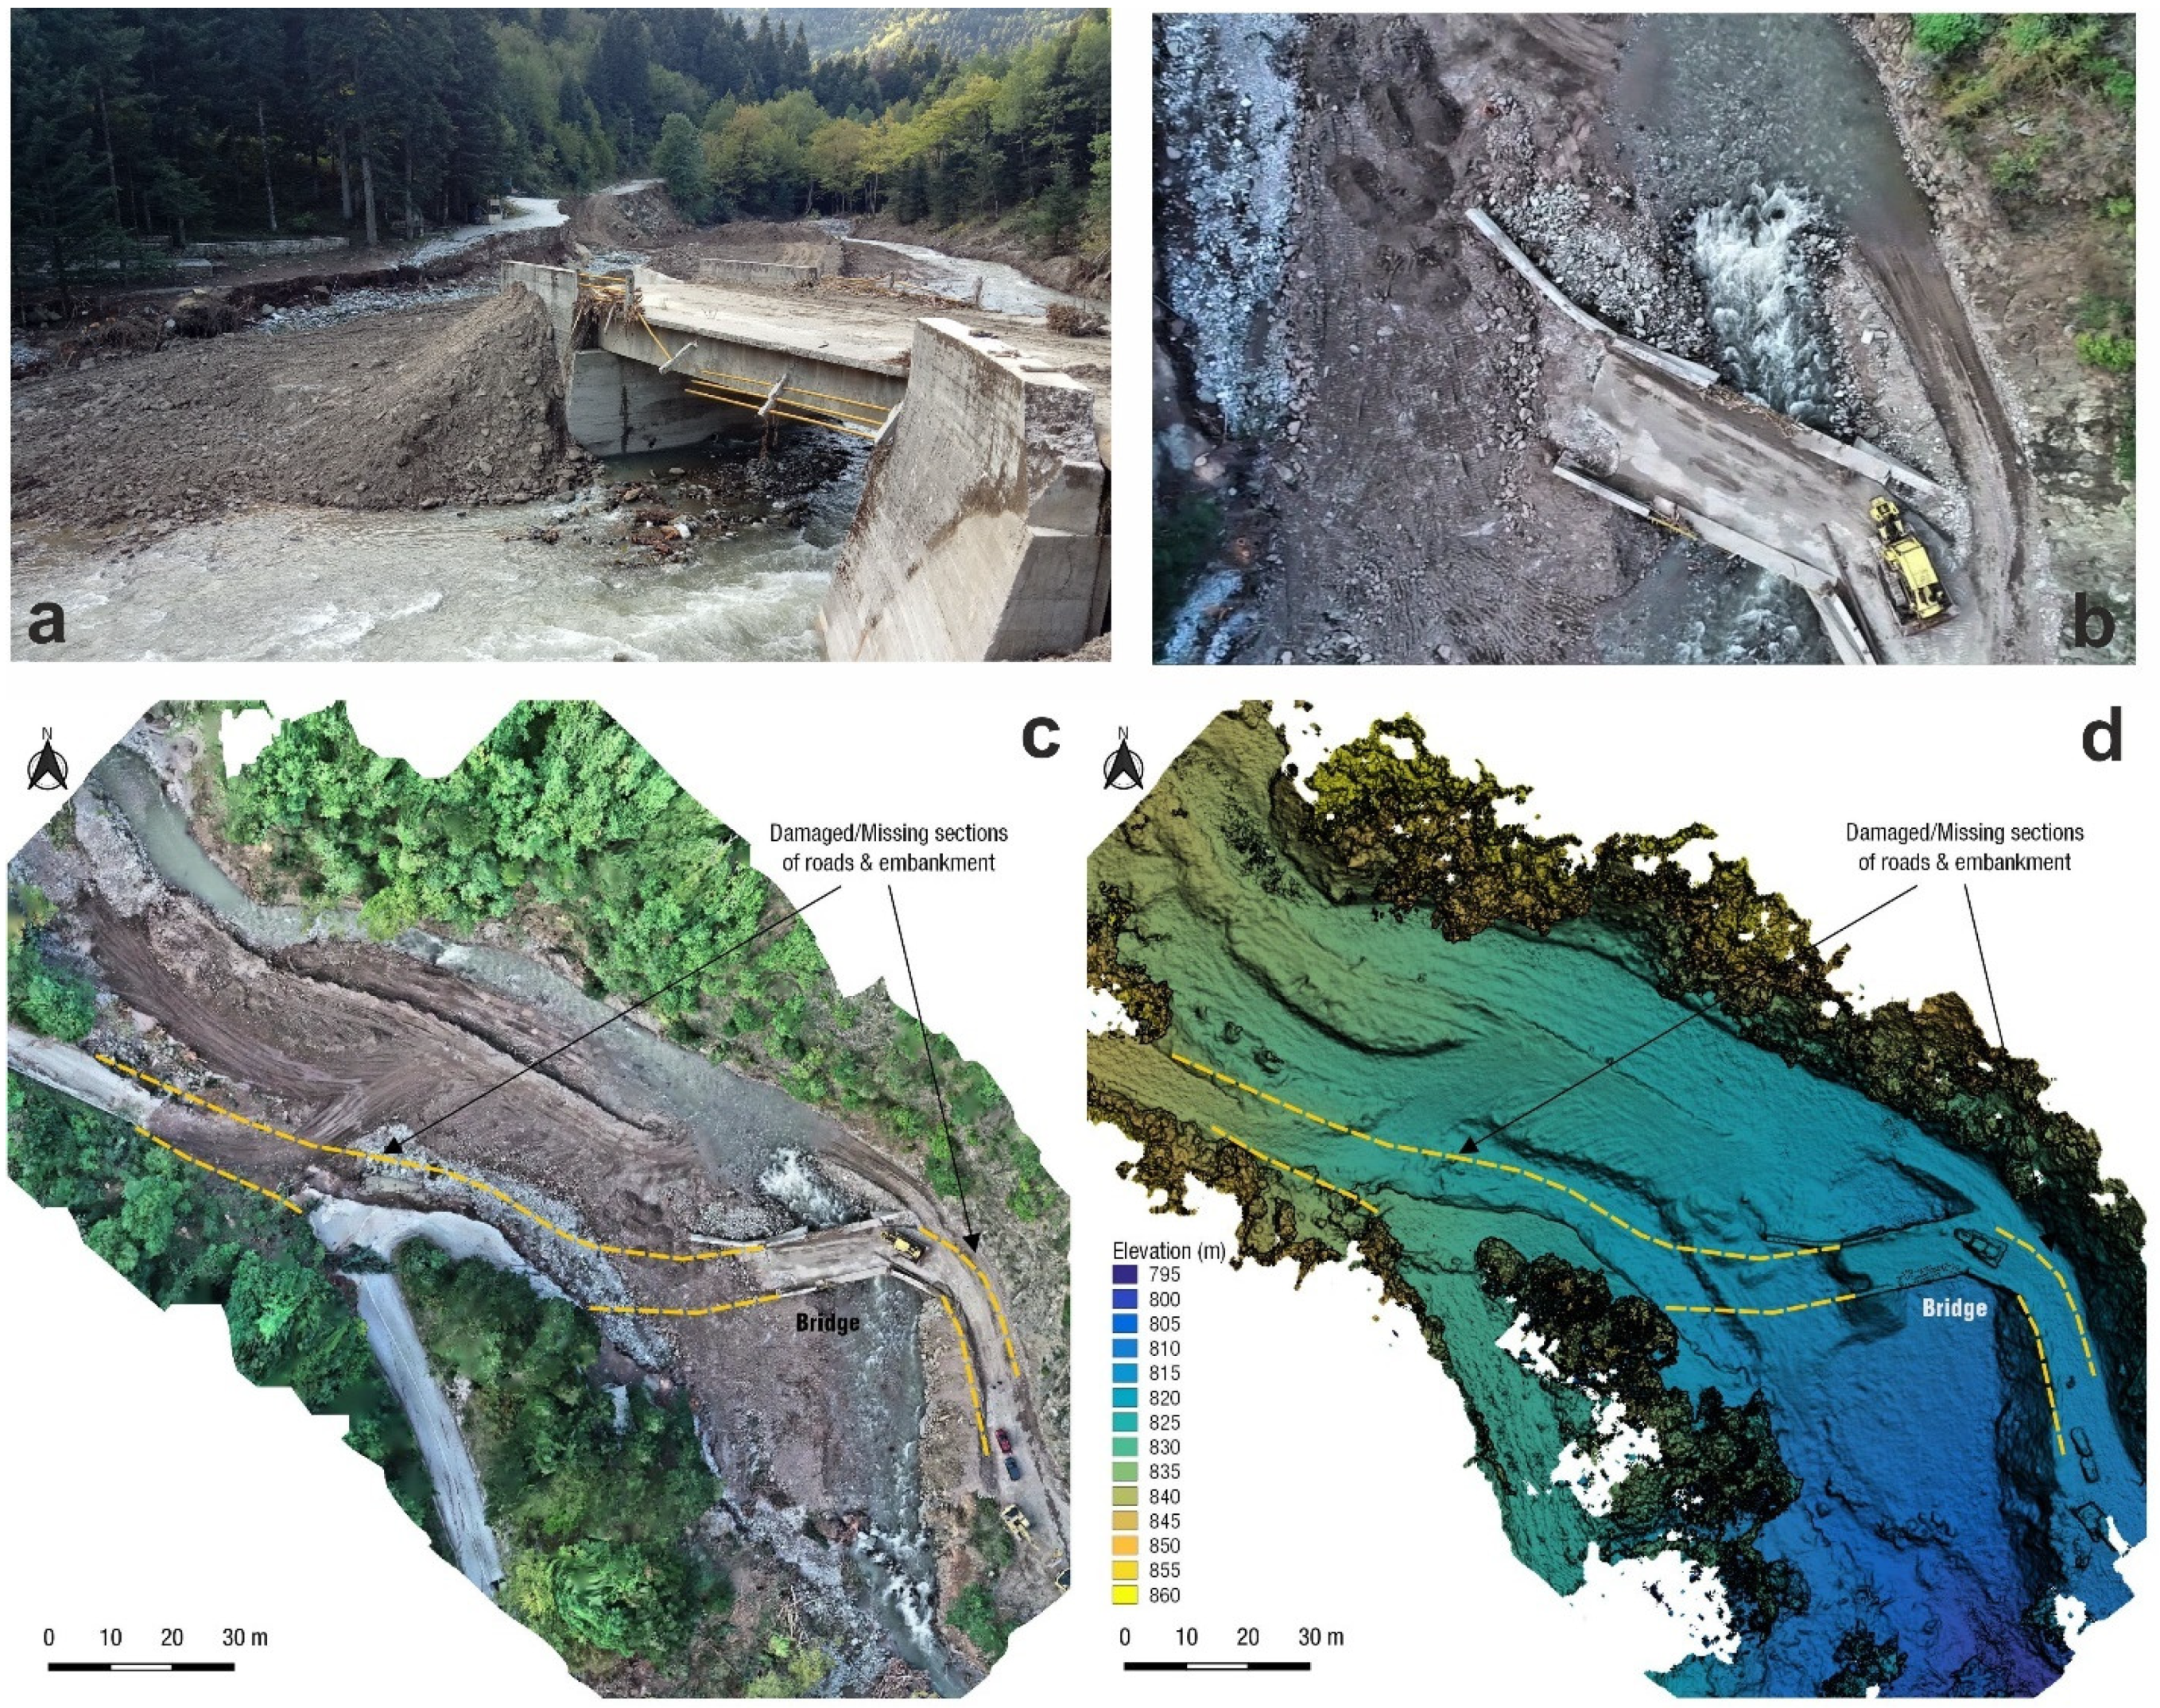
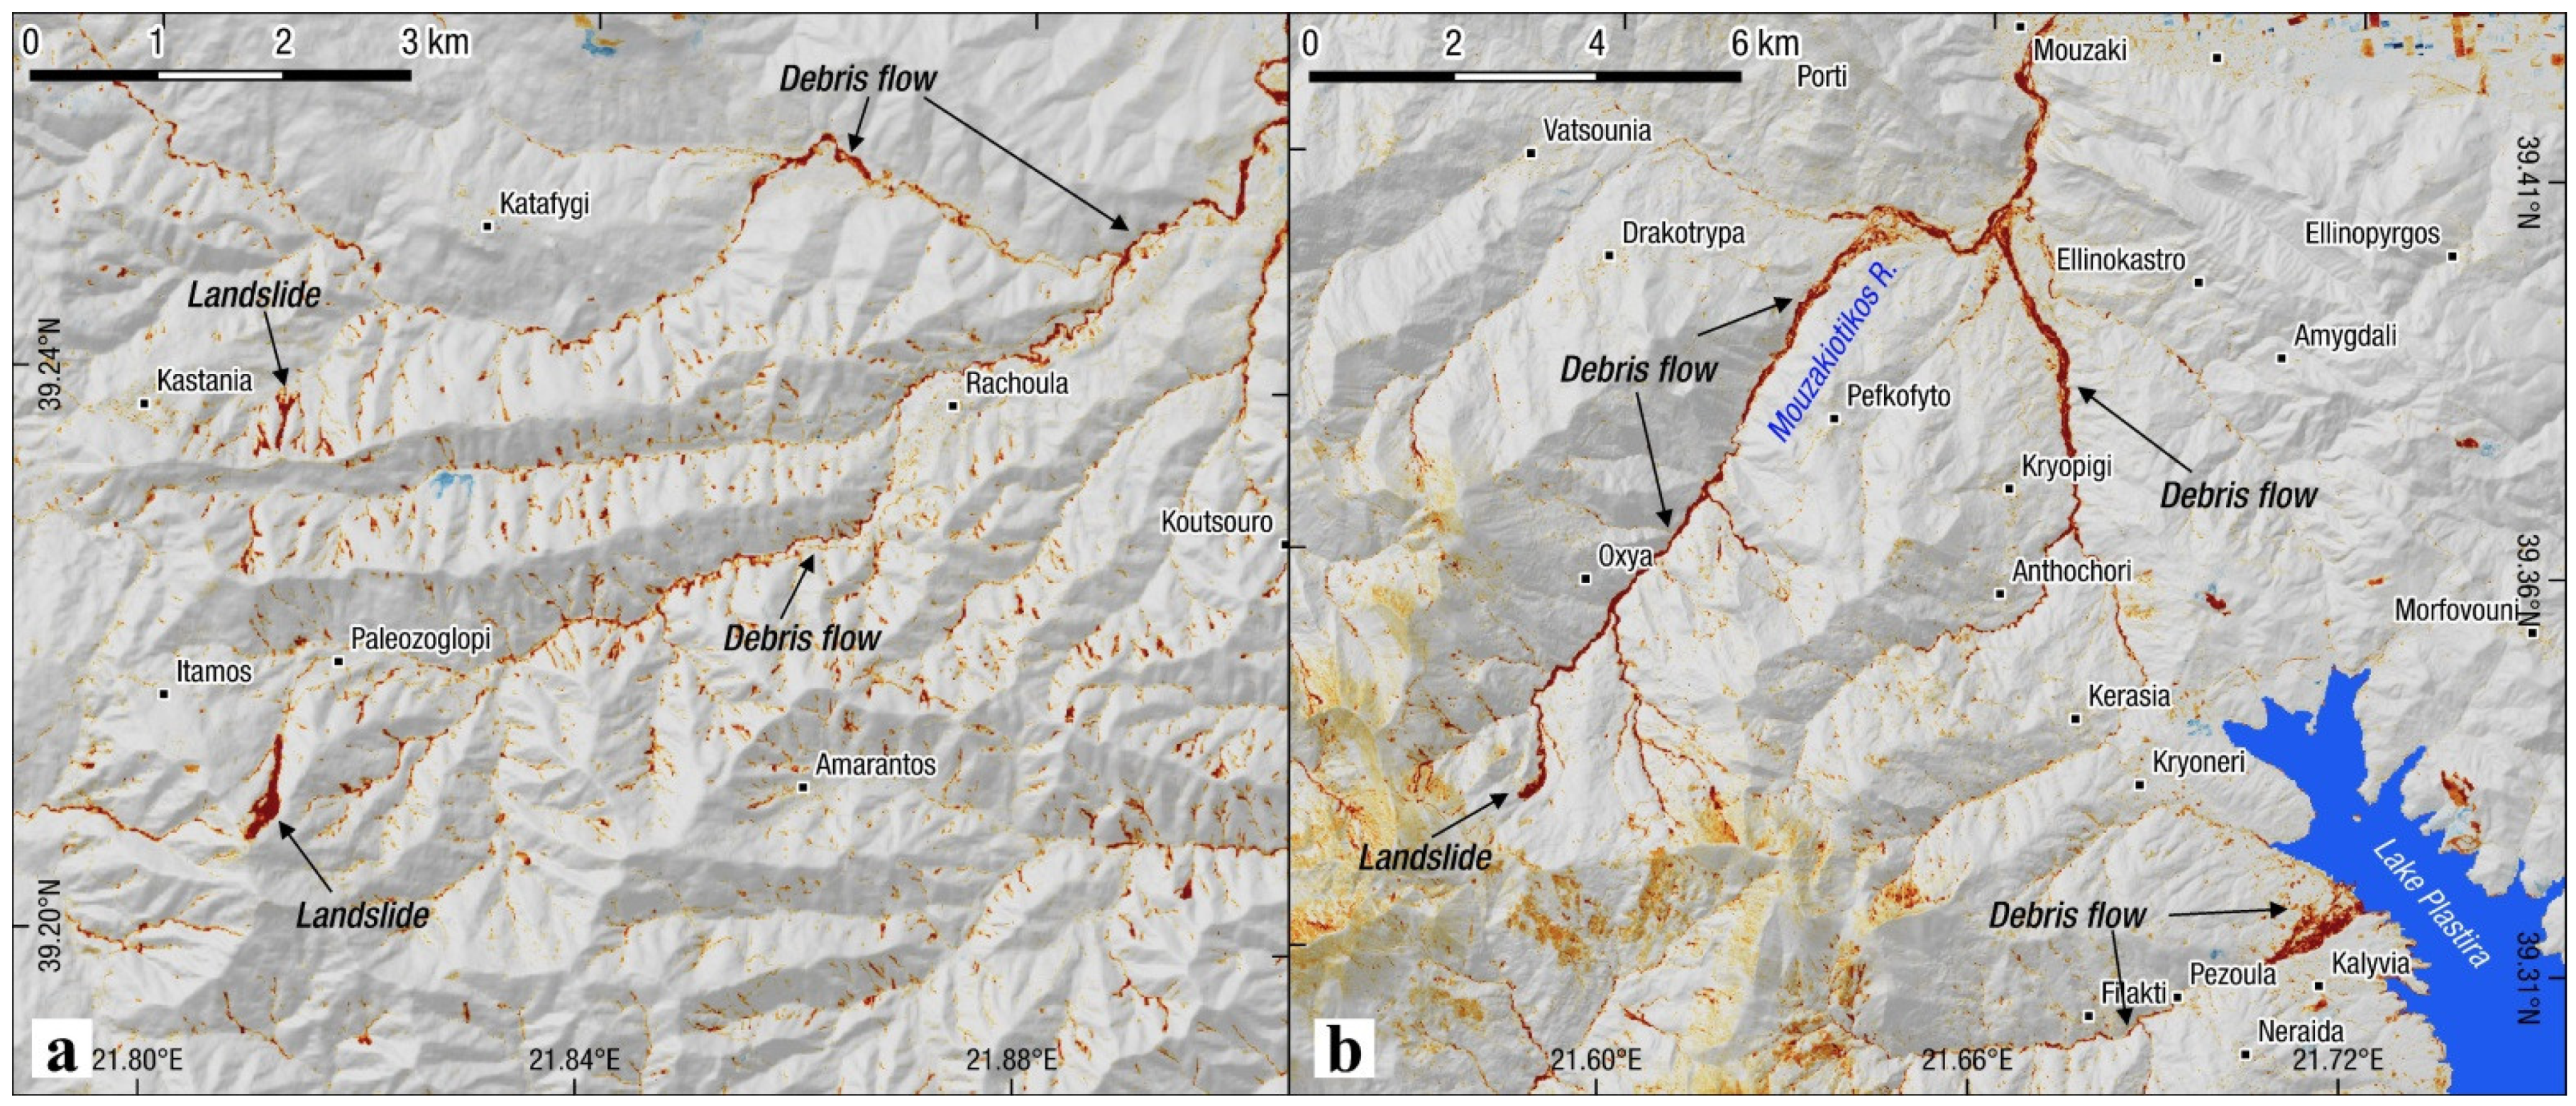
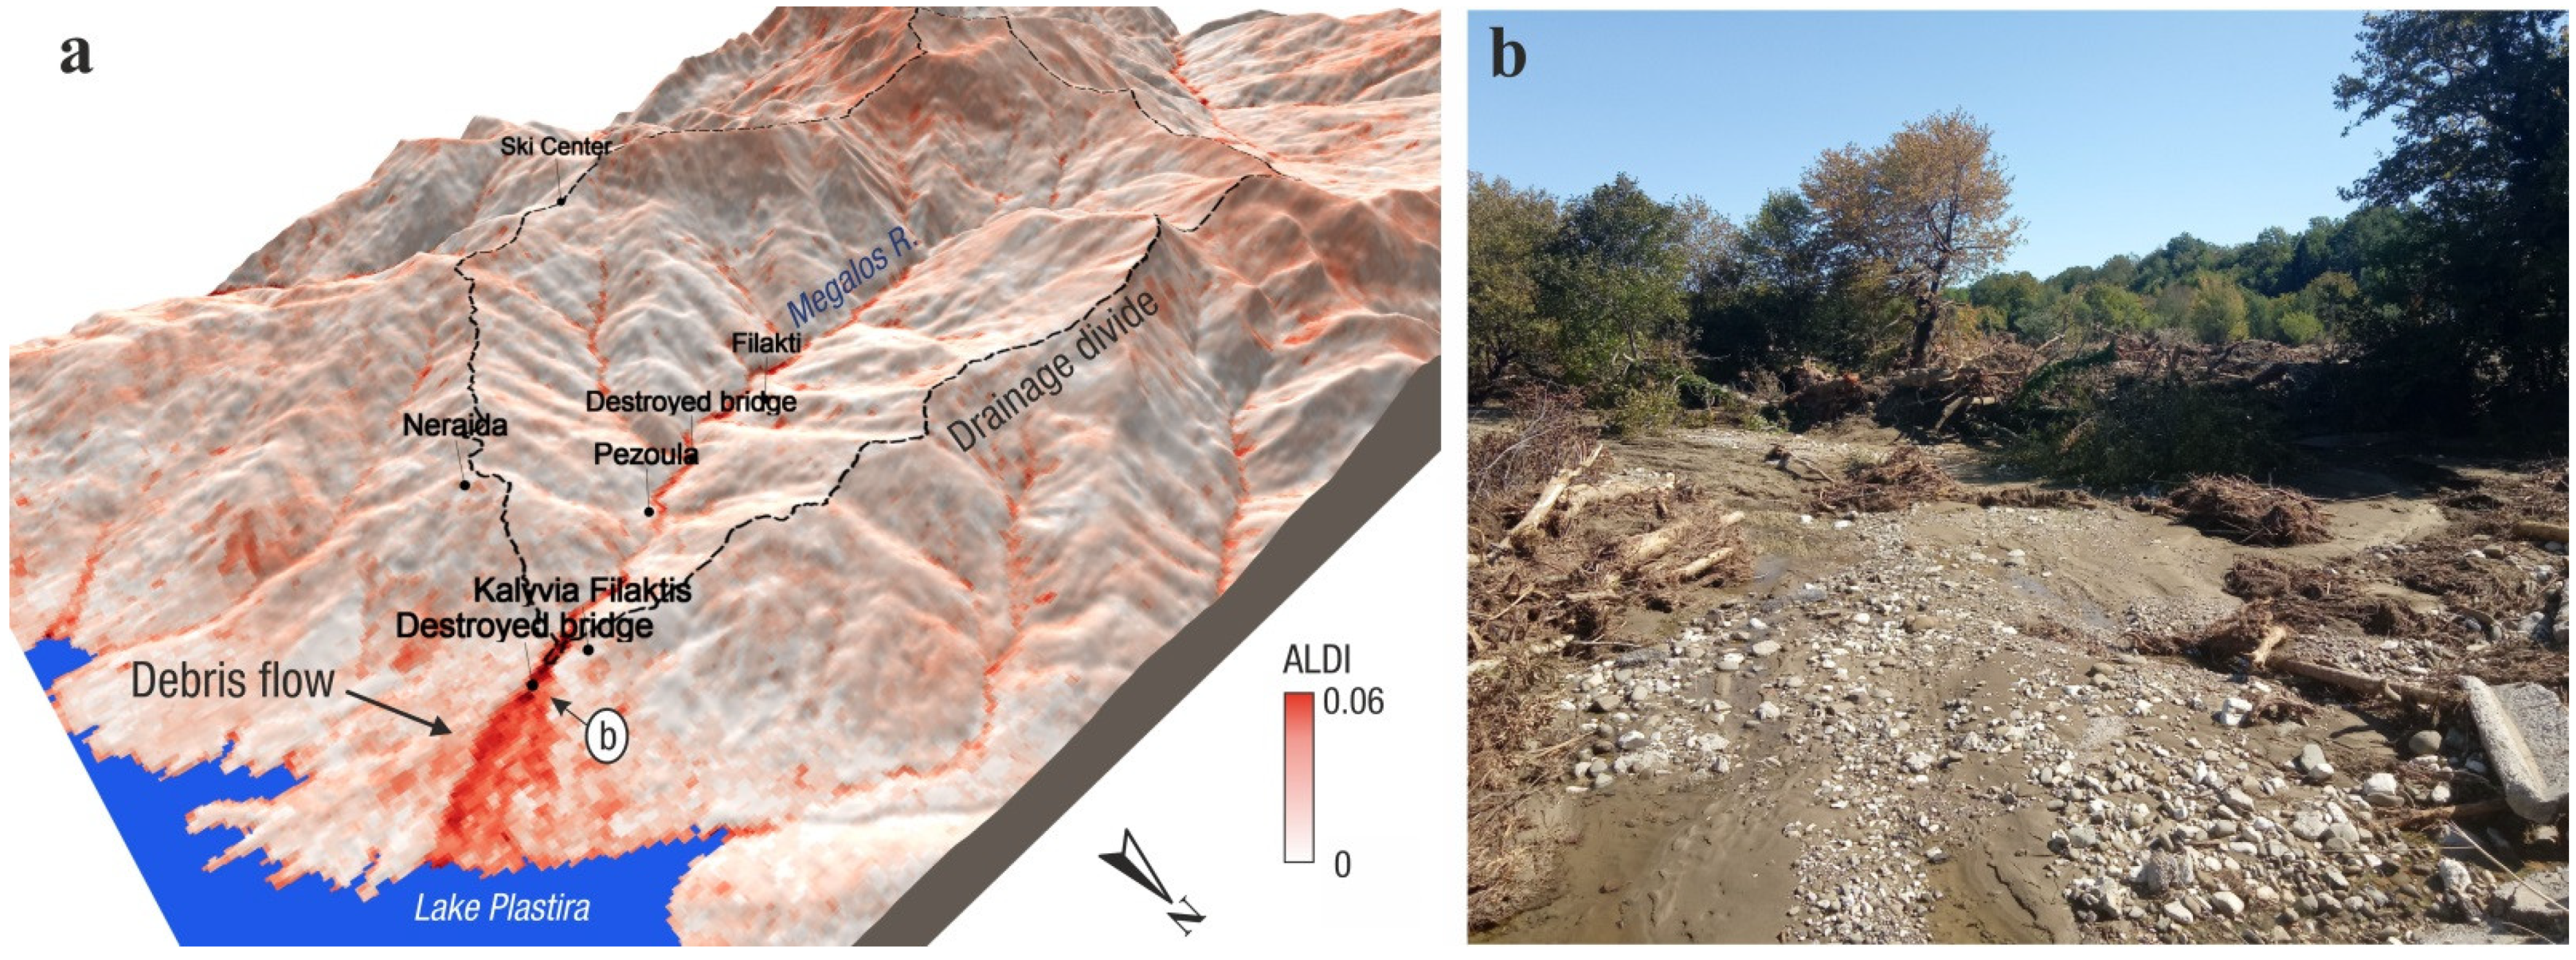
  • Debris flows in fractured limestones, scree, sandstone/conglomerate flysch. These were encountered in areas with steep morphology with deep gullies where mass transport of rock pieces and boulders was favored. These failures, i.e., debris flows, heavily impacted the road network and some villages located at higher elevations.
  • Rockfalls and structural failures (planar and wedges) mainly in limestone formations. Structurally controlled slides were recorded, under favorable kinematic conditions of the persistent bedding planes and their low shear strength due to the clayey nature. Such slides and rock falls were not very large in volume (few m3) but resulted in road closure and in some cases minor to moderate structural failures.
Based on the information obtained, the majority of landslides are classified as rotational (Figure 5 and Figure 6), causing the most severe damage to the human-made environment in the wider investigated area. As it has been previously mentioned, these slides occurred mainly in the weathered flysch mantle and the siltstone flysch formation, due to their overall low rock mass strength.
Regarding the rotational landslides, most of them had a depth ranging between 10 and 15 m while a significant portion of failures was relatively shallow (<5 m). Their width ranges between 20 to 80 m, while the smaller slides have a width between 5 and 20 m. The width of the largest landslides was up to 200 m. Debris flows in most cases affected road sections with limited width, between 10 and 20 m, except a few cases where the affected width is almost 300 m.
The most severe landslide-induced failures in Karditsa Prefecture were around Amarantos village, located to the south-east of Plastira lake. In Figure 7a, a landslide that occurred in siltstone flysch causing the road failure is shown. In particular, the road was totally covered by slipped material across a length of 200 m, while its depth was estimated at about 15 m. Its height is approximately 70 m. The slide failure plane was probably constrained by the presence of a deeper stronger flysch layer downslope. In Figure 7b, a rotational slide in the weathered mantle of siltstone flysch is also shown. This landslide resulted in the collapse of the road pavement for a length of 10 m.
Extensive debris flows were mapped in Livadia and between the communities of Pefkofito and Vlassi (Figure 8). Specifically, the thickness of the debris at the road level is 5 m while the impacted area is 300 m long in the former case. The debris flow material mainly consisted of limestone fragments and clay materials (Figure 8a).
Regarding the second case, located in the area between Pefkofito and Vlassi (Figure 8b), it should be pointed out that this area is characterized by steep morphology while the extensive amounts of debris have been transported via deep gullies from higher elevations.
Moreover, the erosion and flooding of the Karitsiotis River damaged and blocked the road crossing south of Belokomiti village, Plastira Lake, as shown in Figure 9. Although the bridge itself did not collapse, road embankments on both sides were partially or completely washed out. The intersection of the roads west of the bridge was the most damaged part, blocking road traffic towards communities to the south and west of Lake Plastira. Riverbank erosion also caused several slope failures, while the flooding of the river caused slope undercutting that resulted in road failures (Figure 9).

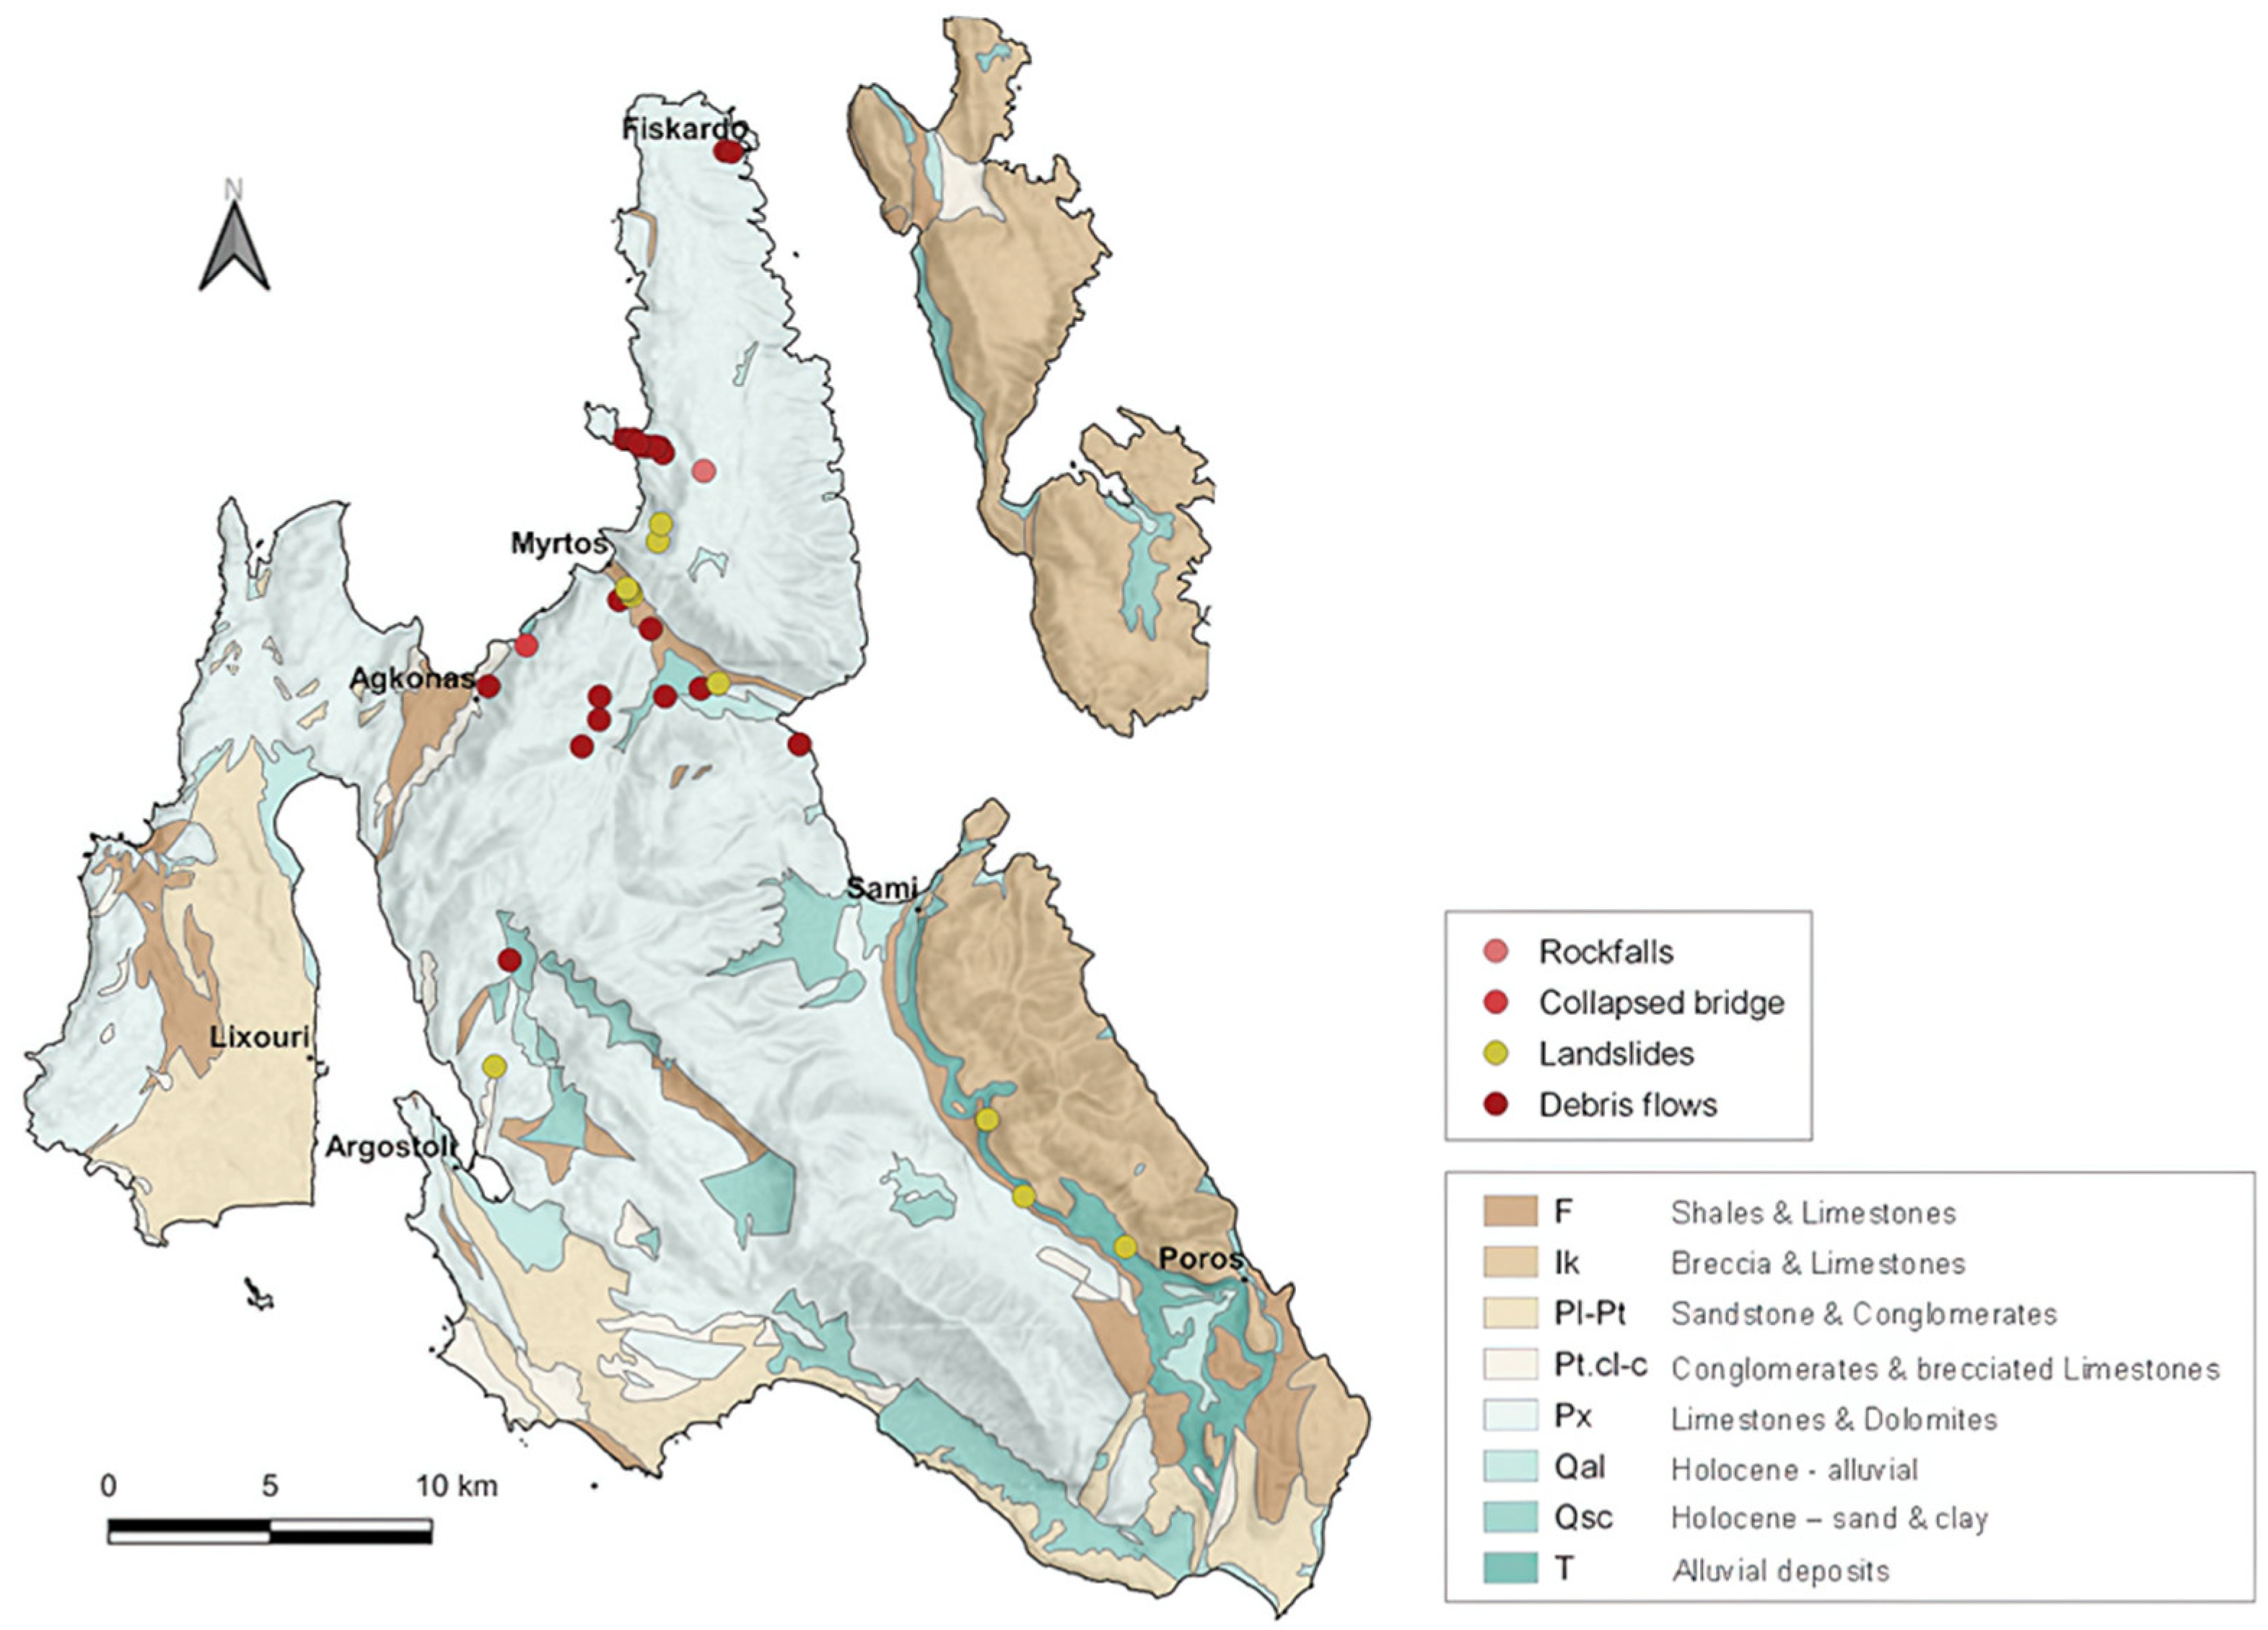
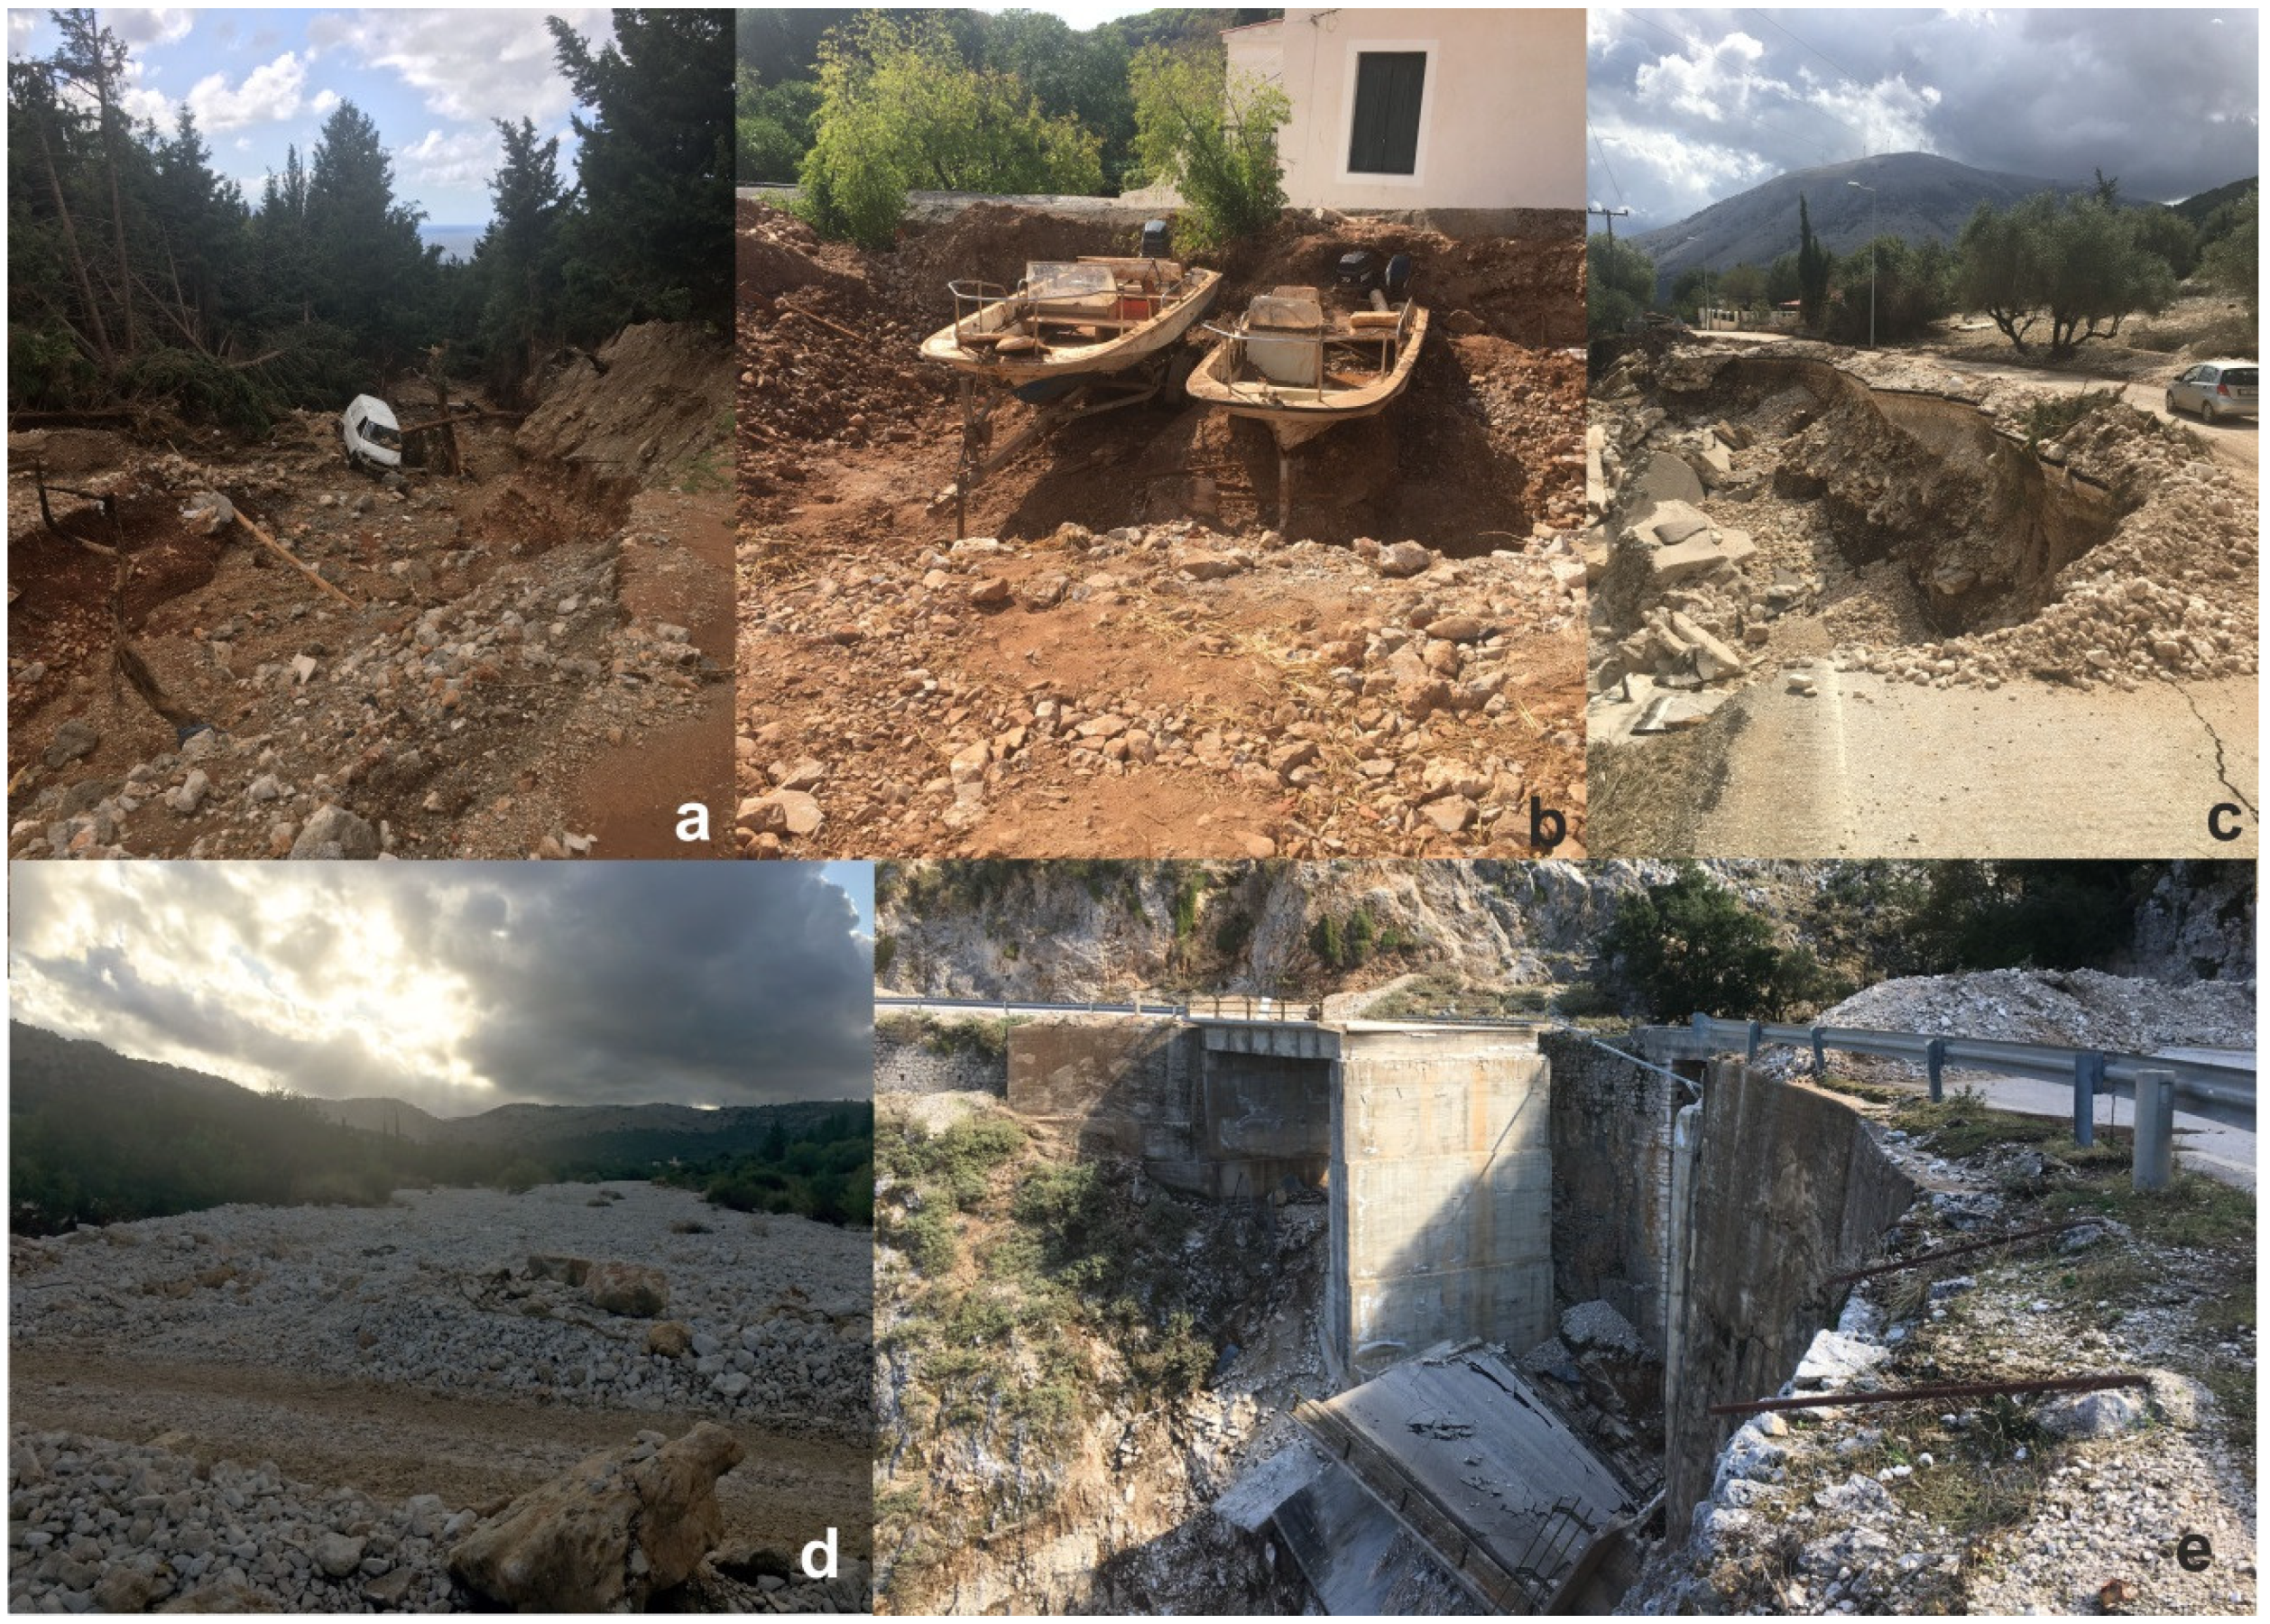
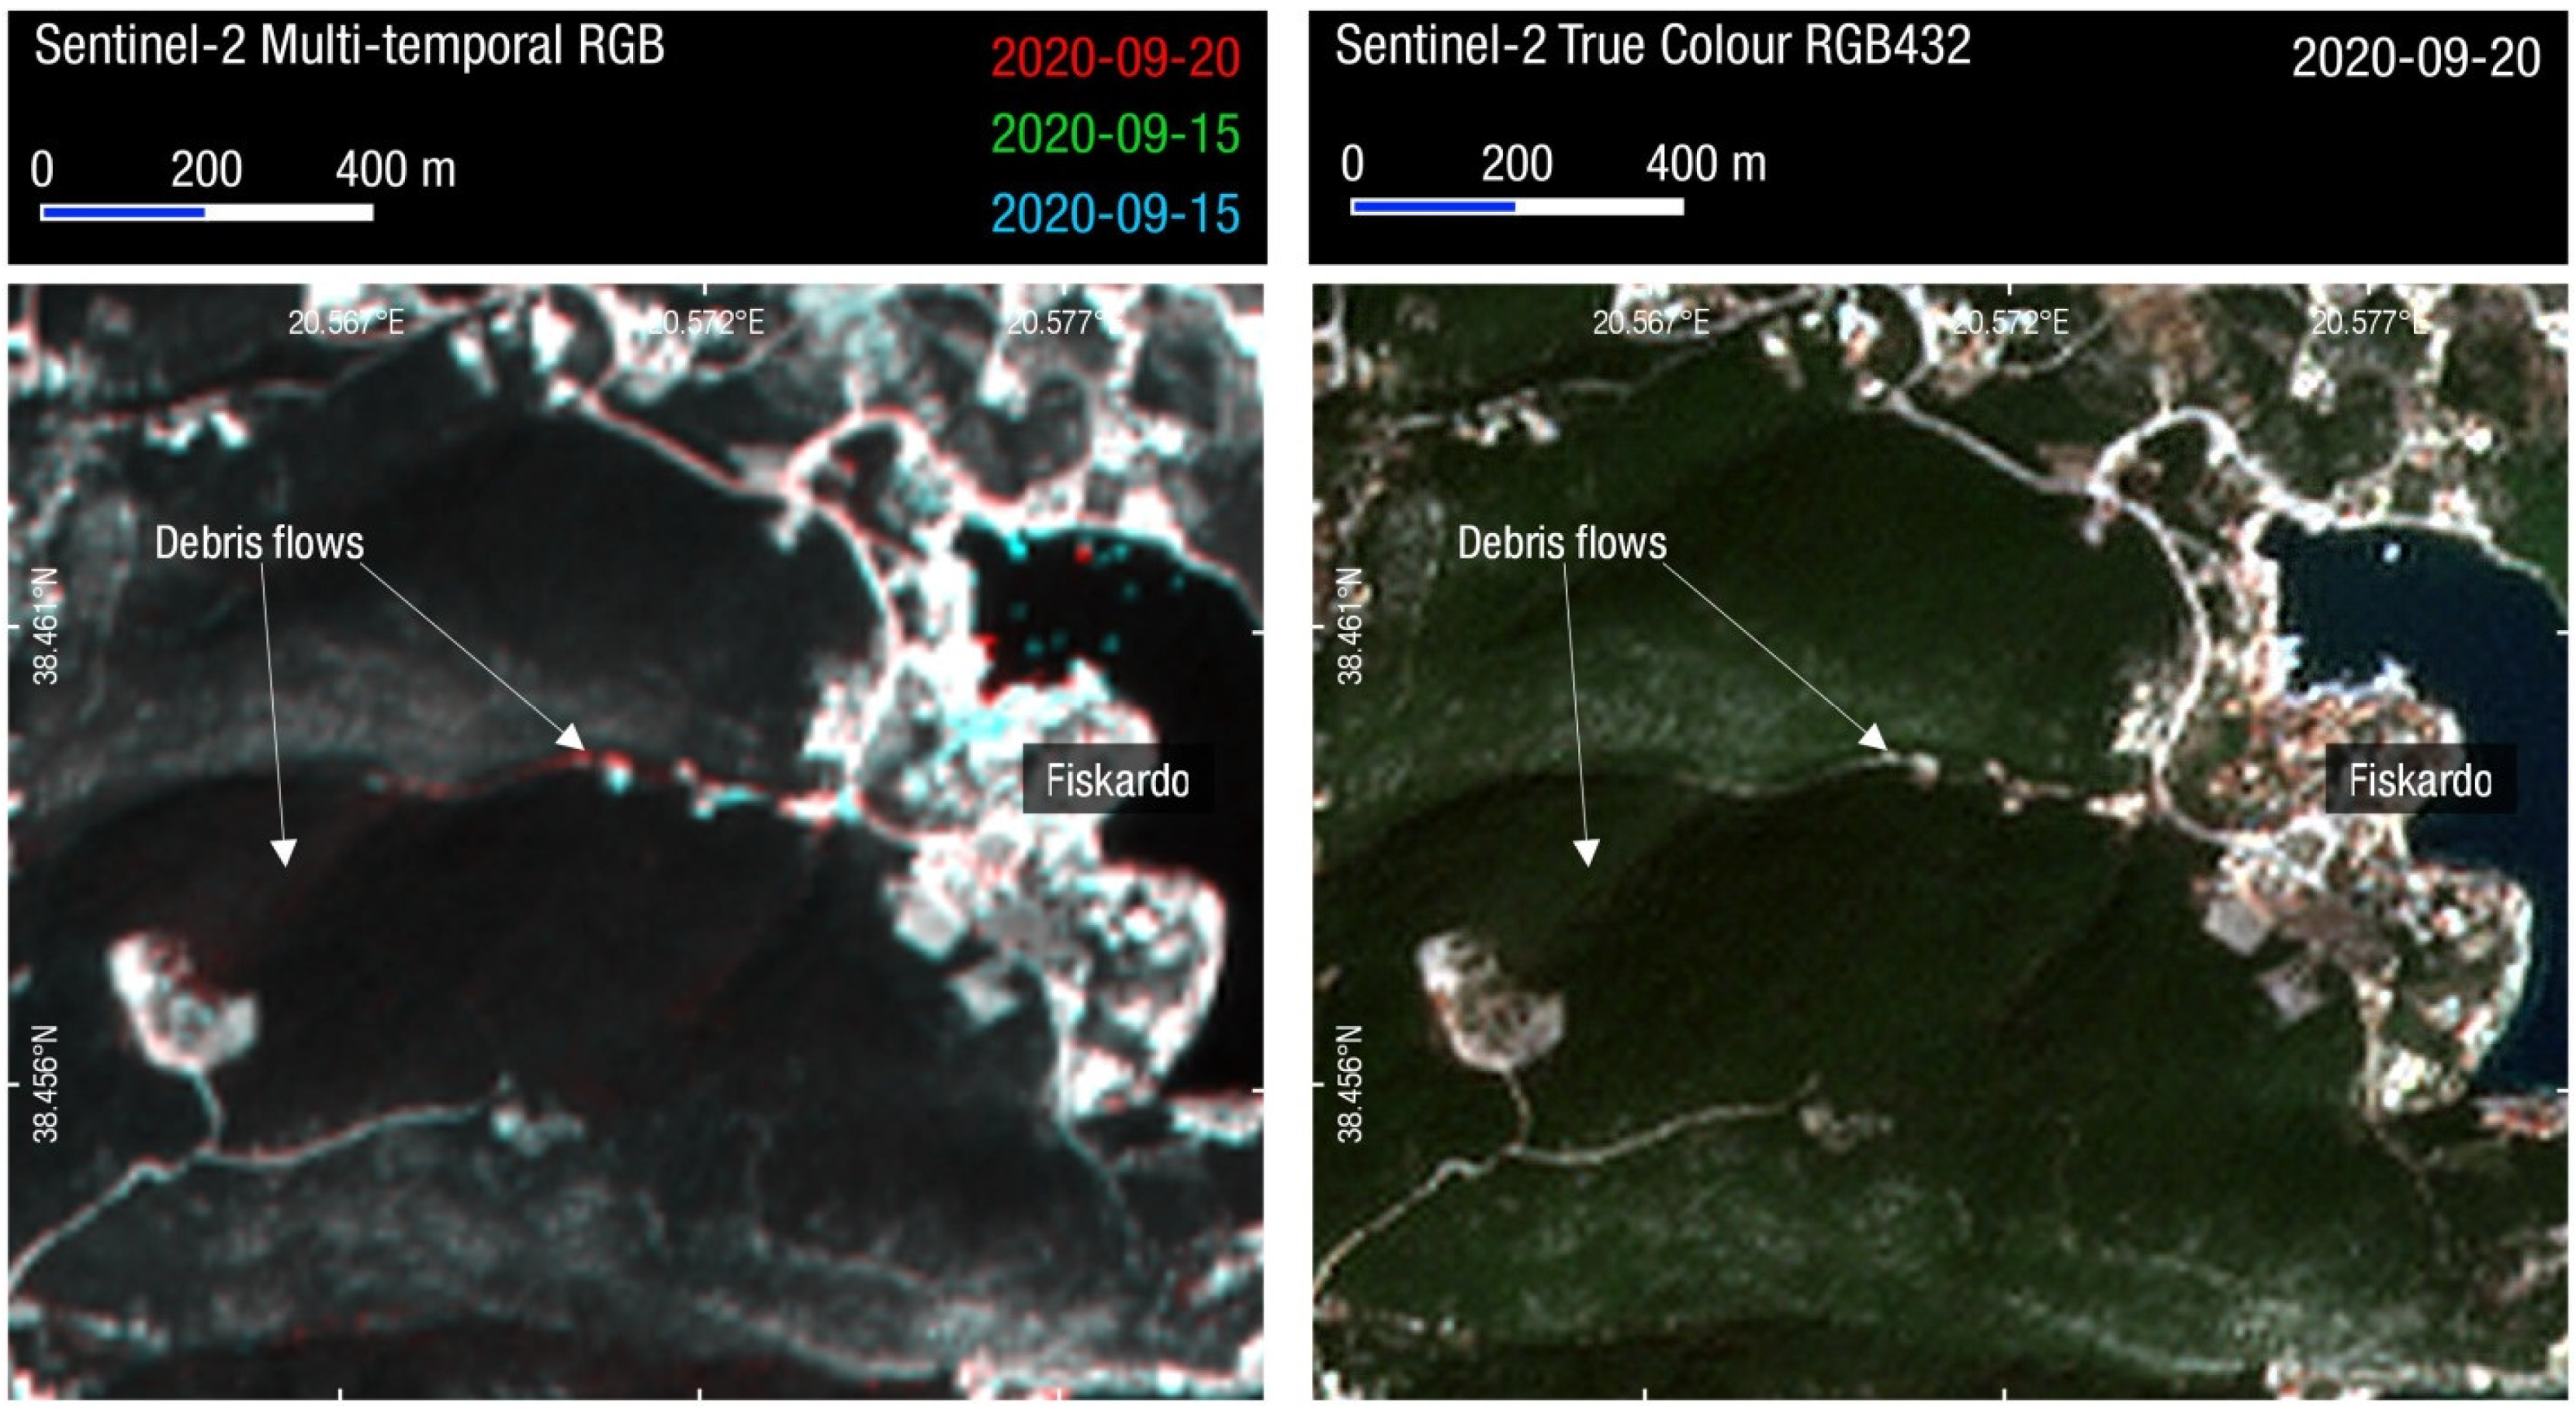
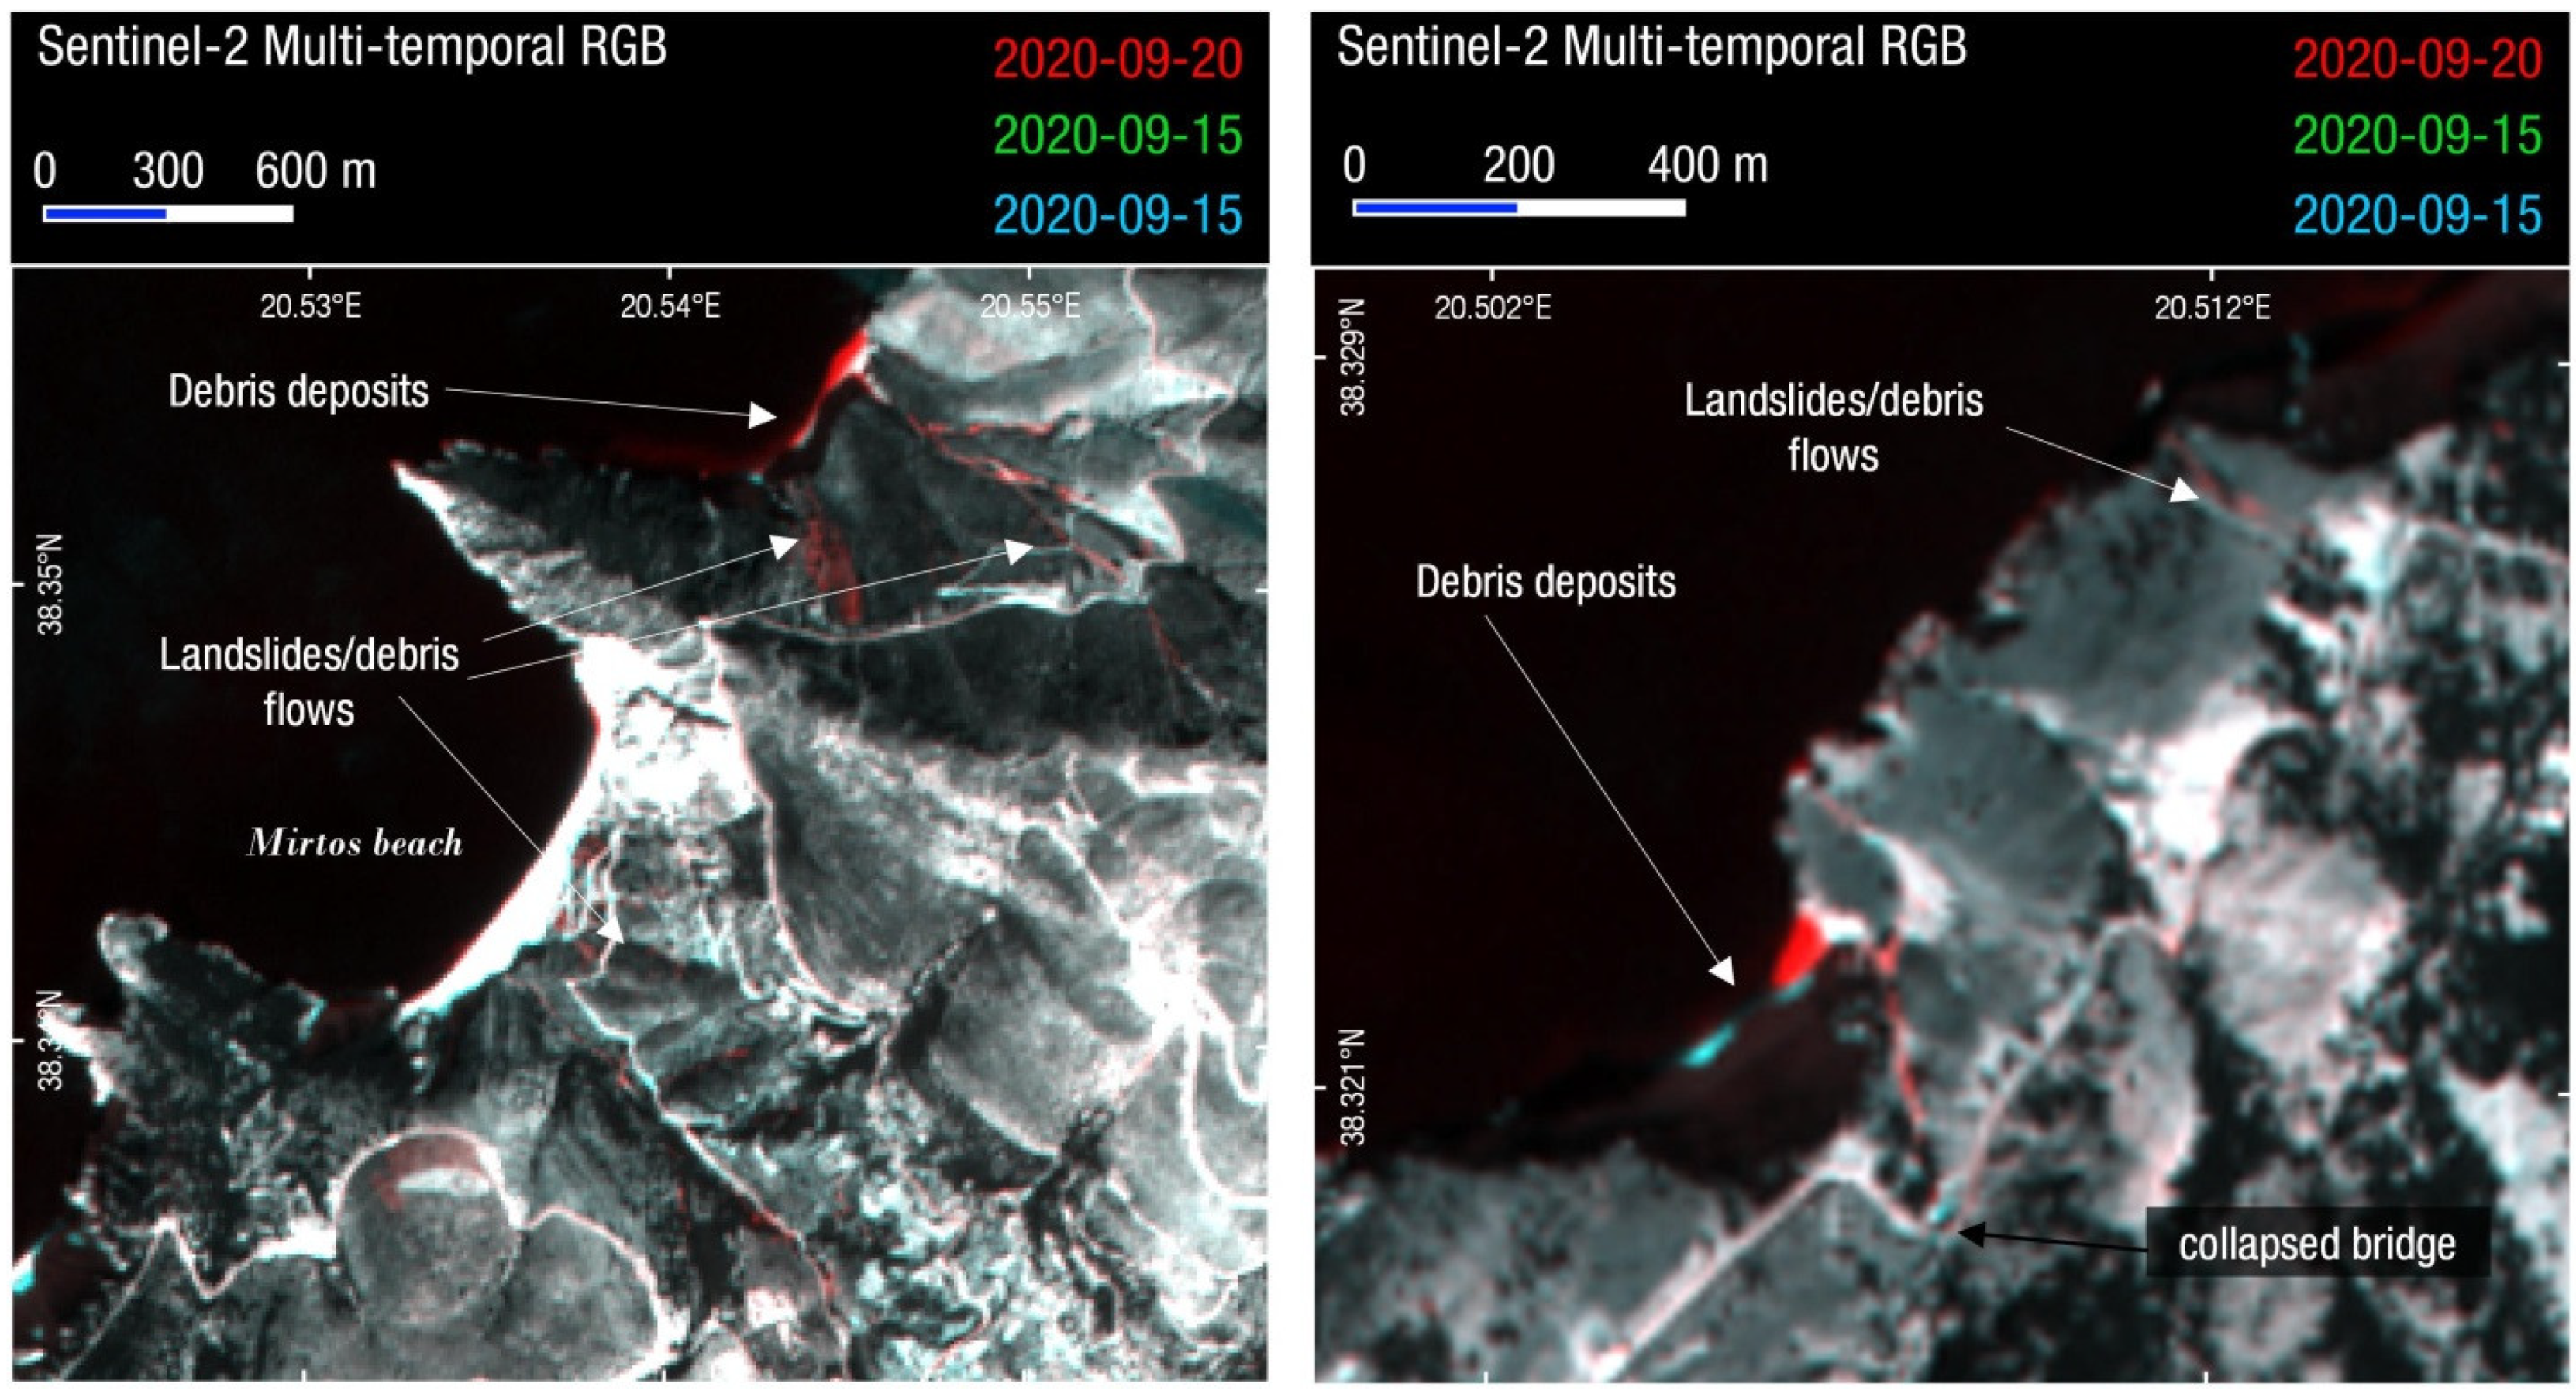
2.2. Landslides in Cephalonia Island

2.2.1. Geologic Setting

Cephalonia is part of the Ionian Islands and is located at the westernmost part of Greece. Geologically, the island is within the outermost edge of the ongoing subduction of the African plate under the Eurasian plate [34]. The bedrock of the island consists of two main formations: (i) the Pre-Apulian unit, which covers most of the island and consists mainly of a thick sequence of limestone and dolomite, overlain by a much thinner sequence of marl and pelite, and (ii) the Ionian unit, which covers part of the southeastern coastal areas and consists of limestone, shale, and breccia [35,36,37]. The basement is overlain by extensive sedimentary deposits in the southern and eastern part of the Paliki peninsula and the south part of the main island. These deposits consist of alluvial fans, mainly deposited along the stream channels (Figure 10). The dominance of carbonate rocks in combination with favorable climate conditions have facilitated the formation of karst units especially in the north and central part of the island. In particular, the Erissos Peninsula is dominated by an extensive, and partially karstified, planation surface. Cephalonia island is also characterized by steep slopes, especially along its western shoreline. Ridges are arranged in a NNW–SSE direction. The principal water divide has a NW–SE direction, with the main flow directions towards Sami Bay in the NE, and Poros in the SW.

2.2.2. Types of Landslides and Induced Phenomena

Cephalonia Island was heavily impacted by Medicane Ianos. Ianos was the most damaging natural hazard event for Cephalonia island, since the earthquakes of 2014 that caused building damages, widespread landslides, rockfalls and liquefaction over the island [38,39,40,41]. Severe rainfall at Cephalonia peaked at 759 mm (17–18 September 2020) during the passing of Medicane Ianos from the Ionian Sea islands [12]. In particular, the highest severity of the Medicane-induced phenomena was reported at the northern-central part of the island towards Erissos peninsula, between Sami and Fiskardo. Debris flows and landslides occurred in several locations across the island (Figure 10 and Figure 11). Often the debris flows covered wide areas (~40–70 m in width), while typically the average size of debris blocks reached 20–50 cm (Figure 11d). Moreover, the earth flows were often associated with road embankment failures (Figure 11c). The latter was also observed in cases of severe riverbank erosion/scour. The road network of the island was damaged and/or obstructed in several locations due to landslides, while a critical simple-span reinforced concrete bridge near the village of Agkonas collapsed due to scour of the west pier foundation by extensive gully flooding and debris (Figure 11e), heavily impacting the transportation network of the island.
Debris flows appeared to be the most common feature of the effect of Medicane Ianos across Cephalonia. Debris, collected or still in place, was present along gullies and riverbeds, across the island. Most notably, Assos village, situated in the north-west of the island, was severely impacted by a major debris flow, as it was covered by approximately 1.5 m of earth/debris material (Figure 11b). The source of the debris was traced to the hills east of the village, where significant surface erosion and ground cracking were observed. At places, eroded zones reached several meters in width. Eroded limestone boulders and residual soil material were present along the entire path of the flow. UAS-enabled mapping of the entire area indicates the change along the sea-shore due to material deposition (Figure 12). An initial, rough, estimation of the debris flow volume is 20,000 m3.
Similar to Assos, just outside of the village of Fiskardo (Figure 13), which is situated at the northern part of Erissos peninsula, a debris flow was documented. The debris flow had a lesser extent than the one that occurred in Assos, but was still significant, with the flow reaching a run-out distance of approximately 400 m. Significant erosion features were observed near the source of the debris flow. Eroded zones reached, at places, a depth of 2 m. The debris flow is also visible in Sentinel-2 satellite imagery, as shown in the pre-and-post-event images (Figure 13). Moreover, several rotational landslides were identified along the steep central coastline, particularly near Myrtos beach. Sentinel-2 pre-and-post event images of landslides and debris flows near Myrtos beach, and the collapsed bridge at Agkonas village are shown in Figure 14.

3. Discussion

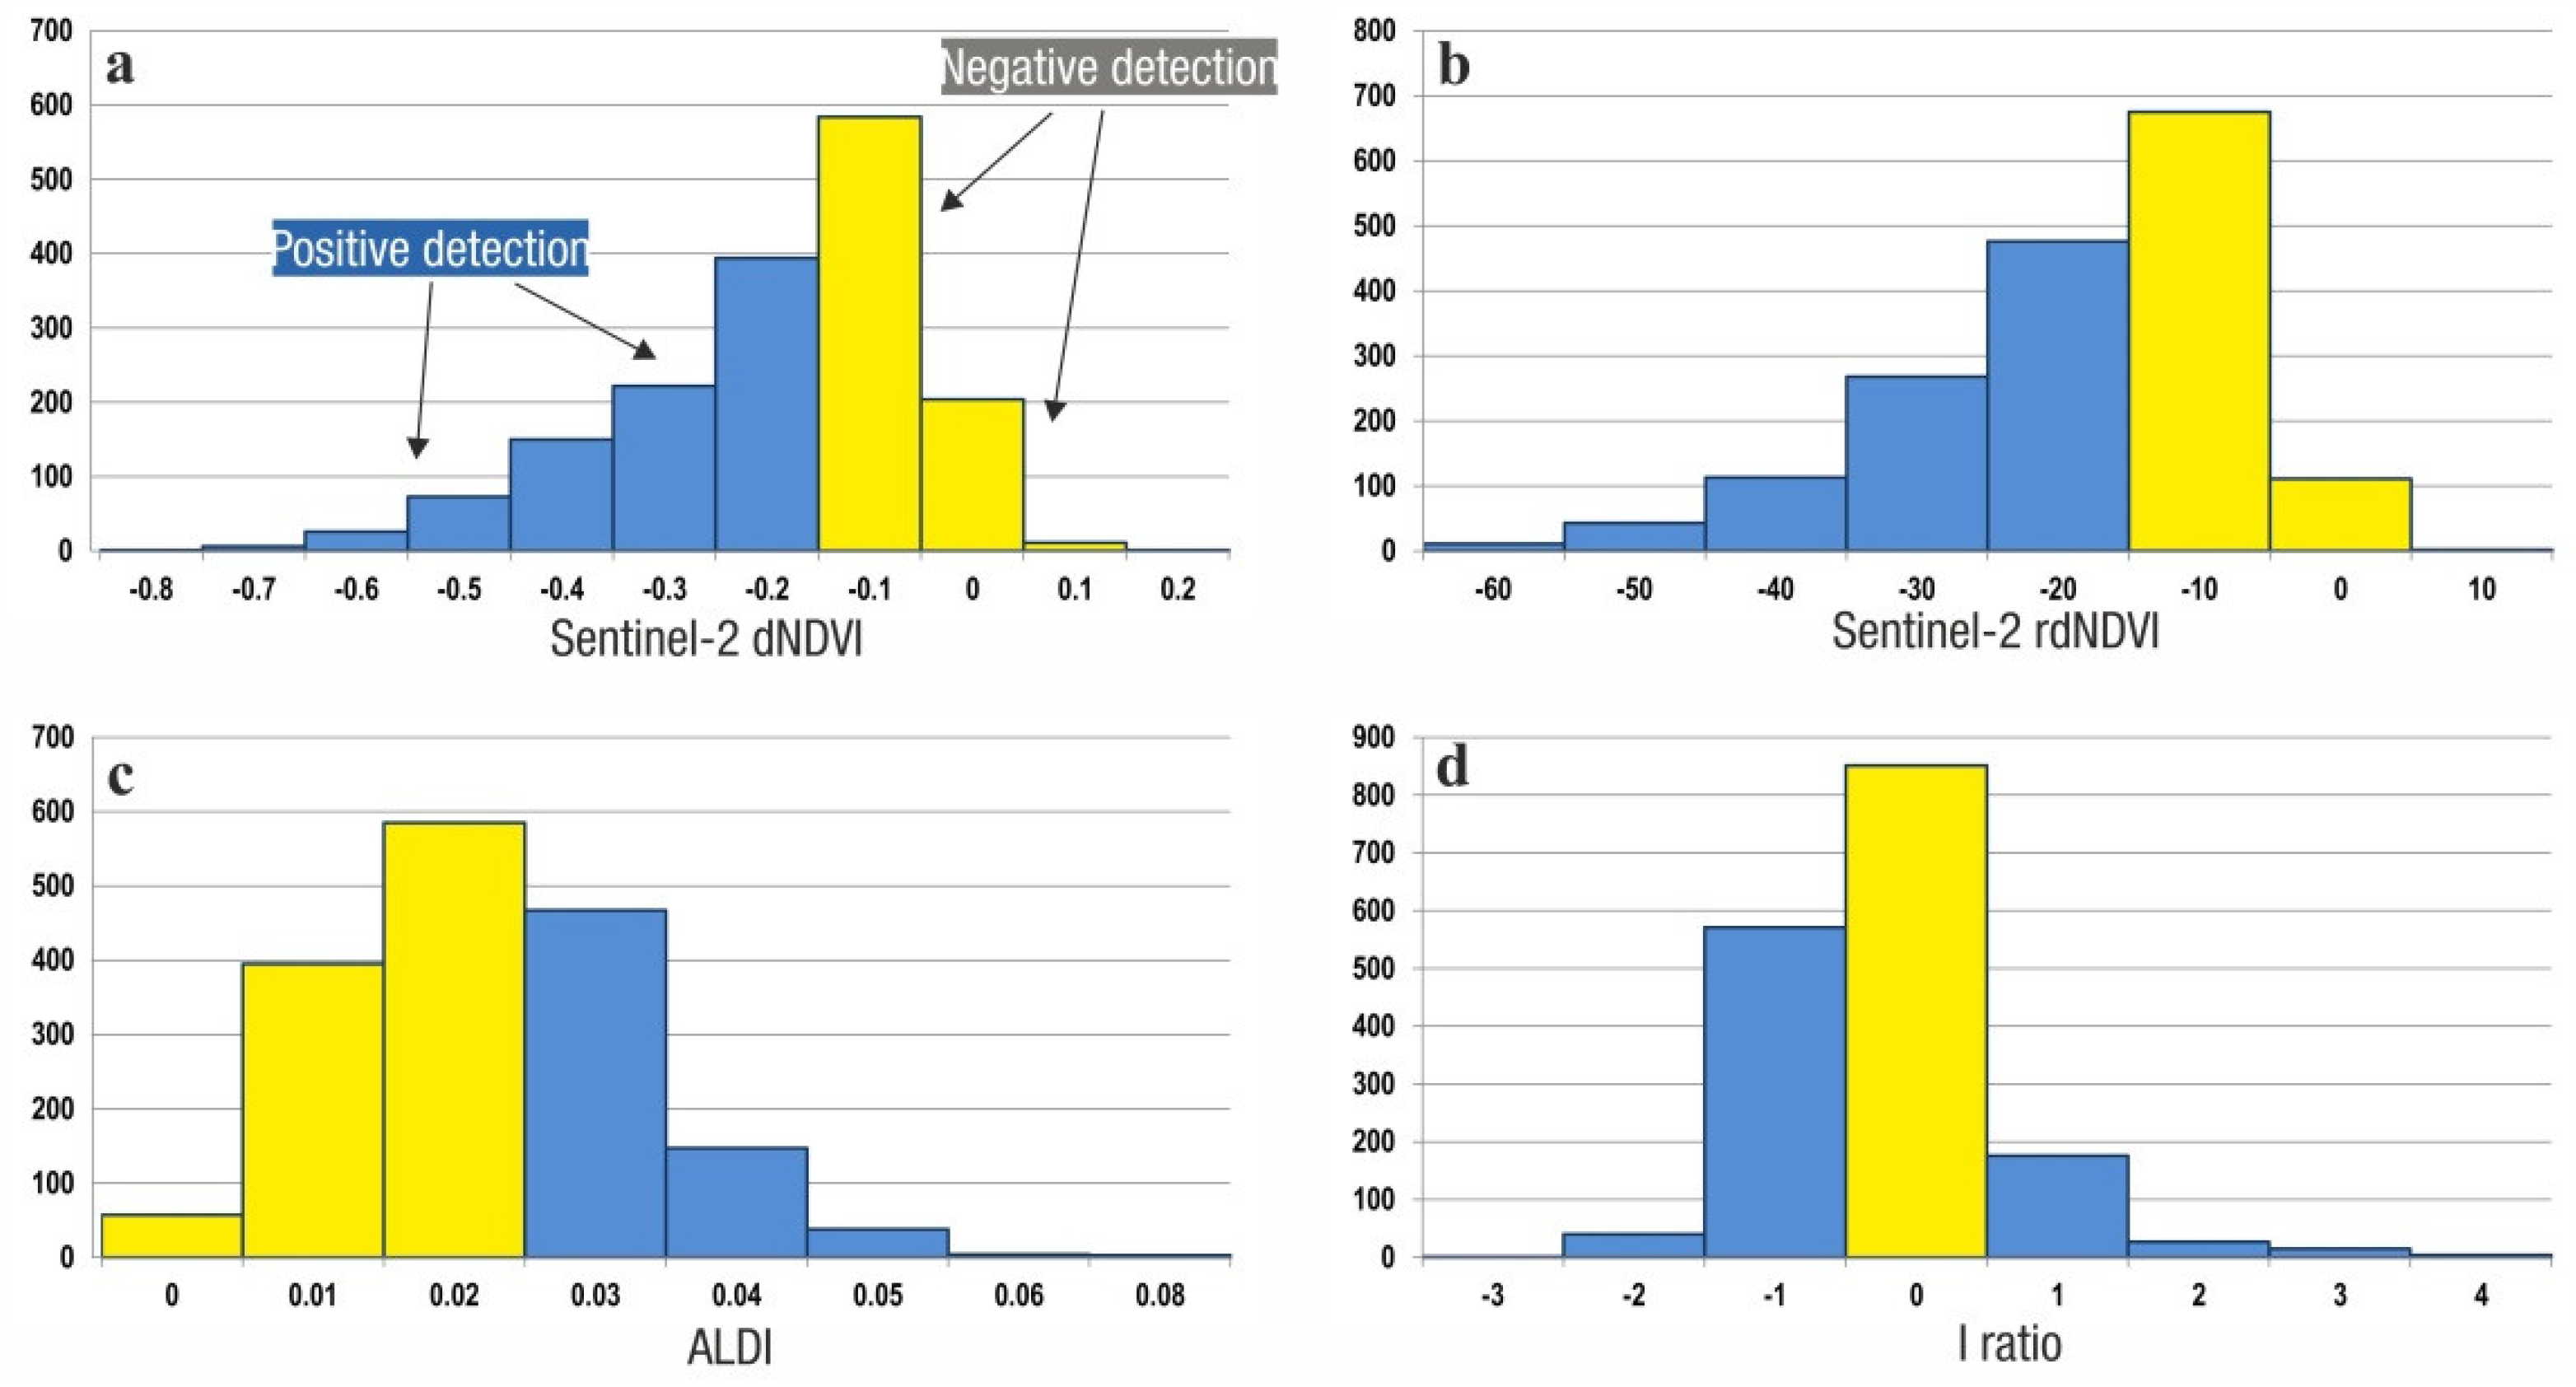
3.1. Comparison with Automated Mapping Methods

Rapid response to a major landslide event, such as hurricanes or earthquakes, is nowadays feasible due to the abundance of open remote sensing data available shortly after an event, from satellite imagery (e.g., Sentinel-1 & Sentinel-2, Landsat 8/9). The first satellite images available during or shortly after a meteorological event can provide a fast and comprehensive map of significant slides and effects, as described in the previous section. During the period that follows first response and early reconstruction, there is the need for more thorough and detailed landslide inventories. While this can be performed by manually digitizing landslides and effects using very high-resolution satellite imagery or other remote sensing data such as UAS surveys, new tools and a wealth of open satellite data can automate this workflow [42]. The ability to have access and process huge amounts of satellite imagery on the cloud through Google Earth Engine [43] and similar platforms has revolutionized remote sensing in geohazard response and analysis.
We present a comparison of our manual rapid mapping using Sentinel-2 images, with a series of recent workflows and codes that use the multi-temporal analysis of satellite imagery in Google Earth Engine [44,45,46,47]. While this comparison is not straightforward due to the different workflow, data and time frame used by either rapid manual mapping or automated multi-temporal analysis, this is an interesting case study to compare them. The wide extent and large number of landslides in the area of Karditsa, Thessaly is suitable for this use and comparison (Figure 15).
We selected four change detection techniques, that use multi-temporal analysis of open satellite data (Sentinel-1, Sentinel-2, Landsat); (a) method from [46] that calculates relative difference in the normalized difference vegetation index (rdNDVI) calculated from cloud-free composites of Sentinel-2, (b) HazMapper code by [44] that is based on the normalized difference vegetation index (dNDVI) calculated from cloud-free composites of Sentinel-2 [48], (c) ALDI, automated landslide detection index algorithm based on normalized difference vegetation index (NDVI) differencing of Landsat time series within Google Earth Engine taking into account seasonality [47] and (d) a SAR backscatter and amplitude change approach that uses multi-temporal stacks of Copernicus Sentinel-1 images [45].
Treshold values for positive and negative landslide and debris flow identification was determined for each method results based on proposed values and also local conditions after cross comparing with mapped landslides and imagery (Table 2 and Figure S2). Examining the different change detection results we obtained from these four methods, we can observe that all methods captured the large debris flows that occurred along the mountainous watersheds such as Mouzakiotikos river (Figure 15) and Megalos river in Filakti, near Lake Plastira (Figure 16). Large landslides with significant dimensions and/or long run-out distance were also identified. As the majority of landslides triggered during Medicane Ianos were of small dimensions (less than 20–30 m), these were mostly missed or were undifferentiated from the background scatter noise.
A quick estimate of the positive or negative detection was performed by extracting pixel values on the mapped landslide inventory from the various methods. Table 2 presents the final percentage and number of positively and negatively detected landslides.
Histograms of the detection results of Table 2 are presented in Figure 17. The highest success ratio is achieved by the methods of [44,46] with almost comparable results, as expected due to the similarities in the calculated change detection data (Sentinel-2 10 m) and parameters (time-series of normalized difference vegetation index). The worst percentage was achieved by ALDI [47], probably due to the lower resolution data used (Landsat multispectral bands with 30 m resolution instead of 10 m for Sentinel-2). SAR backscatter change [45] was close to the first two method results, with the difference attributed to the coarser pixel resolution of Sentinel-1 SAR imagery (20 × 4 m, translated into >15 m ground resolution when geometrically corrected to terrain) and the challenging oblique scanning of SAR satellites that can lead to terrain shadows.
In conclusion, rapid manual mapping of landslides for Ianos outperformed automated mapping methods based on Google Earth Engine time-series change detection of satellite imagery. The most prominent factor was the small size of the majority of landslides, which was barely close to the ground resolution threshold of 10 m for Sentinel-2, making it harder to identify by automated change detection algorithms. A large number of false positives were visually identified in the various change detection results, a factor that could negatively affect early response and mapping (Figures S1 and S2). Debris flow and large slides were identified in most automated mapping results (Figure S1), while smaller and shallow landslides were difficult to positively identify due to variations in image reflectance and terrain shadows. Surface manifestation of small shallow landslides kept being modified in the days and weeks following the landslide event, due to erosion and vegetation regrowth, a factor that affects the signal in the long time-series used by automated change detection methods. It is worth mentioning that a number of landslides occurred in the winter months following the Ianos landslide event. These landslides would be included in most automated change detection results due to the larger time frame examined.

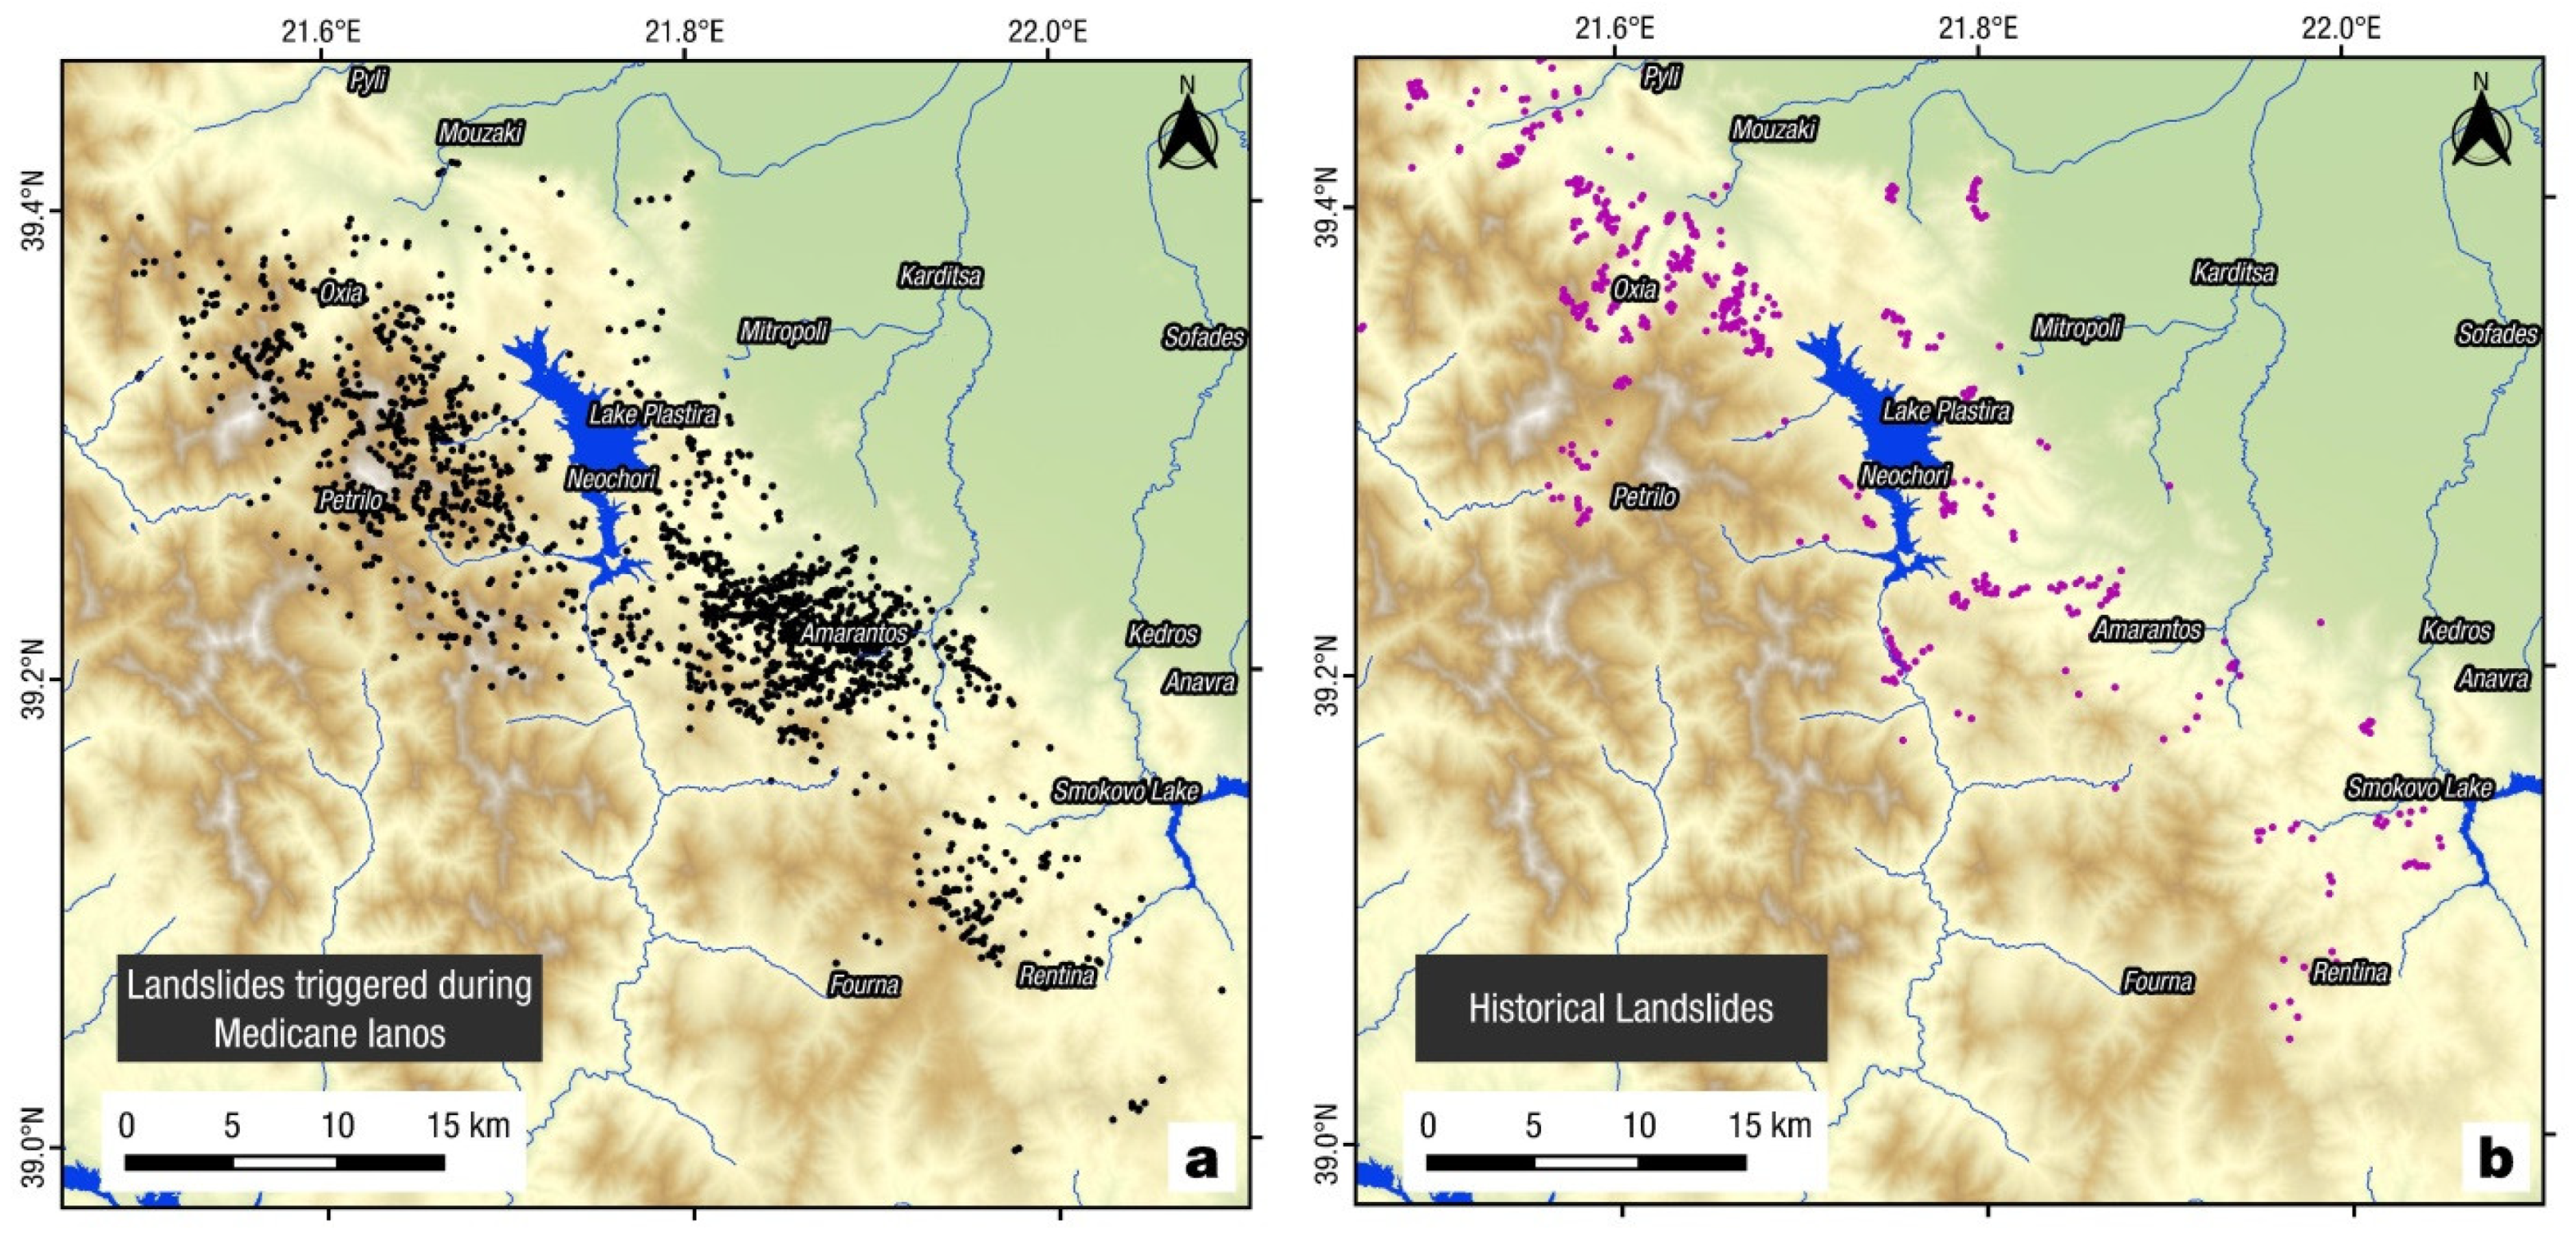
3.2. Older Landslides/Hazard

The mountainous area of Karditsa, Thessaly is known to be significantly affected by numerous landslides, many affecting communities and infrastructure [44]. The Agrafa mountain area, where the majority of landslides triggered by Medicane Ianos occurred, is one of the most hazardous areas in Greece for landslides. Landslide occurrence is mostly due to the factors of highly susceptible lithology (flysch and molassic sediments) and high precipitation rates of the Pindos mountain range. We compare the landslide inventory of Medicane Ianos with historically reported landslide locations in Figure 18. Historical locations were retrieved from [49,50] and official reports of the Institute of Geological and Mineral Exploration. A visual examination shows that Ianos landslides occurred along roughly the same locations of historical landslides, revealing a relation with long-term climatic and lithological/geomorphological conditions.

4. Conclusions

Medicane Ianos in September 2020 caused one of the most widespread catastrophic events for Greece in the last few decades. While most of the areas affected were already susceptible to geohazard occurrences, the areal extent and scale of the almost simultaneous (within three days) occurrence of failures and damage over a large area, represent a unique challenge for future response and mitigation. The area of western Thessaly was the hardest hit by an unprecedent number of landslides and debris flows in the mountains, while the low plains were covered by 475.5 km2 of flood waters [14,17].
We examined in detail two of the most affected areas, Cephalonia island in the Ionian Sea and Karditsa area in Thessaly, using early remote sensing data and post-event field surveys. Karditsa suffered more than 1500 landsides and numerous debris flows that caused widespread damage and disruption. Cephalonia Island did not experience the number of landsides of western Thessaly, but was severely hit by landslides and debris flows in key location and settlements, destroying bridges and disrupting transportation within the island. Assos settlement was nearly buried by a major debris flow. A dominant factor in these effects was the heavy precipitation experienced by those two areas during Medicane Ianos, in combination with local conditions highly susceptible to mass wasting.
The landside inventory acquired for Karditsa region is the first detailed inventory due to a major atmospheric event in Greece and a valuable asset for studying and mitigating future Medicane events in mainland Greece and surrounding regions. The detailed distribution of landslides can be studied along with meteorological and atmospheric observations, with possible implementation in the hurricane impact model development and forecasting.
As more data sources (satellite imagery) and tools (UAS sensors and platforms, rapid remote sensing big data processing, etc.) will be available to scientists in the near future, response and rapid mapping during future landslide events will be more thorough and faster, based on the experience that data collection from events such as Medicane Ianos provide.

Supplementary Materials

The following supporting information can be downloaded at: https://www.mdpi.com/article/10.3390/app122312443/s1, Figure S1: Comparison of field surveyed landslides with automatic satellite mapping results (a–g). Left: field photos (acquired 1–3 October 2020); right; location map with automatic satellite mapping results (HazMapper). Blue dots show mapped landslides from Sentinel-2 images and triangles with letter marking field locations of surveyed landslides. Location map for sites a–g (h) with Sentinel-2 landslides (orange), Figure S2: Automatic satellite mapping results. Left: method results; middle: method results with mapped landslides (blue dots) and field survey locations (orange triangles); right: Sentinel-2 true color image, acquired on 30 September 2020.

Author Contributions

Conceptualization, S.V. and G.P.; methodology, S.V. and G.P.; validation, S.V., G.P., V.M., C.S., V.K., E.K., I.F., G.Z., J.M. and O.-J.K.; formal analysis, S.V. and G.P.; investigation, S.V., G.P., V.M., C.S., V.K., E.K., I.F., G.Z., J.M. and O.-J.K.; data curation, S.V. and G.P.; writing—original draft preparation, S.V., G.P. and O.-J.K.; writing—review and editing, S.V., G.P., D.Z., G.Z. and O.-J.K.; visualization, S.V. and G.Z.; supervision, G.P., V.M., C.S., D.Z. and G.Z.; project administration, D.Z. and G.Z.; funding acquisition, D.Z. All authors have read and agreed to the published version of the manuscript.

Funding

Part of this research (Geotechnical Extreme Events Reconnaissance-GEER Association work) was funded by the National Science Foundation through the Geotechnical Engineering Program under Grant No. CMMI-1826118.

Institutional Review Board Statement

Not applicable.

Informed Consent Statement

Not applicable.

Data Availability Statement

A detailed description of the field surveys and reconnaissance after Medicane Ianos can be found in the Geotechnical Extreme Events Reconnaissance Report https://doi.org/10.18118/G6MT1T (accessed on 3 July 2022) and the companion web map: https://elxisgroup.com/GEER-MedicaneIanos-FieldMap/ (accessed on 3 July 2022).

Acknowledgments

We would like to thank Athanassios Ganas, Charalambos Kolovos and Vivi Diamantopoulou for discussions and assistance in the field surveys.

Conflicts of Interest

The authors declare no conflict of interest.

References

  1. Gorum, T.; van Westen, C.J.; Korup, O.; van der Meijde, M.; Fan, X.; van der Meer, F.D. Complex rupture mechanism and topography control symmetry of mass-wasting pattern, 2010 Haiti earthquake. Geomorphology 2013, 184, 127–138. [Google Scholar] [CrossRef]
  2. Larsen, M.C. Rainfall-triggered landslides, anthropogenic hazards, and mitigation strategies. Adv. Geosci. 2008, 14, 147–153. [Google Scholar] [CrossRef] [Green Version]
  3. Gariano, S.L.; Guzzetti, F. Landslides in a changing climate. Earth Sci. Rev. 2016, 162, 227–252. [Google Scholar] [CrossRef] [Green Version]
  4. Miglietta, M.M. Mediterranean tropical-like cyclones (Medicanes). Atmosphere 2019, 10, 206. [Google Scholar] [CrossRef] [Green Version]
  5. Emanuel, K. Genesis and maintenance of “Mediterranean hurricanes”. Adv. Geosci. 2005, 2, 217–220. [Google Scholar] [CrossRef] [Green Version]
  6. Kassis, D.; Varlas, G. Hydrographic effects of an intense “medicane” over the central-eastern Mediterranean Sea in 2018. Dyn. Atmos. Oceans 2020, 93, 101185. [Google Scholar] [CrossRef]
  7. Shaltout, M.; Omstedt, A. Recent sea surface temperature trends and future scenarios for the Mediterranean Sea. Oceanologia 2014, 56, 411–443. [Google Scholar] [CrossRef] [Green Version]
  8. Koseki, S.; Mooney, P.A.; Cabos, W.; Gaertner, M.; de la Vara, A.; González-Alemán, J.J. Modelling a tropical-like cyclone in the Mediterranean Sea under present and warmer climate. Nat. Hazards Earth Syst. Sci. 2021, 21, 53–71. [Google Scholar] [CrossRef]
  9. Cavicchia, L.; von Storch, H.; Gualdi, S. A long-term climatology of medicanes. Clim. Dyn. 2014, 43, 1183–1195. [Google Scholar] [CrossRef]
  10. Smart, D. Medicane ‘Ianos’ over the central Mediterranean 14–20 September 2020. Weather 2020, 75, 352–353. [Google Scholar] [CrossRef]
  11. Prat, A.C.; Federico, S.; Torcasio, R.C.; D’Adderio, L.P.; Dietrich, S.; Panegrossi, G. Evaluation of the sensitivity of medicane ianos to model microphysics and initial conditions using satellite measurements. Remote Sens. 2021, 13, 4984. [Google Scholar] [CrossRef]
  12. Lagouvardos, K.; Karagiannidis, A.; Dafis, S.; Kalimeris, A.; Kotroni, V. Ianos—A hurricane in the Mediterranean. Bull. Am. Meteorol. Soc. 2022, 103, E1621–E1636. [Google Scholar] [CrossRef]
  13. Zimbo, F.; Ingemi, D.; Guidi, G. The tropical-like cyclone “Ianos” in September 2020. Meteorology 2022, 1, 29–44. [Google Scholar] [CrossRef]
  14. Lekkas, E.; Nastos, P.; Cartalis, C.; Diakakis, M.; Gogou, M.; Mavroulis, S.; Spyrou, N.-I.; Kotsi, E.; Vassilakis, E.; Katsetsiadou, K.-N.; et al. Impact of medicane “IANOS” (September 2020) on Cephalonia and Ithaki Islands. In Newsletter of Environmental, Disaster and Crises Management Strategies; National Capodistrian University of Athens: Athens, Greece, 2020; ISSN 2653-9454. Available online: https://edcm.edu.gr/images/docs/newsletters/Newsletter_20_2020_Ianos.pdf (accessed on 3 July 2022).
  15. Loli, M.; Mitoulis, S.A.; Tsatsis, A.; Manousakis, J.; Kourkoulis, R.; Zekkos, D. Flood characterization based on forensic analysis of bridge collapse using UAV reconnaissance and CFD simulations. Sci. Total Environ. 2022, 822, 153661. [Google Scholar] [CrossRef]
  16. Tegos, A.; Ziogas, A.; Bellos, V.; Tzimas, A. Forensic hydrology: A complete reconstruction of an extreme flood event in data-scarce area. Hydrology 2022, 9, 93. [Google Scholar] [CrossRef]
  17. Zekkos, D.; Zalachoris, G.; Alvertos, A.E.; Amatya, P.M.; Blunts, P.; Clark, M.; Dafis, S.; Farmakis, I.; Ganas, A.; Hille, M.; et al. The September 18–20 2020 Medicane Iaonos Impact on Greece—Phase I Reconnaissance Report; Geotechnical Extreme Events Report–Reconnaissance Report, GEER-068; Geer Association: San Francisco, CA, USA, 2020. [Google Scholar] [CrossRef]
  18. Kirschbaum, D.; Stanley, T. Satellite-based assessment of rainfall-triggered landslide hazard for situational awareness. Earth’s Futur. 2018, 6, 505–523. [Google Scholar] [CrossRef] [PubMed]
  19. Khan, S.; Kirschbaum, D.B.; Stanley, T.A.; Amatya, P.M.; Emberson, R.A. Global landslide forecasting system for hazard assessment and situational awareness. Front. Earth Sci. 2022, 10, 878996. [Google Scholar] [CrossRef]
  20. Kallergis, G. Hydrogeological study of Kalabaka sub-basin (western Thessaly). In Geological and Geophysical Studies 1970, XIV (1); Institute of Geology and Subsurface Investigations: Athens, Greece, 1970; 197p. [Google Scholar]
  21. Lekkas, E. Geological Structure and Geodynamic Evolution of Koziakas Range (Western Thessaly); Geological Monographs. PhD Thesis, Department of Geology, National and Kapodistrian University of Athens, Athens, Greece, 1988; 281p. [Google Scholar]
  22. Brunn, J.H. Contribution à l’ étude géologique du Pinde septentrional et d’une partie de la Macédoine occidentale. Ann. Géol. Pays Hell. 1956, 7, 1–358. [Google Scholar]
  23. Aubouin, J. Contribution a l’étude géologique de la Grèce septentrionale: Les confins de l’Épire et de la Thessalie. Ann. Geol. Pays Hellen. 1959, 10, 1–484. [Google Scholar]
  24. Ferrière, J. Paléogéographies et Tectoniques Superposées Dans les Hellénides Internes au Niveau de l’ Othrys et du Pélion (Grèce). Thèse, Sciences, Université de Lille, Lille, France, 1982. Soc. Géol. Nord 1982, 8, 970. [Google Scholar]
  25. Nielsen, A.A.; Conradsen, K.; Simpson, J.J. Multivariate Alteration Detection (MAD) and MAF postprocessing in multispectral, bitemporal image data: New approaches to change detection studies. Remote Sens. Environ. 1998, 64, 1–19. [Google Scholar] [CrossRef] [Green Version]
  26. Brigot, G.; Colin-Koeniguer, E.; Plyer, A.; Janez, F. Adaptation and evaluation of an optical flow method applied to coregistration of forest remote sensing images. IEEE J. Sel. Top. Appl. Earth Obs. Remote Sens. 2016, 9, 2923–2939. [Google Scholar] [CrossRef]
  27. Avdis, V.; Manakos, K. Geological map of Greece in scale 1:50000. In Map Sheet Fournas; Institute of Geological and Mineral Exploration: Athens, Greece, 1991. [Google Scholar]
  28. Karfakis, I. Geological map of Greece in scale 1:50000. In Map Sheet Mouzakion; Institute of Geological and Mineral Exploration: Athens, Greece, 1983. [Google Scholar]
  29. Lyberis, N.; Chotin, P.; Bodozis, C. Geological map of Greece in scale 1:50000. In Map Sheet Agrafa; Institute of Geological and Mineral Exploration: Athens, Greece, 1983. [Google Scholar]
  30. Manakos, K. Geological map of Greece in scale 1:50000. In Map Sheet Mirofillon; Institute of Geological and Mineral Exploration: Athens, Greece, 1993. [Google Scholar]
  31. Savoyat, E. Geological map of Greece in scale 1:50000. In Map Sheet Karditsa; Institute of Geological and Mineral Exploration: Athens, Greece, 1969. [Google Scholar]
  32. Bessette-Kirton, E.K.; Coe, J.A.; Schulz, W.H.; Cerovski-Darriau, C.; Einbund, M.M. Mobility characteristics of debris slides and flows triggered by Hurricane Maria in Puerto Rico. Landslides 2020, 17, 2795–2809. [Google Scholar] [CrossRef]
  33. Papathanassiou, G.; Valkaniotis, S.; Ganas, A.; Stampolidis, A.; Rapti, D.; Caputo, R. Floodplain evolution and its influence on liquefaction clustering: The case study of March 2021 Thessaly, Greece, seismic sequence. Eng. Geol. 2022, 298, 106542. [Google Scholar] [CrossRef]
  34. Underhill, J.R. Late Cenozoic deformation ofifhe Hellenic foreland, Western Greece. Geol. Soc. Am. Bull. 1989, 101, 613–634. [Google Scholar] [CrossRef]
  35. British Petroleum Co.; University of Munich; Migiros, G. Geological map of Greece in scale 1:50000. In 2 Map Sheets—Cephalonia Island; Institute of Geological and Mineral Exploration: Athens, Greece, 1985. [Google Scholar]
  36. Lekkas, E.; Danamos, G.; Mavrikas, G. Geological structure and evolution of Kefallonia and Ithaki islands. Bull. Geol. Soc. Greece 2001, 34, 11–17. [Google Scholar] [CrossRef]
  37. Lekkas, E. (Ed.) Neotectonic Map of Greece. Cephalonia—Ithaki Sheet, Scale 1:100.000; University of Athens—Earthquake Planning and Protection Organization: Athens, Greece, 1996. [Google Scholar]
  38. Valkaniotis, S.; Ganas, A.; Papathanassiou, G.; Papanikolaou, M. Field observations of geological effects triggered by the January–February 2014 Cephalonia (Ionian Sea, Greece) earthquakes. Tectonophysics 2014, 630, 150–157. [Google Scholar] [CrossRef]
  39. Lekkas, E.L.; Mavroulis, S.D. Earthquake environmental effects and ESI 2007 seismic intensities of the early 2014 Cephalonia (Ionian Sea, western Greece) earthquakes (January 26 and February 3, Mw 6.0). Nat. Hazards 2015, 78, 1517–1544. [Google Scholar] [CrossRef]
  40. Nikolaou, S.; Zekkos, D.; Asimaki, D.; Gilsanz, R. Reconnaissance highlights of the 2014 sequence of earthquakes in Cephalonia, Greece. In Proceedings of the 6th International Conference on Earthquake Geotechnical Engineering, Christchurch, New Zealand; International Society for Soil Mechanics and Geotechnical Engineering (ISSMGE): London, UK, 2015. [Google Scholar]
  41. Athanasopoulos, G.; Kechagias, G.; Zekkos, D.; Batilas, A.; Karatzia, X.; Lyrantzaki, F.; Platis, A. Lateral spreading of ports in the 2014 Cephalonia, Greece, earthquakes. Soil Dyn. Earthq. Eng. 2020, 128, 105874. [Google Scholar] [CrossRef]
  42. Burrows, K.; Milledge, D.; Walters, R.J.; Bellugi, D. Integrating empirical models and satellite radar can improve landslide detection for emergency response. Nat. Hazards Earth Syst. Sci. 2021, 21, 2993–3014. [Google Scholar] [CrossRef]
  43. Gorelick, N.; Hancher, M.; Dixon, M.; Ilyushchenko, S.; Thau, D.; Moore, R. Google earth engine: Planetary-scale geospatial analysis for everyone. Remote Sens. Environ. 2017, 202, 18–27. [Google Scholar] [CrossRef]
  44. Scheip, C.M.; Wegmann, K.W. HazMapper: A global open-source natural hazard mapping application in Google Earth Engine. Nat. Hazards Earth Syst. Sci. 2021, 21, 1495–1511. [Google Scholar] [CrossRef]
  45. Handwerger, A.L.; Huang, M.-H.; Jones, S.Y.; Amatya, P.; Kerner, H.R.; Kirschbaum, D.B. Generating landslide density heatmaps for rapid detection using open-access satellite radar data in Google Earth Engine. Nat. Hazards Earth Syst. Sci. 2022, 22, 753–773. [Google Scholar] [CrossRef]
  46. Lindsay, E.; Frauenfelder, R.; Rüther, D.; Nava, L.; Rubensdotter, L.; Strout, J.; Nordal, S. Multi-temporal satellite image composites in google earth engine for improved landslide visibility: A case study of a glacial landscape. Remote Sens. 2022, 14, 2301. [Google Scholar] [CrossRef]
  47. Milledge, D.G.; Bellugi, D.G.; Watt, J.; Densmore, A.L. Automated determination of landslide locations after large trigger events: Advantages and disadvantages compared to manual mapping. Nat. Hazards Earth Syst. Sci. 2022, 22, 481–508. [Google Scholar] [CrossRef]
  48. Scheip, C.; Wegmann, K. HazMapper v1.0 Source Code (Version 1.0). Zenodo. Available online: https://zenodo.org/record/4103348#.Y43JIX3MJPY (accessed on 2 July 2022).
  49. Pyrgiotis, L. Engineering Geological Conditions in Karditsa County: Landslides Phenomena in Flysch Formations. Ph.D. Thesis, Department of Geology, University of Patras, Patras, Greece, 1997; p. 362. [Google Scholar]
  50. Apostolidis, E. Engineering-Geological Conditions in the Western Thessaly Basin: Geomechanical Characteristics of the Quaternary Deposits: Analysis Using Geographic Information Systems. Ph.D. Thesis, Department of Geology, University of Patras, Patras, Greece, 2014; p. 1119. [Google Scholar]
Figure 1. (a) Medicane Ianos over Greece, Sentinel-3 OLCI true color image acquired on 18 September 2020, one day after Medicane landing. (b) Satellite precipitation (NASA IMERG) of 18 September 2020. Overview boxes show the location of the two studied areas; 1—Cephalonia island, 2—western Thessaly.
Applsci 12 12443 g001
Figure 2. Example of manually mapping landslides within the study area using Sentinel-2 imagery. Pre- and post-event true color Sentinel-2 images (a,b) and an overlay (c) of mapped landslide points with red color (mostly headscarp points). Change detection MAD processing (d,e) assisted visual picking of headscarp points (f).
Applsci 12 12443 g002
Figure 3. (a) Mapped landslides (black dots) triggered by Medicane Ianos during 17–19 September 2020, and simplified lithology of the area (see text for references). (b) Density map of Ianos landslides (using a radius of 1000 m); two major concentrations of landslides west of Lake Plastira and around Amarantos village.
Applsci 12 12443 g003
Figure 4. Statistical correlation of the spatial distribution of Ianos slope failures with: (a) elevation (histogram with area covered by each class in km2 with a black line), (b) geology, (c) slope angles and (d) histogram of slope aspect values.
Applsci 12 12443 g004
Figure 5. Types of landslides identified in the field reconnaissance surveys.
Applsci 12 12443 g005
Figure 6. Different lithology types affected by rotational and translational slides.
Applsci 12 12443 g006
Figure 7. Characteristic rotational failures around Amarantos area. (a) large failure in siltstone flysch west of Itamos village and (b) failure in weathered flysch mantle material causing damage to the road.
Applsci 12 12443 g007
Figure 8. (a) Characteristic debris flow at Livadia village; (b) extensive debris flows in gullies in the area between Pefkofito and Vlassi.
Applsci 12 12443 g008
Figure 9. Damaged bridge crossing of Karitsiotis River near Belokomiti. Ground (a) and vertical aerial (b) images of the damaged bridge undergoing repairs on 1 October 2020. UAS orthophoto (c) and digital surface model (d) of the Karitsiotis River bridge area (surveys 1 October 2020).
Applsci 12 12443 g009
Figure 10. Lithological map of Cephalonia Island with observed landslides and related phenomena following Medicane Ianos. Modified from [35,37].
Applsci 12 12443 g010
Figure 11. Characteristic damages in Cephalonia Island following Medicane Ianos: (a) Riverbank erosion, (b) debris flow within a rural community, (c) road embankment failure, (d) extensive debris flow, and (e) bridge collapse.
Applsci 12 12443 g011
Figure 12. UAS-enabled mapping of Assos village debris flow and surrounding area (3D model can be viewed at: https://skfb.ly/6WyTT (accessed on 2 July 2022)): (a) orthophotomap and (b) digital surface model (surveyed on 30 September 2020).
Applsci 12 12443 g012
Figure 13. (Left): Sentinel-2 multi-temporal composite (Band 4) Fiskardo, Cephalonia. (Right): Sentinel-2 true color composite (Bands 4-3-2). Red colors mark the location of debris flows upstream of Fiskardo.
Applsci 12 12443 g013
Figure 14. Sentinel-2 multi-temporal composites (Band 4) of central Cephalonia. (Left): Mirtos beach area; (Right): Site of collapsed bridge on the E.O. Argostoliou-Fiskardou (38.3195° N, 20.5081° E). Red colors mark the location of debris flows, landslides and deposition of debris along the coast.
Applsci 12 12443 g014
Figure 15. Change detection results from HazMapper [44,48] utilizing multi-temporal Sentinel-2 imagery. Red colors show negative rdNDVI changes that correspond to land cover changes due to landslides and debris flows. Results were in par with manual mapping in the area of high-density landslides southeast of Plastira Lake (a), while in most areas change detection was more successful in depicting the major debris flows such as the ones upstream of Mouzakiotikos River (b).
Applsci 12 12443 g015
Figure 16. Debris flow and landslides along Megalos River in Filakti/Pezoula area (a). 3D view of the Megalos River watershed with debris flows along the main river course and its exit to Lake Plastira (red colors of ALDI change detection index values). Flooding, severe sedimentation and material transportation from upstream was mapped at its exit (photo (b), view towards east with location marked in (a)) and near Pezoula. Road bridges were destroyed in both locations, with positions labeled in (a).
Applsci 12 12443 g016
Figure 17. Histograms of pixel values by automated mapping methods corresponding to mapped landslides; (a) [46], (b) HazMapper by [44], (c) ALDI [47] and (d) SAR backscatter change by [45]. Yellow bars mark negative detections and blue bars positive detection, based on set threshold values for each method.
Applsci 12 12443 g017
Figure 18. Comparison of (a) Medicane Ianos triggered landslides (black dots) and (b) historical occurrences of landslides in the region (purple dots).
Applsci 12 12443 g018
Table 1. Description of geological formations (based on [26,27,28,29,30,31]).
Unit NameSymbolArea km2Landslides %AgeDescription
Quaternary depositsQ111.381.4QuaternaryAlluvial and fluvial sediments, scree, debris and terrace deposits
Molassic formationsMi.m40.810.5Oligocene-MioceneConglomerates, marls, sandstones, Limestone (Mi.m and Mi.k)
FlyschFo829.6479 The formation consists of alternations of sandstone, shales, siltstones (fo.st) and more seldom conglomerates (fb)
Transition BedsK9-Pc48.084.4Cretaceous-PaleoceneAlternations of limestones, sandstones, shales and marls (K9-Pc, K7-Pc)
Cretaceous carbonatesK7-9.k123.215.6Cretaceous-PaleoceneLimestones
Pindos
“First” Flysch
K1-7.fl20.052.7CretaceousOlder flysch formation; red cherts, shales, conglomerates and sandstones
OphiolitesO5.540.1Jurassic-CretaceousMafic and ultra-mafic igneous rocks; peridotites, serpentinites, dunites, basalts. Also contain syn-sedimentary shales, limestones and conglomerates
Jurassic carbonatesJ11-K.k17.611.8Jurassic-CretaceousThin bedded limestones and cherts
Jurassic carbonatesJi-s.k42.90.3JurassicLimestones
Jurassic carbonatesJm.sch35.681.6JurassicAlternations of cherts, limestones and shales
Triassic carbonatesT-J.kh14.412.3Triassic-JurassicLimestones, cherts, sandstones
Triassic carbonatesTs.k14.200.3Upper TriassicLimestones
Triassic carbonatesTm-Jm.k2.150Middle Triassic-JurassicLimestones, cherts, sandstones
Triassic Basal BedsTms.fl2.330.1Middle TriassicFlysch formation, thin beds of cherts, shales and limestones
Table 2. Positive and negative detection of mapped landslides by the different change detection methods.
MethodPositiveNegativeSuccess %Threshold Value
rdNDVI [46]87280052.15−0.1<
HazMapper [44]91178653.68−10<
ALDI [47]659103738.85>0.025
SAR backscatter change by [45]83785149.58−1 < I ratio > 1
Publisher’s Note: MDPI stays neutral with regard to jurisdictional claims in published maps and institutional affiliations.

