Article

The Effect of Hydrolysis on the Antioxidant Activity of Olive Mill Waste

1
Institute of Applied Science, Malta College of Arts, Science and Technology, PLA 9032 Paola, Malta
2
Department of Food Engineering, Middle East Technical University, Ankara 06800, Turkey
*
Authors to whom correspondence should be addressed.
Appl. Sci. 2022, 12(23), 12187; https://doi.org/10.3390/app122312187
Submission received: 25 October 2022 / Revised: 17 November 2022 / Accepted: 25 November 2022 / Published: 28 November 2022
(This article belongs to the Special Issue Advances in Waste Treatment and Resource Utilization)

Abstract

:
This study presents the effect of hydrolysis on the antioxidant activity of olive mill waste. The olive pomace samples were collected at different stages of maturity and were investigated for their phenolic content and antioxidant activity. Three different extraction procedures were employed, including methanolic maceration extraction and two hydrolysed procedures using 6 M HCL for acid hydrolysis and 10 M NaOH for alkaline hydrolysis. The total phenolic, flavonoid and ortho-diphenolic content, metal ion reducing activity, 2,2′-azino-bis (3-ethylbenzothiazoline-6-sulfonic acid) and 2,2-Diphenyl-1-picrylhydrazyl Radical Scavenging, hydrogen peroxide and superoxide scavenging activity assays were determined for the different extracts. In this study, cultivar and maturation of olives was one of the factors that affected the phenolic content in the olive pomace samples. Results show that alkaline hydrolysis had the highest antioxidant activity with respect to total phenolic content, 2,2-Diphenyl-1-picrylhydrazyl scavenging activity, metal ion reducing activity and superoxide scavenging activity, whereas acid hydrolysis had the highest 2,2′-azino-bis (3-ethylbenzothiazoline-6-sulfonic acid) scavenging activity. The correlation analysis carried out on the different phenolic classes revealed that the total phenolic, flavonoid and ortho-diphenolic content were correlated with metal ion reducing activity and Radical Scavenging activity.

1. Introduction

In recent years, the olive cultivation industry in the Maltese Islands has re-emerged, potentially allowing the creation of a niche market for high-quality olive oils produced by the Maltese agribusiness sector. The land used for olive plantation has increased drastically from 21 hectors in 2003 to 140 hectors in 2010 [1]. In Malta, there are three major identified olive cultivars which are thought to be native, namely the ‘Bajda’, ‘Bidni’ and ‘Malti’ [2]. The ‘Bajda’ and ‘Bidni’ are monocultivars, whilst the ‘Malti’ is thought to be made up of ancient varieties which are geographically isolated from each other [3]. Olive oil is associated with a rich source of phenolic compounds which are related to various beneficial qualities, including anti-inflammatory properties and antioxidant, anti-cancerous and anti-microbial effects [4].
Phenolic compounds are a class of secondary metabolites found in plants, distributed non-uniformly at both cellular and subcellular level. They occur as both soluble and insoluble compounds. During the processing of oil, phenolic compounds are transferred from the fruit to the oil. Thus, the analysis of olive waste phenolic compounds reflects those found in the drupes [5]. The olive fruit is rich in secoiridoid oleuropein, demethyloleuropein and ligstroside, as well as in their hydrolytic derivatives [6,7,8,9]. Due to the polar nature of these compounds, the partition coefficient (oil/water) of most of these phenolic compounds favour the water phase [10], leading to the majority of such bioactive compounds to be lost in the waste. In fact, only 2% of the total phenolic content of the olive fruit passes to the oil phase, while the remaining 98% is lost in the olive mill waste [10].
Publications examining olive mill waste began to appear around the 1960s, motivated by scientific curiosity and the possible agricultural benefits of the waste produced during the processing of olives. Various uses have been proposed, including use as a fertilizer [11,12] or as a renewable energy source [13,14,15]. Olive waste has also been proposed to be used as a low-cost substrate for the production of ethanol [16], xanthan [17] and laccase [18,19]. Furthermore, this waste is additionally used for the production of biological active compounds [20] such as phenolic antioxidants from olive mill waste constituents, which is a viable alternative for the valorising of this problematic waste.
Olive waste is made up of olive mill wastewater and olive pomace. Olive pomace is a heterogenous solid waste of olive oil production which contains many inorganic and organic compounds, such as magnesium, sugars, calcium, potassium and different phenolic groups. These phenolic groups are bioactive compounds with antioxidants; hence, they provide nutritional properties [21]. A study conducted by Radic et al. [22] on the cellular antioxidant activity of olive pomace extract states that olive pomace is more potent compared to an equivalent dose of hydroxytyrosol and tyrosol.
For this study, three different extraction procedures were used, including maceration extraction, acid hydrolysis and alkaline hydrolysis. Although maceration extraction is one of the most common extractions used, it may not allow a complete recovery of phenolic compounds that are linked by a glycosidic or ester bond to matrix components, such as cell wall polysaccharides and lipophilic structures. Thus, to break these bonds and achieve higher recoveries, alkaline or acid hydrolysis is performed [23]. These two different hydrolysis procedures are often used in the extraction of phenolic acids from plants.
The main aim for this study was to investigate the effect of hydrolysis on the antioxidant activity of olive mill waste. Thus, phenolic extracts derived from waste pomace of monocultivar and coupage (mixed-olive) olive oil from the Maltese island were analysed for total phenolic (TPC), flavonoid (TFC) and ortho-diphenolic content (TdOPC), ferric reducing antioxidant power (FRAP), cupric reducing antioxidant power (CUPRAC), hydrogen peroxide scavenging activity, 2,2-Diphenyl-1-picrylhydrazyl (DPPH) Radical Scavenging activity, 2,2′-azino-bis(3-ethylbenzothiazoline-6-sulfonic acid) (ABTS) Radical Scavenging stabilization, and lastly, a modified method for Superoxide Radical Scavenging activity capable of working under reducing conditions.

2. Materials and Methods

2.1. Collection of Raw Material

Olive pomace was collected from different classes of olive cultivars found in the Maltese islands. The indigenous class was composed of three different cultivars, namely ‘Bidni’, ‘Malti’ and ‘Bajda’; the foreign locally grown class was composed of nine different cultivars which are commonly present in the Maltese islands, including Carolea, Frantoio, Uovo di Piccione, Cerasuola, Picholine, Coratina, Bella di Spagna, Leccino and mixed pomace.
The mixture of olive mill wastewater and olive press cake was collected at different stages of the olive oil press. A 10 L composite sample was obtained and homogenised from which 2 L of olive mill waste was used for analysis. In total, 26 samples were collected in 2 months, from 27 September 2021 till 26 November 2021. During these 2 months, the samples were collected every 2 days in a week. For the ‘Bidni’ cultivar, olive mill waste was collected through the entire olive pressing season in order to investigate the effect of maturity on the olive mill waste composition.
From the olive pomace collected, two kilos of waste material from each variety of olive waste was collected in 2 L plastic bottles, followed by filtration to separate the olive mill wastewater from the olive pomace. The olive pomace was frozen (−80 °C), followed by freeze drying. The freeze-dried material was grounded using a conventional household blender and subjected to extraction and hydrolysis procedures.

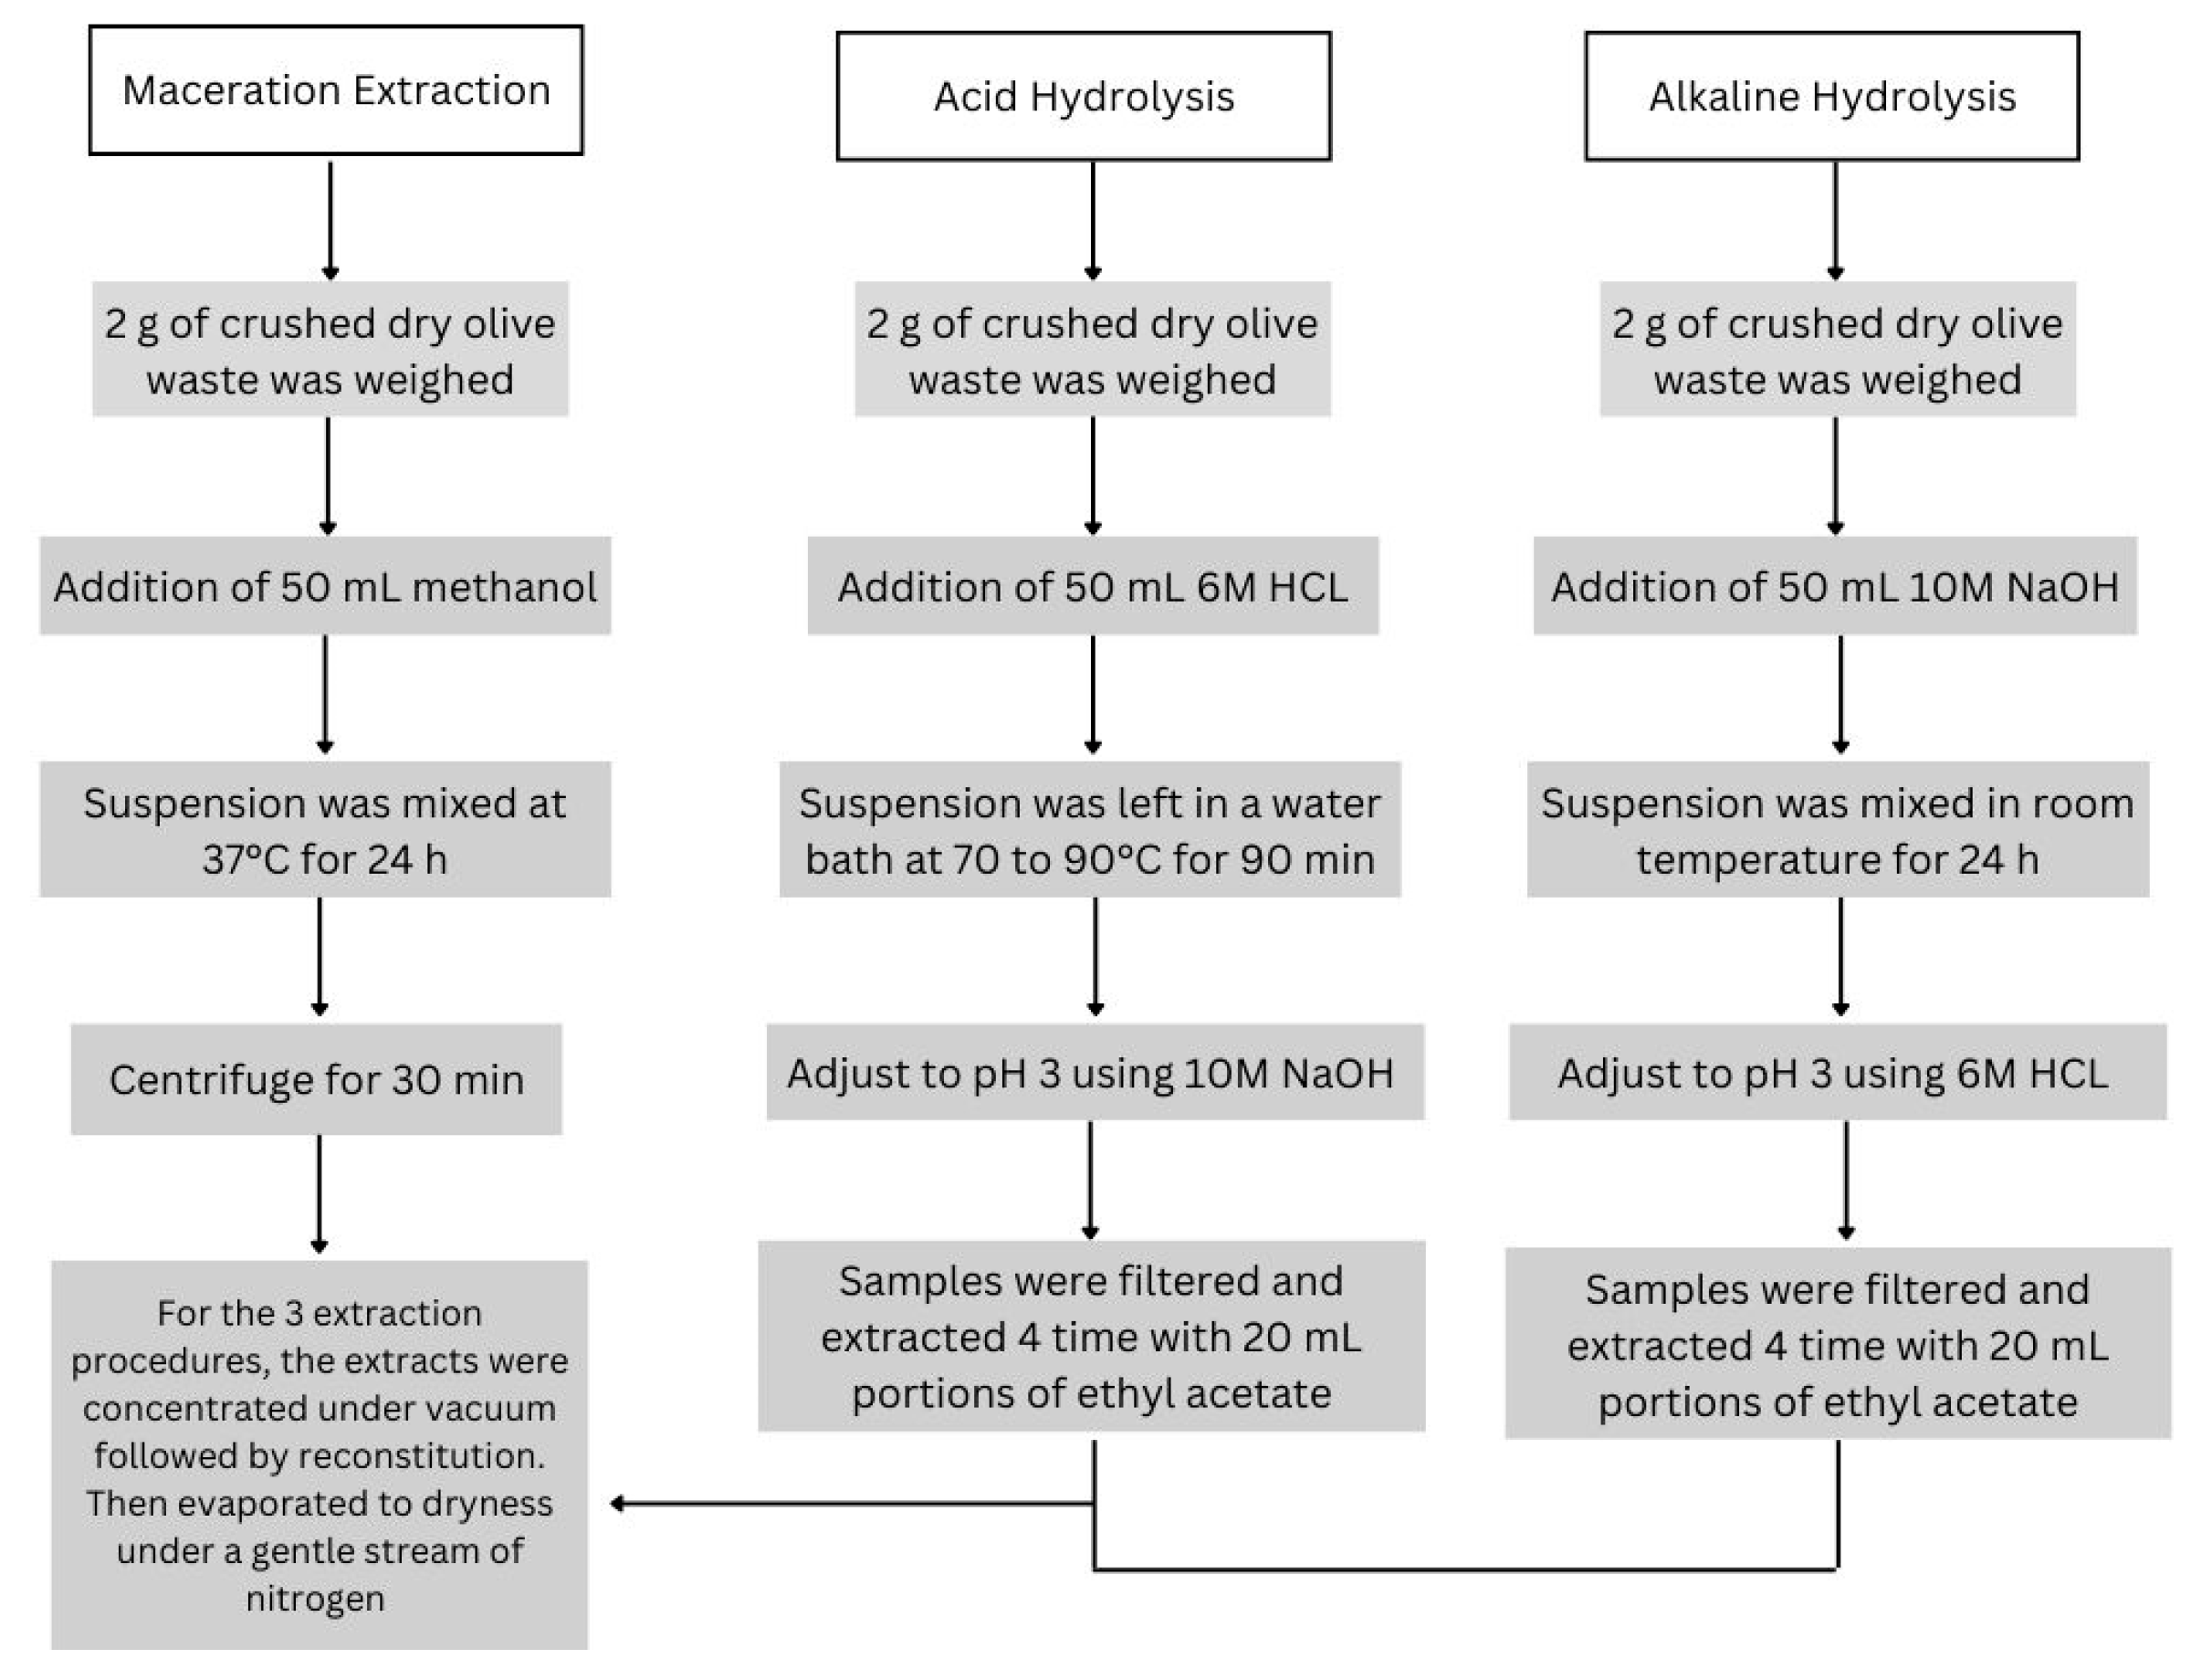
2.2. Extraction Procedure for Maceration Extraction and Hydrolysis

Figure 1 shows the three different extraction procedure used. For maceration extraction, 2 g of crushed dry olive press cake was weighed and transferred in a reagent bottle, followed by the addition of 50 mL of methanol. The suspension was mixed in a shaker incubator at 37 °C for 24 h. Afterwards, the samples were centrifuged for 30 min to separate the liquid from the solid found at the bottom of the centrifuge tube. For acid hydrolysis, 2 g of crushed dry olive press cake was weighed and transferred in a reagent bottle followed by the addition of 50 mL of 6 M HCL. The suspension was left in a water bath at a temperature of 70 °C for 90 min. By using 10 M NaOH, the pH was adjusted to pH 3. The samples were filtered and extracted 4 times with 20 mL portions of ethyl acetate. Lastly, for alkaline hydrolysis, 2 g of crushed dry olive press cake was weighed and hydrolysed at room temperature by the addition of 50 mL of 10 M NaOH. The suspension was mixed for 24 h and brought to pH 3 by the addition of 6 M HCL. The samples were filtered and extracted 4 times with 20 mL portions of ethyl acetate. For the three extraction procedures, the extracts were concentrated under a vacuum, followed by reconstitution with 5 mL of methanol and transfer to a pre-weighed test tube. The extracts were evaporated to dryness under a gentle stream of nitrogen weighed and reconstituted in 2 mL of ethanol.

2.3. Determination of Total Phenolic Content

The Folin–Ciocalteu colorimetric method by Singleton et al. [24] was used for the determination of TPC present in the olive oil waste extracts against a calibration curve made with gallic acid (Sigma-Aldrich, Saint Louis, MO, USA) with an R2 value of 0.98 and an equation of y = 0.0045x + 0.0985. For this assay, 20 μL of extract at a dilution factor of 25 was oxidised with 100 μL of previously prepared 5-fold diluted Folin–Ciocalteu reagent. The reaction was neutralised by adding 80 μL of 7.5% Na2CO3. The microtiter plate was incubated at room temperature for two h in the dark, after which the absorbance was read at 630 nm by using a microtiter plate reader (BioTek ELx800, Gen5TM, Friedrichshall, Germany).

2.4. Determination of Total Flavonoid Content

The method for TFC was determined by Mabry, Markham and Thomas [25], with minor modifications. For this assay, 25 μL of extract at a dilution factor of 10 was mixed with 10 μL of 10% aluminium chloride, 10 μL of 7% w/v sodium nitrite and 80 μL of distilled water. The microtiter plate was left at room temperature for 30 min, after which 100 μL of 1 M NaOH solution was added. The plate was shaken vigorously, and the absorbance for the reaction was recorded at 450 nm. The calibration curve was prepared by using quercetin (Sigma-Aldrich) with an R2 value of 0.94 and a regression equation of y = 0.00009x + 0.0091.

2.5. Determination of Ortho-Diphenolic Content

Arnow’s colorimetric method was used for the determination of ortho-diphenolic compounds present in the concentrated extracts [26]. A standard calibration curve was made with protocatechuic acid (Sigma-Aldrich) with an R2 value of 0.96 and a regression equation of y = 0.00009x + 0.0393. For this assay, 20 μL of extract at a dilution factor of 10 was added with 20 μL of 1M HCL in a 96-well microtiter plate. The resulting mixture was briefly mixed, followed by the addition of 20 μL of Arnow’s reagent, which was previously prepared by dissolving 10 g of sodium molybdate dihydrate and 10 g of sodium nitrite in 100 mL of ethanol–water in a ratio of 1:1. The plate was shaken vigorously, and after 15 min, 80 μL of water and 40 μL of 1M NaOH were added. The absorbance was measured at 405 nm by using a microtiter plate reader.

2.6. Determination of Cupric Reducing Antioxidant Power Assay

The reducing capacity of the extracts was determined using cupric ion reducing antioxidant capacity by Apak et al. [27]. A standard calibration curve was made with gallic acid (Sigma-Aldrich) with an R2 value of 0.97 and a regression equation of y = 0.0012x − 0.068. For this assay, 20 μL of extract at a dilution factor of 25 was added with 100 μL of 10 mM CuCl2 solution, followed by 100 μL of 1M ammonium acetate buffer at pH 7.0. An amount of 100 μL of 7.5 mM neocuproine ethanolic solution was added to the resulting solution, and the reaction was allowed to proceed for 30 min, after which the absorbance at 405 nm was recorded.

2.7. Determination of Ferric Reducing Antioxidant Power Assay

Ferric reducing antioxidant power (FRAP) was determined using a spectrophotometric method previously described by Benzie and Strain [28]. The FRAP assay is based on the ability of phenols to reduce Fe3+ to Fe2+. This assay is conducted in an acidic medium in order to maintain iron solubility. At low pH, the ionization potential that drives the hydrogen atom transfer decreases, whereas the redox potential increases. When the Fe3+ to Fe2+ reduction occurs in the presence of 2,4,6-trypyridyl-s-triazine (TPTZ), it forms a colour complex of Fe2+ which produces an intense blue colour [29]. A standard calibration curve was made with ascorbic acid (Sigma-Aldrich) with an R2 value of 1.0 and a regression of y = 0.0005x + 0.399. For this assay, the FRAP reagent was prepared by mixing 25 mL of 300 mmol/L acetate buffer, 2.5 mL of 10 mmol/L TPTZ solution dissolved in 300 mmol/L HCL and 2.5 mL of 20 mmol/L FeCl3 solution in a 10:1:1 ratio. An amount of 10 μL of extract at a dilution factor of 25 was mixed with 200 μL of FRAP reagent, and the contents were mixed vigorously. Ferric tripyridyltriazine (FeIII-TPTZ) complex is reduced to ferrous tripyridyltriazine (FeII-TPTZ) form in the presence of antioxidants and develops an intense blue colour, with an absorption of 630 nm.

2.8. Determination of DPPH (2,2-Diphenyl-1-picrylhydrazyl) Radical Scavenging Activity

DPPHRadical Scavenging activity of the extracts was determined using Rahman et al.’s [30] method, with minor modifications. To determine the Radical Scavenging activity of phenolic compounds derived from olive waste, a stock solution of 60 μM DPPH was prepared daily in methanol, and the solution was kept in the dark at 4 °C. An amount of 50 μL of the phenolic concentrated stock solution was added into the well, and it was further diluted down to the lowest concentration by performing a serial two-fold dilution in a 96-well microtiter plate. A row of negative DPPH controls was added in the same 96-well microtiter plates by adding 50 μL of methanol into each well. An amount of 150 μL of methanolic DPPH was added into each well, and the reaction was allowed to proceed for 30 min in the dark. The absorbance was measured at 560 nm using a microtiter plate reader.

2.9. Determination of ABTS (2,2′-Azino-bis(3-ethylbenzothiazoline-6-sulfonic Acid) Radical Cation Stabilisation

ABTSRadical Scavenging activity of the extracts was determined using Rajurkar and Hande’s [31] method. The ABTS radical cation was produced by mixing a 7 mM stock solution of ABTS with 2.45 mM of potassium persulfate. This mixture was left to stand in the dark at room temperature for 12 h before use. The concentration of the blue-green ABTS radical solution was adjusted with methanol to an absorbance of 0.700 at 734 nm. An amount of 50 μL of the phenolic concentrated stock solution was added into the well, and it was further diluted down to the lowest concentration by performing a serial two-fold dilution in a 96-well microtiter plate. A row of negative ABTS controls was added in the same 96-well microtiter plate by adding 50 μL of methanol into each well. An amount of 280 μL of ABTS radical solution was added into each well, and the reaction was incubated for 5 min at 30 °C. The absorbance was measured at 450 nm using a microtiter plate reader.

2.10. Determination of Hydrogen Peroxide Scavenging Activity

The method described by Mukhopadhyay et al. [32] was used, but slight modifications were made. A standard calibration curve was made with ascorbic acid (Sigma-Aldrich) with an R2 value of 0.96 and a regression of y = 0.0053x + 0.2351. The scavenging activity was measured using 25 μL of 1 mM iron(II)sulphate, after which 150 μL of dilution factor 100 extract was added. The plate was shaken vigorously, followed by the addition of 63 μL of 50 mM hydrogen peroxide. After 5 min, 150 μL of 1 mM 1,10-phenanthroline was added. After 10 min, the absorbance was read at 490 nm.

2.11. Modified Alkaline DMSO (Dimethyl Sulfoxide) Assay with Nitroblue Tetrazolium for Superoxide Radical Scavenging Activity

The Superoxide Radical Scavenging activity was determined using alkaline DMSO. This new assay overcomes the problems associated with the reduction of NBT (nitro blue tetrazolium chloride) by the extracts. For this assay, 50 μL of extract at a dilution factor of 10 was added into the well, and it was further diluted down to the lowest concentration by performing a serial two-fold dilution in a 96-well microtiter plate. Then, 200 μL of alkaline DMSO was added, followed by 0.7 mM of FeCl3 and 10 μL of DMPD (dimethyl-4-phenylenediamine). The microtiter plate was radiated for 5 min under UV-B light and shaken vigorously using a microtiter plate shaker. The absorption was measured at 450 nm.

2.12. IC50 Calculations

In order to work out the IC50’s for DPPH, ABTS and superoxide scavenging activity, plots of percentage of Radical Scavenging, percentage of ABTS inhibition and percentage of superoxide scavenging against concentration were plotted for each sample. For all three assays, the absorbance was corrected by the blank in order to find the true absorbance value for all triplicates. This was followed by working out the percentage of Radical Scavenging, percentage of ABTS inhibition and percentage of superoxide scavenging:
%   R a d i c a l S c a v e n g i n g = A B S D P P H i n m e t h a n o l A B S D P P H w i t h s a m p l e A B S D P P H   i n   m e t h a n o l × 100
%   A B T S   i n h i b i t i o n = 100 100 A B S s a m p l e ( A B S C o n t r o l )
%   S u p e r o x i d e   S c a v e n g i n g = A B S S u p e r o x i d e i n m e t h a n o l A B S S u p e r o x i d e w i t h s a m p l e A B S S u p e r o x i d e i n m e t h a n o l × 100
Afterwards, an average was calculated for the triplicate percentages, and the standard deviation was worked out. The IC50’s were expressed as the concentration under which 50% of ABTS, DDPH and superoxide radical were scavenged.

2.13. Data Analysis

For each sample, all parameters were determined in triplicate. All absorbances were corrected against a blank. The IBM® SPSS® Statistics Version 24 software (Armonk, NY, USA) was used for all data analysis. Normality tests carried out using both Shapiro–Wilk’s test and the Kolmogorov–Smirnov test revealed that the data did not follow a normal distribution; thus, a Kruskal–Wallis ANOVA test was selected as the non-parametric test for pairwise comparisons between the different treatments, with significant comparisons having a p-value less than 0.05. A non-parametric test was done by using Spearman’s Rho correlation to measure the strength of association between two variables.

3. Results

3.1. Phenolic Content

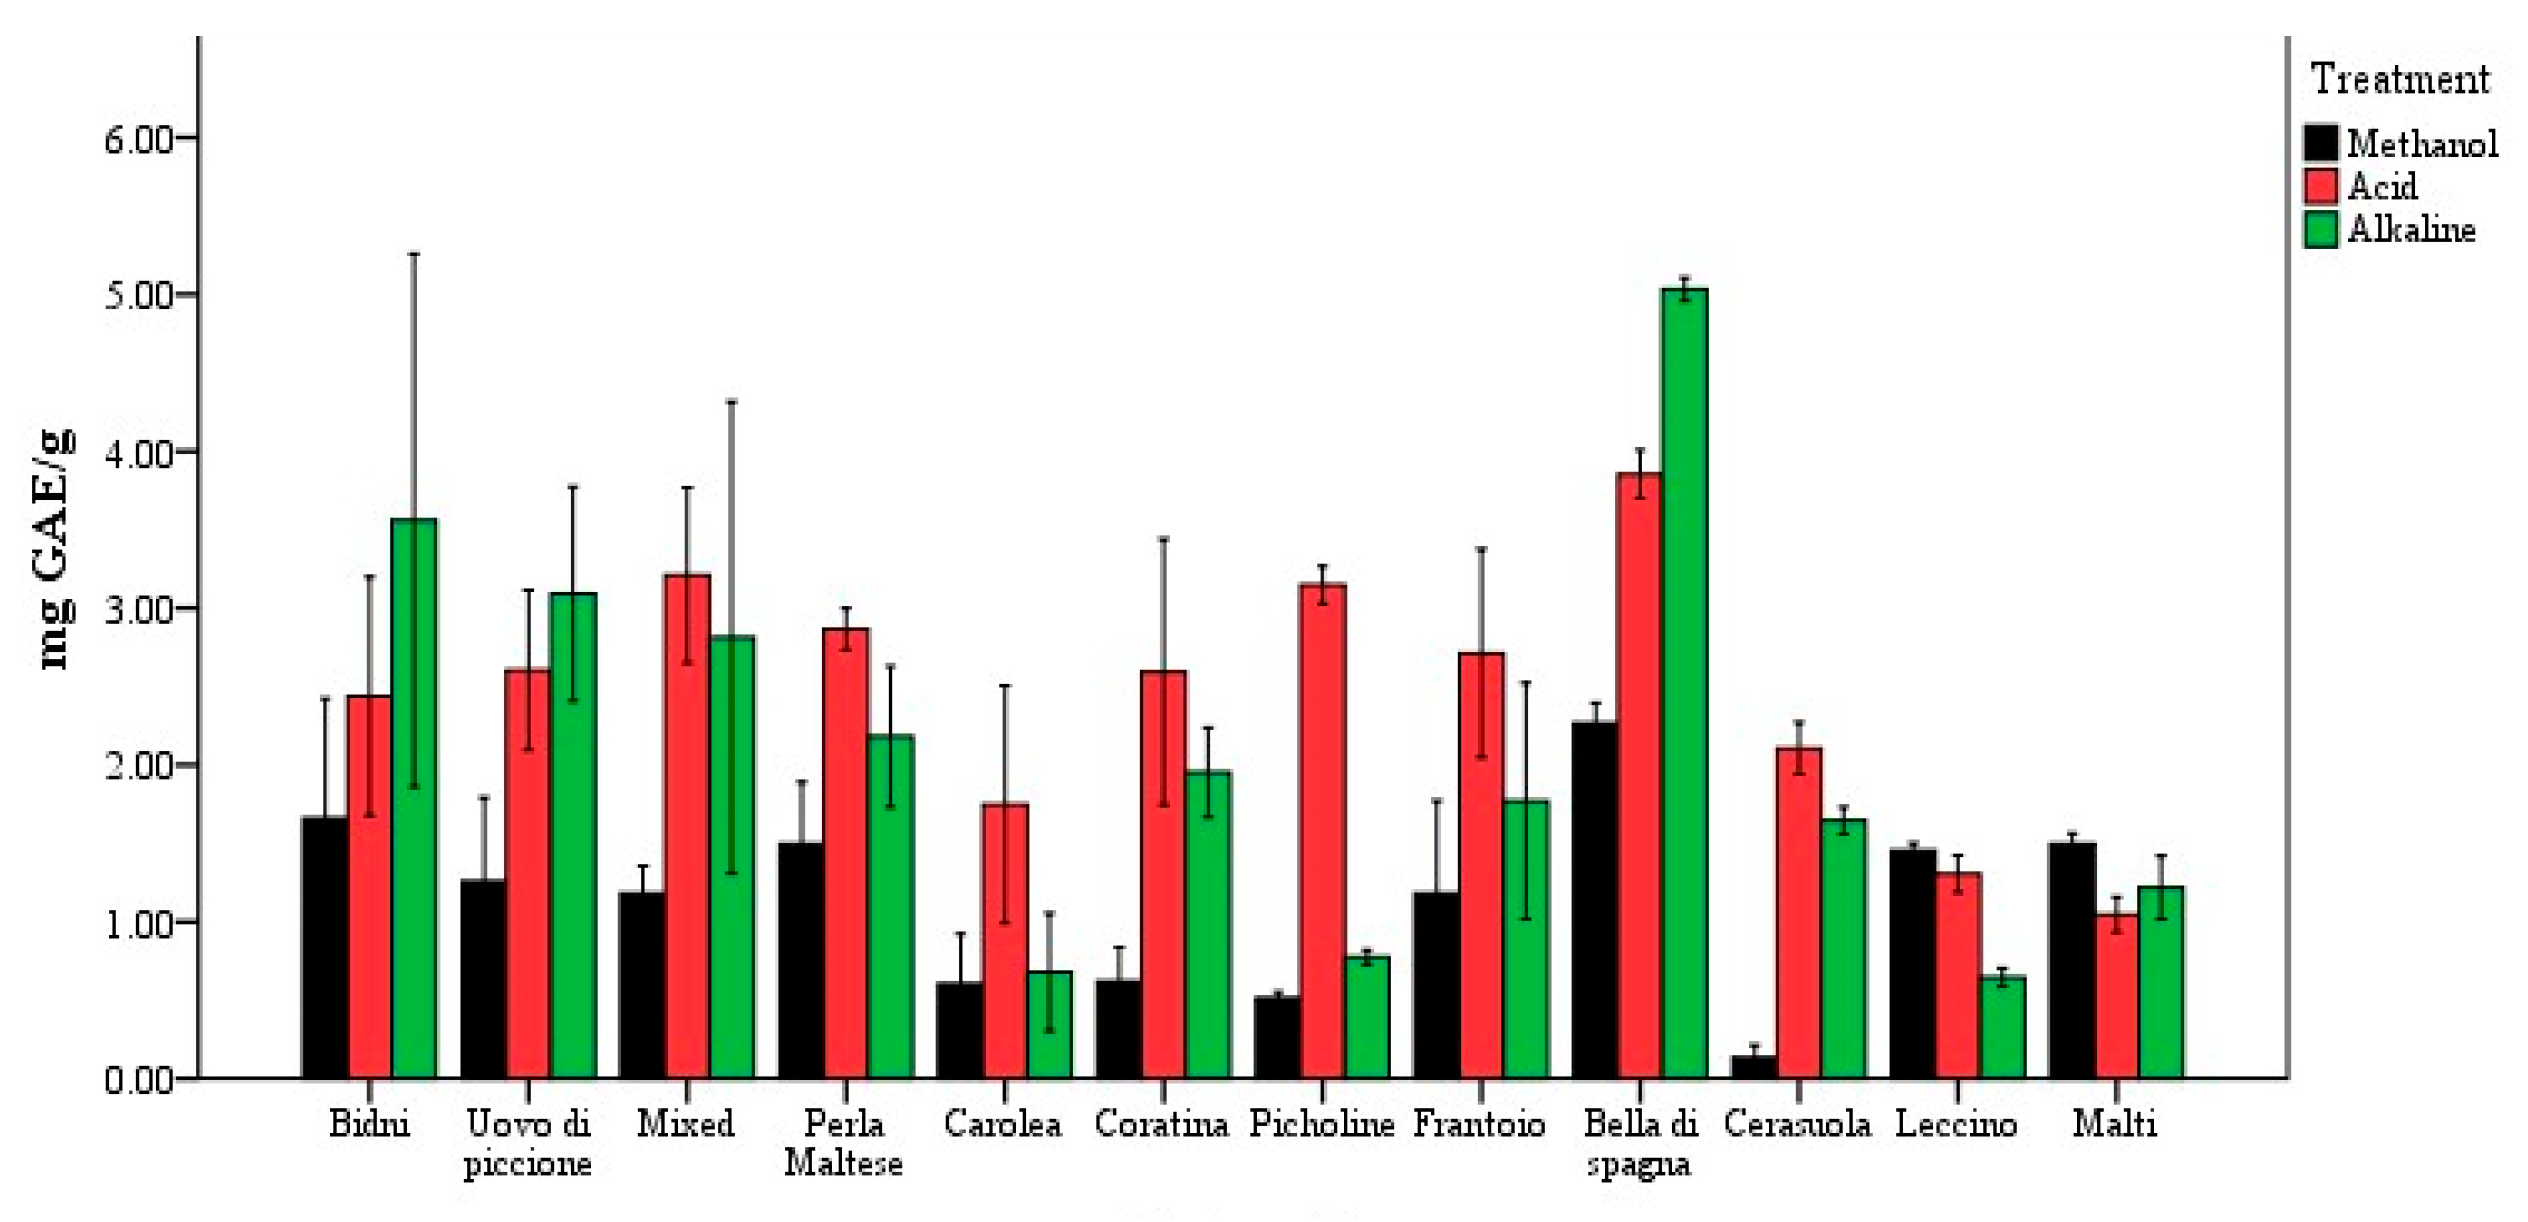
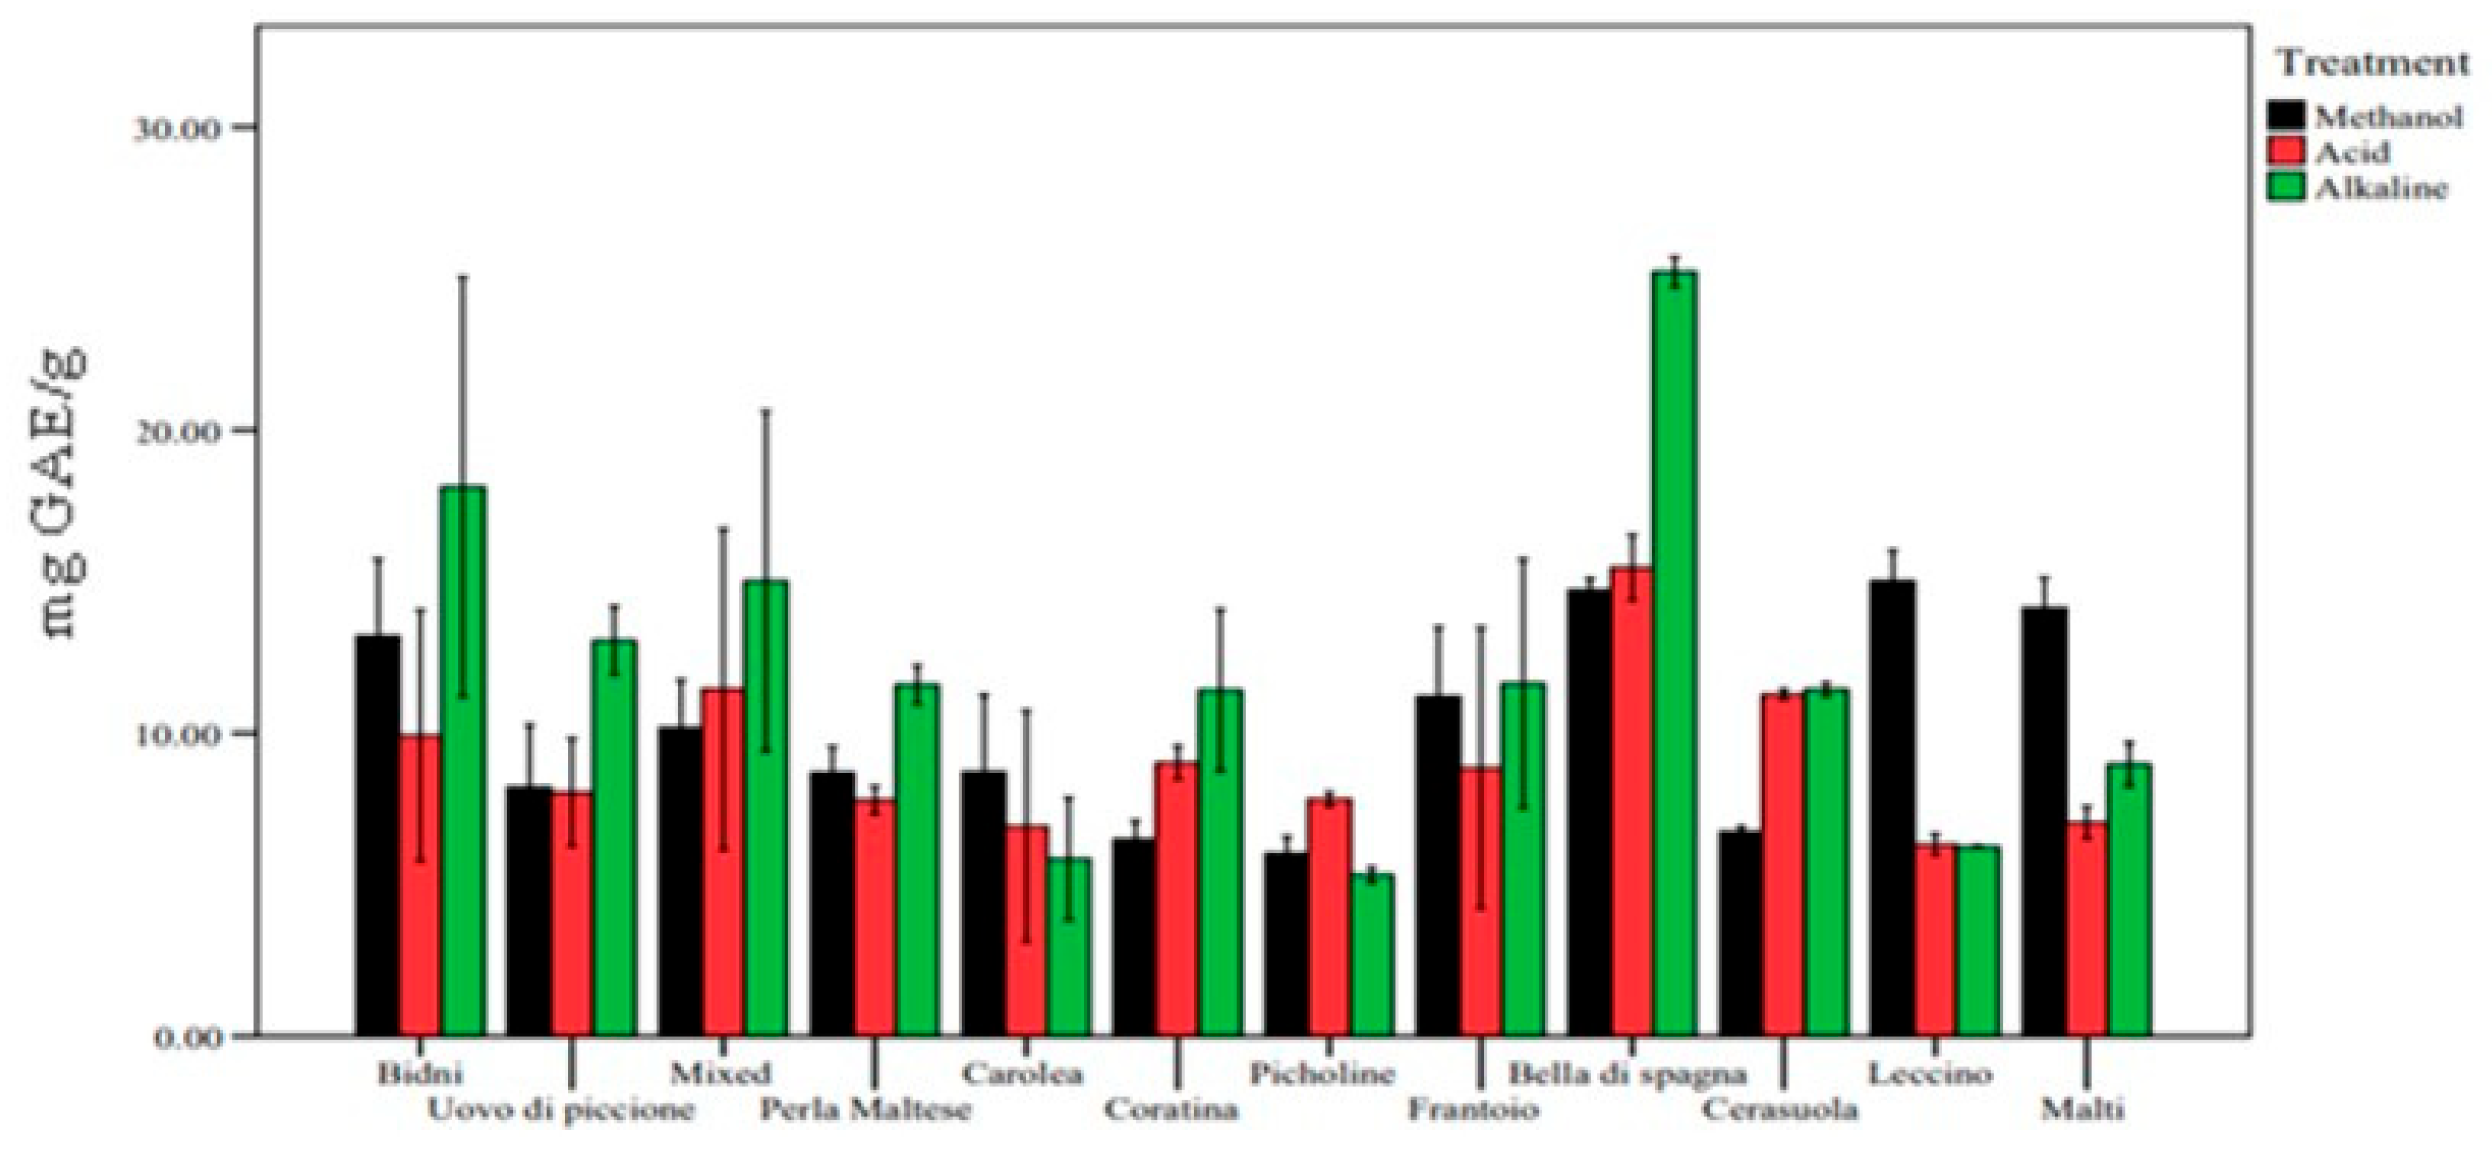
3.1.1. Total Phenolic Content

Figure 2 shows that the highest TPC was found in the hydrolysed extracts, followed by the macerated extracts. For all extraction procedures used, the highest concentration of TPC was found in the cultivar of Bella di Spagna (alkaline: 5.03 ± 0.08, acid: 3.58 ± 0.15 and maceration: 2.27 ± 0.13), whereas the lowest concentration of TPC was found in Leccino in alkaline hydrolysis (0.68 ± 0.06), ‘Malti’ in acid hydrolysis (1.05 ± 0.11) and lastly, Picholine in macerated extracts (0.51 ± 0.34). All concentrations were expressed in mg GAE/g (gallic acid equivalent).

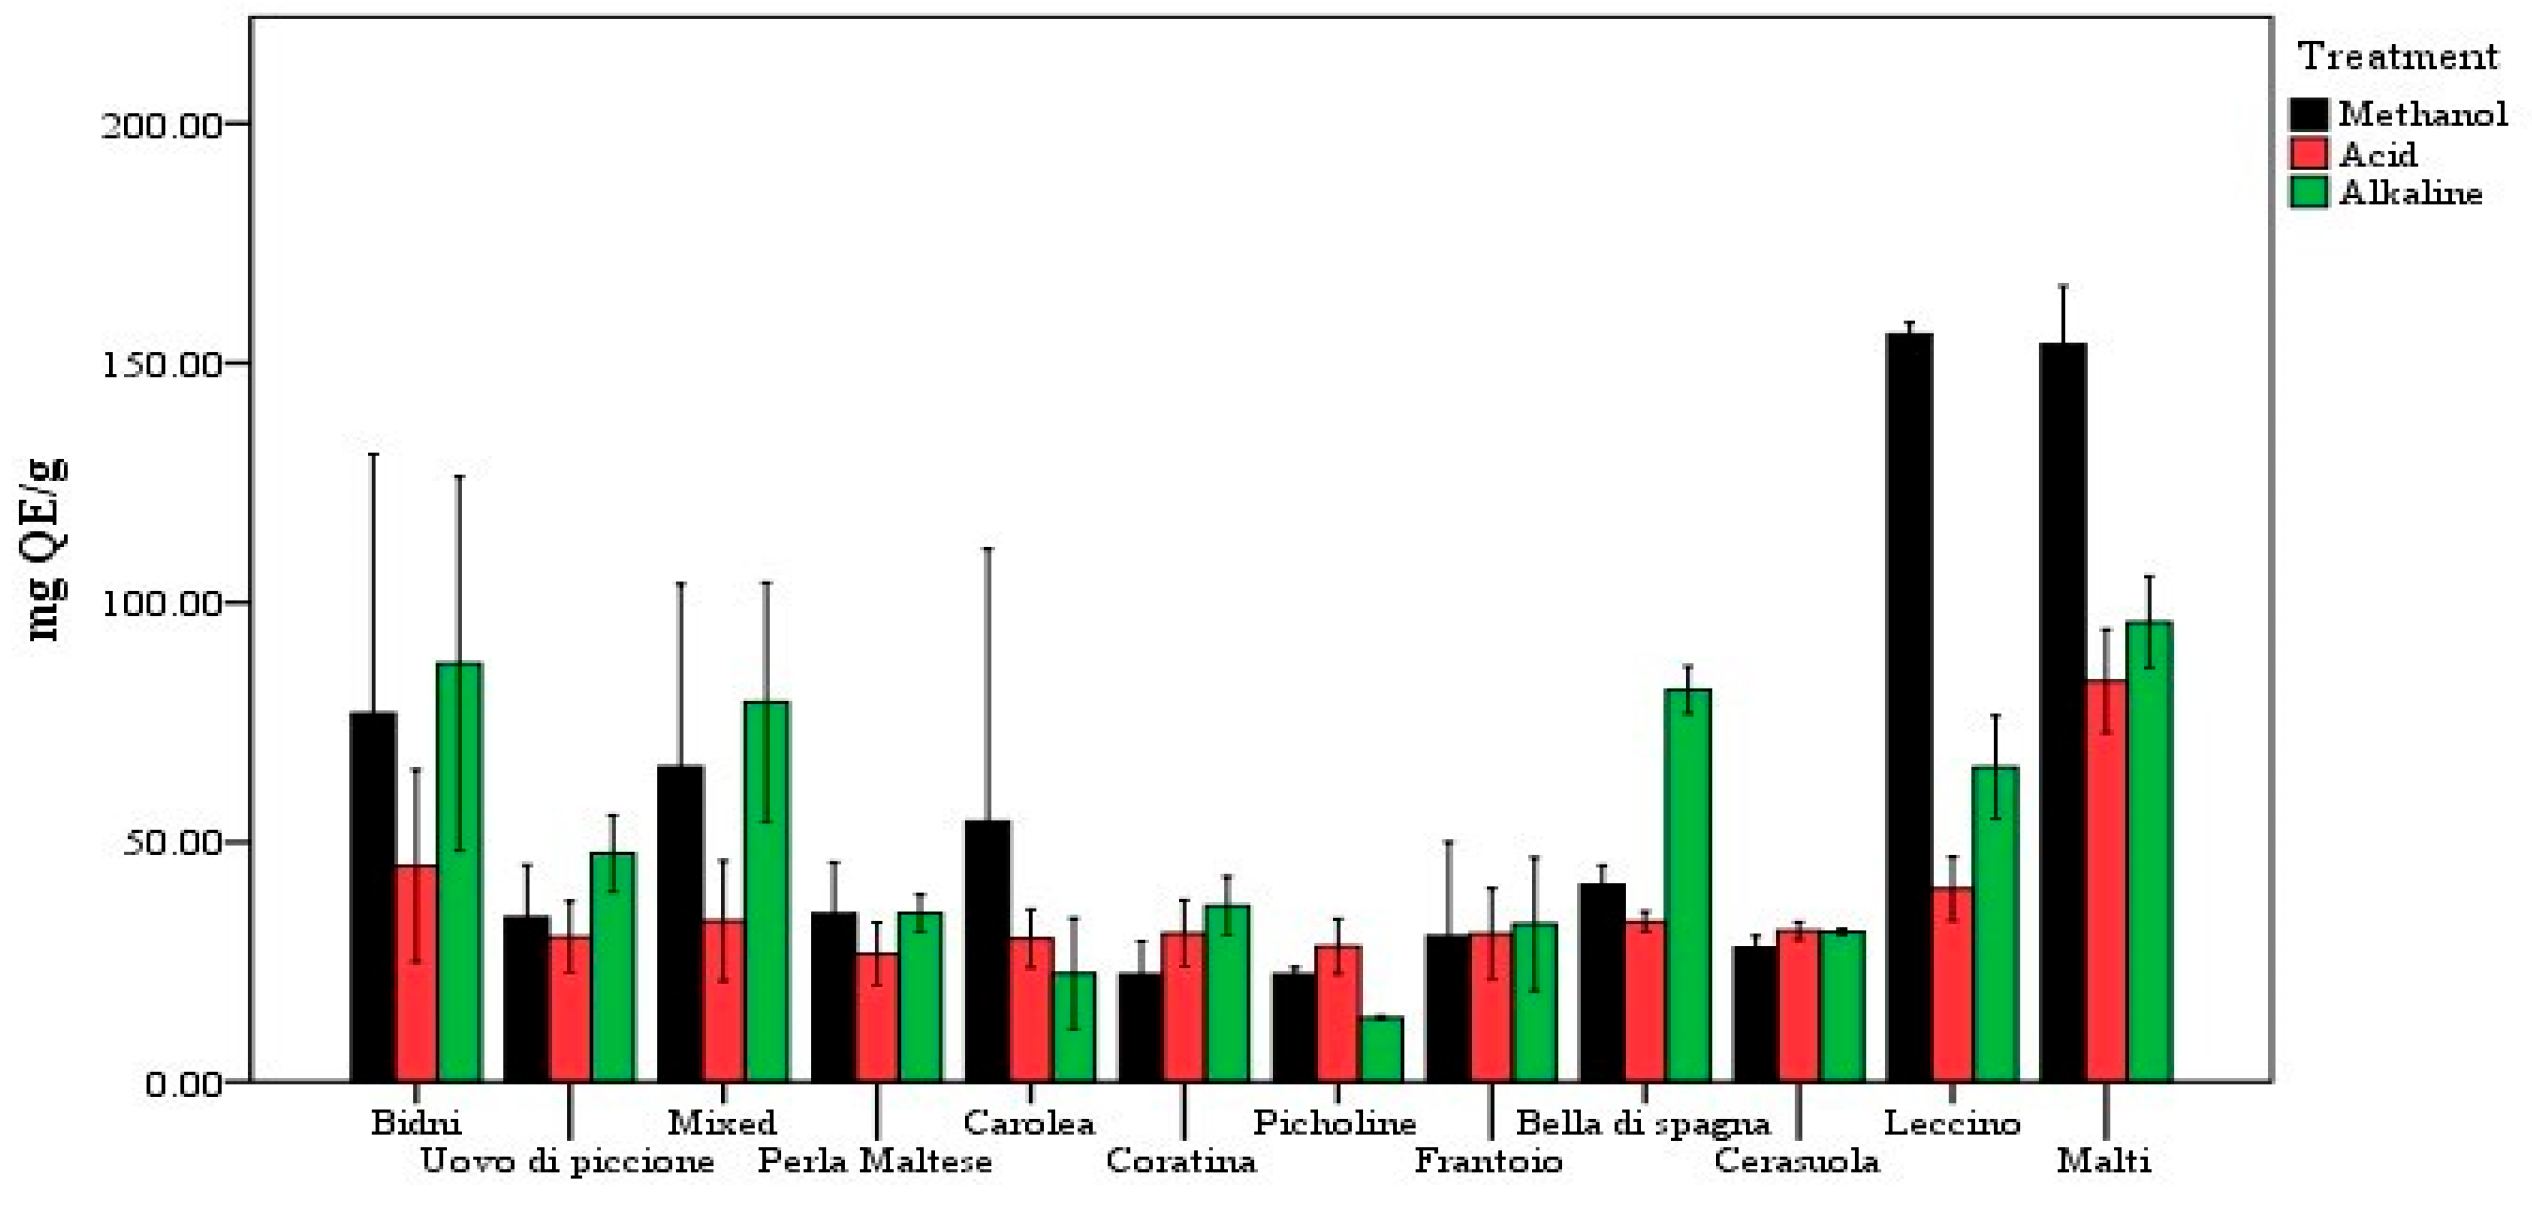
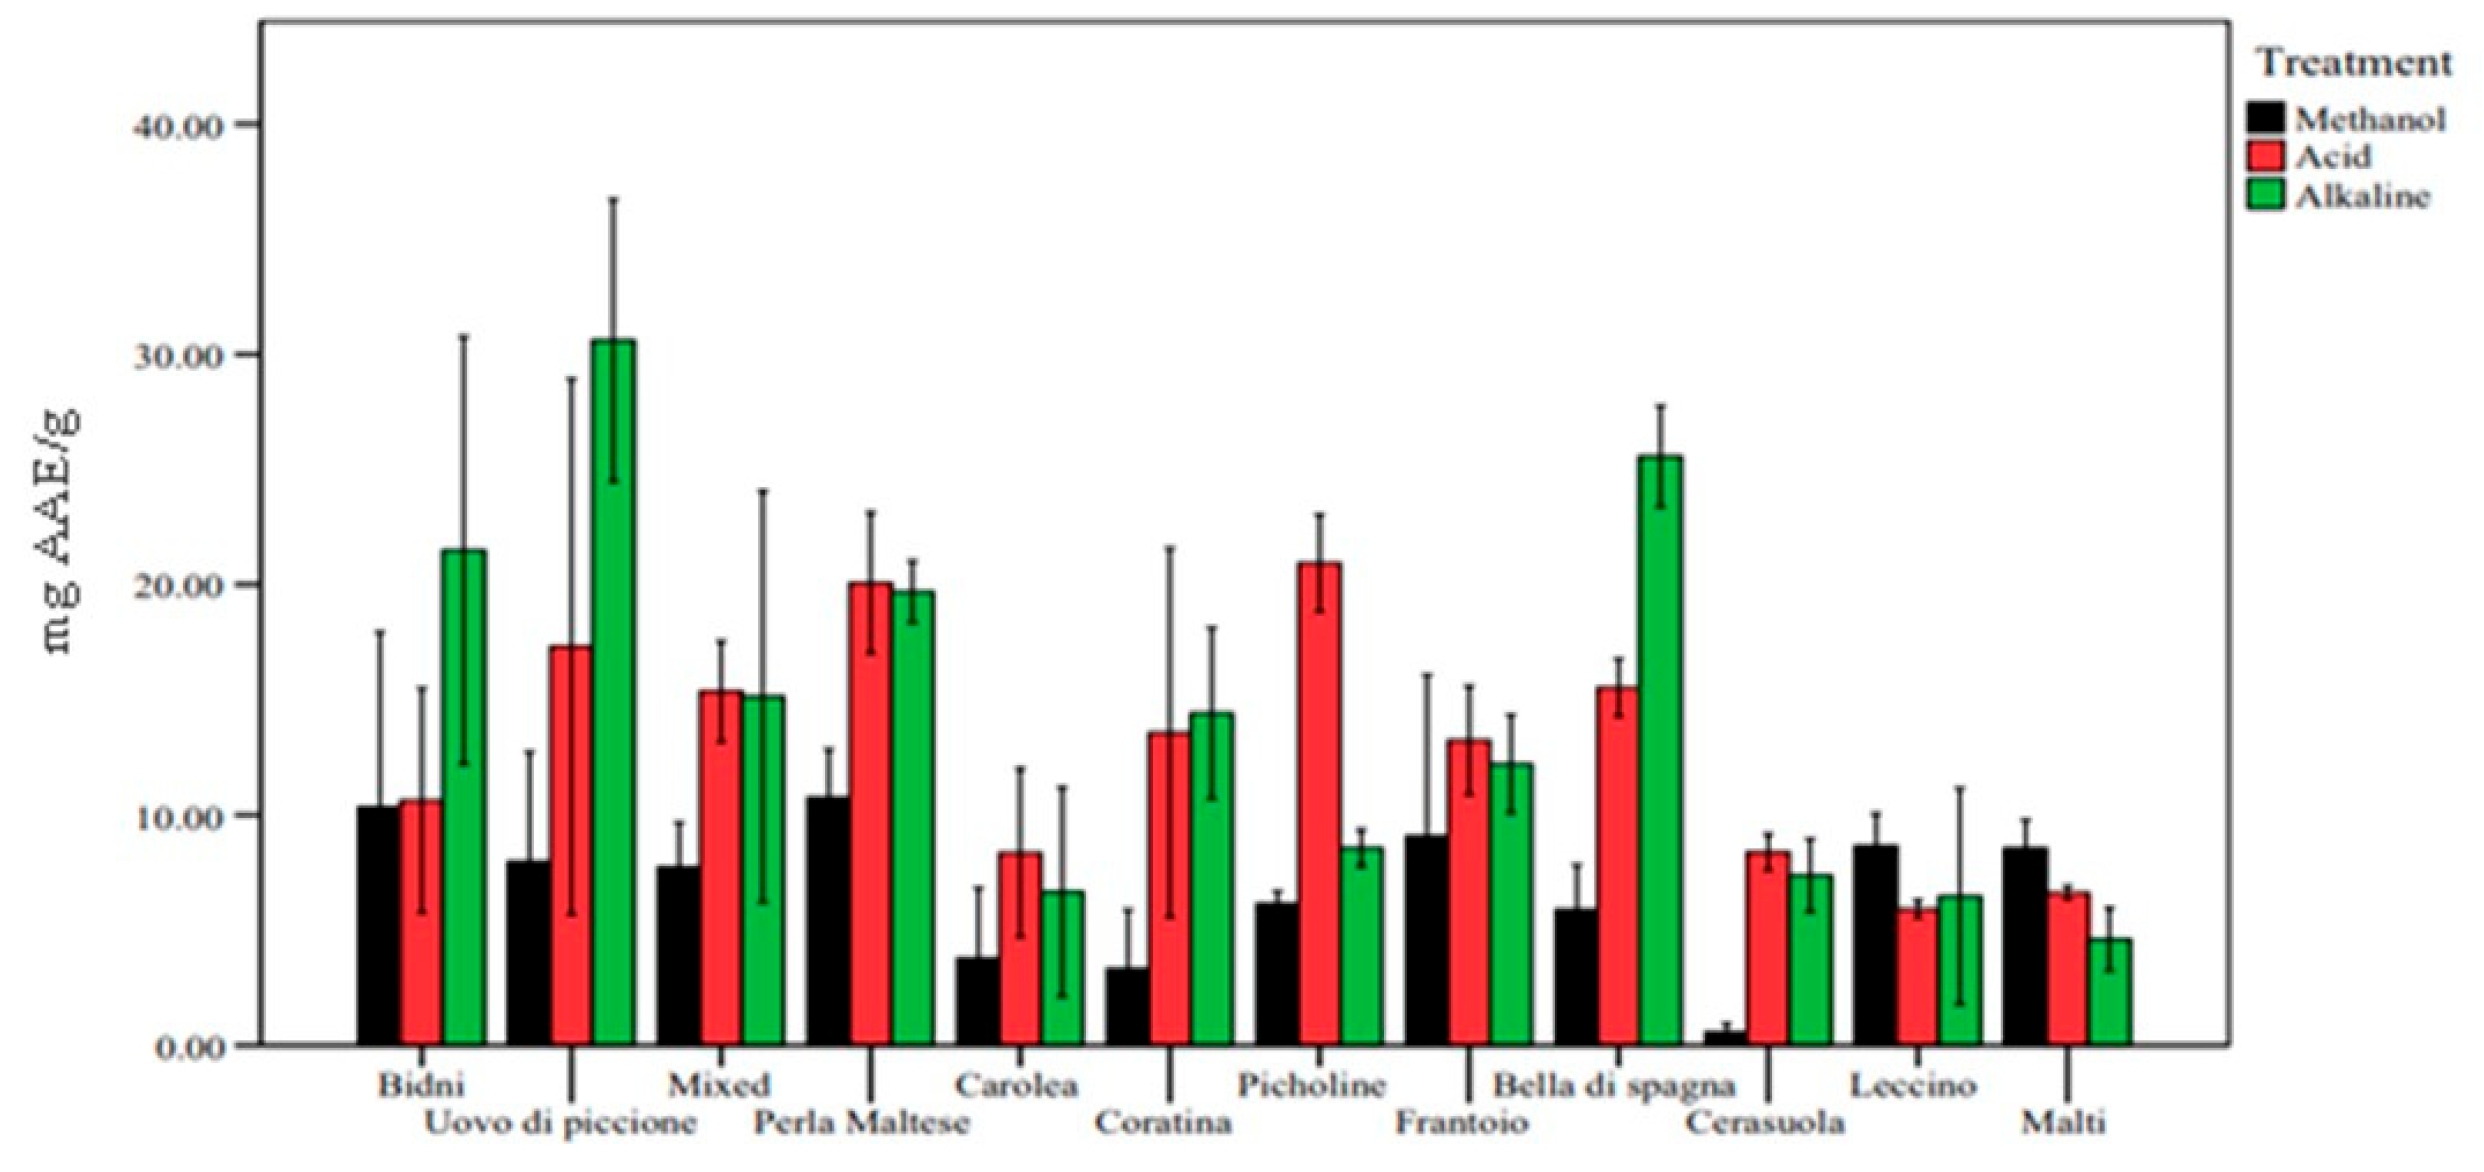
3.1.2. Total Flavonoid Content

Figure 3 shows that methanol macerated extracts had the highest TFC. In fact, the highest concentration was found in methanolic-derived extracts obtained from the cultivar of Leccino (155.97 ± 2.44), and the lowest was found in Picholine (22.42 ± 1.48), whereas for alkaline and acid hydrolysis, the highest concentration was found in the Maltese cultivar ‘Malti’ (alkaline: 95.92 ± 9.56 and acid: 83.62 ± 10.75). The lowest concentration in alkaline hydrolysis was found in Picholine (13.36 ± 0.41), whilst the lowest concentration for acid hydrolysis was found in the cultivar of ‘Bajda’ (26.70 ± 1.32). All concentrations were expressed in mg QE/g (Quercetin equivalent).

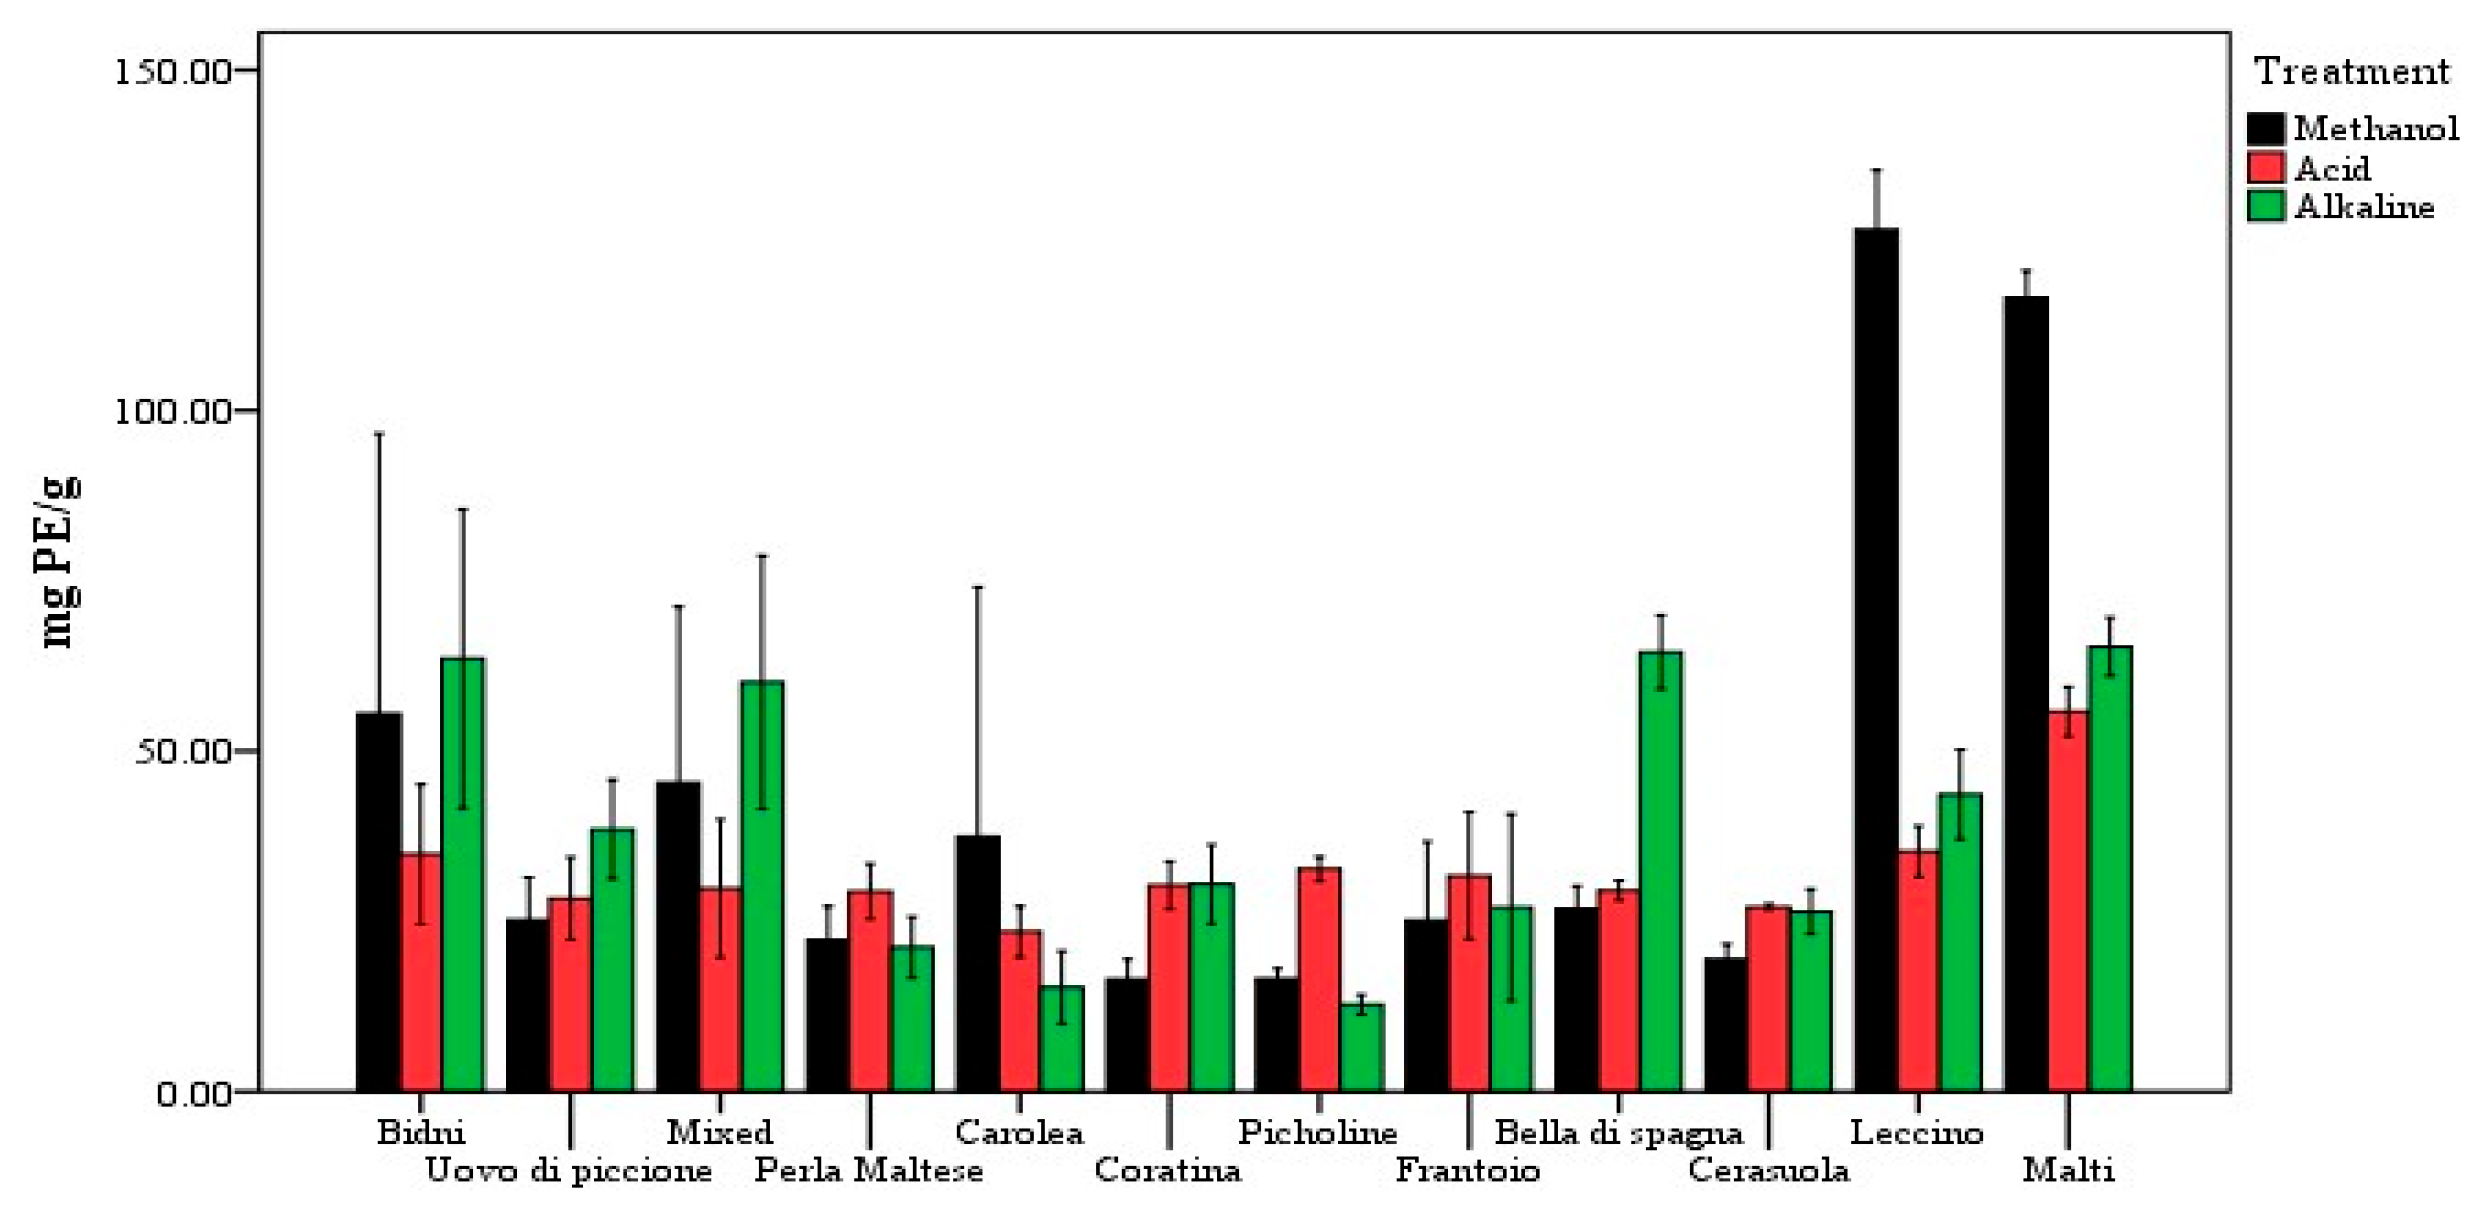
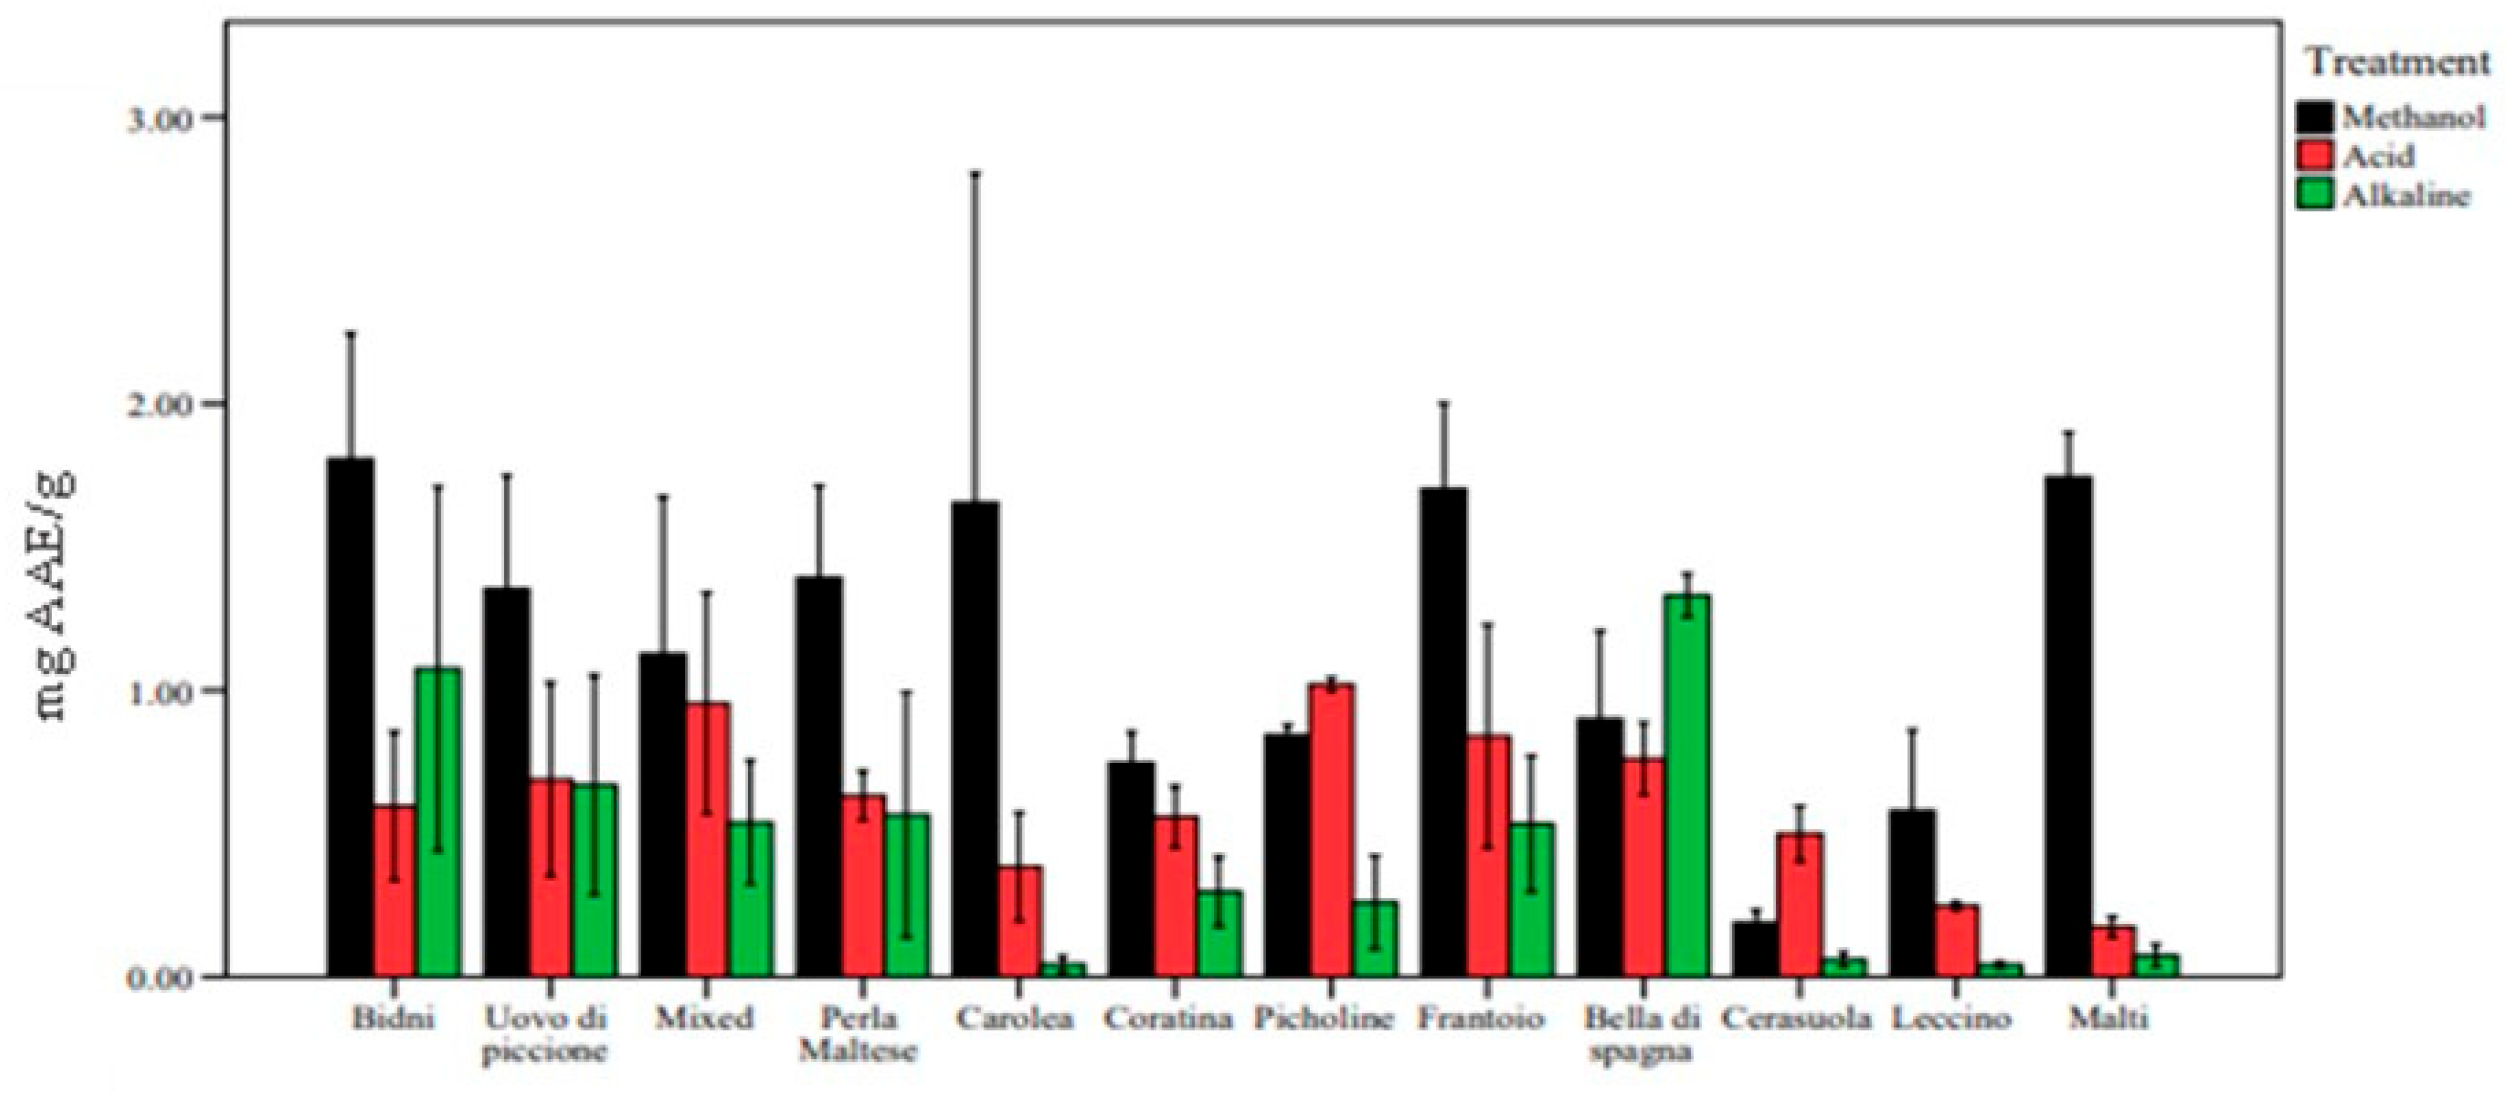
3.1.3. Total Ortho-Diphenolic Content

Figure 4 shows that the highest concentration of TdOPC was found in macerated extracts, followed by alkaline- and acid-hydrolysed extracts. In fact, the highest concentration of TdOPC in macerated extracts was found in Leccino (126.519 ± 8.80), whilst the lowest concentration was found in Coratina (16.50 ± 2.73). This was followed by the hydrolysed extracts, in which the cultivar of ‘Malti’ had the highest concentration of TdOPC for both acid and alkaline hydrolysis (acid: 55.81 ± 3.64 and alkaline: 65.31 ± 4.30). The lowest concentration was found in Picholine for alkaline hydrolysis (12.80 ± 1.45) and in Carolea for acid hydrolysis (27.53 ± 2.64). All concentrations were expressed in mg PE/g.

3.1.4. Changes in Phenolic Content with Maturity

Maturity of olives was one of the factors that affected the phenolic content in the olive pomace samples. Figure 5 shows the effect of maturity, which was analysed on four different ‘Bidni’ cultivars which were collected in different stages of olive maturation. Results indicate that the concentration of TPC increased by maturation up till November. However, it decreased rapidly once the olives became highly mature. For TFC and TdOPC, as the olive fruit became more mature, the concentration of both TFC and TdOPC also increased. In fact, the highest concentration was found in November (16 November 2021) whilst the lowest was seen in September (29 September 2021).

3.2. Antioxidant Activity

3.2.1. Radical Scavenging Activity against DPPH and ABTS

Percentage of DPPH Radical Scavenging activity against concentration graphs can be found in Supplementary Materials Figure S1 for alkaline-derived extracts, Figure S2 for acid-derived extracts and Figure S3 for methanol-derived extracts. IC50s are quoted in Table 1 Results show that alkaline hydrolysis had the highest antioxidant activity compared with acid hydrolysis and macerated extracts. In fact, the lowest IC50 for alkaline hydrolysis was found in Uovo di piccione (4 October 2021) with a value of 0.16 ± 0.03, whilst the highest was found in Carolea (17 November 2021) with a value of 5.00 ± 0.72. For acidic hydrolysis, the lowest IC50 was found in Coratina (27 September 2021) with a value of 0.31 ± 0.04, whilst the highest was found again in Carolea (17 November 2021) with a value of 7.79 ± 0.81. Lastly, for macerated extracts, the lowest IC50 was found in the Maltese cultivar ‘Bidni’ (2 November 2021) with a value of 1.11 ± 0.24, whereas the highest was found in Carolea (7 October 2021) with a value of 8.76 ± 1.03. The IC50 concentrations were expressed in mg/mL.
ABTS radical cation stabilization assay against concentration graphs can be found in Supplementary Materials Figure S4 for alkaline-derived extracts, Figure S5 for acid-derived extracts and Figure S6 for methanol-derived extracts. IC50s are quoted in Table 2 Results show that acidic hydrolysis had the highest antioxidant activity; in fact, it had the lowest IC50 of 0.03 ± 0.02, found in the cultivar of Uovo di piccione (7 October 2021), whilst the highest IC50 was found in Frantoio (27 September 2021) with a value of 574.30 ± 510.34. Alkaline hydrolysis also had a relatively low IC50 of 0.05 ± 0.01 in the cultivar of Cerasuola, whereas the highest IC50 was again found in Frantoio (27 September 2021), with a value of 247.11 ± 71.83. Lastly, macerated extracts had the lowest IC50 in the Maltese cultivar ‘Bidni’ (16 November 2021), with a value of 0.27 ± 0.09, whilst the highest was found in the same Maltese cultivar ‘Bidni’, which was collected in an earlier stage of olive maturation (26 October 2021). This cultivar had an IC50 of 1837.88 ± 39.51. The concentrations were expressed in μg/mL.

3.2.2. Metal Ion Reducing Activity

The highest metal ion reducing activity for FRAP and CUPRAC assays were both found in alkaline hydrolysis. Figure 6 shows that CUPRAC under both acidic and alkaline hydrolysis, Bella di Spagna had the highest concentration (acid: 15.47 ± 1.09 and alkaline: 25.22 ± 0.49), whilst the lowest reducing activity was found in Leccino (acid: 6.33 ± 0.36 and alkaline: 5.33 ± 0.25). For methanolic extracts, the highest reducing activity was found in Leccino (15.02 ± 1.01) and the lowest was found in Picholine (6.032 ± 0.56). CUPRAC reducing activity was expressed in mg GAE/g (gallic acid equivalent).
As shown in Figure 7 the highest reducing activity in FRAP for alkaline hydrolysis was found in the cultivar of Uovo di piccione (30.60 ± 4.91), whilst the lowest reducing activity was found in the Maltese cultivar ‘Malti’ (4.60 ± 1.36). For acidic hydrolysis, the highest reducing activity was found in Picholine (20.93 ± 2.12) and the lowest was found in Leccino (5.91 ± 0.38). Lastly, for the macerated extracts, the highest reducing activity was found in ‘Bajda’ (Perla Maltese) (10.74 ± 0.87) whilst the lowest concentration was found in Cerasuola (0.57 ± 0.39). FRAP reducing activity was expressed in mg AAE/g (ascorbic acid equivalent).

3.2.3. Hydrogen Peroxide and Superoxide Radical Scavenging

Figure 8 shows that macerated extracts had the highest concentration of hydrogen peroxide scavenging activity, followed by acid and alkaline hydrolysed extracts. For maceration extraction, the highest scavenging activity was found in the Maltese cultivar ‘Bidni’ (1.81 ± 0.41), whilst the lowest H2O2 scavenging activity was found in Cerasuola (0.19 ± 0.04). The highest scavenging activity for acid hydrolysis was found in the cultivar of Picholine (1.02 ± 0.02), whilst the lowest was found in the Maltese cultivar ‘Malti’ (0.18 ± 0.04). Lastly, for alkaline hydrolysis, the highest scavenging activity was found in Bella di Spagna (1.33 ± 0.08) whilst Leccino had the lowest concentration of 0.043 ± 0.01. All concentrations were expressed in mg AAE/g (ascorbic acid equivalent).
Percentage of Superoxide Radical Scavenging against concentration graphs can be found in Supplementary Materials Figure S7 for alkaline-derived extracts, Figure S8 for acid-derived extracts and Figure S9 for methanol-derived extracts. IC50s are quoted in Table 3 Results show that alkaline hydrolysis had the highest antioxidant activity; in fact, it had the lowest IC50 of 0.28 ± 0.35, found in the cultivar of Carolea (17 November 2021), whilst the highest IC50 was found in the mixed cultivar (2 October 2021) with an IC50 of 23.86 ± 4.26. Macerated extracts also had a relatively low IC50 of 2.46 ± 1.77 in the cultivar of ‘Bidni’ (29 September 2021). The highest IC50 was also found in the ‘Bidni’ cultivar, but in this case, the sample was collected in November (26 October 2021), when the olive fruit tends to be more mature. For this cultivar, the IC50 was 44.79 ± 9.10. Lastly, acid hydrolysed extracts had the lowest IC50 in the cultivar of Carolea (7 October 2021) with a value of 3.36 ± 0.92, whereas the highest IC50 was found in ‘Bidni’ (26 October 2021) with a value of 36.68 ± 2.12. The concentrations were expressed in mg/mL.

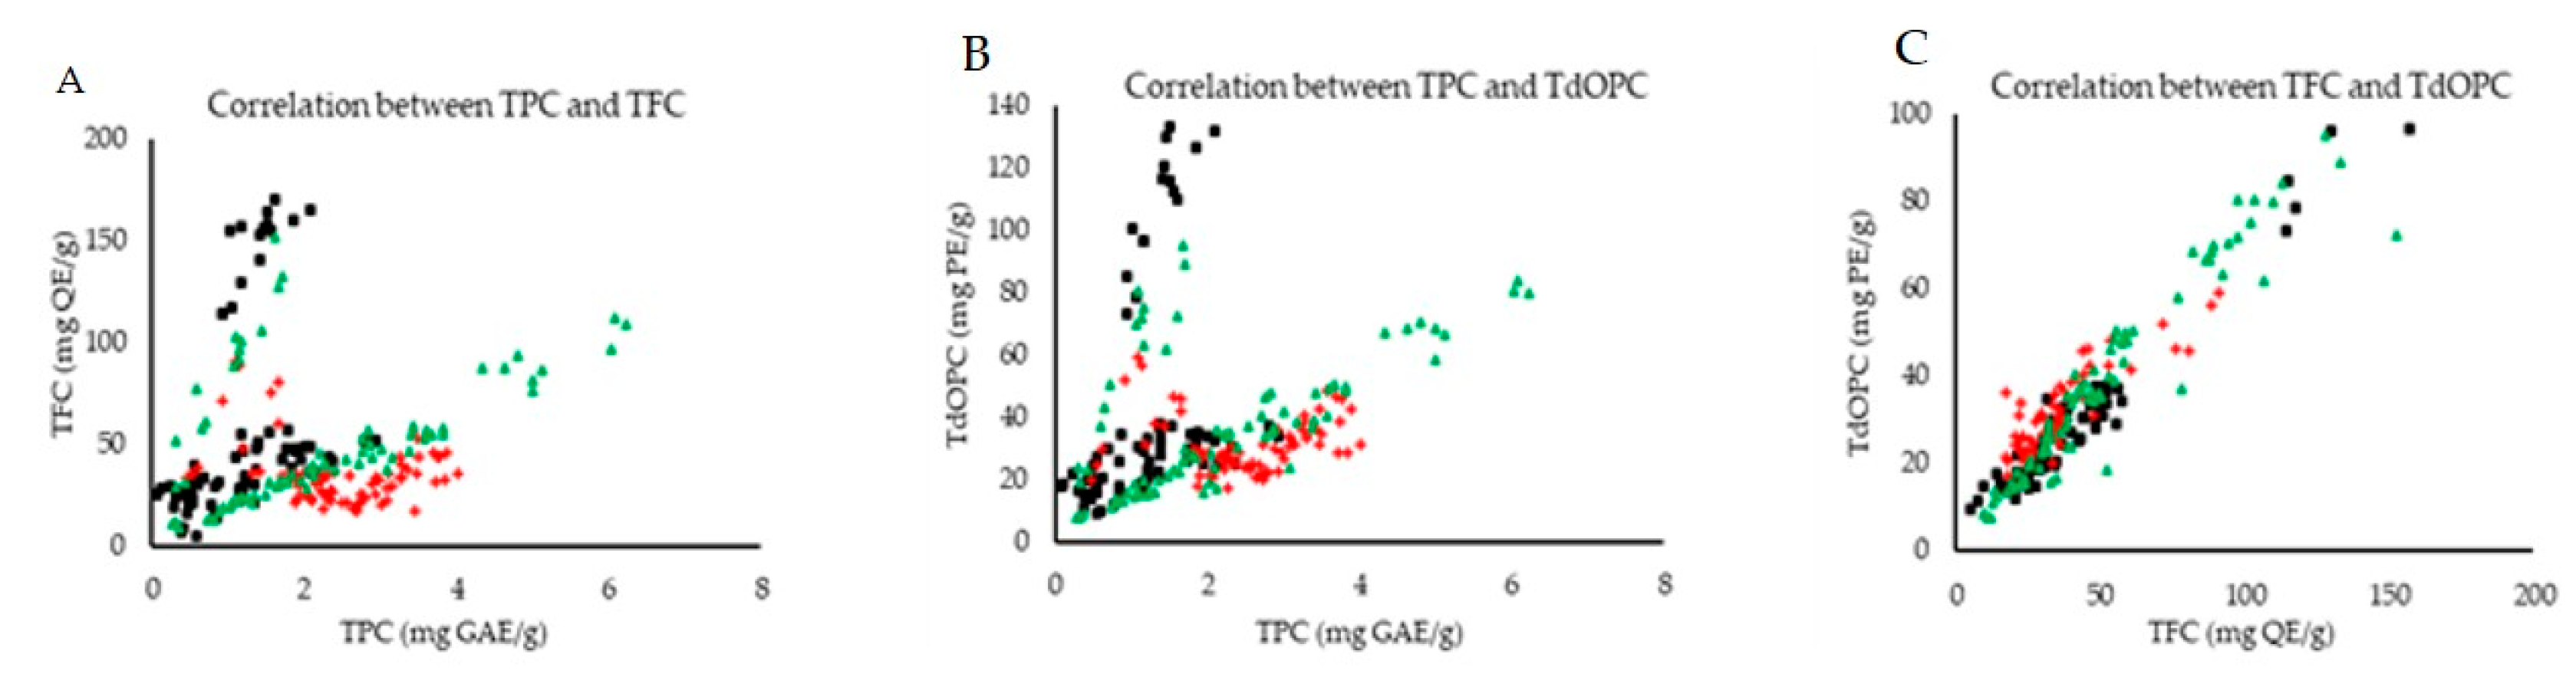
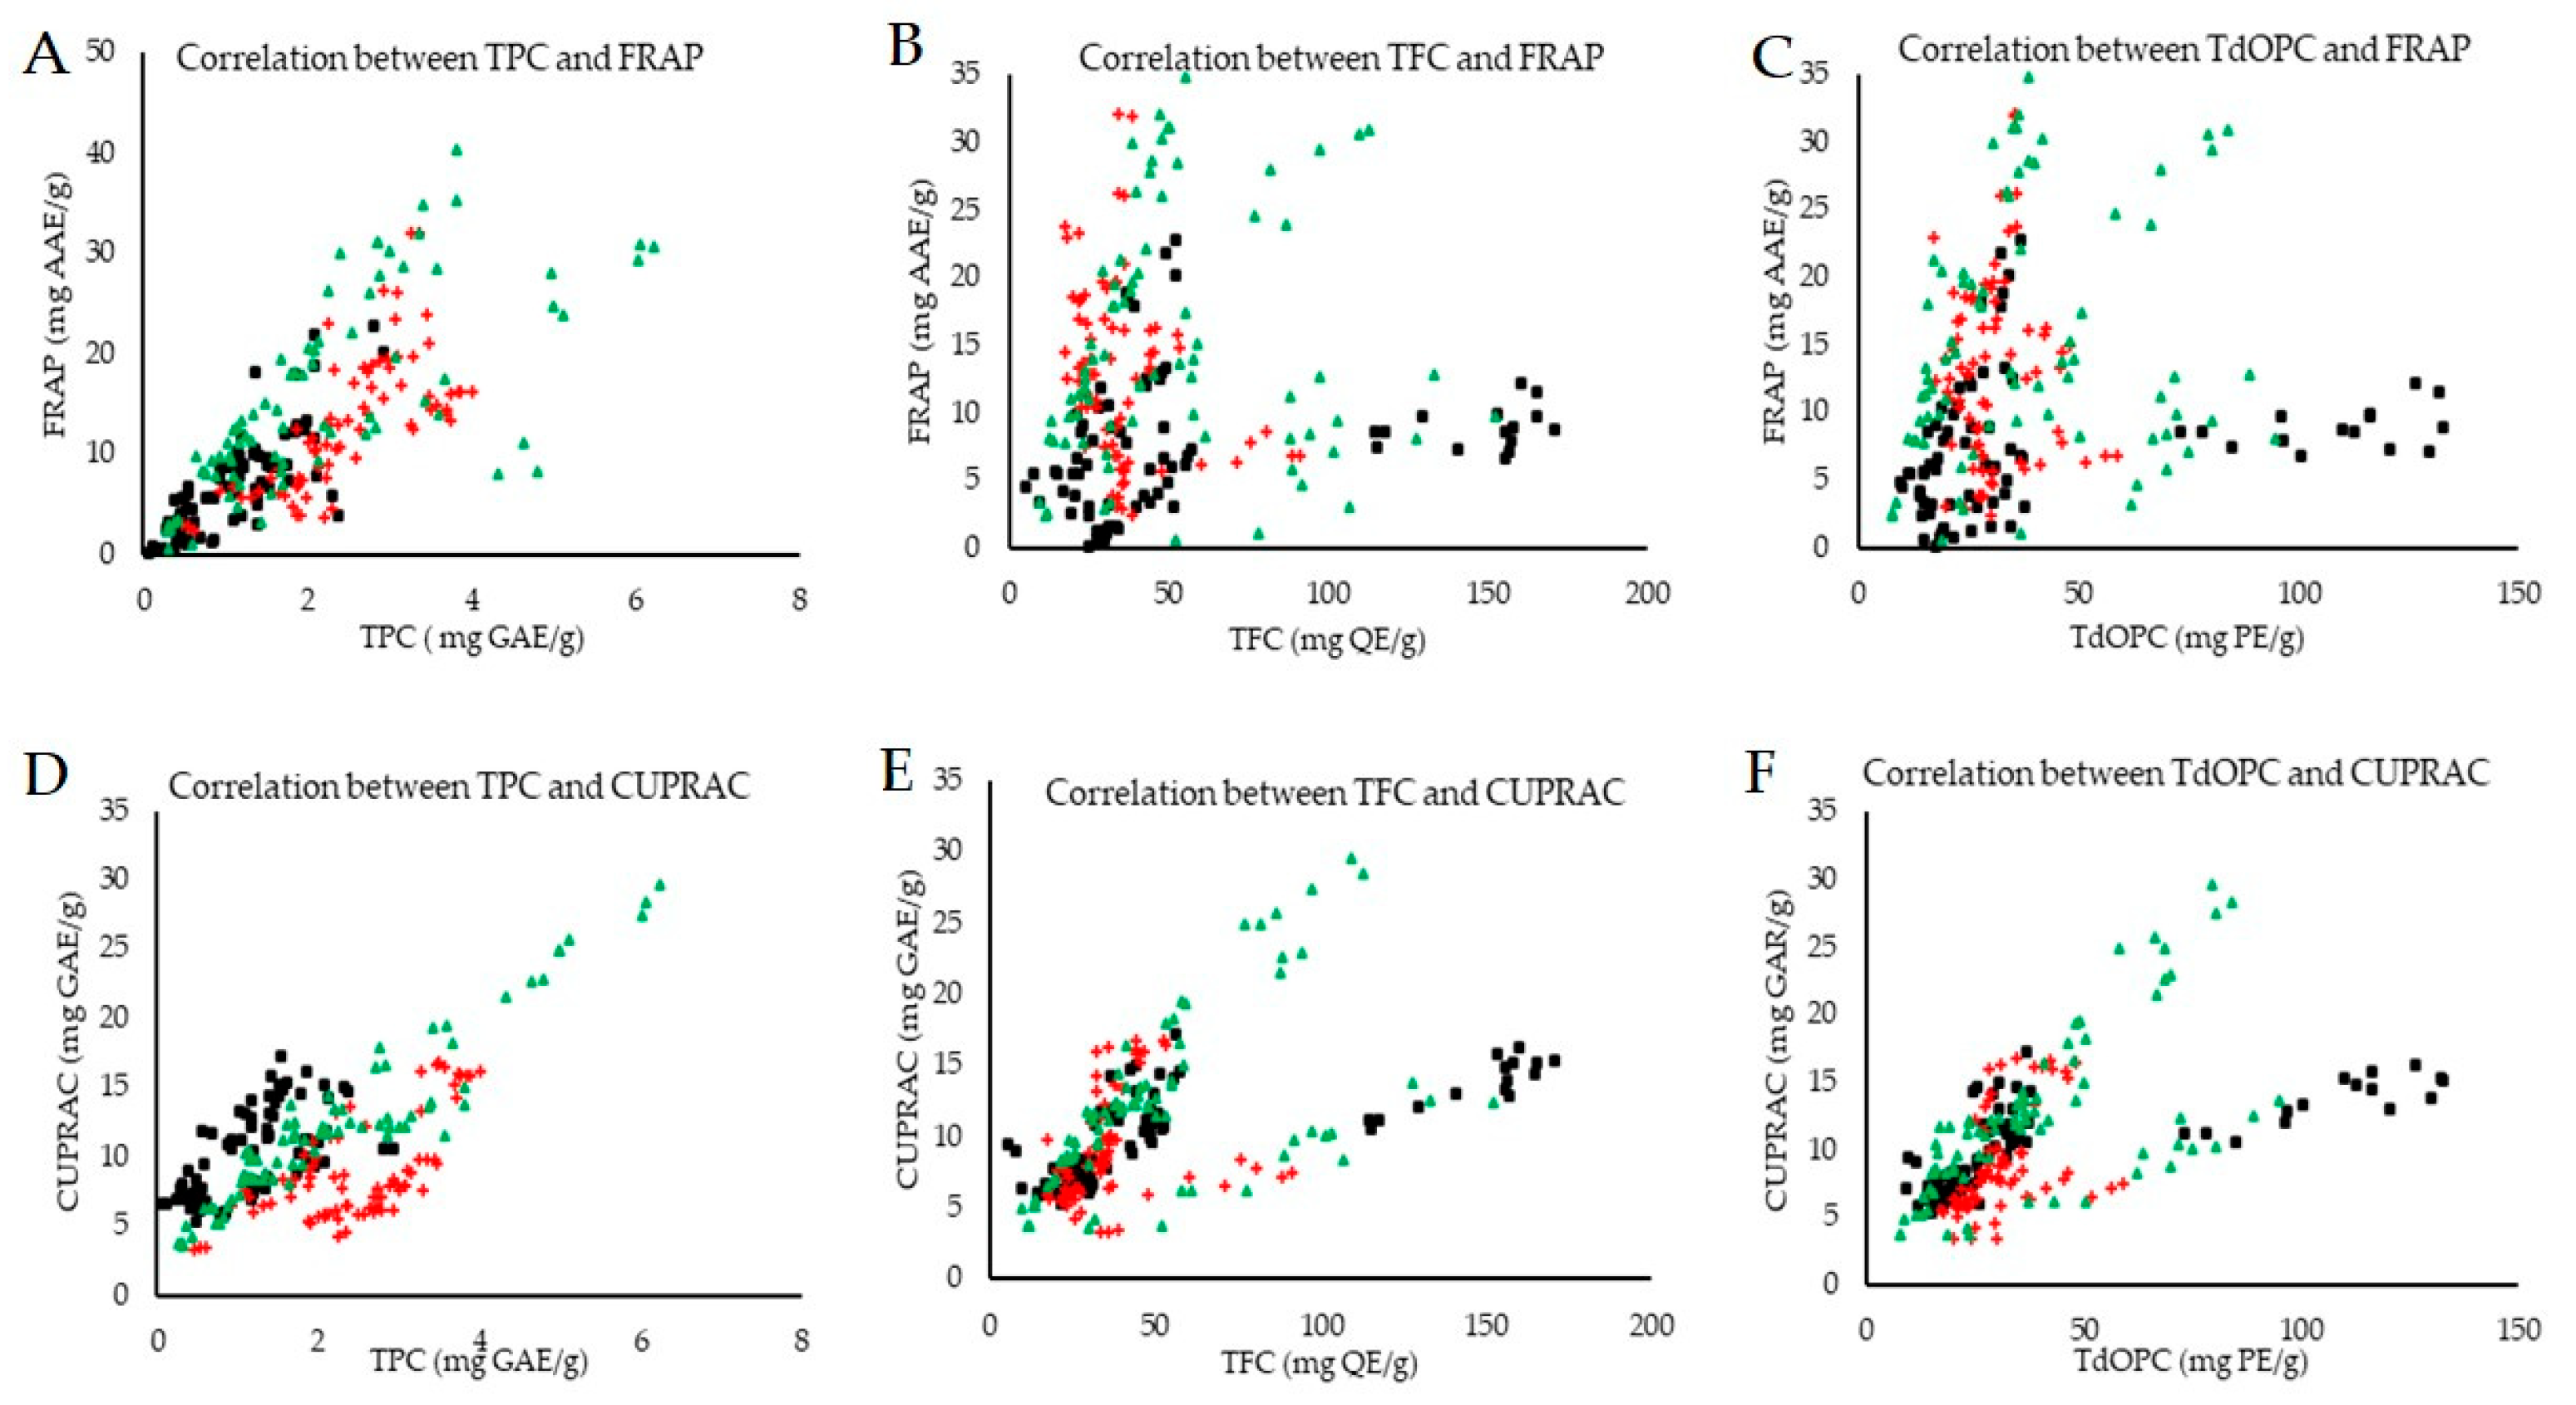
3.3. Correlation Analysis

3.3.1. Correlation between TPC, TFC and TdOPC

Figure 9 shows the correlations observed between TPC, TFC and TdOPC. It was found that TPC had a significant strong positive correlation with TFC in alkaline hydrolysis and in macerated extracts, with a ρ of 0.51 and 0.67, respectively, whereas for acidic hydrolysis, there was no significant correlation with TFC observed. TPC and TFC also significantly positively correlated with TdOPC in all extraction procedures (TPC: alkaline-ρ = 0.57, acid-ρ = 0.23, maceration-ρ = 0.67 and TFC: alkaline-ρ = 0.96, acid-ρ = 0.77, maceration-ρ = 0.95).

3.3.2. Correlation between TPC, TFC and TdOPC with Metal Ion Reducing Assays (FRAP and CUPRAC)

Figure 10 shows the correlation between TPC, TFC and TdOPC with FRAP and CUPRAC. It was found that TPC significantly positively correlated with both FRAP and CUPRAC in all extraction procedures (FRAP: alkaline-ρ = 0.76, acid-ρ = 0.80, maceration-ρ = 0.78 and CUPRAC: alkaline-ρ = 0.93, acid-ρ = 0.57, maceration-ρ = 0.69). In the case of TFC and TdOPC, it was found that macerated and alkaline hydrolysed extracts showed a significant positive correlation with FRAP (TFC: macerated-ρ = 0.45, alkaline-ρ = 0.22 and TdOPC: macerated-ρ = 0.46, alkaline-ρ = 0.25), whereas for acid hydrolysis, there was no significant difference observed. However, CUPRAC significantly positively correlated with TFC and TdOPC in all extraction procedures (TFC: alkaline-ρ = 0.63, acid-ρ = 0.48, maceration-ρ = 0.84 and TdOPC: alkaline-ρ = 0.69, acid-ρ = 0.58 and macerated-ρ = 0.83).

3.3.3. Correlation between ABTS and DPPH Radical Scavenging Activity with TPC, TFC and TdOPC

The correlation of different phenolic classes with DPPH and ABTS showed a significant negative correlation with TPC in all extraction procedures (DPPH: macerated-ρ = −0.73, alkaline-ρ = −0.47 and acid-ρ = −0.50 and ABTS: macerated-ρ = −0.70, alkaline-ρ = −0.57 and acid-ρ = −0.47). Furthermore, it was also found that DPPH in macerated extracts had a significant negative correlation with TFC, with a ρ-value of −0.46, whereas for the hydrolysed extracts, there was no correlation observed. For ABTS, all extractions significantly negatively correlated with TFC (macerated-ρ = −0.77, acid-ρ = −0.21, alkaline-ρ = −0.67). Only macerated extracts showed a significant negative correlation between DPPH and TdOPC (ρ = −0.43), whereas in the hydrolysed extracts, no correlation was observed. ABTS negatively correlated with TdOPC for all extraction procedures used (macerated-ρ = −0.73, alkaline-ρ = −0.70, acid-ρ = −0.26).

3.3.4. Correlation between Hydrogen Peroxide and Superoxide Scavenging Activity with TPC, TFC and TdOPC

Figure 11 shows the correlation of hydrogen peroxide scavenging activity with TPC, TFC and TdOPC. It was found that hydrogen peroxide significantly positively correlated with TPC and TdOPC in all extraction procedures (TPC: macerated-ρ = 0.42, acid—0.80 and alkaline-ρ = 0.85 and TdOPC: macerated-ρ = 0.46, acid-ρ = 0.18, alkaline-ρ = 0.58). Hydrogen peroxide scavenging activity in macerated and alkaline hydrolysed extracts also significantly positively correlated with TFC (ρ = 0.45 and 0.55), whereas for acid hydrolysed extracts, no correlations were observed. Superoxide Scavenging activity was found to be correlated only with TPC in methanolic extracts, whilst there was no significant correlation observed for hydrolysed extracts.

4. Discussion

4.1. Total Phenolic Content, Total Flavonoid Content and Total Ortho-Diphenolic Content

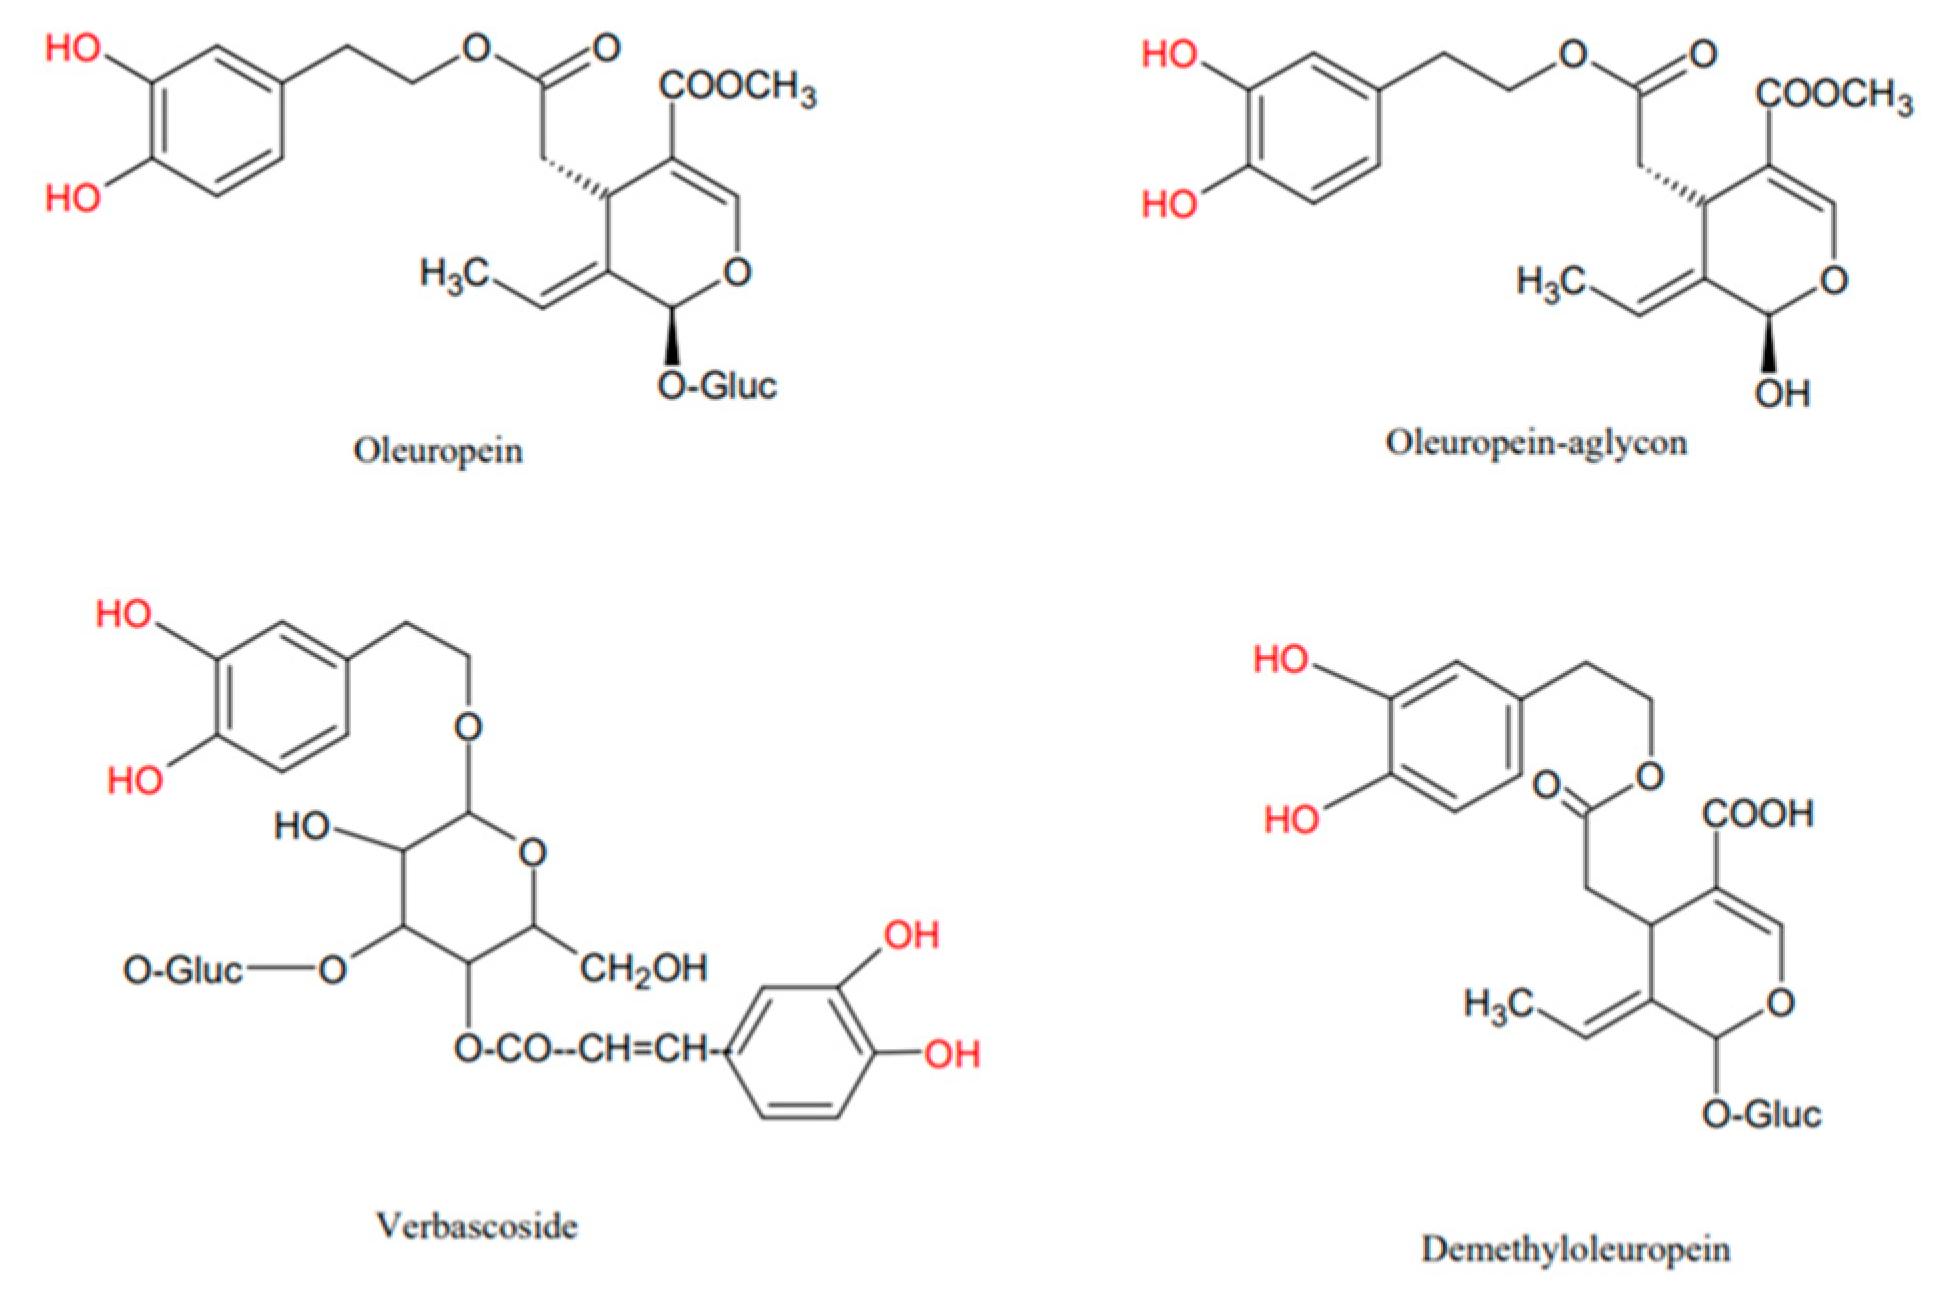
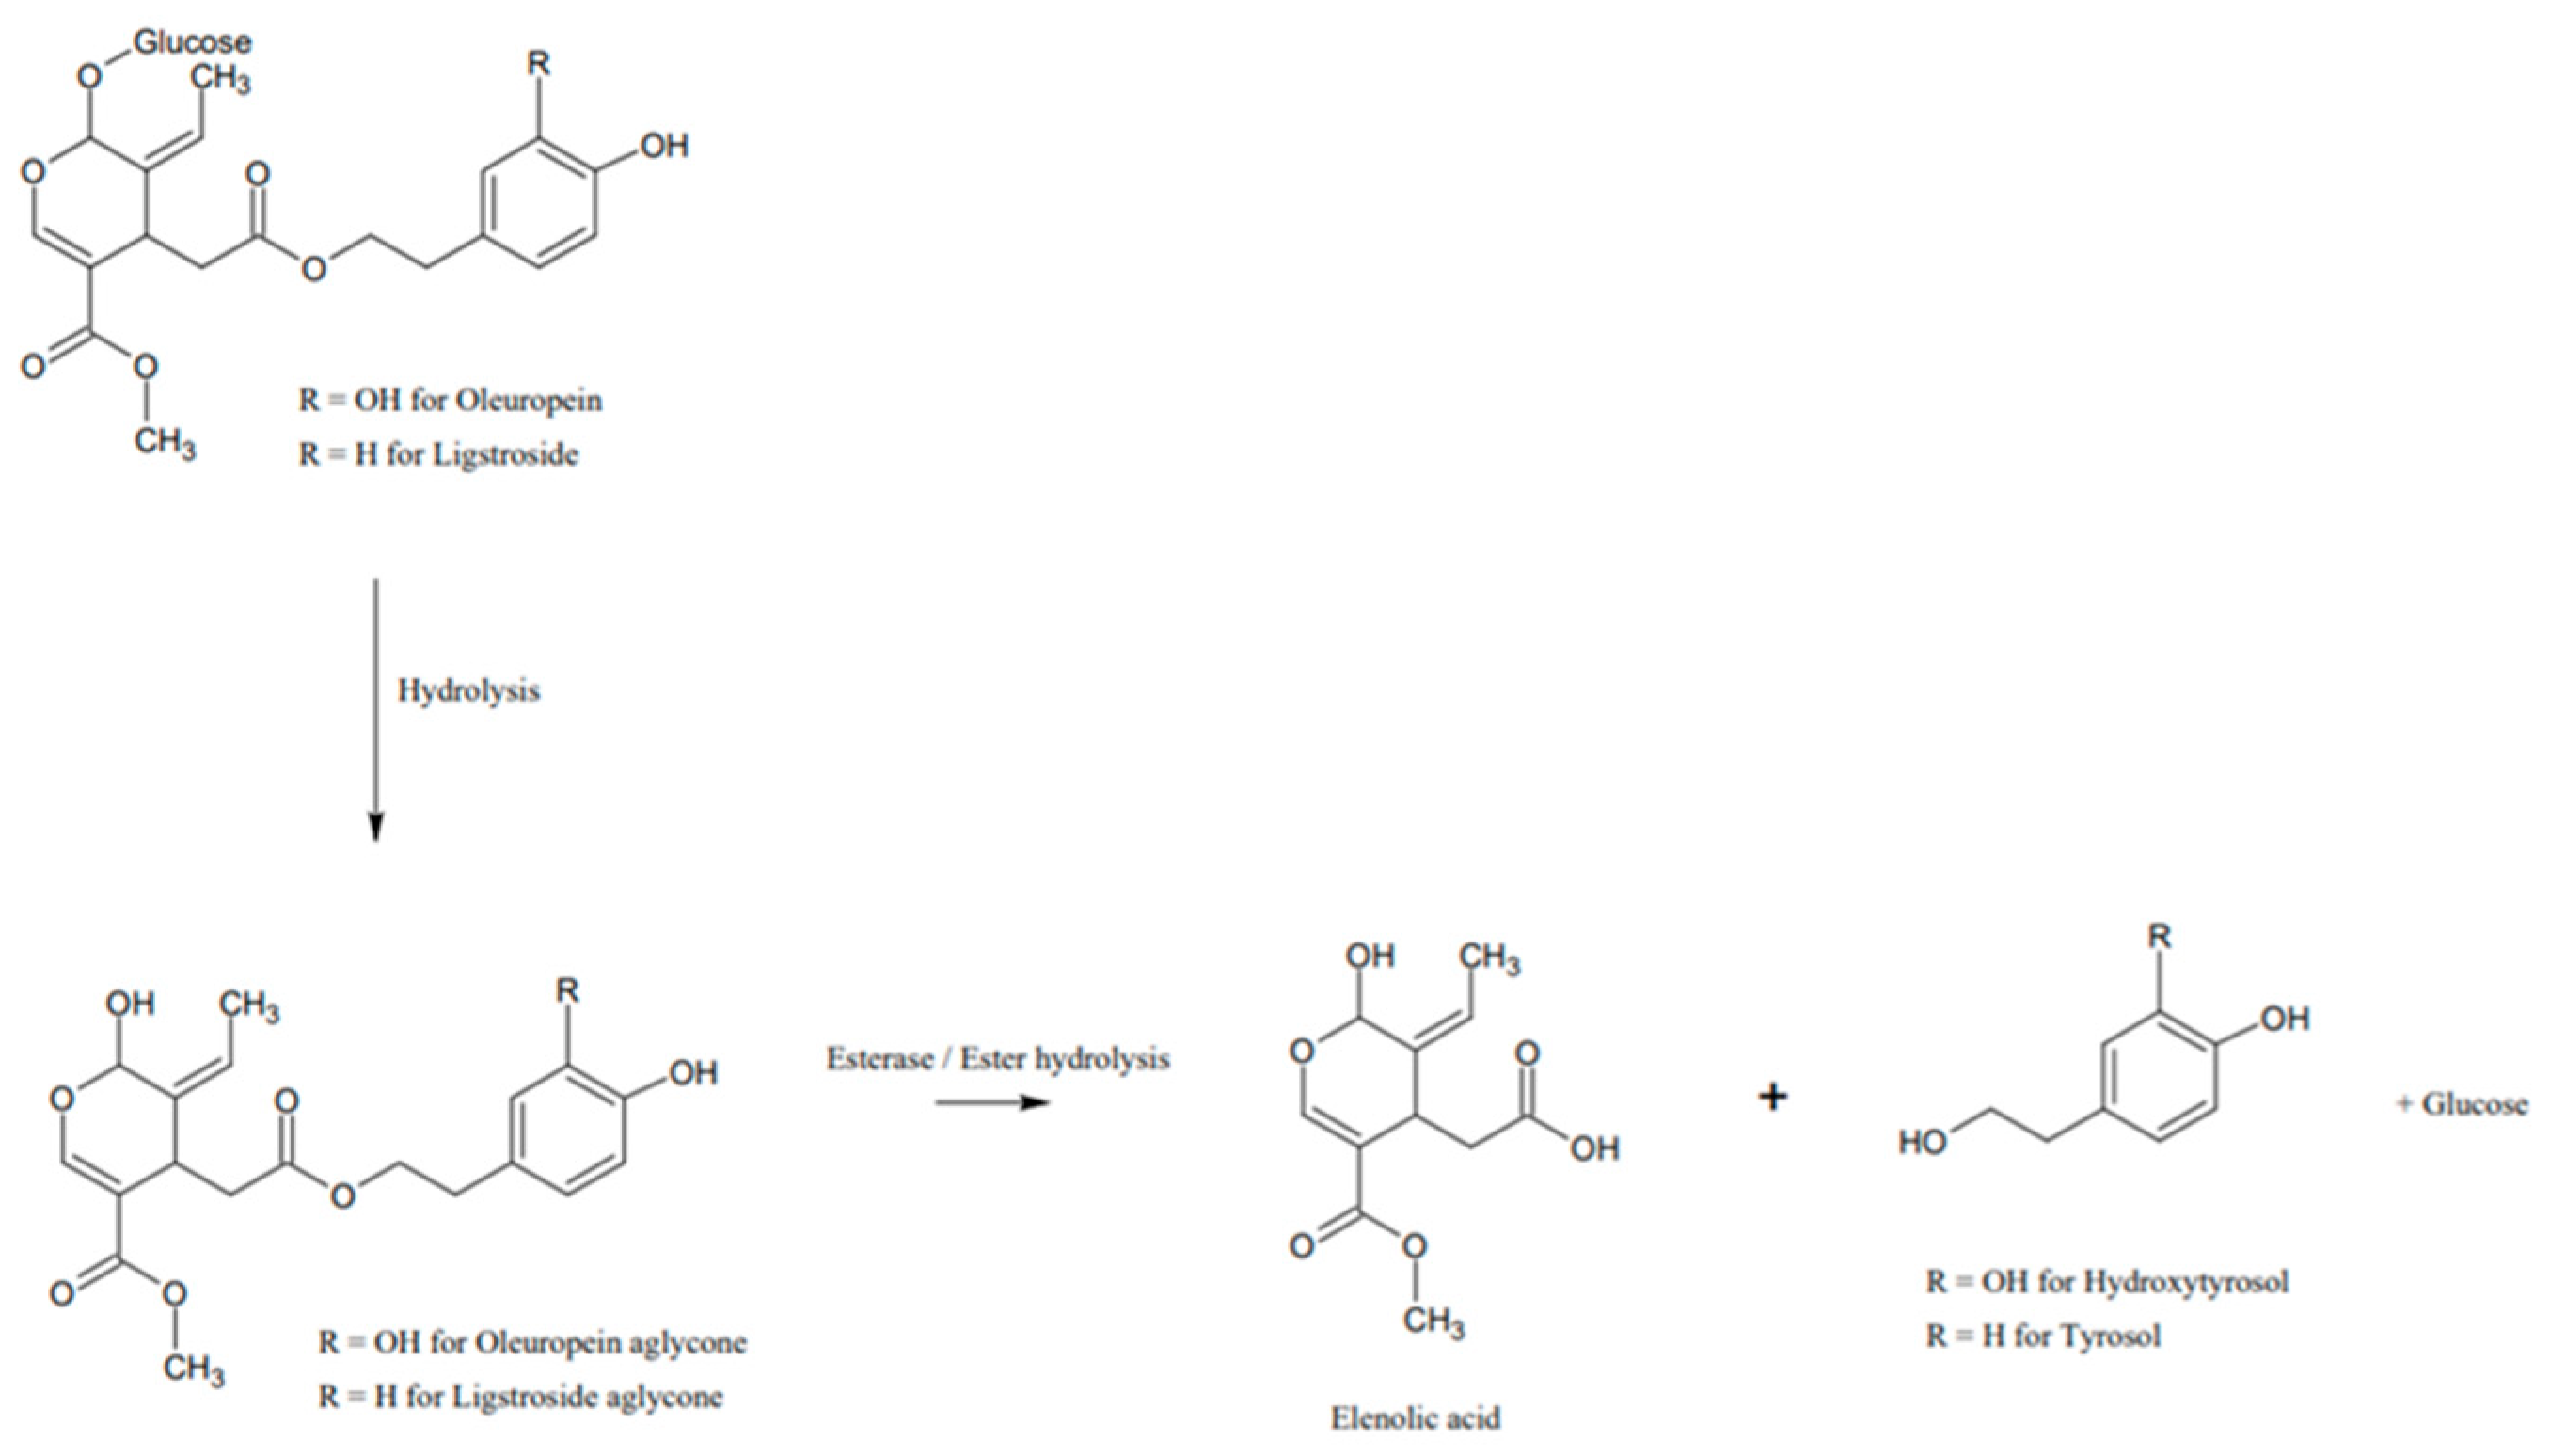
4.1.1. Effect of Hydrolysis on the Different Classes of Phenolic Compounds

One of the most common solvents used for the extraction of phenolic content is methanol, as it leads to better phenolic content [33]. A study conducted by Cioffi et al. [34] stated that methanol extracts were the most active compared with other extraction procedures used. Although methanolic extractions are common, the solvent may not allow a complete recovery of phenolic compounds that are linked by a glycosidic or ester bond to matrix components, such as cell wall polysaccharides and lipophilic structures. Thus, in order to break these bonds and achieve higher recoveries, a basic alkaline or acidic hydrolysis can be performed [23]. In fact, as seen in Figure 2, it can be noted that alkaline hydrolysed extracts produced the highest phenolic content compared with methanol and acid hydrolysis.
Acid and alkaline hydrolysis are two methods which can be used to release bound phenolic compounds. In most of the studies conducted, alkaline hydrolysis is the most-used method for the liberation of bound phenolic compounds from the cell wall polysaccharides [35]. This is mainly attributed to the fact that alkaline hydrolysis is carried out at room temperature, without the need of excessive heat which might destroy thermolabile compounds [36]. Wu et al. [37] studied the effects of different extraction methods, profiles and antioxidant abilities of free and bound phenolics of Sargassum polycystum from the South China Sea. In this study, it was found that alkaline hydrolysis releases a higher amount of bound phenolic compounds, which potentially results in higher TPC and antioxidant activity compared to that of acid hydrolysis. In contrast, a study conducted by Sani et al. [38] reported that the use of acid hydrolysis results in a higher TPC. This could be due to the fact that acid hydrolysis is carried out at a higher temperature to release the bound phenolic compounds, which are trapped in the cores or conjugated to cell wall dietary proteins or fibres [36,39].
Furthermore, in this study it was shown that whilst TPC increased with the hydrolysis procedure, macerated extracts had the highest flavonoid content, as seen in Figure 3. This is in line with the results obtained by Ghasemzadeh, Jaafar and Rahmat [40], whereby it was shown that methanolic extracts had the highest level of flavonoid content compared to other polar solvents. Apart from being the best solvent for the extraction of flavonoids, Rommel and Wrolstad [41] showed that significant loss in the flavonoids’ content occurs during boiling; in fact, it was stated that although flavanol aglycons, quercetin and kaempferol were detected, the quantities were lower than would be anticipated from the amount of kaempferol and quercetin glycosides in the non-hydrolysed samples. In fact, from the results obtained, it was evident that some loss of flavanols occurred during the process of hydrolysis. This study was further corroborated by Zhang et al. [42], whereby the sensitivity of flavonoids to high temperatures exceeding 75 °C resulted in the destruction of flavonoids. Flavonoids consist of C-glycoside bonds and exits as oligomers and dimers, and industrial processing such as boiling or even heating results in the formation of monomers through the hydrolysis of C-glycosides bonds [43]. Comparing the results obtained in this study with the literature, alkaline and acid hydrolysis produced far less flavonoid content than that of methanolic extracts. In fact, the results obtained are in line with the study conducted by Ghasemzadeh, Jaafar and Rahmat [40], where methanolic extracts had the highest flavonoid content.
Although TPC and TFC were affected by hydrolysis, the effect on TdOPC was not evident. In fact, there was no significant difference between the macerated, acid and alkaline hydrolysed extracts. Figure 12 shows the ortho-diphenols, such as oleuropein, oleuropein-aglycone, verbascoside and demethyloleuropein. These are considered the most important in relation to their antioxidant activity [44,45]. In contrast to TPC, when hydrolysed, hydroxytyrosol, tyrosol and glucose are formed. The Folin–Ciocalteu reagent tends to be sensitive to reducing compounds such as polyphenols, but it also reacts with other reducing substances, such as aromatic amines, sugars, ascorbic acid, sulphur dioxide and organic acids. Therefore, the presence of sugars within the olive waste extract might lead to an overestimation of polyphenols [46].

4.1.2. Correlation between TPC, TFC and TdOPC

For both macerated and alkaline hydrolysed extracts, TPC had a strong significant positive correlation with TFC. In the literature, it was found that TPC is significantly correlated with TFC. In fact, a study conducted by Gattet al. [4] on virgin olive oil stated that TPC was positively correlated with TFC (ρ = 0.90). Another study conducted by Singh et al. [47] on phenolic content variability, along with antioxidant, antimicrobial and cytotoxic potential of selected traditional medicinal plants, stated that TPC and TFC shared a positive correlation. In this study, it was shown that flavonoids within methanolic extracts had the major constituents of TPC. On the contrary, no correlation with TFC was observed in acid hydrolysis.
Similarly, TPC in macerated and alkaline hydrolysed extracts was moderately correlated with TdOPC. This observation is in line with the study conducted by Gattet et al. [4], where the TPC in methanolic extracts was found to be correlated with TdOPC (ρ = 0.91). Figure 9 shows that heating is the reason why acid hydrolysed extract has a lower correlation coefficient compared to that of alkaline and methanol extracts. This corroborates a study on grape canes conducted by Squillaciet et al. [48]. In this study, it was seen that extracts obtained after acid hydrolysis had a lower TdOPC when compared to extracts obtained after alkaline hydrolysis.
In contrast to the above correlations in Table 4, the correlation between TFC and TdOPC was much higher. Little literature can be found on the correlation between flavonoids and ortho-diphenolic compounds. Gattet et al. [4] stated that TFC appeared to be correlated with TdOPC (ρ = 1.00). The catechol functional group found in some flavonoids may be the reason why TFC and TdOPC shared a high correlation; this is mainly attributed to the catechol functional group, which tends to be a more efficient antioxidant.

4.1.3. The Effect of Maturity on the Different Classes of Phenolic Compounds

With reference to Figure 5, TPC was found to vary throughout the maturation of the olive. This has been attributed to enzymatic and chemical reactions occurring during the ripening process [49]. Olive oil waste consists of a wide range of phenolic compounds resulting from secondary plant metabolism, including phenolic alcohols (hydroxytyrosol and tyrosol), phenolic acids (vanillic acid and caffeic acid), flavonoids (luteolin and apigenin) and secoiridoids, which are the most abundant portion [50,51]. The aglycone forms of ligstroside and oleuropein are the most abundant in secoiridoids [52]. During the maturation process of olives, oleuropein and ligstroside accumulate [53]. As shown in Figure 13, any damages done to the fruit during the ripening process can result in the release of esters [54], which can hydrolyse ligstroside and oleuropein into a range of compounds [55]. Oleuropein aglycone and ligstroside aglycone are formed by hydrolysis. Furthermore, the aglycones can undergo a further ester hydrolysis in order to produce hydroxytyrosol or tyrosol, elenolic acid and glucose, each of which can potentially reduce the Folin reagent [56].
In contrast to the results obtained, both Giuffre et al. [58] and Morellóet et al. [59] showed that there was an apparent decrease in the concentration of phenolic compounds during the maturation of olive fruits. In fact, Morellóet al. [59] states that the highest concentration was seen in the first collected cultivar, with a concentration of 5.79 mg GAE/g, whilst the lowest concentration was found from waste collected a few months later and had a concentration of 0.55 mg GAE/g. The main key for phenolic biosynthesis is L-Phenylalanine Ammonia Lyase (PAL). When there is a decrease in the enzymatic activity of PAL, the TPC of olive drupes during the ripening stage can decrease [60].
As seen in Figure 5, flavonoid content is also affected by maturation. This can also be seen in the literature, where Charoenprasert and Mitchell [61] reported that the glucoside forms of flavonoids, cyanidin-3-glucoside, luteolin-7-glucoside, quercetin-3-rutinoside and cyanidin-3-rutinoside, are abundant in the pulp of mature olive fruits. The possible reason why TFC increases as the maturity progresses from unripe to ripe is because flavonoids tend to participate in the protection of the photosynthetic apparatus against photoinhibition under excessive light [62]. In fact, Li et al. [63] reported that as the light intensity decreased, the accumulation of flavones was inhibited. In contrast to these two studies, Benlarbi, Stoker and Yousfi [64] stated that TFC decreased during fruit ripening, except for one cultivar. The reason why TFC decreases at the second stage could be attributed to the increase of hydrolytic enzymes’ activity during the ripening of the fruit. Thus, the participation of flavonoids in essential biological activities could maintain the hypothesis of defensive needs of the plant rising during fruit ripening.
From the results obtained in Figure 5, it can be seen that although the ortho-diphenolic content is not dependent on temperature, nor on the hydrolysis procedure, it tends to be dependent on the maturation of the olive. When different ‘Bidni’ cultivars were compared with each other, it was shown that the maturation process was coupled with an increase in the TdOPC. According to most studies in the literature, the concentration of ortho-diphenolic content decreases with maturity. In fact, a study on the influence of fruit ripening and crop yield on chemical properties of virgin olive oils by Baccouri et al. [50] stated that the TdOPC decreases as the olive ripens. Another study by Machado et al. [65] also reported that the TdOPC of olive fruits during maturation for rain-fed and different irrigation regimes had a significant decrease in antioxidant activity. In contrast to these studies, a study conducted by Gouvinhaset et al. [66] showed that the concentration of ortho-diphenolic content varies differently in different cultivars, meaning that it is cultivar-dependent. Gouvinhaset et al. [66] showed that for three olive clones, the level of ortho-diphenolic content increased with maturation, whilst for three other different clones, the ortho-diphenolic content decreased with maturation.

4.2. Antioxidant Activity

Antioxidants from plants are known for their ability to limit radical reactions by transferring electrons or hydrogen atoms, as well as their ability to interrupt the chain reactions of oxidative degradation [67,68,69,70,71]. One of the most important groups of plant-based antioxidants is phenolic compounds, which consist of one or more aromatic rings with one or more hydroxyl groups. Phenolic compounds can be divided into several major families according to their chemical structure, including those in phenolic acids and flavonoids.
Bors et al., 1990 [72], defined three different criteria for the structure–activity relationship of antioxidant compounds, and these are:
  • Bors 1: due to hydrogen bonding, the presence of a catechol group on the B-ring leads to a high stability of the antioxidant radical (AO·).
  • Bors 2: a 2,3 double bond in combination with a 4-oxo group on the C-ring facilitates electron delocalization.
  • Bors 3: the presence of OH groups at position 3 and 5 in combination with the 4-oxo group enables electron delocalization via hydrogen bonds [72].
The correlation of chemical structure with antioxidant activity is usually performed by analysing the natural phenolic compounds and extracts using different antioxidant assays. The underlying chemistry for these assays involves either a hydrogen atom transfer mechanism (HAT) or a single electron transfer mechanism (SET) [69]. The HAT mechanism is a chemical transformation which converts the movement of two elementary particles, a proton and an electron, between two substrates in a single kinetic step [73], whilst the SET mechanisms are characterized by electron transfer from a nucleophile to a substrate in order to produce a radical intermediate [74]. The SET mechanism is subdivided into SET-PT and SPLET. The SET-PT mechanism strongly depends on proton dissociation and ionization potential energy. These antioxidants, which are easily deprotonated and ionized, are highly reactive. In contrast, the SPLET mechanism involves the initial loss of protons from the antioxidant, followed by anion transfer to the radical. This then reacts with the proton, which is influenced by the electron transfer enthalpy and proton affinity [69,75,76].

4.2.1. Radical Scavenging Activity

DPPHRadical Scavenging activity preferably reacts via SPLET mechanism in solvents such as methanol and ethanol; this is because it tends to be more stable [77]. From the results obtained during this study, it was observed that alkaline hydrolysis had the best scavenging activity compared to acid hydrolysis and methanolic macerated extracts. This was seen in the study conducted by Tubesha, Iqbal and Ismail [78], where it was stated that non-hydrolysed extracts had a lower antioxidant activity, whilst acid and alkaline hydrolysis had a higher antioxidant activity. In comparison to the results obtained, Sani et al. [38] found that the scavenging activity was higher in acidic hydrolysis compared to non-hydrolysed and alkaline hydrolysis.
ABTS assay preferably reacts via the SPLET mechanism in aqueous solutions [77]. From the results obtained, ABTS radical cation stabilization had a better scavenging activity compared with DPPH. This could be because the ABTS assay tends to be more sensitive for identifying antioxidant activity, since it has faster reaction kinetics and a heightened response to antioxidants [79]. In contrast, the results obtained by Wangsawat et al. [80] state that the IC50 values for the DPPH scavenging assays of all extracts were slightly higher than those of ABTS•+. In this study, it was noted that acidic hydrolyses had the lowest IC50’s compared with alkaline and methanolic extracts. Furthermore, Sani et al. [38] showed that the highest scavenging activity was seen in alkaline hydrolysis rather than in acidic hydrolysis, with a scavenging activity of 96%. Similar results were seen in the study on the effect of hydrolysis conditions on recovery of antioxidants from methanolic extracts of Nigella Sativa seeds conducted by Tubesha, Iqbal and Ismail [78], where it was stated that alkaline hydrolysis had the highest antioxidant activity.
From the correlations obtained in Table 4 for DPPH and ABTS with TPC, TFC and TdOPC correlated best with methanolic extracts. This is in line with studies by both Balluset et al. [81] and Samaniego Sanchez et al. [82], where it was stated thatTPC strongly correlated with DPPH in methanolic extracts. Another study by Sani et al. [38] states that the highest TFC was found in acidic hydrolysis rather than in neutral or alkaline hydrolysed extracts. In this study, it was stated that TFC correlated with DPPH and ABTS, but there was no correlation between the three extraction procedures used, including a non-hydrolysed, basic and acidic hydrolysis extraction. The correlations for DPPH and ABTS with TPC, TFC and TdOPC tend to be much less for acid and alkaline hydrolysed extracts than for methanolic extracts. This could be because compounds are being released during hydrolysis; thus, an increase in antioxidant activity is seen, but a weaker correlation can be observed. In 2015, Mathew, Abraham and Zakaria [83] conducted a study on the reactivity of phenolic compounds towards free radicals under in vitro conditions. In this study, it was concluded that hydroxylated cinnamates are more effective than their benzoic acid counterparts. This could be due to the bulky -CH=CH-COOH group, which increases the activity by stabilizing the resulting phenoxy radicals [84]. Furthermore, the double bond serves as a way to stabilize the radicals of the cinnamic acid derivatives via resonance [85,86]. Thus, comparing the correlations observed with the literature, methanol extracts tend to contain more complex molecules which show a better correlation with antioxidant activity due to the presence of the conjugated compounds. The presence of the unhydrolyzed glucoside groups has shown that they might enhance their stability in the presence of glucose moieties that decrease the antioxidant activity. This is because glycosides increase steric hindrance during the reaction [87].

4.2.2. Metal Ion Reducing Activity

Both FRAP and CUPRAC assays are electron transfer (ET) based assays [88]. ET-based assays measure the capacity of an antioxidant using the reduction of chromogenic oxidant, which changes the colour when reduced. The degree of colour change is correlated with the concentration of antioxidants present in the samples [89]. The FRAP assay is carried out under acidic pH conditions in order to maintain iron solubility and drive electron transfer. This increases the redox potential, causing a shift in the dominant reaction mechanism [90] and forming an intense blue-coloured ferrous complex [FeII(TPTZ)]2+. From the results obtained, alkaline hydrolysed extracts had the highest reducing activity, with a mean of 15.66 ± 9.52. This was followed by acidic hydrolysis, with an activity of 12.92 ± 6.56, and lastly methanolic extracts, with an activity of 7.26 ± 5.12, all expressed in mg AAE/g. From these results, it can be clearly seen that hydrolysis affects the antioxidant capability of olive waste. This corroborates the study conducted by Tang et al. [91], where it was stated that the FRAP values of bound phenolics from alkaline hydrolysis were higher than those from acid hydrolysis, with a p-value of less than 0.01.
Figure 10 shows the correlation of FRAP with TPC, TFC and TdOPC. From the correlations obtained, it was observed that FRAP correlated similarly with TPC for all extractions used, while there was a lower correlation when FRAP was correlated with TFC. The outcomes may reveal that phenolic components could be the main ingredients responsible for the antioxidant capacities of olive waste; whilst flavonoid compounds might contribute to the antioxidant capacities of olive waste, they were not the main contributors. This is in line with a study conducted by Tang et al. [92] where similar results were seen. The correlation between FRAP and TdOPC was also low, indicating that FRAP was more closely related to total phenolic content.
The CUPRAC method consists of a chromogenic oxidizing reagent which is known as bis(neocuproine) copper (II) cation. Upon its reduction, the reactive Ar-OH groups of the polyphenolic antioxidants are oxidized to the corresponding Ar=O (quinones), whilst Cu (II)-Nc is reduced to the orange-yellow coloured Cu(Nc)2+ chelate copper (I) [89]. From the results obtained in this study, it was found that CUPRAC in alkaline hydrolysed extracts had the best activity, with a mean of 12.25 ± 6.07. This was followed by methanolic extracts, with an activity of 10.14 ± 3.20, and lastly acid hydrolysed extracts, with an activity of 8.91 ± 3.67, all expressed in mg GAE/g. This is in line with a study conducted by Nenadis, Kyriakoudi and Tsimidou [93] on the impact of alkaline and acid digestion on antioxidant activity of rice hull extracts. In this study, it was stated that the extracts obtained after alkaline digestion of the hulls presented a higher reducing capacity of cupric ions.
Figure 10 shows the correlation of CUPRAC with TPC, TFC and TdOPC. From the correlations obtained, it can be observed that the correlation of CUPRAC with both TFC and TdOPC was stronger in the methanolic extracts compared to acid and alkaline hydrolysed extracts. This suggests that with regards to copper reducing activity, flavonoid compounds containing an ortho-diphenolic group preferentially reduce Cu2+ ions compared to other phenolic structures present in the extract. This corroborates a study conducted by Apak et al. [94]. In this study, it was stated that the correlation between CUPRAC and TPC was low; in fact, in order for flavonoid glycosides to fully exhibit their antioxidant potency, they required acid hydrolysis to their corresponding aglycons. Slow reacting antioxidants need elevated temperatures in order to complete their oxidation with the CUPRAC reagent. As flavonoid glycosides are hydrolyzed to their corresponding aglycons, their CUPRAC antioxidant capacities significantly increase [94].

4.2.3. Hydrogen Peroxide and Superoxide Scavenging Activity

Hydrogen peroxide is a weak oxidizing agent which inactivates few enzymes directly. It can also cross cell membranes rapidly; in fact, once it is in the cell, it can react with Fe2+ ions in order to form hydroxyl radicals [95]. In this study, the highest mean average of hydrogen peroxide scavenging activity was found in methanolic extracts, followed by acid hydrolysis and lastly, alkaline hydrolysis, all expressed in mg AAE/g. From the existing literature, methanolic extracts have been found to be more effective against hydrogen peroxide activity. A study carried out by Taha, Mohajer and Banisalam [96] on antioxidant activity and total phenolic and flavonoid content of various solvents in red clover showed that methanol extracts were found to be more efficient than hexane or ethyl acetate fractions. Ammar et al. [97] also stated that all solvents used had the ability to reduce the decomposition of hydrogen peroxide, but methanol extracts had a significantly higher (p-value = <0.05) ability to reduce the decomposition of hydrogen peroxide compared with the other solvents. This resulted in methanol exhibiting the highest extraction yield and a better antioxidant activity.
Figure 11 shows the correlation of hydrogen peroxide with TPC, TFC and TdOPC. From these correlations, it can be observed that TPC, TFC and TdOPC have lower correlations with CUPRAC in methanolic extracts. However, a higher correlation was observed in hydrolysed extracts, except for the correlation of TFC and TdOPC with hydrogen peroxide in acid hydrolysis. Bendaryet et al. [98] discussed that phenolic derivatives recorded a higher antioxidant activity than their parent compounds. This indicates that the aminophenol in the two and four positions showed the highest hydrogen peroxide scavenging activity [98]. Louaileche, Zegane and Kenciri [99] also stated that the ortho-diphenol content and antioxidant capacities assessed using the hydrogen peroxide scavenging activity revealed a good correlation, withan R2 value of 0.96. The antioxidant activity of ortho-diphenolic-containing compounds was associated with their ability to form intra-molecular hydrogen bonds between phenoxylic radicals and the hydroxyl group. In fact, Carrasco-Pancarbo et al. [100] states that the presence of an ortho-diphenol enhances the ability of the phenolic compounds to act as an antioxidant. Thus, this shows that the ortho-diphenols of olive waste extracts might bemajor contributors to the antioxidant activities assessed using this method.
The Superoxide Radical Scavenging activity assay was refined in such a way that the probe molecule was replaced by one which was able to be reduced by O2 radicals, but not by polyphenolic compounds. For this assay, acid hydrolysis had the highest IC50 of superoxide radicals; in fact, it had an average mean value of 10.17 ± 2.18, followed by methanolic extracts, with an average of 13.90 ± 4.90, and lastly alkaline hydrolysis, with an average of 16.33 ± 13.53. For Superoxide Radical Scavenging activity, only methanolic extracts correlated with TPC, and there were no correlations observed with TFC and TdOPC for all extracts used.

5. Conclusions

In this study, methanol, acid and alkaline hydrolysis extraction was applied on olive oil waste collected from the Maltese Islands. From the results obtained, it can clearly be seen that significant changes occur in the phenolic content of olive mill waste obtained from olives at different maturity stages. Alkaline and acid hydrolysis had a major influence on phenolic content and antioxidant activity. In fact, alkaline-hydrolysis-derived extracts showed the highest antioxidant activity with respect to TPC, DPPH Radical Scavenging activity and metal ion reducing activity, which includes FRAP and CUPRAC assays, whereas acid hydrolysis had the highest ABTS scavenging activity. From the results obtained, acid hydrolysis showed losses of phenolic content and antioxidant activity due to heating during the hydrolysis procedure. Thus, this might be the reason why acid hydrolysis had lower concentrations than those of alkaline hydrolysis. The correlation analysis carried out on the different phenolic classes revealed that most of the extracts showed a positive correlation between TPC, TFC and TdOPC. Furthermore, these phenolic classes tended to be highly correlated with metal ion reducing activity and Radical Scavenging activity.

Supplementary Materials

The following supporting information can be downloaded at: https://www.mdpi.com/article/10.3390/app122312187/s1. Figure S1: a graph showing the percentage of DPPH inhibition for all extracts in alkaline hydrolysis, Figure S2: a graph showing the percentage of DPPH inhibition for all extracts in acid hydrolysis, Figure S3: a graph showing the percentage of DPPH inhibition for all extracts in maceration extraction, Figure S4: a graph showing the percentage of ABTS inhibition for all extracts in alkaline hydrolysis, Figure S5: a graph showing the percentage of ABTS inhibition for all extracts in acid hydrolysis, Figure S6: a graph showing the percentage of ABTS inhibition for all extracts in maceration extraction, Figure S7: a graph showing the percentage of superoxide inhibition for all extracts in alkaline hydrolysed extracts, Figure S8: a graph showing the percentage of superoxide inhibition for all extracts in acid hydrolysed extracts, Figure S9: a graph showing the percentage of superoxide inhibition for all extracts in macerated extracts, Table S1: extraction yield obtained.

Author Contributions

Conceptualization, K.A. and F.L.; methodology, K.A. and F.L.; validation, K.A.; formal analysis, K.A. and F.L.; investigation, K.A.; resources, F.L.; data curation, K.A., F.L. and M.H.O.; writing—original draft preparation, K.A. and F.L.; writing—review and editing, K.A., F.L. and M.H.O.; visualization, K.A.; supervision, F.L.; project administration, F.L.; funding acquisition, F.L. All authors have read and agreed to the published version of the manuscript.

Funding

This research was funded by the Malta Council for Science & Technology and the Scientific Technological Research Council of Turkey (Tubitak) through the MCST-Tubitak 2021 Joint Call for R&I Projects under grant agreement No MCST-TUBITAK-2021-04 for OPobicell project.

Institutional Review Board Statement

Not applicable.

Informed Consent Statement

Not applicable.

Data Availability Statement

Not applicable.

Acknowledgments

Sam Cremona for providing the olive waste from different cultivars.

Conflicts of Interest

The authors declare no conflict of interest.

References

  1. Axiak, V. State of the Environment Report 2018 Era; Hexagon House: Marsa, Malta, 2005. [Google Scholar]
  2. Borg, J. Cultivation and Diseases of Fruit Trees in the Maltese Islands; Malta Government Printing Office: Marsa, Malta, 1922; pp. 98–113.
  3. Mazzitelli, O.; Calleja, A.; Sardella, D.; Farrugia, C. Analysis of the molecular diversity of Olea europaea in the Mediterranean Island of Malta. Genet. Resour. Crop Evol. 2015, 62, 1021–1027. [Google Scholar] [CrossRef] [Green Version]
  4. Gatt, L.; Lia, F.; Zammit-Mangion, M.; Thorpe, S.J.; Schembri-Wismayer, P. First Profile of Phenolic Compounds from Maltese Extra Virgin Olive Oils Using Liquid-Liquid Extraction and Liquid Chromatography-Mass Spectrometry’. J. Oleo Sci. 2021, 70, ess20130. [Google Scholar] [CrossRef] [PubMed]
  5. Gutiérrez-Rosales, F.; Ríos, J.; Gómez-Rey, M. Main Polyphenols in the Bitter Taste of Virgin Olive Oil. Structural Confirmation by On-Line High-Performance Liquid Chromatography Electrospray Ionization Mass Spectrometry. J. Agric. Food Chem. 2003, 51, 6021–6025. [Google Scholar] [CrossRef]
  6. Esti, M.; Cinquanta, L.; La Notte, E. Phenolic Compounds in Different Olive Varieties. J. Agric. Food Chem. 1997, 46, 32–35. [Google Scholar] [CrossRef] [PubMed]
  7. Mulinacci, N.; Romani, A.; Galardi, C.; Pinelli, P.; Giaccherini, C.; Vincieri, F.F. Polyphenolic content in olive oil waste waters and related olive samples. J. Agric. Food Chem. 2001, 49, 3509–3514. [Google Scholar] [CrossRef] [PubMed] [Green Version]
  8. Romani, A.; Mulinacci, N.; Pinelli, P.; Vincieri, F.F.; Cimato, A. Polyphenolic content in five Tuscany cultivars of Olea europaea L. J. Agric. Food Chem. 1999, 47, 946–967. [Google Scholar] [CrossRef]
  9. Savarese, M.; De Marco, E.; Sacchi, R. Characterization of phenolic extracts from olives (Olea europaea cv. Pisciottana) by electrospray ionization mass spectrometry. Food Chem. 2007, 105, 761–770. [Google Scholar] [CrossRef]
  10. Rodis, P.S.; Karathanos, V.T.; Mantzavinou, A. Partitioning of olive oil antioxidants between oil and water phases. J. Agric. Food Chem. 2002, 50, 596–601. [Google Scholar] [CrossRef]
  11. Haddadin, M.S.; Abdulrahim, S.M.; Al-Khawaldeh, G.Y.; Robinson, R.K. Solid-state fermentation of waste pomace from olive processing. J. Chem. Technol. Biotechnol. 1999, 74, 613–618. [Google Scholar] [CrossRef]
  12. Haddadin, M.S.; Al-Natour, R.; Al-Qsous, S.; Robinson, R.K. Bio-degradation of lignin in olive pomace by freshly-isolated species of basidiomycete. Bioresour. Technol. 2002, 82, 131–137. [Google Scholar] [CrossRef]
  13. Berbel, J.; Posadillo, A. Review and Analysis of Alternatives for the Valorisation of Agro-Industrial Olive Oil By-Products. Sustainability 2018, 10, 237. [Google Scholar] [CrossRef] [Green Version]
  14. Tekin, A.R.; Dalgic, A.C. Biogas production from olive pomace. Resour. Conserv. Recycl. 2000, 30, 301–313. [Google Scholar] [CrossRef]
  15. Vitolo, S.; Petarca, L.; Bresci, B. Treatment of olive oil industry wastes. Bioresour. Technol. 1999, 67, 129–137. [Google Scholar] [CrossRef]
  16. Ballesteros, I.; Oliva, J.M.; Ballesteros, M. Ethanol production from lignocellulosic by products of olive oil extraction. Appl. Biochem. Biotechnol. 2001, 91–93, 237–252. [Google Scholar] [CrossRef]
  17. Lopez, M.J.; Ramos-Cormenzana, A. Xanthan production from olive-mill wastewaters. Int. Biodeter. Biodegrad. 1996, 38, 263–270. [Google Scholar] [CrossRef]
  18. Kahraman, S.; Yesilada, O. Industrial and agricultural wastes as substrates for laccase production by white-rot fungi. Folia Microbiol. 2001, 46, 133–136. [Google Scholar] [CrossRef]
  19. Fenice, M.; Sermanni, G.G.; Federici, F.; D’annibale, A. Submerged and solid-state production of laccase and Mn Peroxidase by Panus tigrinus on olive mill wastewater-based media. J. Biotechnol. 2003, 100, 77–85. [Google Scholar] [CrossRef] [PubMed]
  20. Visioli, F.; Romani, A.; Mulinacci, N.; Zarini, S.; Conte, D.; Vincieri, F.F.; Galli, C. Antioxidant and other biological activities of olive mill wastewaters. J. Agric. Food Chem. 1999, 47, 3397–3401. [Google Scholar] [CrossRef]
  21. Aliakbarian, B.; Palmieri, D.; Casazza, A.A.; Palombo, D.; Perego, P. Antioxidant Activity and Biological Evaluation of Olive Pomace Extract. Nat. Prod. Res. 2012, 26, 2280–2290. [Google Scholar] [CrossRef]
  22. Radic, K.; Vrcek, I.V.; Pavicic, I.; Cepo, D.V. Cellular Antioxidant Activity of Olive Pomace Extracts: Impact of Gastrointestinal Digestion and Cyclodextrin Encapsulation. Molecules 2020, 25, 5027. [Google Scholar] [CrossRef]
  23. Watson, R.R. Polyphenols in Plants: Isolation, Purification and Extract Preparation, 1st ed.; Academic Press: London, UK, 2014; Chapter 7. [Google Scholar]
  24. Singleton, V.L.; Orthofer, R.; Lamuela-Raventos, R.M. Analysis of Total Phenols and Other Oxidation Substrates and Antioxidants by Means of Folin-Ciocalteu Reagent. Methods Enzymol. 1999, 299, 152–178. [Google Scholar]
  25. Mabry, T.J.; Markham, K.R.; Thomas, M.B. The Systematic Identification of Flavonoids; Springer: Berlin/Heidelberg, Germany, 1970. [Google Scholar]
  26. Mateos, R.; Espartero, J.L.; Trujillo, M.; Ríos, J.J.; León-Camacho, M.; Alcudia, F. Determination of phenols, flavones, and lignans in virgin olive oils by solid-phase extraction and high-performance liquid chromatography with diode array ultraviolet detection. J. Org. Chem. 2001, 49, 2185–2192. [Google Scholar] [CrossRef] [PubMed]
  27. Apak, R.; Ozyurek, M.; Guclu, K.; Capaoglu, E. Antioxidant Activity/Capacity Measurement. Classification, Physicochemical Principles, Mechanisms, and Electron Transfer (ET)-Based Assays. Agric. Food Chem. 2016, 64, 997–1027. [Google Scholar] [CrossRef] [PubMed]
  28. Benzie, I.F.F.; Strain, J.J. The Ferric Reducing Ability of Plasma (FRAP) as A Measure of “Antioxidant Power”: The FRAP assay. Anal. Biochem. 1996, 239, 70–76. [Google Scholar] [CrossRef] [Green Version]
  29. Cerretani, L.; Bendini, A. Rapid Assays to Evaluate the Antioxidant Capacity of Phenols in Virgin Olive Oil. In Olives and Olive oil in Health and Diseases Prevention; Academic Press: Cambridge, MA, USA, 2010; pp. 625–635. [Google Scholar]
  30. Rahman, M.M.; Islam, M.B.; Biswas, M.; Khurshid Alam, A.H. In vitro antioxidant and free radical scavenging activity of different parts of Tabebuia pallida growing in Bangladesh. BMC Res. Notes 2015, 8, 621. [Google Scholar] [CrossRef] [Green Version]
  31. Rajurkar, N.S.; Hande, S.M. Estimation of phytochemical content and antioxidant activity of some selected traditional Indian medicinal plants. Indian J. Pharm. Sci. 2011, 73, 146. [Google Scholar] [CrossRef] [Green Version]
  32. Mukhopadhyay, D.; Sinha, D.; Palchoudhuri, S.; Chatteriee, I.; Ali, S.; Dastidar, S.G. A Sensitive In vitro Spectrophotometric Hydrogen Peroxide Scavenging Assay using 1,10-Phenanthroline. Free Radic. Antioxid. 2015, 6, 123–131. [Google Scholar] [CrossRef]
  33. Lopes Araujo, M.; Pimentel, F.B.; Alves, R.C.; Oliveria, M. Phenolic compounds from olive mill wastes: Health effects, analytical approach and application as food antioxidants. Trends Food Sci. Technol. 2015, 45, 200–211. [Google Scholar] [CrossRef]
  34. Cioffi, G.; Pesca, S.; De Caprariis, P.; Braca, A.; Severino, L.; De Tommasi, N. Phenolic compounds in olive oil and olive pomace from Cilento (Campania, Italy) and their antioxidant activity. Food Chem. 2010, 121, 105–111. [Google Scholar] [CrossRef]
  35. Sun, J.; Chu, Y.-F.; Wu, X.; Liu, R.H. Antioxidant and antiproliferative activities of common fruits. J. Agric. Food Chem. 2002, 50, 7449–7454. [Google Scholar] [CrossRef]
  36. Bonoli, M.; Verardo, V.; Marconi, E.; Fiorenza Caboni, M. Antioxidant Phenols in Barley (Hordeum vulgare L.) Flour: Comparative Spectrophotometric Study among Extraction Methods of Free and Bound Phenolic Compounds. Agric. Food Chem. 2004, 2, 5195–5520. [Google Scholar] [CrossRef] [PubMed]
  37. Wu, Y.; Gao, H.; Wang, Y.; Peng, Z.; Guo, Z.; Ma, Y.; Zhang, R.; Zhang, M.; Wu, Q.; Xiao, J.; et al. Effects of different extraction methods on contents, profiles, and antioxidant abilities of free and bound phenolics of Sargassum polycystum from the South China Sea. J. Food Sci. 2022, 87, 968–981. [Google Scholar] [CrossRef]
  38. Sani, I.M.; Iqbal, S.; Chan, K.W.; Ismail, M. Effect of acid and base catalyzed hydrolysis on the yield of phenolics and antioxidant activity of extracts from germinated brown rice (GBR). Molecules 2012, 17, 7584–7594. [Google Scholar] [CrossRef] [Green Version]
  39. Su, D.; Zhang, R.; Hou, F.; Zhang, M.; Guo, J.; Huang, F.; Deng, Y.; Wei, Z. Comparison of the free and bound phenolic profiles and cellular antioxidant activities of litchi pulp extracts from different solvents. BMC Complement. Altern. Med. 2014, 14, 9. [Google Scholar] [CrossRef] [Green Version]
  40. Ghasemzadeh, A.; Jaafar, H.Z.; Rahmat, A. Effects of solvent type on phenolics and flavonoids content and antioxidant activities in two varieties of young ginger (Zingiber officinale Roscoe) extracts. J. Med. Plants Res. 2011, 5, 1147–1154. [Google Scholar]
  41. Rommel, A.; Wrolastad, R.E. Influence of Acid and Base Hydrolysis on the Phenolic Composition of Red Raspberry Juice. J. Agric. Food Chem. 1993, 41, 1237–1241. [Google Scholar] [CrossRef]
  42. Zhang, X.; Wang, X.; Wang, M.; Cao, J.; Xiao, J.; Wang, Q. Effects of different pretreatments on flavonoids and antioxidant activity of Dryopteris erythrosora leave. PLoS ONE 2019, 14, e0200174. [Google Scholar] [CrossRef] [Green Version]
  43. Sharma, K.; Ko, E.Y.; Assefa, D.; Ha, S.; Nile, S.H.; Lee, E.T.; Park, S.W. Temperature-dependent studies on the total phenolics, flavonoids, antioxidant activities, and sugar content in six onion varieties. J. Food Drug Anal. 2014, 23, 243–252. [Google Scholar] [CrossRef] [Green Version]
  44. Soufi, O.; Romero, C.; Hayette, L. Ortho-diphenol profile and antioxidant activity of Algerian black olive cultivars: Effect of dry salting process. Food Chem. 2014, 157, 504–510. [Google Scholar] [CrossRef]
  45. Basuny, M.A. Olive Leaves Healthy Alternative for Green Tea. Curr. Trends Biomed. Eng. Biosci. 2018, 15, 555919. [Google Scholar] [CrossRef]
  46. Rover, M.R.; Brown, R.C. Quantification of total phenols in bio-oil using the Folin–CIOCALTEU method. J. Anal. Appl. Pyrolysis 2013, 104, 366–371. [Google Scholar] [CrossRef]
  47. Singh, G.; Passsari, A.K.; Leo, V.V.; Mishra, V.K.; Subbarayan, S.; Singh, B.P.; Kumar, B.; Kumar, S.; Gupta, V.K.; Lalhlenmawia, H.; et al. Evaluation of phenolic content variability along with antioxidant, antimicrobial, and cytotoxic potential of selected traditional medicinal plants from India. Front. Plant Sci. 2016, 7, 407. [Google Scholar] [CrossRef] [PubMed]
  48. Squillaci, G.; Zannella, C.; Carbone, V.; Minasi, P.; Folliero, V.; Stelitano, D.; La Cara, F.; Galdiero, M.; Franci, G.; Morana, A. Grape Canes from Typical Cultivars of Campania (Southern Italy) as a Source of High-Value Bioactive Compounds: Phenolic Profile, Antioxidant and Antimicrobial Activities. Molecules 2021, 26, 2746. [Google Scholar] [CrossRef] [PubMed]
  49. Ye, J.H.; Wijesundera, C.; Shi, M. Effects of Agronomic and Oil Processing Conditions on Natural Antioxidative Phenolics in Olive (Olea europaea, L.); Austin Publishing Group: Irving, TX, USA, 2014; Volume 2, p. 1050. [Google Scholar]
  50. Baccouri, B.; Zarrouk, W.; Krichene, D.; Nouairi, I.; Youssef, N.; Daoud, D.; Zarrouk, M. Influence of Fruit Ripening and Crop Yield on Chemical Properties of Virgin Olive Oils from Seven Selected Oleasters (Olea europea L.). J. Agron. 2008, 6, 388–396. [Google Scholar] [CrossRef] [Green Version]
  51. Celano, R.; Piccinelli, A.L.; Pugliese, A.; Carabetta, S.; Di Sanzo, R.; Rastrelli, L. Insights into the Analysis of Phenolic Secoiridoids in Extra Virgin Olive Oil. J. Agric. Food Chem. 2018, 66, 6053–6063. [Google Scholar] [CrossRef] [PubMed]
  52. Oliveras-López, M.J.; Innocenti, M.; Giaccherini, C.; Ieri, F.; Romani, A.; Mulinacci, N. Study of the phenolic composition of Spanish and Italian monocultivar extra virgin olive oils: Distribution of lignans, secoiridoidic, simple phenols and flavonoids. Talanta 2007, 73, 726–732. [Google Scholar] [CrossRef] [PubMed]
  53. Mumm, R.; Hilker, M. Direct and indirect chemical defence of pine against folivorous insects. Trends Plant Sci. 2006, 11, 351–358. [Google Scholar] [CrossRef]
  54. Marsilio, V.; Seghetti, L.; Iannucci, E.; Russi, F.; Lanza, B.; Felicioni, M. Use of a lactic acid bacteria starter culture during green olive (Olea europaea L. cv Ascolana tenera) processing. J. Sci. Food Agric. 2005, 85, 1084–1090. [Google Scholar] [CrossRef]
  55. Jemai, H.; Bouaziz, M.; Sayadi, S. Phenolic composition, sugar contents and antioxidant activity of Tunisian sweet olive cultivar with regard to fruit ripening. J. Agric. Food Chem. 2009, 57, 2961–2968. [Google Scholar] [CrossRef] [PubMed]
  56. Gutierrez-Rosales, F.; Romero, M.P.; Casanovas, M.; Motilva, M.J.; Mínguez-Mosquera, M.I. Metabolites involved in oleuropein accumulation and degradation in fruits of Olea europaea L.: Hojiblanca and Arbequina varieties. J. Agric. Food Chem. 2010, 58, 12924–12933. [Google Scholar] [CrossRef]
  57. Johnson, R.; Melliou, E.; Zweigenbaum, J.; Mitchell, A.E. Quantitation of oleuropein and related phenolics in cured Spanish-style green, California-style black ripe, and greek-style natural fermentation olives. J. Agric. Food Chem. 2018, 66, 2121–2128. [Google Scholar] [CrossRef] [PubMed]
  58. Giuffre, A.M.; Piscopo, A.; Slcari, V.; Poiana, M. The effects of harvesting on phenolic compounds and fatty acids content in virgin olive oil (cv Roggianella). Riv. Itaiana Delle Sostanze 2010, 87, 14–23. [Google Scholar]
  59. Morelló, J.-R.; Romero, M.-P.; Ramo, T.; Motilva, M.J. Evaluation of L-phenylalanine ammonia-lyase activity and phenolic profile in olive drupe (Olea europaea L.) from fruit setting period to harvesting time. Plant Sci. 2005, 168, 65–72. [Google Scholar] [CrossRef]
  60. Bouaziz, M.; Chamkha, M.; Sayadi, S. Comparative study on phenolic content and antioxidant activity during maturation of the olive cultivar Chemlali from Tunisia. J. Agric. Food Chem. 2004, 52, 5476–5481. [Google Scholar] [CrossRef] [PubMed]
  61. Charoenprasert, S.; Mitchell, A. Factors Influencing Phenolic Compounds in Table Olives (Olea europaea). Agric. Food Chem. 2012, 60, 7081–7095. [Google Scholar] [CrossRef]
  62. Zhou, R.; Zhang, G.F.; Zhang, Y.N.; Guo, X.R. Relationship between flavonoids and photoprotection in shade-developed Erigeron breviscapus transferred to sunlight. Photosynthetica 2015, 54, 201–209. [Google Scholar] [CrossRef]
  63. Li, A.; Li, S.; Wu, X.; Zhang, J.; He, A.; Zhao, G.; Yang, X. Effect of Light Intensity on Leaf Photosynthetic Characteristics and Accumulation of Flavonoids in Lithocarpus litseifolius (Hance) Chun. (Fagaceae). Sci. Res. 2016, 6, 445–459. [Google Scholar] [CrossRef] [Green Version]
  64. Benlarbi, F.; Stoker, P.; Yousfi, M. Investigation of antioxidant and antihemolytic activities of Algerian defatted olive fruits (Olea europaea L.) at two ripening stages. Mediterr. J. Nutr. Metab. 2018, 11, 217–233. [Google Scholar] [CrossRef]
  65. Machado, M.; Felizardo, C.; Fernandes-Silva, A.A.; Barros, A. Polyphenolic compounds, antioxidant activity and L-phenylalanine ammonia-lyase activity during ripening of olive cv. “Cobrançosa” under different irrigation regimes. Food Res. Int. 2012, 1, 412–421. [Google Scholar] [CrossRef]
  66. Gouvinhas, I.; Martins-Lopes, P.; Vilela, A.; Barros, A.; Sousa, C.; Barreira, D.; Carvalho, M.T.; Lopes, J. ‘Cobrançosa’ Olive Oil and Drupe: Chemical Composition at Two Ripening Stages. J. Am. Oil Chem. Soc. 2014, 91, 599–611. [Google Scholar]
  67. Zheng, W.; Wang, S.Y. Antioxidant activity and phenolic compounds in selected herbs. J. Agric. Food Chem. 2001, 49, 5165–5170. [Google Scholar] [CrossRef] [PubMed]
  68. Shahidi, F.; Zhong, H.J.; Ambigaipalan, P. Antioxidants: Regulatory status. In Bailey’s Industrial Oil and Fat Products; John Wiley & Sons, Ltd.: London, UK, 2005; pp. 1–21. [Google Scholar]
  69. Huang, D.; Ou, B.; Prior, R.L. The chemistry behind antioxidant capacity assays. J. Agric. Food Chem. 2005, 53, 1841–1856. [Google Scholar] [CrossRef] [PubMed]
  70. Wright, J.S.; Johnson, E.R.; DiLabio, G.A. Predicting the activity of phenolic antioxidants: Theoretical method, analysis of substituent effects, and application to major families of antioxidants. J. Am. Chem. Soc. 2001, 123, 1173–1183. [Google Scholar] [CrossRef] [PubMed]
  71. Visioli, F.; Galli, C. Olive oil phenols and their potential effects on human health. J. Agric. Food Chem. 1998, 46, 4292–4296. [Google Scholar] [CrossRef]
  72. Bors, W.; Heller, W.; Michel, C.; Saran, M. Radical Chemistry of Flavonoid Antioxidants. In Antioxidants in Therapy and Preventive Medicine; Springer: Berlin/Heidelberg, Germany, 1990; pp. 165–170. [Google Scholar]
  73. Capaldo, L.; Ravelli, D. Hydrogen Atom Transfer (HAT): A Versatile Strategy for Substrate Activation in Photocatalyzed Organic Synthesis. Chem. Eur. 2017, 15, 2056–2071. [Google Scholar] [CrossRef] [Green Version]
  74. Leopoldini, M.; Russo, N.; Toscano, M. The molecular basis of working mechanism of natural polyphenolic antioxidants. Food Chem. 2011, 125, 288–306. [Google Scholar] [CrossRef]
  75. Di Meo, F.; Lemaur, V.; Cornil, J.; Lazzaroni, R.; Duroux, J.L.; Olivier, Y.; Trouillas, P. Free radical scavenging by natural polyphenols: Atom versus electron transfer. J. Phys. Chem. A 2013, 117, 2082–2092. [Google Scholar] [CrossRef]
  76. Lemanska, K.; Szymusiak, H.; Tyrakowska, B.; Zieliński, R.; Soffers, A.E.; Rietjens, I.M. The influence of pH on antioxidant properties and the mechanism of antioxidant action of hydroxyflavones. Free Radic. Biol. Med. 2001, 31, 869–881. [Google Scholar] [CrossRef]
  77. Platzer, M.; Kiese, S.; Herfellner, T.; Schweiggert-Weisz, U.; Miesbauer, O.; Eisner, P. Common Trends and Differences in Antioxidant Activity Analysis of Phenolic Substances Using Single Electron Transfer Based Assays. Molecules 2021, 26, 1244. [Google Scholar] [CrossRef]
  78. Tubesha, Z.; Iqbal, S.; Ismail, M. Effects of hydrolysis conditions on recovery of antioxidants from methanolic extracts of Nigella Sativa seeds. J. Med. Plants Res. 2011, 5, 5393–5399. [Google Scholar]
  79. Jin Lee, K.; Chang Oh, Y.; Kyung Cho, W.; Yeul Ma, J. Antioxidant and Anti-Inflammatory Activity Determination of One Hundred Kinds of Pure Chemical Compounds Using Offline and Online Screening HPLC Assay. Evid. Based Complement. Altern. Med. 2015, 2015, 165457. [Google Scholar]
  80. Wangsawat, N.; Nahar, L.; Sarker, S.D.; Phosri, C.; Evans, A.R.; Whalley, A.J.S.; Choowongkomon, K.; Suwannasai, N. Antioxidant Activity and Cytotoxicity against Cancer Cell Lines of the Extracts from Novel Xylaria Species Associated with Termite Nests and LC-MS Analysis. Antioxidants 2021, 10, 1557. [Google Scholar] [CrossRef] [PubMed]
  81. Ballus, C.A.; Meinhart, A.D.; De Souza Campos, F.A.; Godoy, H.T. Total Phenolics of Virgin Olive Oils Highly Correlate with the Hydrogen Atom Transfer Mechanism of Antioxidant Capacity. J. Am. Oil Chem. Soc. 2015, 92, 843–885. [Google Scholar] [CrossRef]
  82. Samaniego Sánchez, C.; Troncoso González, A.M.; García-Parrilla, M.C.; Quesada Granados, J.J.; López García de la Serrana, H.; López Martínez, M.C. Different radical scavenging tests in virgin olive oil and their relation to the total phenol content. Anal. Chim. Acta 2007, 593, 103–107. [Google Scholar] [CrossRef]
  83. Mathew, S.; Abraham, T.E.; Akmar Zakaria, Z. Reactivity of phenolic compounds towards free radicals under in vitro conditions. J. Food Sci. Technol. 2015, 52, 5790–5798. [Google Scholar] [CrossRef] [PubMed] [Green Version]
  84. Yamagami, C.; Akamatsu, M.; Motohashi, N.; Hamada, S.; Tanahashi, T. Quantitative structure-activity relationship studies for antioxidant hydroxybenzalacetones by quantum chemical-and 3-D-QSAR(CoMFA) analyses. Bioorg. Med. Chem. Lett. 2005, 15, 2845–2850. [Google Scholar] [CrossRef]
  85. Cuvelier, M.E.; Richard, H.; Berset, C. Comparison of the antioxidant activity of some acid phenols: Structure-activity relationship. Biosci. Biotechnol. Biochem. 1992, 56, 324–325. [Google Scholar] [CrossRef] [Green Version]
  86. Natella, F.; Nardini, M.; Di Felice, M.; Scaccini, C. Benzoic and cinnamic acid derivatives as antioxidants: Structure-activity relation. J. Agric. Food Chem. 1999, 47, 1453–1459. [Google Scholar] [CrossRef]
  87. Li, W.; Gu, M.; Gong, P.; Wang, J.; Hu, Y.; Hu, Y.; Tan, X.; Wei, J.; Yang, H. Glycosides changed the stability and antioxidant activity of pelargonidin. Food Sci. Technol. 2021, 147, 111581. [Google Scholar] [CrossRef]
  88. Apak, R.; Semirci Cekic, S.; Uzer, A.; Esin Celik, S.; Bener, M.; Bekdeser, B.; Can, Z.; Saglam, S.; Nur Onem, A.; Ercag, E. Novel Spectroscopic and Electrochemical Sensors and Nanoprobes for the Characterization of Food and Biological Antioxidants. Sensor 2018, 18, 186. [Google Scholar] [CrossRef] [Green Version]
  89. Ozyurek, M.; Guclu, K.; Tutem, E.; Sozgeb Baskan, K.; Ercag, E.; Celik, E.; Baki, S.; Yildiz, L.; Karaman, S.; Apak, R. A comprehensive review of CUPRAC methodology. R. Soc. Chem. 2011, 3, 2439–2453. [Google Scholar]
  90. Zhong, Y.; Shahidi, F. Methods for assessment of antioxidant activity in foods. Handb. Antioxid. Food Preserv. 2015, 1, 287–333. [Google Scholar]
  91. Tang, W.; Li, W.; Yang, Y.; Lin, X.; Wang, L.; Li, C.; Yang, R. Phenolic Compounds Profile and Antioxidant Capacity of Pitahaya Fruit Peel from Two Red-Skinned Species (Hylocereus polyrhizus and Hylocereus undatus). Foods 2021, 10, 1183. [Google Scholar] [CrossRef] [PubMed]
  92. Tang, G.-Y.; Zhao, C.-N.; Liu, Q.; Feng, X.-L.; Xu, X.-Y.; Cao, S.-Y.; Meng, X.; Li, S.; Gan, R.-Y.; Li, H.-B. Potential of Grape Wastes as a Natural Source of Bioactive Compounds. Molecules 2018, 23, 2598. [Google Scholar] [CrossRef] [Green Version]
  93. Nenadis, N.; Kyriakoudi, A.; Tsimidou, M. Impact of alkaline or acid digestion to antioxidant activity, phenolic content and composition of rice hull extracts. Food Sci. Technol. 2013, 54, 207–215. [Google Scholar] [CrossRef]
  94. Apak, R.; Guclu, K.; Ozyurek, M.; Bektasoglu, B.; Bener, M. Cupric ion reducing antioxidant capacity assay for food antioxidants: Vitamins, polyphenolics, and flavonoids in food extracts. Methods Mol. Biol. 2008, 477, 163–193. [Google Scholar] [PubMed]
  95. Mohan, S.C.; Balamururgan, V.; Salini, T.; Rekha, R. Metal ion chelating activity and hydrogen peroxide scavenging activity of medicinal plant Kalanchoe pinnata. J. Chem. Pharm. Res. 2012, 4, 197–202. [Google Scholar]
  96. Taha, R.M.; Mohajer, S.; Banisalam, B. Antioxidant Activity and Total Phenolic and Flavonoid Content of Various Solvent Extracts from in vivo and in vitro Grown Trifolium pratense L. (Red Clover). Biomed Res. Int. 2015, 2015, 643285. [Google Scholar]
  97. Ammar, A.F.; Baeshen, M.; Aqlan, F.M.; Siddeeg, A.; Chamba, M.V.M.; Afifi, M.; Almulaiky, Y.Q.; Alayafi, A. Solvent effects on antioxidant activities and phenolic contents of the alhydwan (Boerhavia elegana choisy) seed flour. J. Food Meas. Charact. 2018, 12, 2121–2127. [Google Scholar] [CrossRef]
  98. Bendary, E.; Francis, R.R.; Ali, H.; Sarwat, M.I.; El Hady, S. Antioxidant and structure–activity relationships (SARs) of some phenolic and anilines compounds. Ann. Agric. Sci. 2013, 58, 173–181. [Google Scholar] [CrossRef]
  99. Louaileche, H.; Zegane, O.; Keciri, S. Ortho-Diphenol Content, Iron Chelating and Hydrogen Peroxide Scavenging Properties. Int. J. Bioinf. Biomed. Eng. 2015, 3, 211–215. [Google Scholar]
  100. Carrasco-Pancorbo, A.; Gomez-Caravaca, A.M.; Cerretani, L.; Bendini, A.; Segura-Carretero, A.; Fernandez-Gutierrez, A. Rapid quantification of the phenolic fraction of Spanish virgin olive oils by capillary electrophoresis with UV detection. J. Agric. Food Chem. 2006, 54, 7984–7991. [Google Scholar] [CrossRef] [PubMed]
Figure 1. Extraction procedure for maceration extraction, acid hydrolysis and alkaline hydrolysis.
Applsci 12 12187 g001
Figure 2. Mean values for total phenolic content (TPC) of olive mill waste extracts using three different solvent extraction methods—methanol, acid and alkaline (black, red and green bars, respectively) with error bars showing ± 1SD for three independent trails.
Applsci 12 12187 g002
Figure 3. Mean values for total flavonoid content (TFC) of olive mill waste extracts using three different solvent extraction methods—methanol, acid and alkaline (black, red and green bars, respectively) with error bars showing ± 1SD for three independent trails.
Applsci 12 12187 g003
Figure 4. Mean values for total ortho-diphenolic content (TdPC) of olive mill waste extracts using three different solvent extraction methods—methanol, acid and alkaline (black, red and green bars, respectively) with error bars showing ± 1SD for three independent trails.
Applsci 12 12187 g004
Figure 5. (A) Total phenolic content (TPC), (B) total flavonoid content (TFC) and (C) total ortho-diphenolic content (TdOPC) of four different Bidni cultivars (collected during different dates between September and November) using three different solvent extraction methods—methanol, acid and alkaline (black, red and green bars, respectively) with error bars showing ± 1SD for three independent trails.
Applsci 12 12187 g005
Figure 6. Mean of cupric reducing antioxidant activity of olive mill waste extracts using three different solvent extraction methods—methanol, acid and alkaline (black, red and green bars, respectively) with error bars showing ± 1SD for three independent trails.
Applsci 12 12187 g006
Figure 7. Mean of ferric reducing antioxidant activity of olive mill waste extracts using three different solvent extraction methods—methanol, acid and alkaline (black, red and green bars, respectively) with error bars showing ± 1SD for three independent trails.
Applsci 12 12187 g007
Figure 8. Mean values for hydrogen peroxide scavenging activity of olive mill waste extracts using three different solvent extraction methods—methanol, acid and alkaline (black, red and green bars, respectively) with error bars showing ± 1SD for three independent trails.
Applsci 12 12187 g008
Figure 9. (A) Correlation between TPC and TFC. The ρ-value of methanolic extracts (■) was 0.67, for acidic hydrolysis (+) it was −0.09 and for alkaline hydrolysis () it was 0.51. (B) Correlation between TPC and TdOPC. The ρ-value of methanolic extracts (■) was 0.67, for acidic hydrolysis (+) it was 0.23 and for alkaline hydrolysis () it was 0.57. (C) Correlation between TFC and TdOPC. The ρ-value of methanolic extracts was 0.95, for acidic hydrolysis (+) it was 0.77 and for alkaline hydrolysis () it was 0.96.
Applsci 12 12187 g009
Figure 10. (A) Correlation between TPC and FRAP. The ρ-value of methanolic extracts (■) was 0.78, for acidic hydrolysis (+) it was 0.80 and for alkaline hydrolysis () it was 0.76. (B) Correlation between TFC and FRAP. The ρ-value of methanolic extracts (■) was 0.45, for acidic hydrolysis (+) it was −0.35 and for alkaline hydrolysis () it was 0.052. (C) Correlation between TdOPC and FRAP. The ρ-value of methanolic extracts was 0.46, for acidic hydrolysis (+) it was 0.06 and for alkaline hydrolysis () it was 0.25. (D) Correlation between TPC and CUPRAC. The ρ-value of methanolic extracts (■) was 0.69, for acidic hydrolysis (+) it was 0.57 and for alkaline hydrolysis () it was 0.93. (E) Correlation between TFC and CUPRAC. The ρ-value of methanolic extracts (■) was 0.84, for acidic hydrolysis (+) it was 0.48 and for alkaline hydrolysis () it was 0.63. (F) Correlation between TdOPC and CUPRAC. The ρ-value of methanolic extracts was 0.83, for acidic hydrolysis (+) it was 0.58 and for alkaline hydrolysis () it was 0.69.
Applsci 12 12187 g010
Figure 11. (A) Correlation between TPC and hydrogen peroxide scavenging activity. The ρ-value of methanolic extracts (■) was 0.42, for acidic hydrolysis (+) it was 0.80 and for alkaline hydrolysis () it was 0.85. (B) Correlation between TFC and hydrogen peroxide scavenging activity. The ρ-value of methanolic extracts (■) was 0.45, for acidic hydrolysis (+) it was −0.60 and for alkaline hydrolysis () it was 0.55. (C) Correlation between TdOPC and hydrogen peroxide. The ρ-value of methanolic extracts was 0.46, for acidic hydrolysis (+) it was0.18 and for alkaline hydrolysis () it was 0.58.
Applsci 12 12187 g011
Figure 12. Chemical structures of ortho-diphenolic compounds highlighting the ortho-diphenolic structures.
Applsci 12 12187 g012
Figure 13. A figure shown by Johnson et al. [57], showing the structures of oleuropein, ligstroside and other related hydrolysis products.
Applsci 12 12187 g013
Table 1. C50s of olive oil extracts for DPPH Radical Scavenging activity. (BDS—Bella di Spagna and UDP—Uovo di Piccione).
DPPH
CultivarDateIC50 of
Alkaline
Hydrolysis
IC50 of Acid
Hydrolysis
IC50 of
Maceration
Extraction
Bidni26 October 20210.43 ± 0.051.12 ± 0.132.51 ± 0.18
Bidni2 November 20210.25 ± 0.020.60 ± 0.021.11 ± 0.24
Bidni16 November 20213.78 ± 0.473.77 ± 0.652.10 ± 0.26
BDS28 September 20210.20 ± 0.041.31 ± 0.151.51 ± 0.27
Carolea7 October 20210.70 ± 0.020.50 ± 0.108.76 ± 1.03
Carolea22 October 20210.42 ± 0.010.88 ± 0.237.06 ± 2.78
Carolea17 November 20215.00 ± 0.727.79 ± 0.812.34 ± 0.26
Cerasuola2 November 20210.85 ± 0.021.26 ± 0.148.69 ± 0.96
Coratina27 September 20210.61 ± 0.100.31 ± 0.045.29 ± 1.13
Coratina25 October 20210.65 ± 0.060.98 ± 0.113.68 ± 0.27
Frantoio27 September 20210.78 ± 0.180.94 ± 0.046.18 ± 1.08
Frantoio4 October 20210.70 ± 0.100.66 ± 0.132.03 ± 0.26
Frantoio19 October 20210.69 ± 0.210.43 ± 0.021.23 ± 0.13
Leccino17 October 20212.10 ± 0.263.06 ± 0.183.14 ± 0.10
Malti29 September 20212.75 ± 0.314.67 ± 0.457.25 ± 0.88
Mixed 12 October 20210.48 ± 0.060.44 ± 0.091.89 ± 0.34
Mixed 230 September 20210.43 ± 0.132.22 ± 0.251.79 ± 0.13
Bajda 14 October 20210.42 ± 0.060.32 ± 0.071.84 ± 1.01
Bajda 24 October 20210.43 ± 0.070.59 ± 0.052.49 ± 0.17
Picholine7 October 20210.37 ± 0.030.52 ± 0.212.67 ± 0.25
UDP4 October 20210.16 ± 0.030.81 ± 0.402.24 ± 0.12
UDP7 October 20210.81 ± 0.020.35 ± 0.013.79 ± 0.42
UDP25 October 20210.31 ± 0.050.34 ± 0.051.86 ± 0.65
Table 2. IC50s of olive oil extracts for ABTS radical cation stabilization assays. (BDS—Bella di Spagna and UDP—Uovo di Piccione).
ABTS
CultivarDateIC50 of Alkaline
Hydrolysis
IC50 of Acid
Hydrolysis
IC50 of
Maceration
Extraction
Bidni26 October 202184.68 ± 8.80191.10 ± 6.181837.88 ± 39.51
Bidni2 November 202143.91 ± 20.9590.77 ± 42.8112.81 ± 12.61
Bidni16 November 20210.09 ± 0.040.11 ± 0.030.27 ± 0.09
BDS28 September 202145.62 ± 3.5553.88 ± 4.089.80 ± 13.89
Carolea7 October 2021109.75 ± 17.596.11 ± 7.86839.02 ± 152.85
Carolea22 October 202198.94 ± 57.313.10 ± 2.96800.71 ± 173.90
Carolea17 November 20210.46 ± 0.140.65 ± 0.151.44 ± 0.13
Cerasuola2 November 20210.05 ± 0.0186.20 ± 5.53615.52 ± 45.12
Coratina27 September 202130.32 ± 22.234.05 ± 2.37800.30 ± 150.70
Coratina25 October 202172.72 ± 0.9795.02 ± 6.21295.80 ± 50.56
Frantoio27 September 2021247.11 ± 71.83574.30 ± 510.34591.98 ± 136.01
Frantoio4 October 2021217.80 ± 53.50199.43 ± 219.3645.27 ± 29.93
Frantoio19 October 202179.28 ± 2.5650.35 ± 6.0024.34 ± 8.83
Leccino17 October 20210.18 ± 0.050.04 ± 0.020.83 ± 0.06
Malti29 September 20210.19 ± 0.070.17 ± 0.080.61 ± 0.13
Mixed 12 October 20210.77 ± 0.4644.39 ± 4.19135.78 ± 40.30
Mixed 230 September 202174.14 ± 5.1777.38 ± 14.7914.26 ± 8.40
Bajda 14 October 20213.13 ± 3.6418.56 ± 6.4330.54 ± 14.41
Bajda 24 October 20215.82 ± 4.1048.35 ± 3.44174.72 ± 51.97
Picholine7 October 2021100.21 ± 13.930.48 ± 0.50262.26 ± 63.37
UDP4 October 20210.39 ± 0.670.63 ± 1.09106.88 ± 58.25
UDP7 October 202165.00 ± 11.050.03 ± 0.02269.47 ± 23.13
UDP25 October 20210.56 ± 0.670.27 ± 0.24157.46 ± 62.23
Table 3. IC50s of olive oil extracts for Superoxide Radical Scavenging activity assays. (BDS—Bella di Spagnaand UDP—Uovo di Piccione).
Superoxide Radical Scavenging Activity
CultivarDateIC50 of Alkaline
Hydrolysis
IC50 of Acid
Hydrolysis
IC50 of
Maceration
Extraction
Bidni26 October 202118.38 ± 1.3836.68 ± 2.1244.79 ± 9.10
Bidni2 November 202112.70 ± 0.2416.68 ± 2.058.07 ± 5.36
Bidni16 November 20214.43 ± 3.9711.40 ± 3.8211.23 ± 10.15
Bidni29 September 20215.32 ± 0.418.37 ± 3.482.46 ± 1.77
BDS28 September 20211.30 ± 0.0912.18 ± 4.588.96 ± 1.30
Carolea7 October 202111.25 ± 0.123.36 ± 0.9213.27 ± 5.03
Carolea22 October 20213.39 ± 2.545.06 ± 1.4011.69 ± 2.08
Carolea17 November 20210.28 ± 0.359.48 ± 1.5913.27 ± 4.77
Carolea19 October 20210.85 ± 0.389.00 ± 1.5010.62 ± 1.02
Cerasuola2 November 202115.66 ± 2.299.07 ± 4.797.91 ± 0.83
Coratina27 September 20215.57 ± 4.0911.98 ± 3.128.44 ± 9.72
Coratina25 October 20217.60 ± 1.628.86 ± 2.6623.53 ± 4.69
Frantoio27 September 202114.08 ± 5.8510.02 ± 3.3217.59 ± 4.47
Frantoio4 October 20211.30 ± 0.954.32 ± 0.5128.00 ± 2.42
Frantoio19 October 20214.00 ± 0.599.59 ± 1.253.28 ± 3.37
Leccino17 October 202116.10 ± 10.415.10 ± 0.646.86 ± 5.34
Malti29 September 202113.87 ± 2.717.11 ± 0.8113.01 ± 10.37
Mixed 12 October 202123.86 ± 4.265.66 ± 0.9412.58 ± 3.40
Mixed 230 September 202120.95 ± 6.2927.51 ± 6.288.55 ± 4.38
Bajda 14 October 202114.86 ± 3.428.70 ± 2.973.77 ± 2.39
Bajda 24 October 202110.40 ± 2.947.19 ± 2.0018.90 ± 4.50
Picholine7 October 20211.83 ± 1.197.04 ± 1.4822.26 ± 15.31
UDP4 October 20214.94 ± 0.463.63 ± 0.462.90 ± 2.19
UDP7 October 202114.61 ± 0.495.36 ± 1.5011.03 ± 0.79
UDP25 October 20219.22 ± 2.0810.87 ± 0.4120.74 ± 1.18
Table 4. Correlation analysis between all assays.
Correlation Analysis
Methanolic ExtractsAcid HydrolysisAlkaline Hydrolysis
TPC
TPC–TFC0.67−0.090.51
TPC-TdOPC0.670.230.57
TPC-FRAP0.780.800.76
TPC-CUPRAC0.690.570.93
TPC-DPPH−0.73−0.50−0.47
TPC–ABTS−0.70−0.47−0.57
TPC–H2O20.420.800.85
TFC
TFC-TdOPC0.950.770.96
TFC–FRAP0.45−0.350.052
TFC-CUPRAC0.840.480.63
TFC–DPPH−0.460.340.20
TFC–ABTS−0.77−0.21−0.67
TFC–H2O20.45−0.600.55
TdOPC
TdOPC-FRAP0.460.060.25
TdOPC-CUPRAC0.830.580.69
TdOPC–DPPH−0.430.150.17
TdOPC–ABTS−0.73−0.26−0.70
TdOPC–H2O20.460.180.58
Publisher’s Note: MDPI stays neutral with regard to jurisdictional claims in published maps and institutional affiliations.

