Article

The Relatively Stable Seepage Field: A New Concept to Determine Seepage Field in the Design of a Dry-Stack Tailings Pond

1
School of Civil Engineering, Shijiazhuang Tiedao University, Shijiazhuang 050043, China
2
Key Laboratory of Roads and Railway Engineering Safety Control (Shijiazhuang Tiedao University), Ministry of Education, Shijiazhuang 050043, China
*
Author to whom correspondence should be addressed.
Appl. Sci. 2022, 12(23), 12123; https://doi.org/10.3390/app122312123
Submission received: 3 September 2022 / Revised: 6 November 2022 / Accepted: 23 November 2022 / Published: 27 November 2022
(This article belongs to the Special Issue Advances in Geotechnologies in Infrastructure Engineering)

Abstract

:
The determination of seepage field is the basis to design seepage drainage facilities and dam slopes in tailings pond. However, in the design of a dry-stack tailings pond with a long service life, previous research has been mostly limited to the influence of short-term rainfall, and a proper concept has not been formed to guide the calculation of the seepage field in the design of a dry-stack tailings pond under the cumulative effect of long-term periodic rainfall. The objective of this study is to propose a new concept to concisely determine the seepage field for the design of a dry-stack tailings pond under multi-year periodic rainfall. To this end, the calculation model of the seepage field of a dry-stack tailings pond under multiyear rainfall was established. The evolution process of the seepage field was studied by numerical simulation based on the calculation model and the final form of the seepage field evolution of a dry-stack tailings pond was found. Accordingly, a new concept, the relatively stable seepage field (RSSF) which can be used as the basis for seepage drainage facilities and the dam slope design of a dry-stack tailings pond, was proposed and named. Furthermore, the influencing factors of a relatively stable seepage field were studied by numerical simulation. The results show that: (1) the cumulative infiltration of long-term periodic rainfall is the main reason for the formation of the RSSF, and (2) under the condition of constant annual rainfall, the distribution of the RSSF has little to do with the selection of rainfall mode. Therefore, a new understanding has been formed from this article whereby the RSSF is an essential basis to be considered in the design of the dam slope and drainage system of a dry-stack tailings pond.

1. Introduction

A tailings pond refers to the places where dams are built to intercept valleys or enclosures to stack the tailings or other industrial waste residues from metal or non-metal mines after ore separation. A tailings pond is one of the three basic projects of mining facilities and is also a major hazard source of mining projects. Tailings pond accidents occur from time to time all over the world, causing significant damage to the economy and, downstream, people’s lives and properties [1,2,3,4,5]. The tailings dam of the Córrego do Feijão iron mine in Brazil broke on 25 January 2019, with a dam breaking volume of 12 million m3, causing more than 230 deaths and serious environmental pollution [6]. Compared with a traditional hydraulic-filled tailings pond, a dry-stack tailings pond has become a tailings storage form strongly advocated by the Chinese government [7] due to its obvious advantages of safety and environmental protection [8,9].
In the design of a tailings pond, seepage field analysis is an important basis for the design and stability analysis of tailings ponds [10,11,12]. China’s current Code for Design of Tailings Facility (GB50863-2013) does not specify the calculation method of seepage field analysis of dry-stack tailings ponds [13], which brings uncertainty to the design of dry-stack tailings ponds. As there is no standard method for calculating the seepage field, discharge pipes are usually set in the dam body of dry-stack tailings ponds to control unpredictable phreatic lines. When the phreatic line is very low, it may be a waste. Therefore, accurate determination of the seepage field in a dry-stack tailings pond can optimize its design and save costs. The saturation line in the standard seepage field is the lifeline of a tailings pond [13], and accurate determination of the seepage field is crucial to the design of the slope of the dry-stack tailings pond. In brief, the study on the seepage field of dry-stack tailings ponds under rainfall is very important to guide the design of dry-stack tailings ponds.
For a dry-stack tailings pond, there is no water stored. Hence, the seepage field is mainly affected by rainfall infiltration [14,15]. In the analysis of seepage field of dams or slopes under rainfall, differential equations can be established based on seepage theory [16], and the boundary conditions and initial conditions can be determined according to the actual situation. The seepage field can be solved by theoretical derivation [16,17] or numerical simulation [18,19]. The distribution characteristics and evolution law of the seepage field can be reflected by indicators such as pore water pressure [20] and the change in groundwater level (phreatic line) [20,21]. The above research methods have been widely used in the stability analysis of slope seepage under rainfall [17,18]. Guanhua Sun [17] used the theoretical analysis method to determine the saturation line equation of the slope, but the saturation line equation is applicable to specific boundary conditions. Rahimi Arezoo [18] used the finite element method to analyze the distribution law of seepage field of slopes under different rainfall modes. In general, the theoretical method to determine the seepage field is suitable for simpler boundary conditions [16]. Correspondingly, the numerical simulation method can be applied to complex boundary conditions and initial conditions, which is why it is more widely used [18,19]. At present, there are many achievements in slope seepage and stability analysis under rainfall. Relevant literature shows that different rainfall patterns [18,22], amounts of rainfall [23], rainfall periods [20], prophase rainfall [24], soil materials [25,26], and different slopes [27] have a greater impact on the slope seepage field under rainfall.
Compared with general slopes, there are only a few studies focused on the seepage field of dry-stack tailings ponds under rainfall. Although the research method of dry-stack tailings ponds under rainfall is the same as that of general slopes, the emphasis of the two studies is obviously different. Comparatively, because general slopes always have smaller volumes, and their seepage fields are easily affected by short-term rainfall [17,18,22], researchers pay more attention to the response of the transient seepage field of the slope under short-term rainfall [25,26,27,28], whereas a dry-stack tailings pond always has a high dam slope and large volume, and, in addition, has a considerable storage capacity for the rainwater. Moreover, under multi-year periodic rainfall, the water content of tailings in the dry-stack tailings ponds will continue to rise, and the saturation line of its internal seepage field will also increase year by year [13]. This may threaten the long-term stability of the dam, but the current research mainly examines the behavior of short-term rainfall and has not studied the behavior of long-term rainfall. Therefore, there exists a gap in that the study of the seepage field of dry-stack tailings ponds under rainfall cannot be limited to short-term rainfall but should focus on the evolution law of the unstable seepage field of dry-stack tailings ponds under rainfall for many years. At the same time, this seepage field is of great significance in predicting the seepage stability of dry-stack tailings ponds at their design stage. Based on this, the current study investigates the long-term evolution law of the seepage field of dry-pile tailings ponds under the action of rainfall for many years, in order to reveal the potential stability of the whole dam structure caused by rainfall for many years.
In this study, the essential reasons for the evolution of the seepage field in dry-stack tailings ponds were analyzed, the factors that need to be considered in the calculation model were determined (in Section 2.1), and then a numerical analysis model of the seepage field was established (in Section 2.2 and Section 2.3). On this basis, the evolution law of the seepage field in dry-stack tailings ponds was investigated (in Section 3.1), and the final distribution and influencing factors of the seepage field were analyzed (in Section 3.2 and Section 3.3), which provides the basis for the drainage design and stability analysis of dry-stack tailings ponds.

2. Materials and Methods

2.1. Problem of Seepage Field in Dry-Stack Tailings Ponds

2.1.1. Analysis of Influencing Factors of Water in Dry-Stack Tailings Ponds

When analyzing the seepage field of dry-stack tailings ponds, both water entering and drainage out of the seepage field should be firstly considered, as shown in the Figure 1. The main sources of water entering the seepage field include: residual water of tailings, rainfall, and infiltration of flood water after ponding in the dry beach. The drainage out of the seepage water mainly includes: the drainage through the initial dam, the drainage through drainage pipe buried in the dam, evaporation, and leakage through the pond bottom.
From Figure 1, taking the dry-stack tailings pond as the hydrogeological unit, the volume of water entering the seepage field is calculated by Equation (1):
d V i n = d V r + Q r n d t + Q f d t
where, Vin is volume of water entering the tailings pond, V0 is initial volume of water in the tailings, Qrn is the flow caused by rainfall infiltration, and Qf is the infiltration flow of flood after ponding in the dry beach under extreme rainfall.
The residual water content of tailings is related to the tailings concentration process, and it can be considered through the initial water content in the calculation. V0 has nothing to do with time, so Equation (2) is satisfied:
dV0 = 0
The confluence of the flood on the dry beach generally occurs only after extreme rainfall. Current specifications in China require that the flood is drained through the flood drainage system within 3 days. In ordinary times, there is no water in the dry beach of the tailings pond. This part has little impact on the long-term seepage field of the tailings pond and can be ignored in the calculation, which satisfies Equation (3):
Qf = 0
Rainfall infiltration is the main source of the seepage field evolution of dry-stack tailings ponds. From the literature review in the introduction, it can be seen that short-term rainfall infiltration has little impact on the seepage field of tailings ponds. So, it is essential to consider the cumulative effect of multi-year rainfall on the seepage field of dry-stack tailings ponds. Therefore, in the design of a tailings pond or the management of a closed tailings pond, it is necessary to consider the effect of accumulated rainfall infiltration on the seepage field during the life cycle of the tailings pond.
By simultaneous Equations (1)–(3), the volume of water entering the tailings pond is calculated by Equation (4)
d V i n = Q r n d t
The volume of water drainage out of the seepage field is calculated by Formula (5),
d V o u t = Q d 1 d t + Q d 2 d t + Q e d t + Q l d t
where Vout is volume of water discharge out of the seepage field, Qd1 is rate of flow of water drainage through the initial dam, Qd2 is rate of flow of water drainage through a drainage pipe buried in the dam, Qe is rate of flow of water evaporation, and Ql is rate of flow of water leakage through the reservoir bottom.
The initial dam of the tailings pond is generally a permeable dam, and it is the main way for seepage water discharging out of the tailings and it must be considered in the calculation. In the dry-stack tailings pond, drainage pipes buried in the dam body are mainly used to control the phreatic line. When the buried depth of the phreatic line is lower than the position of the drainage pipe, it cannot be considered in the calculation, thus the calculation result of the seepage field tends to be safer. Therefore, in this study, Qd2 satisfies Equation (6):
Qd2 = 0
Although the influence of evaporation is not considered in most slope rainfall seepage and stability analyses [22,23,24,25,26], under the condition of multi-year periodic rainfall, the influence of evaporation on the seepage field of a dry-stack tailings pond has a cumulative effect, which needs to be considered. This is also an important characteristic of the difference between tailings ponds and ordinary slopes.
In order to eliminate the pollution of the dry-stack tailings pond, the impermeable layer is generally laid at the lower part of the dam to avoid seepage pollution, so it can be considered according to the actual situation. Therefore, in this study, Ql satisfies Equation (7):
Ql = 0
By simultaneous Equations (5)–(7), the volume of water entering the tailings pond is calculated by Equation (8)
d V o u t = Q d 1 d t + Q e d t

2.1.2. Water Balance Model of Seepage Field in the Dry-Stack Tailings Pond

During the evolution of the seepage field of the dry-stack tailings pond, according to the principle of mass conservation, when the volume of inflow water is larger than the volume of discharge water, the water volume in the seepage field will increase and the phreatic line will increase. When the water into the seepage field is equal to the water discharge out of seepage field, that is, when Equation (9) is satisfied, the seepage field in the tailings pond is in a stable state.
dVin = dVout
By simultaneous Equations (1)–(9), when Equation (10) is satisfied, the seepage field of the tailings pond becomes stable, and the seepage field is in equilibrium. On the contrary, if Equation (10) is not satisfied, the seepage field of the dry-stack tailings pond does not reach a stable state.
Qrn = Qd1 + Qe
From Equation (10), the main factors considered in establishing the calculation model should include the contribution of rainfall infiltration and the initial water content of tailings, as well as water drainage through the initial dam and water evaporation from the dam. In this study, the SEEP program of GeoStudio is applied to establish the numerical analysis model of the seepage field of the dry-stack tailings dam. The rainfall infiltration flow and evaporation are considered by the flow boundary, and the initial dam seepage is automatically calculated by the program. The Equation (10) is transformed into Equation (11)
ΔQrn = Qd1
where ΔQrn is the net infiltration flow of rainfall deducting evaporation within a certain time (in this study, a certain time is a month). In the same region, the rainfall and evaporation are relatively stable in a year, so the annual average value of ΔQrn can be considered constant. Qd1 is the initial dam discharge flow. As the water level of the phreatic line of the seepage field rises, Qd1 will gradually increase. When Qd1 satisfies Equation (11), the seepage field of the dry-stack tailings pond will finally evolve to an equilibrium state, that is, the final state of the seepage field of the dry-stack tailings pond. Therefore, this seepage field can be used as the basis for the design of the drainage system and dam slope of a dry-stack tailings dam and also as the basis for predicting the long-term stability of a dry-stack tailings dam. It is worth noting that due to the fluctuation in seasonal rainfall, the final seepage field is relatively stable.
In the following study, we will mainly study the evolution law of the seepage field, analyze the influencing factors, and judge the criteria of the final state of the seepage field.

2.2. Theory of Seepage Calculation in Unsaturated Soil

The seepage analysis of the dry-stack tailings under rainfall is carried out under the SEEP/W module in the Geostudio platform. The two-dimensional transient seepage theory is used, and the governing Equation (12) is adopted [18].
x k w x h w x + y k w y h w y + q = m w 2 γ w h w t
where kwx is the permeability coefficient in the x direction, kwy is the permeability coefficient in the y direction, which is usually a function of matric suction or soil volumetric water content and can be determined according to the soil–water characteristic curve. hw is the water head, q is the boundary flow caused by rainfall, m w 2 is the gradient of the soil–water characteristic curve, γw is the gravity of water, and t is the seepage time.
As shown in Equation (13), the Fredlund and Xing model is used for the unsaturated soil–water characteristic curve [29].
θ ψ , α , n , m = C ψ θ s ln e + ψ / α n m C ψ = ln 1 + ψ / ψ r ln 1 + 10 6 / ψ r + 1
where θ is the volume moisture content, θs is the saturated volume moisture content, e is the base of natural logs, m is the parameter related to residual water content, n is the parameter related to the gradient of inflection point of the soil–water characteristic curve, α is the matrix suction corresponding to the inflection point of the volume water content function, which is about the air entry value in the soil, ψ is matrix suction, and ψr is the matrix suction corresponding to the residual moisture content.
In Equation (12), the permeability coefficient of unsaturated soil can be tested by the transient profile method in the laboratory; the parameter m w 2 can be calculated by using the soil–water characteristic curve. The soil–water characteristic curve can be tested by the filter paper method, mercury injection method (MIP), pressure plate test, etc. In Equation (13), the saturated water content θs can be determined by an oven-drying method, and four other parameters, ψr, α, m, and n, can be obtained from fitting the experimental results of the soil–water characteristic curve (SWCC).

2.3. Establishment of Numerical Model

2.3.1. Establishment of Tailings Pond Model

In China, there are three types of dry-stack tailings ponds [13], among which the dry-stack tailings ponds discharging ore in front of the dam accounts for a larger proportion. This study mainly focuses on the seepage field in the dry-stack tailings ponds discharging ore in front of the dam under rainfall conditions.
According to the general provisions in the specification [13] on tailings ponds, the parameters of dry-stack tailings ponds in this paper are set as follows: the initial dam is a permeable dam, which is built of gravel material with a height of 15 m, an outer slope ratio of 1:2, and an inner slope ratio of 1:1.75; the accumulation dam is built and compacted by tail silt, including 6 sub-dams with the height of 10 m, slope ratio of 1:2.5, and platform width of 5 m. The total dam height of the tailings pond is 75 m. In this study, three kinds of bottom slope i = 0.05, 0.1, and 0.15 were selected. As shown in Figure 2, the angle between the bottom slope line of the tailings pond and the horizontal line is set as β and i = sinβ.

2.3.2. Parameters of Soil Material

There are many unsaturated parameter models of soil [16,19,30], the commonly used models include the Fredlund and Xing model [31], the Van Genuchten model [32,33], etc. The material of dry-stack tailings ponds is unclassified tailings, which is evenly distributed in the tailings pond and is considered as an isotropic material. In this study, the Fredlund and Xing model (Equations (12) and (13)) was used to describe the unsaturated soil properties of tailings. Since it is not for a certain tailings material, the saturated water content and saturated permeability coefficient of the materials can be taken according to experience. The other parameters in the Fredlund and Xing model of unsaturated soil were determined by the sample function method which was provided by the Geostudio platform. The gravel material was selected for the initial dam and the saturated water content was set as 0.295. The gravel sample function was used to fit the unsaturated soil–water characteristic curve. The tailings silt was selected for the accumulation dam, and the saturated water content was set as 0.402. The silt sample function was used to fit the soil–water characteristic curve of the tailings silt. The relationship between the permeability coefficient and the matrix suction was estimated by the Fredlund and Xing model. The saturated permeability coefficient of the gravel was set as 1.25 × 10⁻⁴ m/s, and the saturated permeability coefficient of the tailings silt was set as 3.75 × 10⁻⁶ m/s. The soil–water characteristic curve and hydraulic conductivity curve of the material are shown in Figure 3.

2.4. The Boundary Conditions and Initial Condition

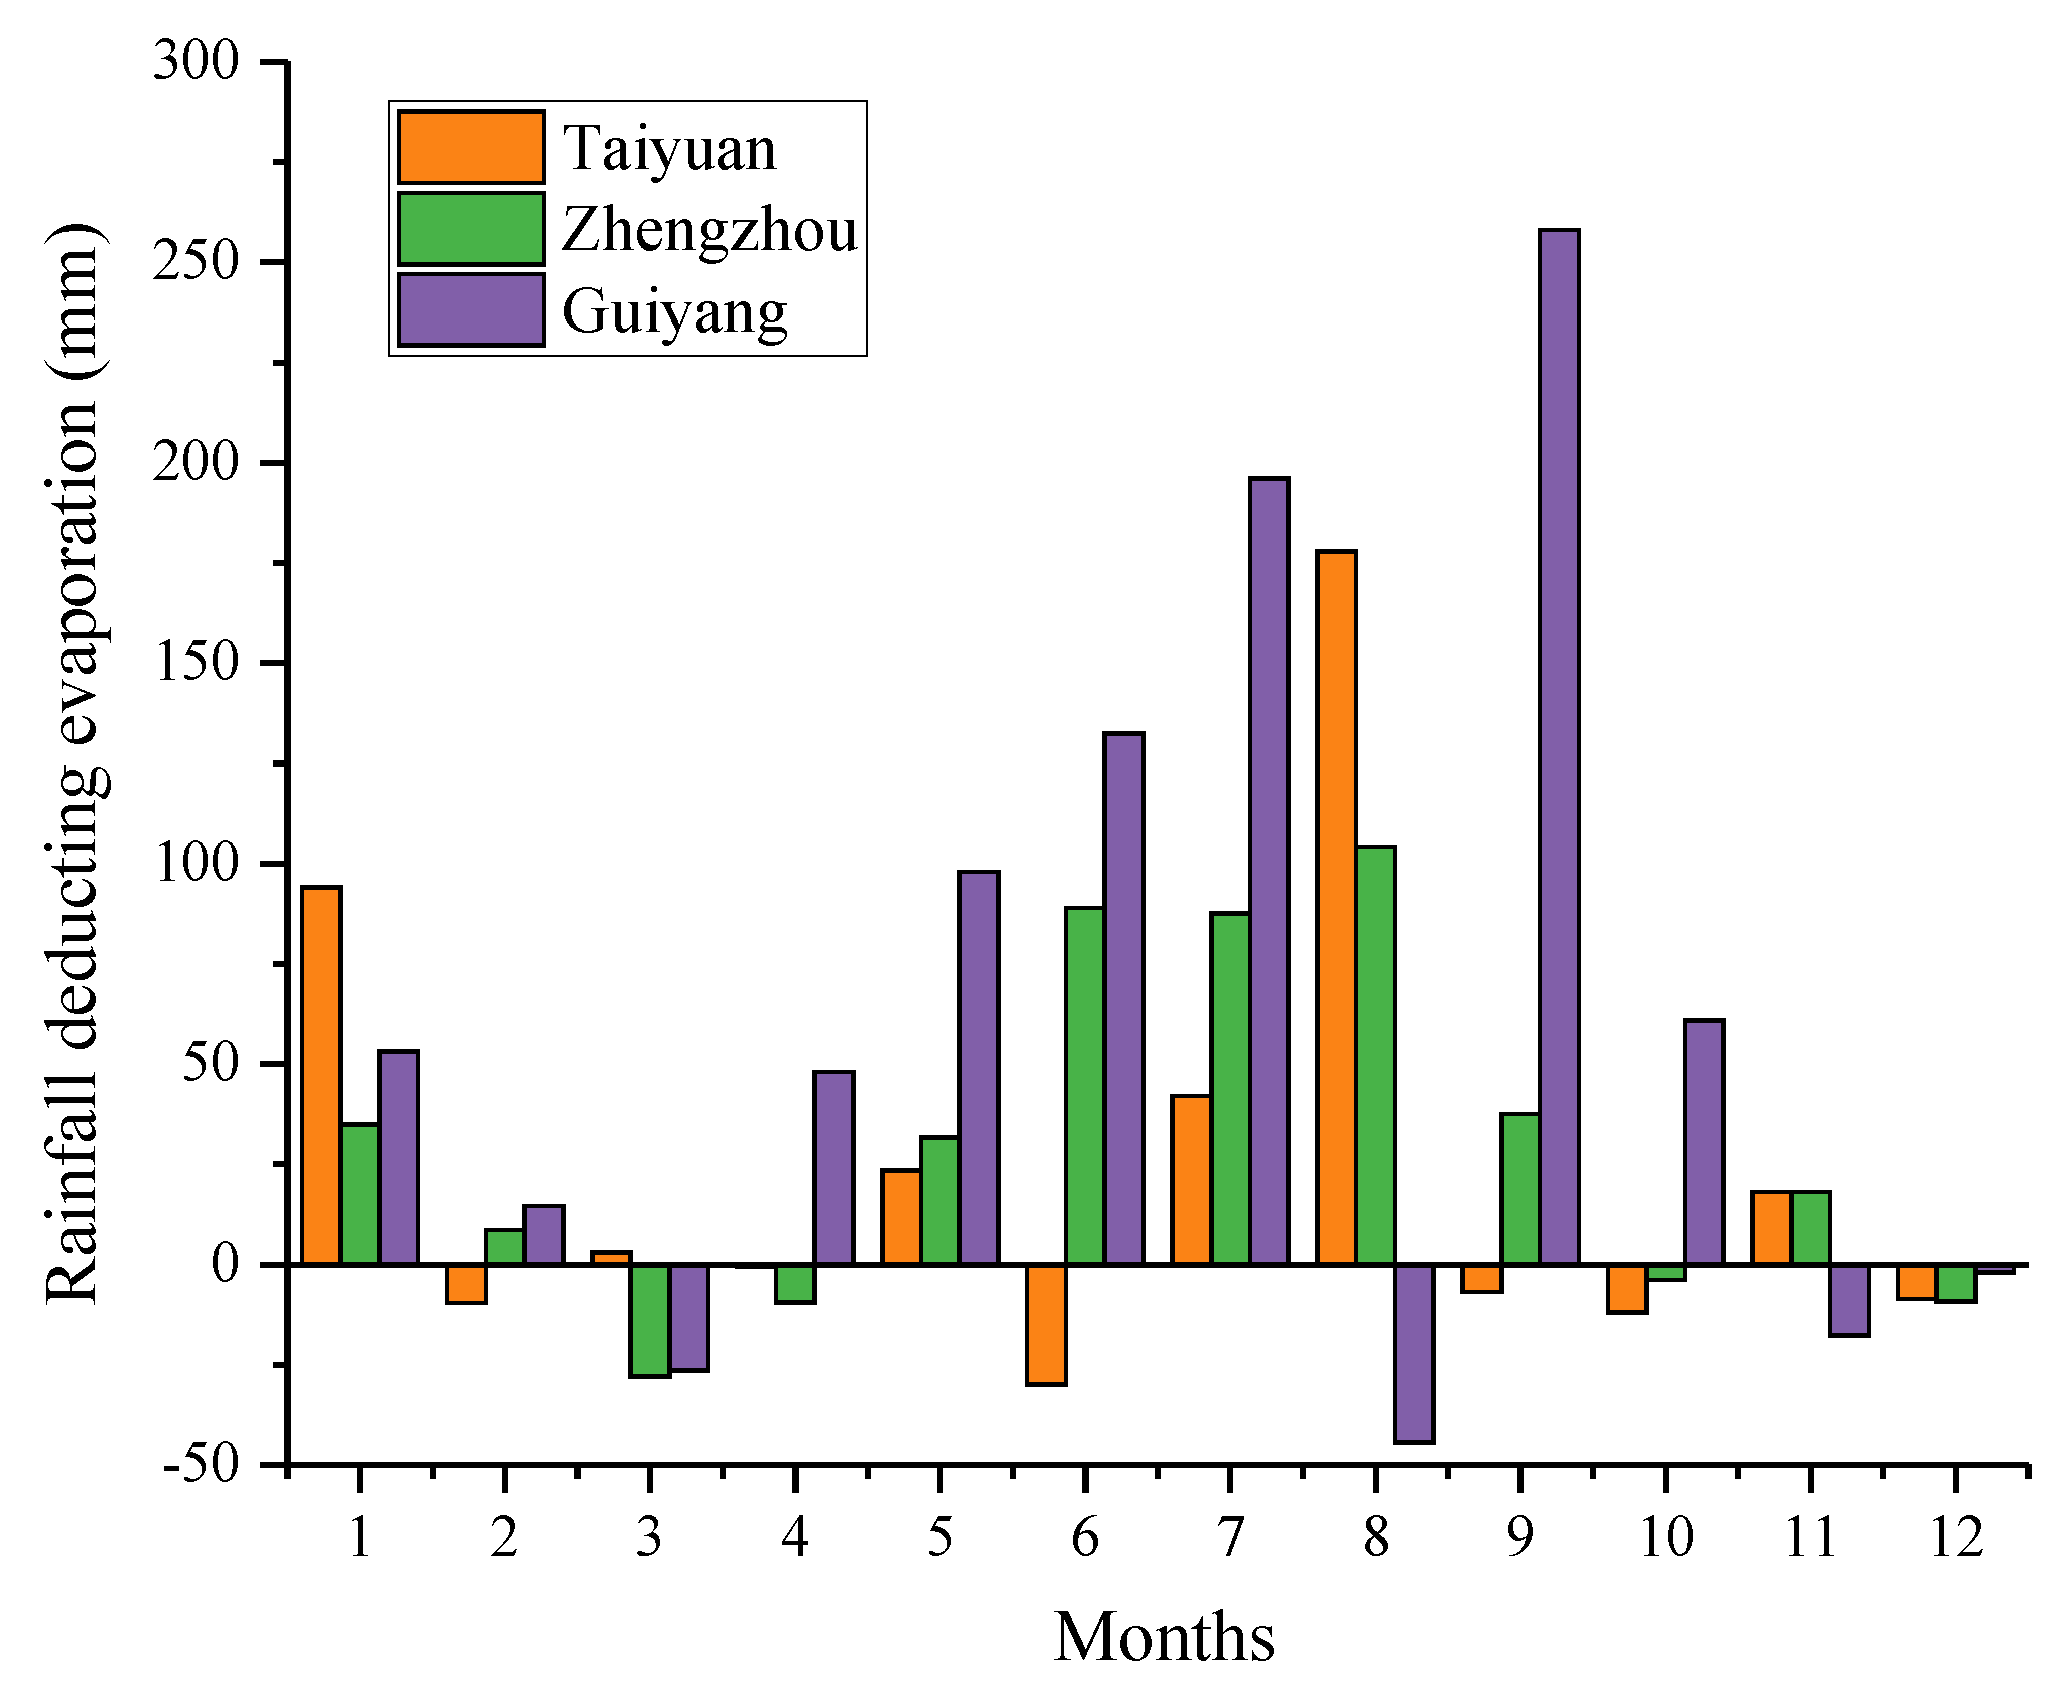
2.4.1. Determination of Rainfall Patterns

In this study, the rainfall curve is determined in the following ways, instead of a specific area where a tailings pond is located. The total rainfall, in this study, is considered unchanged in a certain region within one year. To reflect the influence of the rainfall duration curve on the research results, the real rainfall curves of three different years in the region were selected and normalized to the same total rainfall, so as to form different annual rainfall duration curves.
According to the rainfall distribution data in China, the real rainfall history of Taiyuan (normalized as the annual rainfall of 400 mm), Zhengzhou (normalized as the annual rainfall of 800 mm), and Guiyang (normalized as the annual rainfall of 1200 mm) in 2018, 2019, and 2020 were selected as the rainfall curves. The rainfall distribution after normalization is shown in Figure 4.

2.4.2. Rainfall Boundary Conditions and Initial Condition

The boundary condition was set with the flow boundary, and the value was the rainfall intensity. For the same rainfall curve, the rainfall duration was set to 150 years. For comparison, the initial conditions are uniformly set as the negative pore water pressure in the dam is −49 kPa, and the corresponding initial moisture content is 0.15.

2.5. Numerical Simulation Conditions

Definition of the working conditions: the bottom slopes of the tailings pond with i = 0.05, 0.1, and 0.15 are represented by I, II, and III, and the different rainfall curves are represented by letters a to i. Then, the working conditions can be expressed as Table 1.
In the calculation conditions, different rainfall patterns and annual rainfalls are considered and evaporation effects are discussed.

3. Results and Discussion

3.1. Results of Numerical Simulation

The seepage analysis was calculated using the unsaturated soil seepage theory on the Seep/W module in the GeoStudio platform, and the rainfall duration of each rainfall curve was set to 150 years. In this study, nine rainfall conditions corresponding to the bottom slope of i = 0.1 were used to investigate the evolution law of seepage field in dry-stack tailings ponds. Combined with the results of the bottom slope of i = 0.05 and i = 0.15, the influencing factors of the evolution of seepage field in dry-stack tailings ponds were analyzed. In the study of the evolution law of seepage field, the typical positions in the tailings pond (the distribution of the points is shown in Figure 1) were used to study the changing process of pore water pressure at different positions with time in the process of rainfall, so as to analyze the evolution process of the seepage field in the tailings pond. In order to properly express the evolution characteristics of the seepage field in dry-stack tailings ponds, the variation in the saturation line with time and its influencing factors were analyzed.

3.1.1. The Spatial-Temporal Evolution Process of the Seepage Field in Dry-Stack Tailings Ponds under the Action of Multi-Year Rainfall

Considering that there are many working conditions and that the laws revealed by working condition 1, working condition 2, and working condition 3 are similar, the author arbitrarily selected condition II to explain the evolution process of the seepage field in dry-stack tailings ponds in this paper. The evolution process of pore pressure at typical points A, B, and C (marked in Figure 2) in dry-stack tailings ponds is shown in Figure 5.
It can be seen from Figure 5 that under different working conditions, the growth modes of pore water pressure at various points at the bottom of the dry-stack tailings pond are basically the same. In the case of a certain amount of annual rainfall, the variation law of pore water pressure at the same position of the tailings pond under different rainfall patterns is the same. Correspondingly, the numerical difference is not large. The final pore pressure of each point at the bottom of the tailings pond grows with the increase in annual rainfall. According to the growth curve of pore water pressure at each point, the changing process of pore water pressure can be divided into three stages: the rapid, the slow, and the relatively stable increase stages of pore pressure with rainfall years of 0–20a, 20–50a, and 50–150a, respectively. The changes in pore water pressure values in the corresponding three stages are shown in Table 2, Table 3 and Table 4. It should be noted that the division of the time periods of the three stages is not very accurate, and the purpose is mainly to facilitate the description of the pore pressure development mode in the seepage field of the tailings pond.
Stage 1: Under the action of rainfall, the pore pressure increases relatively fast in the early stage, and the growth values of pore water pressure at each point in this stage are shown in Table 2.
In this stage, the pore water pressure at the bottom of the tailings pond changes from negative to positive, indicating that the saturation line of the tailings pond has been formed in this stage. In Figure 4a, for different rainfall patterns, the positive pore water pressure first appeared at points A and C when the rainfall lasted 4.75 years, while point B remained negative. This indicates that the saturation line began to appear, but there was no complete saturation line in the dam, due to the different thicknesses of tailings in the dry-stack tailings pond. The thickness of tailings at point B is greater than that at points A and C, and the influence of rainfall infiltration on point B is slower than that of points A and C. Positive pore pressure also appeared at point B after 5.75 years, indicating that a complete saturation line began to appear in the dry-stack tailings pond in 5.75 years. The same phenomenon is found in Figure 4b,c. The difference is that under the condition of annual rainfall of 800 mm, the positive pore water pressure occurred at points A and C after 3.25 years of rainfall, and at point B after 4.25 years of rainfall. Under the condition of annual rainfall of 1200 mm, the positive pore water pressure occurred at points A and C after 2.5 years of rainfall, and at point B after 3.25 years of rainfall. This indicates that the occurrence time of the saturation line in the dry-stack tailings pond is related to the annual rainfall. The higher the annual rainfall rate, the earlier the occurrence time of the saturation line, but it has little to do with the rainfall pattern.
Stage 2: the pore water pressure at each point in the tailings pond changes slowly and begins to approach a stable state. The growth value of the pore water pressure at each point in this stage is shown in Table 3.
Stage 3: the pore water pressure of each point in the tailings pond tends to be relatively stable and fluctuates within a certain range. The growth value of the pore water pressure in this stage is shown in Table 4.
In this stage, the pore pressure of points A, B, and C remained basically stable but fluctuated within a certain range. Referring to Figure 5a, the point C in Case II-a has the largest fluctuation with 0.6 kPa, ranging from 74.6 kPa to 75.2 k, which is a small fluctuation range. Hence, it can be considered that the seepage field is in a relatively stable state. Referring to Figure 5b, the point C in Case II-f has the largest fluctuation with 1.3 kPa, ranging from 153.2 kPa to 154.5 kPa. Compared with the pore water pressure value, the fluctuation range is not large, therefore it can be considered that the seepage field is in a relatively stable state. Referring to Table 2 and Figure 5c, the fluctuation of point C in Case II-i is the largest, with it fluctuating between 235.8 and 241.8, and the fluctuation range is 6.0 kPa. Compared with the pore water pressure value, the fluctuation range is small. The main reason for the fluctuation lies in the influence of the rainfall curve within one year, that is, the greater the rainfall rate, the greater the fluctuation of the relatively stable seepage field. However, compared with the total pore pressure value, the fluctuation is not large, so it can be considered that the seepage field is in a relatively stable state.

3.1.2. Evolution Process of the Saturation Line in the Dry-Stack Tailings Pond under Multi-Year Rainfall

The equipotential surface with a pore water pressure of 0 is called the saturation surface in three-dimensional space, which is correspondingly called the saturation line in two-dimensional profile. The saturation line is known as the lifeline of tailings ponds, which is the basis of seepage drainage design and the stability analysis of tailings pond. As shown in Figure 6, Figure 7 and Figure 8, the evolution process of the saturation line in the dry-stack tailings pond under multi-year rainfall with different working conditions was analyzed.
From Figure 6a–c, it can be seen that in Taiyuan, when the annual rainfall is 400 mm, the saturation line appeared in the local area of the dam after 5 years of rainfall, which is mainly distributed in the thinner position of the tailings sand. After 7.5 years, there was a clear saturation line in the whole dam body, and then the saturation line gradually lifted with the rainfall years, and the lifting speed was faster. After 50 years, the rise in the saturation line was not obvious, and then the saturation line gradually stabilized, approaching a saturation line similar to the steady state. Comparing Figure 6a–c, it can be seen that the evolution laws under different rainfall patterns are basically the same.
As shown in Figure 7 and Figure 8, when the annual rainfall is 800 mm or 1200 mm, the evolution law of the saturation line in the dry-stack tailings pond is similar to that when the annual rainfall is 400 mm. The difference is that when the rainfall is 800 mm or 1200 mm, the saturation line appears in the local area of the dam in the 2.5th year of rainfall, and after 5 years, the whole dam appears with an obvious saturation line, and the saturation line of annual rainfall of 1200 mm is higher than 800 mm. Thereafter, the saturation line gradually lifted with the increase in rainfall years and finally approached a relatively stable state.

3.1.3. The Concept and Significance of the Relatively Stable Seepage Field of the Dry-Stack Tailings Pond

In summary, from the perspective of the saturation line of the seepage field, under the action of long-period rainfall, the obvious saturation line is gradually formed at the bottom of the tailings pond. With the continuous rainfall, the saturation line in the tailings pond gradually rises and gradually tends to be in a relatively stable state. From the perspective of seepage field pore pressure, under the action of long-term rainfall, the pore pressure in the tailings pond gradually increases and tends to be relatively stable, that is, the final pore pressure remains basically unchanged and fluctuates in a small range. The seepage field in this relatively stable state is called the ‘relatively stable seepage field (RSSF)’ in this study.
According to the above research, the characteristics of RSSF are as follows: (1) under the action of multi-year periodic rainfall, a RSSF will be formed inside the dry-stack tailings pond; (2) the distribution of pore pressure and the saturation line in the seepage field is basically stable; (3) the pore pressure and saturation line in the RSSF fluctuate with the periodic rainfall, which is related to seasonal effects.
The RSSF is the final form of the seepage field in the dry-stack tailings pond under multi-year rainfall. Considering that the dry-stack tailings pond has a long design life and is a permanent structure, the RSSF can be used as the basis for the drainage design and stability analysis of dry-stack tailings ponds.

3.2. The Formation Mechanism and Discriminant Conditions of RSSF

3.2.1. The Formation Mechanism

The average rainfall infiltration flow Qrn of the dam body is defined as Equation (14):
Q r n = f × s t
where Qrn is the total infiltration flow into the tailings pond, f is the rainfall intensity, s is the rainfall area, which is the product of the unit width of the tailings pond and the total length of the dam body, and t is the duration time.
Corresponding to the rainfall in Taiyuan, f = 400 mm, t = 365 d, s = 538 m2, according to Formula (14): it can be ascertained that Qrn = 6.82 × 10⁻⁶ m3/s. Using the same methods, we can obtain Qrn = 1.364 × 10⁻⁵ m3/s when f = 800 mm, and Qrn = 2.047 × 10⁻⁵ m3/s when f = 1200 mm.
In the numerical analysis, the drainage flow through the initial dam at any time can be calculated, so the relationship curve between the drainage flow of the initial dam and the rainfall infiltration time can be drawn, as shown in Figure 9.
As can be seen from Figure 9a, the drainage flow of the initial dam grows with the increase in rainfall infiltration time. The drainage flow rate of the dam in the first 20 years is less than the average rainfall infiltration flow, which indicates that the water storage of the tailings in the dry-stack tailings pond is increasing, resulting in the continuous uplift of the saturation line in the dam. The larger the difference between the drainage flow and average rainfall infiltration flow, the faster the increase in the water storage in the dry-stack tailings pond and, furthermore, the faster the rise in the saturation line, which is consistent with the results about the evolution law of the saturation line in Figure 5, Figure 6 and Figure 7. Evidently, this reveals the reason for the rapid rise of the saturation line in the early stage of rainfall infiltration. With the time continuing, when the drainage flow of the initial dam is roughly equal to the average rainfall infiltration flow, the water storage in the tailings pond is no longer increased. Correspondingly, the saturation line is no longer uplifted, and the seepage field of the tailings pond is in a stable state. Due to the inhomogeneity of rainfall within a year, the seepage field of tailings pond will be in a fluctuating state, and its fluctuation characteristics are related to the rainfall curve. There are similar rules in Figure 9b,c.

3.2.2. Distinguishing Basis for Forming RSSF

How to judge whether the current seepage field of the dry-stack tailings pond reaches a relatively stable state is the key foundation for reasonable and accurate calculation of the RSSF. From the analysis in the previous sections, the reason for the formation of the RSSF of the dry-stack tailings pond has been found. It is that when the average rainfall infiltration flow and the initial dam drainage flow are in a dynamic equilibrium state, the internal water content of the dam body does not change much in a year, thus the saturation line of the dry-stack tailings pond is in a relatively stable state. Therefore, as show in Figure 9, the relative relationship between the initial dam drainage flow and the average rainfall infiltration flow can be used to judge whether a RSSF has been formed. However, considering the large fluctuation in the drainage flow of the initial dam (shown in Figure 9), the fluctuation in the pore water pressure field is relatively small, as shown in Figure 5. Hence, the pore pressure curve at the typical position in the dam can be used for discrimination. Practically, when the pore pressure remains basically unchanged over time, it can be judged that the seepage field of the dry-stack tailings pond is relatively stable. Therefore, it is recommended for the pore water pressure curve of the typical position to be used to judge whether the seepage field of the dry-stack tailings pond reaches a relatively stable state.

3.3. Influencing Factors of Relatively Steady Seepage Field

3.3.1. Influence of Rainfall Patterns

In order to analyze the influence of different rainfall patterns on the same tailings pond under the same annual rainfall conditions, the final distribution forms of saturation lines of different rainfall patterns under the same annual rainfall amount are calculated. The results are shown in Figure 10.
From the calculation results in Figure 10, when the annual rainfall and the bottom slope of the tailings pond are certain, different rainfall patterns have little effect on the saturation line distribution of the RSSF.
Therefore, when analyzing the long-term distribution of the saturation line in the dry-stack tailings pond for certain conditions of annual rainfall, the selection of rainfall patterns has little influence on the final saturation line results of the RSSF. In contrast to the response of the seepage field in a general slope under short-term rainfall [21,22], the relatively stable saturation line in the dry-stack tailings pond under long-term rainfall is not sensitive to the selection of rainfall patterns. The finding brings convenience to the calculation of RSSF by a numerical method.

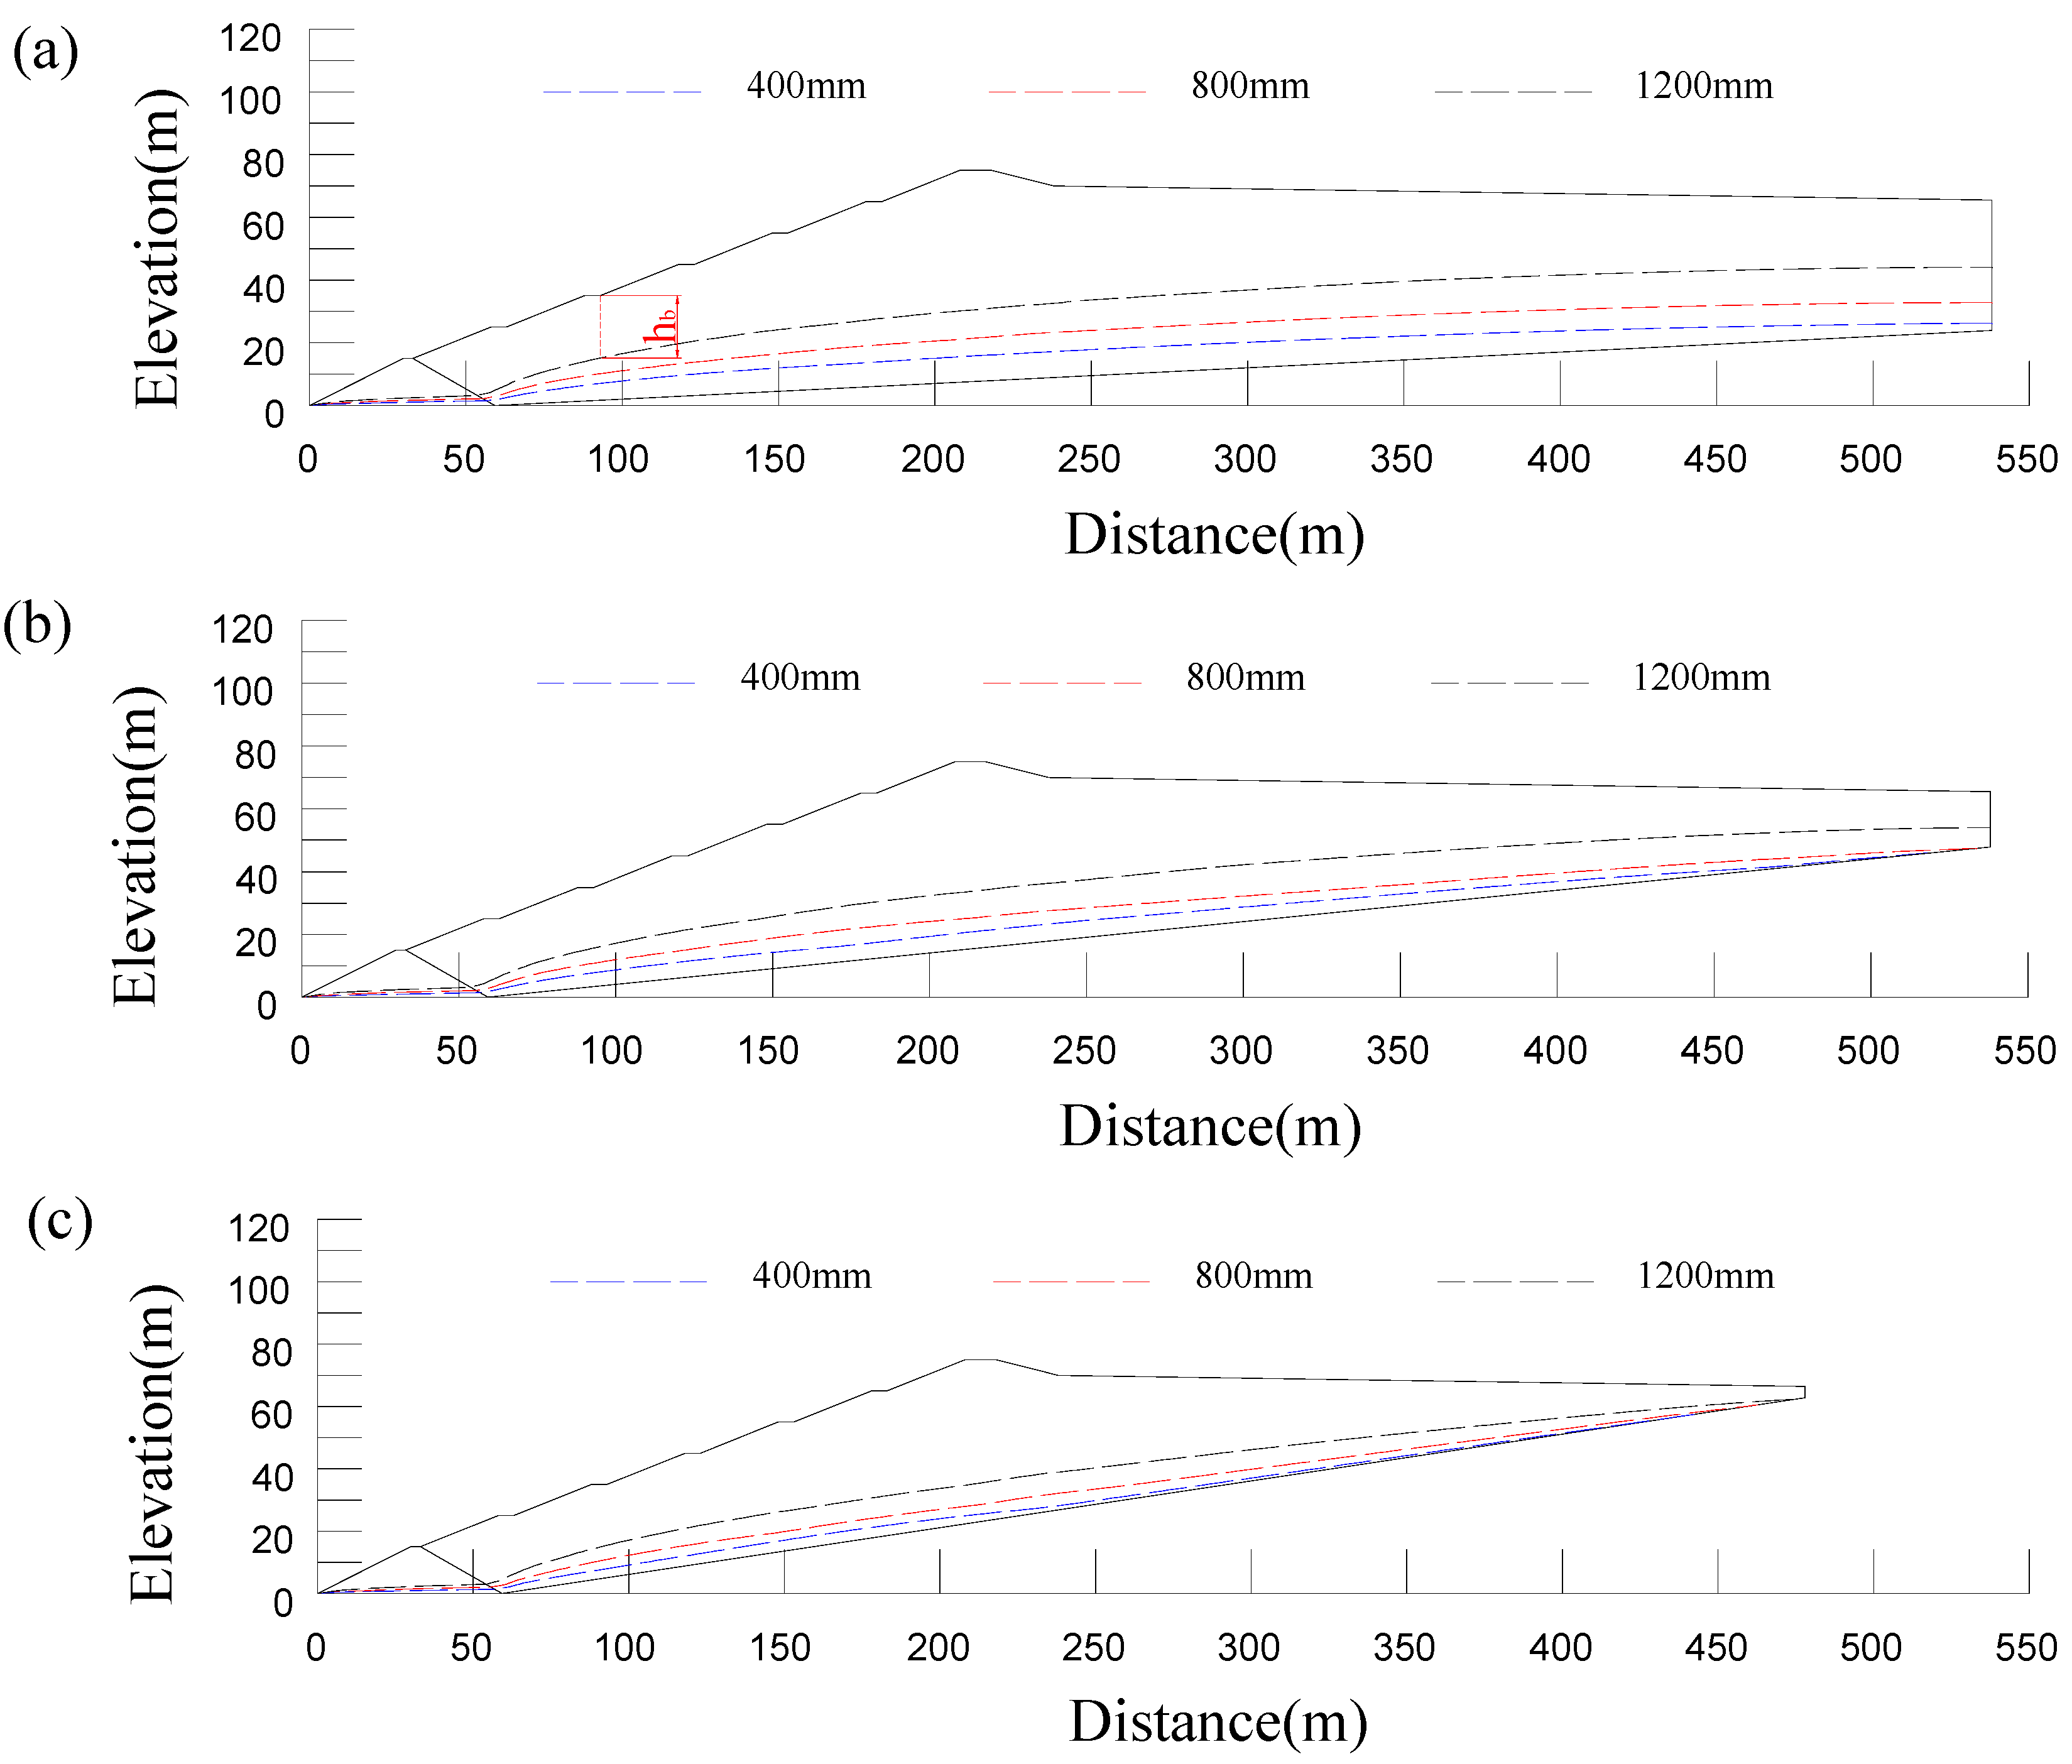
3.3.2. Influence of Annual Rainfall

Saturation lines of the RSSF in the dry-stack tailings pond under different annual rainfall conditions are plotted in Figure 11. It can be seen from Figure 11 that under the same bottom slope conditions, annual rainfall has a great influence on the distribution of the saturation line. The greater the annual rainfall rate, the higher the position of the saturation line. Therefore, the seepage field distribution of the same dry-stack tailings pond differs with different annual rainfall areas, and the safety of the seepage field is also different.

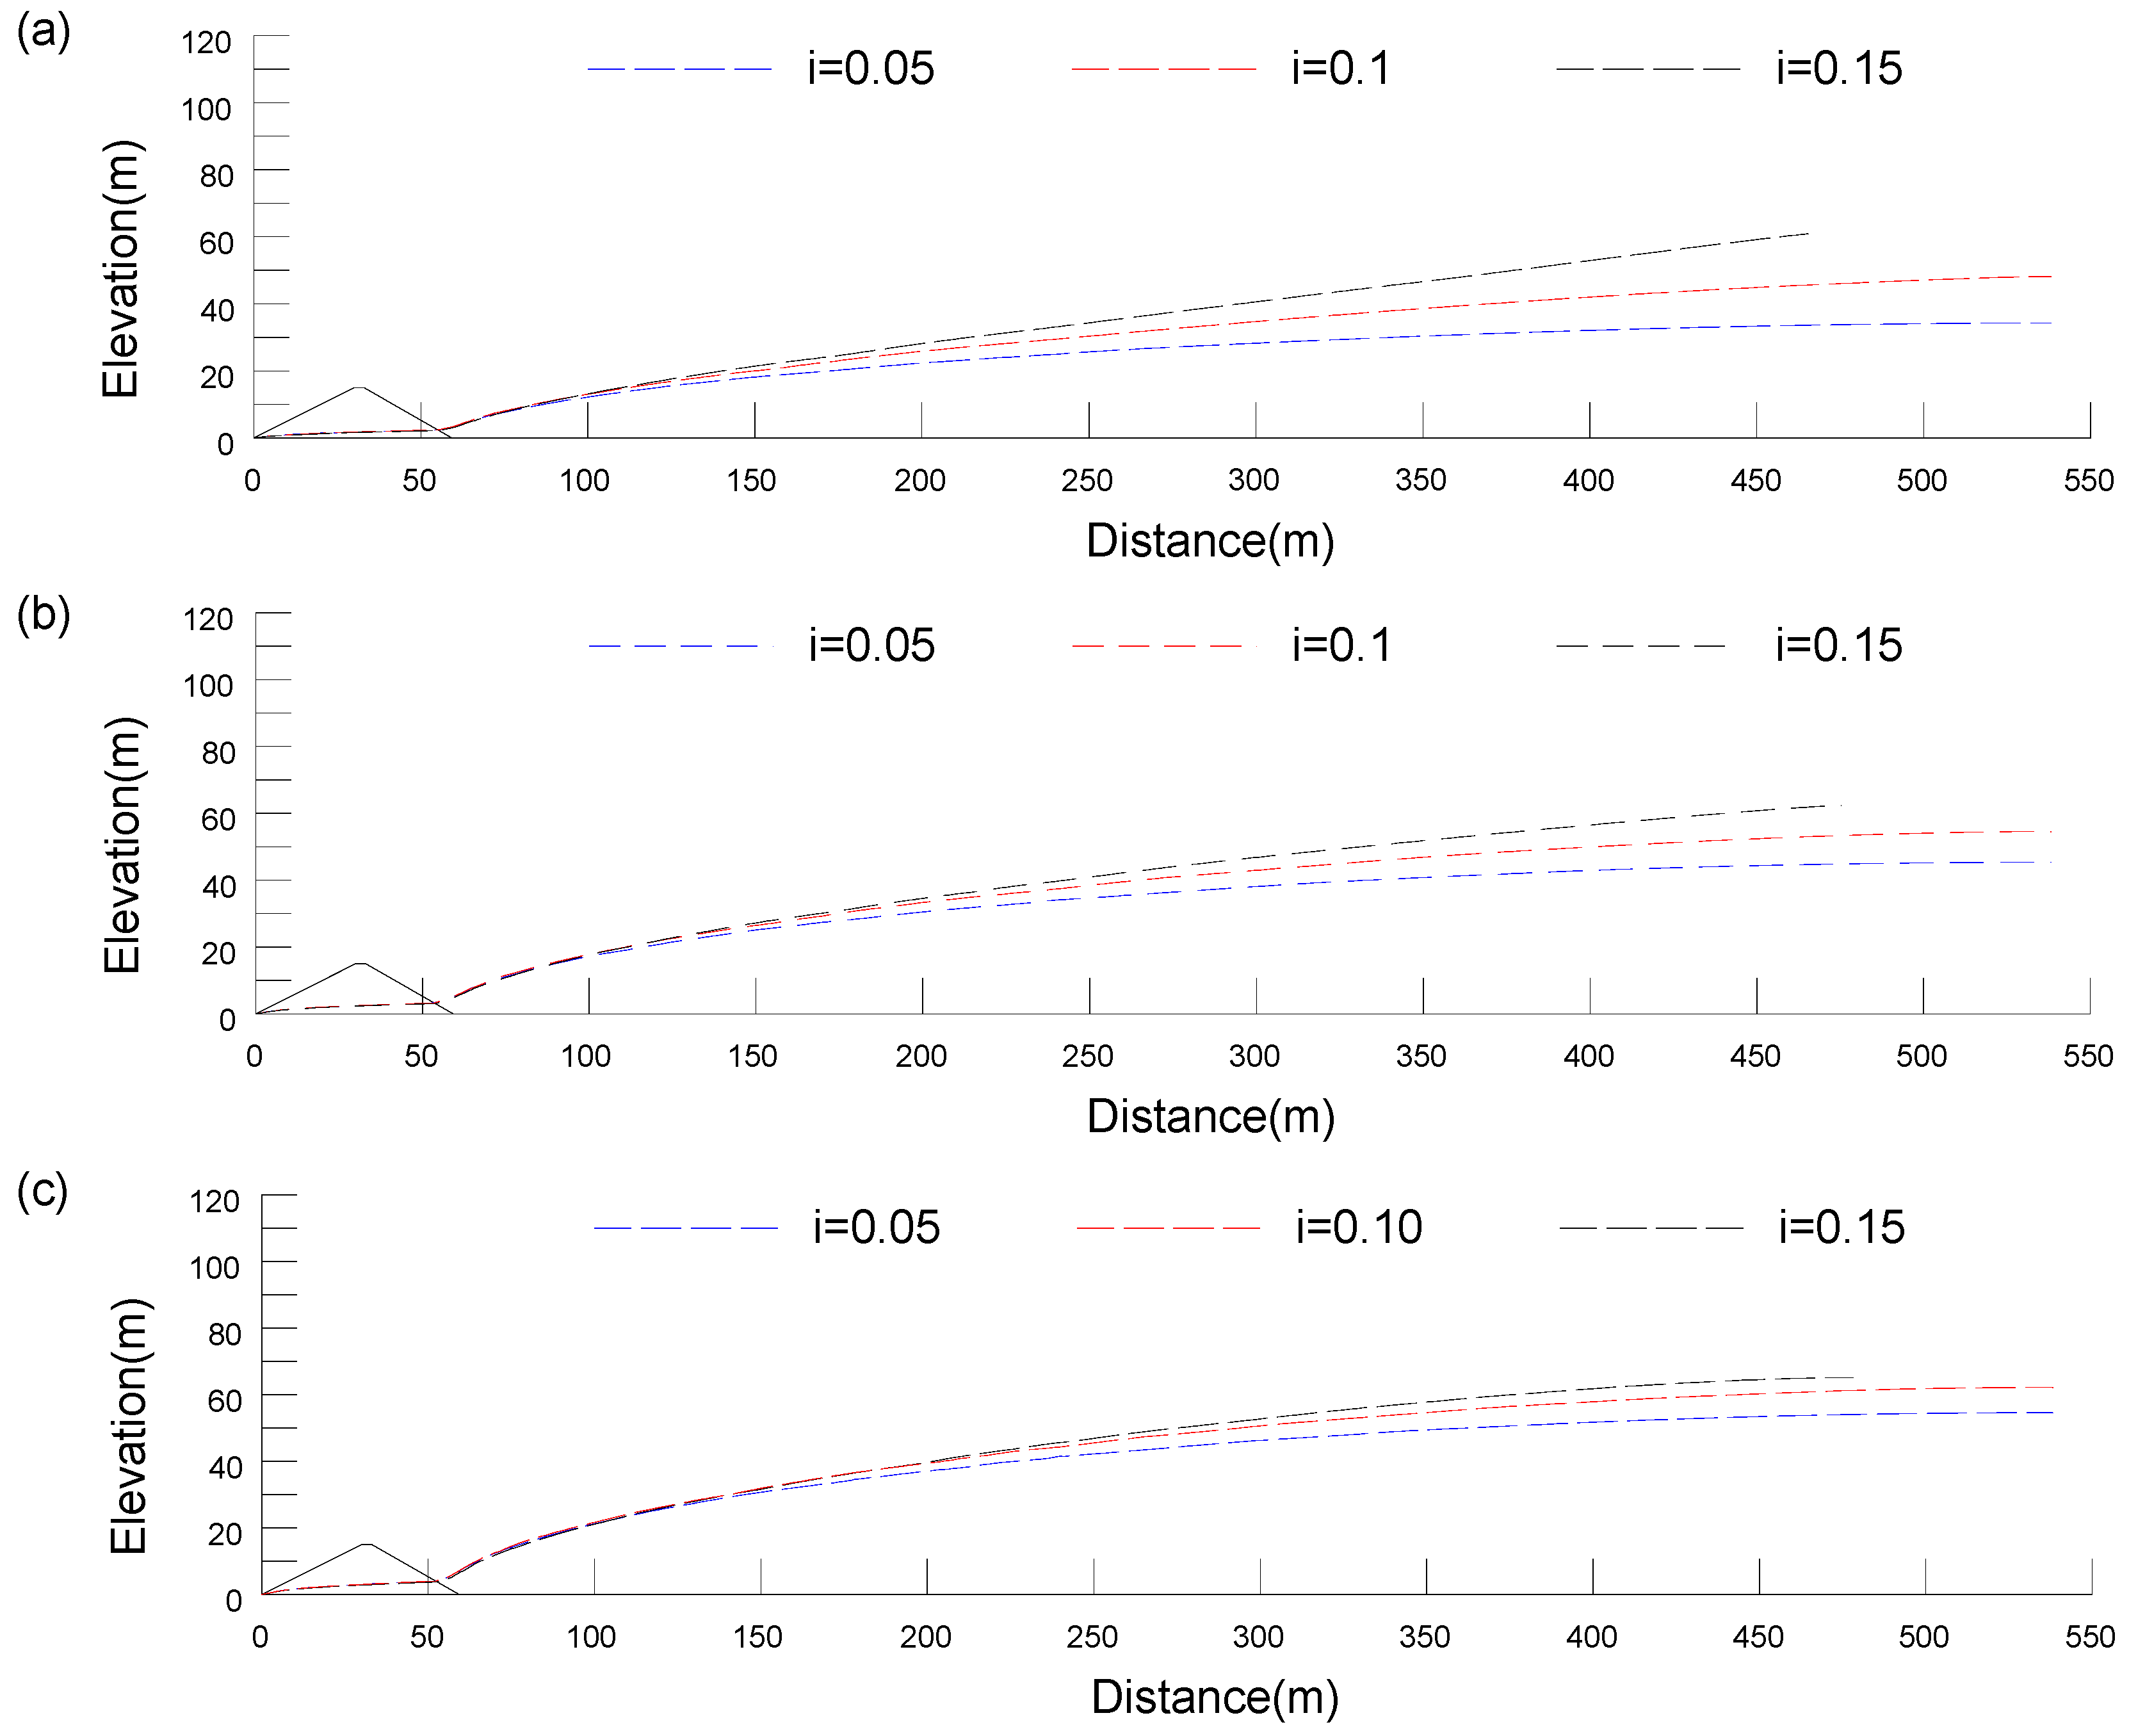
3.3.3. Influence of Bottom Slope

Saturation lines of RSSF in dry-stack tailings pond under different bottom slopes are plotted in Figure 12. It can be seen from Figure 12 that a RSSF can be formed under different bottom slopes, and the position of the saturation line increases with the increase in the bottom slope.

3.3.4. Influence of Evaporation

When the effect of evaporation is considered, the rainfall subtracting evaporation capacity is taken as the flow boundary in the calculation model. Figure 13 shows the D-value between annual rainfall and evaporation capacity in Taiyuan, Zhengzhou, and Guiyang in 2020. The relative stable seepage fields considering evaporation effect were calculated, as shown in Figure 14.
The minimum burial depth (hb) of the phreatic line is defined as the minimum distance from the dam surface of the tailings dam to the phreatic line. As shown in Figure 14a, hb is an important index for evaluating the safety of the seepage field of the tailings pond in Chinese specifications. Comparing Figure 11 and Figure 14, when the evaporation time effect is considered, the changes of hb under different working conditions are listed in Table 5.
From Figure 6, when the annual rainfall was 400 mm, the maximum change of hb increased from 23.9 m to 28 m, thus the increase ratio was 17.2%; when the annual rainfall was 800 mm, the maximum change of hb increased from 19.4 m to 24.9 m, thus the increase ratio was 28.4%; when annual rainfall was 1200 mm, the maximum change of hb increased from 15.2 m to 19.1 m, thus the increase ratio was 27.3%.
Although the influence of evaporation is not considered in the rainfall seepage and stability analysis of most slopes [22,23,24,25,26], evaporation has a great impact on the seepage field of dry-stack tailings ponds under multi-year periodic rainfall conditions. Evaporation will reduce the water content of the tailings dam. Based on the above analysis in this paper, when considering the existence of evaporation, the RSSF will still be generated, whereas the distribution of the RSSF and the position of the saturation line will be reduced by the influence of evaporation. According to the above research results, if the influence of evaporation is not considered in the preliminary design of dry-stack tailings ponds, the design result will be safer. This may lead to further costs in the later construction of the tailings pond.

3.4. Suggestions

At present, a dry-stack tailings pond has obvious advantages in safety and environmental protection. Hence, it is recommended for them to be used by government departments in China. However, the calculation method of the seepage field of dry-stack tailings ponds is immature at present [13]. Such situations bring risks to the design of dry-stack tailings ponds and they are not conducive to the promotion and application of dry-stack tailings ponds. In this study, a new method for calculating the seepage field of dry-stack tailings ponds is proposed, and the new concept of RSSF is also proposed. From the research results of the article, it takes a long time for the RSSF to form, and there may be no phreatic line in the early stage of the tailings dam, which may make the managers and designers ignore the existence of the seepage field and this brings risks to the safety of the dry-stack tailings pond. However, tailings ponds are generally used for a long time. When considering the safety of the tailings pond in the whole life cycle, it can be seen from Table 4 that there is a phreatic line in the dry-stack tailings pond, which will affect its seepage stability dry-stack. Therefore, a new understanding has been formed from the article that the RSSF is an essential basis to be considered in the design of the dam slope and drainage system of a dry-stack tailings pond.
In addition, after the closure of the tailings pond, its safety management will often become lax. With the increase in time, some facilities in the tailings pond will gradually fail, which will threaten the long-term stability of the tailings pond. Therefore, it is suggested for the influence of the RSSF on the design parameters in the design of the closed pond to be considered to ensure the long-term stability of the tailings pond.

3.5. Limitations and Future Research

This study tends to focus on the formation of a relatively stable seepage field in a dry-stack tailings pond under the action of long-term rainfall. The main purposes are as follows: (1) to propose the concept and research framework of a relatively stable seepage field; (2) remind designers that a relatively stable infiltration line will be formed in the dam body under the effect of cumulative rainfall over many years. Designers should consider the influence of this line in the calculation of dam slope stability and drainage design to avoid potential hazards.
In this study, the influence of tailings reservoir bottom leakage is ignored. Strictly, the leakage at the bottom of the tailings pond is the main way of pollutant transport and ignoring it will have an important impact on the research results of seepage water pollution. However, when studying from the perspective of the dam slope safety analysis, it is safer without considering the leakage at the bottom of tailings pond. Therefore, it is feasible to apply the conclusion of this study.
Indeed, the relevant theories and applications of the relatively stable seepage field proposed in this paper need to be improved. In addition, it is difficult to study all of the related aspects such as the assessment of pollution brought by the leakage of the dam bottom and the discharge of the seepage pipeline, the influence of different drainage arrangements, the effects of flood confluence frequency, flood infiltration range, infiltration time, and other factors on the relatively stable seepage field of the dry-stack tailings pond under the action of rainfall.
In the future, based on the study in this manuscript, the authors will conduct in-depth research on the safety and pollution problems caused by the seepage field with the leakage of the dam bottom and the discharge of the seepage pipeline through a series of experimental, simulation, and numerical studies. Predictably, with considering more specific problems, including the possible dam seepage, complex drainage pipes, water infiltration in the catchment area and other factors, it will facilitate in gradually establishing a more perfect design theory and method for dry-stack tailings ponds.

4. Conclusions

The main factors affecting the seepage field in the long-term operation of the dry-stack tailings pond were analyzed and then a calculation model of the seepage field of the dry-stack tailings pond was established. Numerical simulations were conducted to study the evolution process of the seepage field of the dry-stack tailings pond. Based on the method of water dynamic balance in the tailings pond, the final seepage field shape of the dry-stack tailings pond was determined and a new concept was proposed, named the relatively stable seepage field (RSSF). The seepage field can be used as the basis for the drainage system and dam slope design of dry-stack tailings ponds, and it also has a certain guiding role for the design of closed tailings ponds. Through the research on the RSSF under different working conditions, the following conclusions were obtained:
(1)
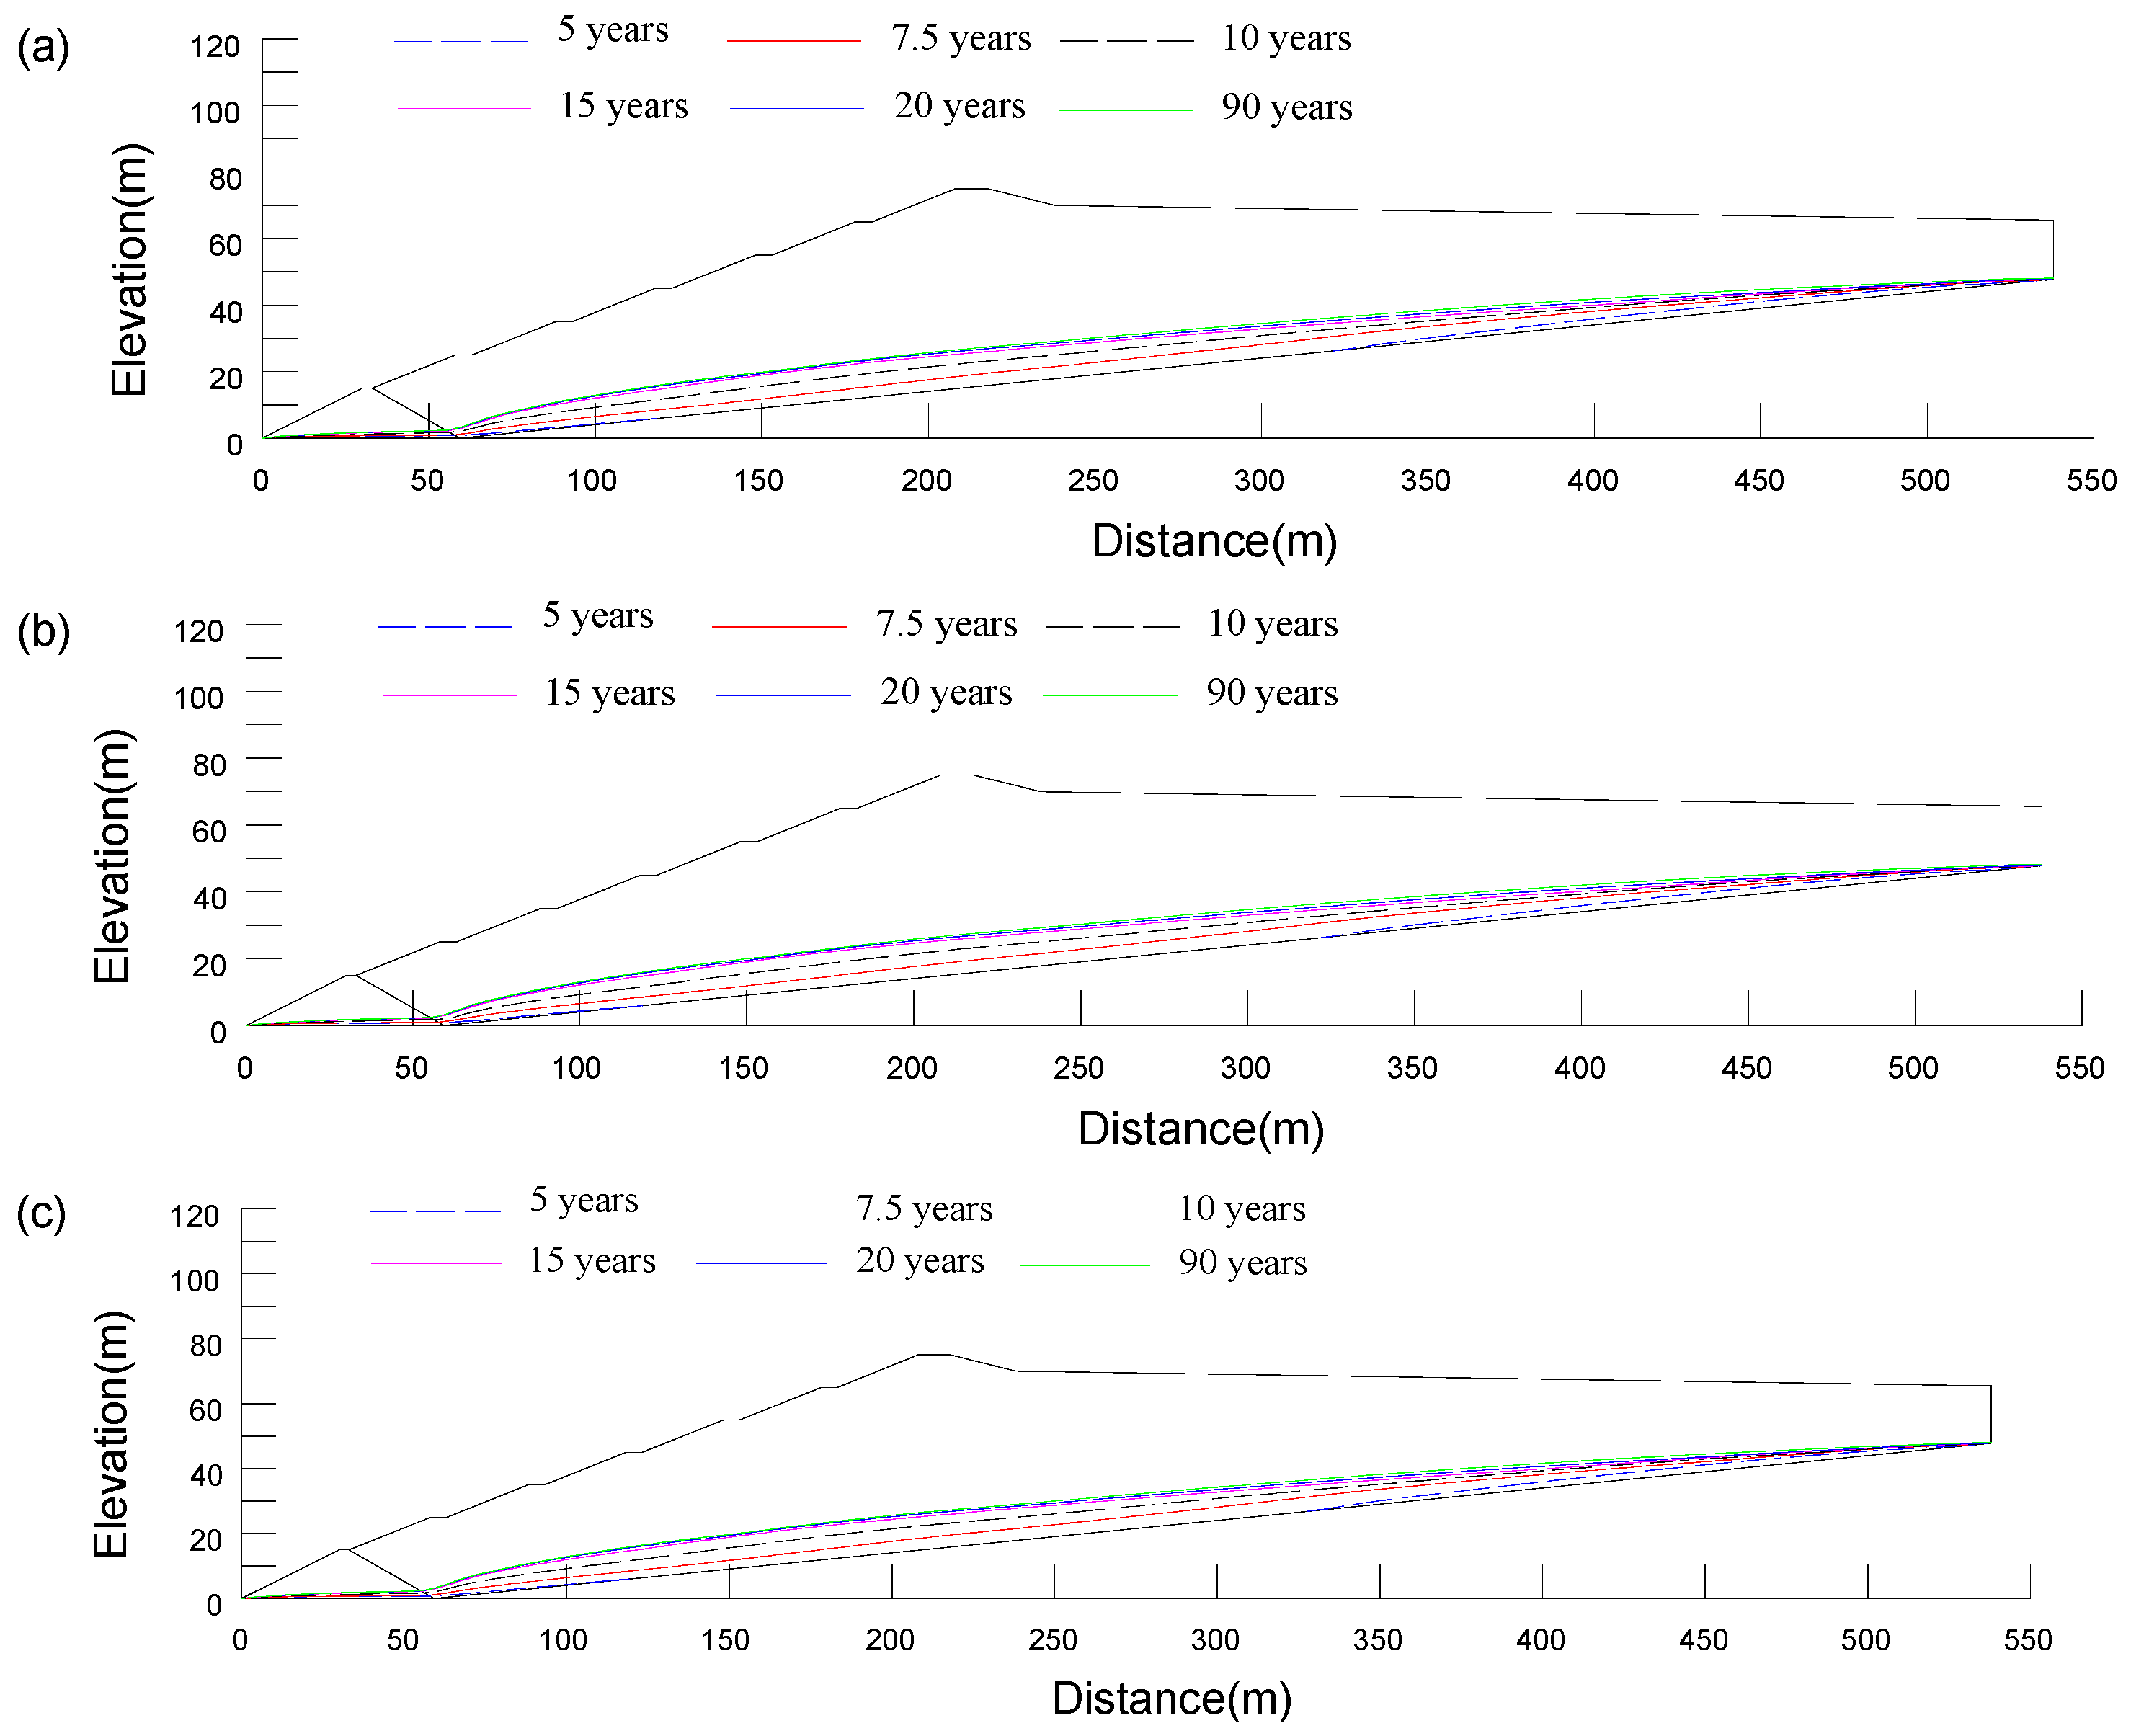
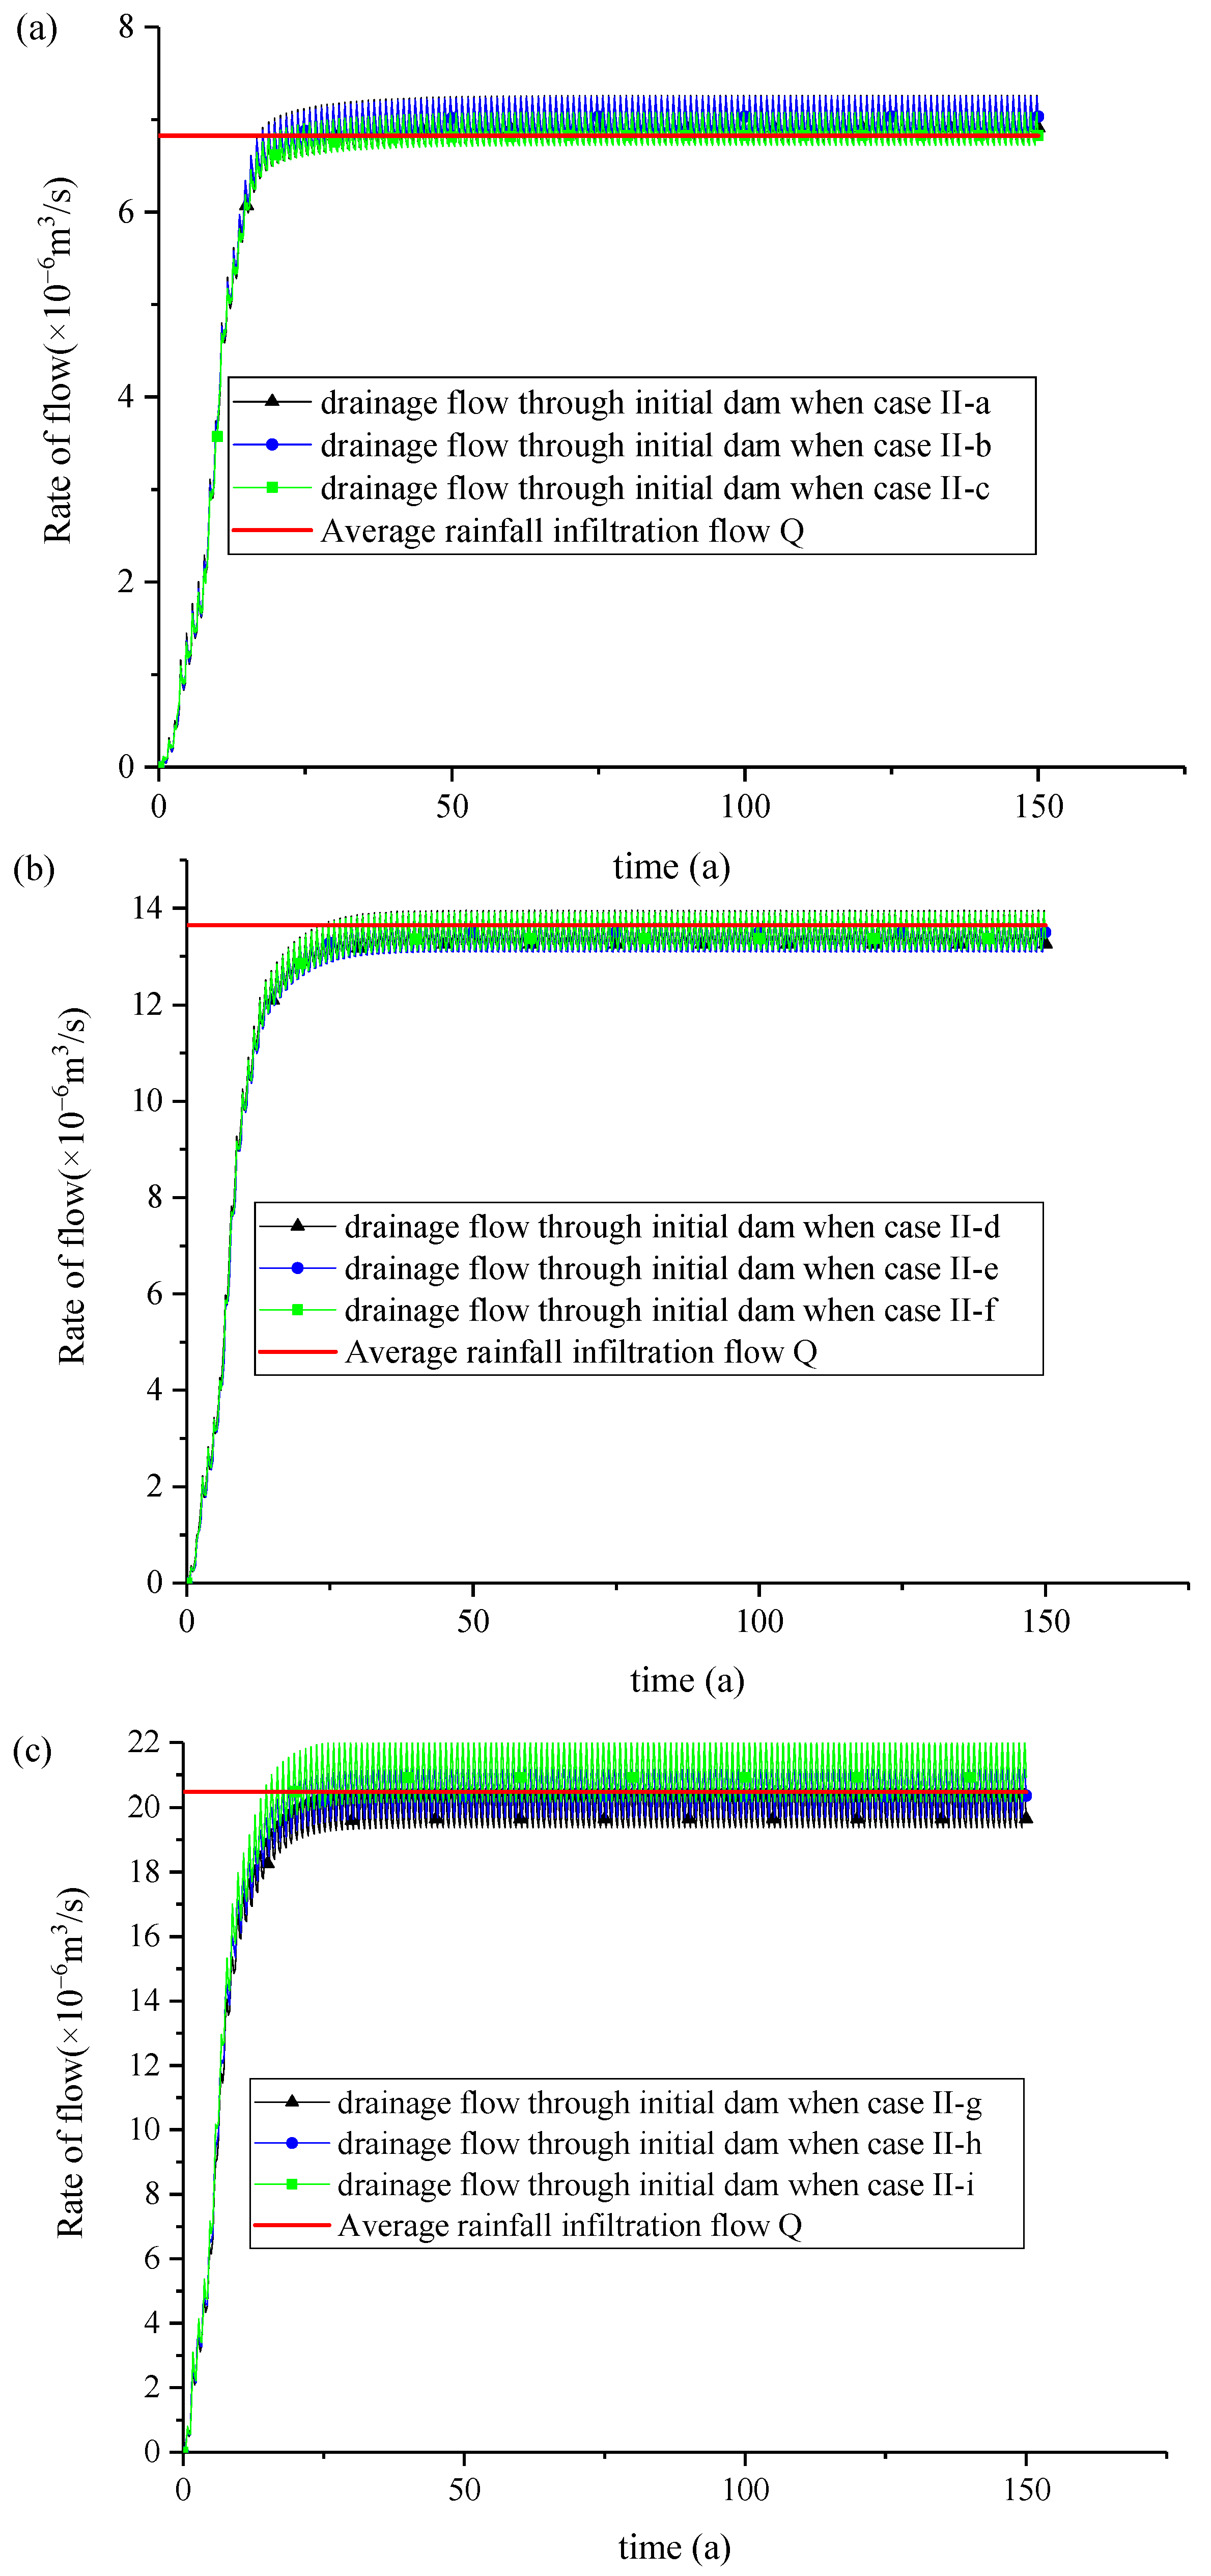
In the early stage during the formation process of RSSF, the drainage flow of the initial dam was less than the average rainfall infiltration flow and the saturation line in the dam rose rapidly. As the drainage flow of the initial dam was gradually equal to the average rainfall infiltration flow, the seepage field of the dry-stack tailings pond gradually approached a relatively stable state and finally a RSSF was formed.
(2)
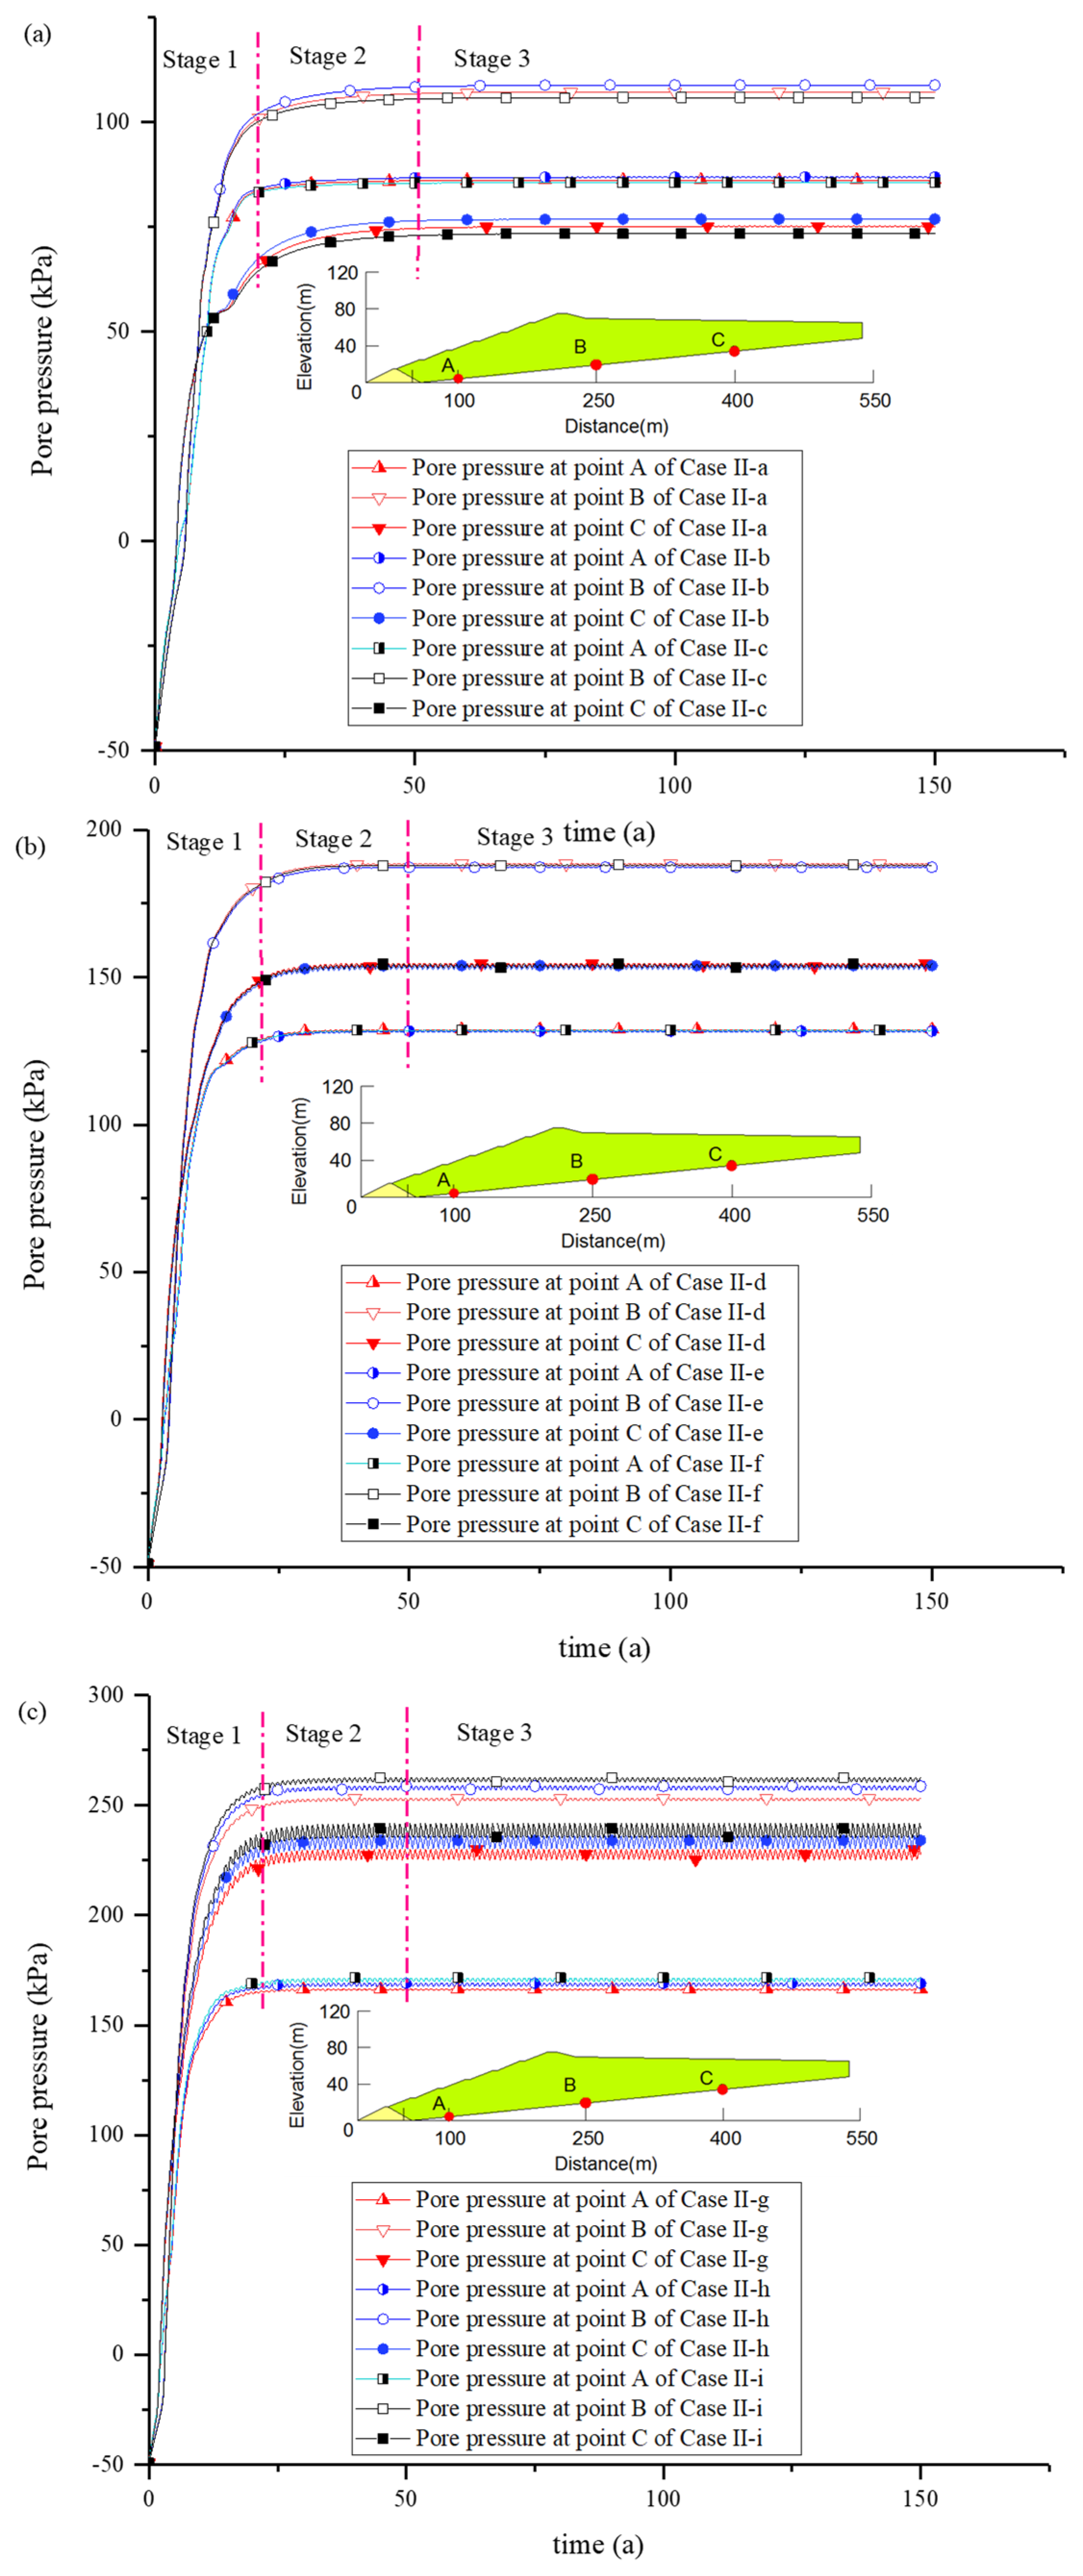
Since the fluctuation in the pore pressure curve is relatively small, it is easier to judge the RSSF formation standard of the dry-stack tailings pond by using the relationship between pore pressure and time at typical positions in the dam.
(3)
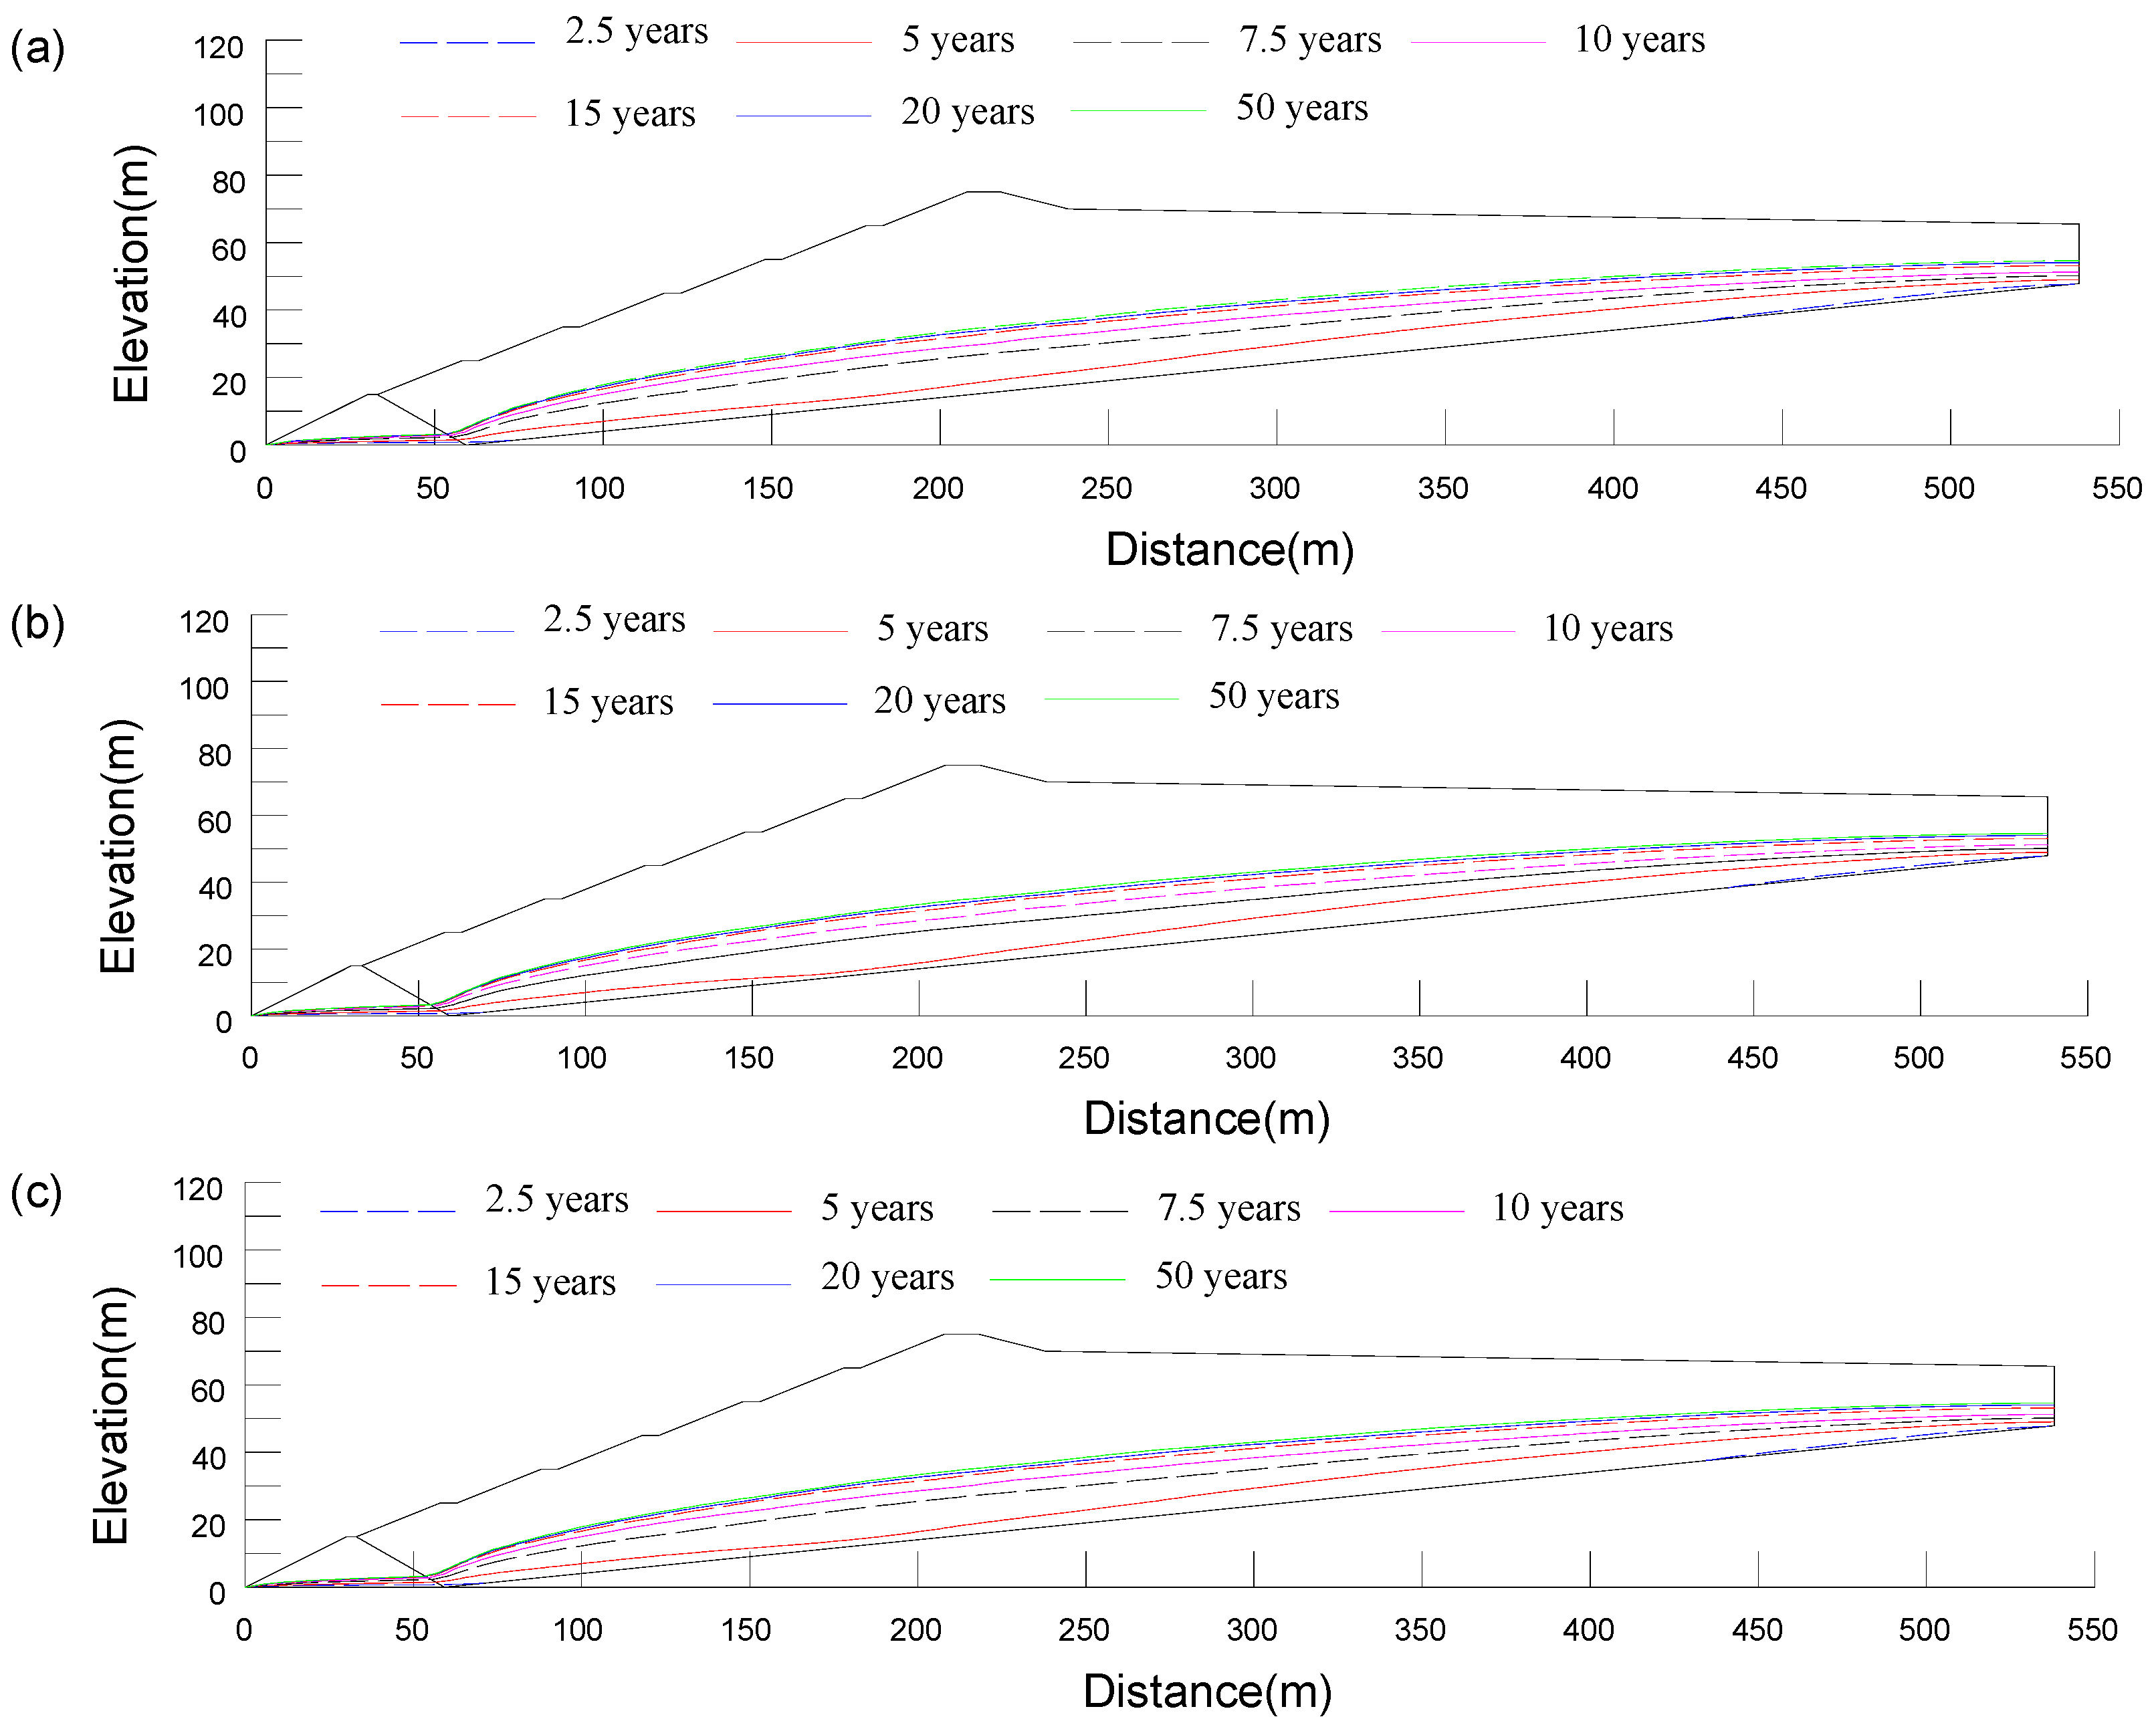
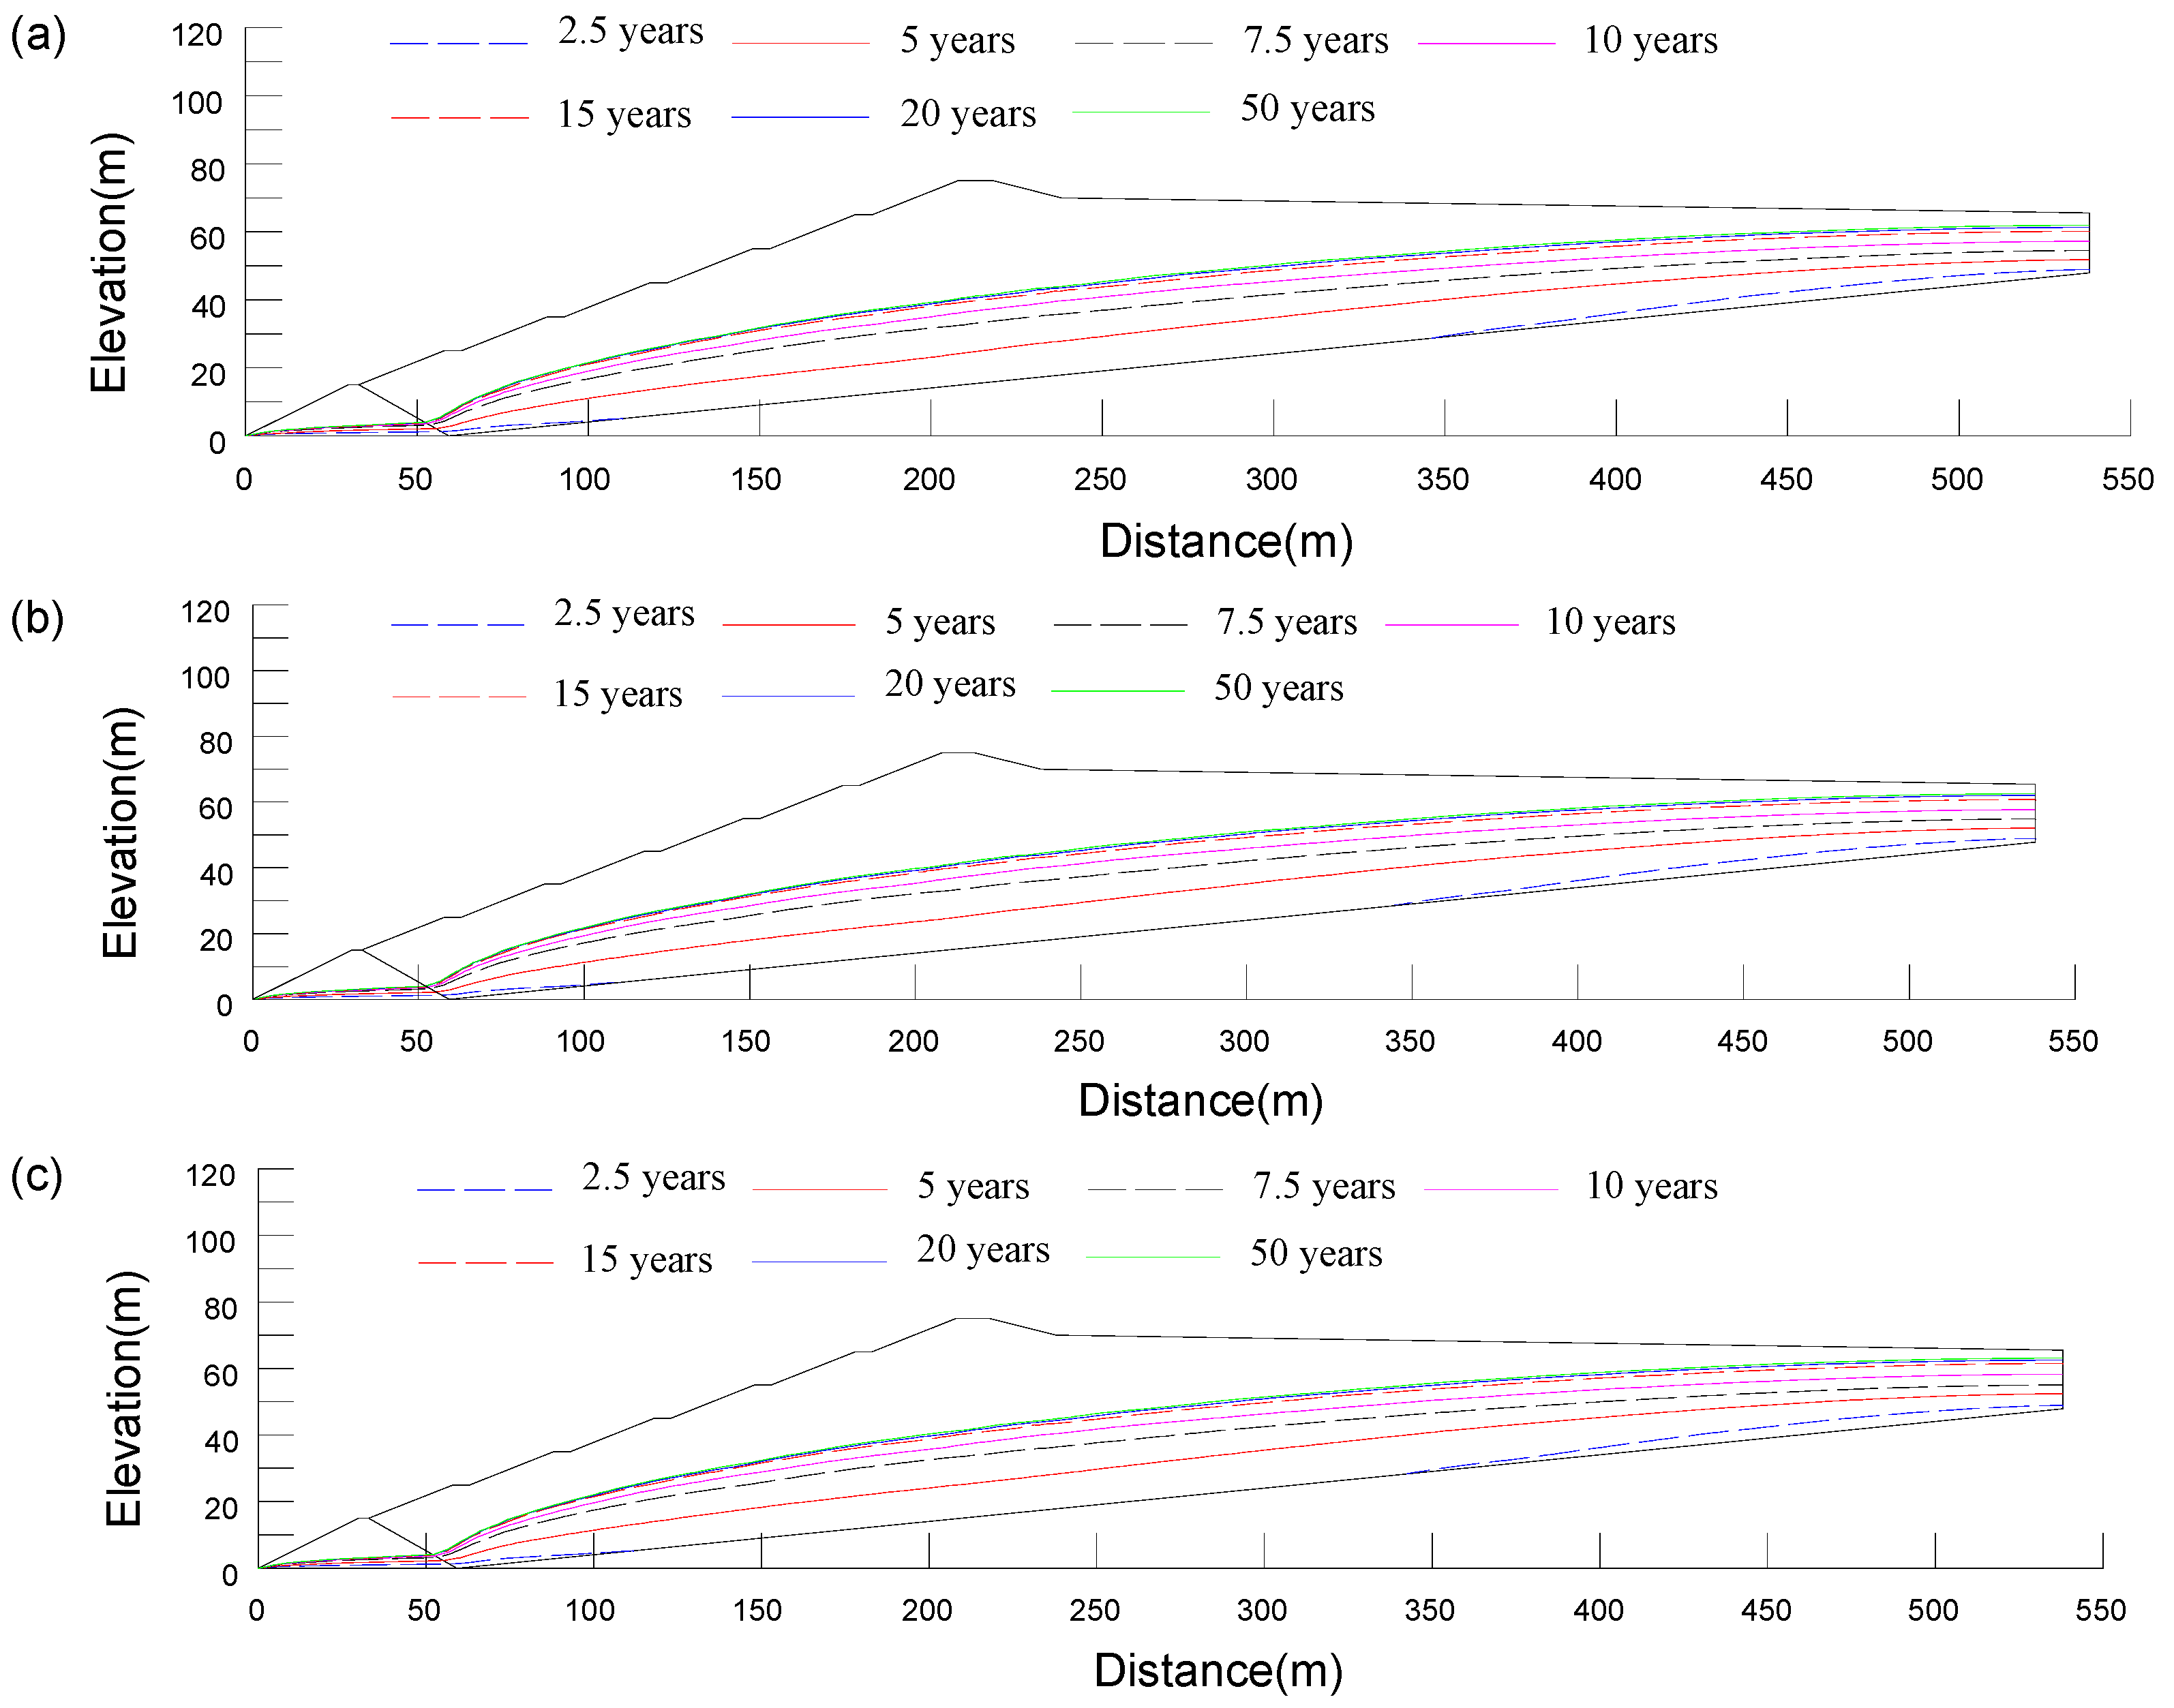
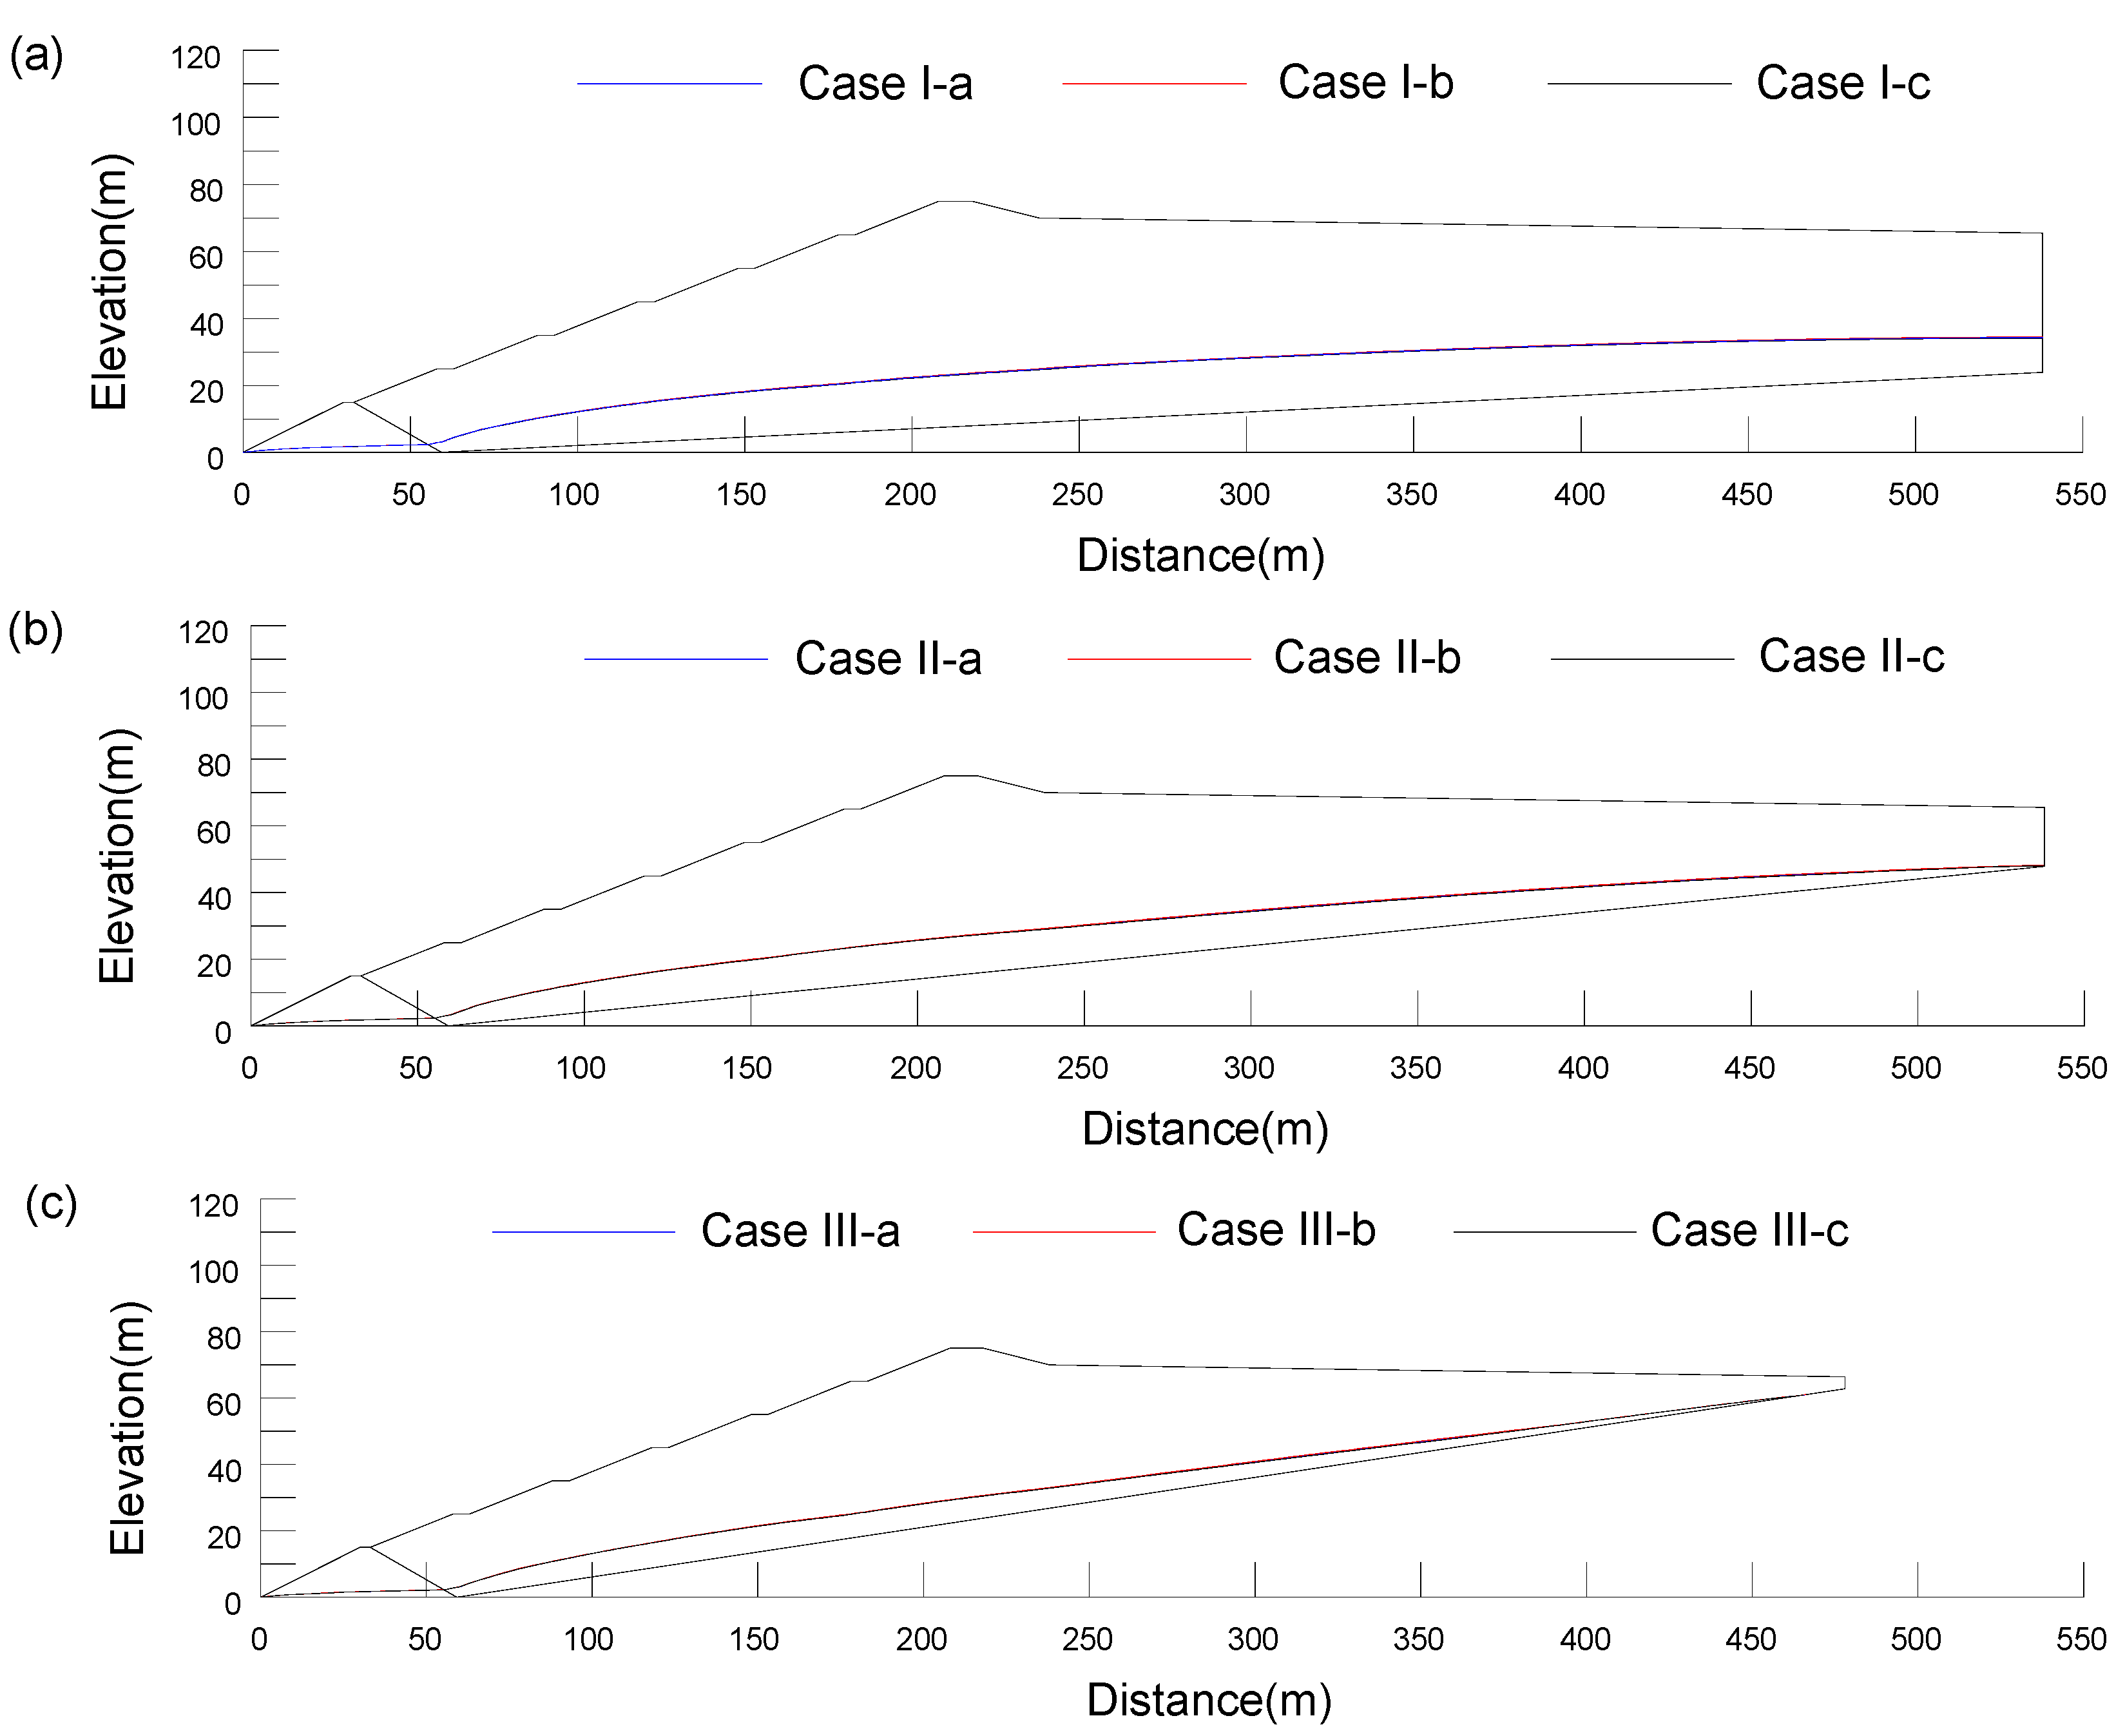
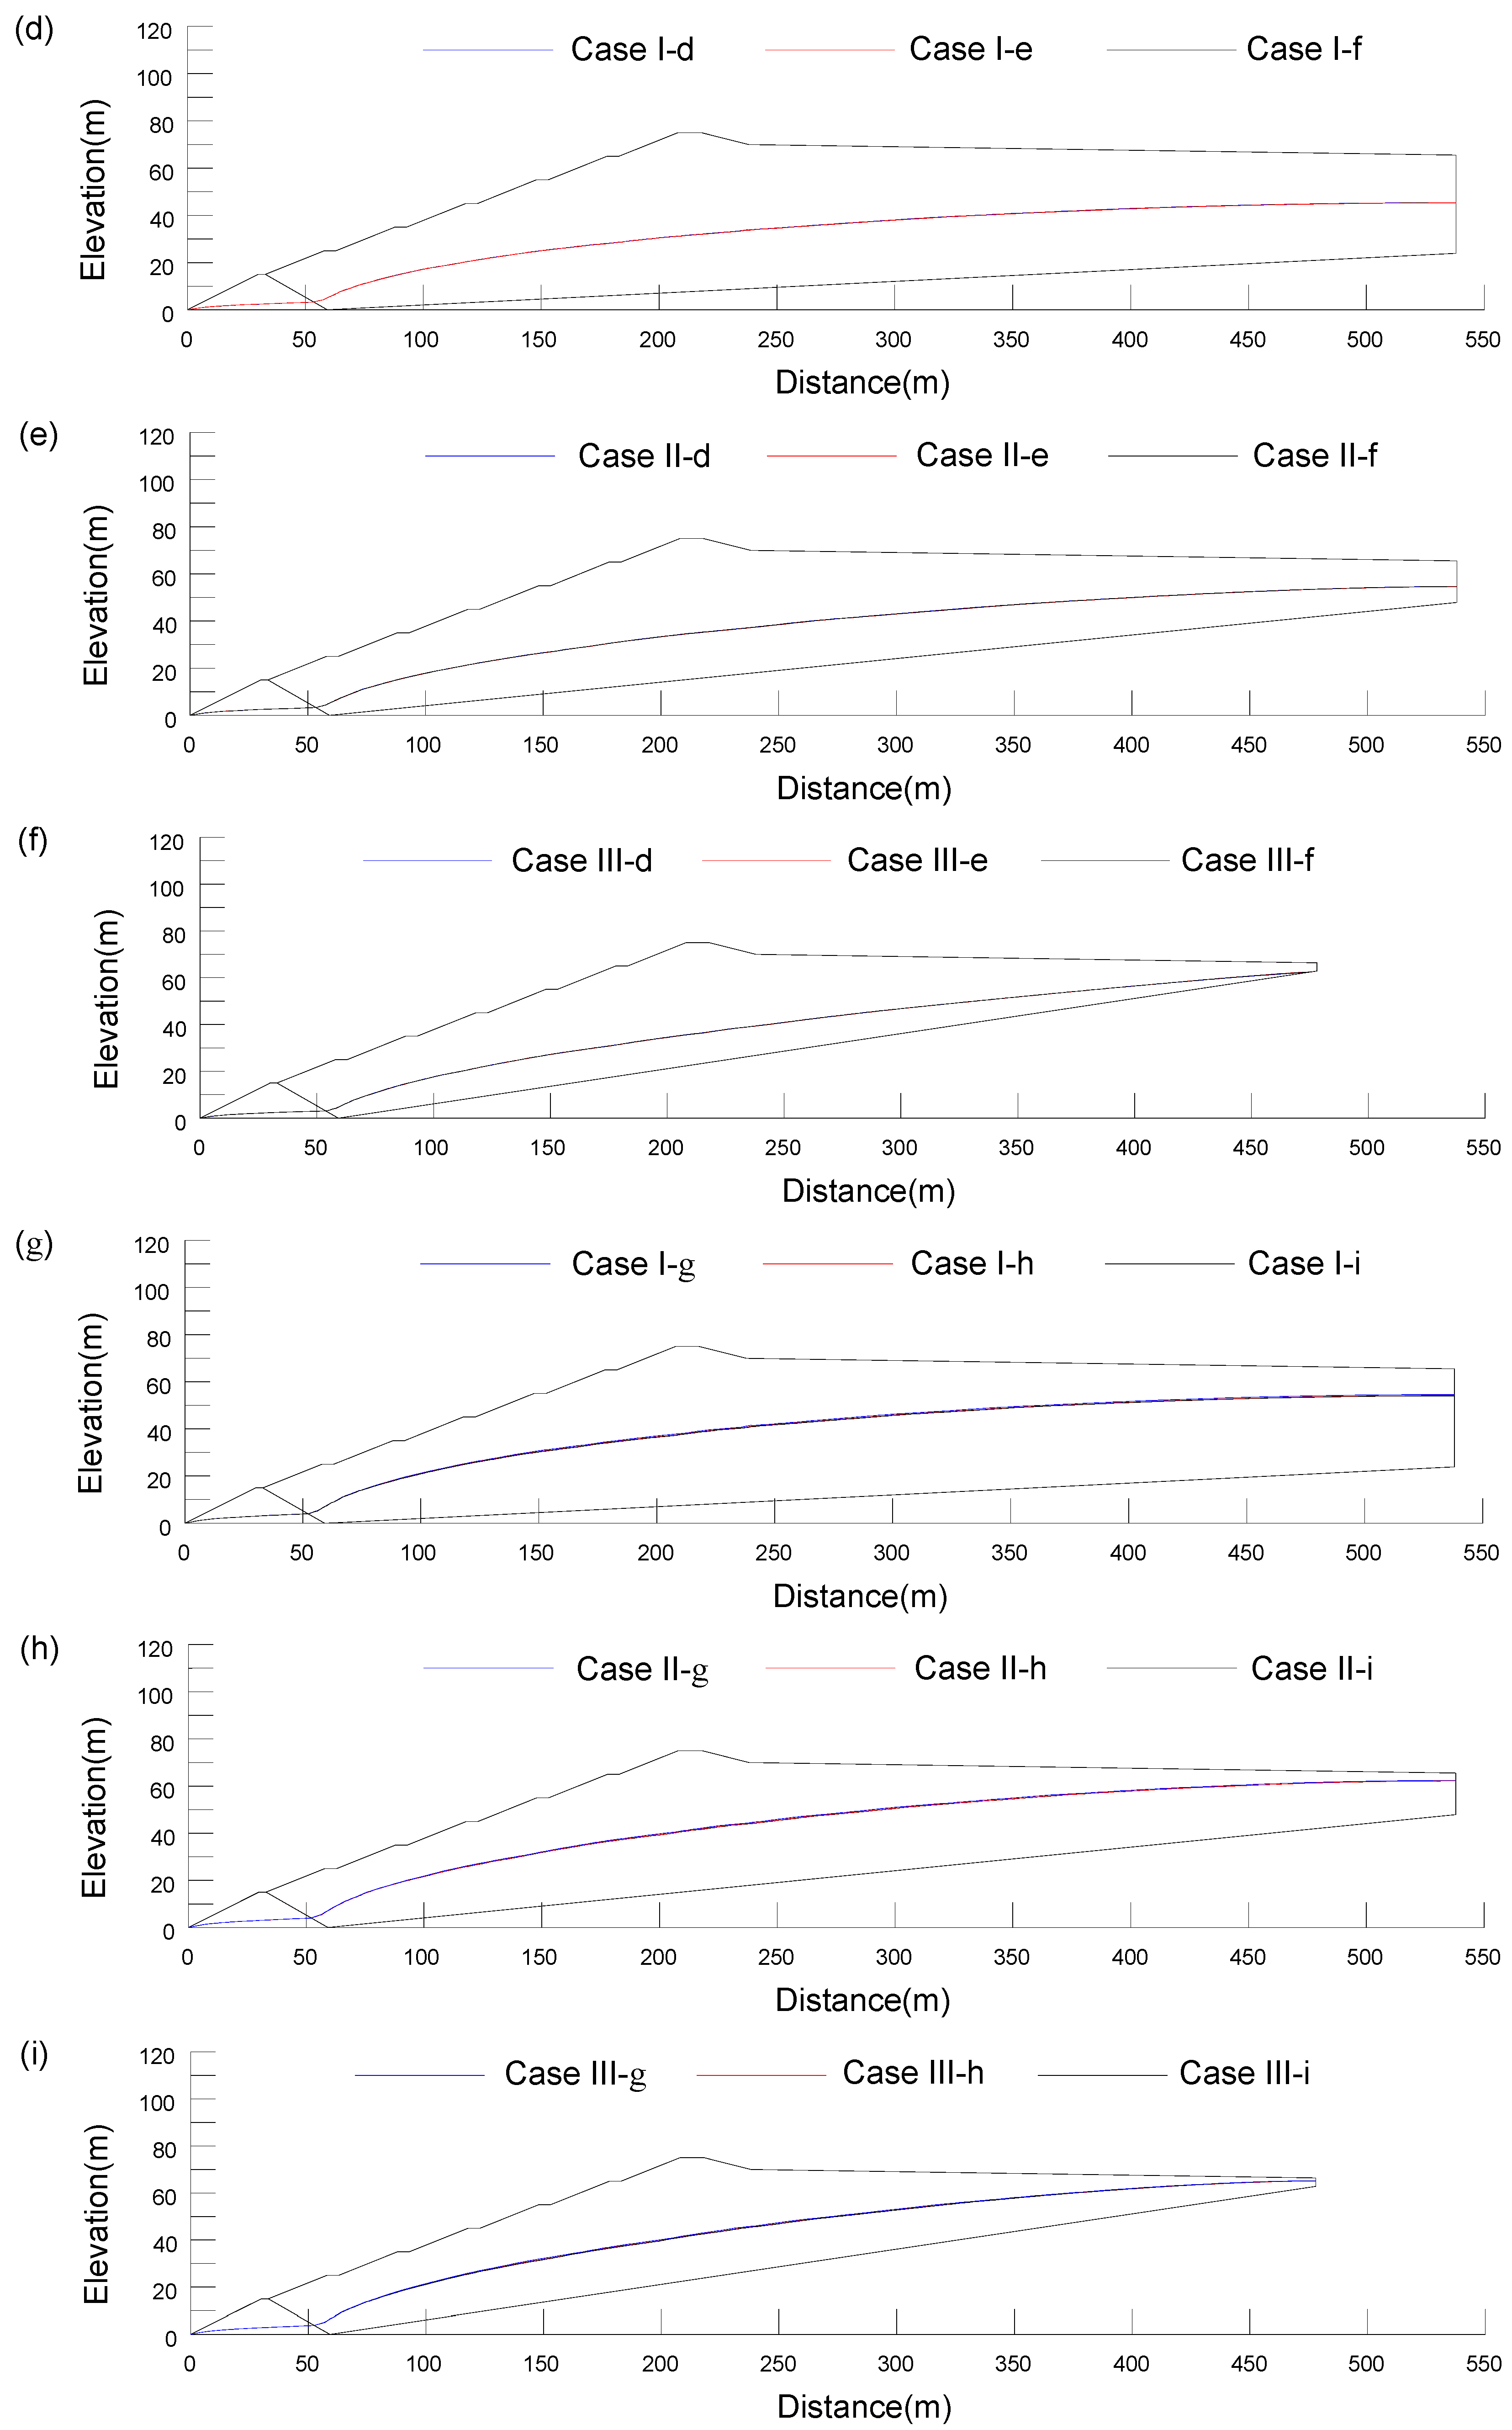
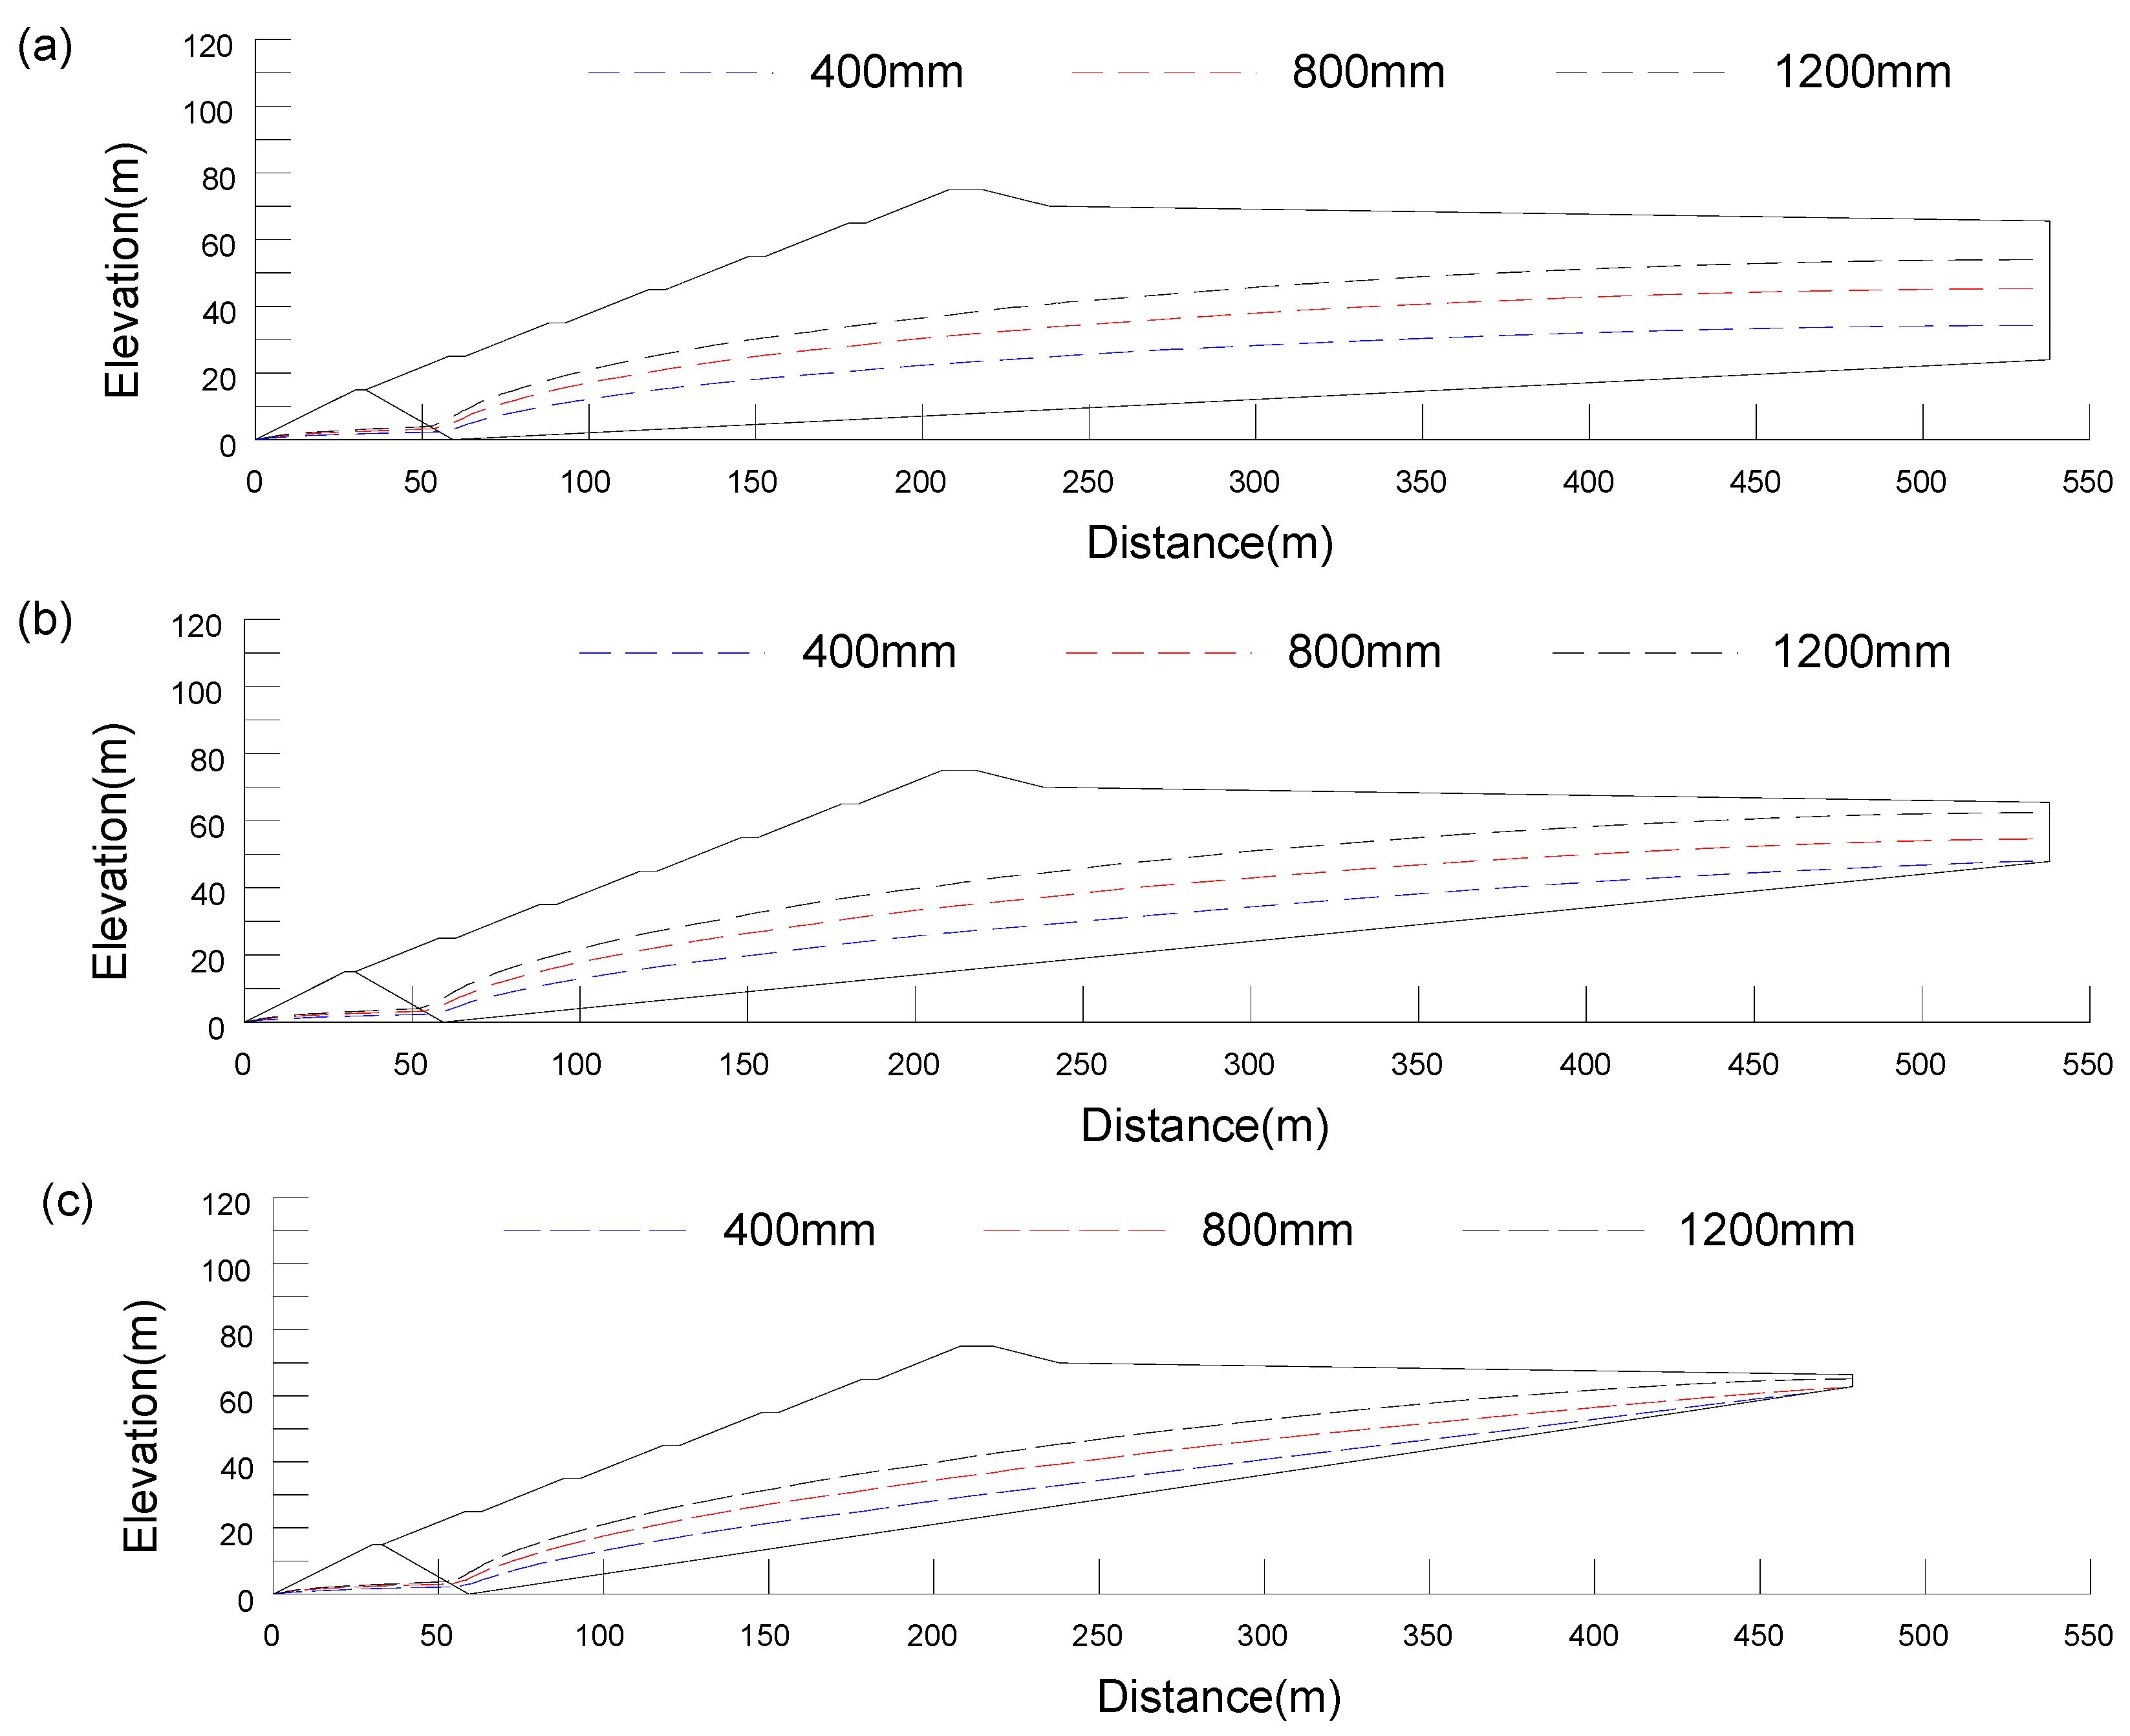
The final form of the RSSF is related to the total annual rainfall. With the increase in annual rainfall, the location of the saturation line corresponding to the RSSF will be higher. RSSF has little relation with rainfall patterns when the annual rainfall is constant. Therefore, in the calculation of RSSF, any reasonable rainfall time history curve can be selected, which brings great convenience to the calculation. In addition, under other constant conditions, the final form of RSSF is related to the topography (bottom slope) of the dry-stack tailings pond.
(4)
When evaporation is considered, the height of the phreatic line of the RSSF will decrease. In this calculation example, the minimum burial depth of the phreatic line (hb) before and after evaporation is counted: when the annual rainfall is 400 mm/800 mm/1200 mm, the maximum change of hb increased from 23.9 m/19.4 m/15.2 m to 28 m/24.9 m/19.1 m and increase ratio was 17.2%/28.4%/27.3%.
(5)
Because the formation of the RSSF in the dry-stack tailings pond takes a long time, it is easy for it to be ignored in the management and design of tailings ponds. Therefore, it is necessary to consider the influence of the RSSF on the design parameters in the design of dry-stack tailings ponds.

Author Contributions

Conceptualization, Q.L. and X.L.; methodology, Q.L. and B.-Z.W.; software, S.J.; validation, B.-Z.W., F.-H.Z. and S.G.; formal analysis, X.L.; investigation, X.L.; data curation, B.-Z.W.; writing—original draft preparation, Q.L.; writing—review and editing, X.L.; funding acquisition, Q.L. and X.L. All authors have read and agreed to the published version of the manuscript.

Funding

This research was funded by the Natural Science Foundation of Hebei Province (E2019210304, E2021210092), the Youth Top Talent Project of Hebei Province, and S&T Program of Hebei (No. 22375412D).

Institutional Review Board Statement

Not applicable.

Informed Consent Statement

Not applicable.

Conflicts of Interest

The authors declare no conflict of interest.

References

  1. Williams, D.J. Lessons from Tailings Dam Failures—Where to Go from Here? Minerals 2021, 11, 853. [Google Scholar] [CrossRef]
  2. Kossoff, D.; Dubbin, W.E.; Alfredsson, M.; Edwards, S.J.; Macklin, M.G.; Hudson-Edwards, K.A. Mine tailings dams: Characteristics, failure, environmental impacts, and remediation. Appl. Geochem. 2014, 51, 229–245. [Google Scholar] [CrossRef] [Green Version]
  3. Agurto-Detzel, H.; Bianchi, M.; Assumpção, M.; Schimmel, M.; Collaço, B.; Ciardelli, C.; Barbosa, J.R.; Calhau, J. The tailings dam failure of 5 November 2015 in SE Brazil and its preceding seismic sequence. Geophys. Res. Lett. 2016, 43, 4929–4936. [Google Scholar] [CrossRef] [Green Version]
  4. Lyu, Z.; Chai, J.; Xu, Z.; Qin, Y.; Cao, J. A Comprehensive Review on Reasons for Tailings Dam Failures Based on Case History. Adv. Civ. Eng. 2019, 2019, 4159306. [Google Scholar] [CrossRef] [Green Version]
  5. Alonso, E.E. The Failure of the Aznalcóllar Tailings Dam in SW Spain. Mine. Water Environ. 2021, 40, 209–224. [Google Scholar] [CrossRef]
  6. Du, Z.; Ge, L.; Ng, A.M.H.; Zhu, Q.; Horgan, F.G.; Zhang, Q. Risk assessment for tailings dams in Brumadinho of Brazil using InSAR time series approach. Sci. Total Environ. 2020, 717, 137125. [Google Scholar] [CrossRef]
  7. Gomes, R.B.; De Tomi, G.; Assis, P.S. Iron ore tailings dry stacking in Pau Branco mine, Brazil. J. Mater. Res. Technol. 2016, 5, 339–344. [Google Scholar] [CrossRef] [Green Version]
  8. Cacciuttolo, C.; Valenzuela, F. Efficient Use of Water in Tailings Management: New Technologies and Environmental Strategies for the Future of Mining. Water 2022, 14, 1741. [Google Scholar] [CrossRef]
  9. Yan, W. Tailings Disposal Methods and Applications at Home and Abroad. Met. Mine 2016, 9, 1–13. (In Chinese) [Google Scholar]
  10. Zhang, C.; Chai, J.; Cao, J.; Xu, Z.; Qin, Y.; Lv, Z. Numerical Simulation of Seepage and Stability of Tailings Dams: A Case Study in Lixi, China. Water 2020, 12, 742. [Google Scholar] [CrossRef] [Green Version]
  11. Wang, G.; Hu, B.; Tian, S.; Ai, M.; Liu, W.; Kong, X. Seepage field characteristic and stability analysis of tailings dam under action of chemical solution. Sci. Rep. 2021, 11, 4073. [Google Scholar] [CrossRef]
  12. Rodríguez, R.; Muñoz-Moreno, A.; Vanessa Caparrós, A.; García-García, C.; Brime-Barrios, Á.; César Arranz-González, J.; Rodríguez-Gómez, V.; Fernández-Naranjo, F.J.; Alcolea, A. How to Prevent Flow Failures in Tailings Dams. Mine Water Environ. 2021, 40, 83–112. [Google Scholar] [CrossRef]
  13. China Nonferrous Metals Industry Association. Code for Design of Tailings Facilities; China Planning Press: Beijing, China, 2013. [Google Scholar]
  14. Schafer, W.M. Probabilistic Modeling of Long-Term Mass Loads from a Covered Dry-Stack Tailings Facility. In Proceedings of the 7th International Conference on Acid Rock Drainage (ICARD), St. Louis, MO, USA, 26–30 March 2006; Barnhisel, R.I., Ed.; American Society of Mining and Reclamation (ASMR): Lexington, KY, USA, 2006. [Google Scholar]
  15. Hudson, A.; Hussey, A.; Harley, A.; Dyhr, T.M. Simulating the Performance of a Dry Stack Tailings Design for Water Control Permitting. In Proceedings of the 10th International Conference on Acid Rock Drainge & IMWA Annual Conference, Santiago, Chile, 21–24 April 2015. [Google Scholar]
  16. Ning, L.U.; William, J.L. Unsaturated Soil Mechanics; John Wiley & Sons, Inc.: Hoboken, NJ, USA, 2004. [Google Scholar]
  17. Sun, G.; Yang, Y.; Cheng, S.; Zheng, H. Phreatic line calculation and stability analysis of slopes under the combined effect of reservoir water level fluctuations and rainfall. Can. Geotech. J. 2017, 54, 631–645. [Google Scholar] [CrossRef] [Green Version]
  18. Rahimi, A.; Rahardjo, H.; Leong, E.C. Effect of antecedent rainfall patterns on rainfall-induced slope failure. J. Geotech. Geoenviron. 2011, 137, 483–491. [Google Scholar] [CrossRef]
  19. Joe, E., Jr.; Ali, N.; Jusoh, S.N. Numerical modelling of coupled seepage-deformation subjected to rainfall infiltration in unsaturated slope. World J. Eng. 2020, 17, 867–875. [Google Scholar] [CrossRef]
  20. Chinkulkijniwat, A.; Yubonchit, S.; Horpibulsuk, S.; Jothityangkoon, C.; Jeeptaku, C.; Arulrajah, A. Hydrological responses and stability analysis of shallow slopes with cohesionless soil subjected to continuous rainfall. Can. Geotech. J. 2016, 53, 2001–2013. [Google Scholar] [CrossRef]
  21. Ng, S.M.; Ismail, M.A.M.; Abustan, I. Development of Groundwater Level Fluctuation Response System Subjected to Rainfall for Slope Stability Forecasting. J. Geol. Soc. India 2020, 96, 616–622. [Google Scholar] [CrossRef]
  22. He, J.; Wang, S.; Liu, H.; Nguyen, V.; Han, W. The critical curve for shallow saturated zone in soil slope under rainfall and its prediction for landslide characteristics. Bull. Eng. Geol. Environ. 2021, 80, 1927–1945. [Google Scholar] [CrossRef]
  23. Robinson, J.D.; Vahedifard, F.; AghaKouchak, A. Rainfall-triggered slope instabilities under a changing climate: Comparative study using historical and projected precipitation extremes. Can. Geotech. J. 2017, 54, 117–127. [Google Scholar] [CrossRef] [Green Version]
  24. Greco, R.; Comegna, L.; Damiano, E.; Marino, P.; Olivares, L.; Santonastaso, G.F. Recurrent rainfall-induced landslides on the slopes with pyroclastic cover of Partenio Mountains (Campania, Italy): Comparison of 1999 and 2019 events. Eng. Geol. 2021, 288, 106160. [Google Scholar] [CrossRef]
  25. Wu, L.Z.; Zhang, L.M.; Zhou, Y.; Li, B.E. Analysis of multi-phase coupled seepage and stability in anisotropic slopes under rainfall condition. Environ. Earth Sci. 2017, 76, 469. [Google Scholar] [CrossRef]
  26. Dong, H.; Huang, R.; Gao, Q.F. Rainfall infiltration performance and its relation to mesoscopic structural properties of a gravelly soil slope. Eng. Geol. 2017, 230, 1–10. [Google Scholar] [CrossRef]
  27. Qiu, X.; Li, J.; Jiang, H.; Ou, J.; Ma, J. Evolution of the Transient Saturated Zone and Stability Analysis of Slopes under Rainfall Conditions. KSCE J. Civ. Eng. 2022, 26, 1618–1631. [Google Scholar] [CrossRef]
  28. Mao, X.; Zhang, B.; Fu, W. Stability Analysis of Soil Slopes Subject to Action of Rainfall-Induced Wetting Front. Soil Mech. Found. Eng. 2021, 58, 109–115. [Google Scholar] [CrossRef]
  29. Hu, W.; Xin, C.L.; Li, Y.; Zheng, Y.S.; van Asch, T.W.J.; McSaveney, M. Instrumented flume tests on the failure and fluidization of tailings dams induced by rainfall infiltration. Eng. Geol. 2021, 294, 106401. [Google Scholar] [CrossRef]
  30. Liu, W.; Luo, X.; Huang, F.; Fu, M. Uncertainty of the Soil-Water Characteristic Curve and its effects on slope seepage and stability analysis under conditions of rainfall using the Markov Chain Monte Carlo method. Water 2017, 9, 758. [Google Scholar] [CrossRef] [Green Version]
  31. Fredlund, D.G.; Xing, A. Equations for the Soil-water Characteristic Curve. Can. Geotech. J. 1994, 31, 521–532. [Google Scholar] [CrossRef]
  32. van Genuchten, M.T. A closed-form equation for predicting the hydraulic conductivity of unsaturated soils. Soil Sci. Soc. Am. J. 1980, 44, 892–898. [Google Scholar] [CrossRef] [Green Version]
  33. Yamaguchi, K.; Tomiyama, S.; Igarashi, T.; Yamagata, S.; Ebato, M.; Sakoda, M. Effects of Backfilling Excavated Underground Space on Reducing Acid Mine Drainage in an Abandoned Mine. Minerals 2020, 10, 777. [Google Scholar] [CrossRef]
Figure 1. Diagram of the factors leading to the change of seepage water in the dry-stack tailings pond (Note: residual water refers to the water that cannot be separated freely after tailings are dehydrated).
Applsci 12 12123 g001
Figure 2. Model of dry-stack tailings pond: (a) i = sinβ = 0.05; (b) i = sinβ = 0.1; (c) i = sinβ = 0.15.
Applsci 12 12123 g002
Figure 3. Parameter curves of the unsaturated soil: (a) soil–water characteristic curves (SWCC); (b) hydraulic conductivity curves.
Applsci 12 12123 g003
Figure 4. Annual rainfall distribution in different regions and years: (a) 400 mm: Taiyuan, in 2018, 2019, and 2020; (b) 800 mm: Zhengzhou, in 2018, 2019, and 2020; (c) 1200 mm: Guiyang, in 2018, 2019, and 2020.
Applsci 12 12123 g004
Figure 5. Pore pressure curves of the seepage field in a dry-stack tailings pond under different rainfall patterns: (a) Taiyuan: 2018, 2019, and 2020; (b) Zhengzhou: 2018, 2019, and 2020; (c) Guiyang: 2018, 2019, and 2020.
Applsci 12 12123 g005
Figure 6. The spatial–temporal evolution law of the saturation line in the tailings pond (Taiyuan, 400 mm): (a) Taiyuan 2018 (caseII-a); (b) Taiyuan 2019 (caseII-b); (c) Taiyuan 2020 (caseII-c).
Applsci 12 12123 g006
Figure 7. The spatial–temporal evolution law of the saturation line in the tailings pond (Zhengzhou, 800 mm): (a) Zhengzhou 2018 (caseII-d); (b) Zhengzhou 2019 (caseII-e); (c) Zhengzhou 2020 (caseII-f).
Applsci 12 12123 g007
Figure 8. The spatial-temporal evolution law of the saturation line in the tailings pond (Guiyang, 1200 mm): (a) Guiyang 2018 (caseII-g); (b) Guiyang 2019 (caseII-h); (c) Guiyang 2020 (caseII-i).
Applsci 12 12123 g008
Figure 9. The variation curve of initial dam drainage flow with rainfall time: (a) Taiyuan (the annual rainfall of 400 mm); (b) Zhengzhou (the annual rainfall of 800 mm); (c) Guiyang (the annual rainfall of 1200 mm).
Applsci 12 12123 g009
Figure 10. Effects of rainfall patterns: (a) Taiyuan 2018, Taiyuan 2019, and Taiyuan 2020 (i = 0.05); (b) Taiyuan 2018, Taiyuan 2019, and Taiyuan 2020 (i = 0.1); (c) Taiyuan 2018, Taiyuan 2019, and Taiyuan 2020 (i = 0.15); (d) Zhengzhou 2018, Zhengzhou 2019, and Zhengzhou 2020 (i = 0.05); (e) Zhengzhou 2018, Zhengzhou 2019, and Zhengzhou 2020 (i = 0.1); (f) Zhengzhou 2018, Zhengzhou 2019, and Zhengzhou 2020 (i = 0.15); (g) Guiyang 2018, Guiyang 2019, and Guiyang 2020 (i = 0.05); (h) Guiyang 2018, Guiyang 2019, and Guiyang 2020 (i = 0.1); (i) Guiyang 2018, Guiyang 2019, and Guiyang 2020 (i = 0.15).
Applsci 12 12123 g010aApplsci 12 12123 g010b
Figure 11. Effects of annual rainfall: (a) i = 0.05; (b) i = 0.1; (c) i = 0.15.
Applsci 12 12123 g011
Figure 12. Distribution of the saturation line under different terrains of the tailings pond: (a) Taiyuan (annual rainfall of 400 mm); (b) Zhengzhou (annual rainfall of 800 mm); (c) Guiyang (annual rainfall of 1200 mm).
Applsci 12 12123 g012
Figure 13. Rainfall deducting evaporation in 2020.
Applsci 12 12123 g013
Figure 14. Saturation line of RSSF considering evaporation effect: (a) i = 0.05; (b) i = 0.1; (c) i = 0.15.
Applsci 12 12123 g014
Table 1. Calculation table of working conditions.
Rainfall ParametersBottom Slope of 0.05Bottom Slope of 0.1Bottom Slope of 0.15
Annual RainfallRainfall Pattern
400 mmTaiyuan 2018Case: I-aCase: II-aCase: III-a
Taiyuan 2019Case: I-bCase: II-bCase: III-b
Taiyuan 2020Case: I-cCase: II-cCase: III-c
800 mmZhengzhou 2018Case: I-dCase: II-dCase: III-d
Zhengzhou 2019Case: I-eCase: II-eCase: III-e
Zhengzhou 2020Case: I-fCase: II-fCase: III-f
1200 mmGuiyang 2018Case: I-gCase: II-gCase: III-g
Guiyang 2019Case: I-hCase: II-hCase: III-h
Guiyang 2020Case: I-iCase: II-iCase: III-i
Table 2. Pore pressure variation range at each point in 0–20 years (kPa).
Annual Rainfall (mm)CasePore Pressure (kPa)
Point APoint BPoint C
400Case II-a−49~83.7−49~101.2−49~65.8
Case II-b−49~84.3−49~102.2−49~67.6
Case II-c−49~83.3−49~100.3−49~64.6
800Case II-d−49~128−49~180.3−49~147.6
Case II-e−49~127.3−49~179.1−49~146.4
Case II-f−49~127.7−49~179.8−49~147.1
1200Case II-g−49~165−49~248.5−49~222.4
Case II-h−49~167−49~253.9−49~228.7
Case II-i−49~169−49~257.4−49~233.9
Table 3. Pore pressure variation range at each point in 20–50 years (kPa).
Annual Rainfall (mm)CasePore Pressure (kPa)
Point APoint BPoint C
400Case II-a83.7~86101.2~106.865.8~74.6
Case II-b84.3~86.7102.2~108.467.6~76.5
Case II-c83.3~85.5100.3~105.564.6~72.9
800Case II-d128~131.9180.3~188.3147.6~154.2
Case II-e127.3~131.3179.1~187.2146.4~153.2
Case II-f127.7~131.6179.8~187.9147.1~154.5
1200Case II-g165~166.5248.5~252.4222.4~225.3
Case II-h167~169253.9~258.7228.7~234.2
Case II-i169~171.5257.4~262.5233.9~239.7
Table 4. Pore pressure variation range at each point in 50–150 years (kPa).
Annual Rainfall (mm)CasePore Pressure (kPa)
Point APoint BPoint C
400Case II-a86~86.2106.8~107.274.6~75.2
Case II-b86.7~86.9108.4~108.876.5~76.9
Case II-c85.5~85.9105.5~105.972.9~73.4
800Case II-d131.9~132.3188.3~188.5154.2~154.8
Case II-e131.3~131.7187.3~187.4153.2~154.0
Case II-f131.6~132.1187.9~188.1153.2~154.5
1200Case II-g165.9~166.7252.4~253.4225.3~230.2
Case II-h168~169257.3~258.7230.4~236.2
Case II-i169.8~171.5260.4~262.6235.8~241.8
Table 5. Minimum burial depth of the phreatic line (m).
CaseAnnual Rainfall of 400 mmAnnual Rainfall of 800 mmAnnual Rainfall of 1200 mm
i = 0.05i = 0.1i = 0.15i = 0.05i = 0.1i = 0.15i = 0.05i = 0.1i = 0.15
Evaporation not considered23.923.423.219.419.219.115.815.315.2
Evaporation considered28.027.227.024.924.023.919.919.319.1
Difference rate (%)17.2%16.2%16.4%28.4%25.0%25.8%25.9%26.1%27.3%
Publisher’s Note: MDPI stays neutral with regard to jurisdictional claims in published maps and institutional affiliations.

