Article

A Stochastic Queueing Model for the Pricing of Time-Sensitive Services in the Demand-Sharing Alliance

Department of Industrial Engineering and Management, Peking University, Beijing 100871, China
Appl. Sci. 2022, 12(23), 12121; https://doi.org/10.3390/app122312121
Submission received: 24 October 2022 / Revised: 17 November 2022 / Accepted: 23 November 2022 / Published: 27 November 2022
(This article belongs to the Special Issue New Trends in Production and Operations Management)

Abstract

:
The medical alliance has developed rapidly in recent years. This kind of alliance established by multiple hospitals can alleviate the imbalance of medical resources. We investigate the benefit of demand sharing between a hospital with large demand (HD) and another hospital with large supply (HS). Two hospitals are modeled as queueing systems with finite service rates. Both hospitals set prices to maximize the revenues by serving their time-sensitive patients. We adopt a cooperative game theoretic framework to determine when demand sharing is beneficial. We also propose an optimal allocation of this benefit through a commission fee, which makes the alliance stable. We find that demand sharing may not be beneficial even if HS has a low capacity utilization. Demand sharing becomes beneficial for both hospitals only when the idle service capacity of HS exceeds a threshold, which depends on the potential demand rate of the HS and the unit waiting cost of hospitals. Furthermore, if the idle service capacity of HS is smaller than another threshold, which depends on the potential demand of the two hospitals and the service capacity of HD, then the benefit of demand sharing will be independent of the service capacity and potential demand of HD. We also examine the effect of system parameters on revenue gains due to demand sharing.

1. Introduction

The mismatch between supply and demand has been a prevalent problem in the healthcare system. For example, in some Chinese remote rural areas or new peri-urban areas, the medical resources for some kinds of illness is poor [1]. In this case, the local medical service providers are faced with a potential demand that is larger than what it can handle. Meanwhile, the medical resources in metropolis are plentiful. Due to stiff competition, these service providers in big city may not attract enough demand.
The imbalance of medical resources makes patients spend too much time waiting for medical services. Studies have shown that waiting time is one of the main indicators for evaluating patient satisfaction, which has a great impact on overall satisfaction [2,3]. Song et al. (2019) [4] analyze patients’ willingness to make their first visit to primary care institutions and shows that the convenience of consultation is the key factor which patients choose primary care institutions for the first diagnosis. In a hospital survey in Nanjing, China, waiting time accounted for a higher proportion of the total waiting time for medical treatment, which affected patient utility [5].
In order to reduce this mismatch, in China, hospitals have combined into a medical alliance. One example is the cross-regional specialized medical alliance [6] in China. This alliance aims to integrate medical resources and use telemedicine so that patients from remote areas can enjoy medical services of a similar quality to those available in metropolis [7]. In this alliance, rural hospitals can share demand and medical resource with the hospital located in major cities. In this case, the urban hospital is considered as the under-demanded service provider. This form is developing very rapidly in China, there are many medical alliances under construction in Chinese cities (Beijing, Shanghai, Wuhan, Shenzhen, etc.) [8].
Forming an alliance is a reasonable strategy for hospitals to solve the imbalance between supply and demand. Such a strategy would be feasible if the HD shares a part of its demand with the HS who pays an appropriate commission fee. It is called as demand sharing strategy, and both HD and HS can benefit from this strategy. Evidently, the HD can generate extra revenue by collecting the commission fee, and HS can utilize its idle capacity to serve more patients. It seems that the demand sharing strategy is a win-win thing for the two hospitals. However, as shown in this study, this intuitive win-win situation can only occur under some conditions. These conditions are very important for practitioners considering this demand sharing strategy by forming an alliance of hospitals facing demand and supply mismatch.
In the cross-regional specialized medical alliance, since each member of the alliance is decentralized managed, a reasonable method of profit distribution is one of the key factors to achieve cooperation. Otherwise, the HD may prefer to expand its facilities and serve more patients, the HS may tends to reduce its investment, and the patients are more likely to go to the HD because they do not believe in the diagnosis and treatment ability of HS. The mismatch problem becomes more serious, and enter a virtuous circle. Therefore, without a reasonable method of profit distribution, it is difficult to achieve cooperation.
This problem also shows in many other service markets due to asymmetric information or other reasons. Owing to some barriers to market entry (such as exclusive licenses, anti-competitive subsidization, and tariff protection), a service provider (monopoly) with limited service capacity in the market can be faced with a potential demand that is larger than what it can handle.
In this paper, we try to study the alliance, where some participants are often in short supply, while others are facing an oversupply situation. For example, the demand of hospitals in remote areas exceeds supply, or the demand of core hospitals of the medical alliance exceeds supply. HD will transfer part of their demand to HS, which can improve the efficiency of HS. There are several main research questions to answer; they are as follows: (1) When does demand sharing benefit both hospitals? (2) With demand sharing, what are the optimal pricing decisions for both hospitals? (3) How to divide the revenue gains from the demand sharing alliance between two hospitals?
Two hospitals serve their own stream of delay-sensitive patients in two different regions. Each service provider is modeled as an M/M/1 queueing system with different potential Poisson arrival rate and exponential service rate. If the HS participates in this alliance, then it should serve two classes of patients from two different regions. These two classes differ in their arrival rates and delay sensitivities. Based on the price and delay information, each arriving patient in HD is faced with three options—joining the line of HD, switching to the line of HS, and balking. Patients in Region-2 (or HS region) decide whether to join the line of HS or balk. The term ‘balk’ means that the patient will not join the system and leave without service. Patients do not observe the actual queue length at their arrivals. However, they are informed of the average delay (long-term statistics). We also assume that the patient type (HS region or HD region) is known to HS upon patients’ arrival, and different prices can be set for different patient types. All patients are served on a first-come first-served (FCFS) basis. Both hospitals try to maximize their revenues. The two hospitals use the pricing mechanisms to control the demand of each stream, and allocate the revenue gain by the commission fee. If this operation benefit both hospitals, then the HD and HS will collaborate, and a demand sharing alliance will be established. This study adopts a cooperative game theoretic framework to model the cooperation between HD and HS.
The major contributions of this study are as follows:
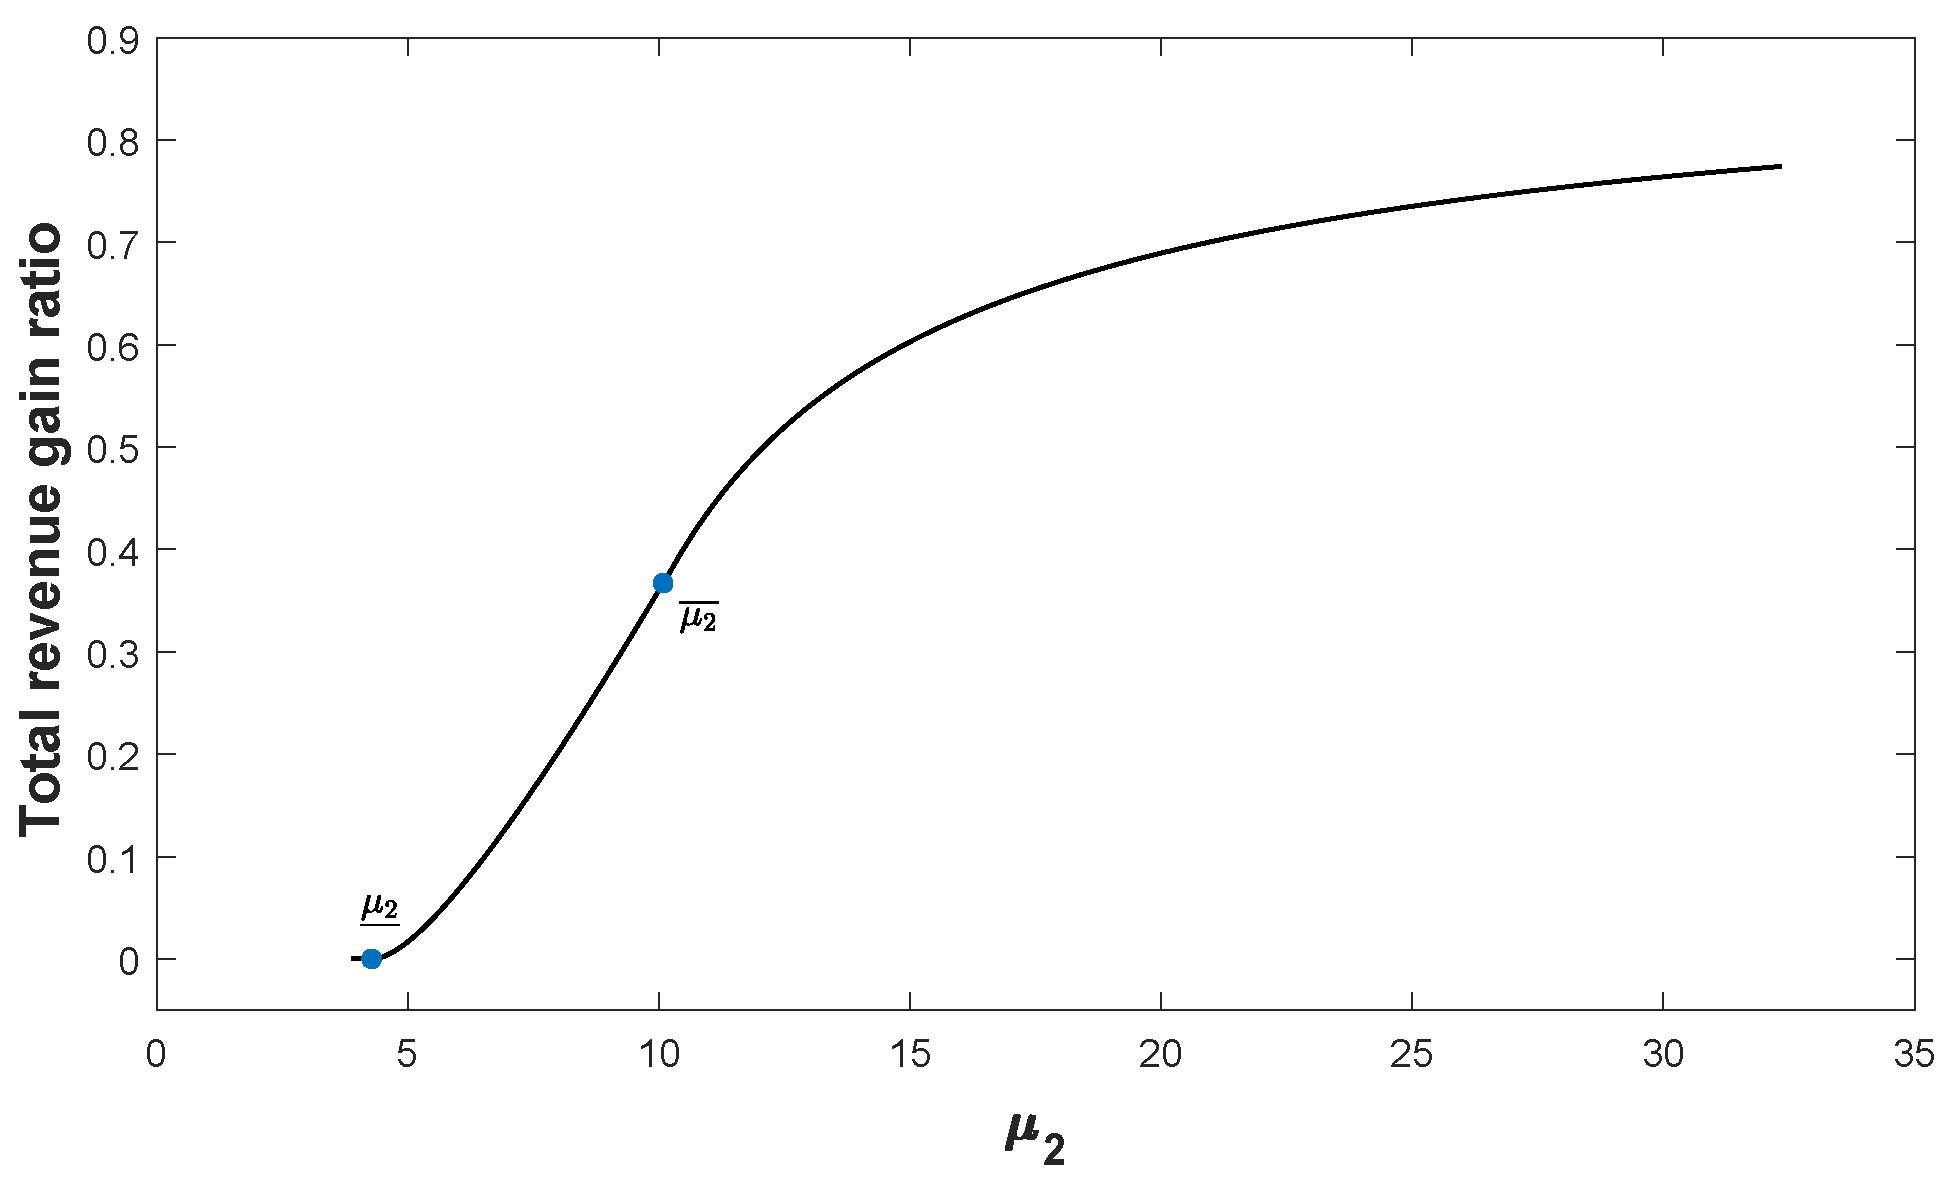
  • we obtain the threshold condition for HS’s idle capacity under which the demand sharing works.
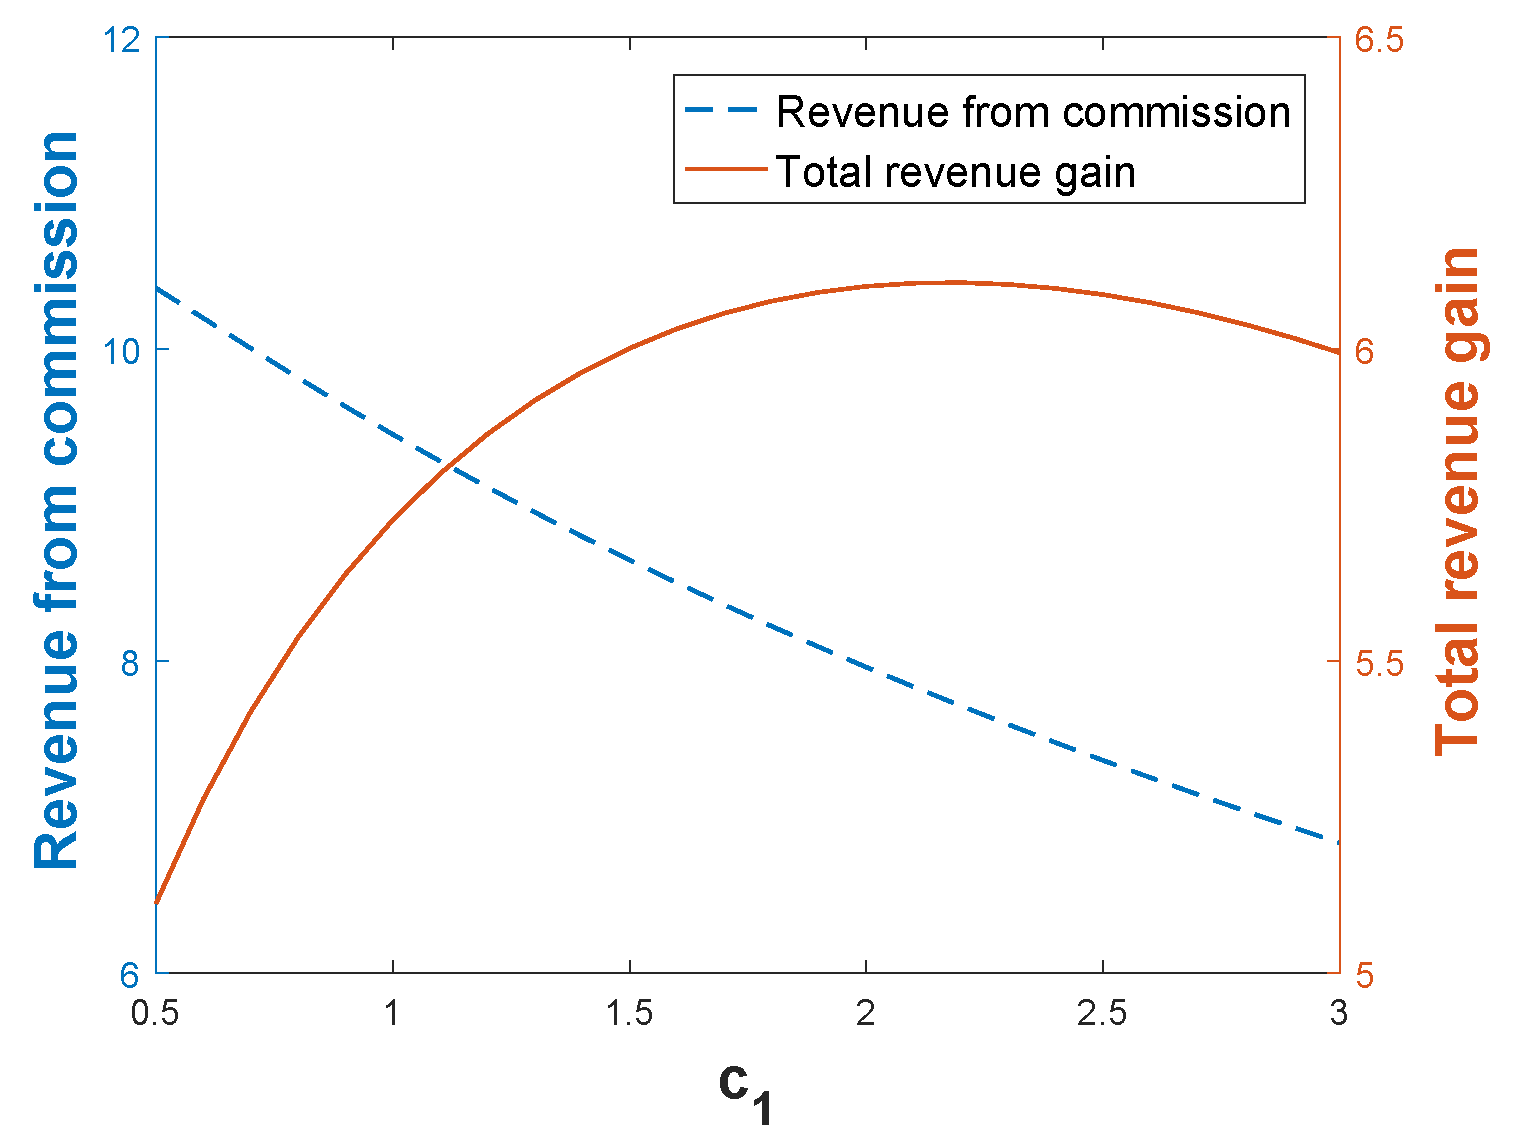
  • we provide the optimal (or stable) commission fee charged by HD that makes demand sharing alliance work.
The rest of this paper is organized as follows. Section 2 summarizes related work on capacity sharing and co-sourcing and compares them with our demand sharing model. Section 3 applies a rational queueing framework to model the service process of HD and HS. Section 4 identifies when demand sharing is beneficial and presents the optimal allocation of the benefit through commission fees if demand sharing is beneficial. Finally, Section 5 concludes with a summary.

2. Related Literature

Medical alliance is an effective way to alleviate the imbalance of medical resources. We will first review the relevant literature of the Medical Alliance. Demand sharing is our main strategy for building a medical alliance, which is the key to improving the uneven supply and demand. A stream of operation management literature related to our work studies the advantage of the inter-firm collaboration strategy in dealing with demand fluctuation or the economies of scope. Therefore, we then review the work on resource pooling, capacity sharing, co-sourcing, and the on-demand service platform. Another related study area is service pricing in queueing systems with self-interested customers.
The medical alliance or referral system have been studied in several articles. Li and Zhang (2015) [9] studied different kinds of contract used in the medical alliance, and address the problem that how to design a contract to to motivate the service provider to do their best to serve patients with mild diseases. Chen et al. (2015) [10] used rational queuing theory to study the capacity planning problem in the referral system. In this paper, we also study the medical alliance, but we focus on the analysis of the benefit allocation mechanism of the demand sharing alliance.
Several papers studied resource pooling and cost sharing among queueing systems. Anily and Haviv (2010) [11] use a cooperative game to study the cost allocation mechanism in the case, wherein a number of servers pool their capacity and customer streams into a single M/M/1 system, and show that the game possesses non-empty cores. Yu et al. (2015) [12] adopted a queueing model and cooperative game to identify settings wherein several firms investing and sharing with one facility can improve the service level and reduce the cost. Zeng et al. (2017) [13] formulate a cooperative game to study the capacity transfer among several M/M/1 systems or M/M/s systems, and propose cost-sharing rules that are at the core of the corresponding game. Anily and Haviv (2017) [14] study the line-balancing in a parallel M/M/1 system and M/M/1/1 system with a cooperative game and show that the core is non-empty. These aforementioned studies assume that the demand is exogenous and can be routed or pooled among all lines without considering customers’ interest. Contrarily, our study assumes that the demand is endogenous—customers are treated as players in the game.
Concerning co-sourcing, it occurs when a firm outsources part of its service to another firm for strategic (customer segmentation) or operational (demand uncertainty) reasons [15]. Aksin et al. (2008) [16] analyzed the optimal capacity and pricing decisions in call center settings under each contract type when a firm adopted outsourcing. Lee et al. (2012) [17] studied how to outsource one level of a two-level service process, wherein the first level diagnoses the request’s complexity. Their studies focused on the problem of coordinating the service providers serving heterogeneous customers. It must be noted that the firm that outsources has complete control over the product price (or owns the demand). Contrarily, in a demand sharing alliance, the HS can set its price and decide how much demand it needs to serve.
To deal with demand fluctuation, a stream of literature studies the capacity sharing between firms who compete on price. Li and Zhang (2015) [9] studied the benefit of capacity sharing in shipping industries. They compared the capacity reservation model, wherein shipping forwarders are allowed to reserve shipping capacity before the demand is realized and have an option to trade capacity after the demand is realized, with the passive capacity sharing model, wherein shipping forwarders only have an option to trade capacity after the demand is realized. They found that capacity reservation model helps the carrier firm to squeeze more profits out of the shipping forwarders. Guo and Wu (2016) [18] studied capacity sharing between two firms that engage in price competition under ex-ante and ex-post capacity sharing price schemes. They found that the equilibrium outcome under ex-ante contracting was more sensitive to variations in market parameters than ex-post contracting. Cetinkaya et al. (2012) [19] studied the capacity collaboration under the scenario wherein two firms build capacity before the demand is realized and make production decisions after they receive a demand signal. These works used a traditional demand function capturing the relationship between demand and price without considering the customer delay cost. Customer delay cost is a fundamental factor in modeling service demand. Contrarily, our study examines demand sharing in service industries where demand depends on both price and delay cost.
Our study is also related to some studies focusing on the on-demand service platforms, such as Uber and DiDi. Tang et al. (2016) and Taylor (2016) [20,21] studied how to set the wage for part-time employees and the price for delay sensitive customers to match the demand with the supply. In our study, the HS is an independent firm with its own demand rather than being the firm that plays the role of part-time employees of an HD. The HS makes its decision based on its own demand and capacity.
Finally, the current study is related to a research stream on pricing for queueing systems with self-interested customers, which is started by [22,23]. See [24,25,26] for an excellent review. Note that we focus on the static pricing policy in this paper since the dynamic price changes may not allowed in many industries. Chen and Frank (2004) [27] studied monopoly pricing an unobservable queue with homogeneous customers with joining and balking options. Chen and Wan (2003) [28] studied simultaneous price competition between two firms in a market with homogeneous customers. Our model is closely related to that of the model by [29], which investigated the service provider’s optimal pricing service for two types of customers who cannot observe the queue length. The pricing policy prescribes different prices for different types of customers. Suk and Wang (2020) [30] consider a tandem queueing system with price sensitive but delay insensitive heterogeneous customers, and study static pricing policy and dynamic pricing policy. In this study, we study the pricing problem under the cooperation between HD and HS, which form a parallel-server queueing system.

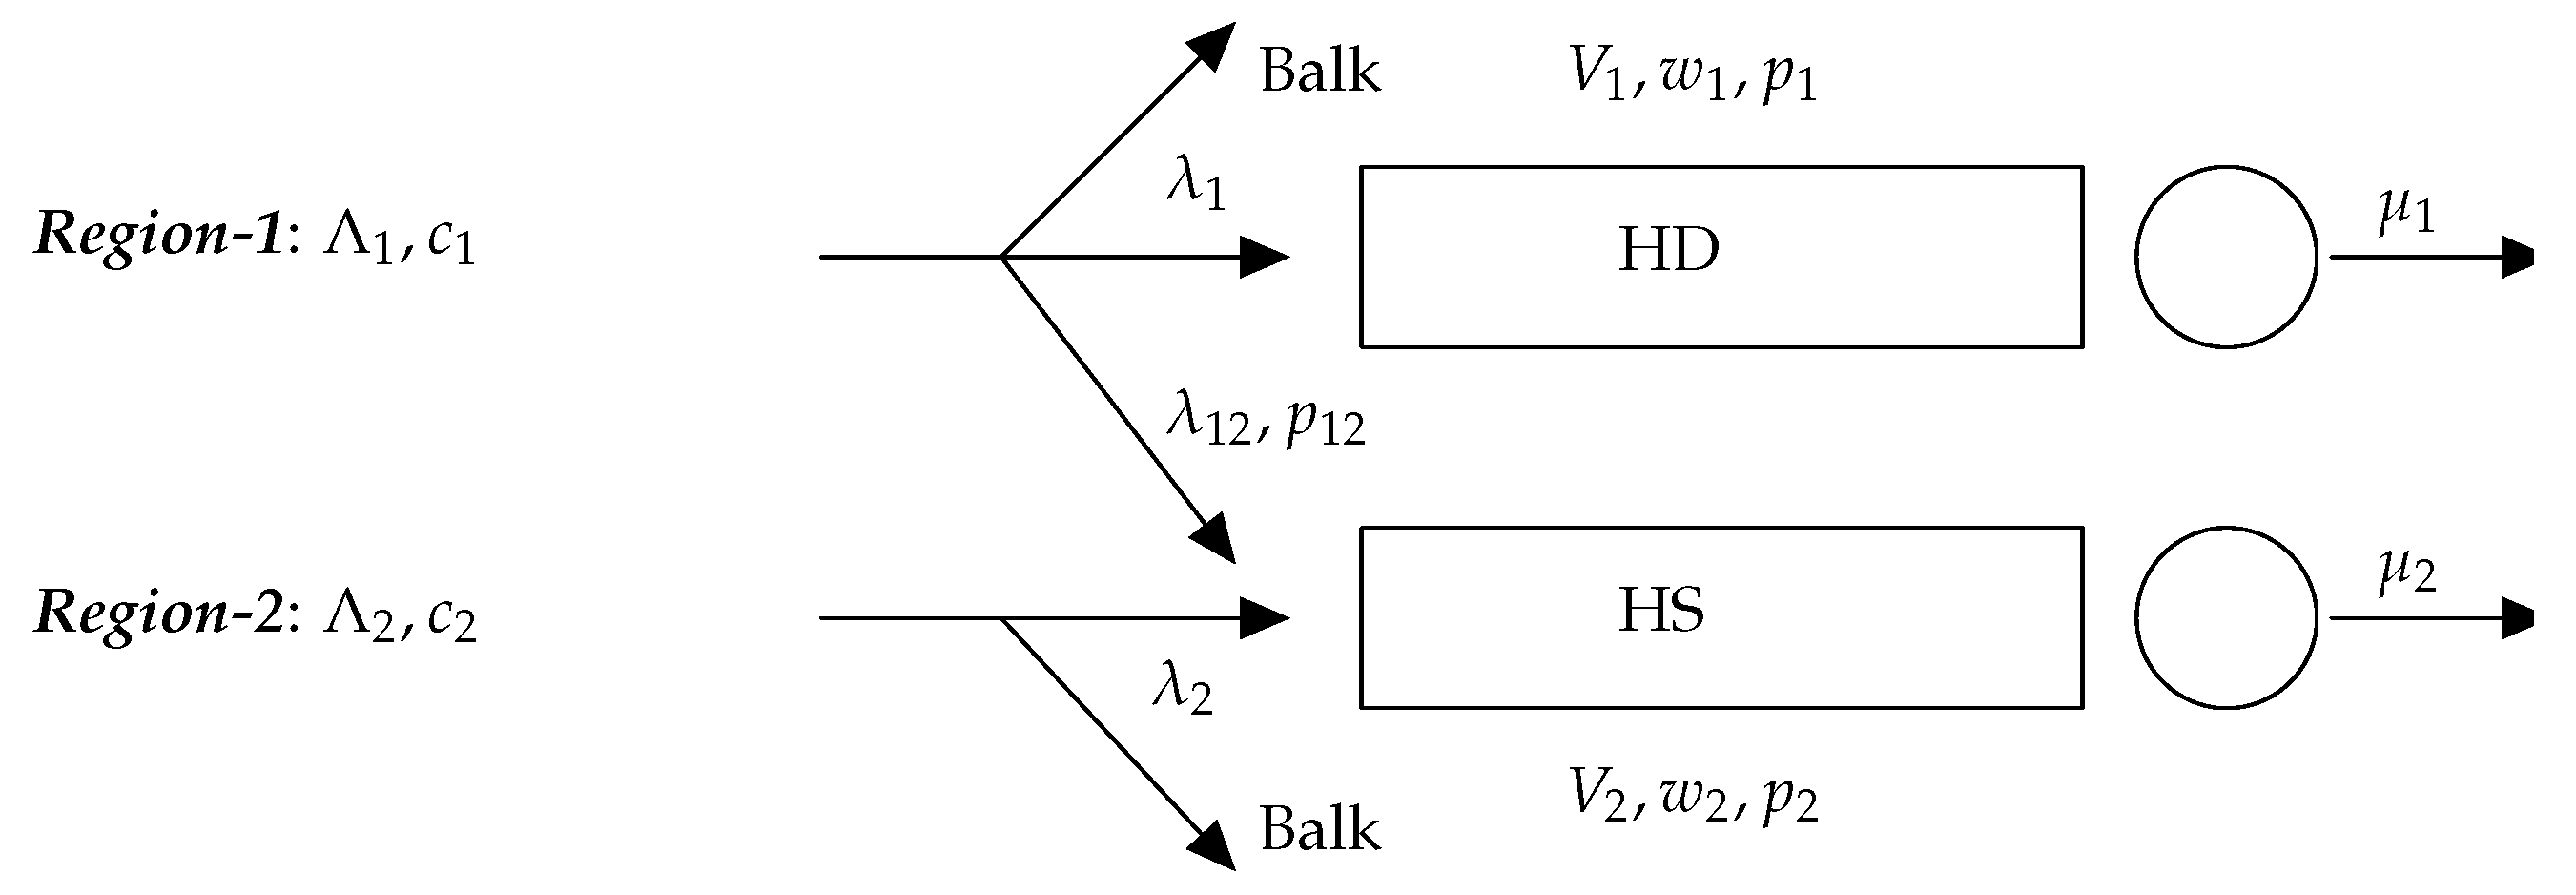
3. Model Formulation

3.1. Two Hospitals with Unbalanced Congestion

First, we describe the mismatch between supply and demand of two hospitals based on a rational queueing framework. We consider two independent hospitals; each hospital has a M/M/1 queueing system with processing rate μ i , i = { 1 , 2 } . Their potential patient arrival rate is Λ i . Patients must wait when the doctor is busy. Patient’s delay cost is proportional to the system delay. The cost of stay per unit time is denoted by c i . Each arriving patient must decide whether to request for the medical service (joining) or not (balking). Patients have a reserved value for each service, which is denoted by V i . The utility function of patients is formulated as U i = V i c i w i p i , where w i is the average sojourn time and p i is the price. We assume that customers can make decision based on the long-term average sojourn time and system parameters such as stay cost per unit time. In several practical situations, the average stay time is available public information. For instance, in Canada [31] or Hong Kong [32], the average stay time for some non-emergent medical service in public hospitals is posted on the website. A patient purchases the service if the patient’s net surplus is positive, that is, U i 0 . The effective arrival rate, which represents the patient arrivals with purchase, is denoted by λ i . The revenue function of the two independent hospitals can be written as π i 0 = p i λ i . We assume that the service capacity is fixed and its investment is sunk cost. Previous literature [27] provides the optimal pricing strategy of a monopoly firm via queueing modeling as follows,
  • if Λ i μ i c i μ i / V i , then the optimal price is p i * = V i c i V i / μ i , the optimal effective arrival rate is λ i * = μ i c i μ i / V i , and the corresponding optimal revenue is π i 0 = ( V 1 μ 1 c 1 ) 2 .
  • if Λ i < μ i c i μ i / V i , then the optimal price is p i * = V i c i / ( μ i Λ i ) , the optimal effective arrival rate is λ i * = Λ i , and the corresponding optimal revenue is π i 0 = Λ 2 [ V 2 c 2 / ( μ 2 Λ 2 ) ] .
This optimal price need to balance the trade off between the revenue from a patient and the externality caused by this patient.
The hospital HD, indexed by i = 1 , which is a large general hospital, attracts a demand which is too large to be met in China because of the medical habits of Chinese patients, the distrust of patients in the treatment capacity of small hospitals, and poor doctors in small hospitals, etc. We define this large demand scenario as the case where the potential patient arrival rate is larger than the effective arrival rate under the optimal pricing strategy, i.e., μ 1 c 1 μ 1 / V 1 < Λ 1 . Accordingly, we make the following assumption for the HD.
Assumption A1.
HD is characterized by a limited service rate that satisfies μ 1 0 < μ 1 < μ 1 1 , where μ 1 0 and μ 1 1 are defined as μ 1 0 = c 1 V 1 ; and μ 1 1 = Λ 1 + c 1 2 V 1 + c 1 2 4 V 1 2 + c 1 Λ 1 V 1 .
In Assumption A1, the condition μ 1 < μ 1 1 is equivalent to μ 1 c 1 μ 1 / V 1 < Λ 1 . The other condition μ 1 0 < μ 1 is equivalent to V 1 c 1 / μ 1 > 0 , which ensures that the HD can attract at least one patient. Accordingly, we can get the optimal revenue of HD when it operates independently, that is π 1 0 = ( V 1 μ 1 c 1 ) 2 .
The hospital HS, indexed by i = 2 , which is a community hospital, cannot attract patients due to its lack of medicine and poor doctors. However, it can provide alternative services for common diseases as that of the HD. Given the market segmentation, since the coverage of medical insurance is only local or the distance between regions is relatively long, the HS cannot directly serve patients in the HD’s region (region-1). One case that satisfies the above two types of hospitals is the medical alliance constructed between hospitals in remote areas and specialized hospitals in big cities, such as the “Wu Jieping Urological Medical Center”. In this kind of alliance, hospitals in remote areas are hospitals HD, since the medical resources in their areas are poor, which makes it difficult to treat some intractable diseases. On the other hand, specialized hospitals in big cities are hospital HS due to the sufficient medical resources in the large cities and the fiercer competition among hospitals. Moreover, due to geographical restrictions, the two hospitals can be considered to be in two separate markets.
The hospital HS is faced with a small potential demand due to its lack of medicine and poor doctors, such as it is a new hospital. Similarly, we make the following assumption to define this under-utilized scenario.
Assumption A2.
HS is characterized by a large service rate that satisfies μ 2 > μ 2 0 , where μ 2 0 is defined as μ 2 0 = Λ 2 + c 2 2 V 2 + c 2 2 4 V 2 2 + c 2 Λ 2 V 2 .
In Assumption A2, the condition μ 2 > μ 2 0 is equivalent to μ 2 c 2 μ 2 / V 2 > Λ 2 ; it means that the HS is faced with the potential demand that is smaller than the demand level under the optimal policy. HS’s optimal revenue, when it operates independently, is π 2 0 = Λ 2 [ V 2 c 2 / ( μ 2 Λ 2 ) ] . It is increased in the potential arrival rate Λ 2 .
Note that the above two scenarios are defined based on their own region characteristics and optimal pricing strategy. We do not give assumption for the relationship between the congestion of two hospitals. Thus, the congestion of the under-utilized HS is possibly more heavy than the over-demanded HD.

3.2. Demand Sharing between Two Hospitals

We can see that both HD and HS are faced with a mismatch between supply and demand. It seems that it is beneficial for both hospitals if the HD shares a part of its patients with the HS. We consider one type of patients sharing alliance between the two hospitals, wherein the HD adds an alternative for its patients that they can opt to use HS’s service, as shown in Figure 1. The price of this option p 12 is different from the original price of HD’s service p 1 . If a patient opts this alternative and purchases HS’s service, then the HD can get a commission fee s from this transaction.
In this alliance, HS is faced with two classes of patients. Two classes are completely differentiated and observed by the HS upon their arrivals. HS can control the arrival rate of the two streams by pricing. We assume that all patients are served on a FCFS basis. Thus, the expected waiting times postulated by the two classes are the same. We also assume that the patients from HD are more impatient than those from Region-2, that is, c 1 c 2 . We make this assumption due to two main reasons. First, if c 1 c 2 , then it will be more profitable for HS to serve patients from Region-2 under the same waiting time. As a result, the balking patient must belong to Market-1, if it exists, which is more appropriate for most scenarios. Second, if we make an opposite assumption, that is, c 1 < c 2 , then the balking patient must belong to Region-2, if it exists. This would produce similar results because the HS’s trade-off between revenue gain from higher utilization and revenue loss due to the externality of new patients would still hold.
We now describe the interaction between hospitals and patients in this alliance. Two hospitals need to make pricing decisions. HD decides the price of its service p 1 and the commission fee s. HS decides its price for Region-2 p 2 and the price for patients switching from HD p 12 .
Given the prices, each arriving patient in HD is faced with three options—joining the queue of HD, switching to the queue of HS, and balking. Patients must choose one option with the largest net surplus. Concerning patients in Region-2, they join the queue of HS if the patient’s net surplus is positive. In equilibrium, a patient should be indifferent between either alternative. Hence, two classes of patient’s decentralized decision behavior for a given pricing strategy results in the following relations:
V 1 p 1 c 1 μ 1 λ 1 = V 2 p 12 c 1 μ 2 λ 12 λ 2 0 , V 2 p 2 c 2 μ 2 λ 12 λ 2 0 , λ 1 + λ 12 Λ 1 ,
wherein λ 12 represents the arrival rate of patients that switch from HD to HS.
Both HD and HS attempt to maximize their revenues by pricing their services. The HD utilizes the price p 1 and commission fee s to control the demand served by itself, λ 1 , and the part shared with the HS, λ 12 . Hence, the HD’s optimization problem is as follows:
max p 1 , s π 1 ( p 1 , s ) = p 1 λ 1 + s λ 12 .
Given that each patient type is known upon arrival, the HS can set different prices for different classes of patients. There exists a trade-off between making extra revenue and increasing the delay of patients by serving more patients that switch from the HD. The HD employs two prices— p 2 and p 12 —to balance the two types of demands. The HS’s optimization problem is as follows:
max p 2 , p 12 0 π 2 ( p 2 , p 12 0 ) = p 2 λ 2 + p 12 0 λ 12 ,
where p 12 0 = p 12 s .

4. Analysis

A medical alliance can be reached by the pricing mechanisms that provides adequate incentives. First, we must identify the setting under which collaboration is essential. We solve the optimal pricing problem for the medical alliance. Subsequently, we compare the optimal revenue of the medical alliance with the total optimal revenues of the two independently operating hospitals. Collaboration becomes beneficial only when the former is greater than the latter. If demand sharing is feasible, then we can formulate a two-players cooperative game to characterize the bargaining processes for HD and HS and to determine the optimal allocation of the extra benefit due to demand sharing through commission fees.

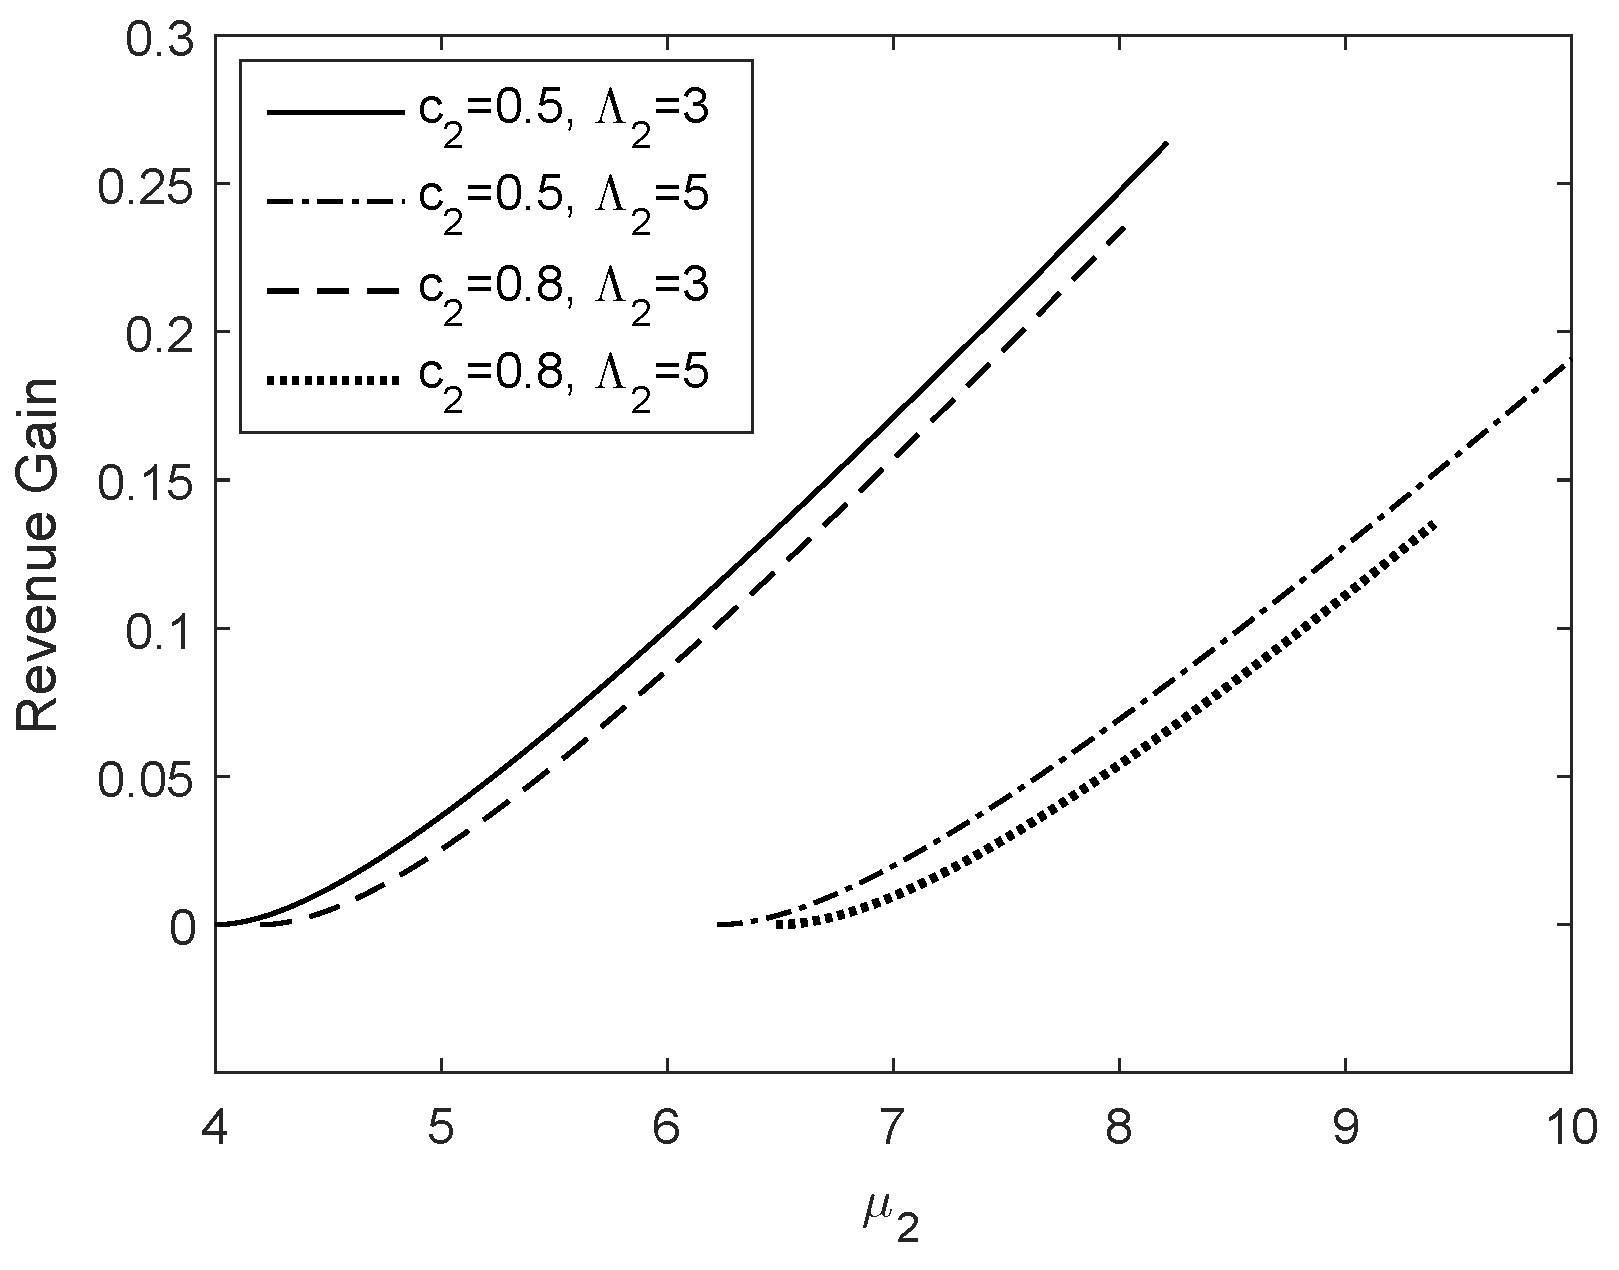
4.1. Total Benefit of Demand Sharing

We first analyze the medical alliance that generates the maximum benefit possible from demand sharing. The objective is to maximize the total revenue with three optimal prices (i.e., p 1 , p 2 , p 12 ) as follows.
π c ( p 1 , p 2 , p 12 ) = p 1 λ 1 + p 12 λ 12 + p 2 λ 2 .
In (4), we can see that the direct benefit of demand sharing is p 12 λ 12 , since, otherwise, this part of patients cannot get service. However, the waiting time will increase if HS would serve more patients; this may drive the HS to set a lower price to compensate its own patients (from Region-2) for the extra delay. This may cause a revenue reduction (lower p 2 ) in the Market-2. Hence, whether demand sharing can raise total revenue depends on HS’s market characteristics. Proposition 1 specifies a lower threshold for the HS service rate, which provides the condition for revenue gain via demand sharing. Proofs of propositions and corollaries are in the Appendix A and Appendix B.
Proposition 1.
There exists a threshold
μ 2 ̲ = Λ 2 + c 1 2 V 2 + c 1 2 4 V 2 2 + c 2 Λ 2 V 2 ,
such that if and only if μ 2 > μ 2 ̲ , then the medical alliance via demand sharing will result in a revenue gain compared to the independent hospitals without demand sharing.
Proposition 1 shows that even if the HS has some idle capacity, the demand sharing may not be necessarily beneficial. For the demand sharing to be feasible, the HS’s idle capacity(service rate) must exceed a threshold, that is, μ 2 > μ 2 ̲ . The threshold μ 2 ̲ implies a condition as per which the HS’s revenue loss, as a result of lowering the price p 2 for its region, must be equal to its revenue gain, as a result of serving more patients from the HD’s region.
Given μ 2 > μ 2 ̲ , wherein the demand sharing is beneficial, we derive the optimal pricing strategy with the medical alliance. Intuitively, with more idle capacity, the HS will serve more patients who make the switch to increase total revenue. HD can at least share patient flow with an arrival rate of Λ 12 0 = Λ 1 λ 1 0 , which does not affect its optimal pricing strategy in Region-1. If HD shares a demand that is larger than Λ 12 0 , then the demand sharing may result in a new mismatch between demand and supply. Hence, whether to share a demand that is larger than Λ 12 0 would depend on the trade-off between the revenue loss caused by the new mismatch and the revenue gain from HS’s higher utilization. An extreme case would be if HS has infinite service rate, then it may be optimal for HD to share all of its demand. The following proposition provides an upper threshold for the HS service rate that can characterize the optimal strategies if the two hospitals cooperate and make an alliance.
Proposition 2.
There exists a threshold
μ 2 ¯ = Λ μ 1 + c 1 μ 1 V 1 + c 1 2 V 2 + c 1 2 4 V 2 2 + c 1 Λ 1 + c 2 Λ 2 c 1 μ 1 + c 1 c 1 μ 1 / V 1 V 2 .
If μ 2 ̲ < μ 2 μ 2 ¯ , then the HD would utilize its own optimal pricing strategy and share its remaining patients Λ 12 0 with the HS; additionally, the HS would serves all the patients from Region-2, that is, λ 2 * = Λ 2 and accept a part of the demand switching from the HD; which is given as:
λ 12 * = μ 2 Λ 2 c 1 μ 2 c 1 Λ 2 + c 2 Λ 2 V 2 .
The corresponding total optimal revenue is as follows:
π c * = V 1 μ 1 + V 2 μ 2 + 2 c 1 2 c 1 μ 1 V 1 2 V 2 ( c 1 μ 2 c 1 Λ 2 + c 2 Λ 2 ) .
Otherwise, that is, μ 2 ¯ < μ 2 , under the medical alliance, the HD will share at least Λ 12 0 with the HS and may deviate from its own optimal strategy; the HS will accept all patients shared by HD. Hence, all patients from both Region-1 and Region-2 will be served by the two hospitals.
Proposition 2 shows the condition, that is, μ 2 ̲ < μ 2 μ 2 ¯ , that even with demand sharing and medical alliance, the HD will still hold its optimal strategy and the two hospitals will be unable to serve all the patients in both the regions. On the other hand, if μ 2 ¯ < μ 2 , then the HS can serve more patients than HD’s remaining demand under its optimal strategy. In this case, the HD will not implement its own optimal strategy due to share more patients with the HS. Compared to the independent operations, HD will earn less revenue by serving its own region. However, this revenue loss will be lesser than the revenue gain as a result of HS’s higher utilization. In this case, the two hospitals can serve all patients from the two regions.
The following lemma characterizes the market shares of the two hospitals under the centralized operation when the HS capacity is sufficiently large.
Lemma 1.
Suppose that μ 2 ¯ < μ 2 , if there exists an equilibrium for the meidical alliance, then the corresponding equilibrium effective arrival rate of HD λ 1 * should be the solution to the equation
( V 1 V 2 ) ( μ 1 λ 1 * ) 2 ( μ 2 Λ + λ 1 * ) 2 + [ c 1 μ 2 c 1 Λ 2 + c 2 Λ 2 ] ( μ 1 λ 1 * ) 2 c 1 μ 1 ( μ 2 Λ + λ 1 * ) 2 = 0 ,
where Λ = Λ 1 + Λ 2 .If the two hospitals’ service quality is equal, that is, V 1 = V 2 , then there will be a unique equilibrium, and the demand shared by HD will be given by
λ 12 * = Λ 1 μ 1 ( μ 1 + μ 2 Λ ) c 1 μ 1 c 1 μ 1 ( c 2 Λ 2 + c 1 μ 2 c 1 Λ 2 ) c 2 Λ 2 + c 1 μ 2 c 1 Λ 2 c 1 μ 1 .
Equation (8) is the necessary condition for equilibrium, which is the first order condition of (4). When the service quality of the two hospitals become equal, they become different in waiting time and pricing for the patients in Region-1. Lemma 1 gives the optimal demand sharing strategy for the medical alliance when V 1 = V 2 . Here, we focus on the case of V 1 = V 2 , and discuss the case of different service quality later.
Let us use π c to denote the total revenue gain of the medical alliance. It is defined as the difference between the total revenue of the medical alliance and the sum of revenues of two independent hospitals, that is, π c = π c π 1 0 π 2 0 . We conduct a numerical study to illustrate the impact of the service rate of the HS, μ 2 , on the total revenue gain, when V 1 = V 2 , as shown in Figure 2. We observe that the revenue gain ratio curve can be divided into three segments. When μ 2 < μ 2 ̲ , there is no revenue gain. When μ 2 ̲ < μ 2 μ 2 ¯ , the revenue gain is increasing quickly in the service capacity. In this case, we can prove that the revenue gain is convex increasing in μ 2 . When μ 2 ¯ < μ 2 , the revenue gain is increasing at a slower rate in μ 2 .
Such a behavior can be explained as follows: when μ 2 μ 2 ¯ , two hospitals still cannot serve the total patients in both the regions. The total revenue gain, as μ 2 increases, is mainly due to serving more patients from the HD region. Therefore, the gain ratio will increase at an accelerated pace and the demand sharing will not change the HD’s optimal pricing strategy in its market. However, when μ 2 ¯ < μ 2 , the two hospitals can serve all the patients. An increase in the HS’s capacity will not result in an increase in the demand. Thus, the total revenue gain is mainly attributed to the improvement of workload balance between the two hospitals in medical alliance. This result is consistent with the monopoly case by [27], if we consider the two hospitals in medical alliance with demand sharing.

4.2. Revenue Allocation in the Medical Alliance

Although demand sharing can significantly increase the overall revenue of both hospitals, in the case of μ 2 > μ 2 ̲ , the collaboration can occur only when each hospital can earn more revenue individually when compared to the independent operation without demand sharing. Therefore, how to allocate the revenue gain between two hospitals in such a way that both hospitals have the incentive to collaborate is an important issue. This section shows that an optimal allocation can be performed by determining an appropriate commission fee.
We now use a two-player bargaining game to characterize the collaboration between HD and HS. Bargaining games have been extensively utilized to model the negotiation processes on prices between sellers and buyers, firm mergers, and acquisitions of small firms. This research area has been surveyed by [33]. Given that the negotiation over the commission fee for each switching patients involves HD and HS, we solve the bargaining game between the HD and the HS by utilizing the cooperative-game solution (also called the generalized Nash bargaining solution (NBS)) [34]. Our analysis framework can be applied to other types of bargaining solutions, such as the Kalai–Smorodinsky bargaining solution [35,36]. The cooperative-game solution can be obtained by solving the following problem:
max p 1 , p 2 , p 12 0 , s [ π 1 * ( p 1 , s ) π 1 0 ] α [ π 2 * ( p 2 , p 12 0 ) π 2 0 ) ] β s . t . π 1 * ( p 1 , s ) π 1 0 > 0 ; π 2 * ( p 2 , p 12 0 ) π 2 0 > 0 .
The disagreement payoffs for the HD and the HS are their revenues earned when they operate independently. Let π 1 * ( s ) and π 2 * ( p 12 0 , s ) denote the revenues of HD and HS, respectively, when they cooperate. The parameters α , β > 0 , ( α + β = 1 ) represent the bargaining power of the HD and the HS, respectively. The two constraints require that both hospitals can make more revenue with demand sharing than without it (or independent operations). The next lemma gives a method for determining the commission fee that facilitates demand sharing.
Lemma 2.
In the equilibrium, the two hospitals set their optimal prices as a centralized hospital. The optimal commission fee s * can be derived by solving
max s [ π 1 * ( p 1 * , s ) π 1 0 ] α [ π 2 * ( p 2 * , p 12 * s ) π 2 0 ] β s . t . π 1 * ( p 1 * , s ) π 1 0 > 0 ; π 2 * ( p 2 * , p 12 * s ) π 2 0 > 0 ,
where p 1 * , p 2 * , p 12 * are given in the proofs of the propositions and lemma in Section 4.1.
Subsequently, the revenue π 1 * , π 2 * and the optimal commission fee s * can be derived according to Proposition 2 and Lemma 1. For a certain range of the HS’s capacity, the optimal commission fee can be expressed explicitly as stated in the following proposition.
Proposition 3.
For μ 2 ̲ < μ 2 μ 2 ¯ , in equilibrium, the negotiated commission fee s * for each switching patient is independent of HD’s service capacity μ 1 and potential demand Λ 1 , which is given as
s * = α V 2 α + β [ 1 c 1 V 2 ( μ 2 Λ 2 ) + c 2 Λ 2 V 2 ( μ 2 Λ 2 ) 2 ] .
Additionally, the equilibrium commission fee s * decreases in c 1 , c 2 , Λ 2 , but increases in V 2 , μ 2 .
Under the condition of μ 2 ̲ < μ 2 μ 2 ¯ , the HD shares a part of patients with the HS, without experiencing any impact on its optimal pricing strategy for Region-1. Since the HS now accepts some extra patients from the HD, the expected waiting time becomes longer than the expected waiting time without demand sharing. This means that the HS must reduce its price for his original patients in Region-2. Hence, to compensate for this revenue loss of HS, the commission fee is less than a proportion of the co-payment of the switching patients, that is, s * < α p 12 * / ( α + β ) . In addition, we find that this policy of revenue allocation mainly depends on HS’s region characteristics, its service rate, and switching patients’ delay sensitivity. Although the result of additional idle HS capacity leading to higher total revenue gain and commission fee is intuitive, quantifying the HS capacity range and the optimal commission fee offers medical personnel valuable information.
We present a numerical example in Figure 3 to illustrate the impact of the parameters of HS, c 2 , Λ 2 , μ 2 , on the revenue gain due to demand sharing. Figure 3 shows the following: (1) the revenue gain can be significant (e.g., more than 20%) depending on the parameters (i.e., Λ 2 and μ 2 ); (2) the revenue gain is monotonous with respect to c 2 , Λ 2 , μ 2 , it is more sensitive to the demand level at the HS market.
Unlike the case of μ 2 ̲ < μ 2 μ 2 ¯ , wherein the HD can share its demand without affecting its optimal strategy, the case of μ 2 ¯ < μ 2 is more complicated. We can still get the equilibrium commission fee for this case with V 1 = V 2 . The non-equal service value case will be discussed later.
Lemma 3.
For V 1 = V 2 and μ 2 ¯ < μ 2 , in equilibrium, the negotiated commission fee s * for each switching patient is
s = α α + β [ V 2 + ( V 1 μ 1 c 1 ) 2 V 2 Λ 2 λ 12 * + c 2 Λ 2 ( μ 2 Λ 2 ) λ 12 * c 1 μ 2 Λ 2 λ 12 * + c 1 Λ 1 c 2 Λ 2 c 1 λ 12 * ( μ 2 Λ 2 λ 12 * ) λ 12 * ] ,
where λ 12 * is given in Lemma 1.
Unfortunately, although the closed-form of the equilibrium commission fee is available for the μ 2 ¯ < μ 2 case with the condition V 1 = V 2 , we cannot get the properties of Proposition 3 analytically. Thus, we conduct a numerical study to investigate the impact of the two regions’ parameters (i.e., c 1 , c 2 , Λ 1 , Λ 2 , μ 1 , μ 2 ) on the equilibrium commission fee and revenue gain. The total revenue gain is equal to ( V 1 c 1 / ( μ 1 Λ 1 + λ 12 * ) ) ( Λ 1 λ 12 * ) ( V 1 μ 1 c 1 ) 2 + s * λ 12 * , which is actually the revenue from commission s * λ 12 * minus the revenue loss in Region-1 π 1 0 ( V 1 c 1 / ( μ 1 Λ 1 + λ 12 * ) ) ( Λ 1 λ 12 * ) . The revenue loss is attributed to the fact that the HD shares more demand than its own optimal pricing strategy.
The impacts of all parameters, except for c 1 , are similar to the case μ 2 ̲ < μ 2 μ 2 ¯ . The total revenue gain, i.e., ( V 1 c 1 / ( μ 1 Λ 1 + λ 12 * ) ) ( Λ 1 λ 12 * ) ( V 1 μ 1 c 1 ) 2 + s * λ 12 * , is not necessarily monotonous with respect to the unit waiting cost c 1 . Figure 4 shows that the revenue from commission fee, that is s * λ 12 * , is decreasing in the delay sensitivity of patients in Region-1 c 1 . This is mainly because, with more delay sensitive patients, there is an increase in the contribution of the idle capacity of HS toward this alliance, which reduces HD’s revenue allocating from the medical alliance. However, in Region-1, the revenue loss, i.e., π 1 0 ( V 1 c 1 / ( μ 1 Λ 1 + λ 12 * ) ) ( Λ 1 λ 12 * ) , is also decreasing and concave in c 1 . The reason is that, with the medical alliance, the revenue from Region-1, i.e., ( V 1 c 1 / ( μ 1 Λ 1 + λ 12 * ) ) ( Λ 1 λ 12 * ) , is less sensitive to patients’ unit waiting cost when compared to the case without demand sharing, i.e., π 1 0 . The difference between the two revenues, that is π 1 0 ( V 1 c 1 / ( μ 1 Λ 1 + λ 12 * ) ) ( Λ 1 λ 12 * ) , decreases as patients become more delay sensitive. Finally, the total revenue gain, which is a combination of the trend of revenue from commission and revenue loss in Region-1, first increases and subsequently decreases in the delay sensitivity of patients in the Region-1. The total revenue of the alliance, which is equal to π 1 * ( α + β ) / α , has the same trend.
Subsequently, we consider the case wherein the service quality of the two hospitals are different, that is, V 1 < V 2 or V 1 > V 2 . Equation (8) is the equilibrium condition, which is the first order condition. It must be noted that closed-form solutions cannot be obtained since they are roots of a quadratic equation. We conduct a numerical study for the case with a unique equilibrium, as shown in Figure 5. We try to investigate the impact of the service quality on the commission fee, the rate of sharing patient flow, the revenue loss in Region-1, and the total revenue gain. Figure 5 shows that the total revenue gain and the demand sharing rate λ 12 are all decreasing in the HD’s service quality V 1 . This observation implies that the HD with a lower service quality has more incentives to share its demand with the HS, which means the HS can replace the HD to a greater extent. However, the commission fee is not necessarily monotonous with respect to V 1 . In fact, the commission fee is increasing in V 1 when V 1 < V 2 , and decreasing in V 1 when V 1 > V 2 (reaching the maximum at V 1 = V 2 ).

5. Conclusions

In this study, we have analyzed the benefit of demand sharing between an over-demanded hospital (HD) and an under-demanded hospital (HS). Both hospitals set their prices to maximize their revenues from serving delay-sensitive patients. We adopted a cooperative game theoretic framework to characterize the situation where the demand sharing is beneficial. We also obtain the commission fee, which guarantees that the medical alliance is stable.
We find that collaboration is not always beneficial even if HS has idle capacity. Demand sharing becomes beneficial for both HD and HS only when the service rate of HS is larger than the first threshold (lower one). This threshold depends on the HS’s rate of patient flow and the patients’ unit waiting cost.
Furthermore, if the service rate of HS is less than the second threshold (higher one), which depends on the rate of patient flow of both markets and the HD’s capacity, then the total revenue gain from demand sharing would be independent of the service rate and potential demand of the HD.
We also showed the effects of the two hospitals’ parameters on the revenue gains from demand sharing. Results show that the medical alliance can be more beneficial with less delay sensitive (or more patient) patients in the moderate service rate case (the HS’s service rate is less than the second threshold). However, if the HS’s service rate exceeds the second (higher) threshold, then the revenue gains may not be necessarily monotonic with respect to the unit waiting costs of both regions. These insights can help service hospitals to form and manage medical alliances.
Our study assumes that patients of each region are homogeneous. However, it would also be interesting to consider the heterogeneity of the patients in each market.

Funding

This research received no external funding.

Data Availability Statement

Not applicable.

Conflicts of Interest

The authors declare no conflict of interest.

Appendix A. Proof for Proposition 1, Proposition 2 and Lemma 1

According to the Theorem 1 of [29], facing two classes of patients, which are characterized by c 1 > c 2 , the optimal pricing and admission control policy for HS is that the lower delay cost enters first, followed by, possibly, part of the other class. It means that HS should first accept patients only from Market-2 and continue doing this until the class is captured; subsequently, if there is sufficient service capacity, then HS should accept patients from Market-1 until it captures the whole sharing demand from Market-1. HS uses different prices to control two streams of demand. However, if HS accepts two types of patients, all patients are faced with the same waiting time in the queue.
Proof. 
The optimal problem is to maximize the total revenues shown in Equation (4) under the equilibrium constraints of the patient behavior, which is defined in Equation (1). Before further analysis, let us discuss HS’s optimal problem, which is given as follows,
max p 2 , p 12 π 2 ( p 2 , p 12 ) = p 12 λ 12 + p 2 λ 2 .
According to Theorem 1 of [29], given the potential sharing demand rate Λ 12 , the optimal solution of the problem defined in Equation (A1) satisfies the following:
  • Suppose that μ 2 0 < μ 2 μ 2 ̲ , then the optimal pricing strategy is as follows:
    p 2 * = V 2 c 2 μ 2 Λ 2 , p 12 * > V 2 c 1 μ 2 Λ 2 .
    Additionally, the corresponding actual demand rates are as follows:
    λ 2 * = Λ 2 , λ 12 * = 0 .
  • Suppose that μ 2 ̲ < μ 2 μ 2 ¯ = Λ 2 + Λ 12 + c 1 2 V 2 + c 1 2 4 V 2 2 + c 2 Λ 2 + c 1 Λ 12 V 2 , then the optimal prices satisfy the following:
    p 2 * = V 2 c 2 V 2 c 1 μ 2 c 1 Λ 2 + c 2 Λ 2 , p 12 * = V 2 c 1 V 2 c 1 μ 2 c 1 Λ 2 + c 2 Λ 2 .
    Additionally, the corresponding actual demand rates are as follows:
    λ 2 * = Λ 2 , λ 12 * = μ 2 Λ 2 c 1 μ 2 c 1 Λ 2 + c 2 Λ 2 V 2 .
  • Suppose that μ 2 ¯ < μ 2 , then the optimal prices satisfy the following:
    p 2 * = V 2 c 2 μ 2 Λ 2 Λ 12 , p 12 * = V 2 c 1 μ 2 Λ 2 Λ 12 .
    Additionally, the corresponding actual demand rates are as follows:
    λ 2 * = Λ 2 , λ 12 * = Λ 12 .
Subsequently, let us analyze HD’s optimal problem, which is given as follows,
max p 1 π 1 ( p 1 ) = p 1 λ 1 .
We can obtain the optimal strategy of HD based on the monopolistic pricing results of [27], which is given as follows,
  • Suppose that Λ 1 μ 1 c 1 μ 1 V 1 , then the optimal pricing strategy is p 1 * = V 1 c 1 V 1 μ 1 . Additionally, the corresponding actual demand rate is λ 1 * = μ 1 c 1 μ 1 V 1 .
  • Suppose that Λ 1 < μ 1 c 1 μ 1 V 1 , then the optimal price is p 1 * = V 1 c 1 μ 1 Λ 1 . Additionally, the corresponding actual demand rate is λ 1 * = Λ 1 .
Here, we analyze the centralized optimal problem shown in Equation (4). Since the threshold μ 2 ̲ does not depend on the HD’s decision, and the optimal strategy of the HS is to capture the demand of Market-2 only when μ 2 0 < μ 2 μ 2 ̲ , the two hospitals are independent. Two hospitals independently operate as a monopolist. Hence, in this case, centralized operation will not result in a revenue gain.
However, if μ 2 > μ 2 ̲ , then HS can raise its revenue by continuing to accept a part of the sharing demand. Hence, we prove the Proposition 1.
In addition, we find that if μ 2 μ 2 ¯ , the real sharing demand accepted by HS would satisfy λ 12 * < Λ 12 . Hence, if Λ 12 Λ 1 μ 1 + c 1 μ 1 V 1 , which results in the condition μ 2 μ 2 ¯ , then the two hospitals can independently obtain their own optimal strategy. Hence, we get the first part of Proposition 2.
As the service capacity of the HS increases, that is, μ 2 ¯ < μ 2 , HS adopts the optimal strategy to capture both the streams of demand Λ 1 , Λ 12 . Hence, in the case μ 2 > μ 2 ¯ , no patient would balk from the two hospitals. The demand shared by HD will be at least Λ 12 0 = Λ 1 μ 1 + c 1 μ 1 V 1 . Hence, we prove the second part of Proposition 2.
Subsequently, let us prove Lemma 1. In this case, two hospitals cannot independently obtain their own optimal strategy anymore. The centralized operation must facilitate a trade-off between the marginal revenue of HD and HS. Subsequently, the optimal problem would change into
max p 2 , p 12 , p 1 π c ( p 1 , p 2 , p 12 ) = p 1 λ 1 + p 12 λ 12 + p 2 λ 2 , s . t . λ 1 + λ 12 = Λ 1 .
In this scenario, if we increase the potential demand rate of the switching patients Λ 12 , then the optimal revenue of HD would decrease, but the revenue of HS would increase. Subsequently, the optimal problem can be written as follows:
max p 2 , p 12 , p 1 π c ( p 1 , p 2 , p 12 ) = ( V 1 c 1 μ 1 λ 1 ) λ 1 + ( V 2 c 1 μ 2 Λ 2 Λ 12 ) ( Λ 1 λ 1 ) + ( V 2 c 2 μ 2 Λ 2 Λ 12 ) Λ 2 .
According to the first order condition of this problem, we have,
( V 1 V 2 ) ( μ 1 λ 1 ) 2 ( μ 2 Λ + λ 1 ) 2 + [ c 1 μ 2 c 1 Λ 2 + c 2 Λ 2 ] ( μ 1 λ 1 ) 2 c 1 μ 1 ( μ 2 Λ + λ 1 ) 2 = 0 .
Hence, if we assume V 1 = V 2 , then we will have
λ 12 * = Λ 1 μ 1 ( μ 1 + μ 2 Λ ) c 1 μ 1 c 1 μ 1 ( c 2 Λ 2 + c 1 μ 2 c 1 Λ 2 ) c 2 Λ 2 + c 1 μ 2 c 1 Λ 2 c 1 μ 1 .
Hence, we have the optimal strategy defined in Lemma 1. □

Appendix B. Proof for Lemma 2, Proposition 3 and Lemma 3

Proof. 
To determine the NBS, we solve the optimization problem defined in Equation (10). We first determine the optimal commission fee, s * , for the given pricing p 1 * , p 2 * , p 12 * . Subsequently, we solve for the optimal pricing. For the given p 1 * , p 2 * , p 12 * , it can be shown that Equation (10) is strictly concave in s, and hence the optimal commission fee s * is unique. To solve for s * , we first write the KKT conditions. Let ν 1 and ν 2 be the Lagrangian multipliers. Subsequently, the KKT conditions are as follows:
λ 12 [ p 2 λ 2 + p 12 λ 12 p 1 λ 1 2 s λ 12 + ( V μ 1 c 1 ) 2 Λ 2 ( V c 2 μ 2 Λ 2 ) + ν 1 ν 2 ] = 0 ; ν 1 [ π 1 * ( p 1 , s ) ( V μ 1 c 1 ) 2 ] = 0 ; ν 2 [ π 2 * ( p 2 , p 12 0 ) Λ 2 ( V c 2 μ 2 Λ 2 ) ] = 0 ; ν 1 , ν 2 0 .
From the KKT condition, we obtain
s * = p 2 λ 2 + p 12 λ 12 p 1 λ 1 + ( V μ 1 c 1 ) 2 Λ 2 ( V c 2 μ 2 Λ 2 ) 2 λ 12 .
To obtain the optimal pricing, we rewrite the Equation (10) by utilizing Equation (A3):
max p 1 , p 2 , p 12 [ p 1 λ 1 + p 2 λ 2 + p 12 λ 12 ( V μ 1 c 1 ) 2 Λ 2 ( V c 2 μ 2 Λ 2 ) 2 ] 2 ,
which is equivalent to the optimization problem defined in Equation (4). Hence, we have Lemma 2.
Suppose that μ 2 ̲ < μ 2 μ 2 ¯ , according to Proposition 2, the optimal problem defined in Equation (10) can be rewritten as follows:
max s ( s λ 12 * ) α [ p 2 * Λ 2 + ( p 12 * s ) λ 12 * Λ 2 ( V 2 c 2 μ 2 Λ 2 ) ] β
Given the first order condition, we have the following:
s = α α + β p 12 * + α [ p 2 * Λ 2 V 2 Λ 2 + c 2 Λ 2 / ( μ 2 Λ 2 ) ] ( α + β ) λ 12 * = α α + β [ V 2 c 1 w * c 2 Λ 2 w * μ 2 Λ 2 ] .
where the optimal waiting time is given as follows:
w * = 1 μ 2 Λ 2 λ 12 * = V 2 c 1 ( μ 2 Λ 2 ) + c 2 Λ 2
Hence, in this case, the equilibrium commission fee is
s * = α V 2 α + β [ 1 c 1 V 2 ( μ 2 Λ 2 ) + c 2 Λ 2 V 2 ( μ 2 Λ 2 ) 2 ] .
With the above commission given and optimal prices given in Proposition 2, the corresponding gains of optimal revenues from demand sharing can be calculated.
Suppose that μ 2 ¯ < μ 2 , the optimal problem defined in Equation (10) can be rewritten as follows:
max s [ p 1 * λ 1 * + s λ 12 * ( V 2 μ 1 c 1 ) 2 ] α [ p 2 * Λ 2 + ( p 12 * s ) λ 12 * Λ 2 ( V 2 c 2 μ 2 Λ 2 ) ] β
Given the first order condition, we have the following:
s = α α + β p 12 * + α [ p 2 * Λ 2 p 1 * λ 1 * + ( V 1 μ 1 c 1 ) 2 V 2 Λ 2 + c 2 Λ 2 / ( μ 2 Λ 2 ) ] ( α + β ) λ 12 * ,
which is equivalent to
s = α α + β [ V 2 + ( V 1 μ 1 c 1 ) 2 V 2 Λ 2 + c 2 Λ 2 / ( μ 2 Λ 2 ) λ 12 * c 1 μ 2 Λ 2 λ 12 * + c 1 Λ 1 c 2 Λ 2 c 1 λ 12 * ( μ 2 Λ 2 λ 12 * ) λ 12 * ] .

References

  1. Allen, D. Telemedicine Expanded to Rural China: Across the Divide. Available online: https://emag.medicalexpo.com/telemedicine-expanded-to-rural-china-across-the-divide/ (accessed on 6 October 2022).
  2. Adi, L.; Yuval, W.; Carroll, J.S.; Paul, B.; dayan Yaron, B. Waiting time is a major predictor of patient satisfaction in a primary military clinic. Mil. Med. 2002, 167, 842. [Google Scholar]
  3. Grossman, M. On the Concept of Health Capital and the Demand for Health. J. Political Econ. 1972, 80, 223–255. [Google Scholar] [CrossRef] [Green Version]
  4. Song, H.; Zuo, X.; Cui, C.; Meng, K. The willingness of patients to make the first visit to primary care institutions and its influencing factors in Beijing medical alliances: A comparative study of Beijing’s medical resource-rich and scarce regions. BMC Health Serv. Res. 2019, 19, 361. [Google Scholar] [CrossRef] [PubMed] [Green Version]
  5. Wang, M.; Lu, Y.; Huang, X. Comparative Study on Medical Cost of Local and Nonlocal Patients in 4 Third Grade First Class Hospitals in Nanjing City. Med. Soc. 2019, 32, 56–59. [Google Scholar]
  6. Xie, F.; Wang, Y.; Zhang, Q.; Chen, Z.; Gu, S.; Guan, W.; Li, C.; Li, T.; Li, X.; Luo, L.; et al. Development of mental health alliances in China (2017 Edition). J. Hosp. Manag. Health Policy 2018, 2, 37. [Google Scholar] [CrossRef]
  7. Wang, X. Medical Alliance Launched to Aid Rural Patients. Available online: http://www.chinadaily.com.cn/china/2016-07/27/content_26240288.htm (accessed on 27 July 2016).
  8. Yang, F.; Yang, Y.; Liao, Z. Evaluation and analysis for Chinese Medical Alliance’s governance structure modes based on Preker-Harding Model. Int. J. Integr. Care 2020, 20, 14. [Google Scholar] [CrossRef]
  9. Li, L.; Zhang, R.Q. Cooperation through capacity sharing between competing forwarders. Transp. Res. Part E Logist. Transp. Rev. 2015, 75, 115–131. [Google Scholar] [CrossRef]
  10. Chen, Y.; Zhou, W.; Hua, Z.; Shan, M. Pricing and capacity planning of the referral system with delay-sensitive patients. J. Manag. Sci. China 2015, 18, 73–83. [Google Scholar]
  11. Anily, S.; Haviv, M. Cooperation in Service Systems. Oper. Res. 2010, 58, 660–673. [Google Scholar] [CrossRef] [Green Version]
  12. Yu, Y.; Benjaafar, S.; Gerchak, Y. Capacity Sharing and Cost Allocation among Independent Firms with Congestion. Prod. Oper. Manag. 2015, 24, 1285–1310. [Google Scholar] [CrossRef]
  13. Zeng, Y.; Zhang, L.; Cai, X.; Li, J. Cost Sharing for Capacity Transfer in Cooperating Queueing Systems. Prod. Oper. Manag. 2018, 27, 644–662. [Google Scholar] [CrossRef]
  14. Anily, S.; Haviv, M. Line Balancing in Parallel M/M/1 Lines and Loss Systems as Cooperative Games. Prod. Oper. Manag. 2017, 26, 1568–1584. [Google Scholar] [CrossRef]
  15. Zhou, Y.P.; Ren, Z.J.; Cochran, J.J.; Cox, L.A.; Keskinocak, P.; Kharoufeh, J.P.; Smith, J.C. Service Outsourcing. In Wiley Encyclopedia of Operations Research and Management Science; John Wiley & Sons, Inc.: Hoboken, NJ, USA, 2010. [Google Scholar]
  16. Aksin, O.Z.; de Vericourt, F.; Karaesmen, F. Call Center Outsourcing Contract Analysis and Choice. Manag. Sci. 2008, 54, 354–368. [Google Scholar] [CrossRef]
  17. Lee, H.H.; Pinker, E.J.; Shumsky, R.A. Outsourcing a Two-Level Service Process. Manag. Sci. 2012, 58, 1569–1584. [Google Scholar] [CrossRef] [Green Version]
  18. Guo, L.; Wu, X. Capacity Sharing between Competitors. Manag. Sci. 2018, 64, 3554–3573. [Google Scholar] [CrossRef] [Green Version]
  19. Cetinkaya, E.; Ahn, H.S.; Duenyas, I. Benefits of Collaboration in Capacity Investment and Allocation. Available online: http://dx.doi.org/10.2139/ssrn.2169490 (accessed on 16 September 2012).
  20. Tang, C.S.; Bai, J.; So, K.C.; Chen, X.M.; Wang, H. Coordinating Supply and Demand on an on-Demand Platform: Price, Wage, and Payout Ratio. Available online: https://ssrn.com/abstract=2831794 (accessed on 20 December 2017).
  21. Taylor, T. On-Demand Service Platforms. Manuf. Serv. Oper. Manag. 2018, 20, 704–720. [Google Scholar] [CrossRef] [Green Version]
  22. Naor, P. The Regulation of Queue Size by Levying Tolls. Econometrica 1969, 37, 15–24. [Google Scholar] [CrossRef]
  23. Levhari, D.; Luski, I. Duopoly pricing and waiting lines. Eur. Econ. Rev. 1978, 11, 17–35. [Google Scholar] [CrossRef]
  24. Hassin, R. Rational Queueing; CRC Press: Boca Raton, FL, USA, 2016. [Google Scholar]
  25. Hassin, R.; Haviv, M. To Queue or Not to Queue: Equilibrium Behavior in Queueing Systems; Springer Science & Business Media: Berlin/Heidelberg, Germany, 2003; Volume 59. [Google Scholar]
  26. Ghosh, S.; Hassin, R. Inefficiency in stochastic queueing systems with strategic customers. Eur. J. Oper. Res. 2021, 295, 1–11. [Google Scholar] [CrossRef]
  27. Chen, H.; Frank, M. Monopoly pricing when customers queue. IIE Trans. 2004, 36, 569–581. [Google Scholar] [CrossRef]
  28. Chen, H.; Wan, Y.W. Price Competition of Make-to-Order Firms. IIE Trans. 2003, 35, 817–832. [Google Scholar] [CrossRef]
  29. Printezis, A.; Burnetas, A. The effect of discounts on optimal pricing under limited capacity. Int. J. Oper. Res. 2011, 10, 160. [Google Scholar] [CrossRef]
  30. Suk, T.; Wang, X. Optimal pricing policies for tandem queues: Asymptotic optimality. IISE Trans. 2020, 53, 199–220. [Google Scholar] [CrossRef]
  31. Canadian Institute for Health Information. Wait Times for Priority Procedures in Canada. Available online: https://www.cihi.ca/en/wait-times-for-priority-procedures-in-canada (accessed on 25 November 2022).
  32. Hospital Authority. Elective Cataract Surgery. Available online: https://www.ha.org.hk/visitor/ha_visitor_text_index.asp?Parent_ID=214172&Content_ID=214184 (accessed on 30 September 2022).
  33. Nagarajan, M.; Sošić, G. Game-theoretic analysis of cooperation among supply chain agents: Review and extensions. Eur. J. Oper. Res. 2008, 187, 719–745. [Google Scholar] [CrossRef]
  34. Muthoo, A. Bargaining Theory with Applications; Cambridge University Press: Cambridg, UK, 1999. [Google Scholar]
  35. Myerson, R.B. Game Theory: Analysis of Conflict; Harvard University Press: Cambridge, MA, USA, 1991. [Google Scholar]
  36. Roth, A.E. Axiomatic Models of Bargaining; Springer Science & Business Media: Berlin/Heidelberg, Germany, 2012; Volume 170. [Google Scholar]
Figure 1. Graphic representation of the system configuration.
Applsci 12 12121 g001
Figure 2. Total revenue gain ratio is increasing in μ 2 . ( V 1 = V 2 = 2.5 , c 1 = 2 , μ 1 = 10 , Λ 1 = 12 , c 2 = 0.5 , Λ 2 = 3 , α = β = 0.5 ). Total revenue gain ratio: π c / ( π 1 0 + π 2 0 ) .
Applsci 12 12121 g002
Figure 3. Revenue gain of the collaboration when μ 2 ̲ < μ 2 μ 2 ¯ . ( V = 2.5 , c 1 = 1 , μ 1 = 10 , Λ 1 = 12 , α = β = 0.5 , Revenue gain ratio: π = ( π 1 + π 2 ) / ( π 1 0 + π 2 0 ) )
Applsci 12 12121 g003
Figure 4. The impact of c 1 when μ 2 ¯ < μ 2 . Total revenue gain: π 1 * π 1 0 . Revenue from commission: s * λ 12 * . ( α = β = 0.5 , V 1 = V 2 = 2.5 , c 2 = 0.5 , μ 1 = 10 , μ 2 = 15 , Λ 2 = 3 , Λ 1 = 12 .)
Applsci 12 12121 g004
Figure 5. The impact of V 1 when μ 2 ¯ < μ 2 . Total revenue gain: π 1 * π 1 0 . Revenue from commission: s * λ 12 * . ( α = β = 0.5 , V 2 = 2.5 , c 1 = 1 , c 2 = 0.5 , μ 1 = 10 , μ 2 = 15 , Λ 2 = 3 , Λ 1 = 12 .)
Applsci 12 12121 g005
Publisher’s Note: MDPI stays neutral with regard to jurisdictional claims in published maps and institutional affiliations.

