Article

Variation Characteristics of the Wind Field in a Typical Thunderstorm Event in Beijing

1
School of Civil and Transportation Engineering, Beijing University of Civil Engineering and Architecture, Beijing 100044, China
2
Central Research Institute of Building and Construction Co., Ltd., MCC, Beijing 100088, China
3
School of Civil Engineering, Beijing Jiaotong University, No. 3 Shangyuancun, Haidian District, Beijing 100044, China
*
Author to whom correspondence should be addressed.
Appl. Sci. 2022, 12(23), 12036; https://doi.org/10.3390/app122312036
Submission received: 25 October 2022 / Revised: 21 November 2022 / Accepted: 23 November 2022 / Published: 24 November 2022
(This article belongs to the Special Issue Structural Wind Engineering)

Abstract

:
The understanding of wind field characteristics during thunderstorms is key to structural design for resistance to thunderstorms. In this paper, the directional thunderstorm wind model is adopted to analyze the characteristics of vertical variations of the wind field in a typical thunderstorm event in the Beijing urban area, based on the measured data. First, the longitudinal and lateral fluctuating wind speed components were decoupled and the change of direction was obtained. Then, variation of the wind speed, wind direction, turbulence intensity, turbulence integral length scale, and gust factor with the height and time were studied. The measured thunderstorm wind spectrum and the coherence function of horizontal longitudinal reduced turbulent fluctuations were analyzed and compared with empirical models. The results showed that the wind speed profile presented an obvious “nose shape” near the peak wind speed. The longitudinal turbulence integral scale was larger than the lateral one. The Von Karman spectrum is relatively effective in fitting the thunderstorm wind spectrum. Compared with synoptic winds, the gust factor during the pass of thunderstorm wind is larger, so it seems necessary to consider the influence of thunderstorm wind in engineering design.

1. Introduction

The wind field of thunderstorms differs greatly from the wind field of the atmospheric boundary layer [1,2,3]. Studies have found that thunderstorms present a “nose shape” wind speed profile, a low average wind speed and a high peak gust wind speed. It is a short, local, strong wind with strong destructive power, which can seriously threaten the safety of power transmission towers, large-span roof structures, fans, etc. [456]. However, the current Chinese load code only considers synoptic strong winds, while extreme winds such as thunderstorms are not taken into account. This can lead to reduced reliability of structural wind resistance design. Therefore, it is of great significance to study the characteristics of thunderstorm wind fields and the corresponding structural wind load, and a basis for the thunderstorm-resistant design of structures can be provided [7].
At present, four methods are mainly used to study the characteristics of thunderstorm wind fields: wind tunnel tests, numerical simulations, empirical models, and field measurements. Among them, field measurement is the most direct and reliable method to explore wind field characteristics [8,9,10]. However, a small amount of measured data can be detected, because thunderstorms usually occur randomly, with regional characteristics, suddenness, and short duration. Thus, the development of related research is hindered [11].
Although few data are available, some scholars have conducted pilot studies related to the characteristics and models of thunderstorm wind fields. The most famous thunderstorm wind record was obtained in 1983 by Fujita [12] at Andrews AFB in the United States, in which the peak wind speed reached 67 m/s. Subsequently, field measurement projects, hosted by Nanyang Technological University in Singapore [13], Texas Tech University in the United States [14] and the University of Genoa in Italy [15], were implemented, and certain thunderstorm wind data were recorded and studied. Holmes and Oliver [16] proposed an empirical model of thunderstorm wind based on the results of the Andrews thunderstorm by assuming that thunderstorm wind speed is the vector sum of moving velocity and the radial wind generated by the collision between downdraft and ground. Choi and Hidayat [17] proposed that the thunderstorm horizontal wind speed was modeled as the sum of time-varying average wind speed and a zero-mean stationary random fluctuating wind speed, based on the measured data in Singapore. Chen and Letchford [18] considered the thunderstorm horizontal wind speed as the superposition of time-varying mean wind speeds and a uniformly modulated nonstationary random process, in which the time-varying mean wind speed profile could be expressed as the product of a spatially dependent time-invariant profile function and a time-varying function. This model is widely recognized by scholars, and based on it, some research has been carried out [8,19].
However, this classical model is based on the horizontal synthetic wind speed. The time-varying characteristics of wind direction are neglected, which leads to the implicit assumption that thunderstorm wind-induced response results are generated along the downwind direction. Obviously, this method is not consistent with the traditional analysis method for synoptic wind, and the comparison results of the two wind field characteristics in the past are controversial. In addition, based on the classical wind field model without considering wind direction, it is difficult to explore the change of wind direction, caused by the movement of thunderstorm wind, as well as the change of background wind. Therefore, the wind field model of thunderstorm wind needs to be optimized urgently. Moreover, there are few results that can be detected by multiple instruments and used to reconstruct the wind field. Most of the measured values are captured by a single instrument. As noted earlier, thunderstorm winds have strong local characteristics. Due to the influence of special terrain and urban thermal circulation, thunderstorms occur frequently in Beijing. The annual number of thunderstorm days is about 36.3, and high extreme wind speed is often related to thunderstorms [20]. At present, field measurement studies on the characteristics of thunderstorm wind fields in Beijing are few, and this should be urgently increased.
There is a unique opportunity to explore the wind field characteristics in Beijing, because multiple ultrasonic anemometers at nine different heights from 8 m to 280 m on the Beijing meteorological tower can be used. In this paper, the vertical variation properties of wind field in a detected typical thunderstorm event are studied, based on a directional thunderstorm wind model proposed in previous research [5]. A quantitative analysis of thunderstorm wind direction is carried out, which enables the study of thunderstorm wind and synoptic wind together, providing a foundation for the analysis of along and cross wind dynamic responses of structures in the face of thunderstorm wind. Accordingly, the variation of time-varying wind speed, the change of wind direction, and the characteristics of longitudinal and lateral fluctuating wind with time and height are explored in detail. Some of the results are compared with those of the thunderstorms in the Northern Tyrrhenian based on LiDAR data [21]. Furthermore, the coherence function of thunderstorm wind records at different heights are investigated. These provide a basis for establishing the wind field model of thunderstorm wind and the wind load of building structures under its action.

2. Modeling Approach

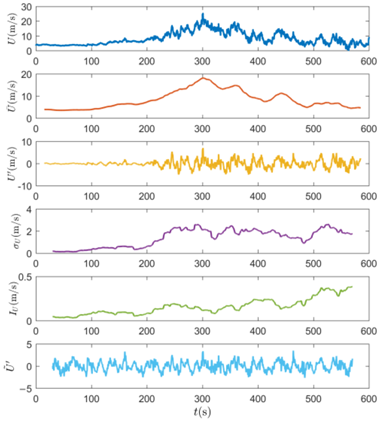
2.1. Classical Thunderstorm Wind Model

In the classical thunderstorm wind model, the horizontal wind speed of thunderstorm wind is composed of the time-varying mean wind and a uniformly modulated nonstationary random process. As shown in Equation (1), the horizontal resultant wind speed U is expressed as the sum of the slowly-varying mean wind speed and the residual fluctuation. The extraction of U ¯ from U may be carried out by wavelet and Hilbert transforms, empirical mode decomposition [18,22,23,24] or, more classically as in this paper, by a moving average filter or running mean [17,19]. There is a wide body of literature on the most suitable choice of the moving average period T: by a moving average filter with a period of 30 s [25]. It is worth noting that the turbulence intensity for thunderstorm events is generally smaller than the classical one for synoptic winds, due to the removal of low-frequency harmonic turbulence components related to the moving average operation [1,5]. The residual turbulent fluctuations can be further expressed as the product of the slowly-varying standard deviation and the reduced turbulent fluctuation. In the modelling process, the reduced turbulent fluctuation is usually taken as a stationary Gaussian random process with zero mean and unit standard deviation.
U t = U ¯ t + U t = U ¯ t + σ U t U ˜ t  
By introducing the turbulence intensity I U t = σ U t / U ¯ t into Equation (1), the wind speed model can be obtained as shown below:
U t = U ¯ t 1 + I U t U ˜ t
The gust factor is:
G U = U ^ / U ¯ max
where U ^ is the 1-s peak wind speed [1], and U ¯ max is the maximum value of the slowly varying mean wind speed U ¯ .
Figure 1 shows the decomposition results of thunderstorm wind speed signal at the height of 64 m, based on the classical decomposition model. The maximum value of slowly-varying mean wind speed U ¯ is 18.14 m/s. The mean value of slowly-varying turbulence intensity is I ¯ U =   0.159. As noted earlier, the relatively important parameter of wind direction is not considered quantitatively in the classical wind velocity modeling method, so it is impossible to achieve the information decomposition of the longitudinal and lateral fluctuation wind speed. Therefore, optimization needs to be conducted.

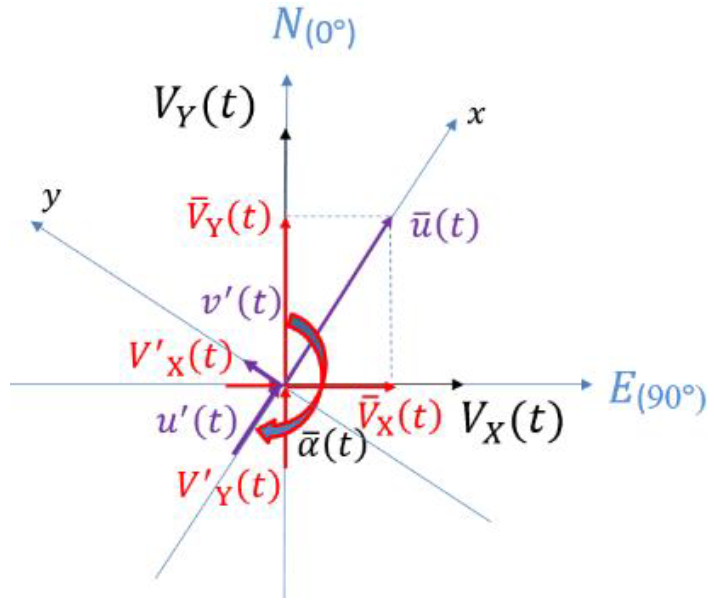
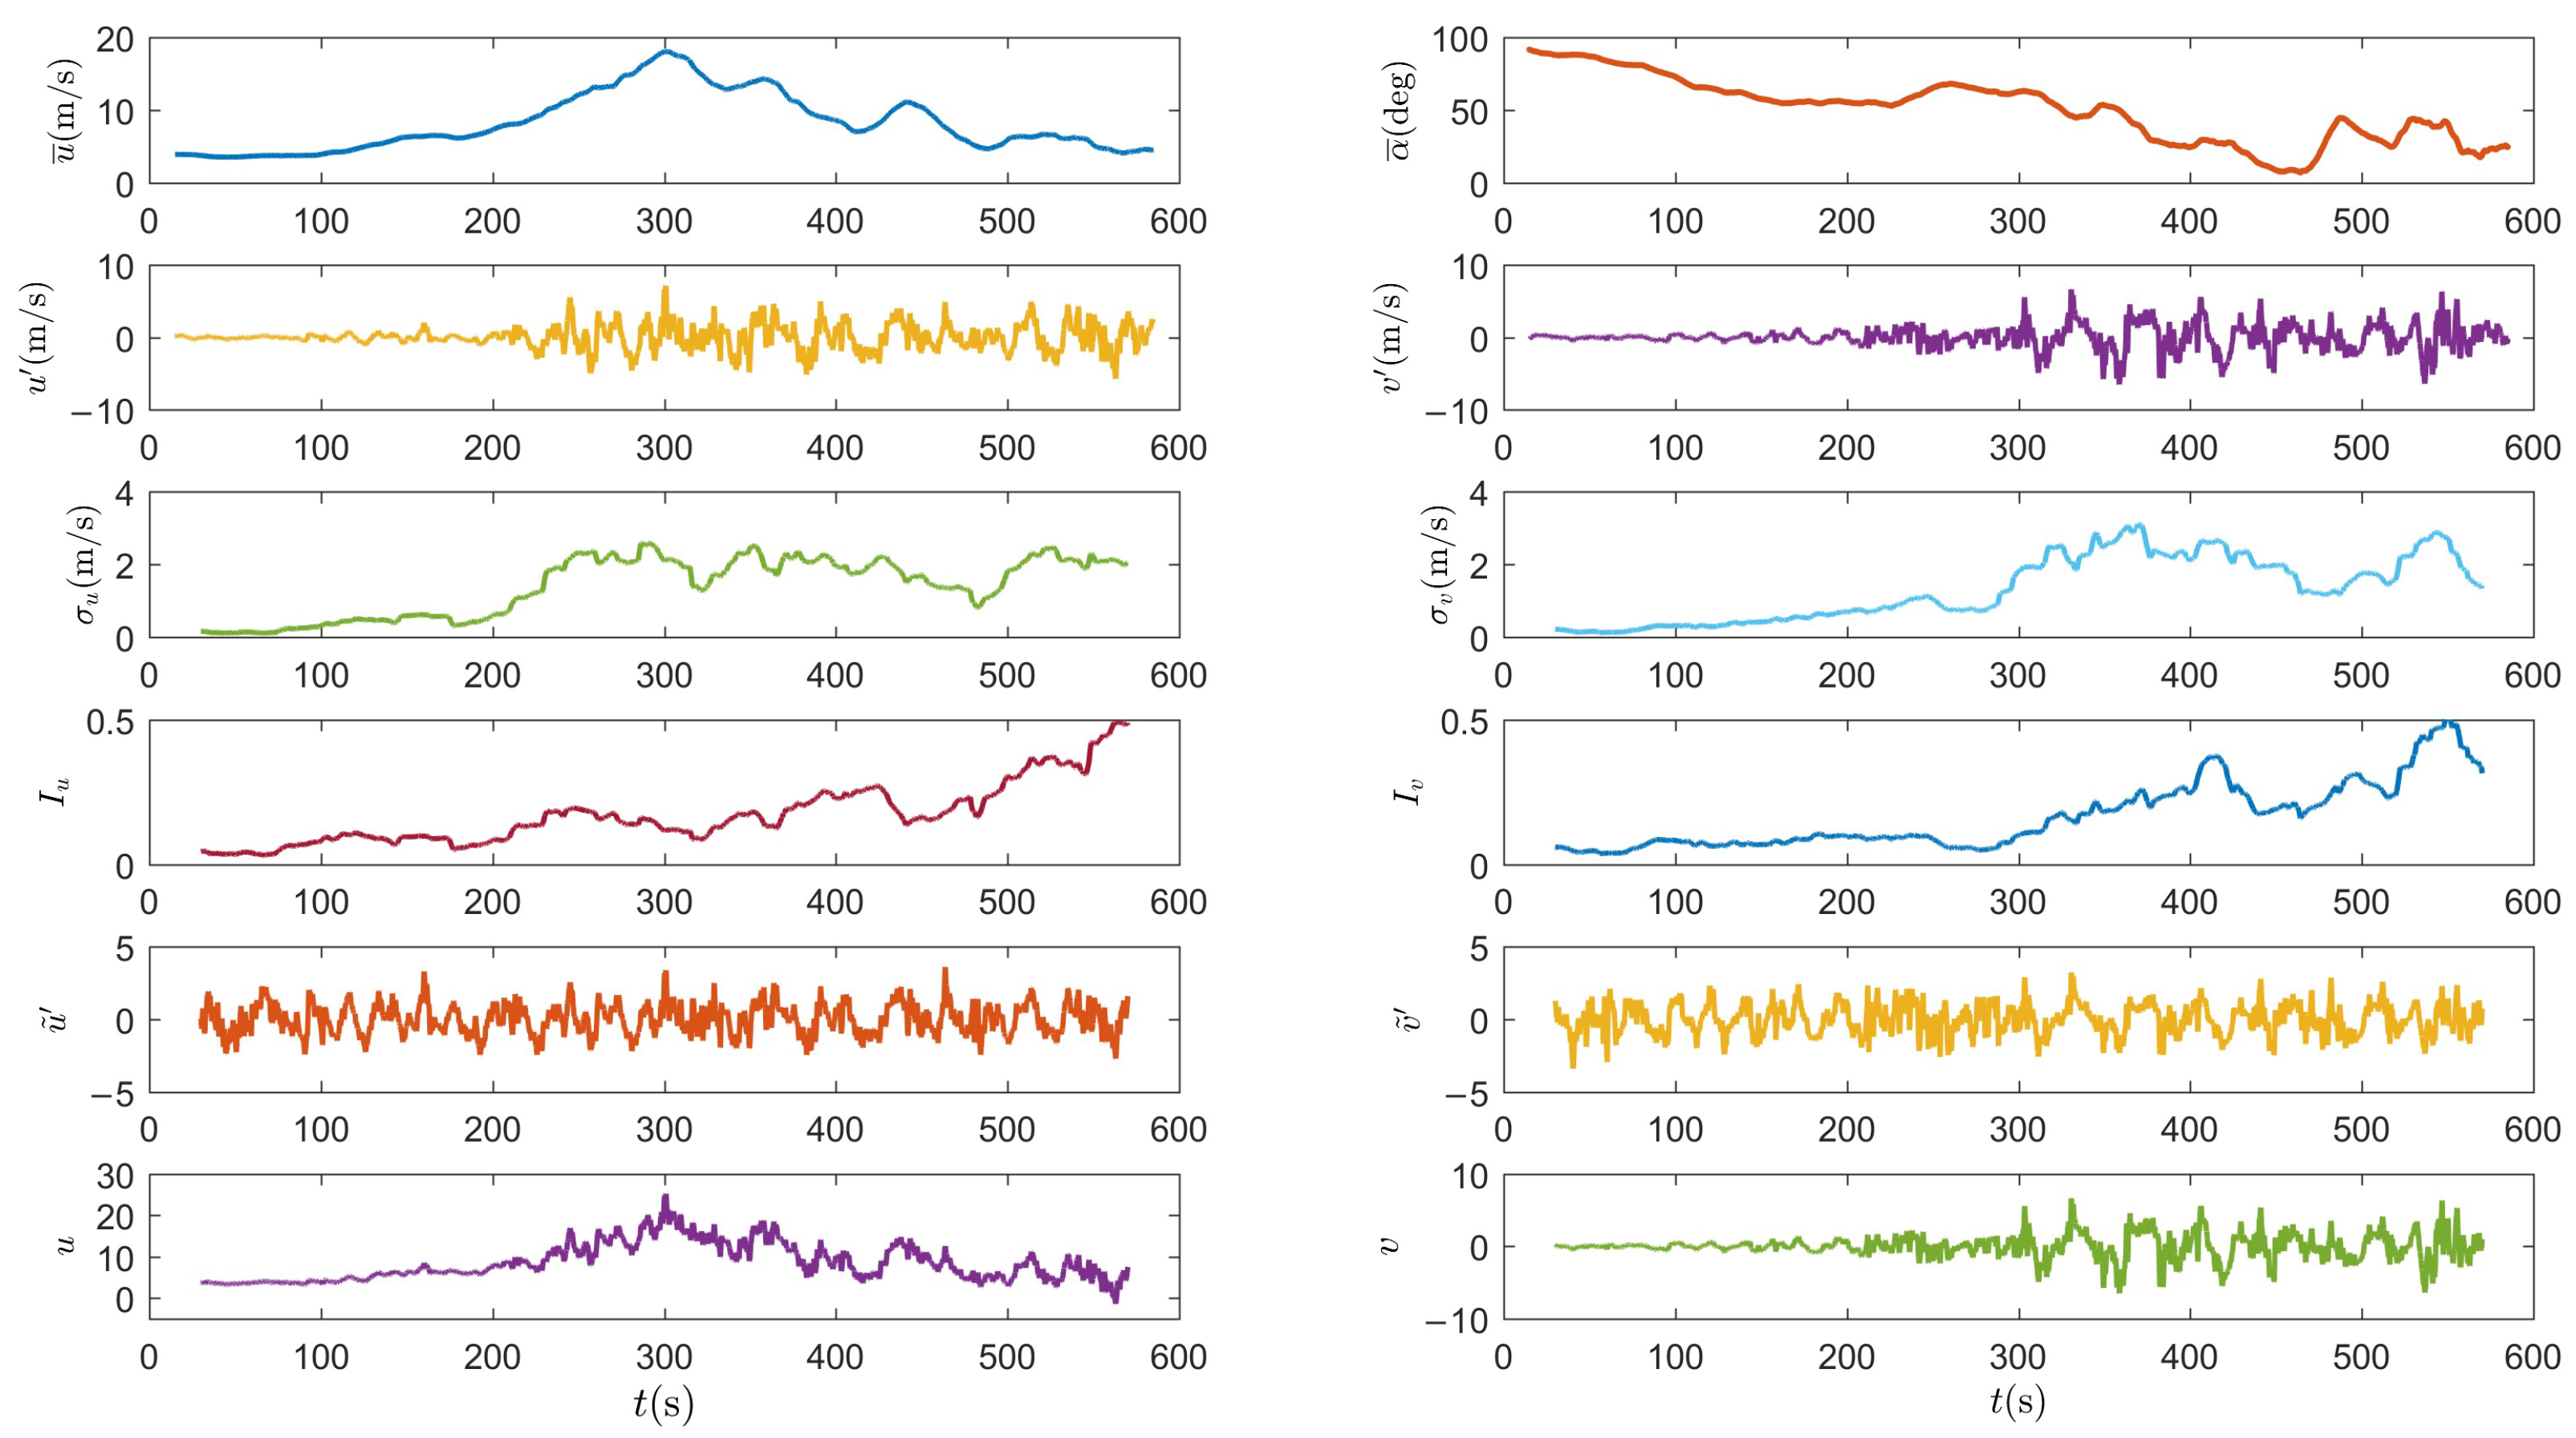
2.2. Directional Thunderstorm Wind Model

In order to overcome the shortcomings of the aforementioned classical method, a directional thunderstorm wind model was established [5]. First, the two horizontal components of wind speed were expressed as:
V X t = V ¯ X t + V X t V Y t = V ¯ Y t + V Y t
in which V ¯ X and V ¯ Y are the slowly-varying mean wind speed in different wind directions, and V X and V Y are residual turbulent fluctuations. The slowly-varying longitudinal mean wind speed u ¯ and its direction α ¯ can be obtained by:
u ¯ t = V ¯ X 2 t + V ¯ Y 2 t α ¯ t = 270 atan 2 V ¯ Y t / V ¯ X t
As shown in Figure 2, the angle range of α ¯ (t) is 0° to 360°, while V X t and V Y t can be projected to the direction of u ¯ t and its perpendicular direction. Accordingly, the following equation can be generated:
u t = V X t sin α ¯ t V Y t cos α ¯ t v t = V X t cos α ¯ t V Y t sin α ¯ t
in which u t and v t are the longitudinal and lateral fluctuating wind speed components, respectively. Similar to the classical method, u t and v t can be simulated as the product of standard deviation and the reduced turbulent fluctuation with stationary Gaussian characteristics:
u t = σ u t u ˜ t v t = σ v t v ˜ t
Therefore, the longitudinal and lateral wind speed can be expressed as follows:
u t = u ¯ + u t = u ¯ 1 + I u t u ˜ t v t = v t = u ¯ I v t v ˜ t
where the slowly-varying longitudinal and lateral turbulence intensity are:
I u t = σ u t / u ¯ I v t = σ v t / u ¯
In addition, the gust factor is:
G u = u ^ / u ¯ max
where u ^ is the longitudinal peak wind speed, defined as the maximum value of longitudinal average wind speed within a period of 1 s, and u ¯ max is the maximum value of the slowly varying mean wind speed u ¯ .
Figure 3 shows the decomposition result of the thunderstorm wind speed signal at a height of 64 m based on the directional thunderstorm wind model by a moving average filter with a period of 30 s. The maximum value of slowly-varying mean wind speeds u ¯ max is 18.06 m/s, which is slightly different from U ¯ max . The mean values of the longitudinal and lateral slowly-varying turbulence intensity are I ¯ u   = 0.167 and I ¯ v   = 0.165, respectively, and the ratio I ¯ v   / I ¯ u   = 0.98 is greater than the reference value of 0.75 specified in the load code. The cross-correlation between the longitudinal and lateral wind speeds obtained by the decomposition model is 0.021, which means that the wind speeds in two directions are uncorrelated. Thus, the directional thunderstorm wind model is effective.

3. Measurement of Thunderstorm Winds

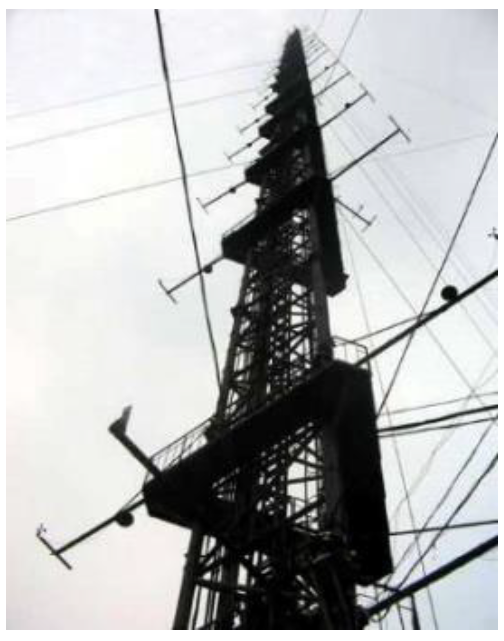
3.1. Field Measurement

As shown in Figure 4, a 325-m-high cable-stayed meteorological tower with an equilateral triangle section was utilized [26]. It is located in the north of Beijing between the Third Ring Road and the Fourth Ring Road. The surrounding site can be regarded as class C land form according to the National Load Code of China (GB50009-2012) [27]. The meteorological tower is equipped with multiple mechanical anemometers and ultrasonic anemometers at different heights. Therefore, it was considered the best observation station for exploring the urban boundary layer and urban strong storms in Beijing.
For the purposes of this paper, high-precision measured data were mainly used, obtained by nine ultrasonic anemometers with a sampling frequency of 10 Hz. The ultrasonic anemometers were tri-axial, and installed at different heights, ranging from 8 m to 20 m, on the north side of the meteorological tower. Thus, three instantaneous wind speed components, V x   V y and V z , could be acquired. Their positive directions were defined as south to north, east to west, and directed upwards, respectively. Before further analysis, the statistical data obtained from the ultrasonic anemometers were calculated and compared with those obtained from the mechanical anemometers on the tower, so that the accuracy of the data could be verified.

3.2. Typical Event

In order to study the vertical variation properties of the thunderstorm wind field with time, a typical case was chosen, and this was a thunderstorm event observed on 8 June 2014 by the Beijing 325-m-high meteorological tower. Table 1 illustrates the 1 s peak wind speed of the resultant horizontal wind speed (classical method) and longitudinal wind speed (directional method). It can be observed that the 1 s gust wind speed of longitudinal wind speeds obtained by the directional model was slightly smaller than that of the resultant horizontal wind speed obtained by the classical method. The 1 s gust wind speeds of thunderstorms detected at all heights were high, while the values did not increase monotonically with the increase in height. The maximum value appeared at the height of 64 m, which is consistent with the unique vertical distribution characteristics of thunderstorm wind speed [28,29].
Figure 5 shows the 1 h wind speed (blue) and wind direction (red) time histories recorded by the ultrasonic anemometers at 16 m (a) and 64 m (b), respectively. As shown in the figure, when the thunderstorm occurred, there was a rapid and strong jump in terms of wind speed, and the wind direction changed about 180°. In addition, according to the temperature record, the temperature dropped by about 10 °C with the sudden change of wind speed, which is consistent with the typical weather feature of thunderstorm wind.
Figure 6 shows the 1 h vertical wind speed (blue) and wind attack angle (red) time history curves recorded by the ultrasonic anemometer at 16 m (a) and 64 m (b), respectively, in which wind attack angle is the angle between the wind flow and the vertical line and the positive direction is directed upwards. It can be observed that the vertical wind speed increased when the peak of the thunderstorm gust wind speeds was reached. At both 16 m and 64 m, when the instantaneous wind speed began to increase at the initial stage of the thunderstorm, the wind attack angle diminished almost to 0. Then, the wind attack angle increased and appeared to be oscillating strongly, indeed more at 16 m than at 64 m. After the jump of the wind speed, the vertical wind speed decreased at the height of 16 m, while it continued to increase at the height of 64 m. On the whole, the meteorological tower was not in the core area of the downdraft of the thunderstorm wind. This may be because of the movement of the thunderstorm downburst along the northwest after the occurrence. During the movement, the scattered outflow vortices passed through the weather tower.
According to the upper air map and sounding data of the day, the severe convective weather was mainly caused by the northeast cold vortex, and the weather was supposed to be a thunderstorm gale of the northwest flow type. From 8:00 to 14:00, the convective effective potential energy increased from 0 to 954.8 J/kg, and the wind shear at the lower level was moderately strong vertical, reaching 3.1 × 10⁻³ s−1 between 0 and 2 km. The wind index reached 28 m/s, the temperature difference between 500 and 850 hPa was 32 °C, and the temperature decline rate was 0.8 °C/hm, presenting the typical weather features of thunderstorm wind [30].

4. Wind Field Characteristics

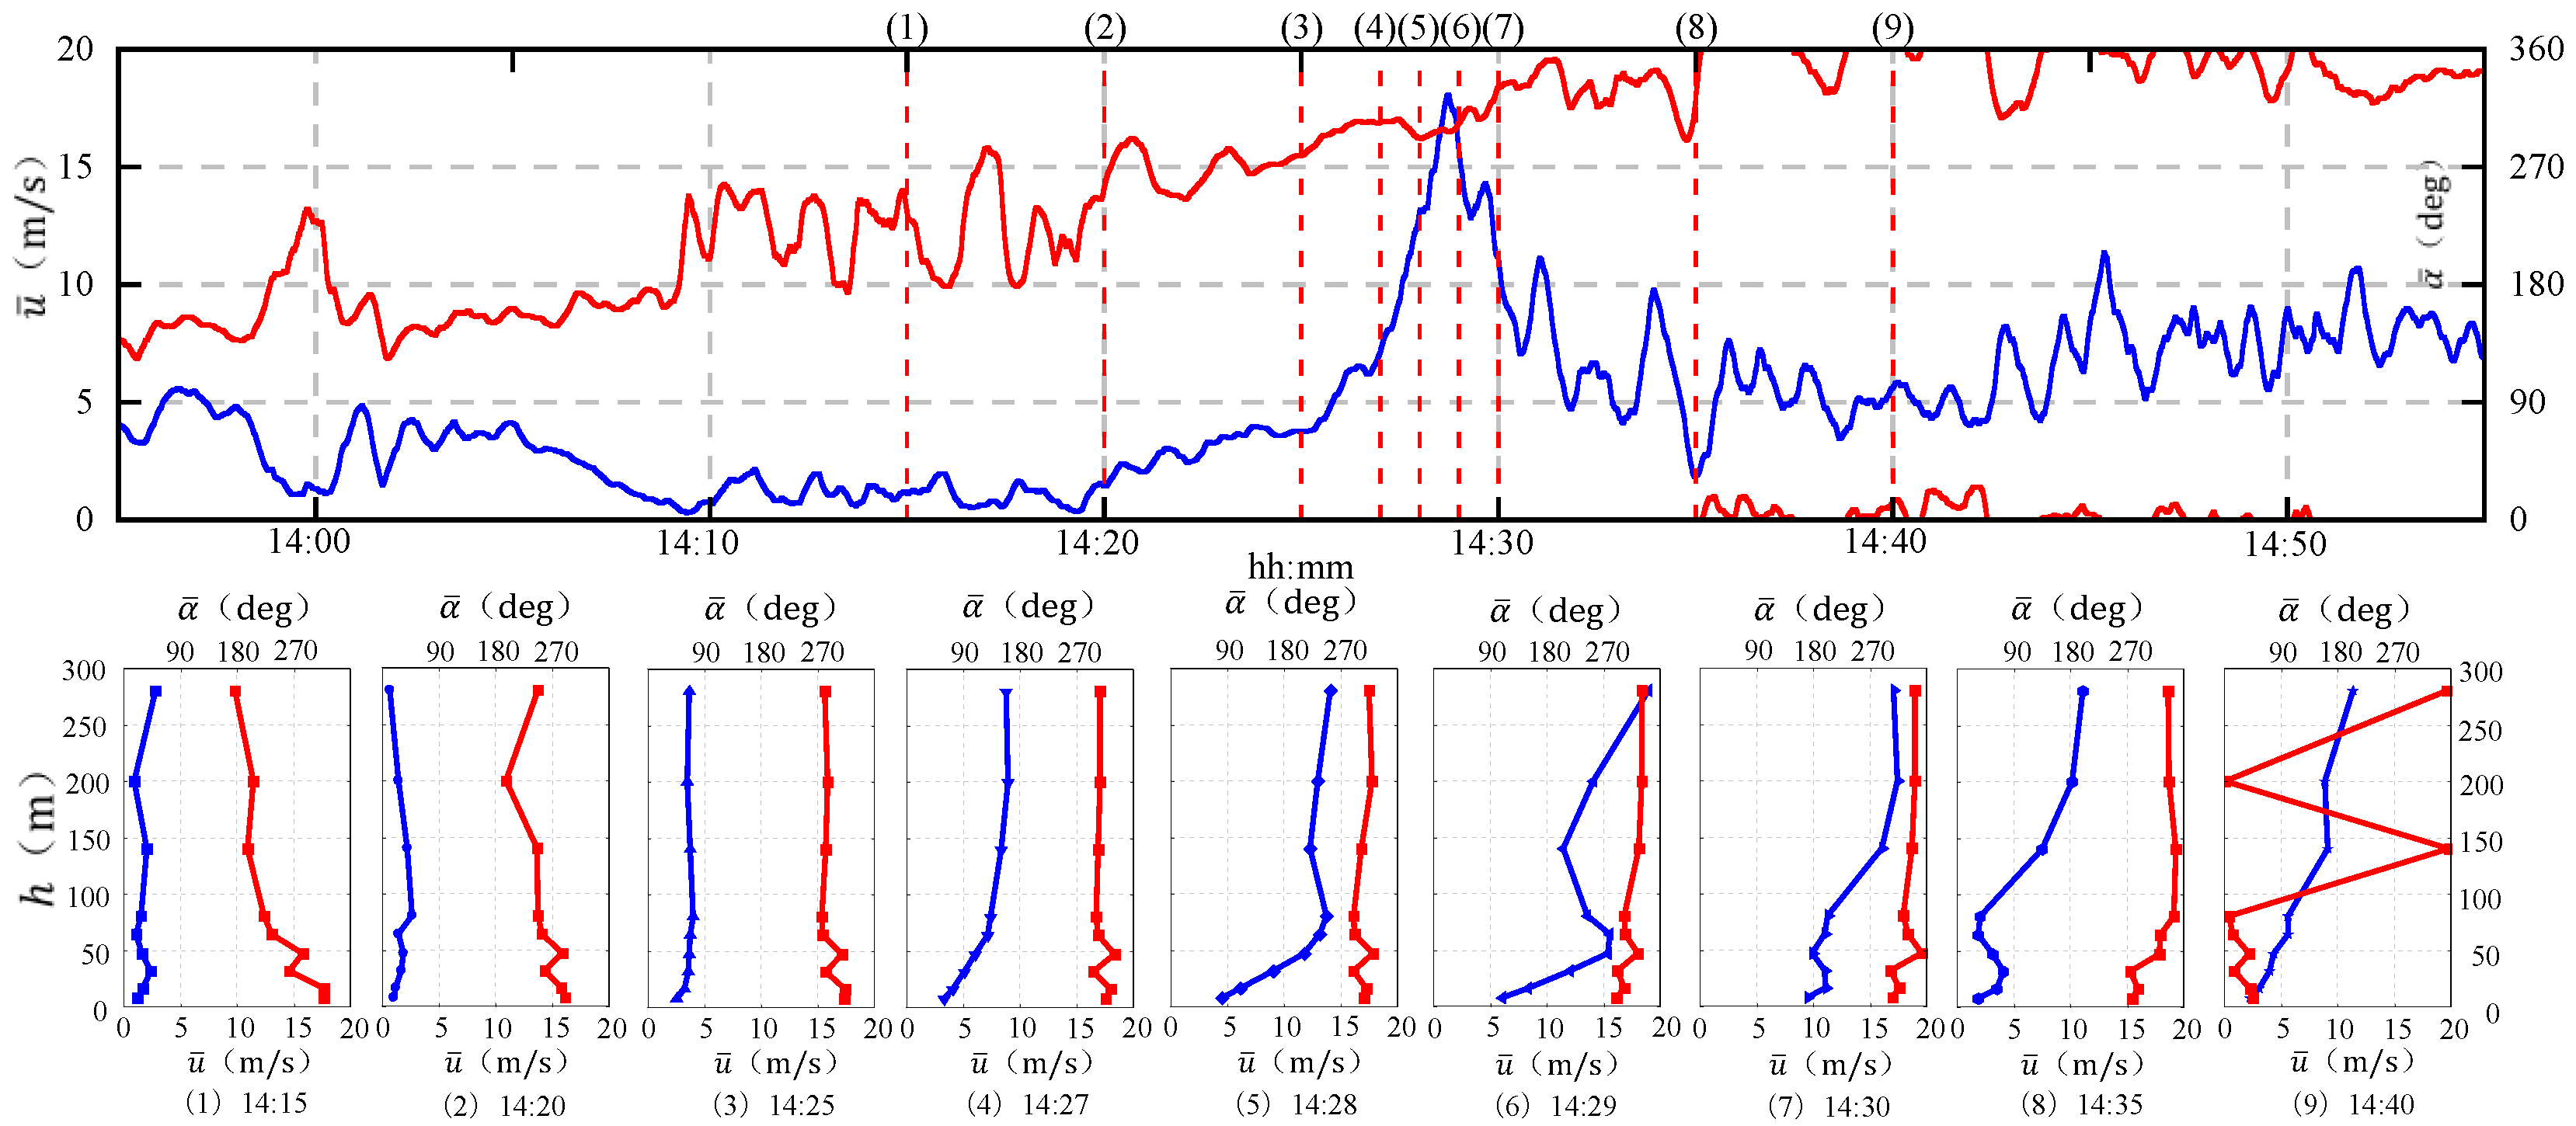
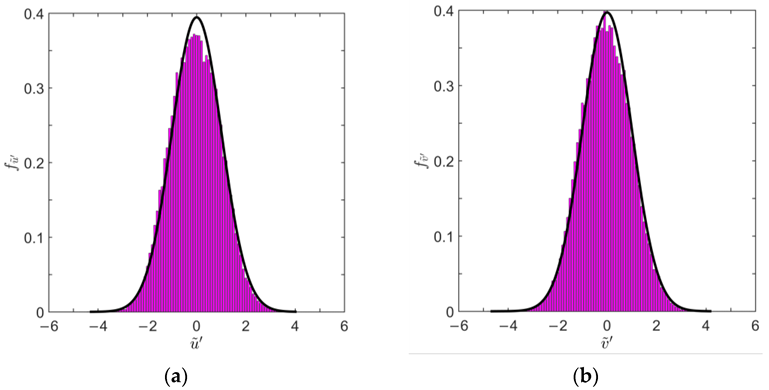
4.1. Mean Wind Speed and Reduced Turbulent Fluctuation

The slowly-varying mean wind speed of the thunderstorm was obtained by a moving average filter, or running mean, the time interval of which could be 30 s according to previous research results [19,25,31]. Figure 7 shows the time history curves of the slowly-varying mean wind speeds of the thunderstorm, obtained by 9 anemometers at different heights. Slowly-varying mean wind speeds did not change the basic shape of the instantaneous wind speeds, and there were still obvious jumps at all heights. The thunderstorm wind speeds varied greatly with time, presenting clear non-stationary characteristics. With the increase in wind speed, the thunderstorm wind directions at different heights gradually changed from south to northwest, and then remained almost unchanged during the process of the thunderstorm. It was found that the duration of the thunderstorm wind gradually increased with elevation.
Figure 8 shows the slowly-varying mean wind speed (a) and wind direction (b) profiles in the 30 min time duration. Before the thunderstorm, the wind speed was small and the wind speed profile fluctuated slightly along the height. When the thunderstorm occurred, the slowly-varying mean wind speed changed abruptly. Especially around 14:29, the wind speed reached its peak, and the slowly-varying mean wind speed did not increase monotonically with the height. This is depicted in Figure 8a with the color change, and it is clearly different from the typical characteristic of wind speed profiles of synoptic winds. Figure 8b represents the changes of wind direction during the rising phase of the thunderstorm wind. Combined with Figure 5 and Figure 7, the low-level wind direction changes when the thunderstorm wind speed begins to increase, and then remains stable, while the high-level wind direction gradually shifts as wind speed increases. It can be inferred that the upper wind direction was mainly controlled by the moving wind speed of the thunderstorm wind, while the lower-level wind direction was mainly controlled by the scattered outflow vortex caused by the collision between the thunderstorm downdraft and the ground, and the moving wind speed.
Figure 9 illustrates the evolution of the slowly-varying mean wind speed (a) and wind direction (b) profiles at a series of key instants during the passage of the gust front. At 14:15 and 14:20, i.e., before the occurrence of the thunderstorm event, the background wind was dominant, the wind speed changed slightly with respect to height, and the wind direction was varied according to altitude, especially near the ground and at high altitude. This may be related to the effect of ground roughness. When the thunderstorm started, at 14:25 and 14:27, the wind speed increased with height and time, and at the same time, the wind direction tended to turn clockwise. Near the peak of the thunderstorm wind, i.e., at 14:29, the nose shape profile could be clearly observed, and the maximum value of slowly-varying mean wind speed at the tip of the nose appeared at the height of 64 m. At 14:30, the wind speed decreased at low altitude and increased at high altitude. Meanwhile, the nose profile gradually diminished. Subsequently, the wind speeds gradually decreased at all altitudes and the nose profile disappeared. The occurrence of the nose shape of the wind speed profile in the thunderstorm event was limited to quite short time intervals during the ramp-up and peak stages, which is consistent with those evaluated for the thunderstorm outflows in the Northern Tyrrhenian [21]. During this process, only the wind direction near the ground changed greatly with the height. The wind direction at the upper level remained almost unchanged with respect to height, and gradually turned clockwise over time. This led to the northwest wind, and it was consistent with the meteorological data, which defined the event as thunderstorm wind with a northwest airflow type.
The next issue is reduced turbulent fluctuation. Based on Equation (6), the longitudinal and lateral reduced turbulent fluctuation ũ′ and v ˜ can be obtained. Table 2 shows the mean and standard deviation of the mean m standard deviation σ , skewness γ and kurtosis κ of u ˜ and v ˜ . Figure 10 depicts the probability density function of reduced turbulent fluctuations and the reference Gaussian model. It can be seen that the reduced turbulent fluctuations, obtained by the directional modeling method, have obvious stationary and Gaussian characteristics. It can be regarded as a stationary Gaussian stochastic process with zero mean and unit standard deviation. In addition, the correlation coefficients of the longitudinal and lateral reduced turbulent fluctuations of the thunderstorm are approximately zero, which is similar to the synoptic wind. It can be regarded as uncorrelated, and the accuracy of the directional thunderstorm wind model in the information decomposition of longitudinal and lateral wind speed can be confirmed.

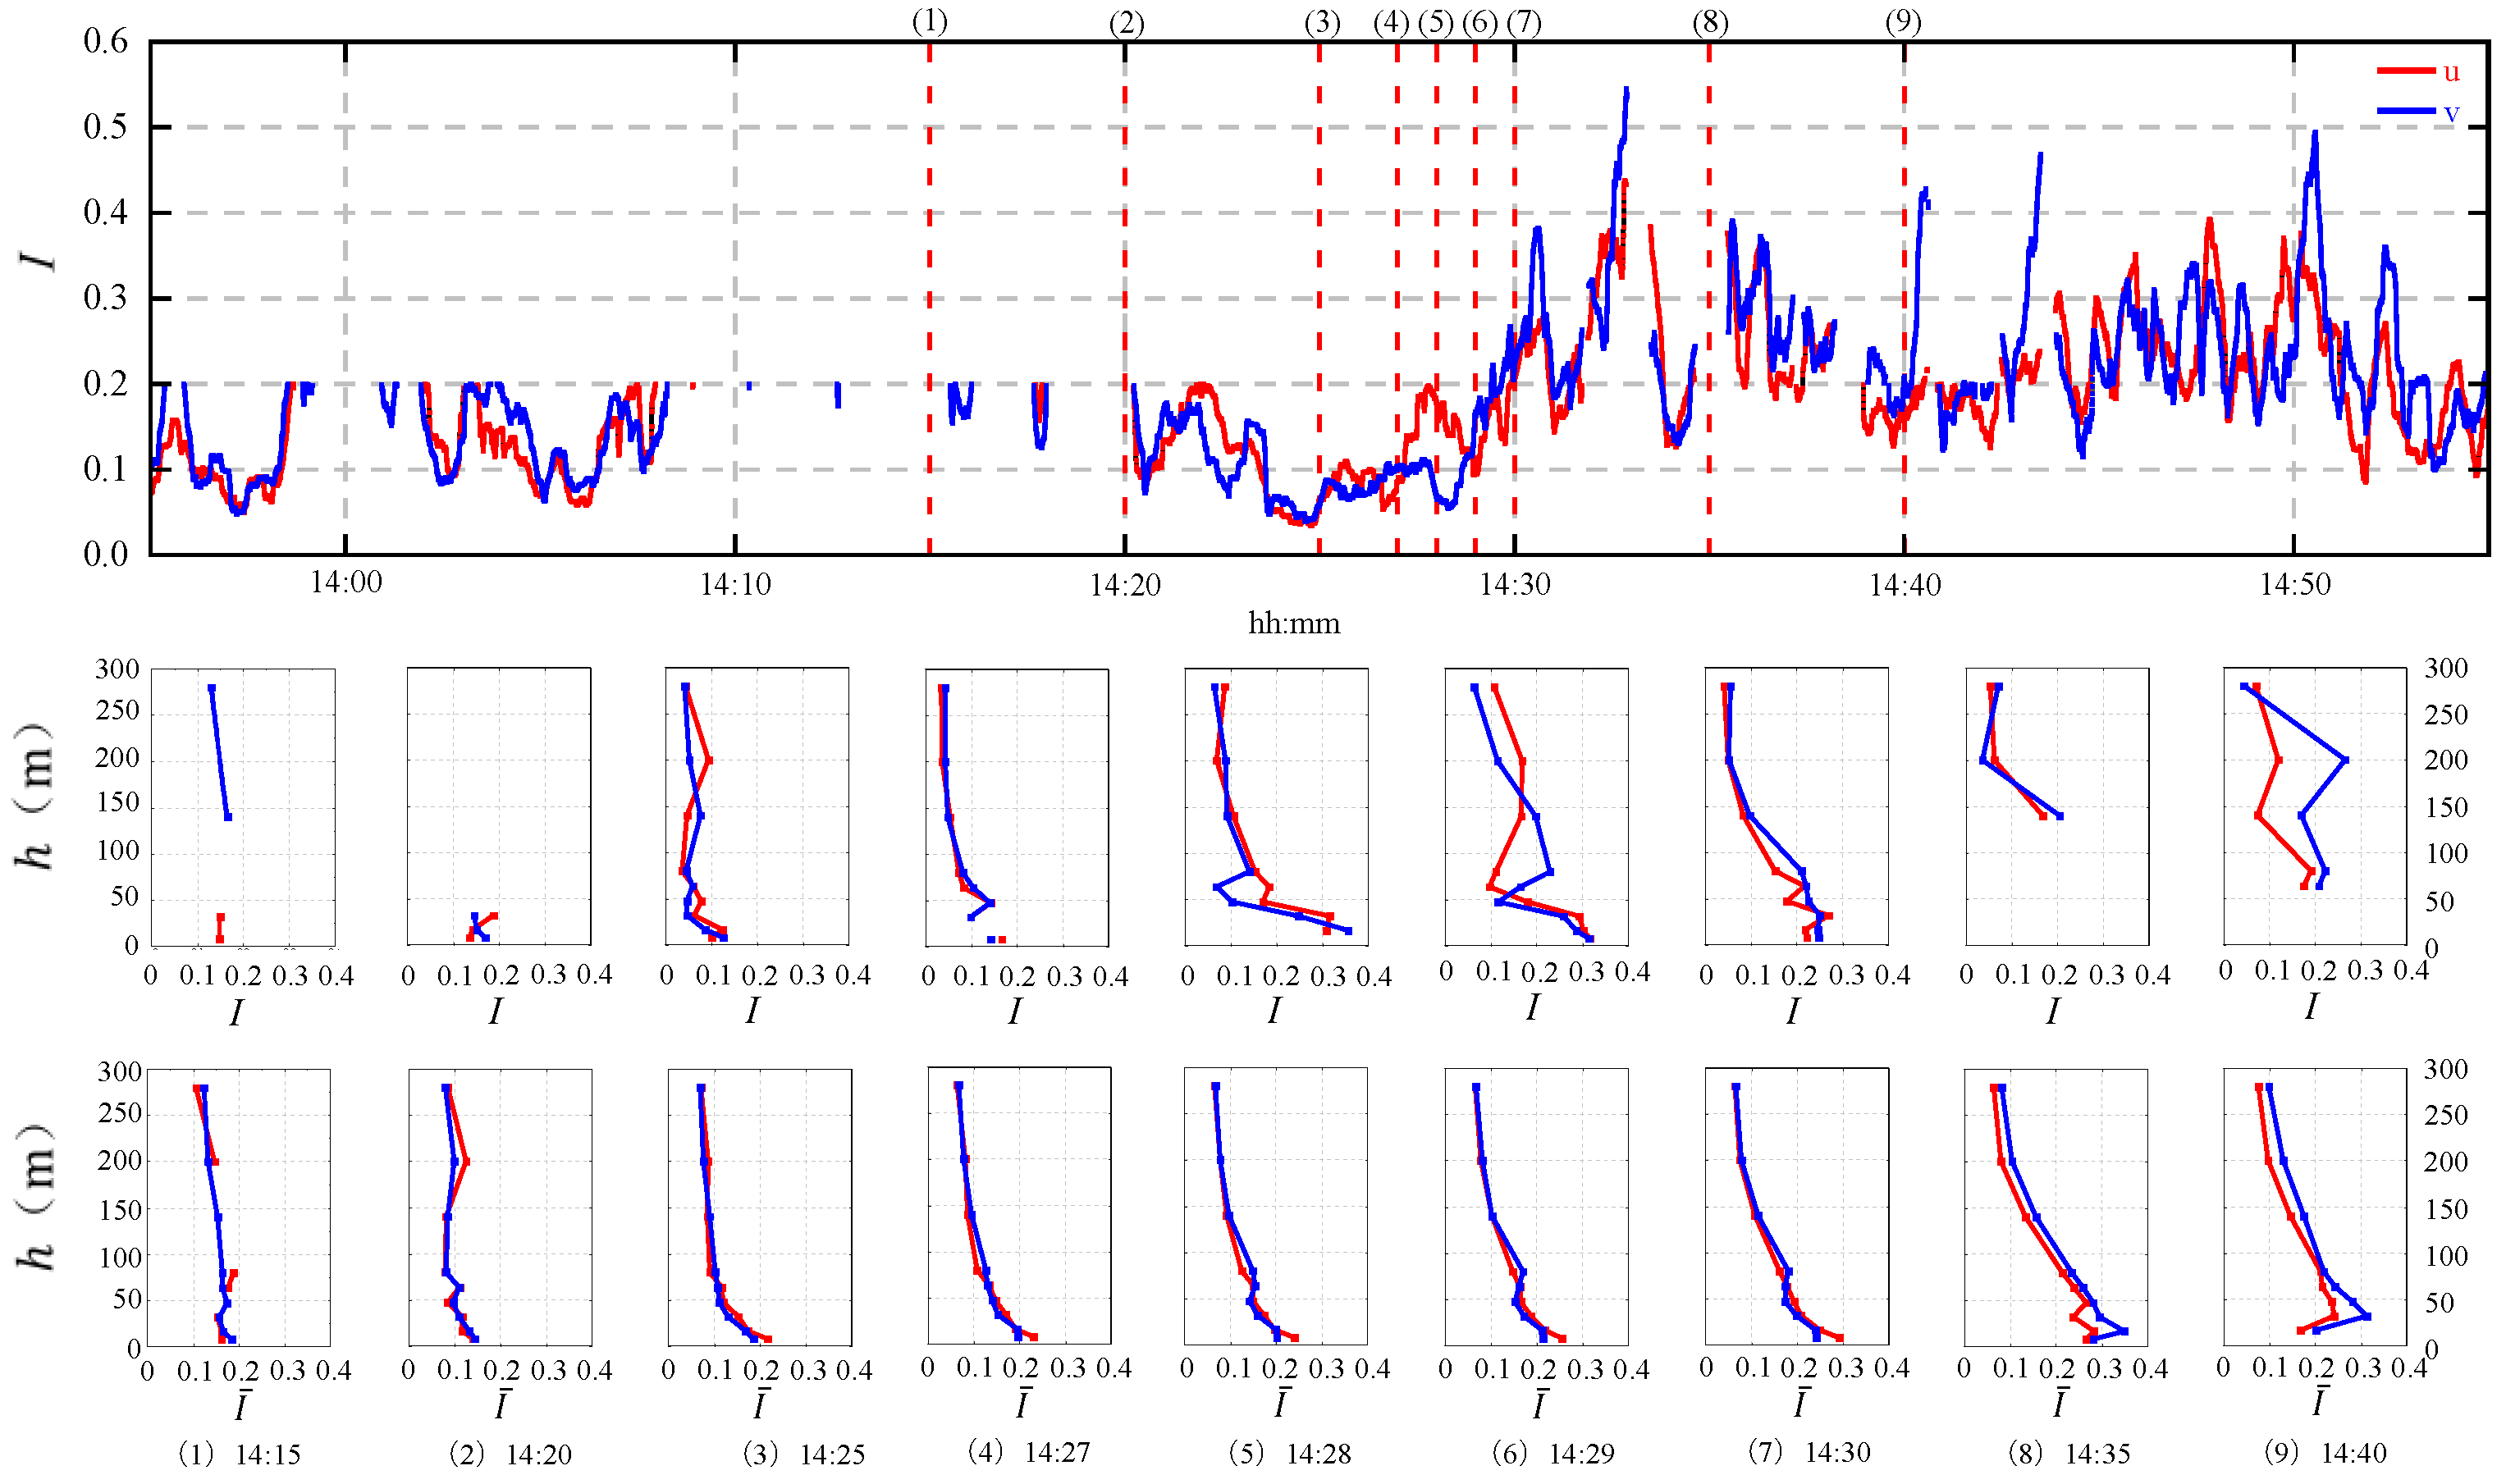
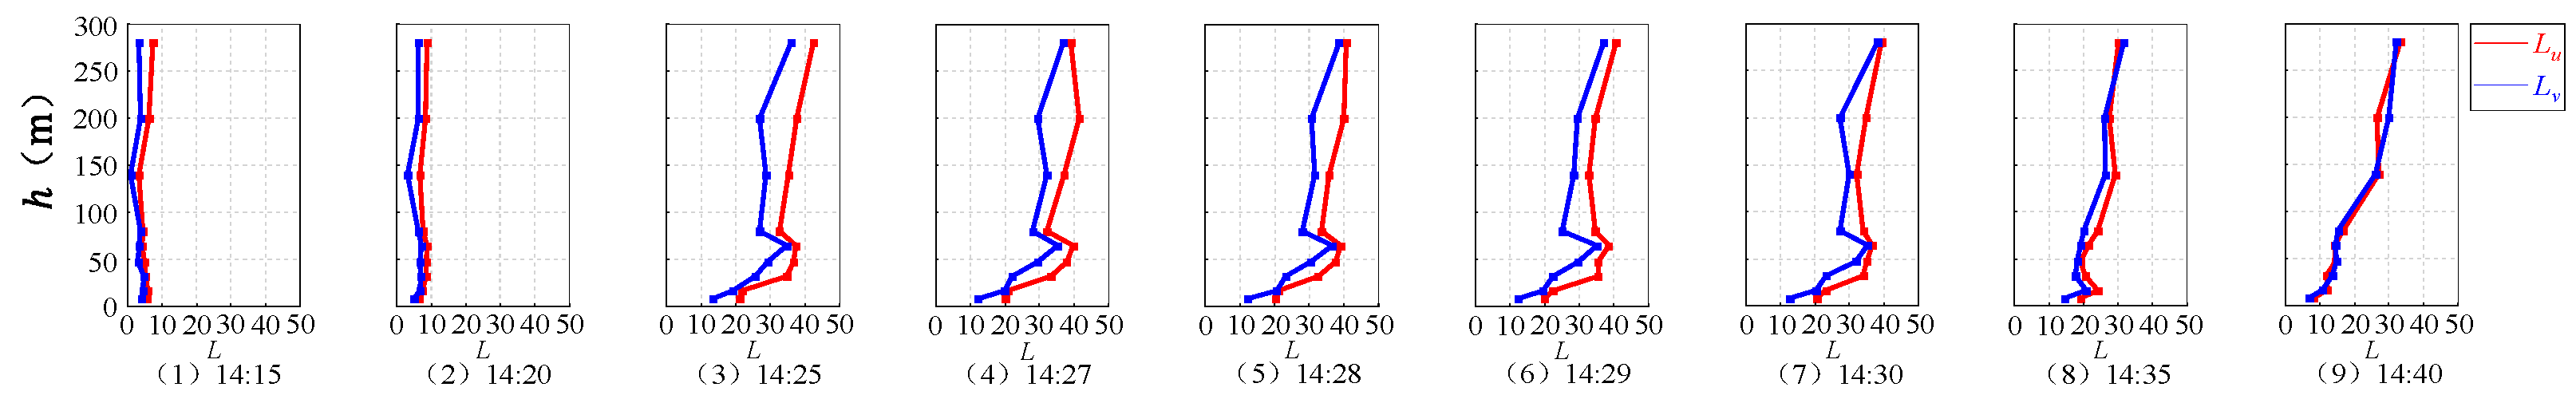
4.2. Turbulence Intensity and Turbulence Integration Scale

The turbulence intensity reflects the degree of pulsation of wind. The first panel of Figure 11 shows the variation of slow-varying turbulence intensity I δ δ = u , v (Equation (8)) with the time during the occurrence of thunderstorm wind at the height of 64 m. It is to be noted that the large turbulence intensity, caused by very small wind speeds, has been ignored ( u ¯ < 5 m/s, I > 0.2) [5]. The results showed that the slow-varying turbulence intensity changed with respect to time, and it increased significantly during the occurrence of thunderstorm winds.
The second panel of Figure 11 presents a series of vertical profiles of the longitudinal and lateral slowly-varying turbulence intensities (a) and (b) at a series of significant instants. As previously noted, the large value has been ignored, so some information in the figure is not presented. In this case, during the pass of the gust front, the longitudinal and lateral turbulence intensities gradually increase and show a zigzagged pattern with the change in height. It is difficult to give an obvious pattern at present, but the turbulence intensity at the bottom is significantly greater than that at the top. Different from the synoptic wind, whose turbulence intensity gradually decreases with the increase in height, the slowly-varying turbulence intensity of the thunderstorm wind decreases, increases and then decreases with height near the time when the peak wind speed occurs (Moment (5) and (6)), and the nasal tip appears at the height of about 64 m. In addition, the lateral value is slightly larger than the longitudinal value, which may be related to the special characteristics of the scattered ring wind field of thunderstorms.
The third panel of Figure 11 shows the profiles of the longitudinal and lateral mean turbulence intensity I ¯ u (a) and I ¯ v (b) (the 10-min time interval centered with the analysis moment). For the mean turbulence intensity, the longitudinal component (a) generally shows a decreasing trend with the increase in height, which is similar to the results obtained based on the thunderstorm outflows in the Northern Tyrrhenian [21]. While the lateral component (b) appears differently, when approaching the peak of the thunderstorm wind speed, the lateral component decreases first and then increases along the height for low heights. This was not found in Canepa et al. [21], which only presented 20 min mean turbulence intensity. With the height exceeding 80 m, it continues to show a decreasing trend. Obviously, this result is significantly different from that of the synoptic wind.
The turbulence integral length scale is a measure which can be used to evaluate the average size of turbulent vortices of fluctuating wind. It has considerable significance in the analysis of structural wind load, and the size of it determines the influence range of fluctuating wind on the structure. Herein, the turbulence integral length scale is calculated based on Taylor’s hypothesis and the auto-correlation function method with a threshold of 0.05 [32]. Figure 12 shows the profiles of the longitudinal and lateral turbulence integral length scales, L u (a) and L v (b), at the same significant instants as Figure 9. In general, the longitudinal turbulence integral length scales are larger than the lateral. In the case of this thunderstorm, with the increase in wind speed during the pass of the gust front, longitudinal and lateral turbulence integral length scales gradually become larger, i.e., the size of the generated vortices becomes larger. An obvious nose shape profile can be observed with the nasal tip appearing at the height of 64 m. This height corresponds to the tip position of the wind speed profile, and it is also a common height of tall buildings and tall structures. Up to 64 m, structures tend to be encased by larger vortices. The dynamic loads caused by fluctuating wind in various parts of the structure are more likely to be synchronized, and the impact on the structure will be visible. Therefore, it seems necessary to consider the influence of thunderstorm wind on the wind-resistant design of structures.

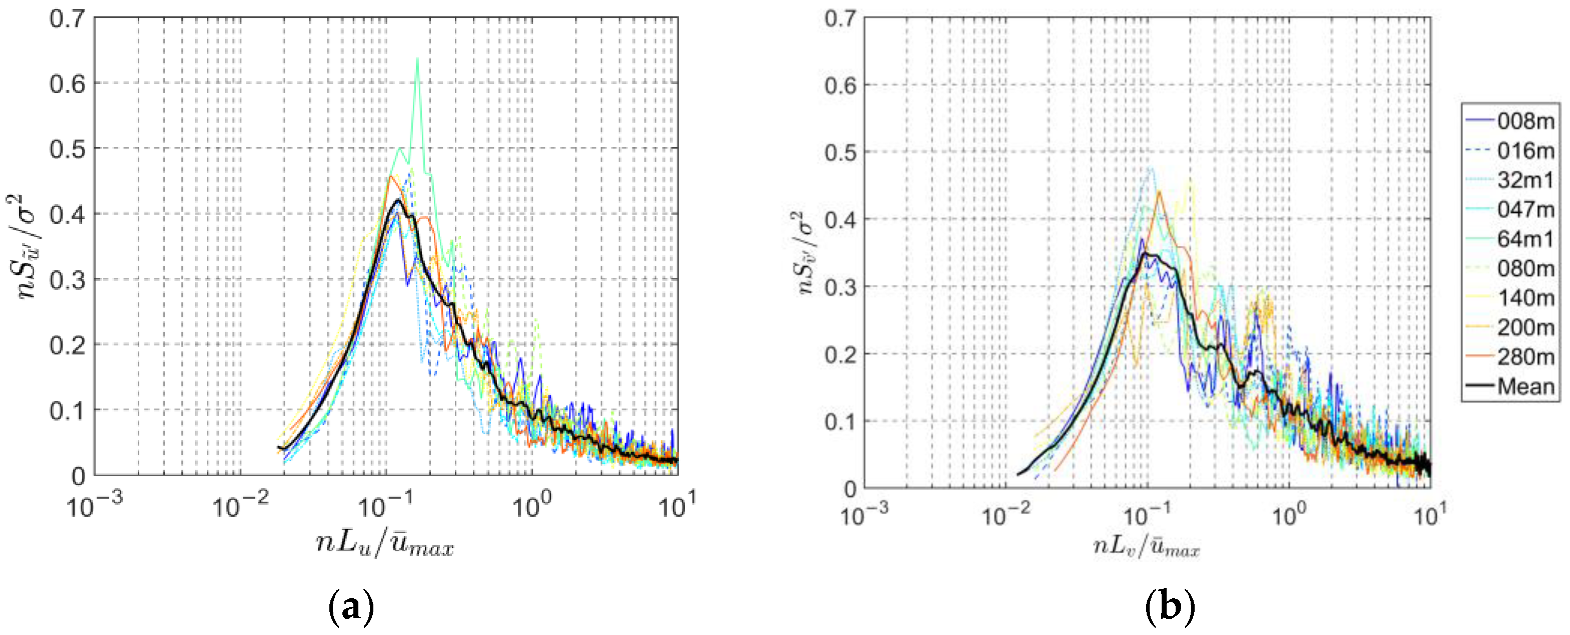
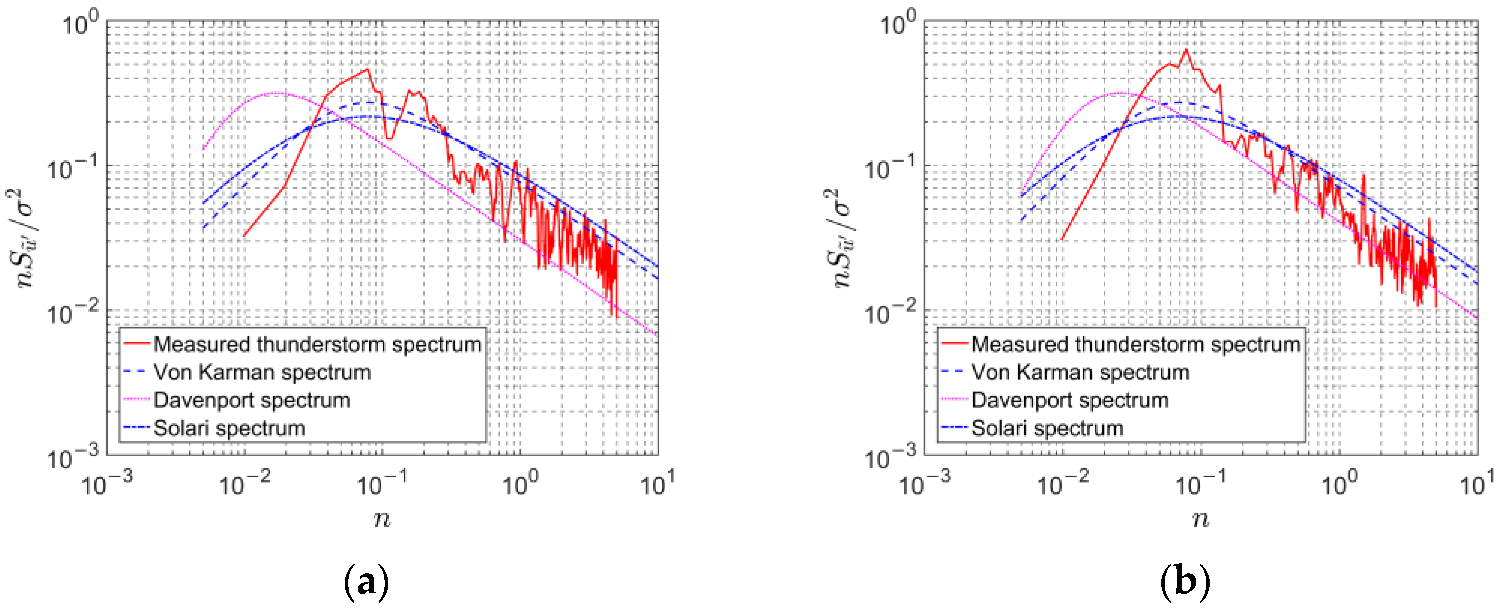
4.3. Power Spectral Density and Gust Factor

Power spectral density (PSD) describes the energy distribution of turbulent kinetic energy in different scales of vortices, and this is the basis for exploring wind-induced structural responses. Figure 13 shows the PSD curves at different heights caused by the thunderstorm wind. It can be observed that when it is expressed as a function of the turbulence integral length scales, the PSD curves at different heights can show basically uniform spikes. This is beneficial to the establishment of a PSD model of thunderstorm wind. The solid black line shows the mean of all heights, and the longitudinal result is slightly larger than the lateral.
Figure 14 shows the PSD thunderstorm records of 16 m (a) and 64 m (b), and the comparisons are made among the records, the empirical PSD models of the Davenport spectrum (Chinese specification), Von Karman spectrum (Japanese specification), and Solari spectrum (European specification). All spectra satisfy the −5/3 power law in the inertial subregion. The Davenport spectrum is significantly different from the thunderstorm spectrum. The Solari spectrum underestimates the spectral peak, and overestimates low frequency as well as high frequency parts. The Von Karman spectrum is relatively effective in fitting the thunderstorm wind spectrum, so it can be considered to model the thunderstorm wind.
Gust factor is another important parameter in wind-induced response and wind-resistant design of structures. Because of this, the amplification effect of fluctuating wind load on structural response has to be taken into account. The gust factor based on the directional thunderstorm wind speed modeling method can be obtained from Equation (10). In view of the instantaneous characteristics of thunderstorm wind, the time interval of 1 s is generally taken for the longitudinal peak wind speed when calculating the gust factor of thunderstorm wind. The gust factor results at significant instants are shown in Table 3. The values during jumps in wind speed are higher, and they are larger at low altitude rather than high altitude. The results are smaller than the values obtained with those presented in Canepa et al. [21] because the different definition of the gust factor, while similar to the results based on a series of thunderstorms in Northern Tyrrhenian with the same definition. The along-height mean value of the ratio between the 1 s peak wind speed and 10 min mean wind speed, the definition of gust factor for synoptic winds, are 3.71 and 3.07 at 14:25 and 14:27, respectively. The results are much higher compared with the synoptic wind, and this is a serious threat to the safety of the structure. In addition, the gust factor at the height of 16 m is large, and the larger peak of gust wind speed is prone to occur at this height compared with others.

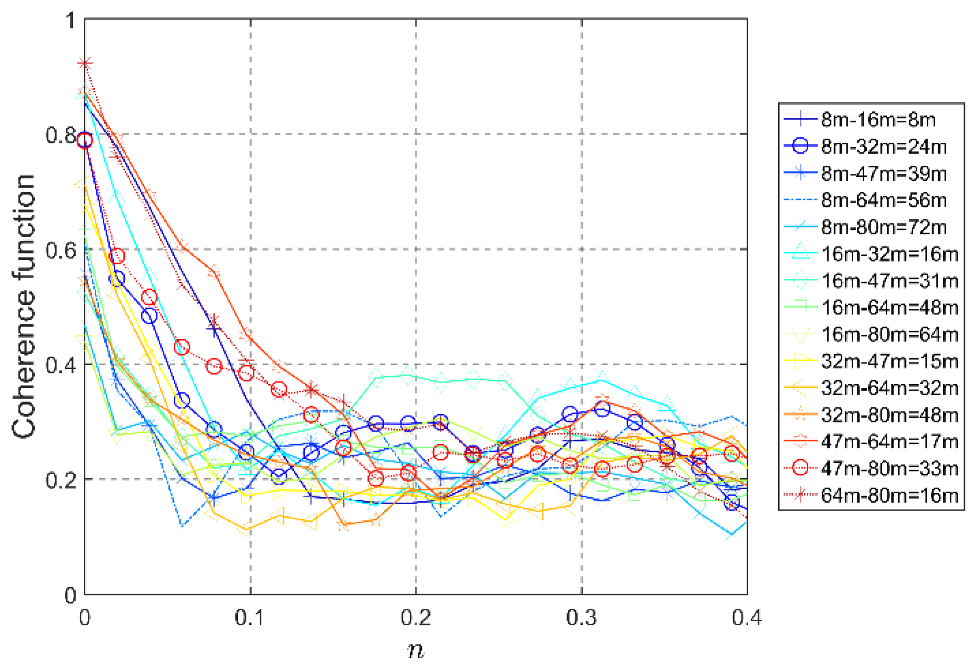
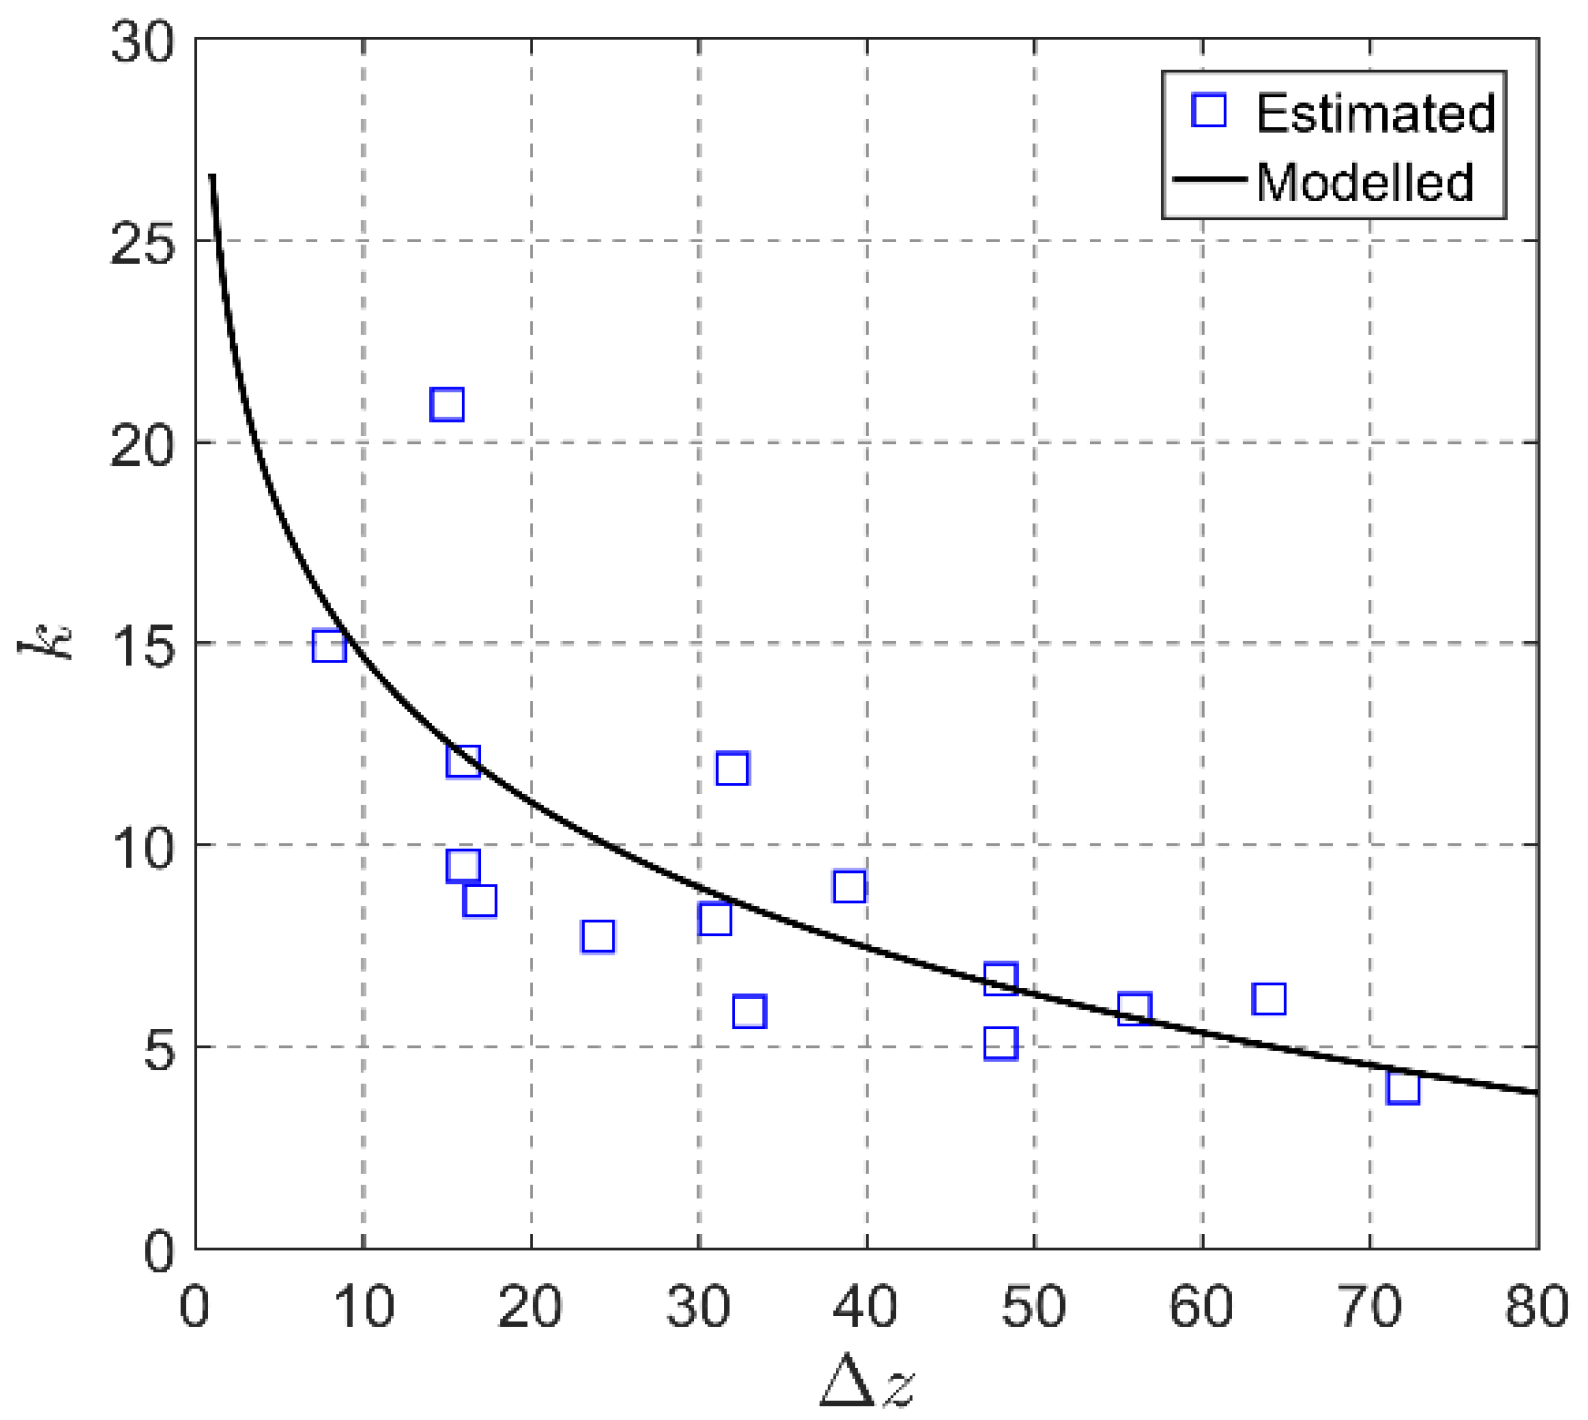
4.4. Coherence Function

Spatial correlation is one of the basic characteristics of fluctuating wind. It is very important when the effect of fluctuating wind on structures is considered. Coherence function is often used to describe the correlation degree in wind engineering, and the formula is:
coh z 1 , z 2 , n = S z 1 z 2 n S z 1 n S z 2 n
where z 1 and z 2 are two values of height, n is the frequency, S z 1 z 2 n is the co-spectral density function between z 1 and z 2 , and S z 1 n and S z 2 n are the spectral density function at z 1 and z 2 .
As noted earlier, the thunderstorm event was observed by nine ultrasonic anemometers located at different heights in the same location. Figure 15 shows the coherence function curves of the reduced turbulent fluctuation, detected by different pairs of anemometers installed at the 325 m meteorological tower in Beijing. The three higher anemometers (140 m, 200 m, and 280 m) are not taken into account, because they are far away from the lower anemometers. As shown in the figure, in general, the coherence between two wind speed records is related to the distances between different anemometers. The coherence related to shorter distances is larger than that of longer distances. However, the relationship between distance and correlation does not show a monotonic trend, which confirms that the distance between two points is not the only influencing factor. The coherence decreases exponentially with the increase of frequency, and this is similar to the feature of synoptic winds.
At present, the coherence function of thunderstorm wind is mainly based on the estimation of the wind-speed time history of low-altitude thunderstorm wind. Because of this, it is difficult to analyze the response of high-rise structures, for instance, ultra-high- voltage transmission towers and so on, under thunderstorm wind. Therefore, the establishment of the empirical coherence function model of thunderstorm wind with respect to height is necessary. The spacing, frequency, and average wind speed are important influencing factors of the coherence function of the longitudinal fluctuating wind with respect to height. For simplicity, the following empirical exponential function model is usually adopted in wind engineering, which can be used to describe the coherence function between wind speeds at two heights [33]:
coh z 1 , z 2 , n = e x p K z 1 , z 2 n z 1 z 2
where K is a parameter changing with z 1 and z 2 .
K z 1 , z 2 is associated with an average wind speed, and it is defined as follows:
K z 1 , z 2 = 2 k z 1 , z 2 / u ¯ z 1 + u ¯ z 2
where u ¯ z 1 and u ¯ z 2 are the maximum values of slowly-varying mean wind speed at z 1 and z 2 , while k z 1 , z 2 is a parameter depending on z = z 1 z 2 .
According to the least squares method, K is related to different separation distances and this can be obtained as shown in Figure 16. Chen et al. [33] gave the empirical formula:
k z = k 1 × ln z + k 0
In this thunderstorm event, it is estimated k1 = 5.20 and k0 = 26.65 in the empirical Equation (14). Figure 16 shows the coherence function fitting result (black curve) with a slight deviation based on the model. During in-depth research, it is necessary to explore the coherence function model, which can be used to study the thunderstorm wind field characteristics, and the accurate fitting of thunderstorm winds, based on a large number of measured data.

5. Conclusions

Based on the measured data, the characteristics of vertical variations of the wind field with time in a typical thunderstorm event in Beijing were explored by applying the directional thunderstorm wind model. The following conclusions considering this thunderstorm event were obtained:
(1)
By using the directional thunderstorm wind model, it is possible to achieve the decoupling of longitudinal and lateral fluctuating wind speed components, quantitatively study the wind direction of the thunderstorm, and develop credible comparisons between the properties of thunderstorm and synoptic wind speeds.
(2)
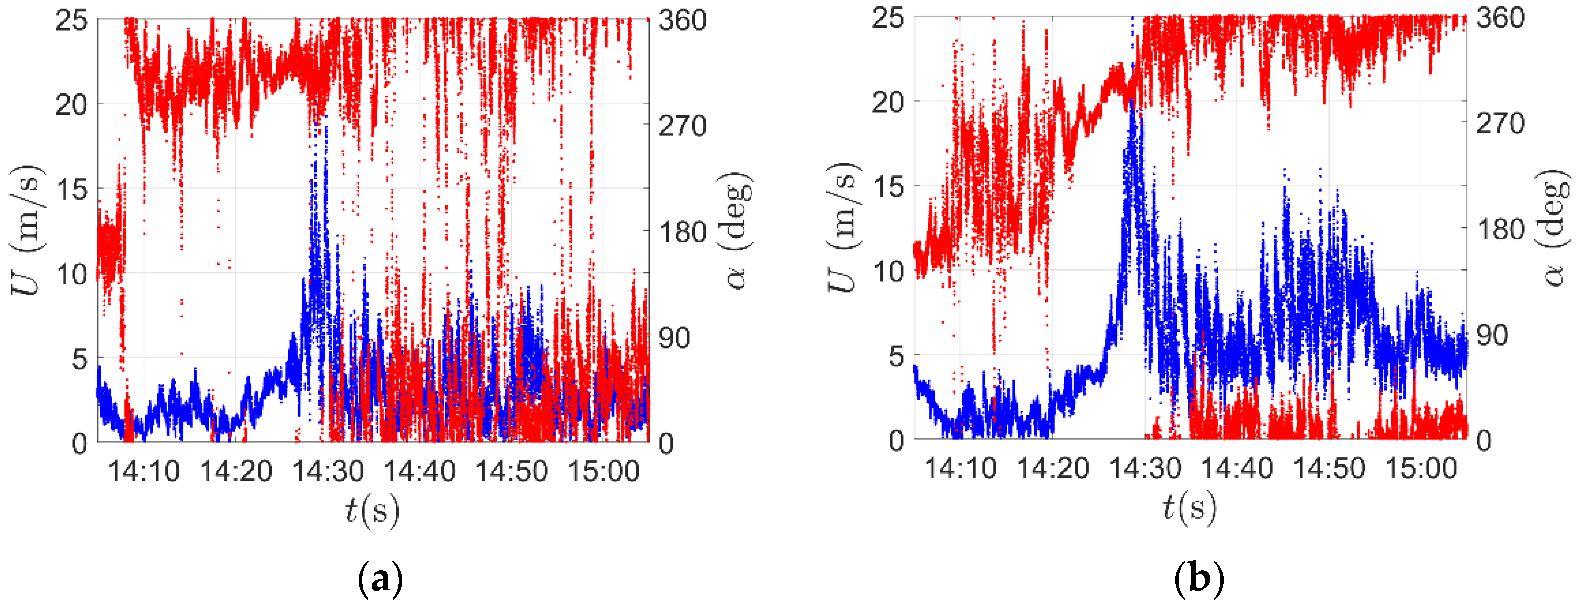
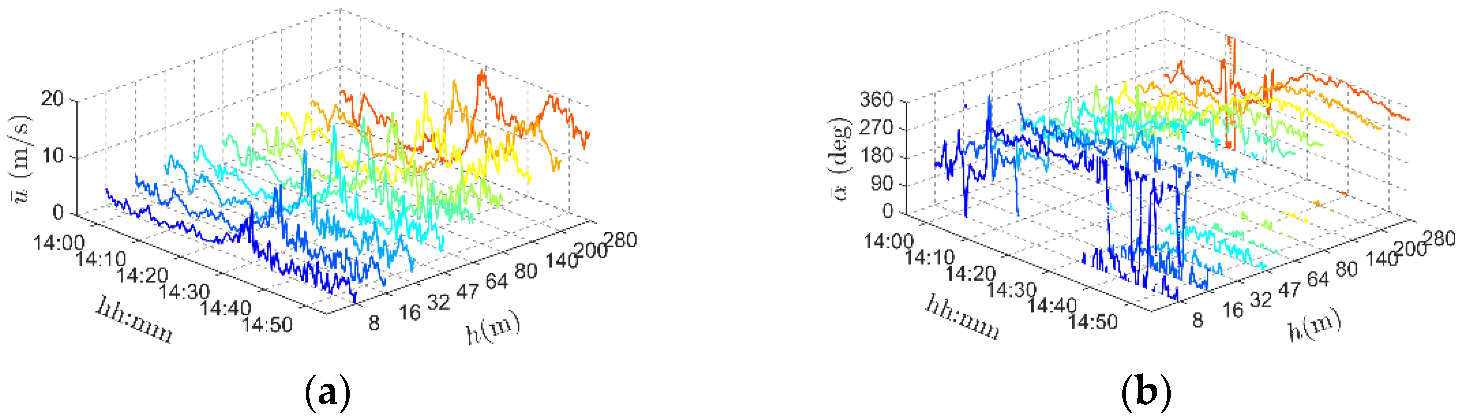
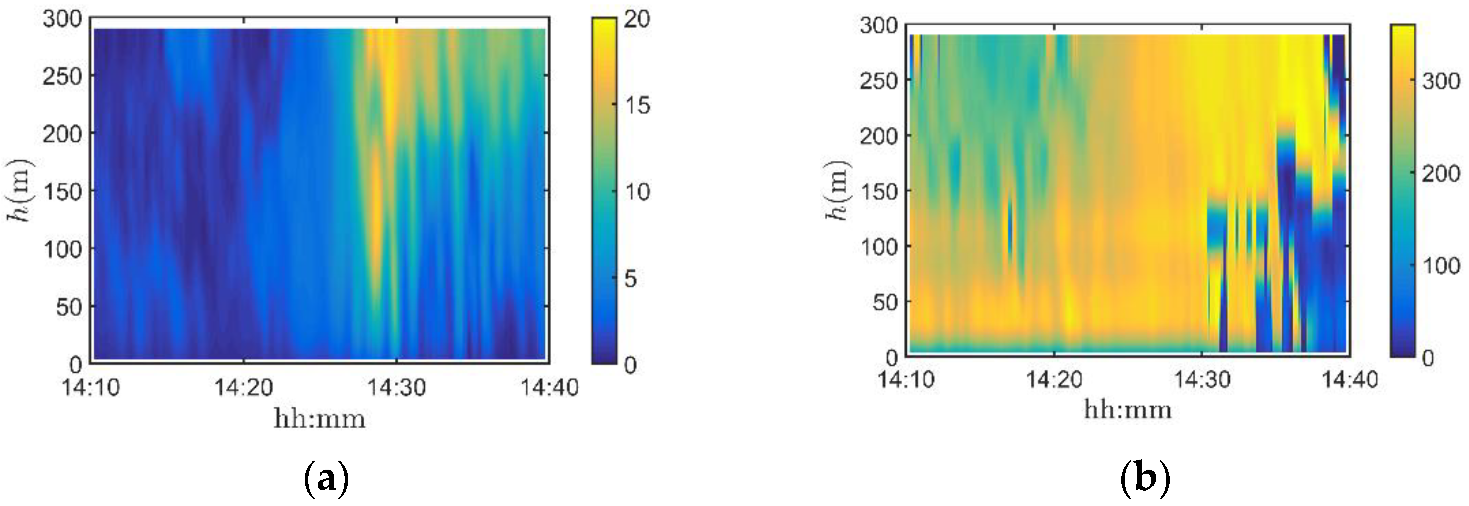
The wind speed of the thunderstorm event shows a typical transient nose shape profile, and the duration of the jump gradually increases with the increase in height. The wind direction in the upper level is mainly controlled by the moving speed of the thunderstorm, while the wind direction in the lower level is determined by the dispersive outflow caused by the collision between the thunderstorm and the ground, and the moving wind speed.
(3)
Different from the synoptic wind, the lateral mean turbulence intensity first decreases, then increases, and finally decreases near the time when the peak wind speed occurs. The turbulence integral length scale presents an obvious “nose” profile, and the height of the nose tip is similar to that of the wind speed profile.
(4)
The Von Karman spectrum appears consistent with the measured thunderstorm wind spectrum. Compared with synoptic wind, the gust factor in the process of thunderstorm wind is larger, so it seems important to consider the influence of thunderstorm wind during engineering design. The empirical exponential function model of coherence function for thunderstorms presents a slight deviation with the measured one and deserves further study.

Author Contributions

Conceptualization, S.Z.; methodology, A.Z. and S.Z.; software, S.Z.; data curation, B.L. and S.Z.; writing—original draft preparation, S.Z. and X.X.; writing—review and editing, A.Z. and H.Z. All authors have read and agreed to the published version of the manuscript.

Funding

This research was supported by Beijing Natural Science Foundation (Grant No. 8222013), National Natural Science Foundation of China (Grant No. 52108431) and the Pyramid Talent Training Project of Beijing University of Civil Engineering and Architecture (Grant No. JDYC20220806).

Institutional Review Board Statement

Not applicable.

Informed Consent Statement

Not applicable.

Data Availability Statement

Not applicable.

Acknowledgments

The authors acknowledge the support of a project supported by Beijing Postdoctoral Research Foundation (2021-ZZ-115), the Research Ability Enhancement Program for Young Teachers of Beijing University of Civil Engineering and Architecture (X21071) and the European Research Council under the European Union’s Horizon 2020 research and innovation program (grant agreement No. 741273) for the project THUNDERR—Detection, simulation, modelling and loading of thunderstorm outflows to design wind safer and cost-efficient structures—through an Advanced Grant 2016.

Conflicts of Interest

The authors declare no conflict of interest.

References

  1. Zhang, S.; Solari, G.; Gaetano, P.D.; Burlando, M.; Repetto, M.P. A refined analysis of thunderstorm outflow characteristics relevant to the wind loading of structures. Probabilist. Eng. Mech. 2018, 54, 9–24. [Google Scholar] [CrossRef]
  2. Zhang, S.; Solari, G.; Yang, Q.S.; Repetto, M.P. Extreme wind speed distribution in a mixed wind climate. J. Wind Eng. Ind. Aerodyn. 2018, 176, 239–253. [Google Scholar] [CrossRef]
  3. Huang, G.Q.; Jiang, Y.; Peng, L.L.; Solari, G.; Liao, H.L.; Li, M.S. Characteristics of intense winds in mountain area based on field measurement: Focusing on thunderstorm winds. J. Wind Eng. Ind. Aerodyn. 2019, 190, 166–182. [Google Scholar] [CrossRef]
  4. Ciano, M.; Gioffrè, M.; Gusella, V.; Grigoriu, M.D. Non-stationary dynamic structural response to thunderstorm outflows. Probabilist. Eng. Mech. 2020, 62, 103103. [Google Scholar] [CrossRef]
  5. Zhang, S.; Solari, G.; Burlando, M.; Yang, Q.S. Directional decomposition and properties of thunderstorm outflows. J. Wind Eng. Ind. Aerodyn. 2019, 189, 71–90. [Google Scholar] [CrossRef]
  6. Li, X.; Li, S.P.; Su, Y.; Peng, L.L.; Cao, S.Y.; Liu, M. Study on the time-varying extreme value characteristic of the transient loads on a 5:1 rectangular cylinder subjected to a thunderstorm-like wind. J. Wind Eng. Ind. Aerodyn. 2022, 229, 105161. [Google Scholar] [CrossRef]
  7. Brusco, S.; Solari, G. Transient aeroelasticity of structures subjected to thunderstorm outflows. Eng. Struct. 2021, 245, 112801. [Google Scholar] [CrossRef]
  8. Choi, E.C.C. Wind characteristics of tropical thunderstorms. J. Wind Eng. Ind. Aerodyn. 2000, 84, 215–226. [Google Scholar] [CrossRef]
  9. Lombardo, F.T.; Smith, D.A.; Schroeder, J.L.; Mehta, K.C. Thunderstorm characteristics of importance to wind engineering. J. Wind Eng. Ind. Aerodyn. 2014, 125, 121–132. [Google Scholar] [CrossRef]
  10. Zhang, S.; Yang, Q.S.; Solari, G.; Li, B.; Huang, G.Q. Characteristics of thunderstorm outflows in Beijing urban area. J. Wind Eng. Ind. Aerodyn. 2019, 195, 104011. [Google Scholar] [CrossRef]
  11. Solari, G. Emerging issues and new frameworks for wind loading on structures in mixed climates. Wind Struct. 2014, 19, 295–320. [Google Scholar] [CrossRef]
  12. Fujita, T.T. The Downburst: Microburst and Macroburst: Report of Projects NIMROD and JAWS; University of Chicago: Chicago, IL, USA, 1985. [Google Scholar]
  13. Choi, E.C.C. Extreme wind characteristics over Singapore-an area in the equatorial belt. J. Wind Eng. Ind. Aerodyn. 1999, 83, 61–69. [Google Scholar] [CrossRef]
  14. Gast, K.D.; Schroeder, J.L. Supercell reak-flank downdraft as sampled in the 2002 thunderstorm outflow experiment. In Proceedings of the 11th International Conference on Wind Engineer, Lubbock, TX, USA, 2–5 June 2003. [Google Scholar]
  15. Solari, G.; Repetto, M.P.; Burlando, M.; Gaetano, P.D.; Pizzo, M.; Tizzi, M.; Parodi, M. The wind forecast for safety management of port areas. J. Wind Eng. Ind. Aerodyn. 2012, 104–106, 266–277. [Google Scholar] [CrossRef]
  16. Holmes, J.D.; Oliver, S.E. An empirical model of a downburst. Eng. Struct. 2000, 22, 1167–1172. [Google Scholar] [CrossRef]
  17. Choi, E.C.C.; Hidayat, F.A. Dynamic response of structures to thunderstorm winds. Prog. Struct. Eng. Mater. 2002, 4, 408–416. [Google Scholar] [CrossRef]
  18. Chen, L.; Letchford, C.W. A deterministic-stochastic hybrid model of downbursts and its impact on a cantilevered structure. Eng. Struct. 2004, 26, 619–629. [Google Scholar] [CrossRef]
  19. Holmes, J.D.; Hangan, H.M.; Schroeder, J.L.; Letchford, C.W.; Orwig, K.D. A forensic study of the Lubbock-Reese downdraft of 2002. Wind Struct. 2008, 11, 19–39. [Google Scholar] [CrossRef]
  20. Zhang, S.; Li, B.; Solari, G.; Zhang, X.; Xu, X. A Refined Study of Atmospheric Wind Properties in the Beijing Urban Area Based on a 325 m Meteorological Tower. Atmosphere 2021, 12, 786. [Google Scholar] [CrossRef]
  21. Canepa, F.; Burlando, M.; Solari, G. Vertical profile characteristics of thunderstorm outflows. J. Wind Eng. Ind. Aerodyn. 2020, 206, 104332. [Google Scholar] [CrossRef]
  22. McCullough, M.; Kwon, D.K.; Kareem, A.; Wang, L. Efficacy of averaging interval for nonstationary winds. J. Eng. Mech.-ASCE 2014, 140, 1–19. [Google Scholar] [CrossRef]
  23. Tubino, F.; Solari, G. Time varying mean extraction for stationary and nonstationary winds. J. Wind Eng. Ind. Aerodyn. 2000, 203, 104187. [Google Scholar] [CrossRef]
  24. Brusco, S.; Buresti, G.; Piccardo, G. Thunderstorm-induced mean wind velocities and accelerations through the continuous wavelet transform. J. Wind Eng. Ind. Aerodyn. 2002, 221, 104886. [Google Scholar] [CrossRef]
  25. Solari, G.; Burlando, M.; De Gaetano, P.; Repetto, M.P. Characteristics of thunderstorms relevant to the wind loading of structures. Wind Struct. 2015, 20, 763–791. [Google Scholar] [CrossRef]
  26. Hui, Y.; Li, B.; Kawai, H.; Yang, Q.S. Non-stationary and non-Gaussian characteristics of wind speeds. Wind Struct. 2017, 24, 59–78. [Google Scholar] [CrossRef]
  27. GB50009-2012; Load Code for the Design of Building Structures; China Architecture & Building Press: Beijing, China, 2012; pp. 31–32.
  28. Burlando, M.; De Cio, A.; Pizzo, M.; Solari, G. Analysis of wind vertical profiles of thunderstorm events in the Mediterranean. In Proceedings of the 9th Asia-Pacific Conference on Wind Engineering, Auckland, New Zealand, 3–7 December 2017. [Google Scholar]
  29. Wood, G.S.; Kwok, K.C.S.; Motteram, N.A.; Fletcher, D.F. Physical and numerical modelling of thunderstorm downbursts. J. Wind Eng. Ind. Aerodyn. 2001, 89, 535–552. [Google Scholar] [CrossRef]
  30. Xu, C.Y.; Yi, X.Y.; Duan, L.Y.; Xu, L.Z. Synthetic applications of multi-data to a weak precipitation thunderstorm accompanied by disastrous winds in Tianjin. Meteorol. Sci. Technol. 2017, 45, 355–363. (In Chinese) [Google Scholar]
  31. Choi, E.C.C.; Hidayat, F.A. Gust factors for thunderstorm and non-thunderstorm winds. J. Wind Eng. Ind. Aerodyn. 2002, 90, 1683–1696. [Google Scholar] [CrossRef]
  32. Flay, R.G.J.; Stevenson, D.C. Integral length scales in strong winds below 20 m. J. Wind Eng. Ind. Aerodyn. 1988, 28, 21–30. [Google Scholar] [CrossRef]
  33. Chen, L.; Letchford, C.W. Numerical simulation of extreme winds from thunderstorm downbursts. J. Wind Eng. Ind. Aerodyn. 2007, 95, 977–990. [Google Scholar] [CrossRef]
Figure 1. Decomposition of thunderstorm outflow wind speed based on the classical method.
Applsci 12 12036 g001
Figure 2. Directional signal decomposition.
Applsci 12 12036 g002
Figure 3. Decomposition of thunderstorm wind speed based on the directional signal decomposition method.
Applsci 12 12036 g003
Figure 4. Beijing 325-m-high meteorological tower.
Applsci 12 12036 g004
Figure 5. Wind speed (blue) and direction (red) time history of the thunderstorm event recorded at 16 m (a) and 64 m (b).
Applsci 12 12036 g005
Figure 6. Vertical wind speed (blue) and wind attack angle (red) time history of the thunderstorm recorded at 16 m (a) and 64 m (b).
Applsci 12 12036 g006
Figure 7. Slowly-varying mean wind speed (a) and direction (b) time history.
Applsci 12 12036 g007
Figure 8. Spatial–temporal variation of slowly-varying mean wind speed (a) and direction (b).
Applsci 12 12036 g008
Figure 9. Spatial–temporal variation of slowly-varying mean wind speed (blue) and direction (red) at some significant instants.
Applsci 12 12036 g009
Figure 10. Probability density function of longitudinal (a) and lateral (b) reduced turbulent fluctuation and the corresponding Gaussian distribution.
Applsci 12 12036 g010
Figure 11. Spatial–temporal variation of longitudinal (red) and lateral (blue) turbulence intensity at some significant instants.
Applsci 12 12036 g011
Figure 12. Spatial–temporal variation of longitudinal (red) and lateral (blue) turbulence integral length scale at some significant instants.
Applsci 12 12036 g012
Figure 13. Power spectral density of longitudinal (a) and lateral (b) reduced turbulent fluctuation.
Applsci 12 12036 g013
Figure 14. Comparison of PSD of reduced turbulent fluctuation of the thunderstorm at 16 m (a) and 64 m (b) and empirical models.
Applsci 12 12036 g014
Figure 15. Coherence function with frequency obtained by the field measurement.
Applsci 12 12036 g015
Figure 16. Function of k and ∆z.
Applsci 12 12036 g016
Table 1. Peak wind speed.
h (m)81632476480140200280
Û14.7619.0023.2523.7124.7519.8721.2221.2023.68
û14.3018.3823.0823.6824.7319.7821.1121.1723.62
Table 2. Mean and standard deviation of the mean, standard deviation, skewness, and kurtosis of ũ′ and v ˜ .
mσγκ
ũ′Mean0.011.010.032.78
Std0.020.010.100.14
v ˜ Mean0.001.000.032.90
Std0.020.010.130.18
Table 3. Gust factors at some significant instants.
h (m)14:2014:2514:2714:2814:2914:3014:35
81.221.431.431.431.431.431.12
161.081.561.561.561.561.561.00
321.251.461.461.461.461.461.14
471.061.301.301.301.301.301.33
641.071.371.371.371.371.371.28
801.141.181.181.181.181.181.25
1401.151.121.121.121.121.121.06
2001.251.101.101.101.101.101.10
2801.171.241.241.241.241.241.10
Publisher’s Note: MDPI stays neutral with regard to jurisdictional claims in published maps and institutional affiliations.

