
A Projection-Based Augmented Reality System for Medical Applications

Abstract
:Featured Application
Abstract
1. Introduction
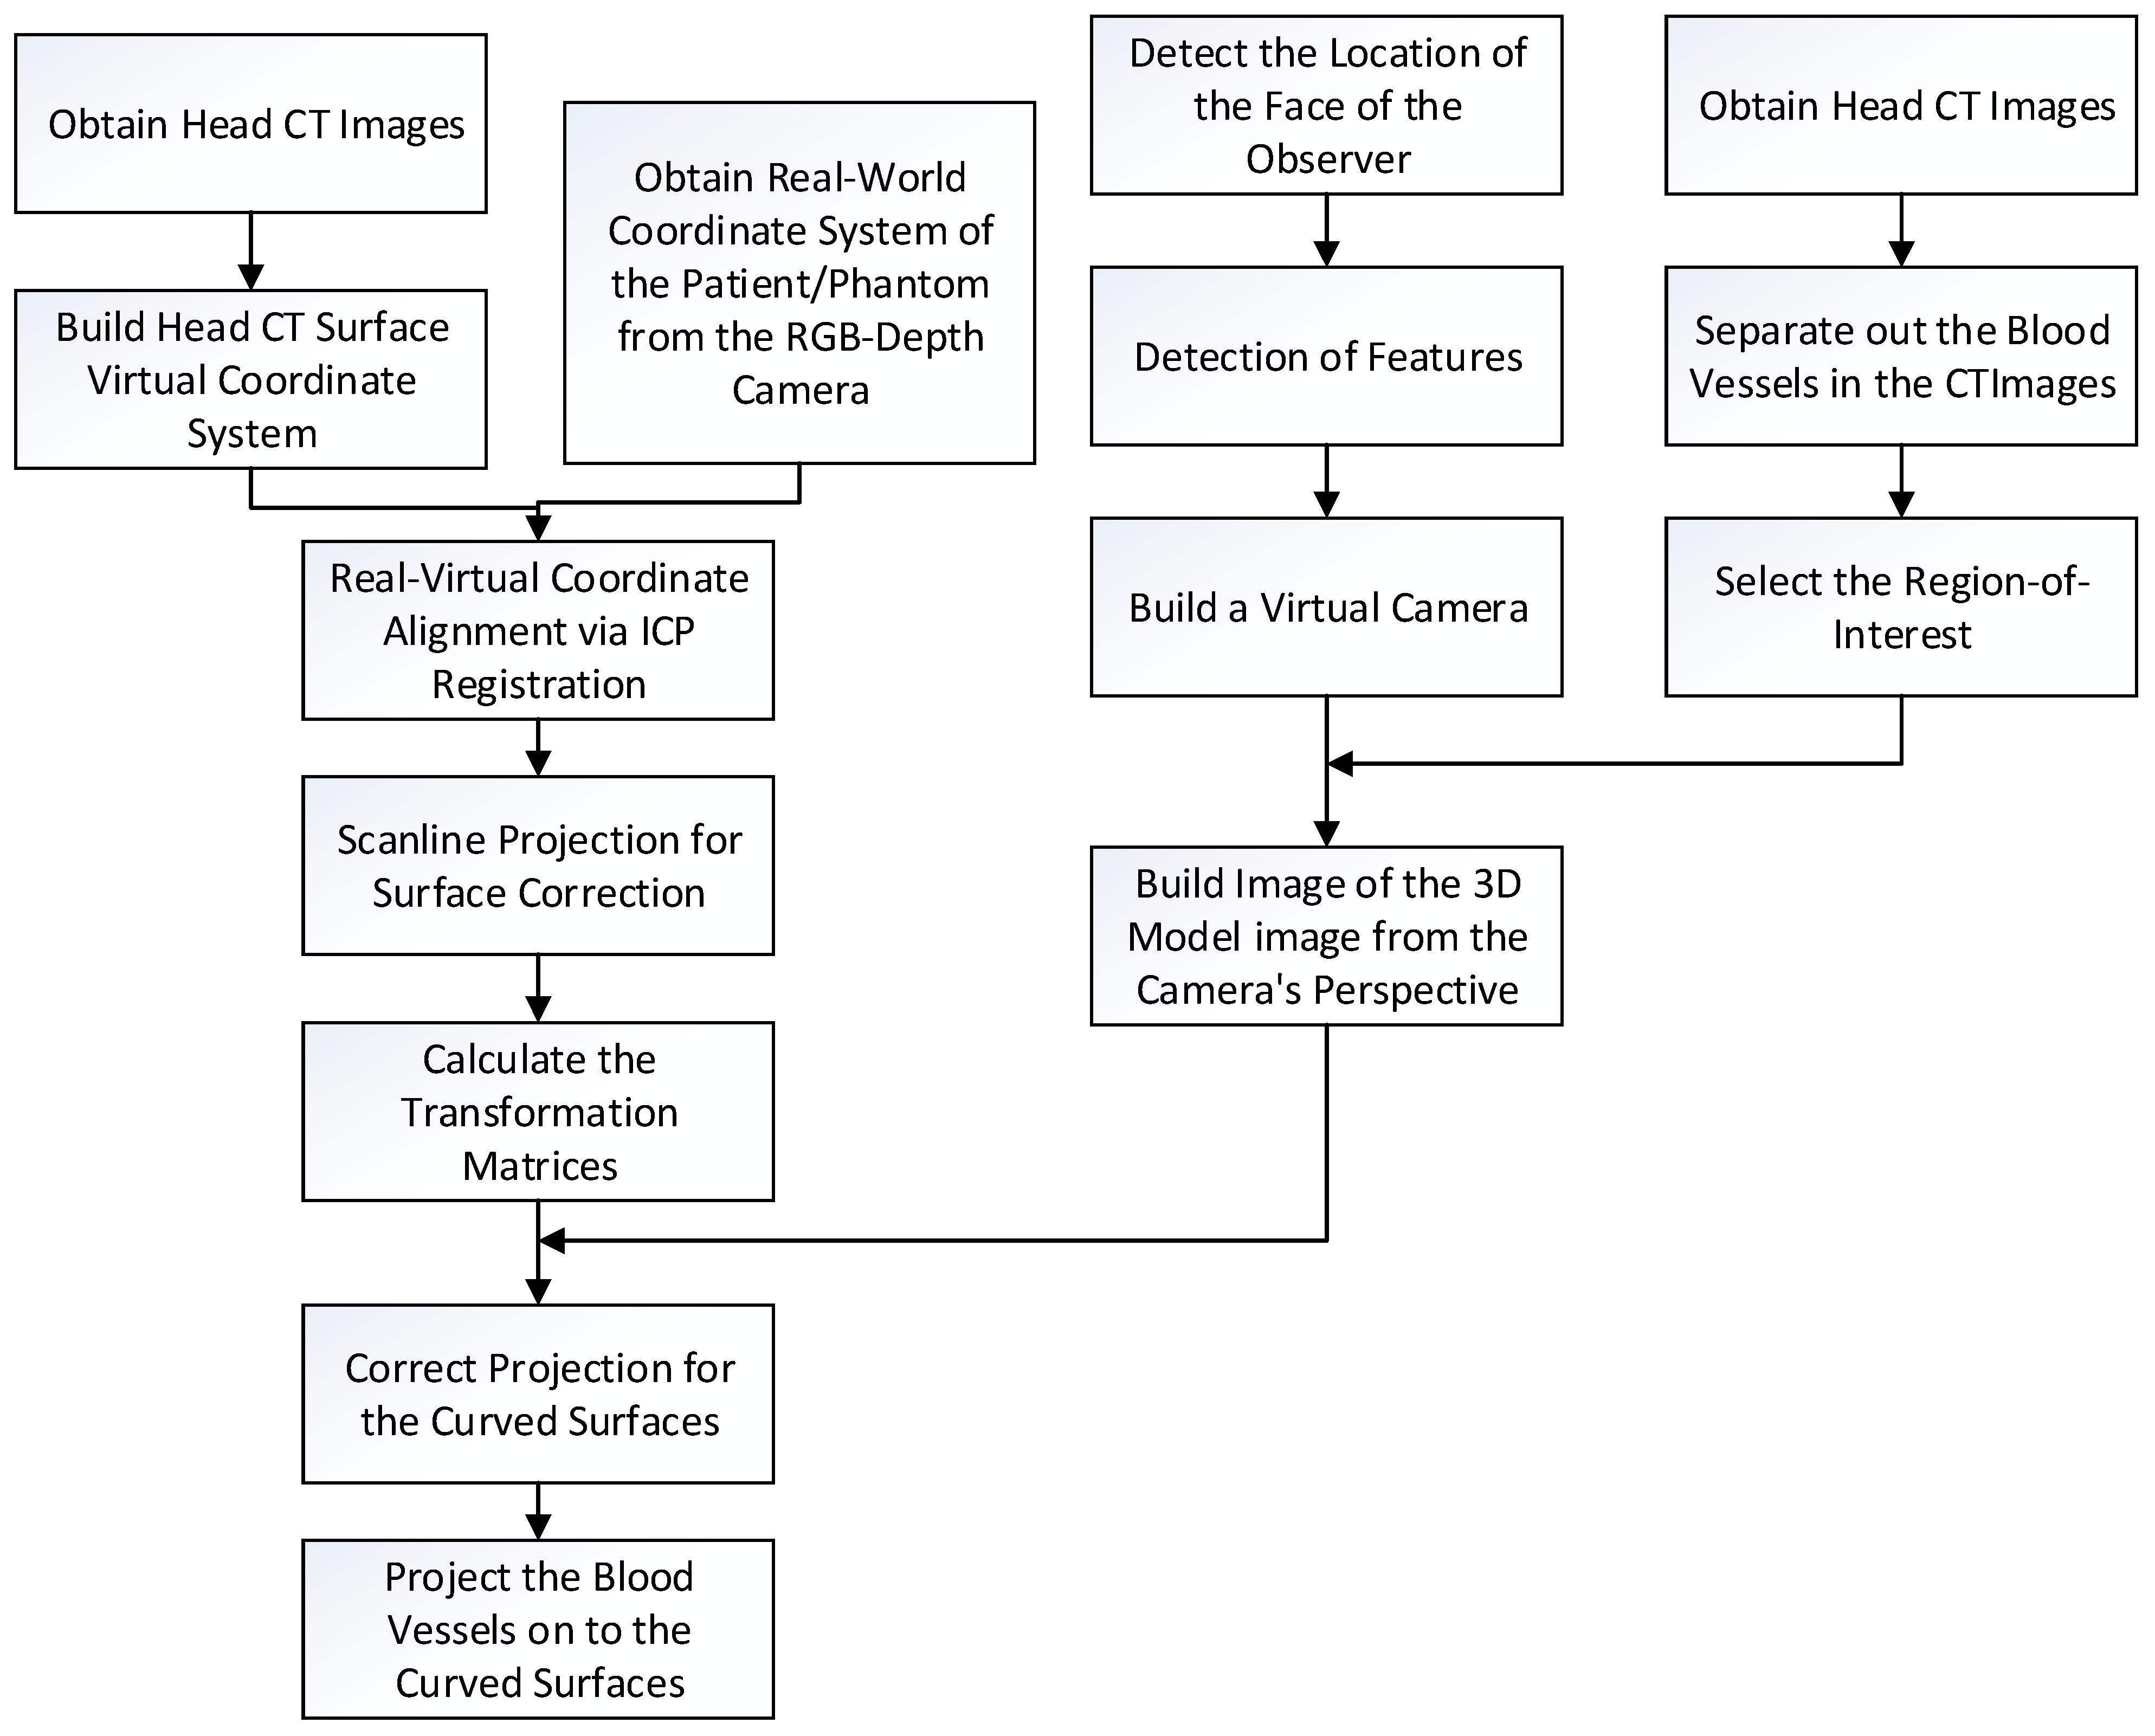
2. Methodology
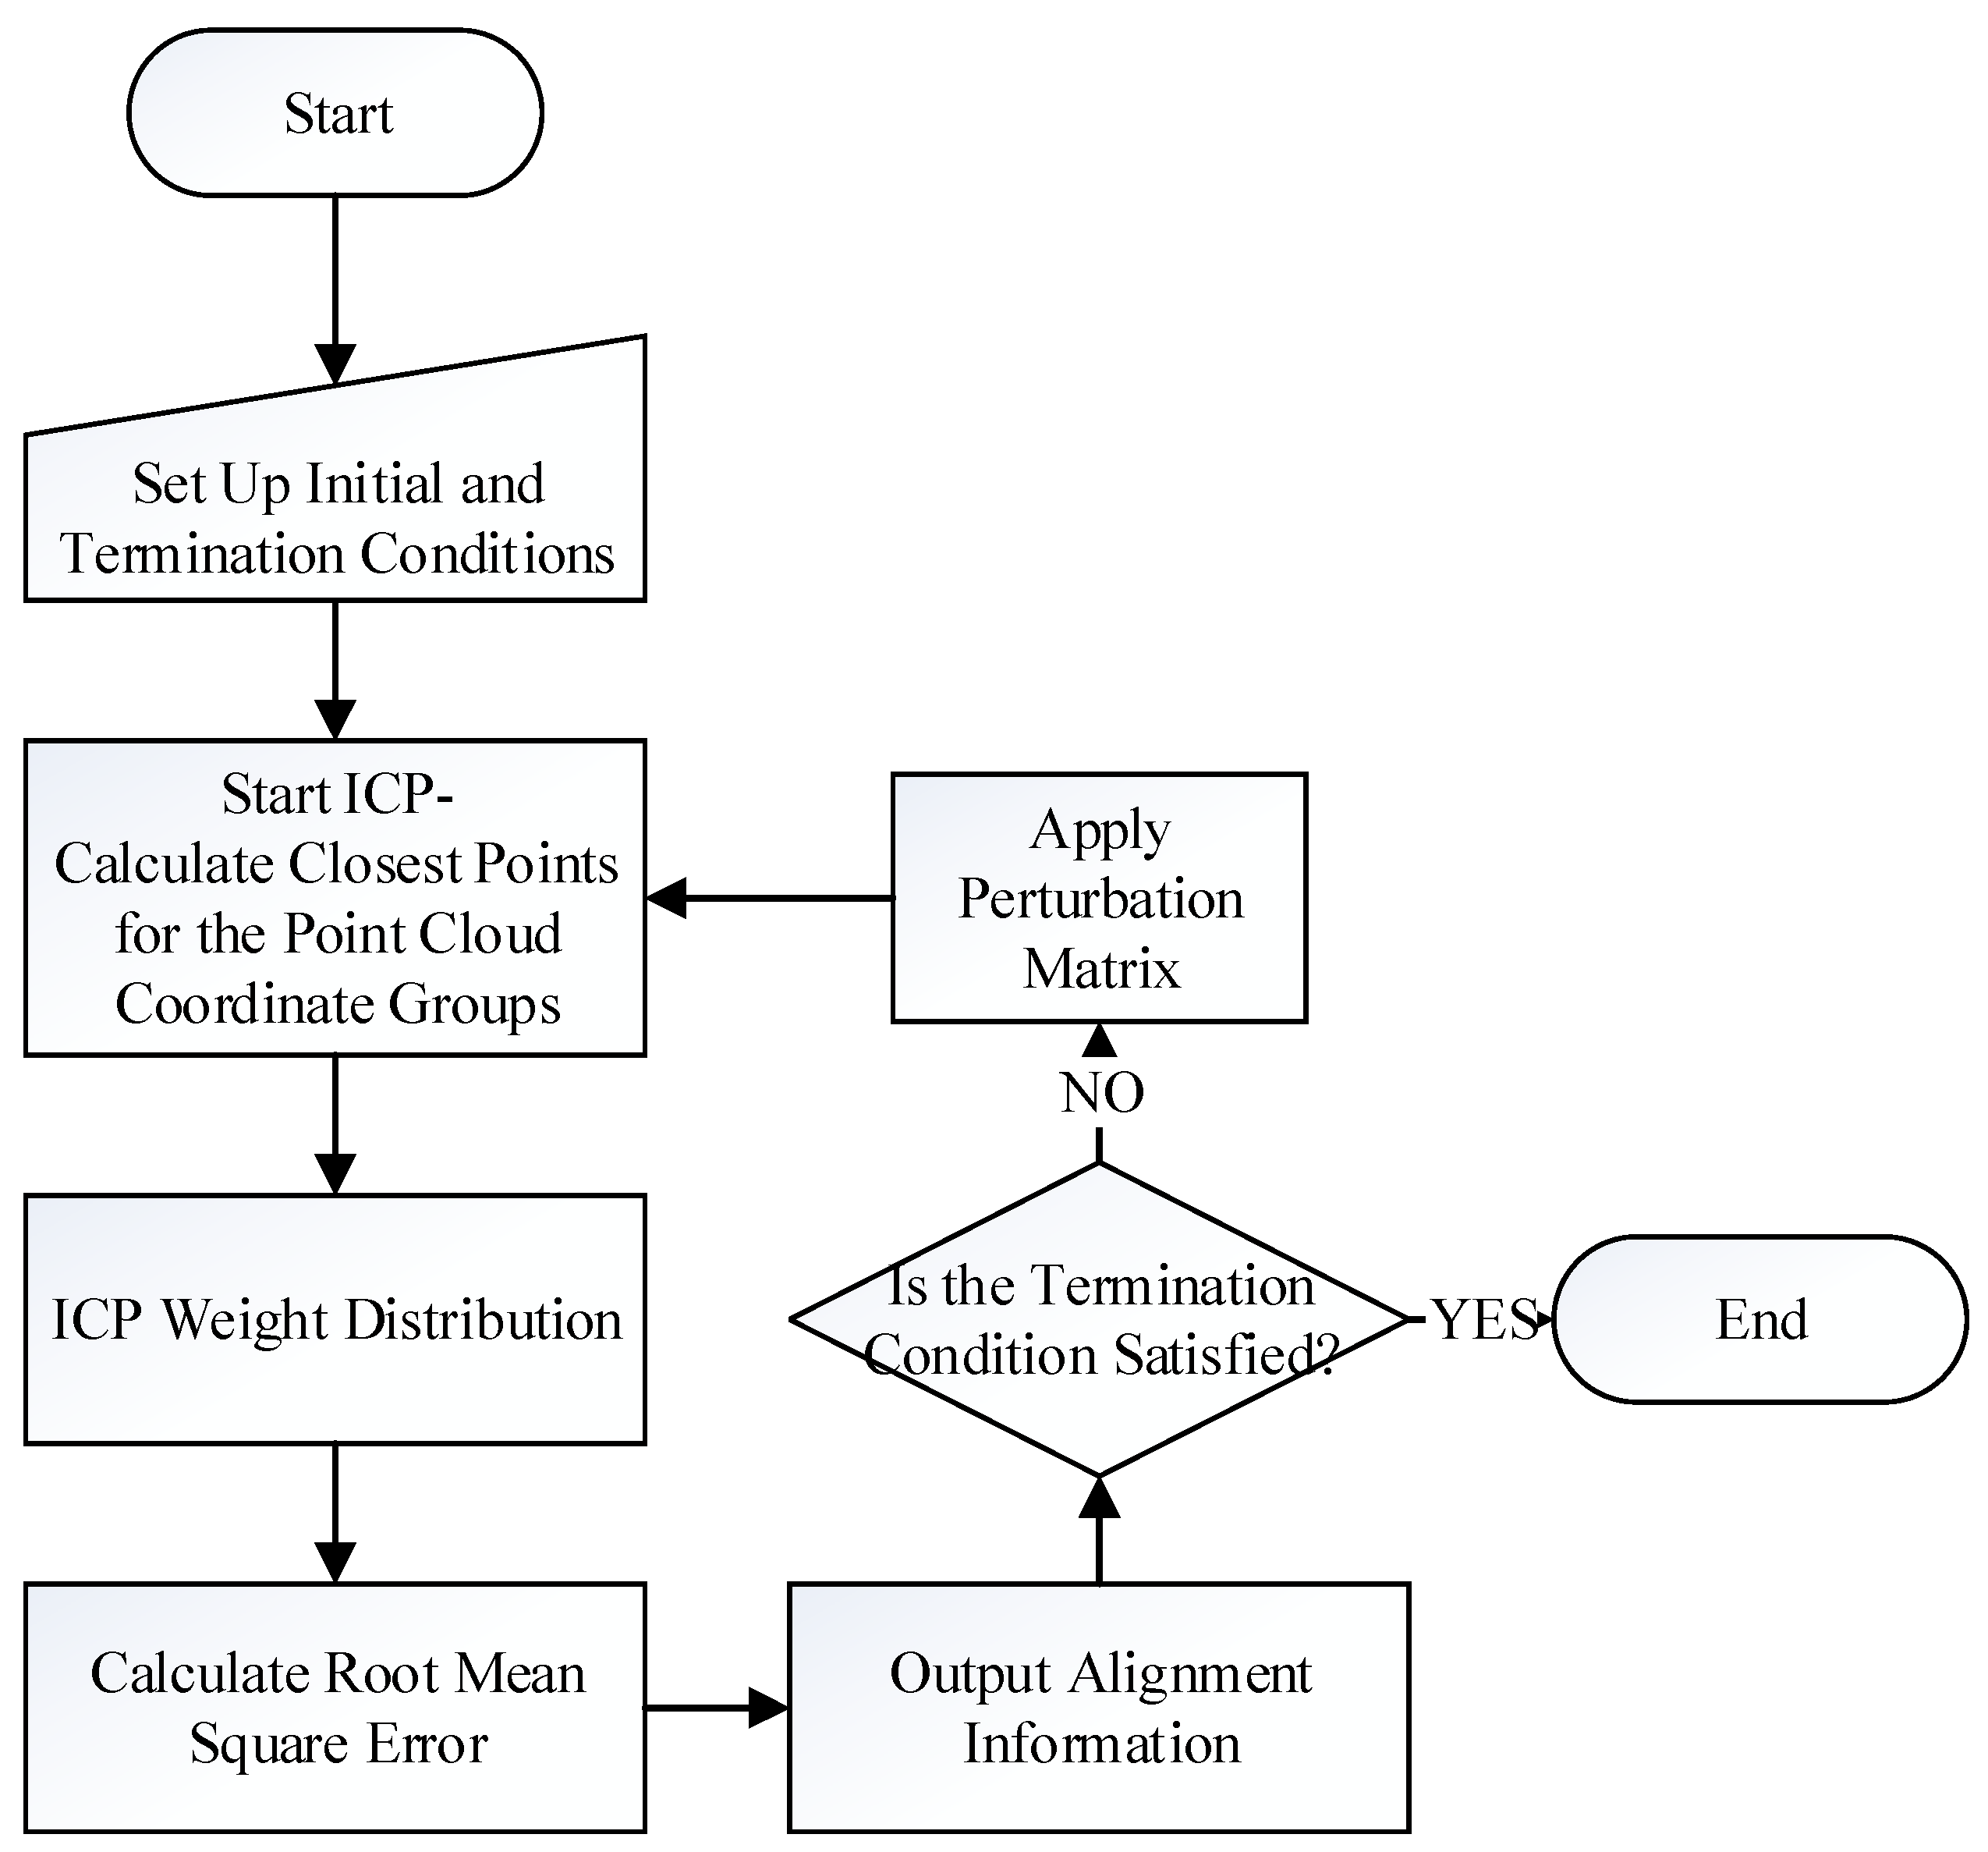
2.1. Image Alignment
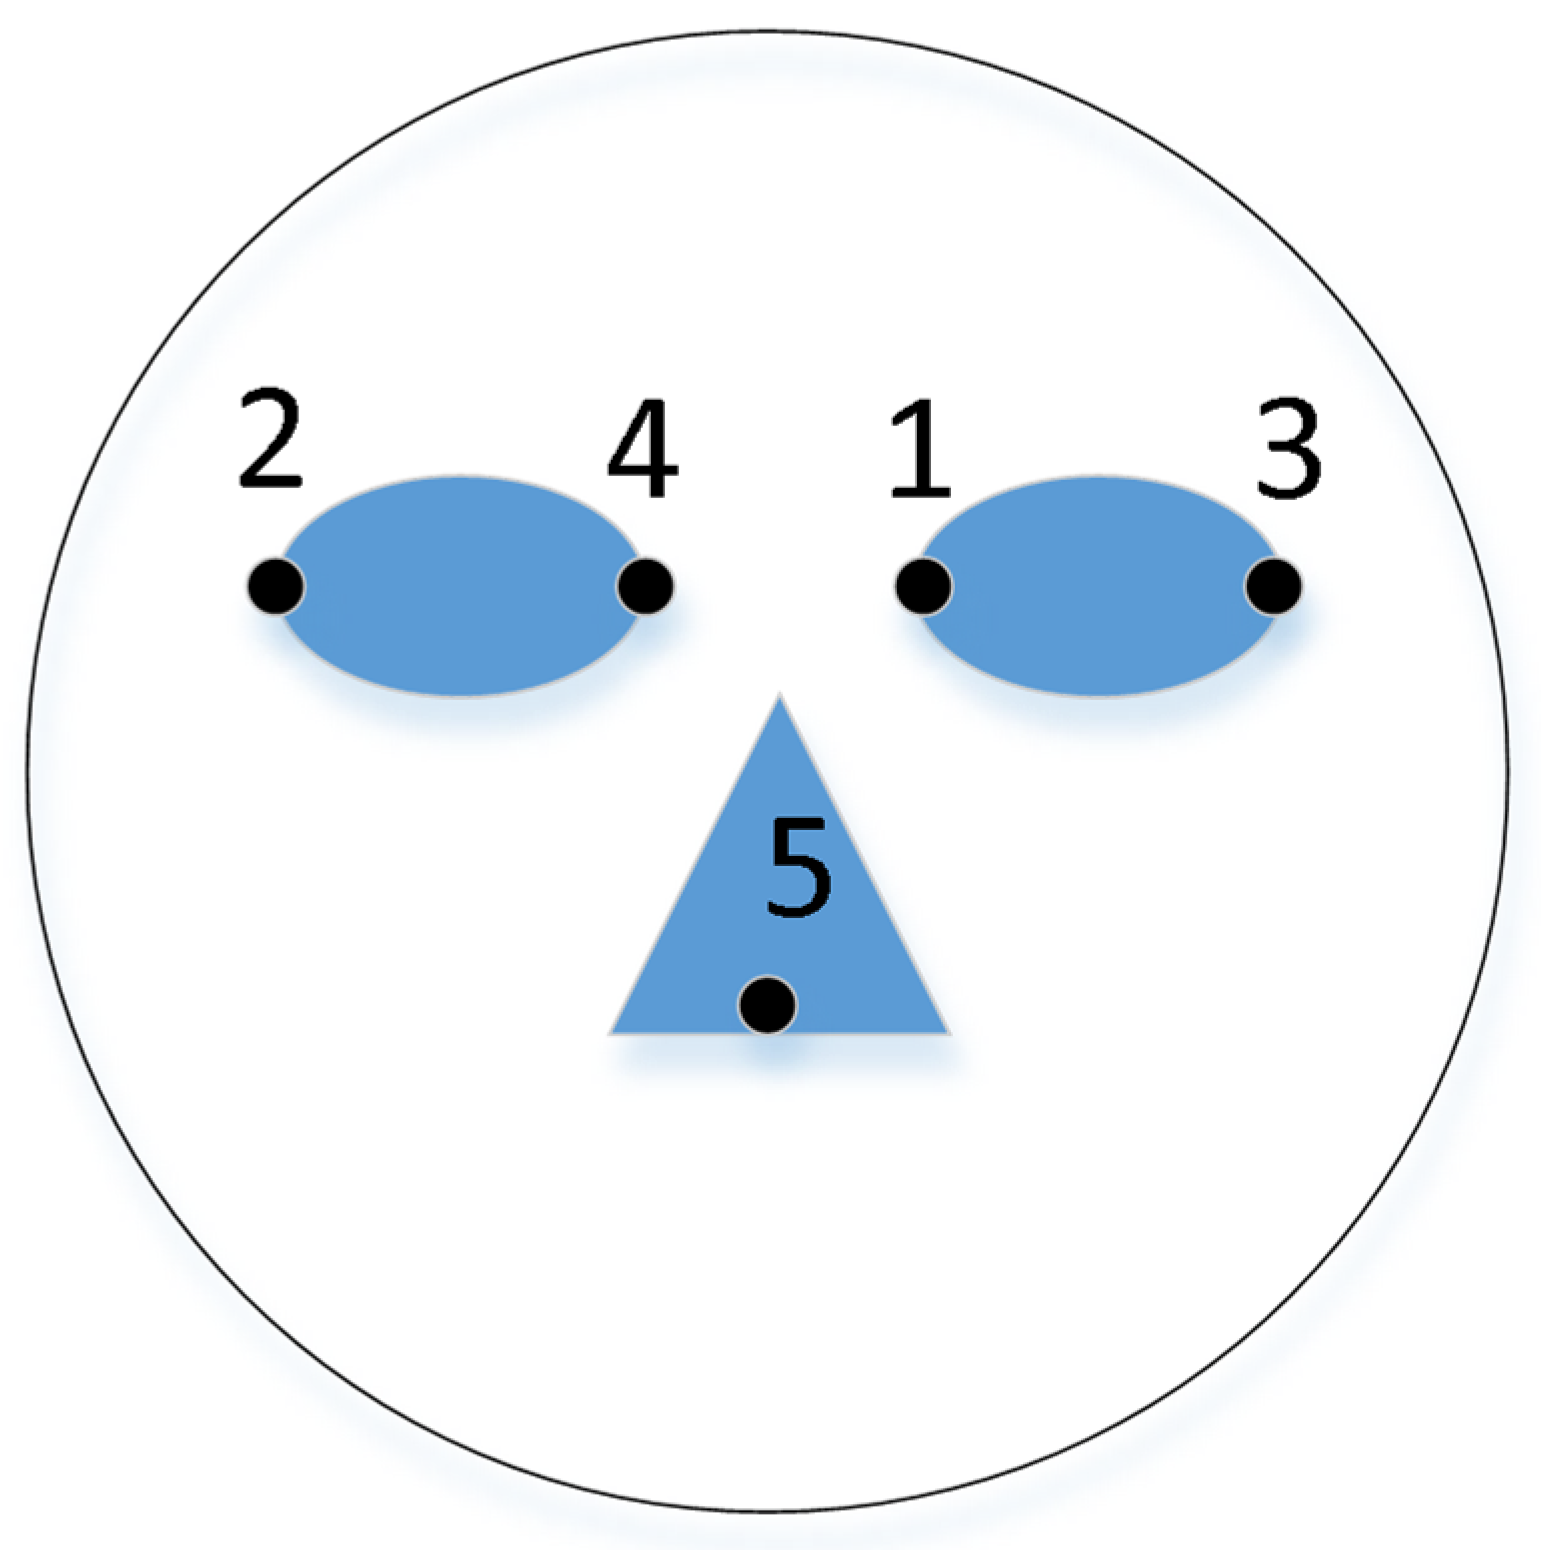
- Let the floating point group corresponding to the patient’s facial features, extracted from the camera image, be F, where F = {fi(x,y,z),1 ≤ i ≤ Nf}, and let the floating data point group corresponding to the facial features, extracted from the CT images, be R, where R = {rj(x,y,z),1 ≤ j ≤ Nr}.
- Pick a random point from F, assume it is f, and seek its closest corresponding point in R by calculating the minimum distance between f and R, d, as:where M is the normalizing constant.
- Calculate the median distance, Median, of all the distances. Assume the distances are re-arranged in order, then:
- Assign weight to each pair, based on the distance between each pair of points.
- Calculate the root mean squared error (RMS):
- Calculate and record the transformation matrix, T, of current pairs. If the termination condition, based on RMS, is reached, output T as the final transformation matrix. However, if the termination condition is not reached, but the RMS value is smaller than the previous iteration, then replace the optimal transformation matrix with the current T.
- If the termination condition is not reached, a perturbation mechanism is used; that is, applying a perturbation matrix on the current pairings. The probability of perturbation is based on the Gaussian distribution. The purpose of perturbation is allowing the search outside the current solution space, which may be small, and can allow for a locally optimum solution.
- Restart the ICP again.
2.2. Capture the Position of the Observer
2.3. Three Dimensional Model Surface Correction
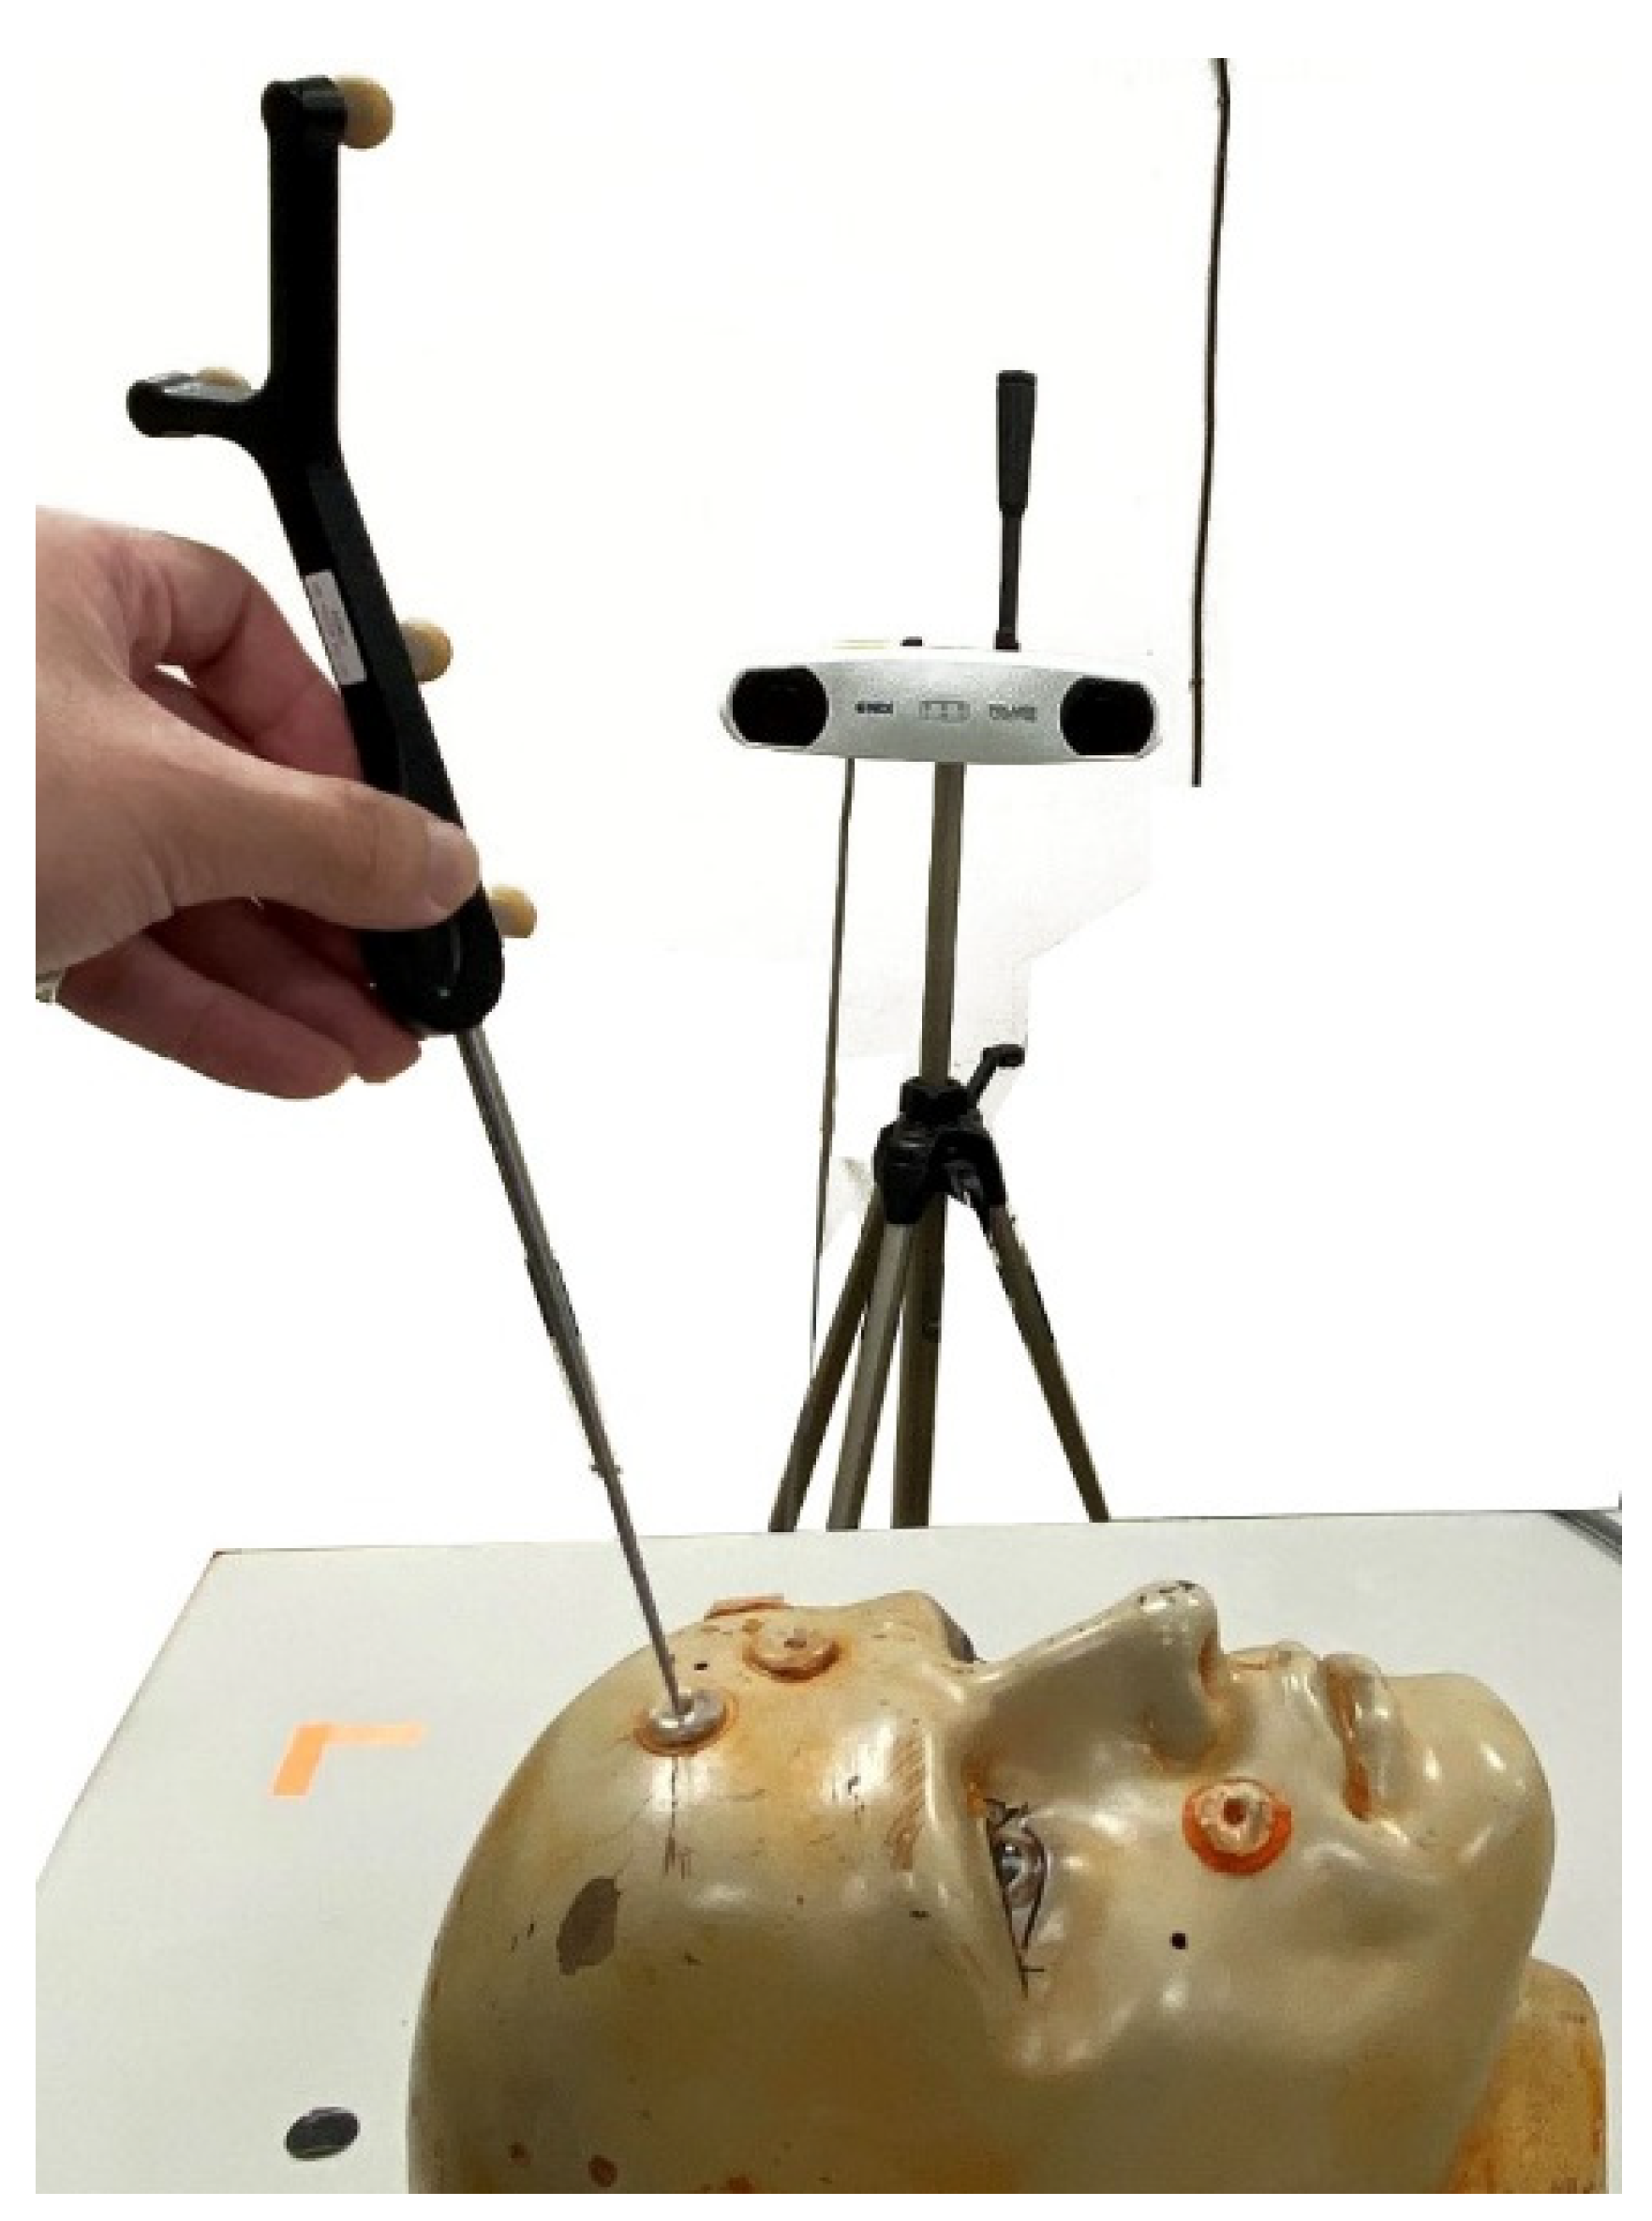
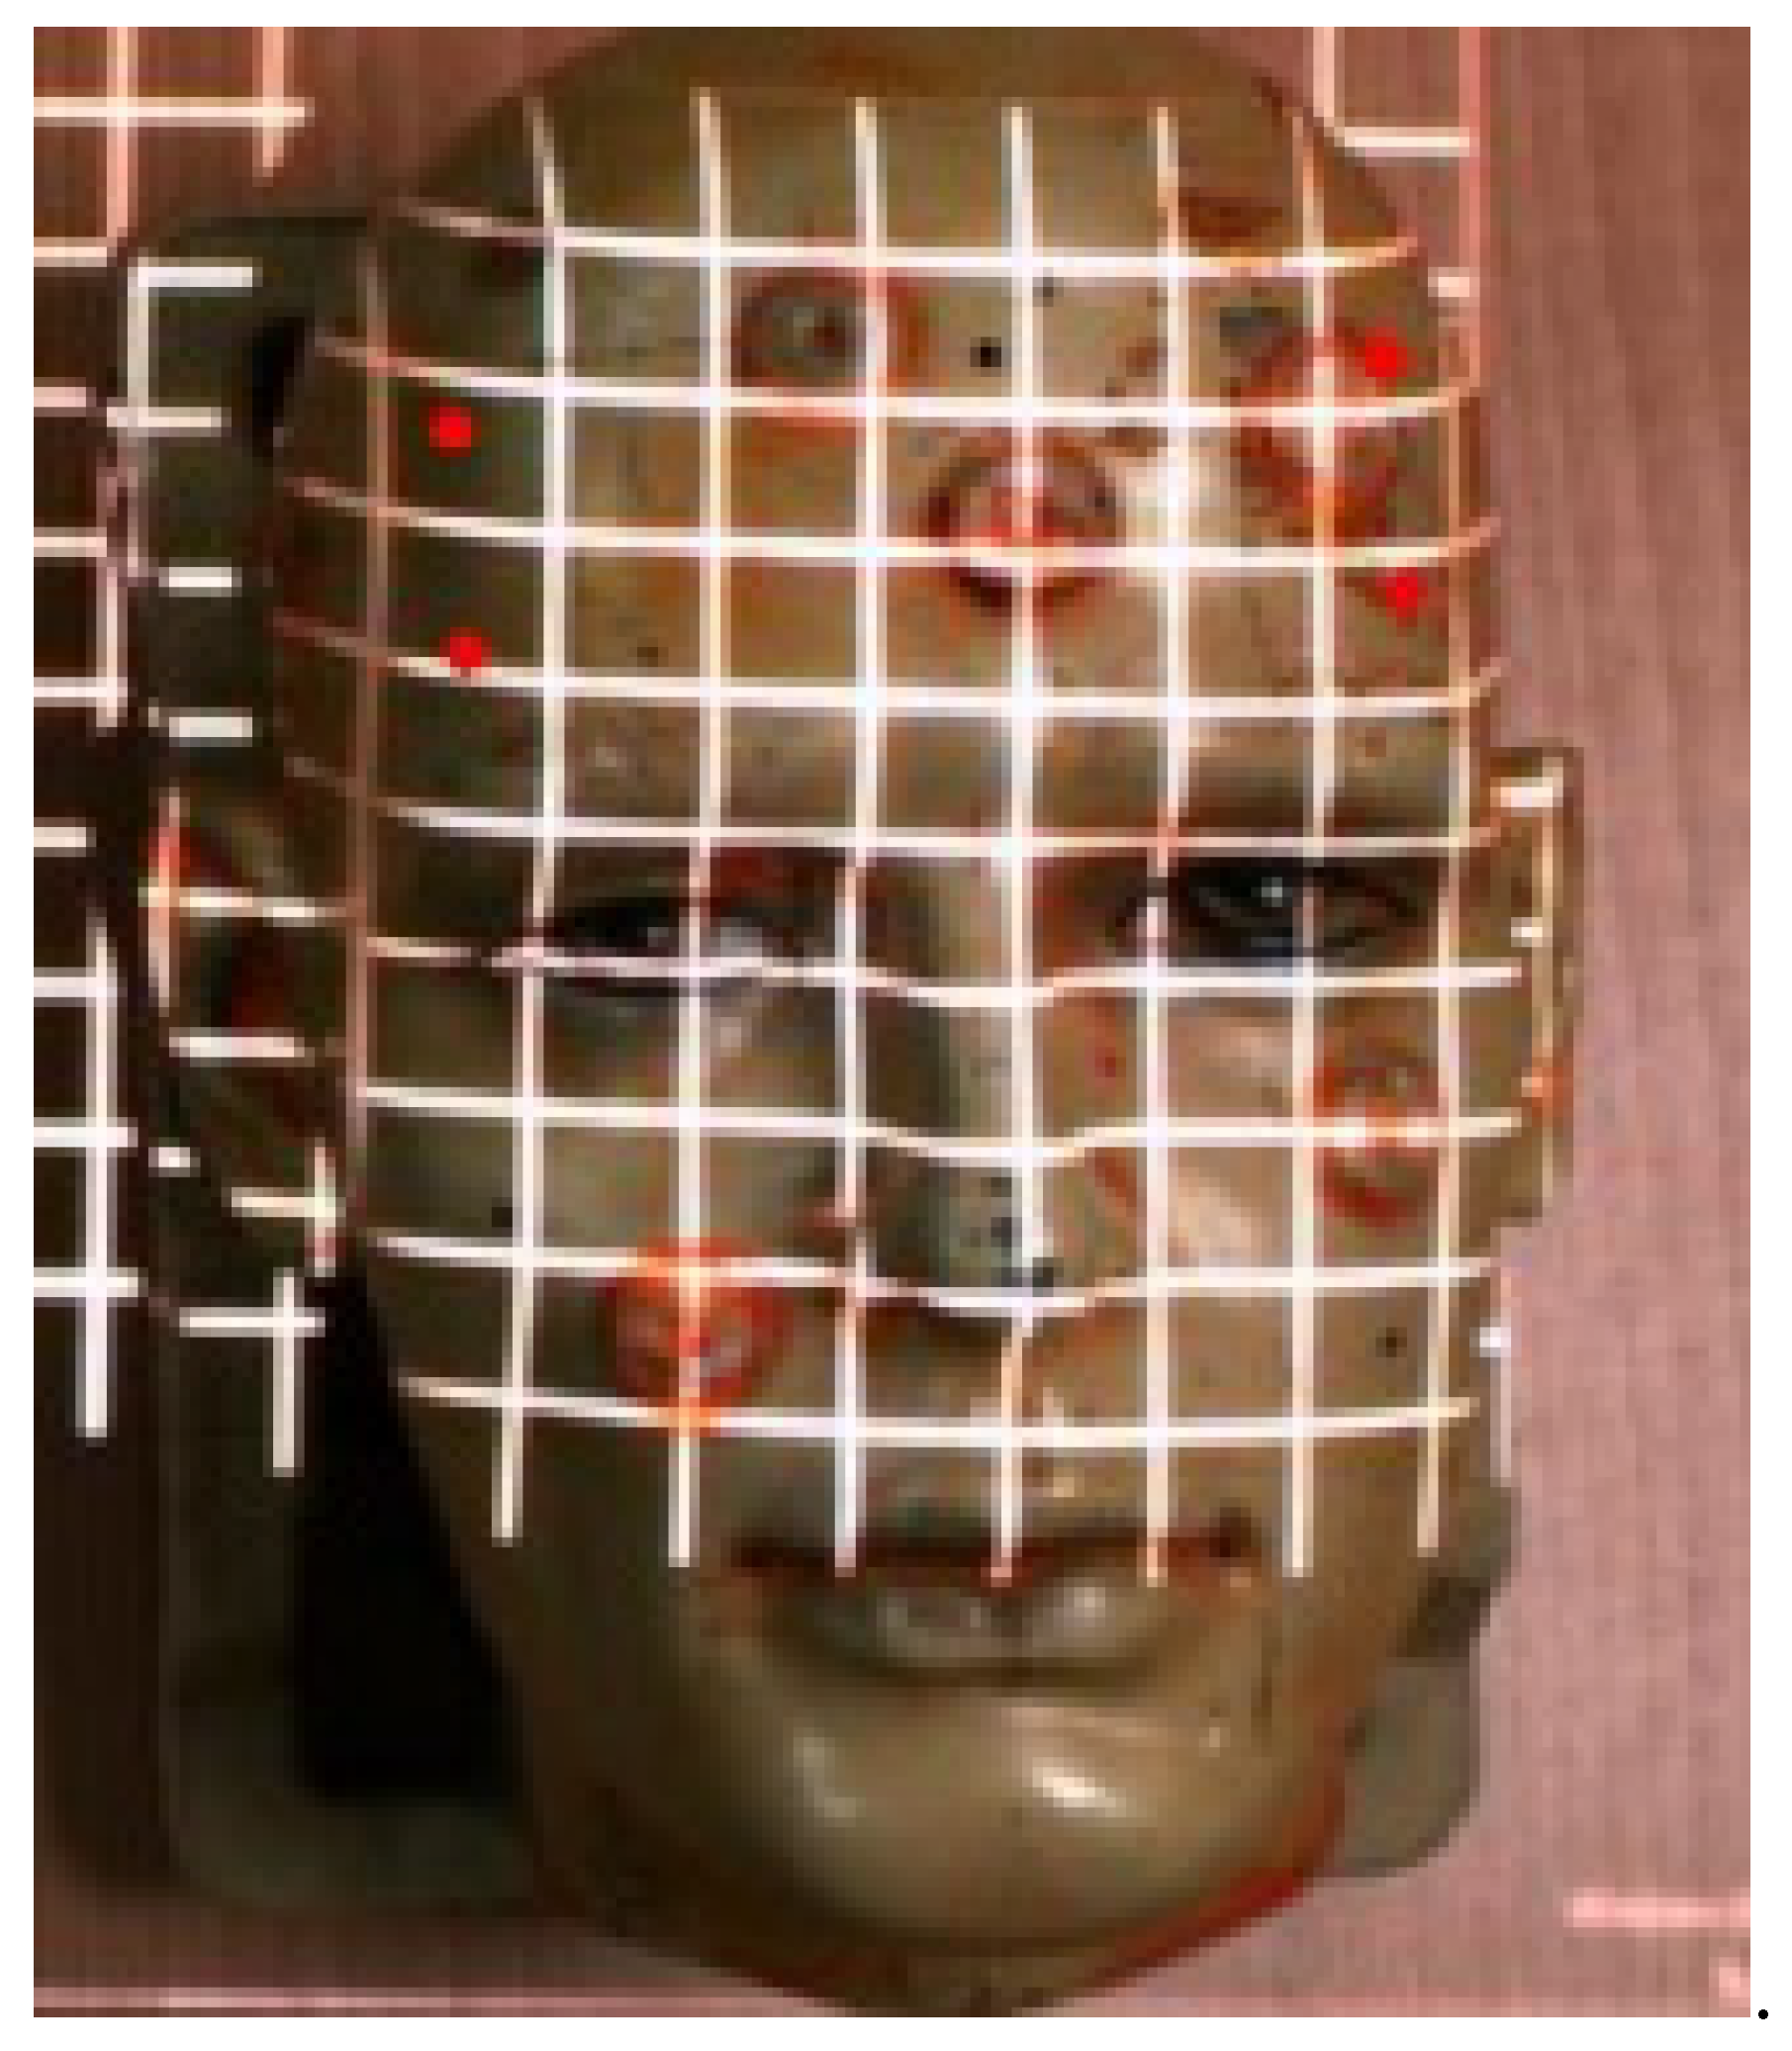
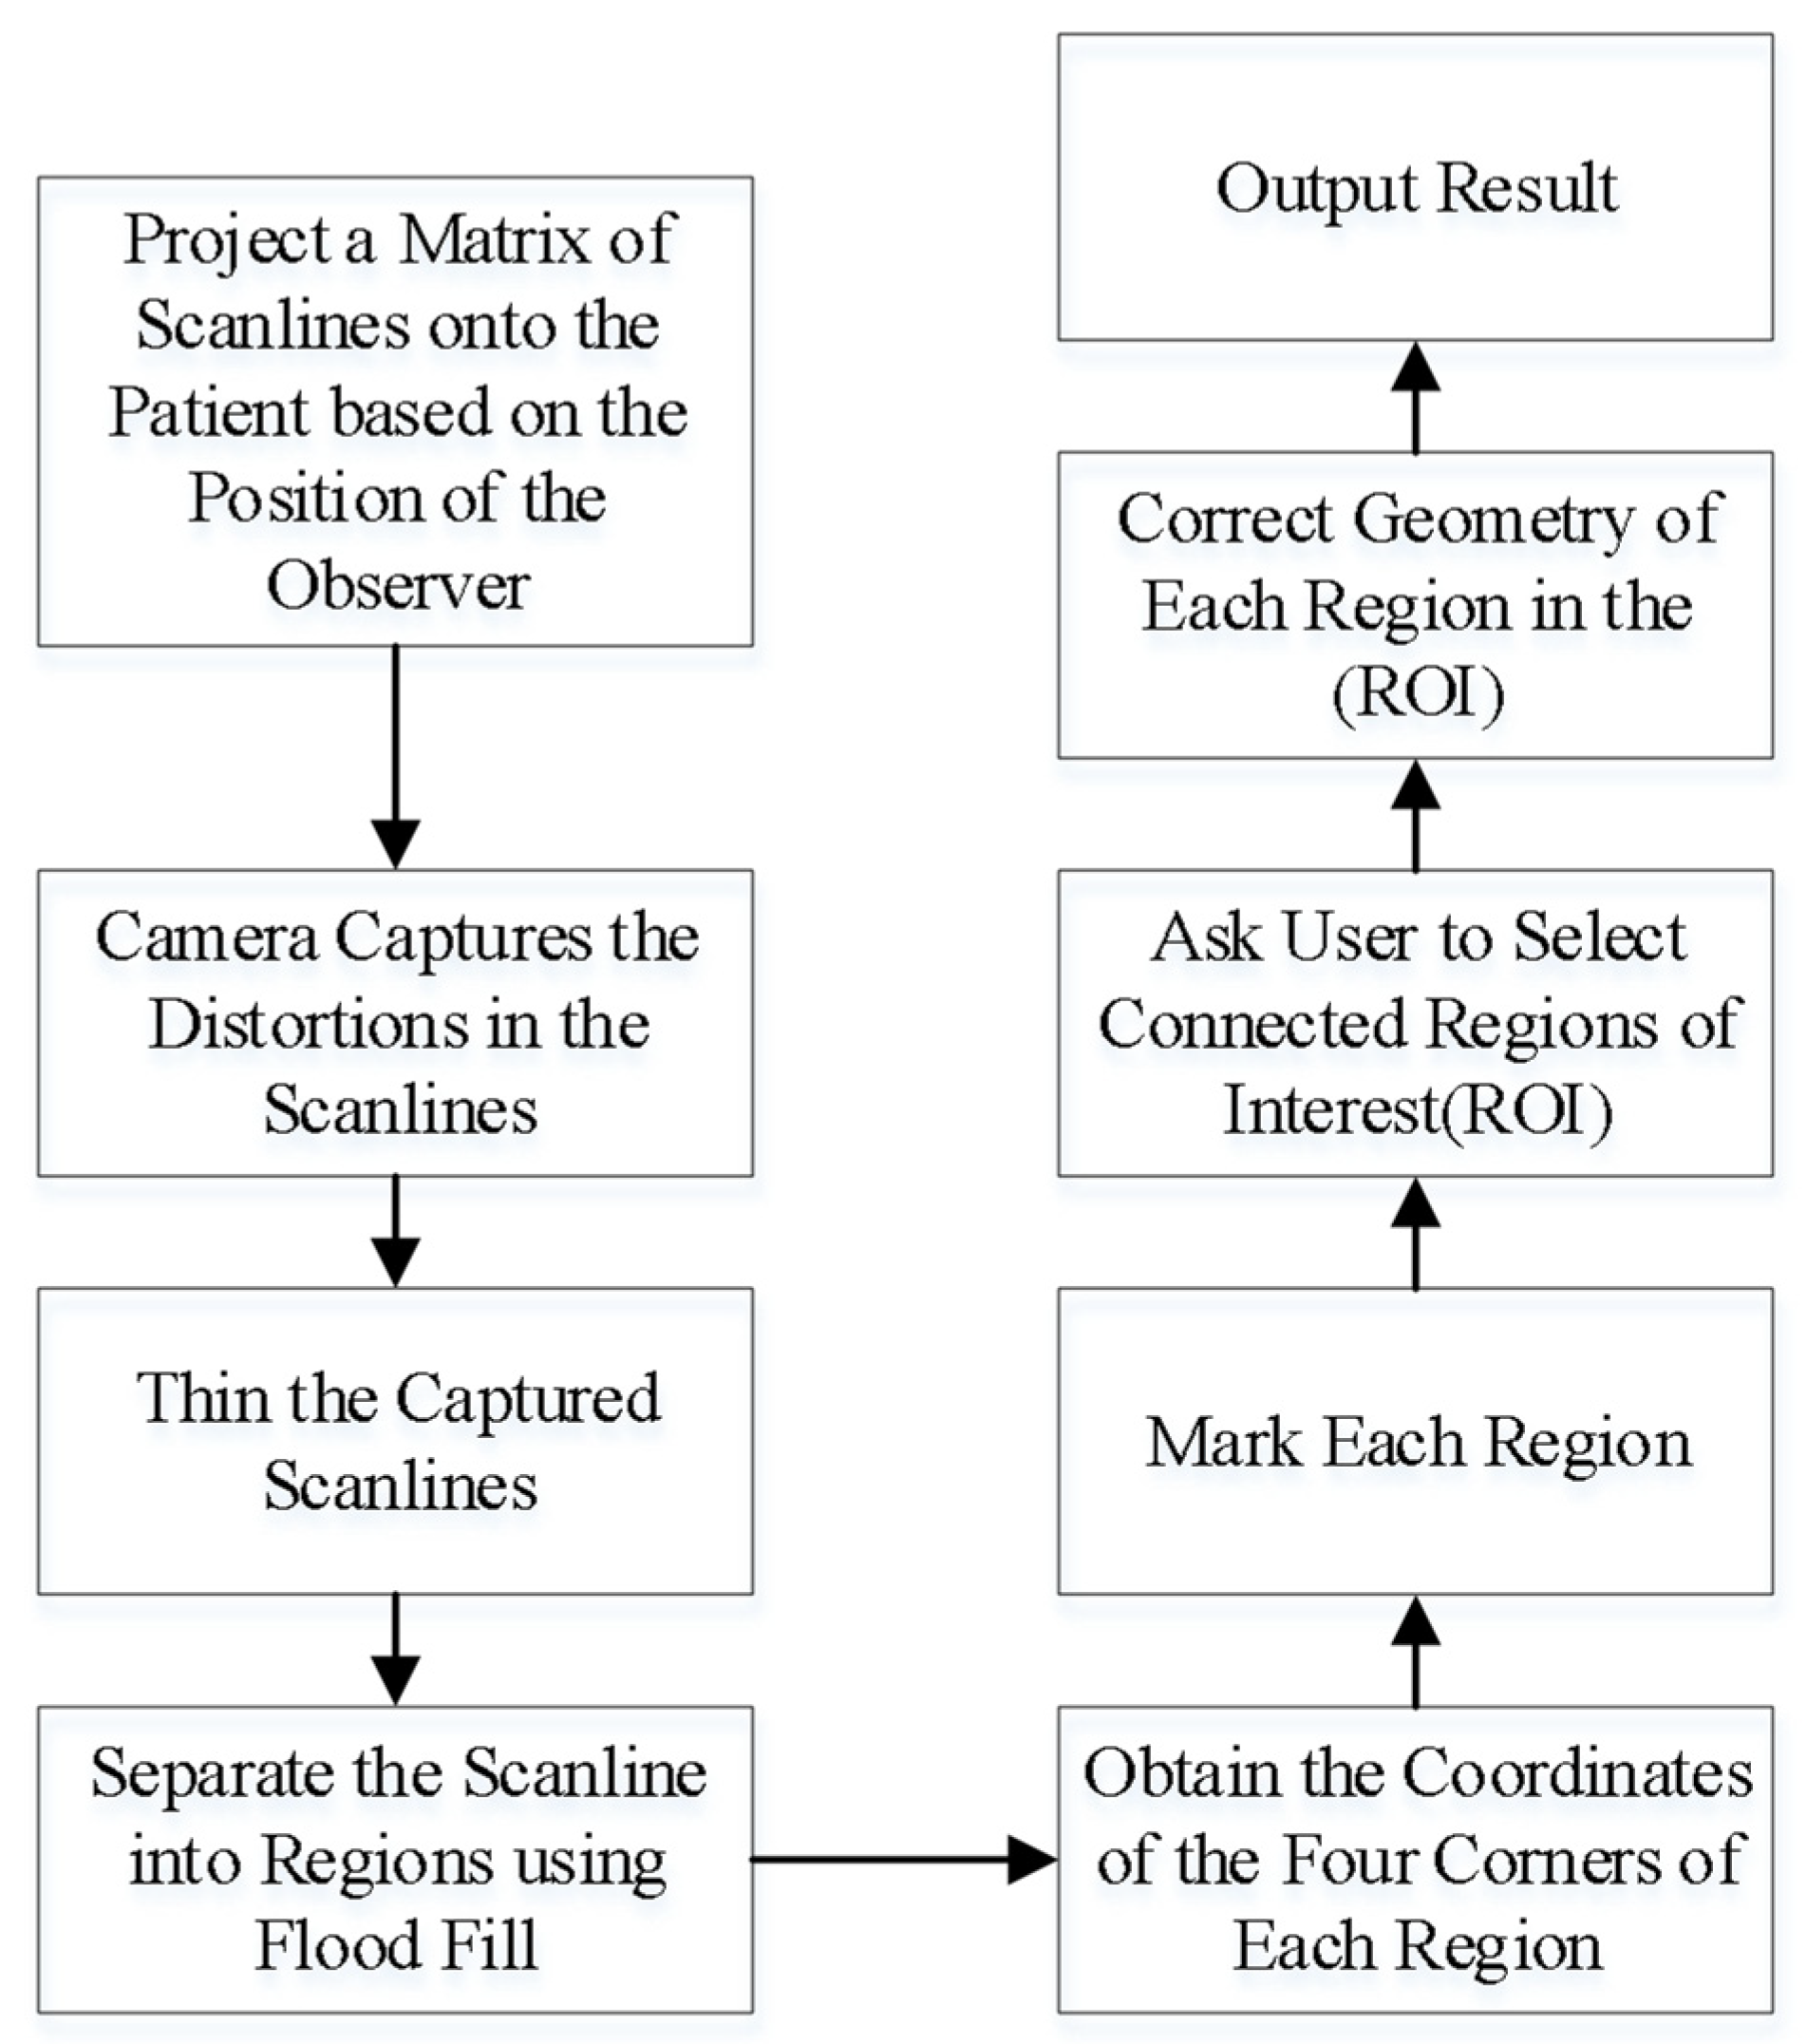
- Project a square matrix of scanlines onto the head of the patient or phantom.
- Use a video camera to capture the distortions of the scanlines on the surface. An example of the scanlines projected onto a head phantom is shown in Figure 6.
- Thin the captured scanlines in order to obtain a more accurate representation of the matrix, obtaining a matrix of regions.
- Determine which regions are still fully closed by using the flood filling algorithm from the center of each region. This is useful for obtaining the coordinates of the intersections of the scanlines.
- Mark out each region and obtain the coordinates of the intersections.
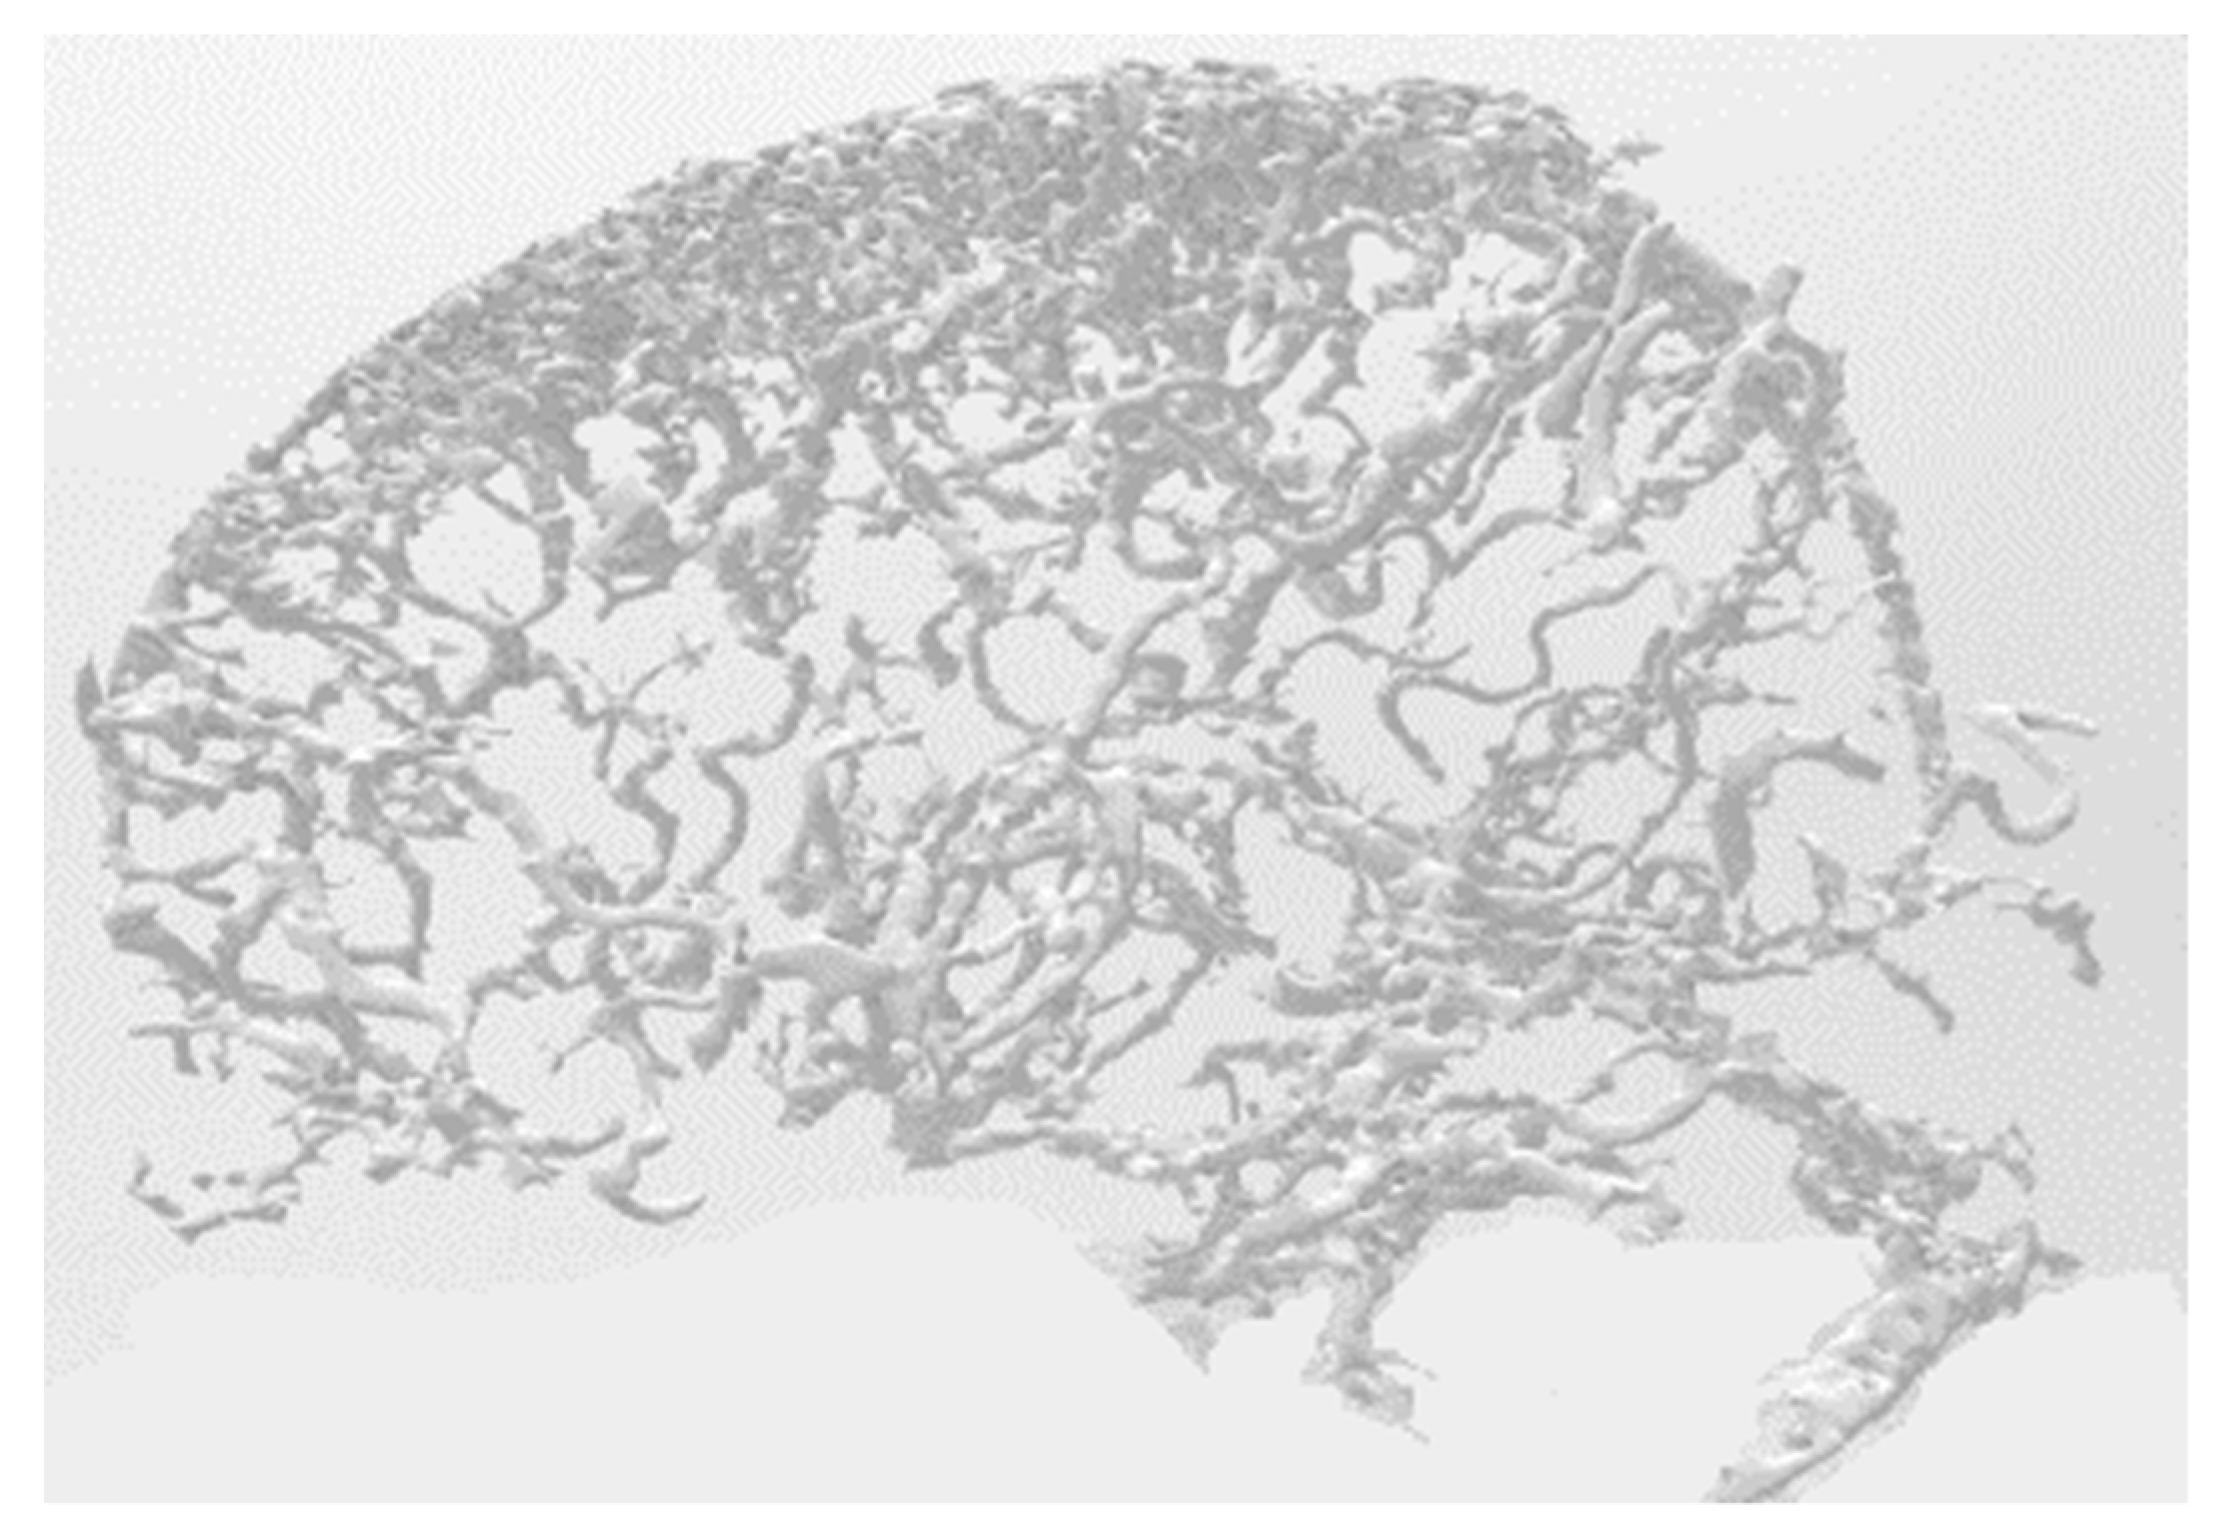
- In order to reduce calculations, the user is asked to mark out regions of interest (ROI).
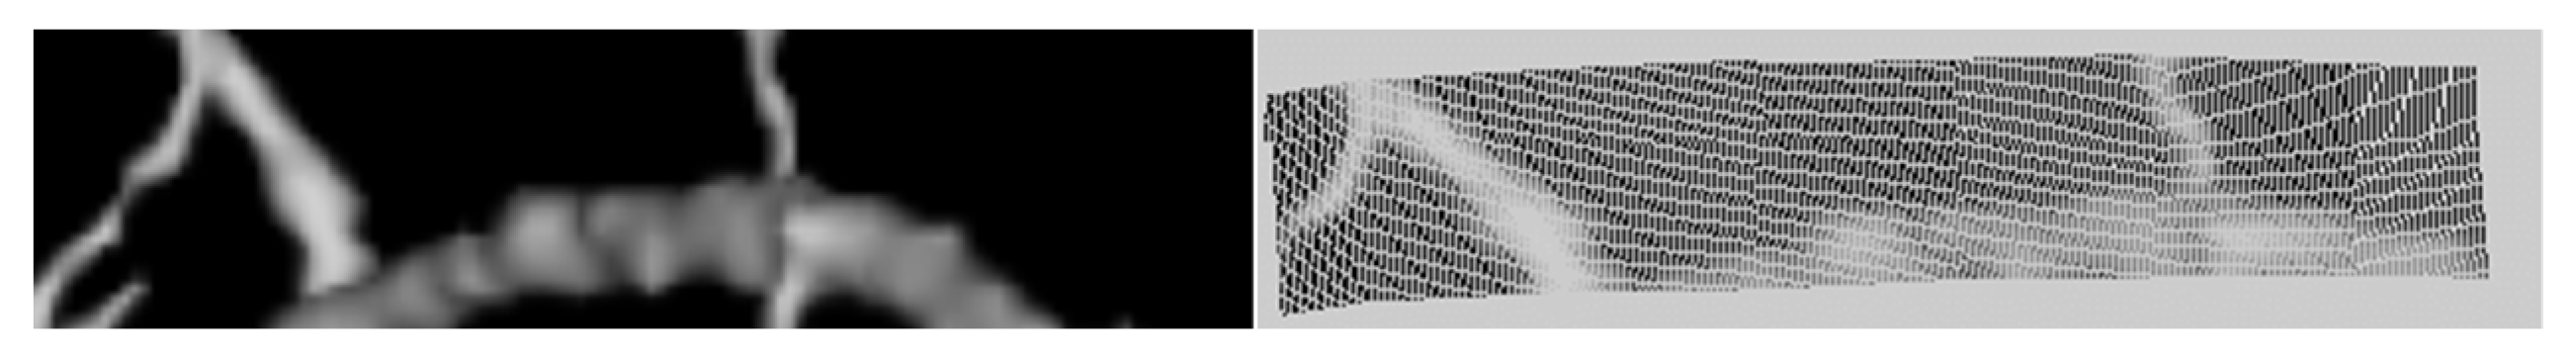
- Geometric corrections are performed for each region in the ROI. An example of a blood vessel before and after adjustment is shown in Figure 7.
- Project the result.
3. Experimental Results
3.1. Experiments for Speed
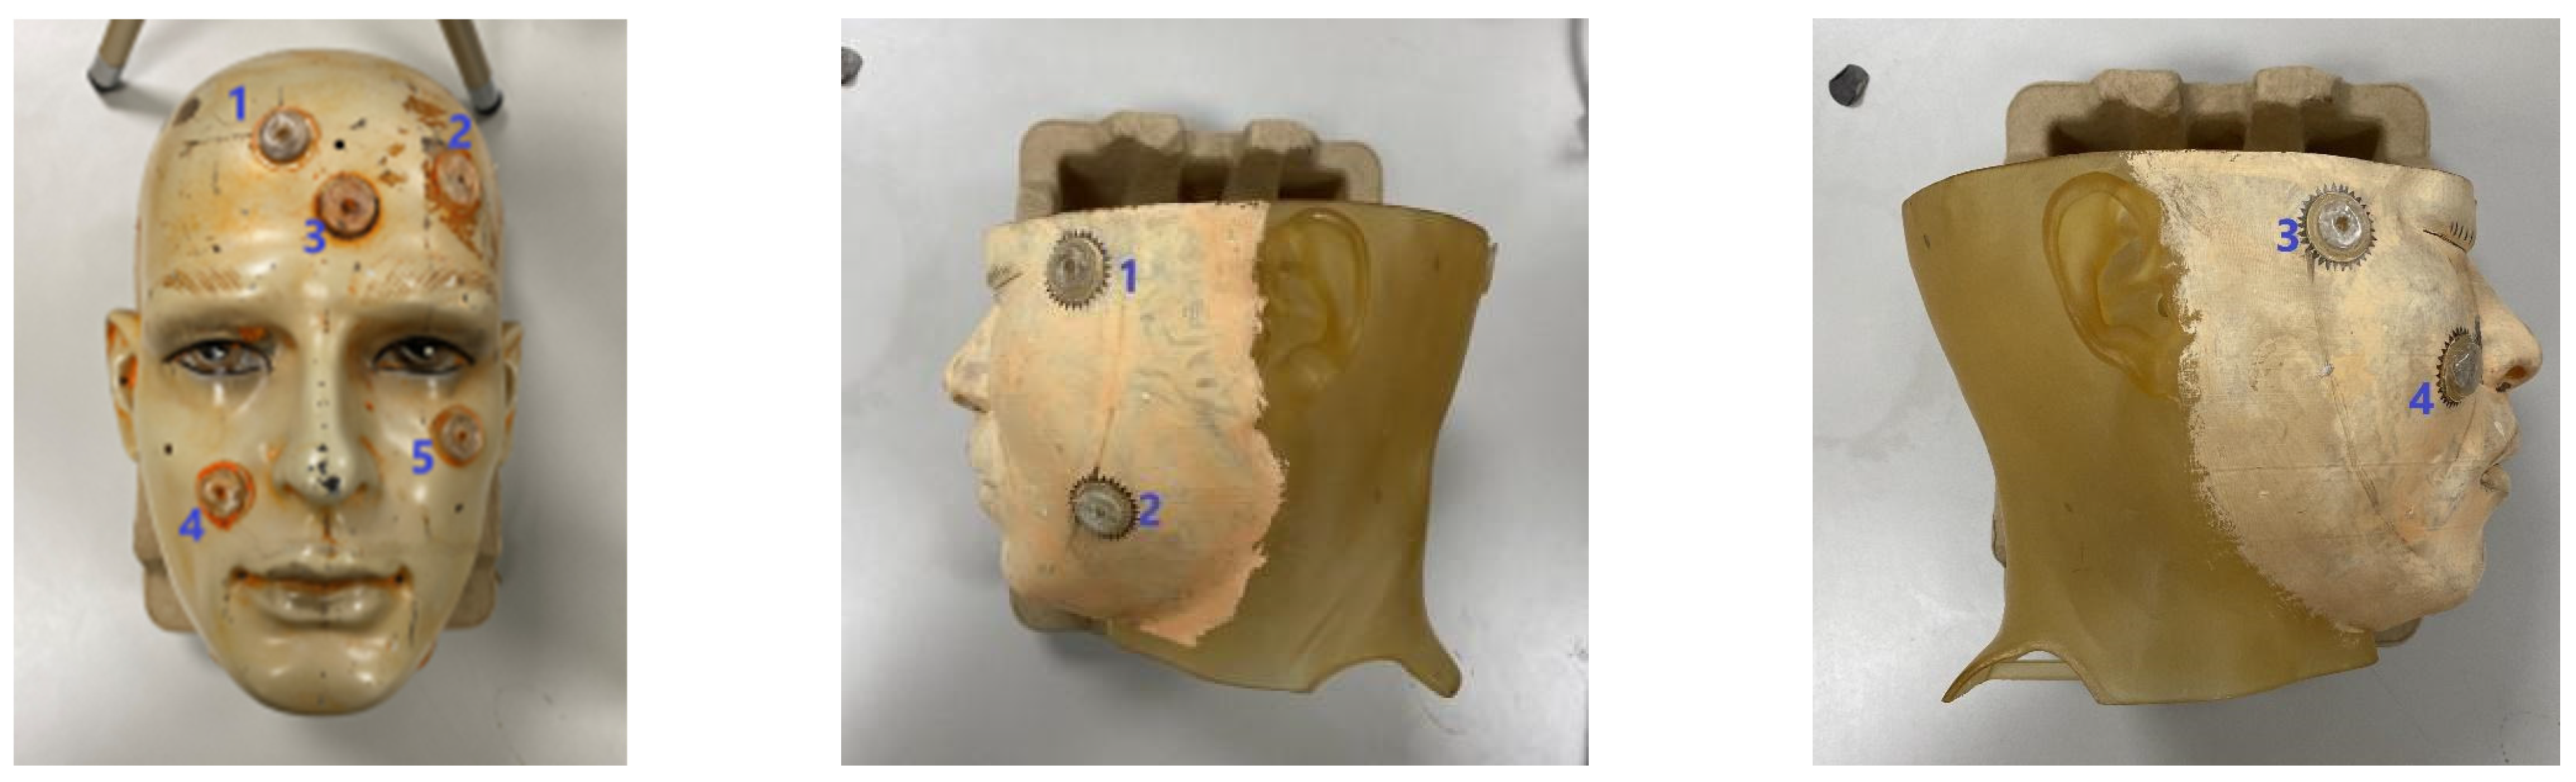
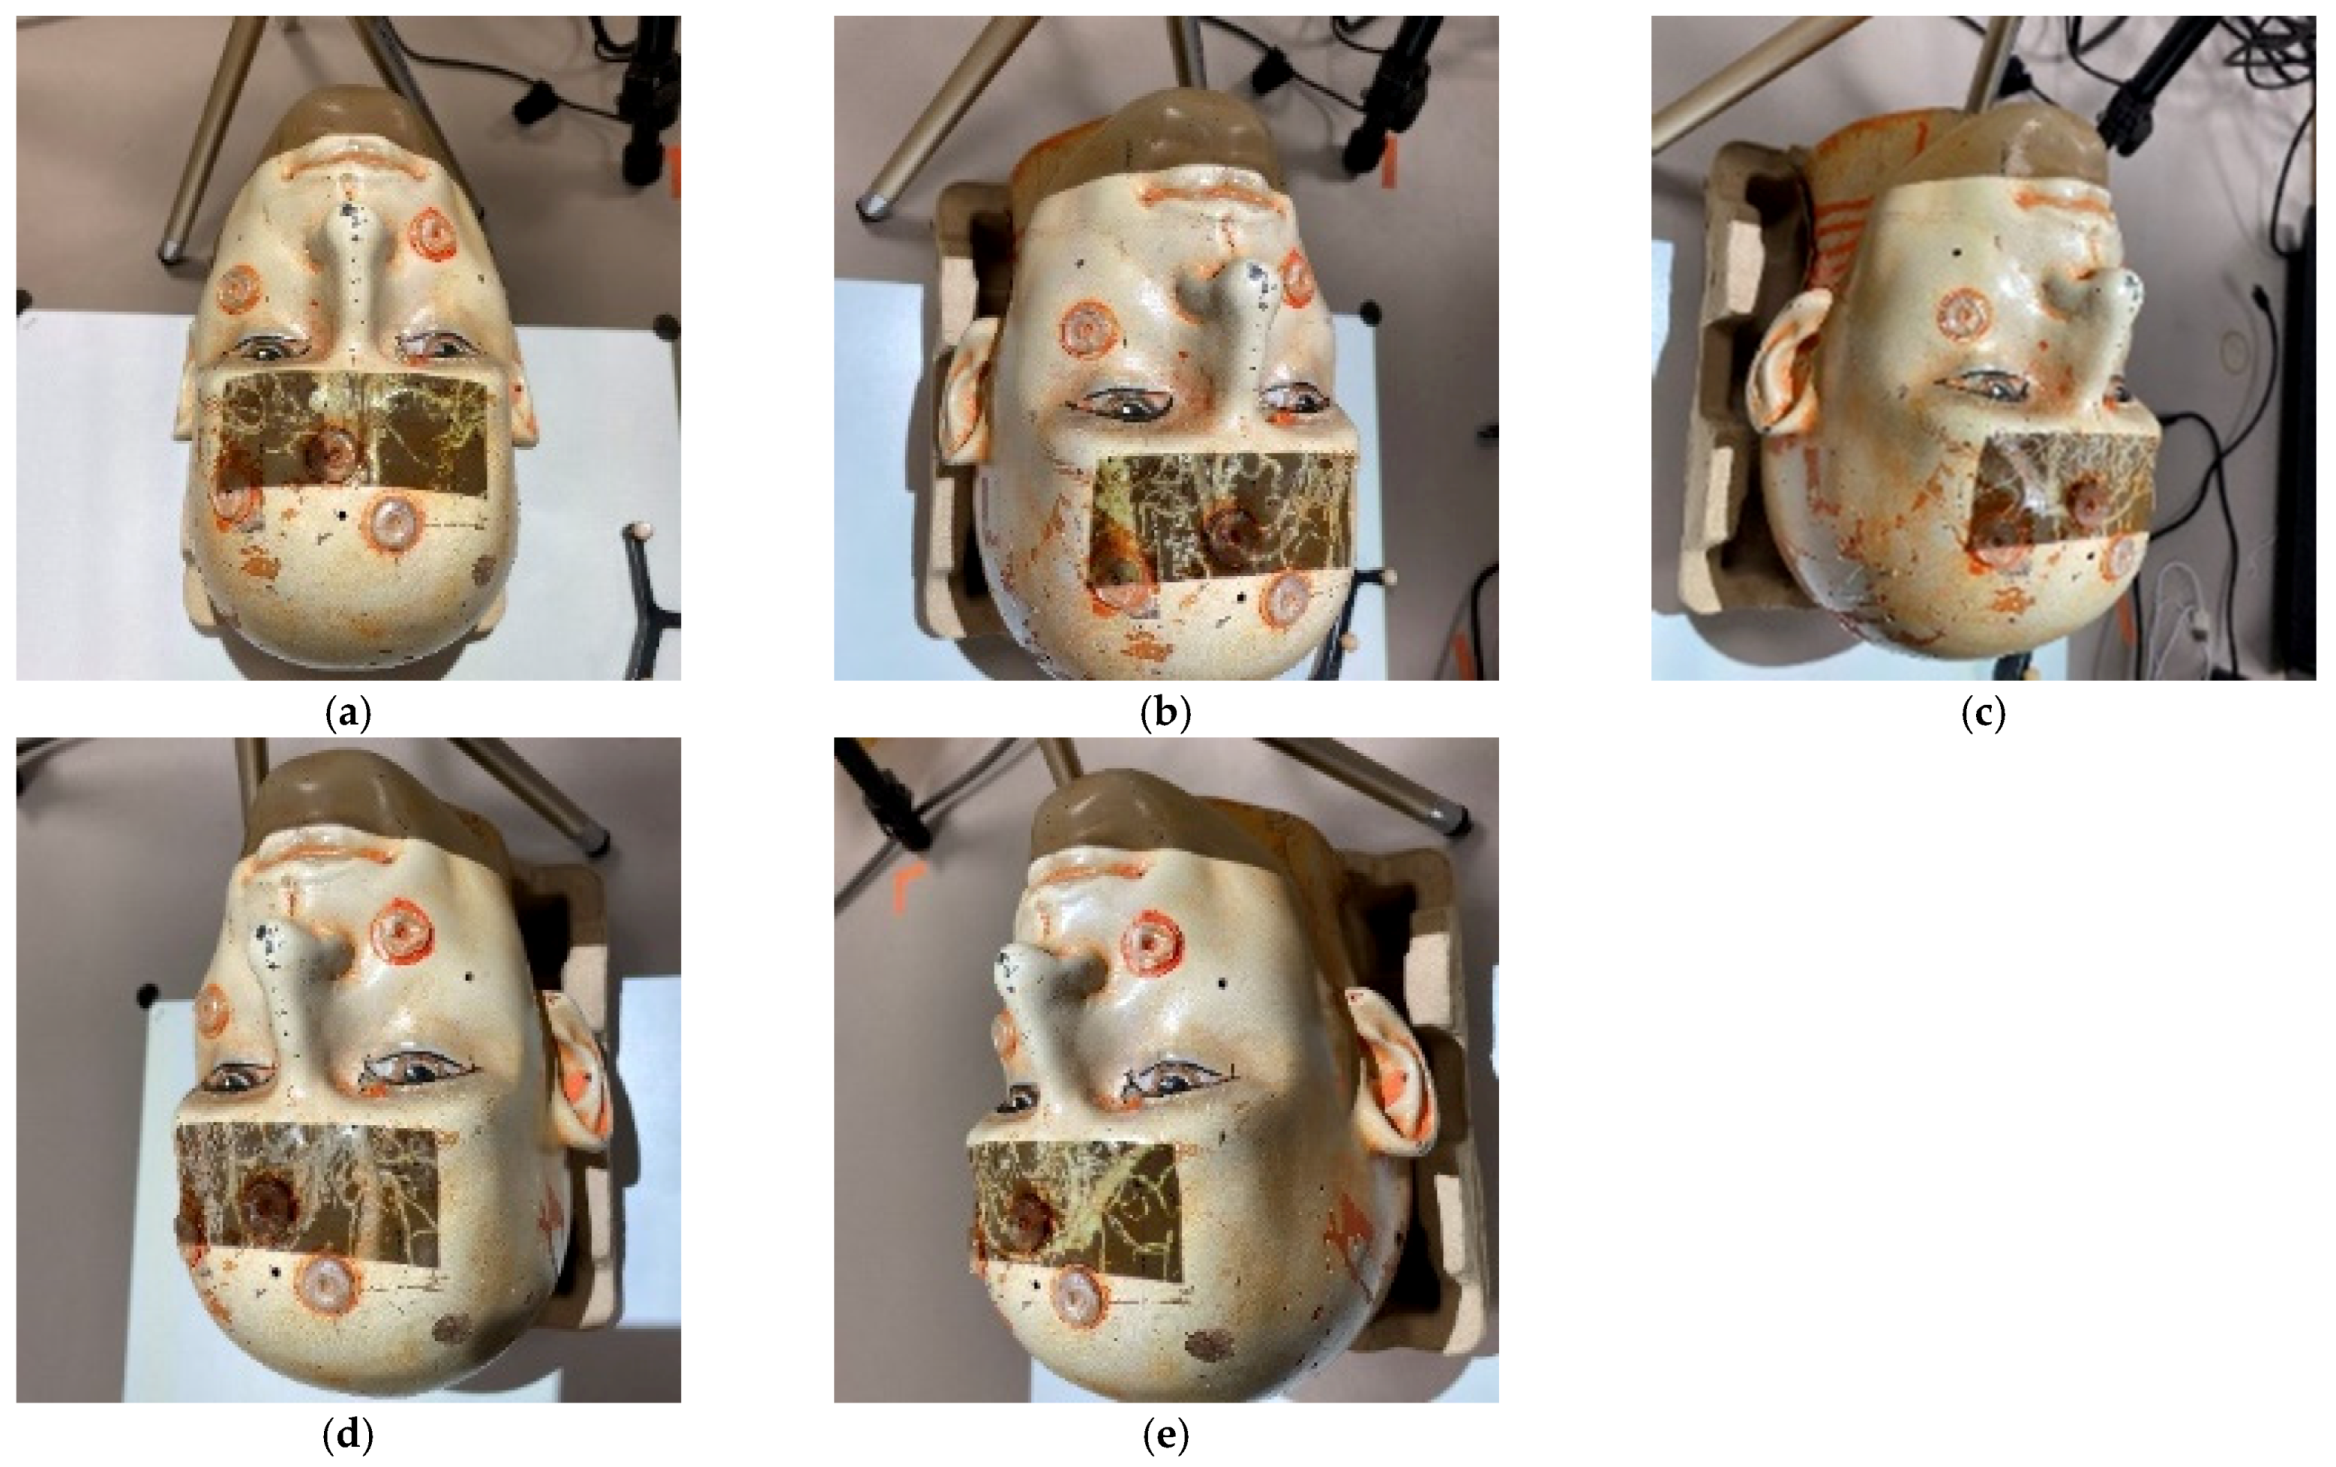
3.2. Experiments for Accuracy
3.3. Experiments for Systems Comparison Purposes
4. Discussion
5. Conclusions
Author Contributions
Funding
Institutional Review Board Statement
Informed Consent Statement
Data Availability Statement
Acknowledgments
Conflicts of Interest
References
- Eckert, M.; Volmerg, J.S.; Friedrich, C.M. Augmented Reality in Medicine: Systematic and Bibliographic Review. JMIR mHealth uHealth 2019, 7, e10967. [Google Scholar] [CrossRef] [PubMed]
- Barteit, S.; Lanfermann, L.; Bärnighausen, T.; Neuhann, F.; Beiersmann, C. Augmented, Mixed, and Virtual Reality-Based Head-Mounted Devices for Medical Education: Systematic Review. JMIR Serious Games 2021, 9, e29080. [Google Scholar] [CrossRef] [PubMed]
- Parekh, P.; Patel, S.; Patel, N.; Shah, M. Systematic review and meta-analysis of augmented reality in medicine, retail, and games. Vis. Comput. Ind. Biomed. Art 2020, 3, 1–20. [Google Scholar] [CrossRef]
- Gibby, J.T.; Swenson, S.A.; Cvetko, S.; Rao, R.; Javan, R. Head-mounted display augmented reality to guide pedicle screw placement utilizing computed tomography. Int. J. Comput. Assist. Radiol. Surg. 2018, 14, 525–535. [Google Scholar] [CrossRef]
- Kristin, N.H.; Margaret, R.C.; Roberts, D.C.; Charles, C. Della Santina, Low-Noise Magnetic Coil System for Recording 3-D Eye Movements. IEEE Trans. Instrum. Meas. 2021, 70, 2–8. [Google Scholar]
- Abdo, Y.; Yahya, E.; Ismail, H.; Saleh, M. Attention Detection using Electro-oculography Signals in E-learning Environment. In Proceedings of the 10th IEEE International Conference on Intelligent Computing and Information Systems, Cairo, Egypt, 5–7 December 2021; pp. 1–6. [Google Scholar]
- Lu, C.; Chakravarthula, P.; Tao, Y.; Chen, S.; Fuchs, H. Improved vergence and accommodation via Purkinje Image tracking with multiple cameras for AR glasses. In Proceedings of the IEEE International Symposium on Mixed and Augmented Reality, Porto de Galinhas, Brazil, 9–13 November 2020; pp. 1–12. [Google Scholar]
- Wan, Z.; Xiong, C.; Chen, W.; Zhang, H.; Wu, S. Pupil-Contour-Based Gaze Estimation With Real Pupil Axes for Head-Mounted Eye Tracking. IEEE Trans. Ind. Informatics 2021, 18, 3640–3650. [Google Scholar] [CrossRef]
- Rigas, I.; Raffle, H.; Komogortsev, O.V. Photosensor Oculography: Survey and Parametric Analysis of Designs Using Model-Based Simulation. IEEE Trans. Human-Machine Syst. 2018, 48, 670–681. [Google Scholar] [CrossRef] [Green Version]
- Nguyen, O.; Nguyen, K.; Pham, T.V. A comparative study on application of multi-task cascaded convolutional network for robust face recognition. In Proceedings of the 8th International Conference on Information Technology and its Application, Labuan, Malaysia, 28–29 August 2021; pp. 2–8. [Google Scholar]
- Thai, T.; Phan, H.N.; Nguyen, D.T.; Ha, S.V. An improved single shot detector for face detection using local binary patterns. In Proceedings of the 2019 International Symposium on Communications and Information Technologies (ISCIT), Ho Chi Minh City, Vietnam, 25–27 September 2019; pp. 1–6. [Google Scholar]
- Kadir, K.; Kamaruddin, M.K.; Nasir, H.; Sairul, I.S.; Bakti, Z.A.K. A comparative study between LBP and Haar-like features for Face Detection using OpenCV. In Proceedings of the Fourth International Conference on Engineering Technology and Technopreneuship, Kuala Lumpur, Malaysia, 27–29 August 2014; pp. 1–5. [Google Scholar]
- Chaudhari, M.N.; Deshmukh, M.; Ramrakhiani, G.; Parvatikar, R. Face Detection Using Viola Jones Algorithm and Neural Networks. In Proceedings of the International Conference on Computing, Communication, Control and Automation(ICCUBEA), Pune, India, 16–18 August 2018; pp. 1–4. [Google Scholar]
- Dalal, N.; Triggs, B. Histo-grams of oriented gradients for human detection. In Proceedings of the IEEE Computer Society Conference on Computer Vision and Pattern Recognition (CVPR’05), San Diego, CA, USA, 20–26 June 2005; pp. 1–8. [Google Scholar]
- Liu, W.; Anguelov, D.; Erhan, D.; Szegedy, C.; Reed, S.; Cheng, Y.; Berg, A. SSD: Single shot multibox detector. In Proceedings of the European Conference on Computer Vision, Amsterdam, The Netherlands, 11–14 October 2016; pp. 21–37. [Google Scholar]
- Wang, S.; Wang, K. Real-time and accurate face detection networks based on deep learning. In Proceedings of the International Conference on Electronic Information Technology and Computer Engineering (EITCE), Xiamen, China, 18–20 October 2019; pp. 1541–1545. [Google Scholar]
- Sun, J.; Xia, S.; Sun, Z.; Lu, S. Cross-Model Deep Feature Fusion for Face Detection. IEEE Sensors Lett. 2020, 4, 1–4. [Google Scholar] [CrossRef]
- Blum, T.; Heining, S.M.; Kutter, O.; Navab, N. Advanced training methods using an augmented reality ultrasound simulator. In Proceedings of the International Symposium on Mixed and Augmented Reality, Orlando, FL, USA, 19–22 October 2009; pp. 177–178. [Google Scholar]
- NDI. Available online: https://www.ndigital.com/optical-measurement-technology/polaris-vicra/ (accessed on 7 September 2021).
- Intel. Available online: https://www.intel.com/content/www/us/en/architecture-and-technology/realsense-overview.html (accessed on 7 September 2021).
- Tabrizi, L.B.; Mahvash, M. Augmented reality–guided neurosurgery: Accuracy and intraoperative application of an image projection technique. J. Neurosurg. 2015, 123, 206–211. [Google Scholar] [CrossRef] [PubMed] [Green Version]
- Gierwiało, R.; Witkowski, M.; Kosieradzki, M.; Lisik, W.; Groszkowski, Ł.; Sitnik, R. Medical Augmented-Reality Visualizer for Surgical Training and Education in Medicine. Appl. Sci. 2019, 9, 2732. [Google Scholar] [CrossRef] [Green Version]
- Frisken, S.; Haouchine, N.; Alexandra, R.D.; Golby, J. Using temporal and structural data to reconstruct 3D cerebral vasculature from a pair of 2D digital subtraction angiography sequences. Comput. Med. Imaging Graph. 2022, 99, 102076. [Google Scholar] [CrossRef] [PubMed]
- Besl, P.J.; McKay, N.D. A method for registration of 3D shapes, IEEE Transactions. Pattern Anal. Mach. Intell. 1992, 14, 239–256. [Google Scholar] [CrossRef] [Green Version]
- Zhao, Z.-Q. Object Detection with Deep Learning: A Review. IEEE Trans. Neural Netw. Learn. Syst. 2019, 30, 3212–3232. [Google Scholar] [CrossRef] [PubMed] [Green Version]
- King, D.E. Max-Margin Object Detection. arXiv 2015, arXiv:1502.00046. [Google Scholar]
- Sagonas, C.; Antonakos, E.; Tzimiropoulos, G.; Zafeiriou, S.; Pantic, M. 300 Faces In-The-Wild Challenge: Database and results. Image Vis. Comput. 2016, 47, 3–18. [Google Scholar] [CrossRef] [Green Version]
- Available online:https://docs.opencv.org/3.4/d2/d99/tutorial_js_face_detection.html (accessed on 15 January 2022).
- Available online:https://docs.opencv.org/4.x/d0/dd4/tutorial_dnn_face.html (accessed on 15 January 2022).
- Available online:https://github.com/davisking/dlib (accessed on 16 January 2022).
- Edirisooriya, T.; Jayatunga, E. Comparative Study of Face Detection Methods for Robust Face Recognition Systems. In Proceedings of the 5th SLAAI International Conference on Artificial Intelligence (SLAAI-ICAI), Colombo, Sri Lanka, 6–7 December 2021; pp. 1–6. [Google Scholar]
- Available online:http://vis-www.cs.umass.edu/fddb/ (accessed on 1 October 2022).
- Aydın, S. Cross-validated Adaboost Classification of Emotion Regulation Strategies Identified by Spectral Coherence in Resting-State. Neuroinformatics 2021, 20, 627–639. [Google Scholar] [CrossRef] [PubMed]


| Algorithm | Precision | Std. Deviation | Recall | Std. Deviation |
|---|---|---|---|---|
| Haar | 80.23% | 5.12% | 44.56% | 30.04% |
| HOG + SVM | 83.78% | 4.45% | 48.61% | 28.41% |
| DNN | 89.33% | 2.17% | 70.94% | 13.86% |
| MMOD | 98.14% | 1.08% | 80.26% | 9.79% |
| Deg. | P1 | P2 | P3 | P4 | P5 | P.Avg. | Q1 | Q2 | Q3 | Q4 | Q Avg. |
|---|---|---|---|---|---|---|---|---|---|---|---|
| 0 | 1.51 | 1.58 | 1.51 | 1.54 | 1.5 | 1.528 | 1.61 | 1.43 | 1.48 | 1.58 | 1.525 |
| +10 | 1.53 | 1.54 | 1.53 | 1.5 | 1.58 | 1.536 | n.a. | n.a. | n.a. | n.a. | |
| +20 | 1.54 | 1.55 | 1.54 | 1.51 | 1.53 | 1.534 | 1.57 | 1.54 | 1.67 | 1.61 | 1.598 |
| +30 | 1.7 | 1.54 | 1.52 | 1.55 | 2.21 | 1.704 | n.a. | n.a. | n.a. | n.a. | |
| +40 | 2.21 | 1.52 | 1.5 | * | 1.52 | 1.688 | 1.68 | 1.71 | 1.66 | 1.7 | 1.688 |
| +50 | 2.5 | 1.55 | 1.7 | * | 1.54 | 1.823 | n.a. | n.a. | n.a. | n.a. | |
| +60 | 2.4 | 1.52 | 1.78 | * | 1.54 | 1.81 | 1.69 | 1.62 | 1.73 | 1.77 | 1.703 |
| −10 | 1.57 | 1.97 | 1.53 | 1.51 | 1.51 | 1.618 | n.a. | n.a. | n.a. | n.a. | |
| −20 | 1.58 | 1.96 | 1.52 | 1.52 | 1.74 | 1.664 | 1.55 | 1.64 | 1.7 | 1.66 | 1.638 |
| −30 | 1.56 | 2.4 | 1.56 | 1.51 | 1.68 | 1.742 | n.a. | n.a. | n.a. | n.a. | |
| −40 | 1.53 | 2.33 | 1.58 | 1.59 | * | 1.758 | 1.51 | 1.49 | 1.47 | 1.53 | 1.5 |
| −50 | 1.58 | 2.21 | 1.89 | 1.54 | * | 1.805 | n.a. | n.a. | n.a. | n.a. | |
| −60 | 2.2 | * | 2.38 | 1.76 | * | 2.113 | 1.73 | 1.68 | 1.74 | 1.76 | 1.728 |
| Total Avg. | 1.717 | 1.625 |
| Deg. | P1 | P2 | P3 | P4 | P5 | P.Avg. | Q1 | Q2 | Q3 | Q4 | Q Avg. |
|---|---|---|---|---|---|---|---|---|---|---|---|
| 0 | 1.62 | 1.75 | 1.71 | 1.64 | 1.66 | 1.676 | 1.78 | 1.83 | 1.76 | 1.85 | 1.805 |
| +10 | 1.66 | 1.78 | 1.81 | 1.68 | 1.7 | 1.726 | n.a. | n.a. | n.a. | n.a. | . |
| +20 | 1.7 | 1.77 | 1.68 | 1.76 | 1.71 | 1.724 | 1.86 | 1.84 | 1.79 | 1.81 | 1.825 |
| +30 | 1.84 | 1.89 | 1.76 | 1.89 | 1.73 | 1.822 | n.a. | n.a. | n.a. | n.a. | |
| +40 | 2.31 | 1.75 | 1.71 | * | 1.64 | 1.8525 | 1.91 | 1.88 | 1.93 | 1.94 | 1.915 |
| +50 | 2.52 | 1.81 | 1.74 | * | 1.67 | 1.935 | n.a. | n.a. | n.a. | n.a. | |
| +60 | 2.64 | 1.74 | 1.89 | * | 1.91 | 2.045 | 1.68 | 1.77 | 1.86 | 1.71 | 1.755 |
| −10 | 1.59 | 1.67 | 1.64 | 1.77 | 1.64 | 1.662 | n.a. | n.a. | n.a. | n.a. | |
| −20 | 1.91 | 1.67 | 1.76 | 1.72 | 1.69 | 1.75 | 1.37 | 1.69 | 1.58 | 1.92 | 1.64 |
| −30 | 1.86 | 1.99 | 1.73 | 1.68 | 1.81 | 1.814 | n.a. | n.a. | n.a. | n.a. | |
| −40 | 1.84 | 2.6 | 1.78 | 1.76 | * | 1.995 | 1.84 | 1.93 | 1.78 | 1.82 | 1.843 |
| −50 | 1.76 | 2.6 | 1.86 | 1.61 | * | 1.958 | n.a. | n.a. | n.a. | n.a. | |
| −60 | 2.1 | * | 2.8 | 1.86 | * | 2.253 | 1.76 | 1.71 | 1.77 | 1.83 | 1.768 |
| Total Avg. | 1.862 | 1.793 |
| Deg. | P1 | P2 | P3 | P4 | P5 | P.Avg. | Q1 | Q2 | Q3 | Q4 | Q Avg. |
|---|---|---|---|---|---|---|---|---|---|---|---|
| 0 | 2.16 | 2.39 | 2.86 | 2.44 | 2.54 | 2.478 | 2.56 | 2.43 | 2.12 | 2.41 | 2.38 |
| +10 | 2.34 | 2.76 | 2.45 | 2.67 | 2.78 | 2.6 | n.a. | n.a. | n.a. | n.a. | . |
| +20 | 3.7 | 3.1 | 2.87 | 2.64 | 2.31 | 2.924 | 2.11 | 2.27 | 2.19 | 2.45 | 2.255 |
| +30 | 2.51 | 1.97 | 1.88 | 2.34 | 1.92 | 2.124 | n.a. | n.a. | n.a. | n.a. | |
| +40 | 3.41 | 2.67 | 2.46 | * | 2.74 | 2.82 | 2.55 | 2.43 | 2.69 | 2.17 | 2.46 |
| +50 | 2.57 | 2.44 | 2.41 | * | 2.67 | 2.523 | n.a. | n.a. | n.a. | n.a. | |
| +60 | 3.11 | 2.87 | 2.92 | * | 2.96 | 2.965 | 2.16 | 2.58 | 2.41 | 2.09 | 2.31 |
| −10 | 2.21 | 2.34 | 2.4 | 2.41 | 2.39 | 2.35 | n.a. | n.a. | n.a. | n.a. | |
| −20 | 2.37 | 2.6 | 2.78 | 2.61 | 2.21 | 2.514 | 2.76 | 2.88 | 2.43 | 2.22 | 2.573 |
| −30 | 2.7 | 2.44 | 2.56 | 2.17 | 2.67 | 2.508 | n.a. | n.a. | n.a. | n.a. | |
| −40 | 3.57 | 3.24 | 3.51 | 3.09 | * | 3.353 | 2.08 | 1.98 | 2.34 | 2.06 | 2.115 |
| −50 | 3.87 | 3.8 | 3.66 | 3.91 | * | 3.81 | n.a. | n.a. | n.a. | n.a. | |
| −60 | 3.14 | * | 3.02 | 2.86 | * | 3.007 | 2.61 | 2.14 | 1.92 | 2.68 | 2.338 |
| Total Avg. | 2.767 | 2.347 |
| System | P1 | P2 | P3 | P4 | P5 | P.Avg. | Q1 | Q2 | Q3 | Q4 | Q Avg. |
|---|---|---|---|---|---|---|---|---|---|---|---|
| NDI | 1.34 | 1.81 | 1.62 | 1.55 | 1.83 | 1.63 | 1.53 | 1.62 | 1.67 | 1.69 | 1.630 |
| Proposed | 1.54 | 1.51 | 1.58 | 1.51 | 1.5 | 1.528 | 1.48 | 1.37 | 1.41 | 1.53 | 1.448 |
Publisher’s Note: MDPI stays neutral with regard to jurisdictional claims in published maps and institutional affiliations. |
© 2022 by the authors. Licensee MDPI, Basel, Switzerland. This article is an open access article distributed under the terms and conditions of the Creative Commons Attribution (CC BY) license (https://creativecommons.org/licenses/by/4.0/).
Share and Cite
Chien, J.-C.; Lee, J.-D.; Chang, C.-W.; Wu, C.-T. A Projection-Based Augmented Reality System for Medical Applications. Appl. Sci. 2022, 12, 12027. https://doi.org/10.3390/app122312027
Chien J-C, Lee J-D, Chang C-W, Wu C-T. A Projection-Based Augmented Reality System for Medical Applications. Applied Sciences. 2022; 12(23):12027. https://doi.org/10.3390/app122312027
Chicago/Turabian StyleChien, Jong-Chih, Jiann-Der Lee, Chai-Wei Chang, and Chieh-Tsai Wu. 2022. "A Projection-Based Augmented Reality System for Medical Applications" Applied Sciences 12, no. 23: 12027. https://doi.org/10.3390/app122312027