
Freezing and Thawing Processes of Highways in Kazakhstan

 ,
,  ,
,
Abstract
:1. Introduction
2. Research Background and Method
3. Results and Discussion
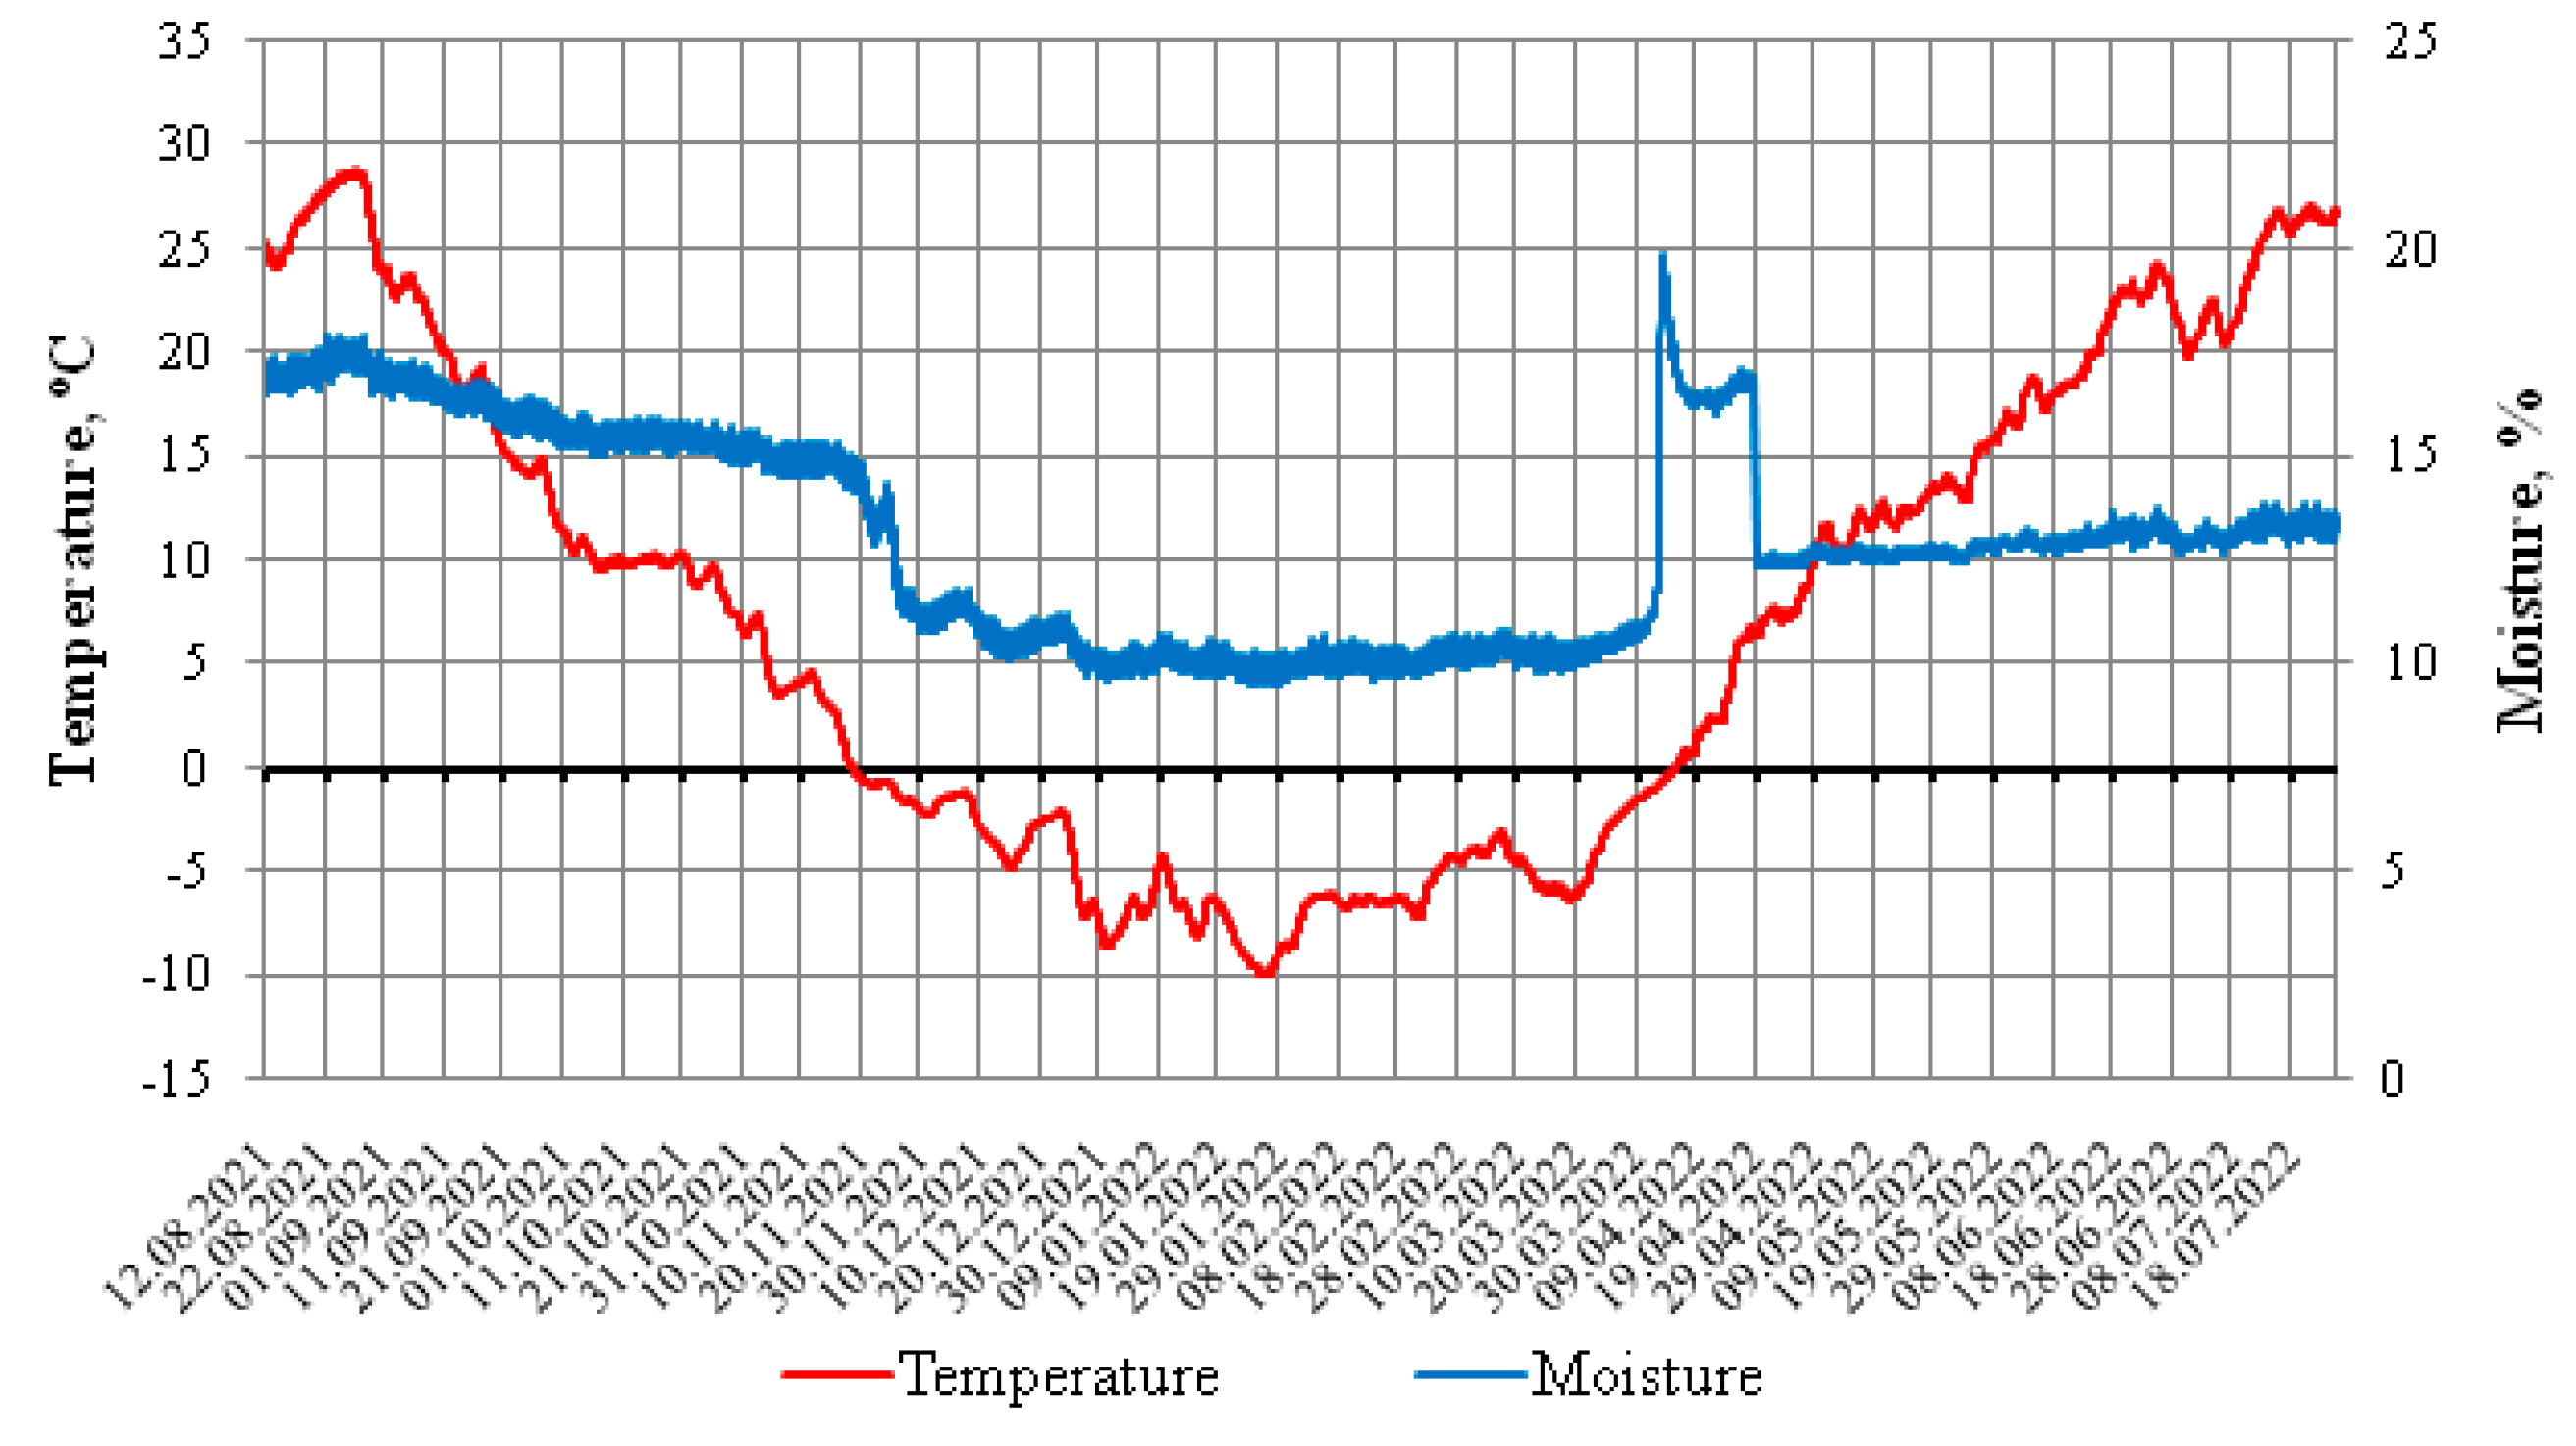
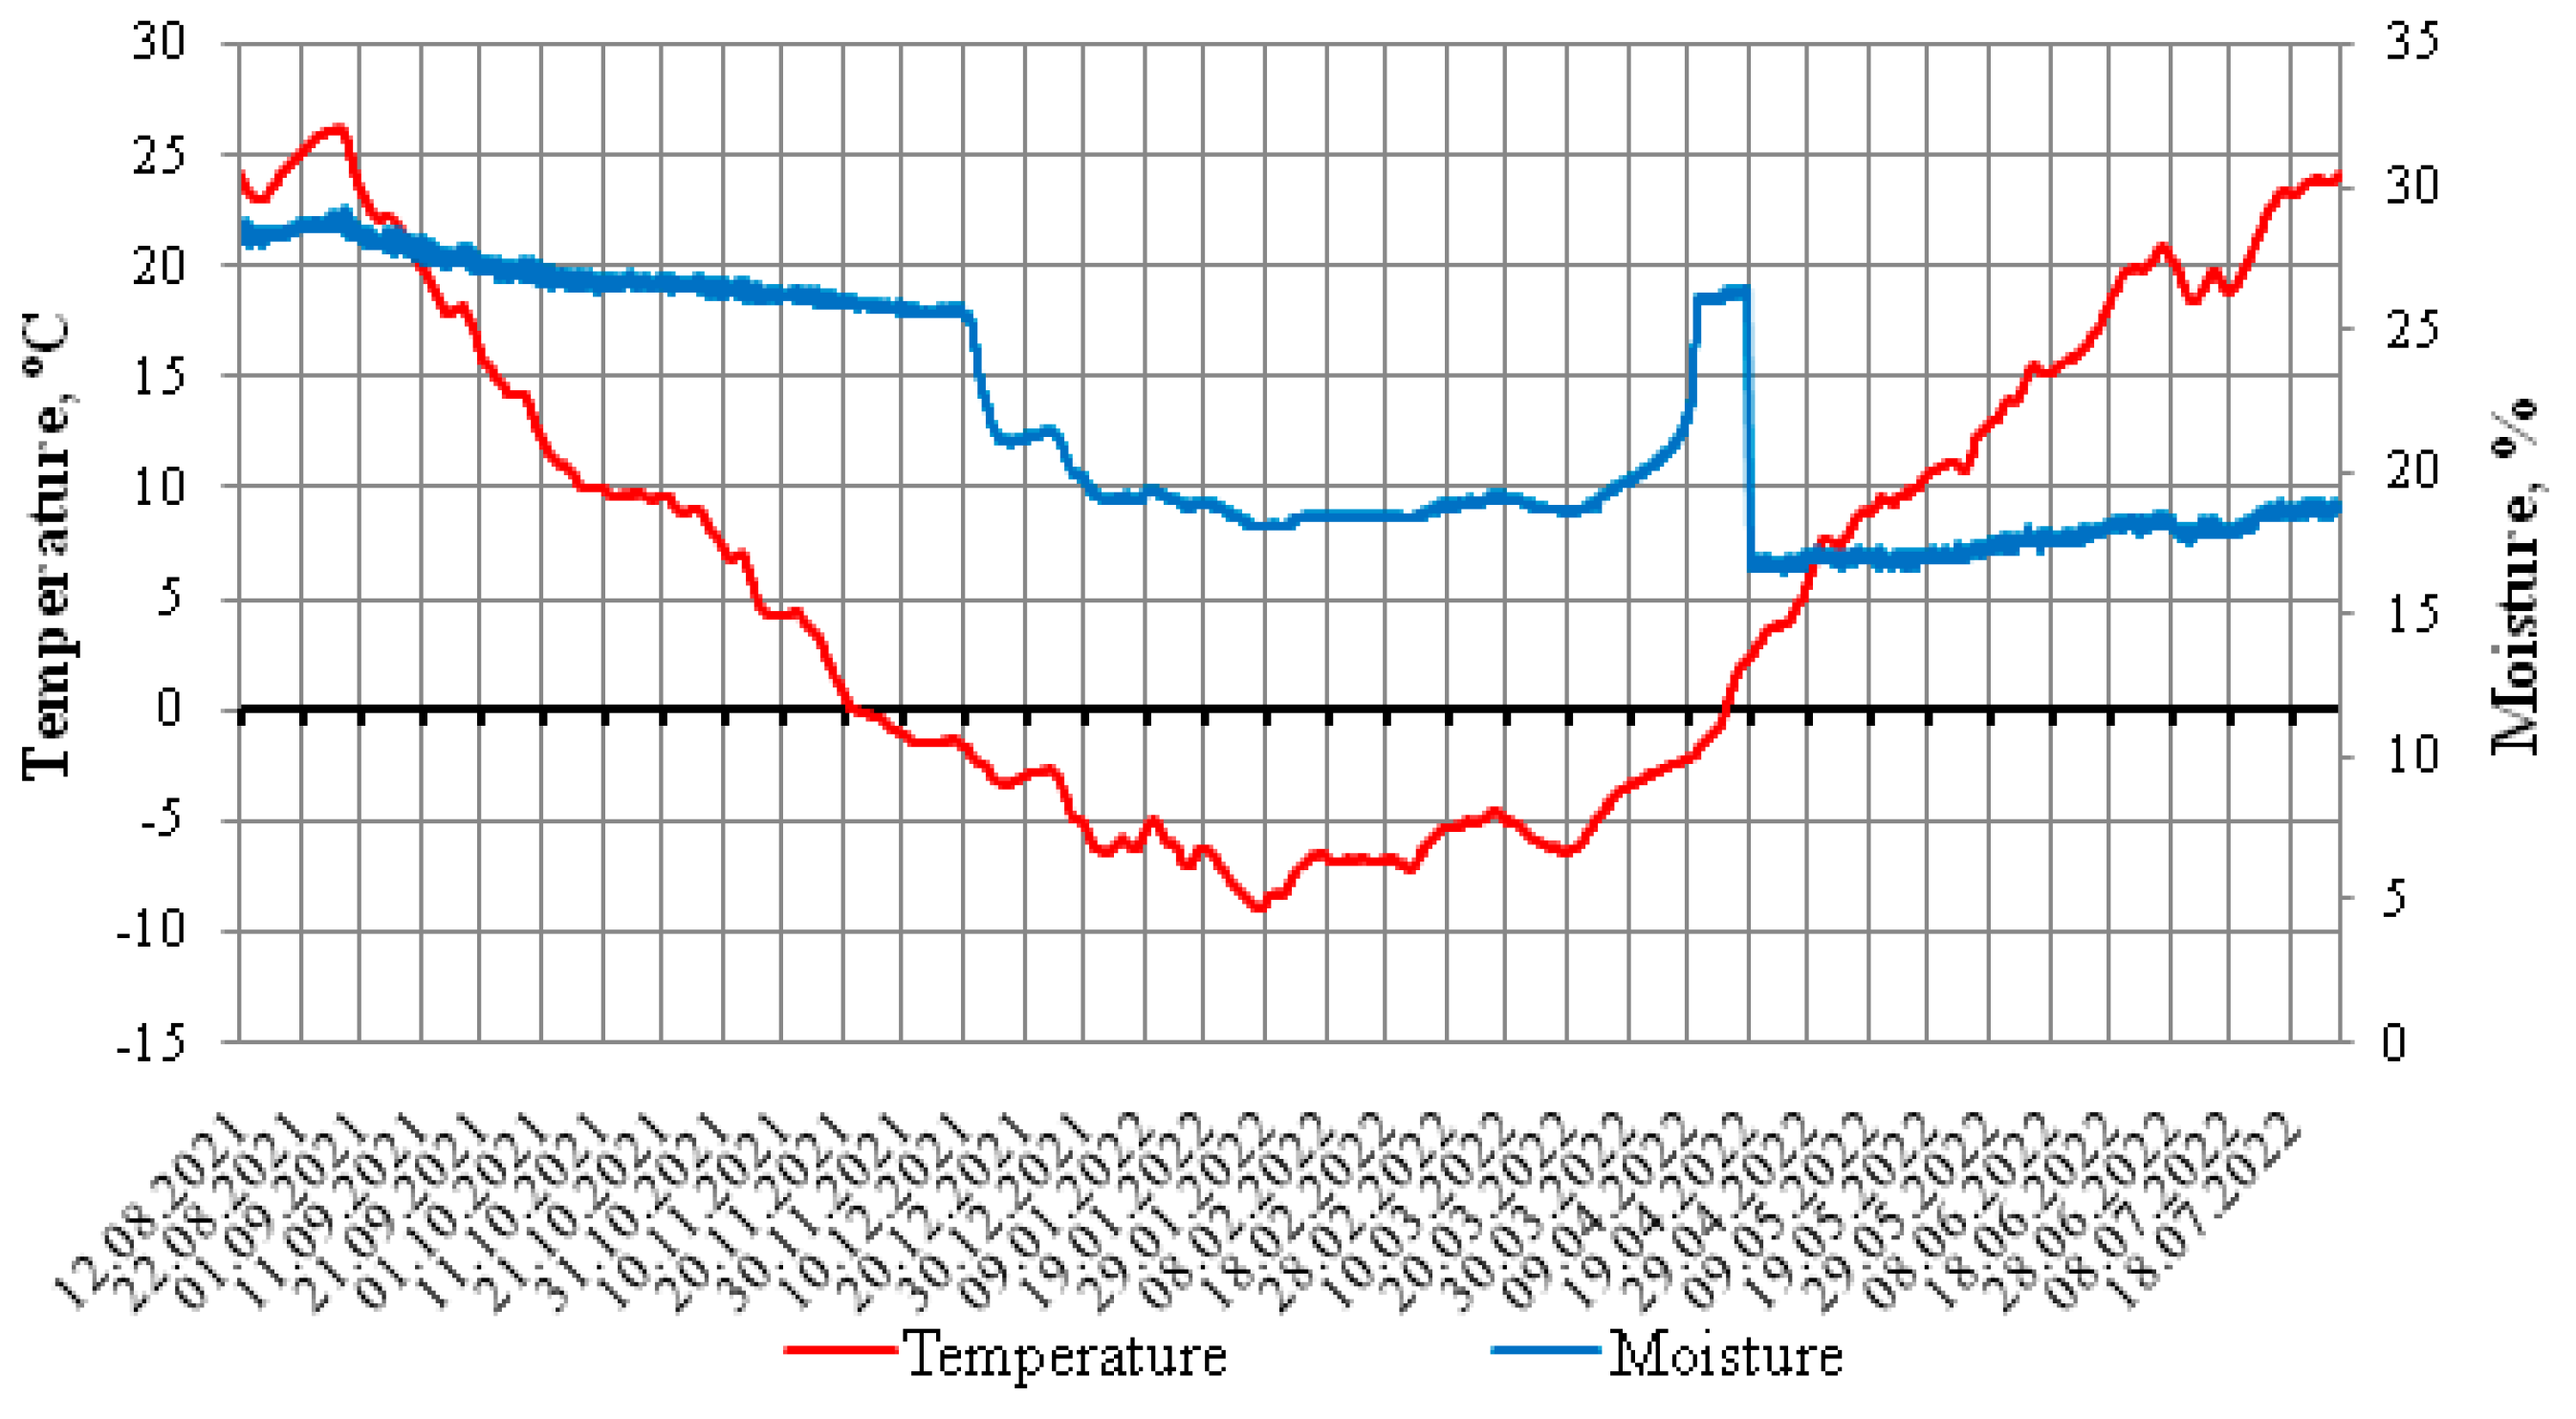
3.1. Air, Pavement, and Subgrade Temperature
3.2. Freezing and Thawing
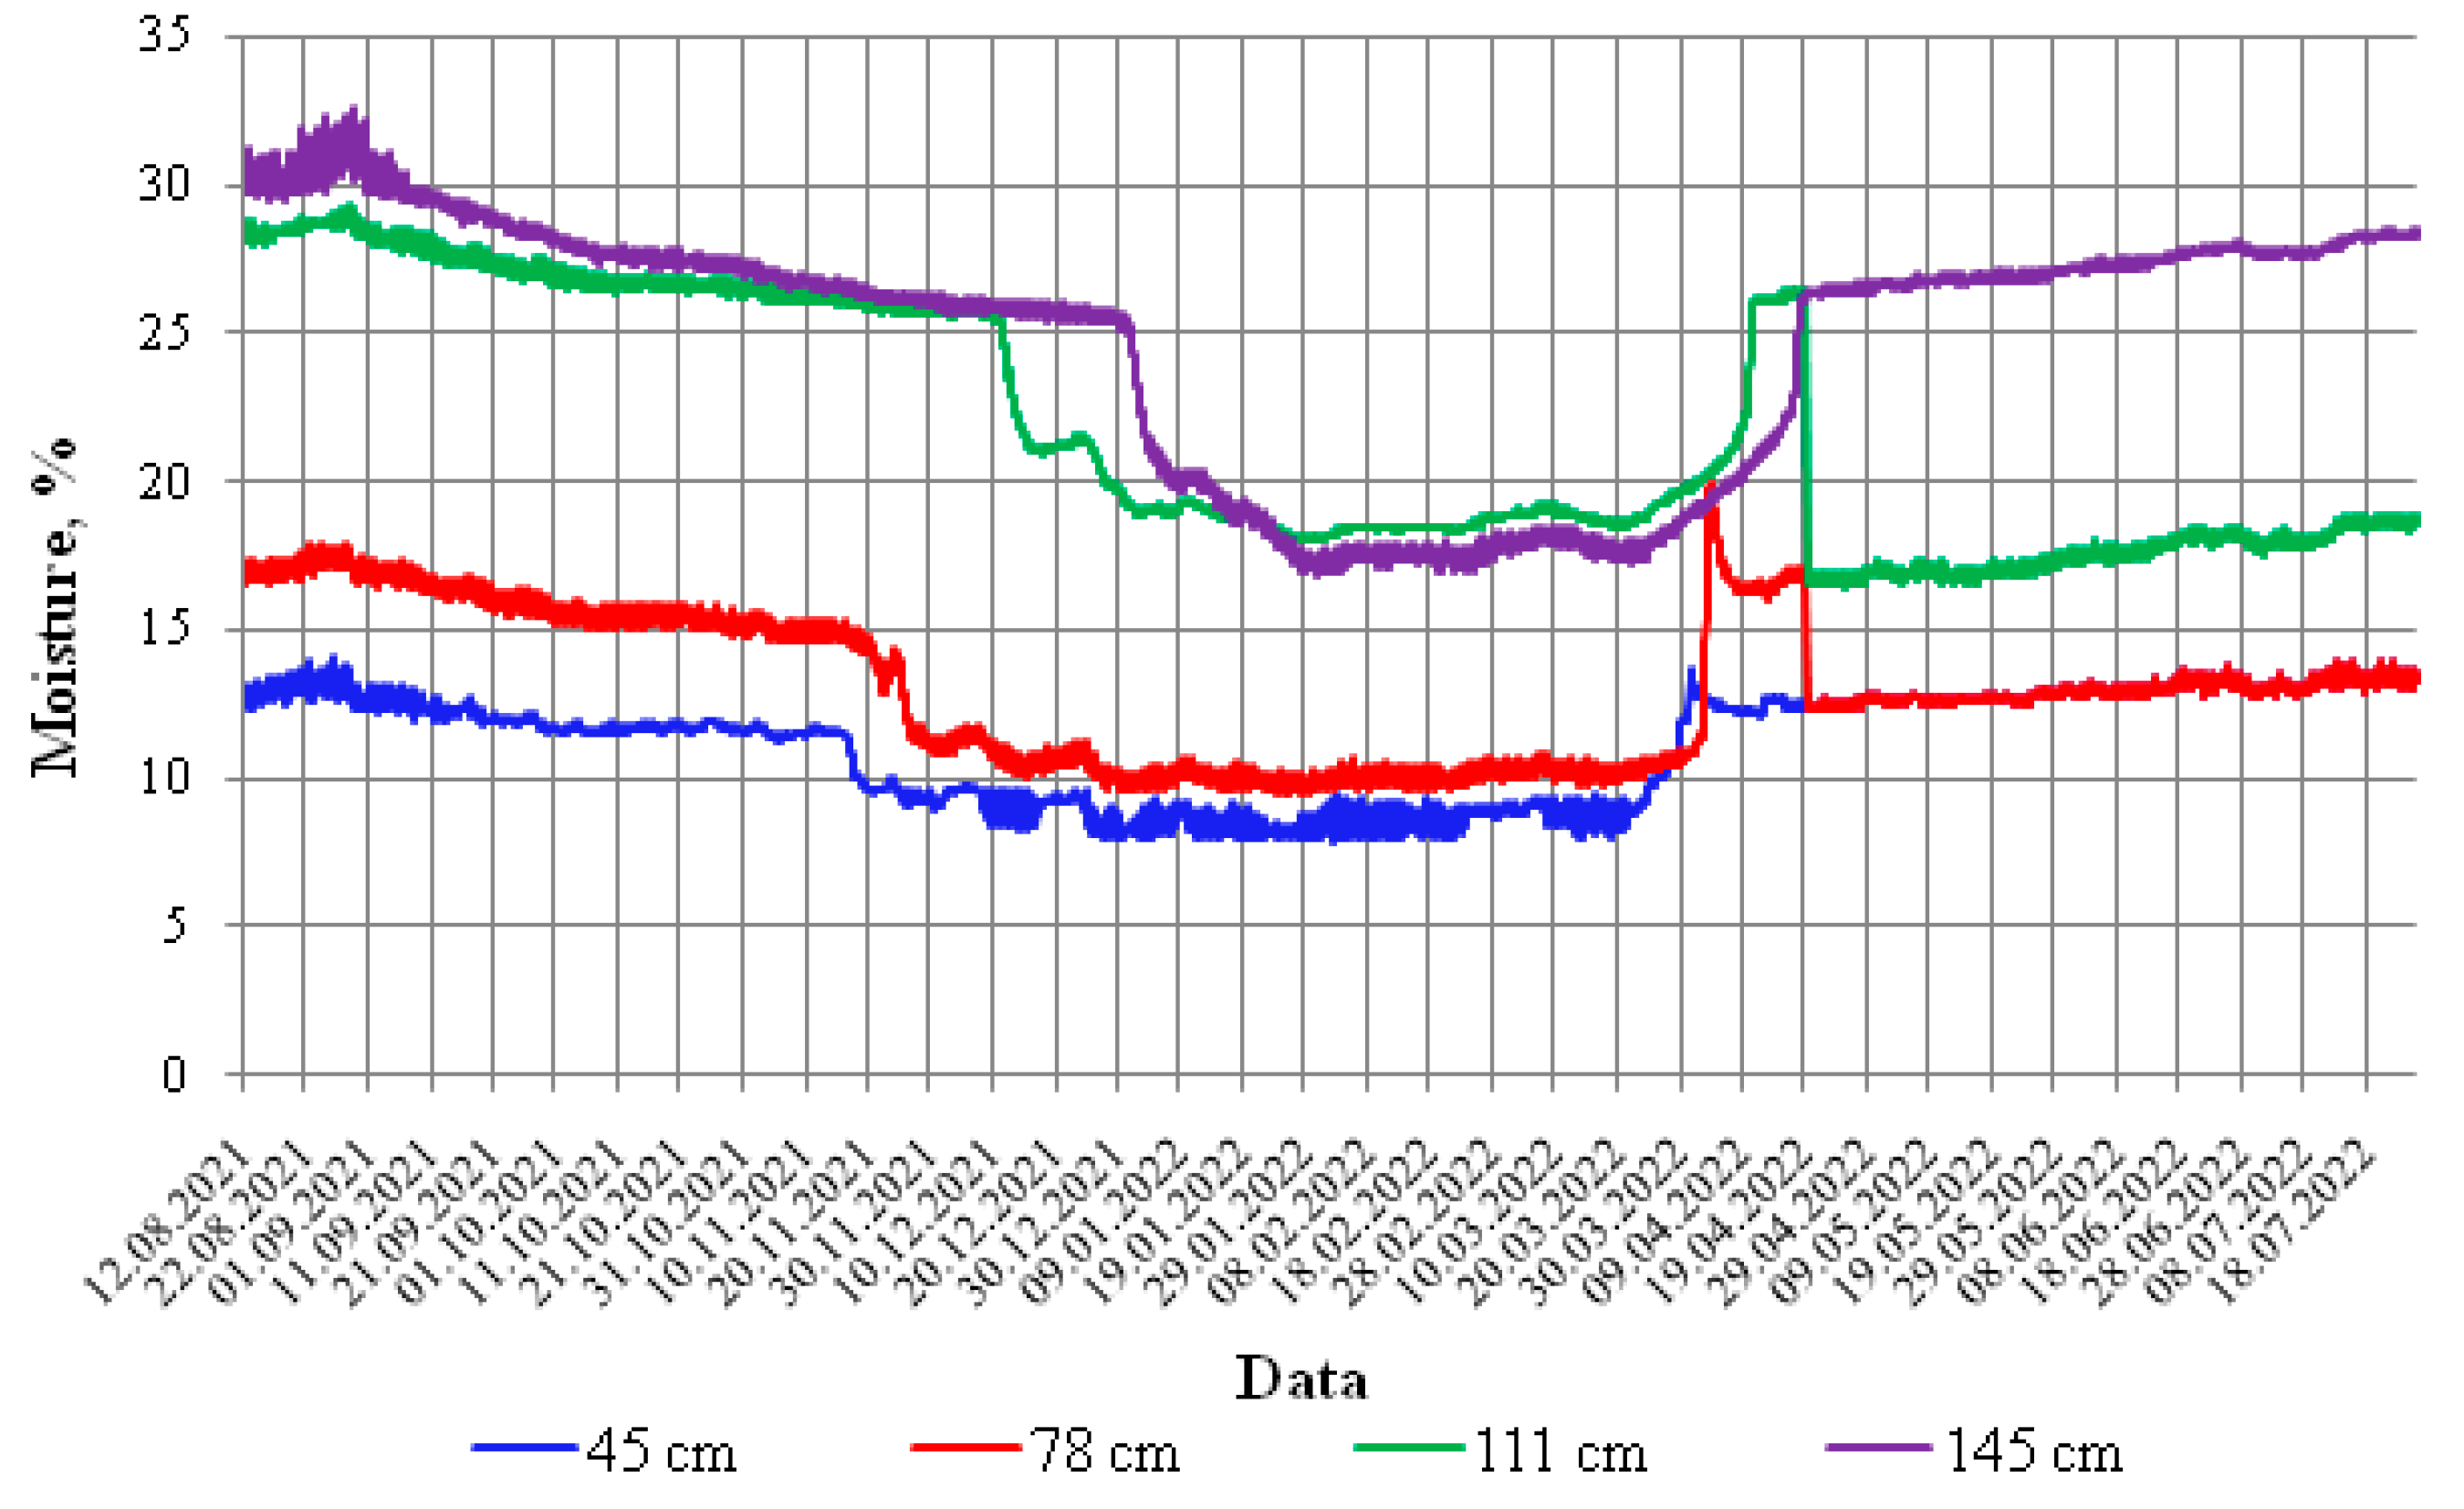
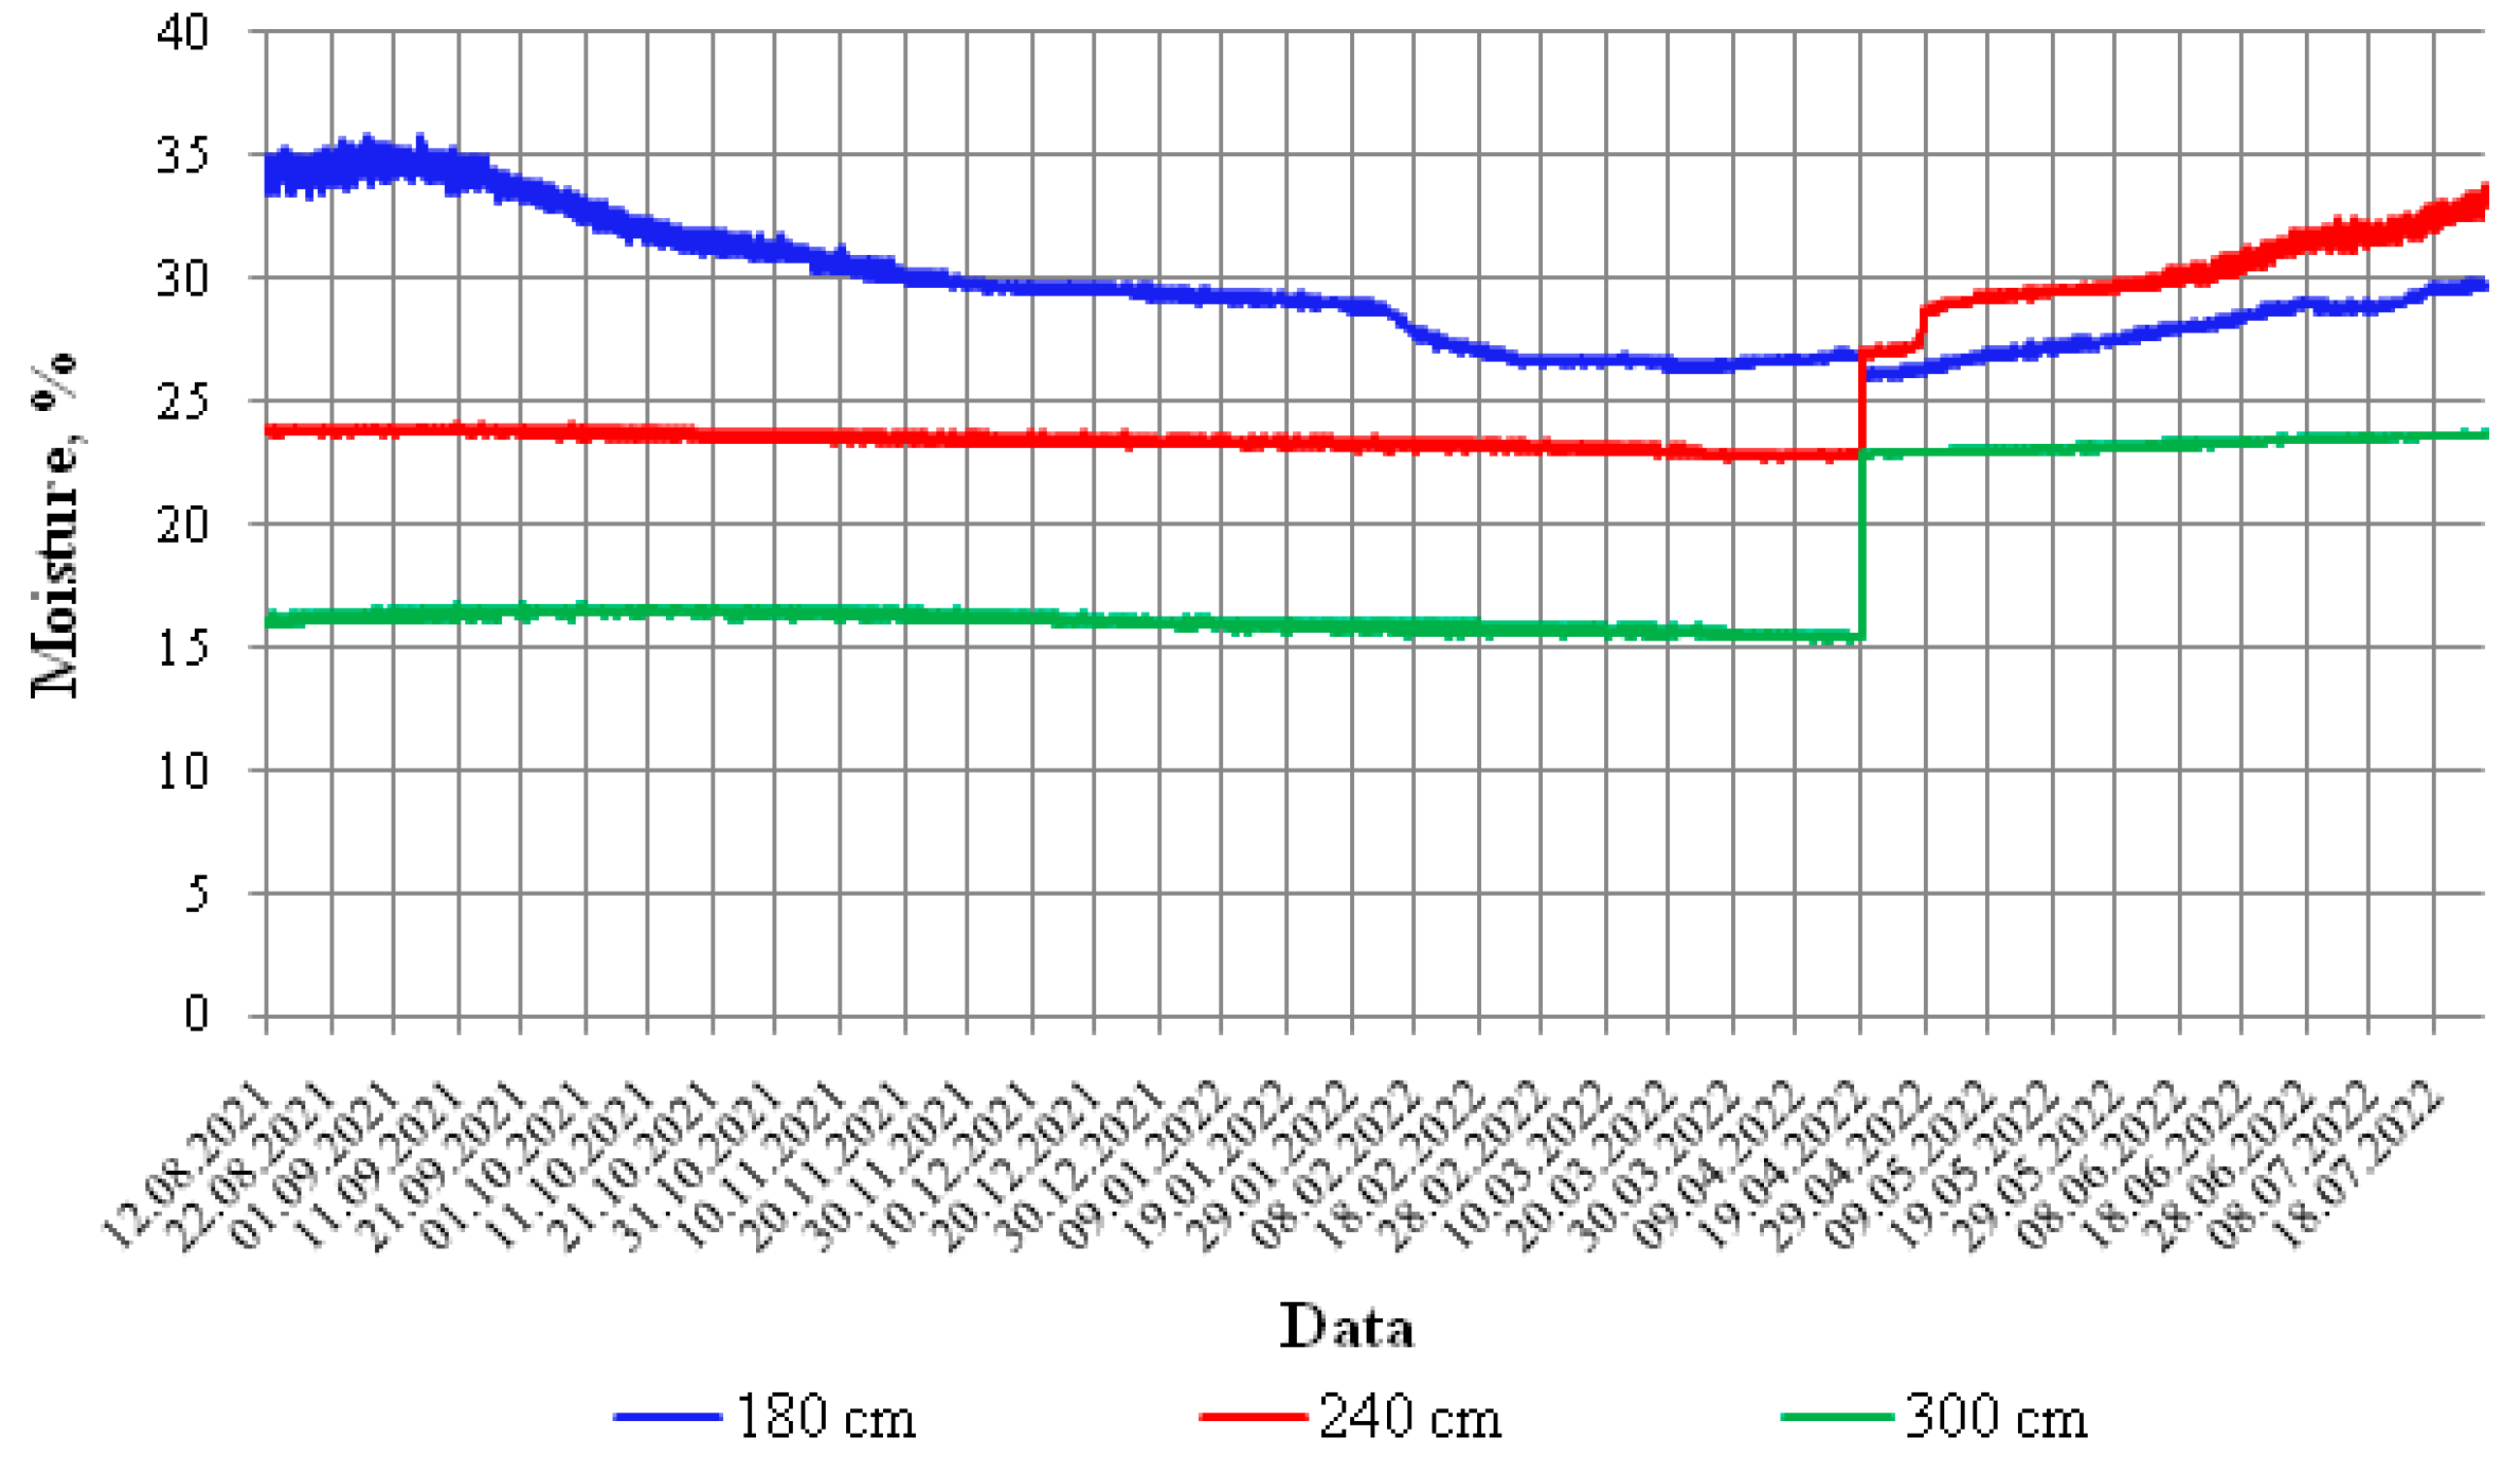
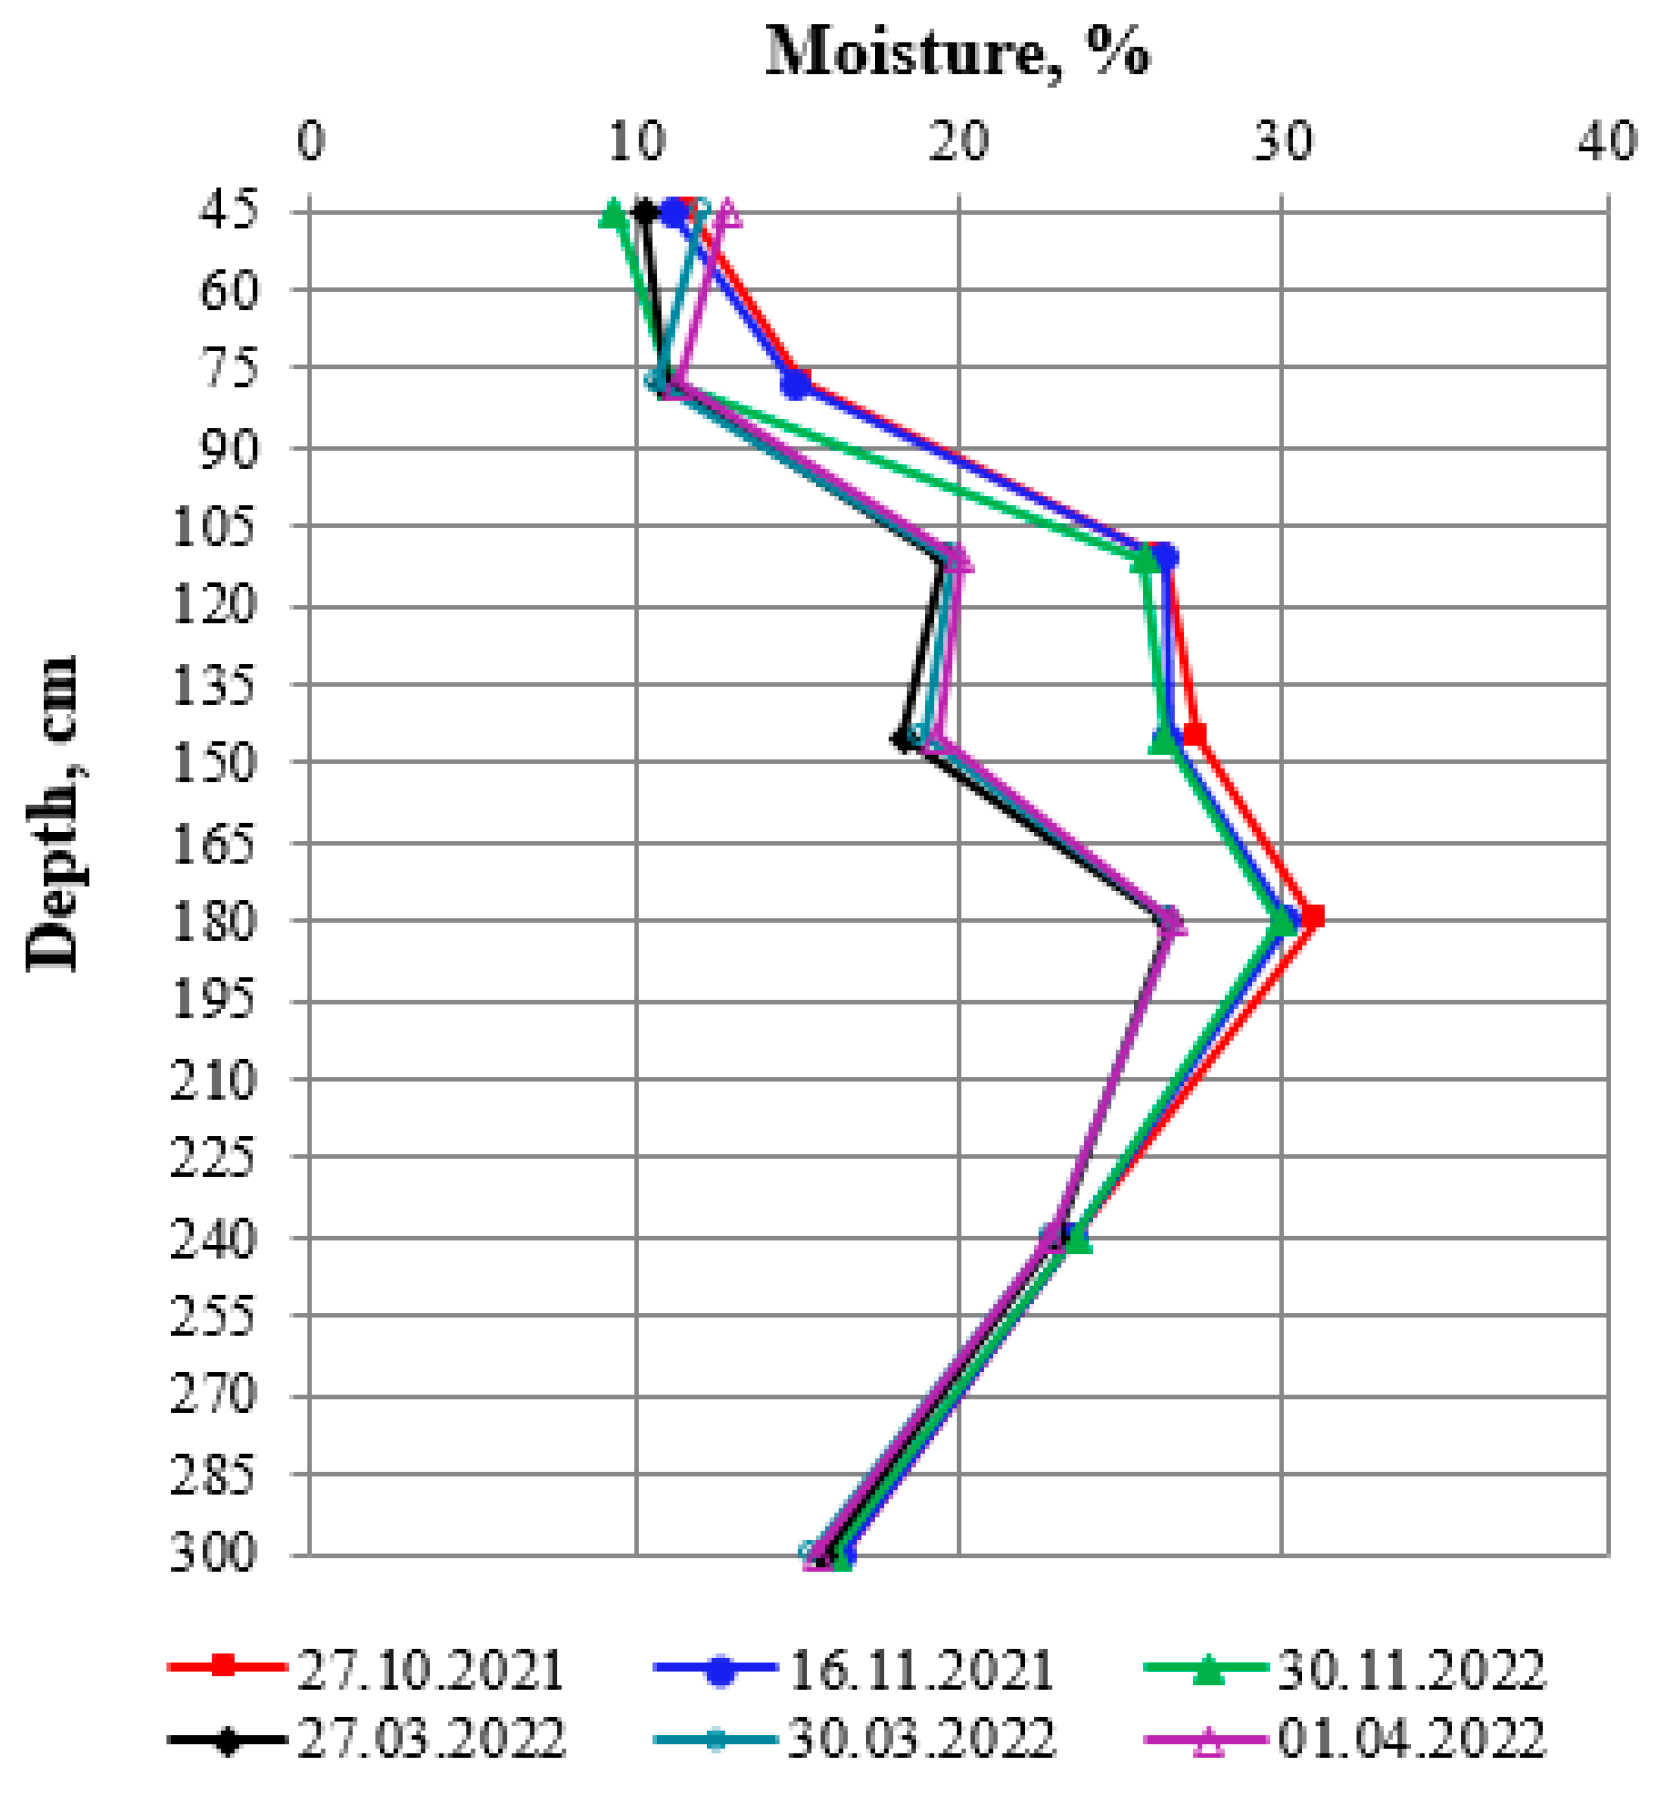
3.3. Moisture
4. Conclusions
- (1)
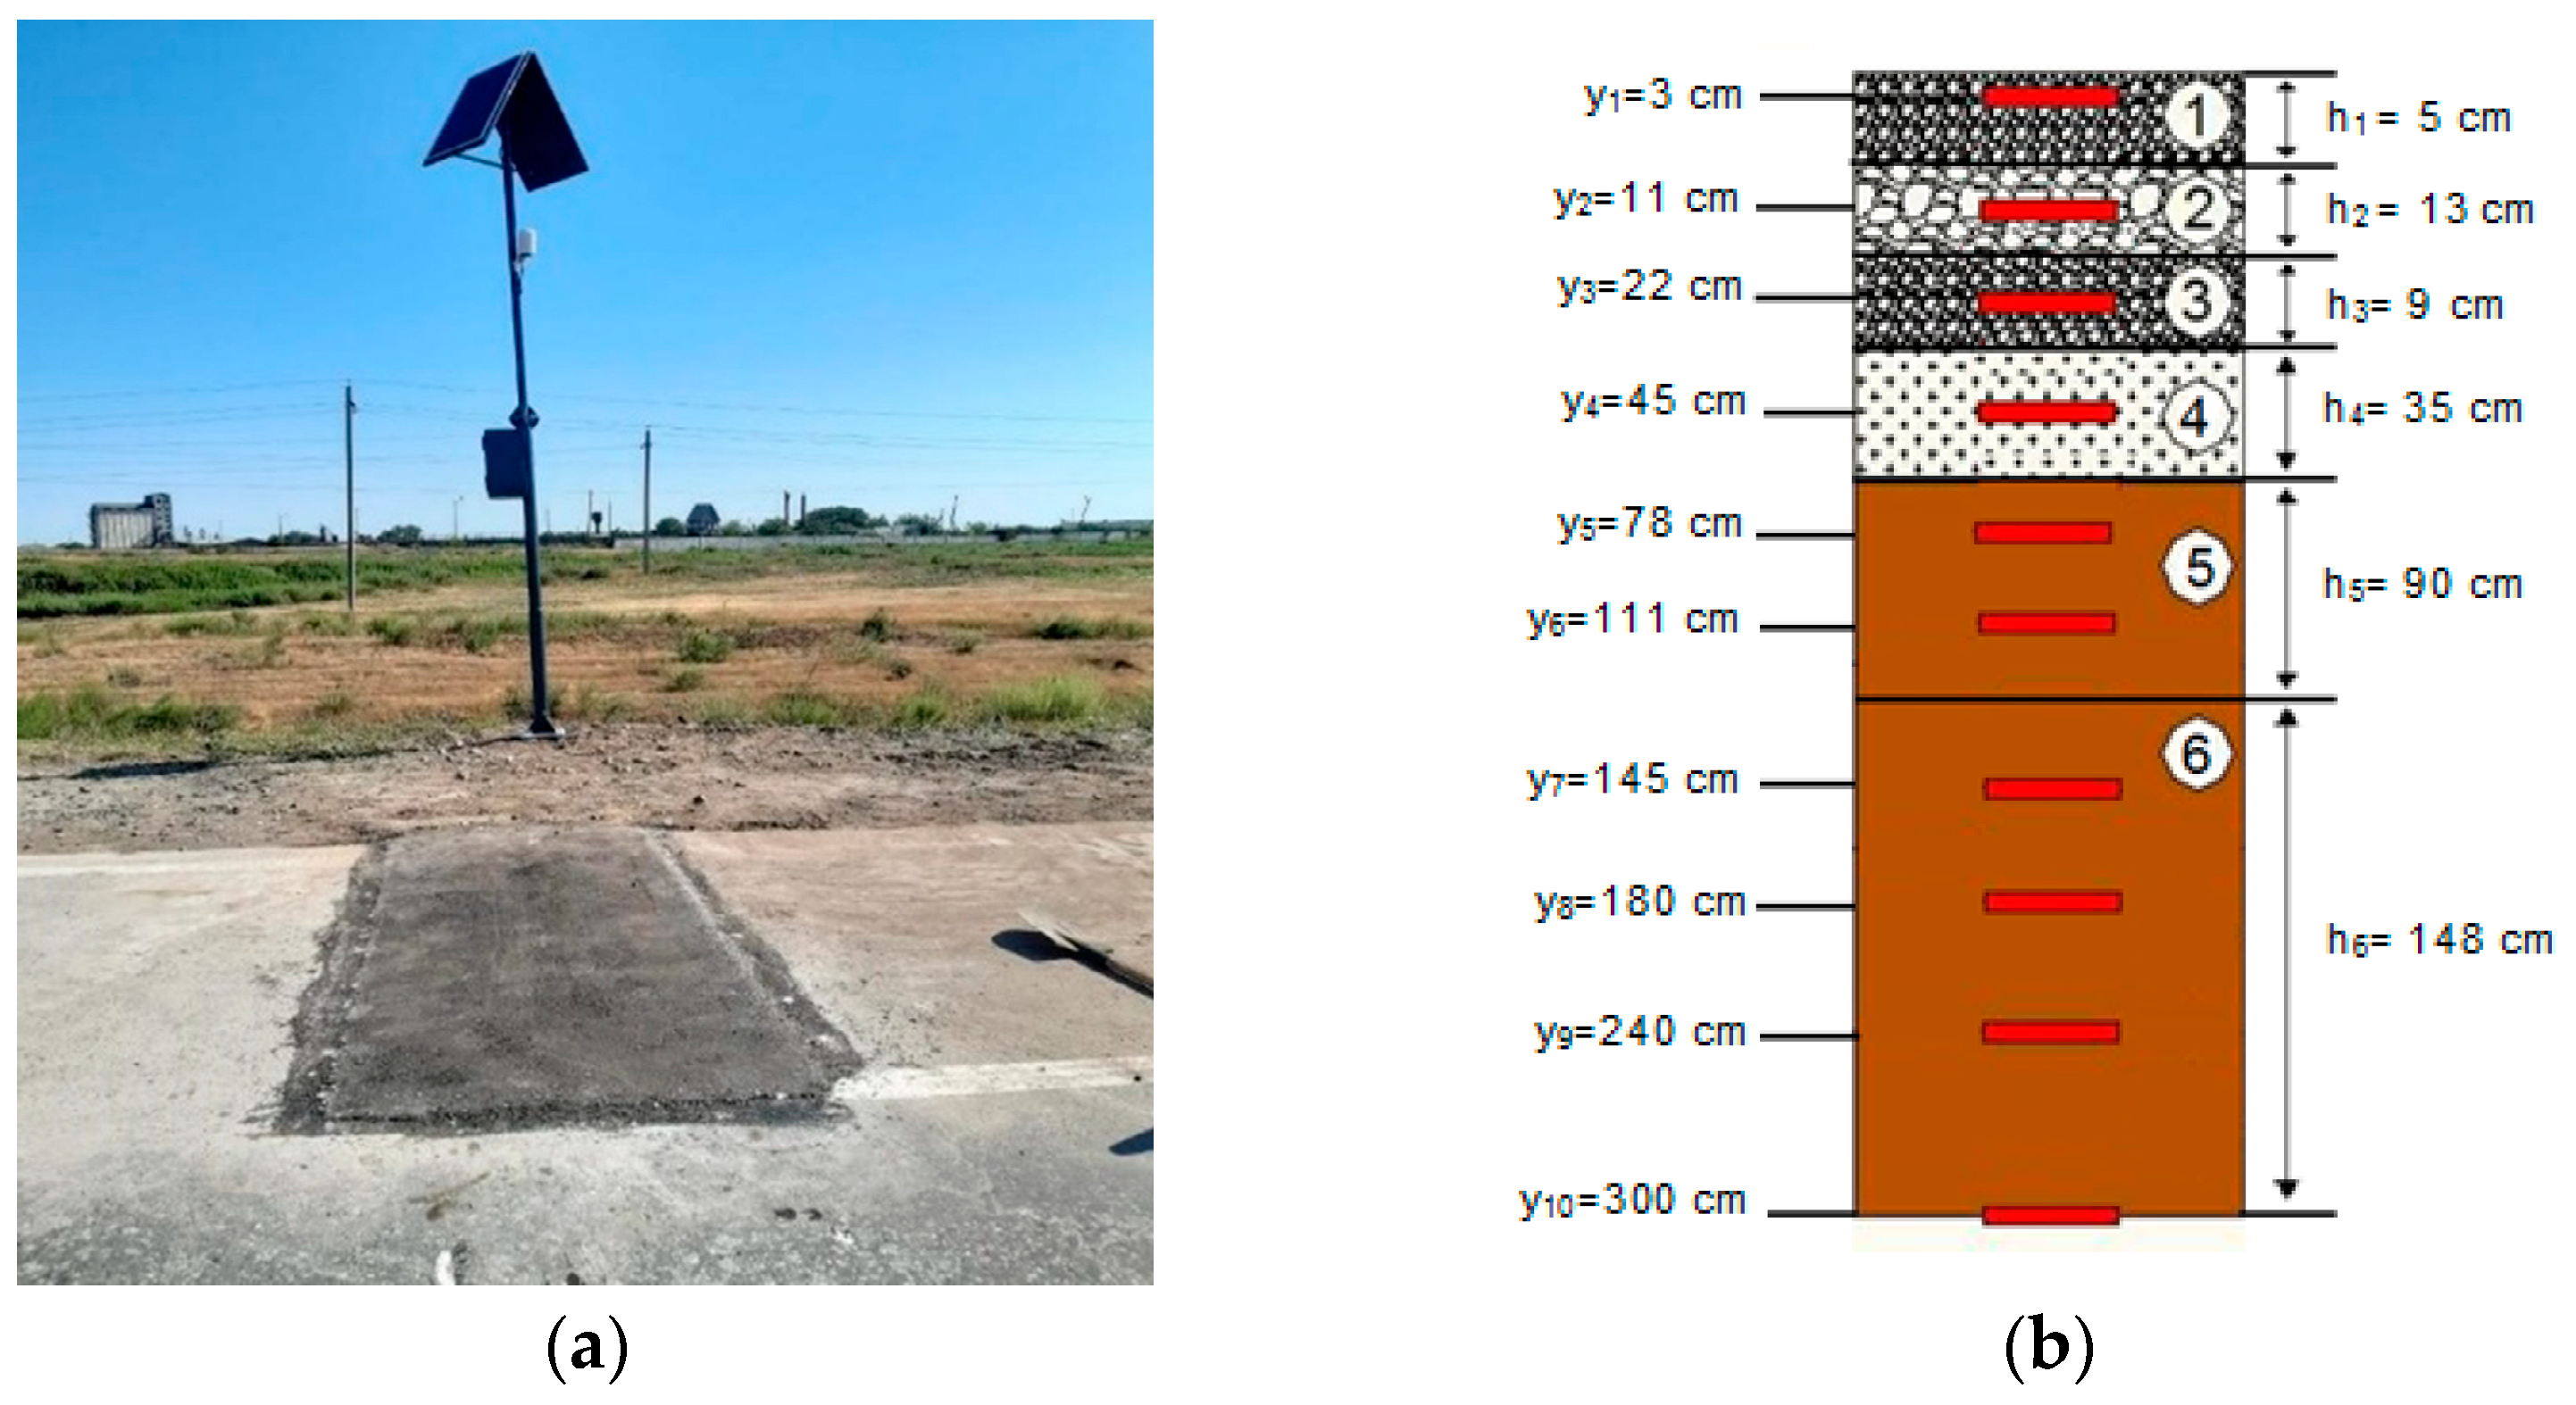
- The measuring stations used in the work make it possible to carry out long-term continuous monitoring of temperature and moisture in pavement and subgrade of highways. The results obtained are very important for road science and practice.
- (2)
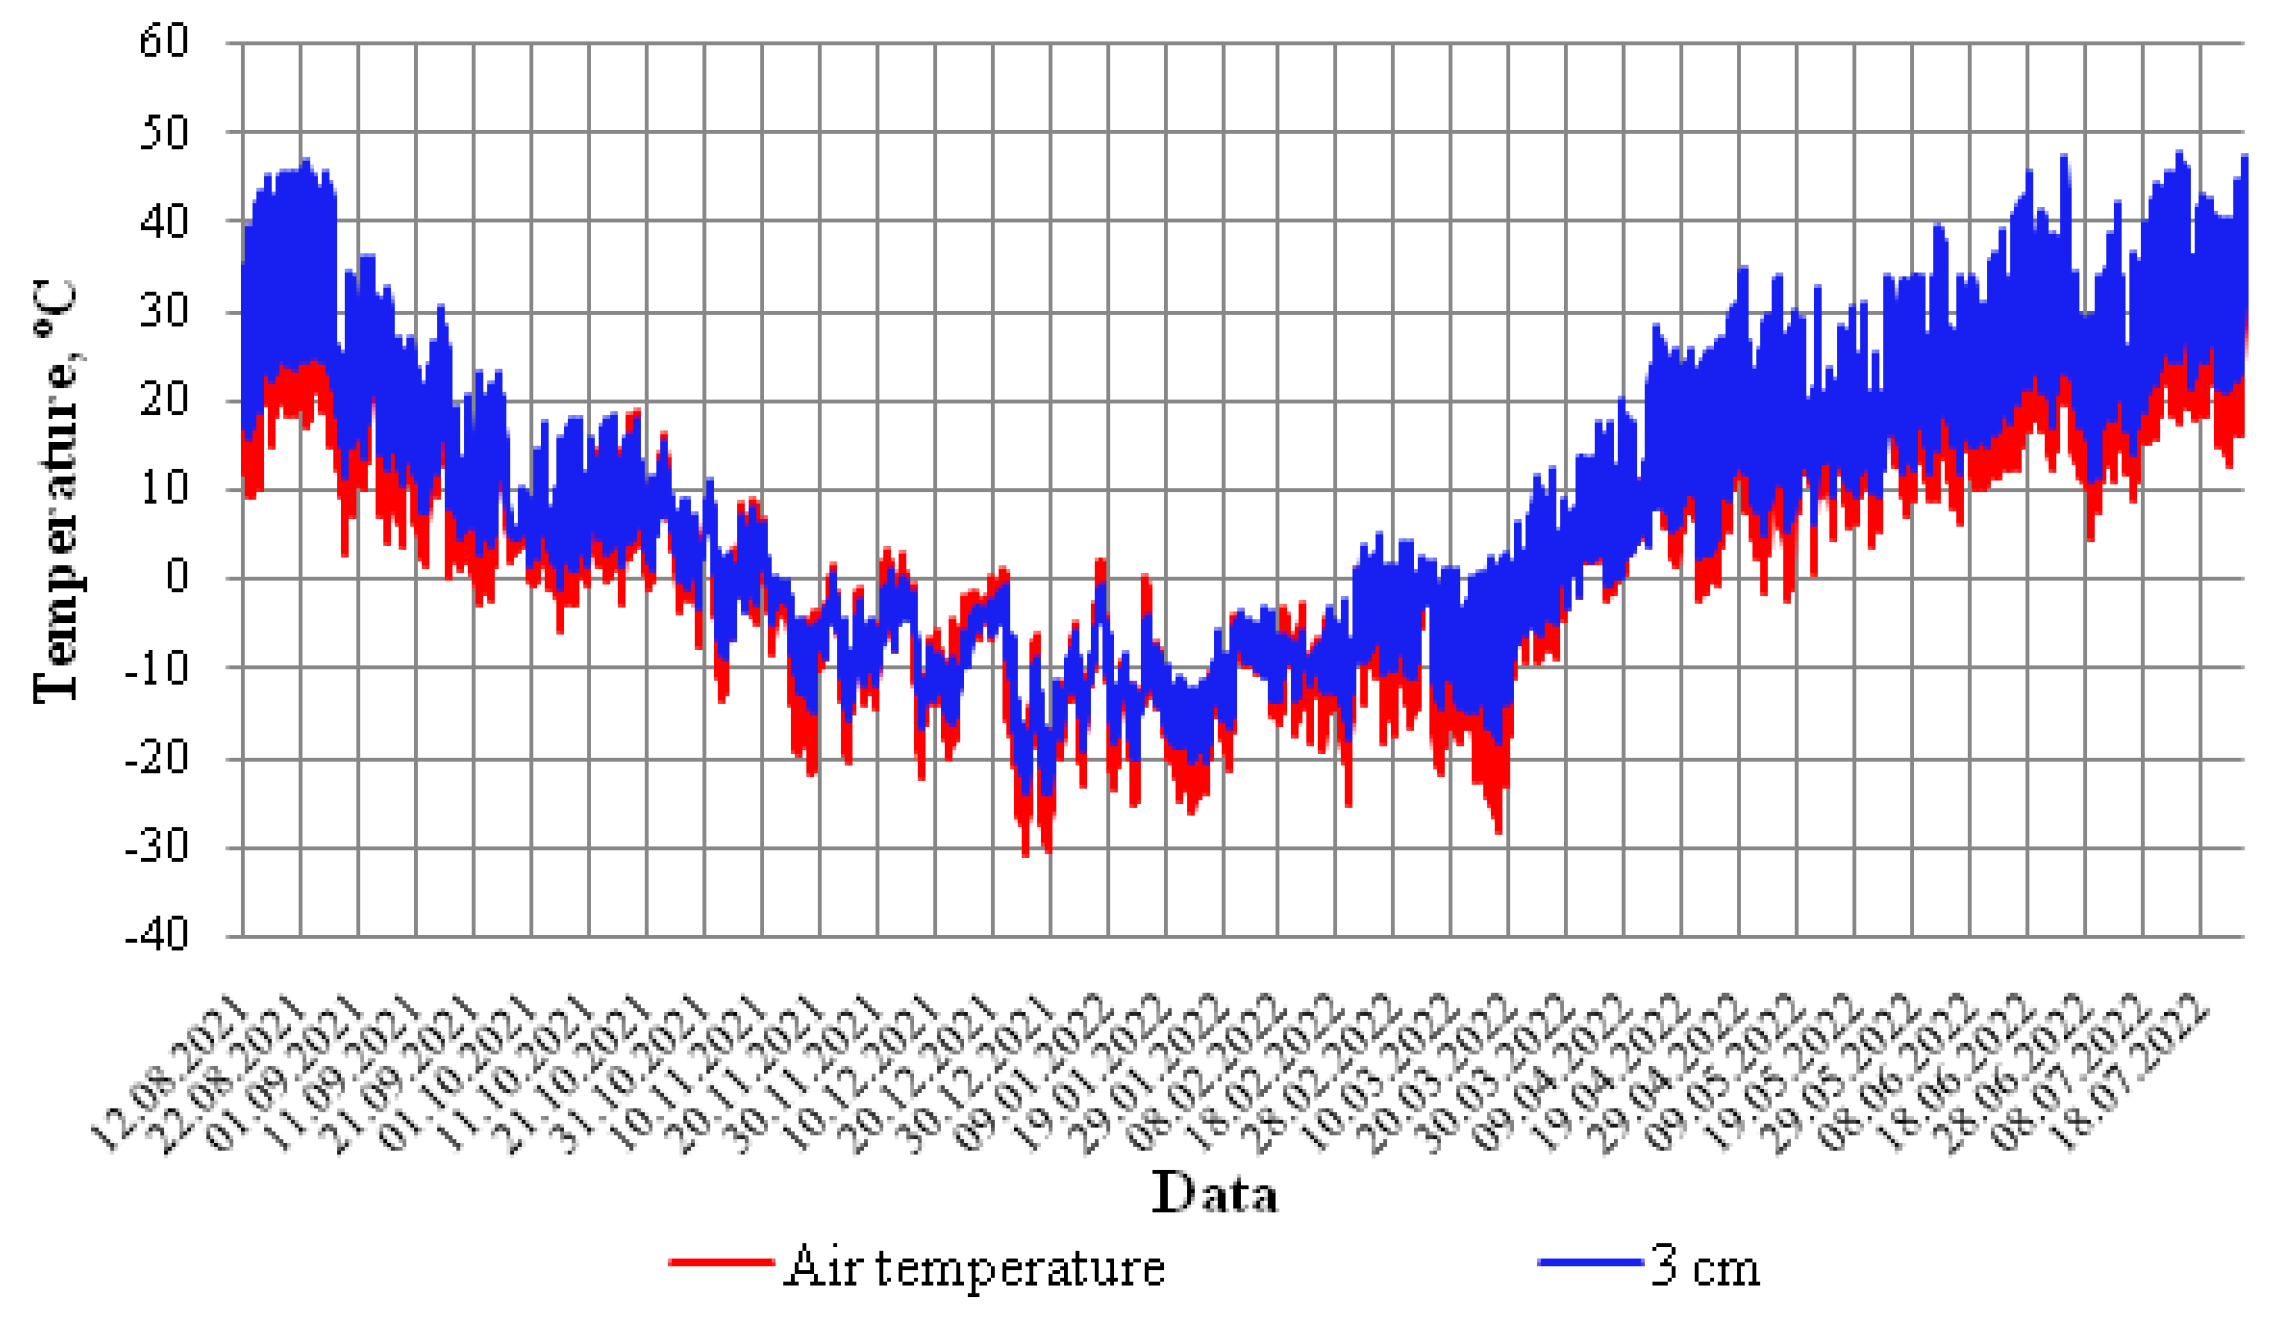
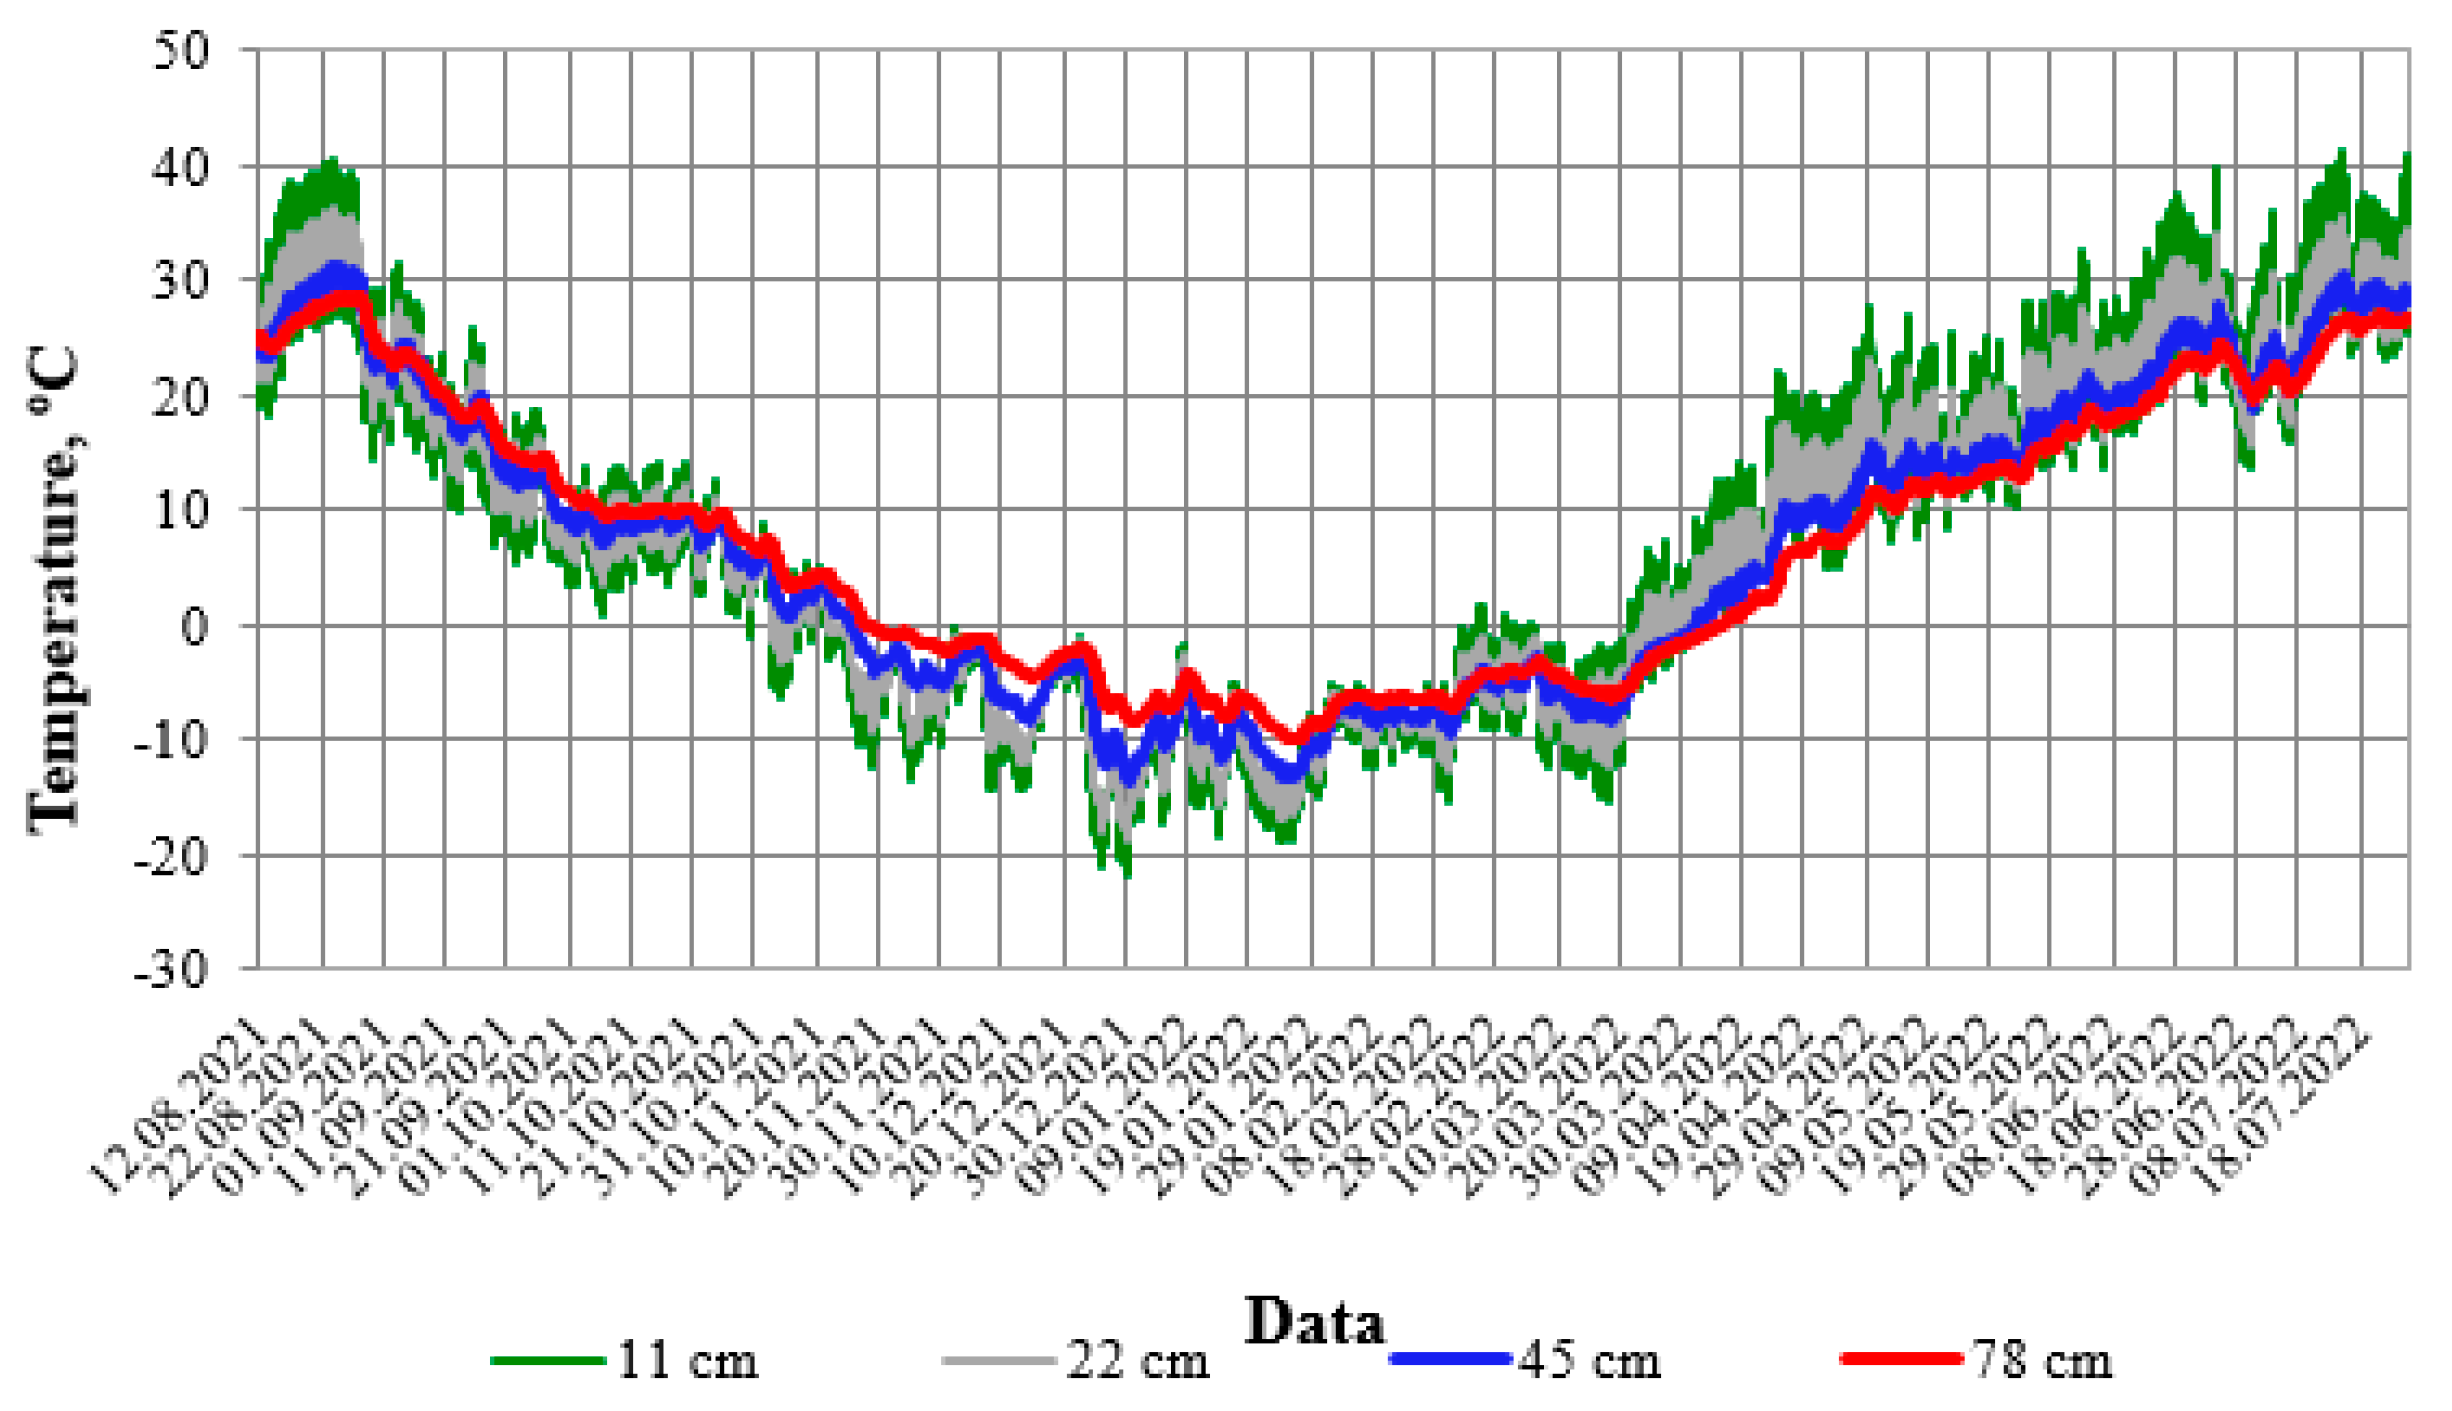
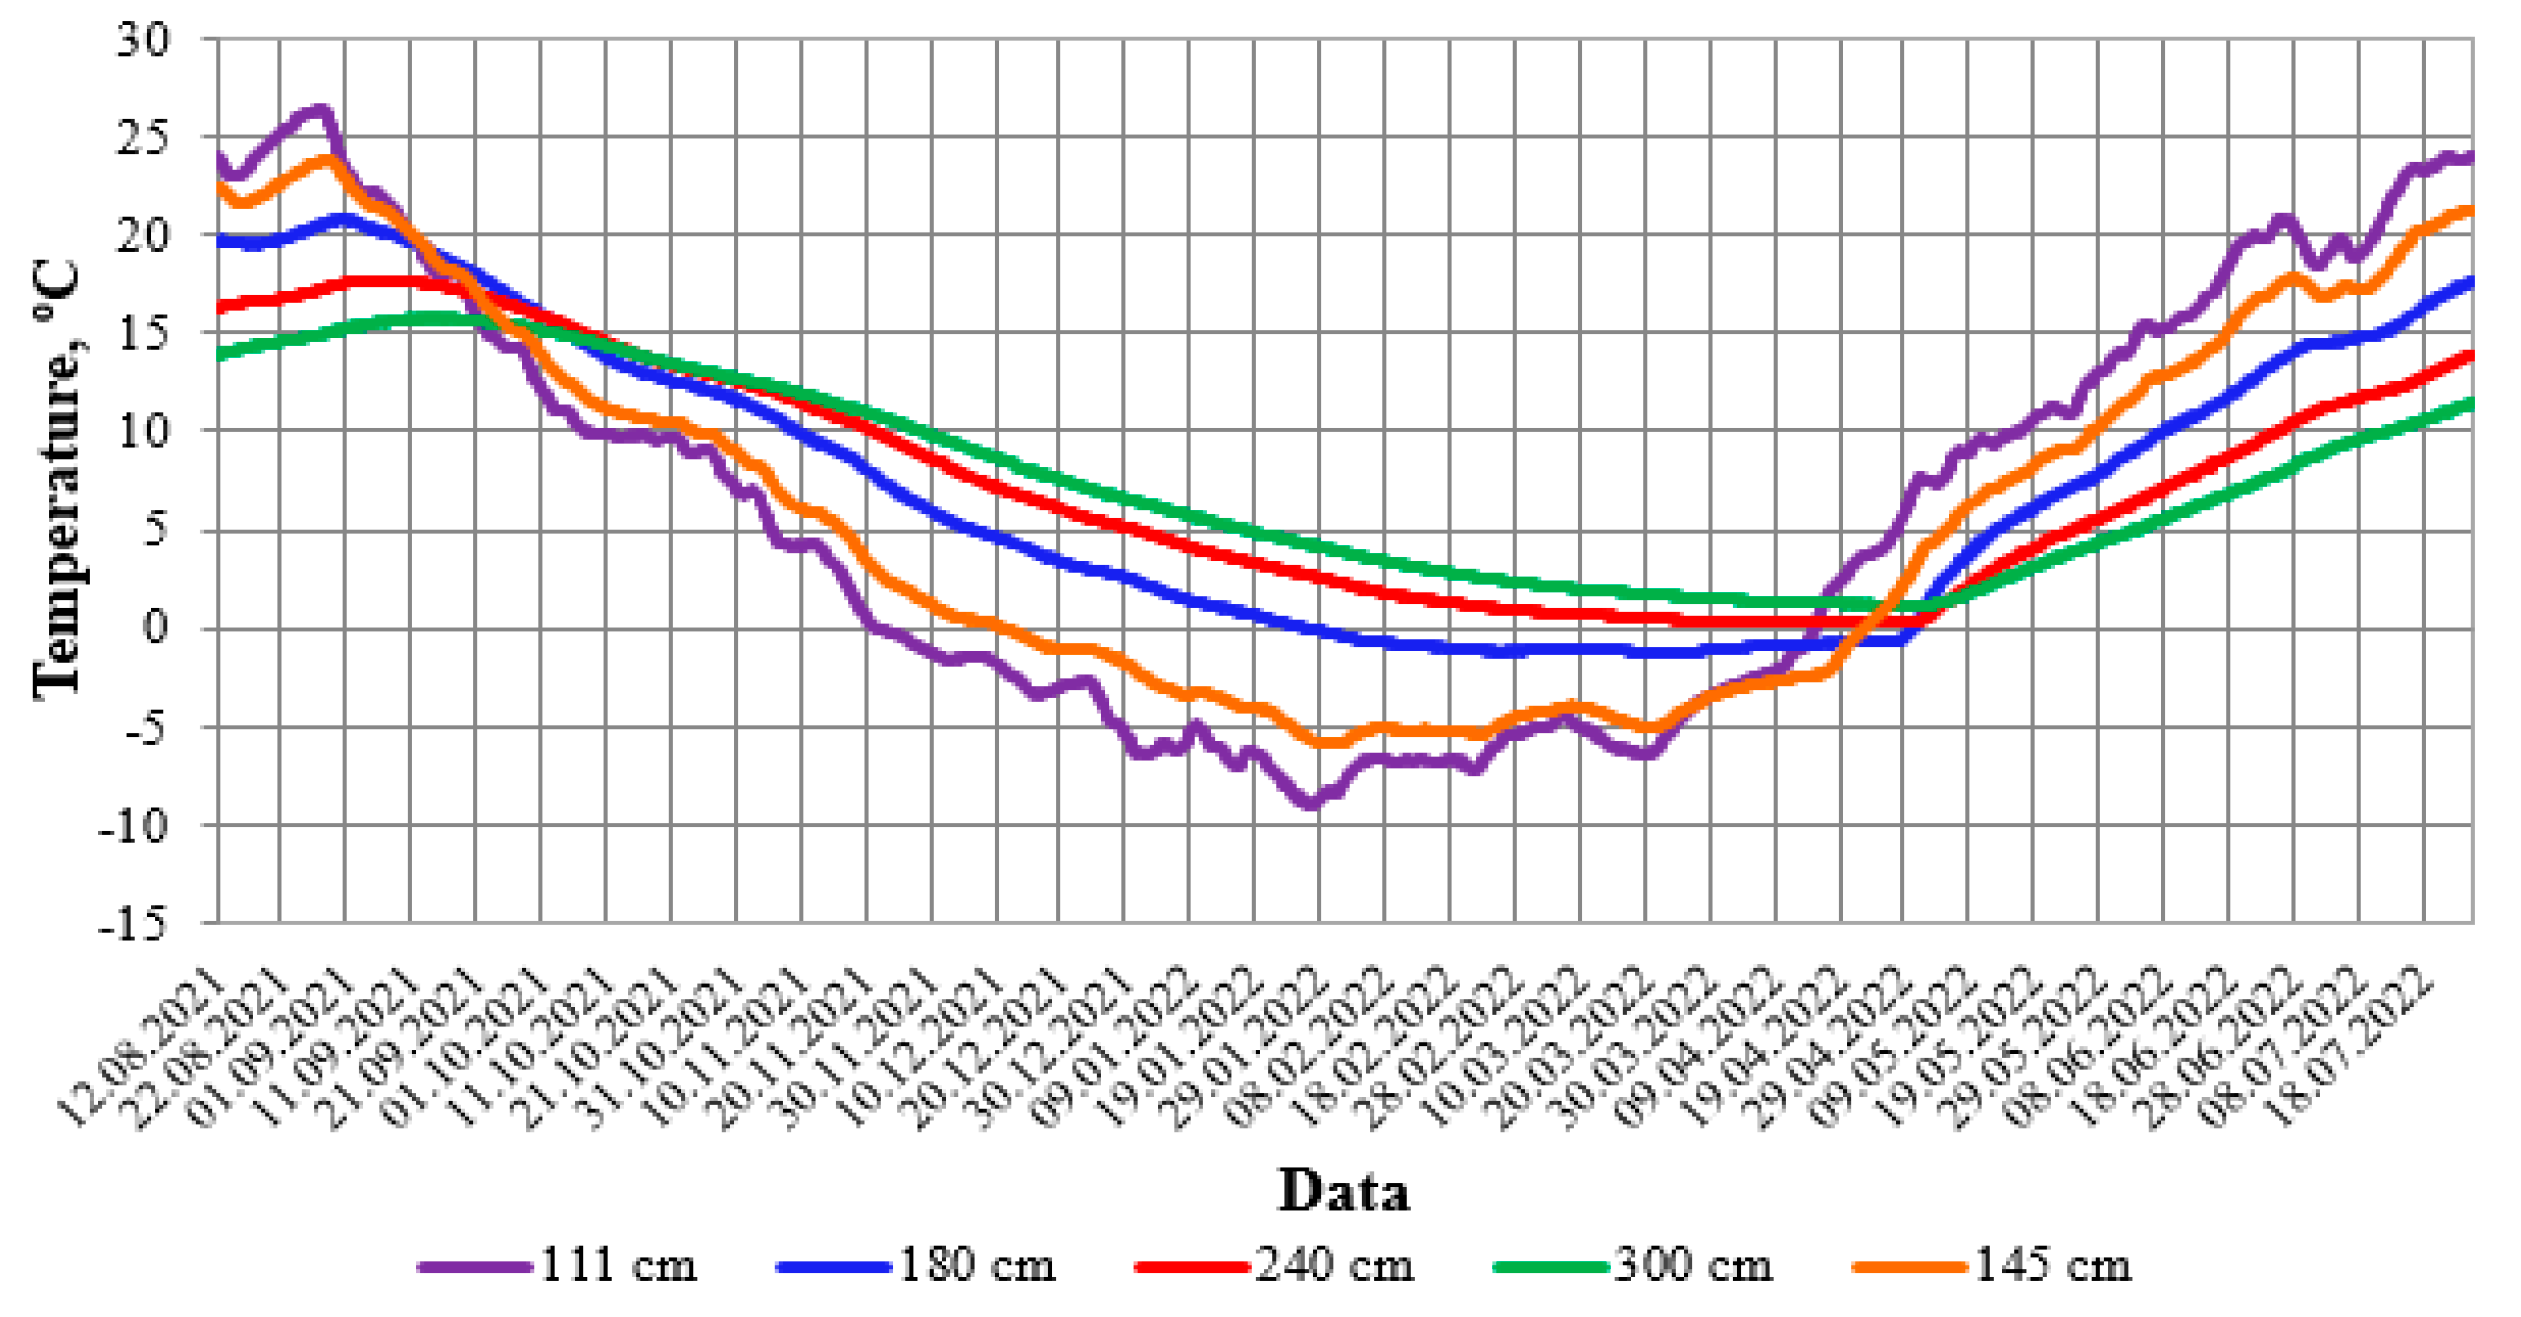
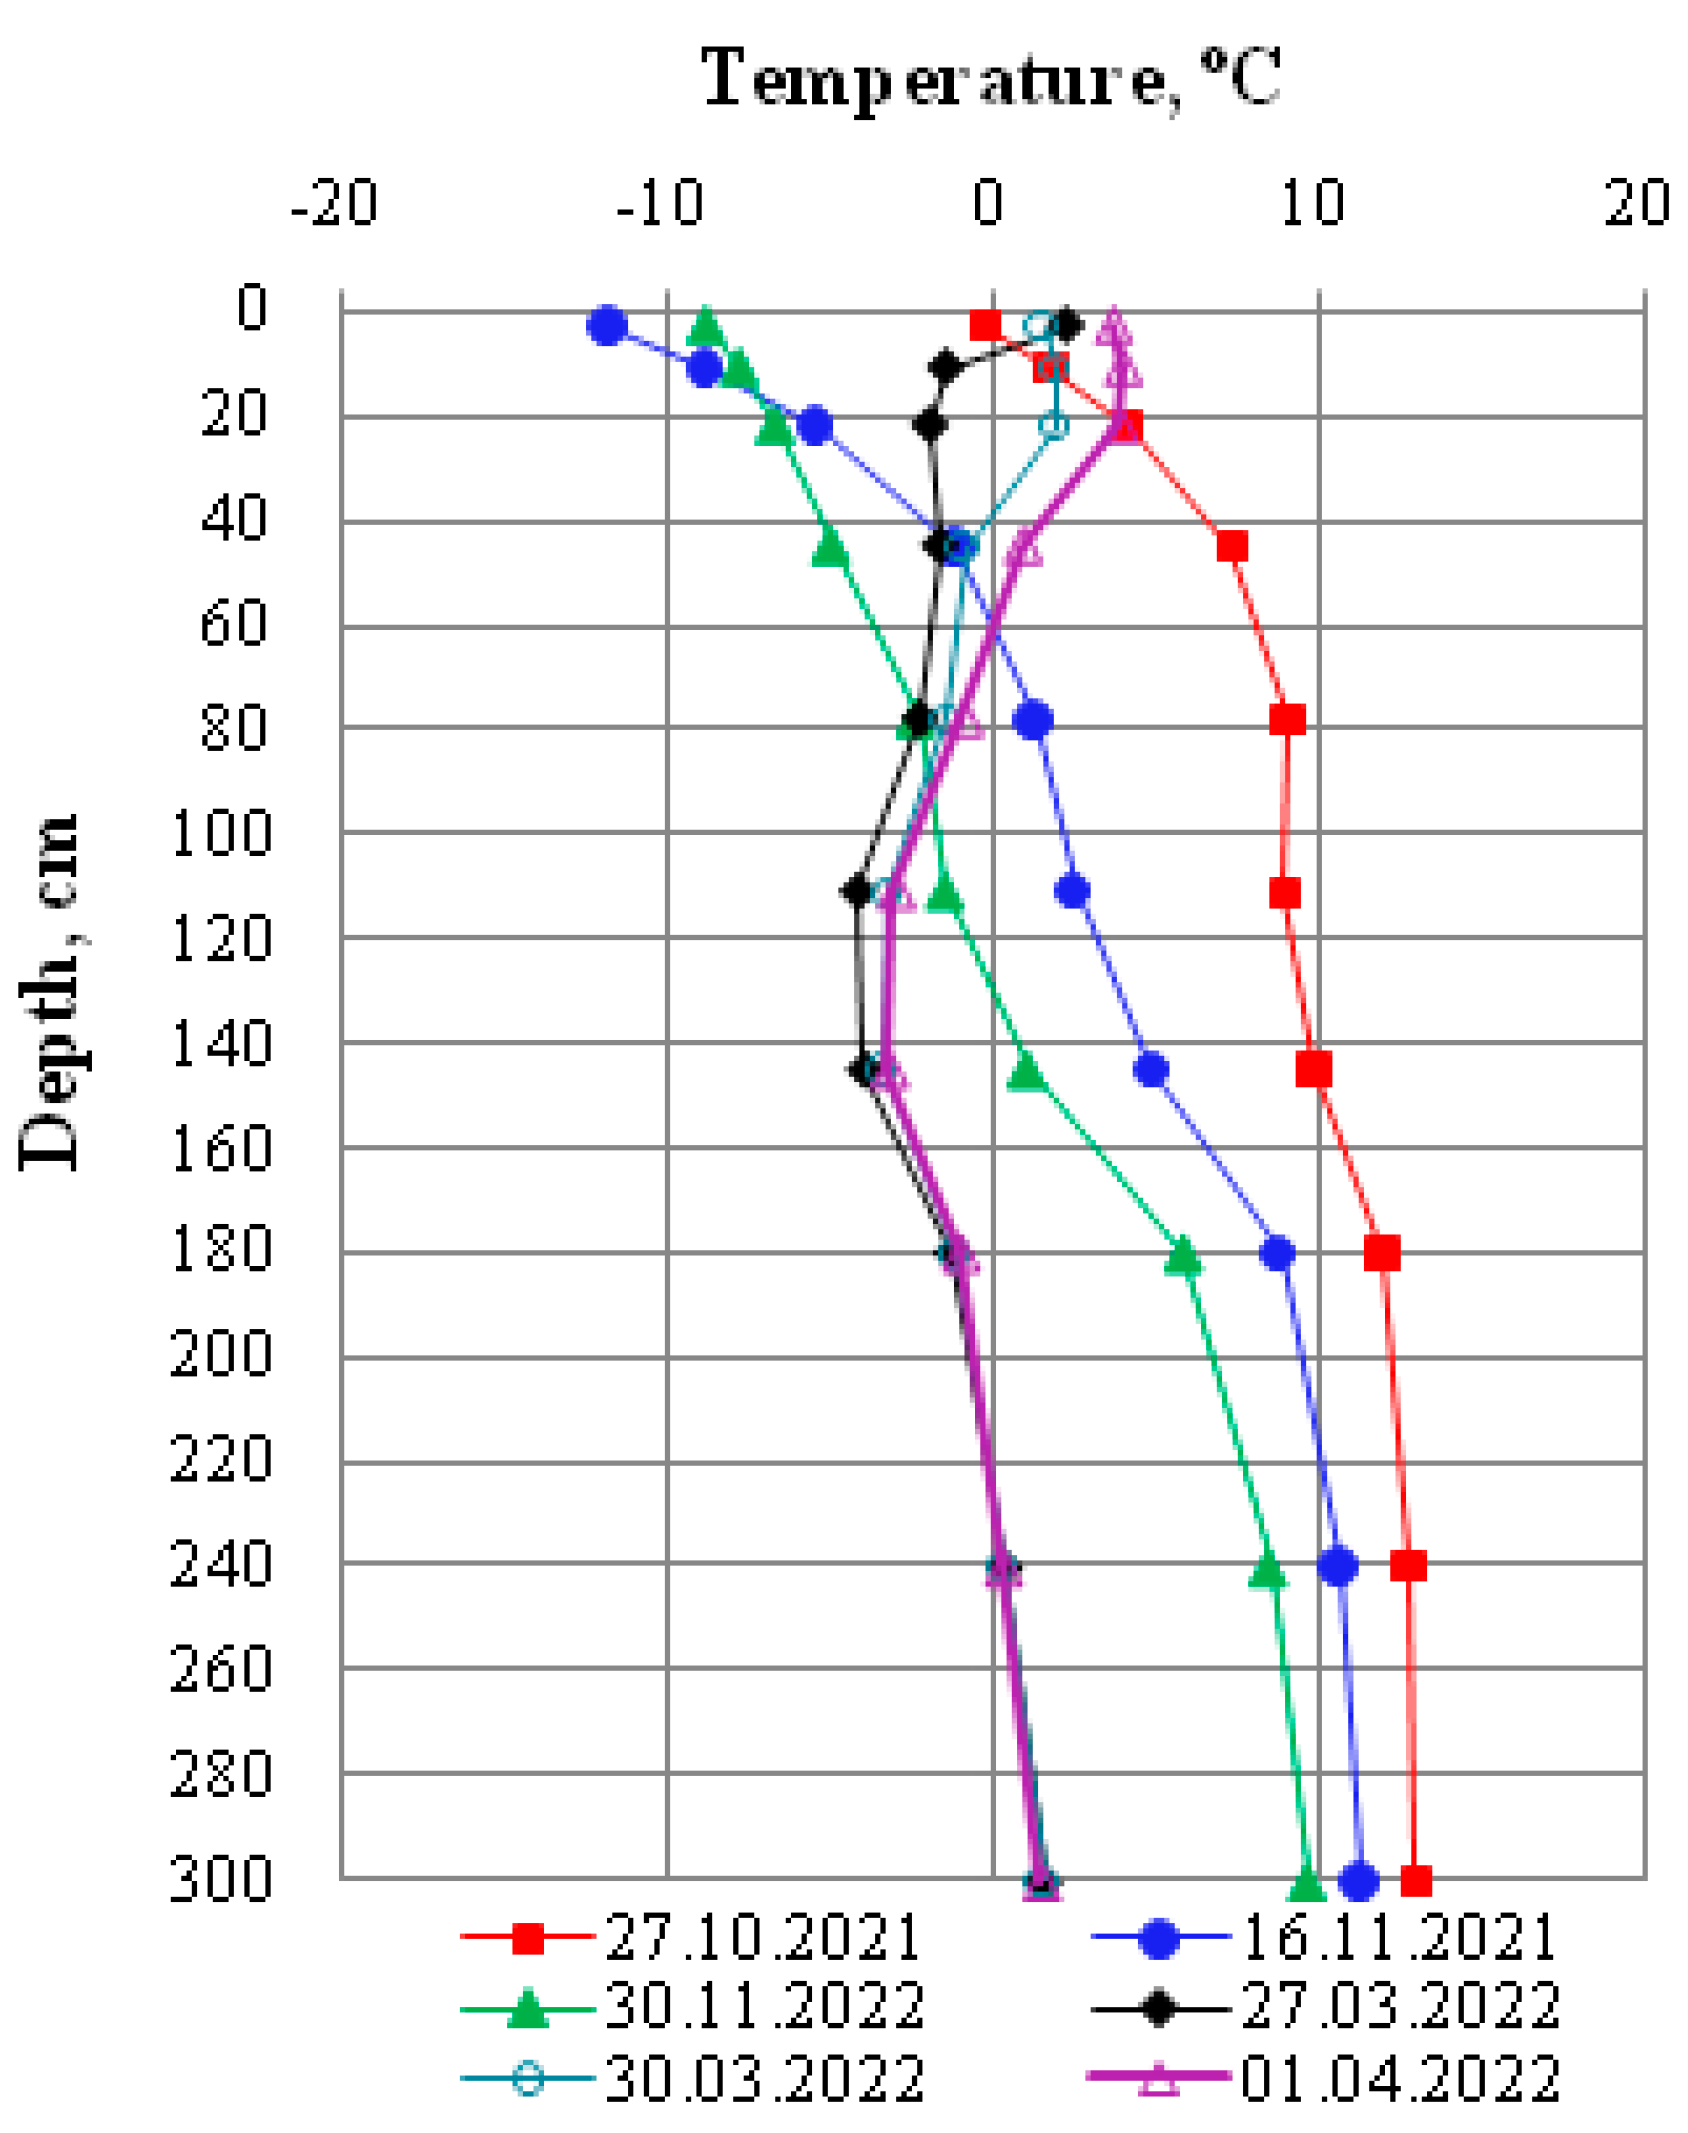
- In the upper part of the pavement (up to 30–40 cm), the temperature changes in annual and daily cycles. As the depth increases, the daily temperature fluctuations disappear, leaving only the annual fluctuation. At a depth of 180 cm and below, temperature fluctuations occur only in the annual cycle.
- (3)
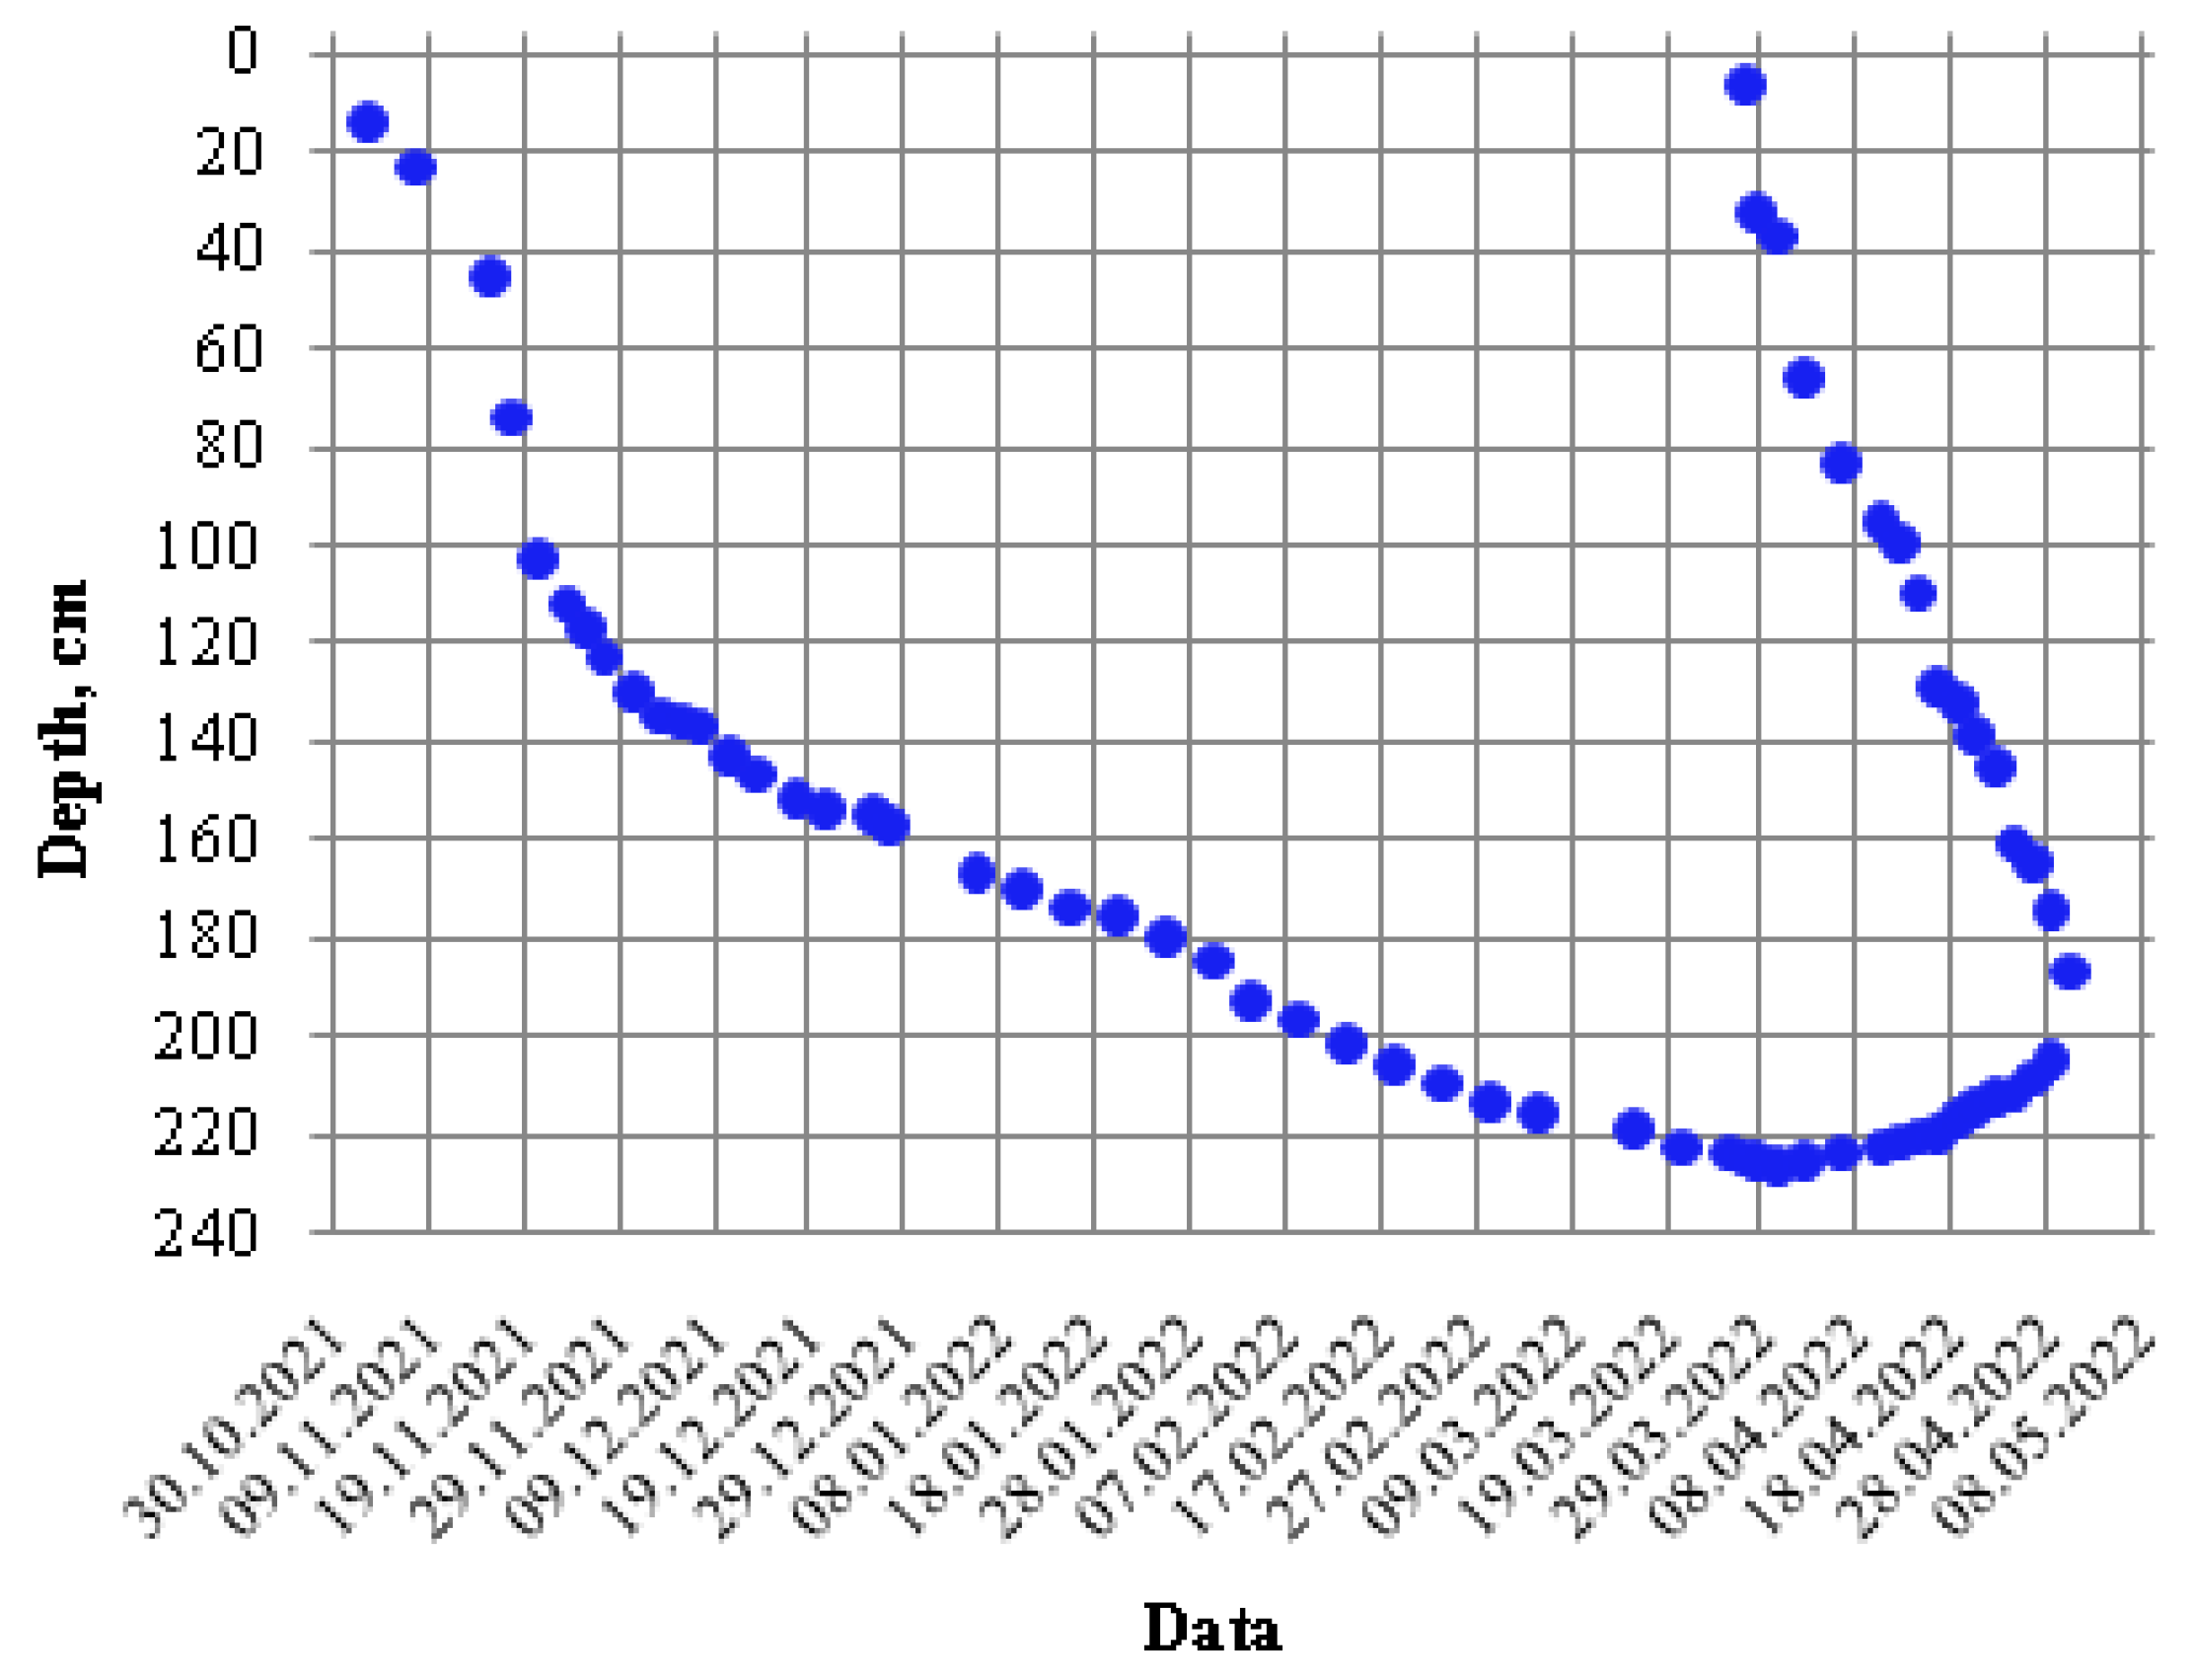
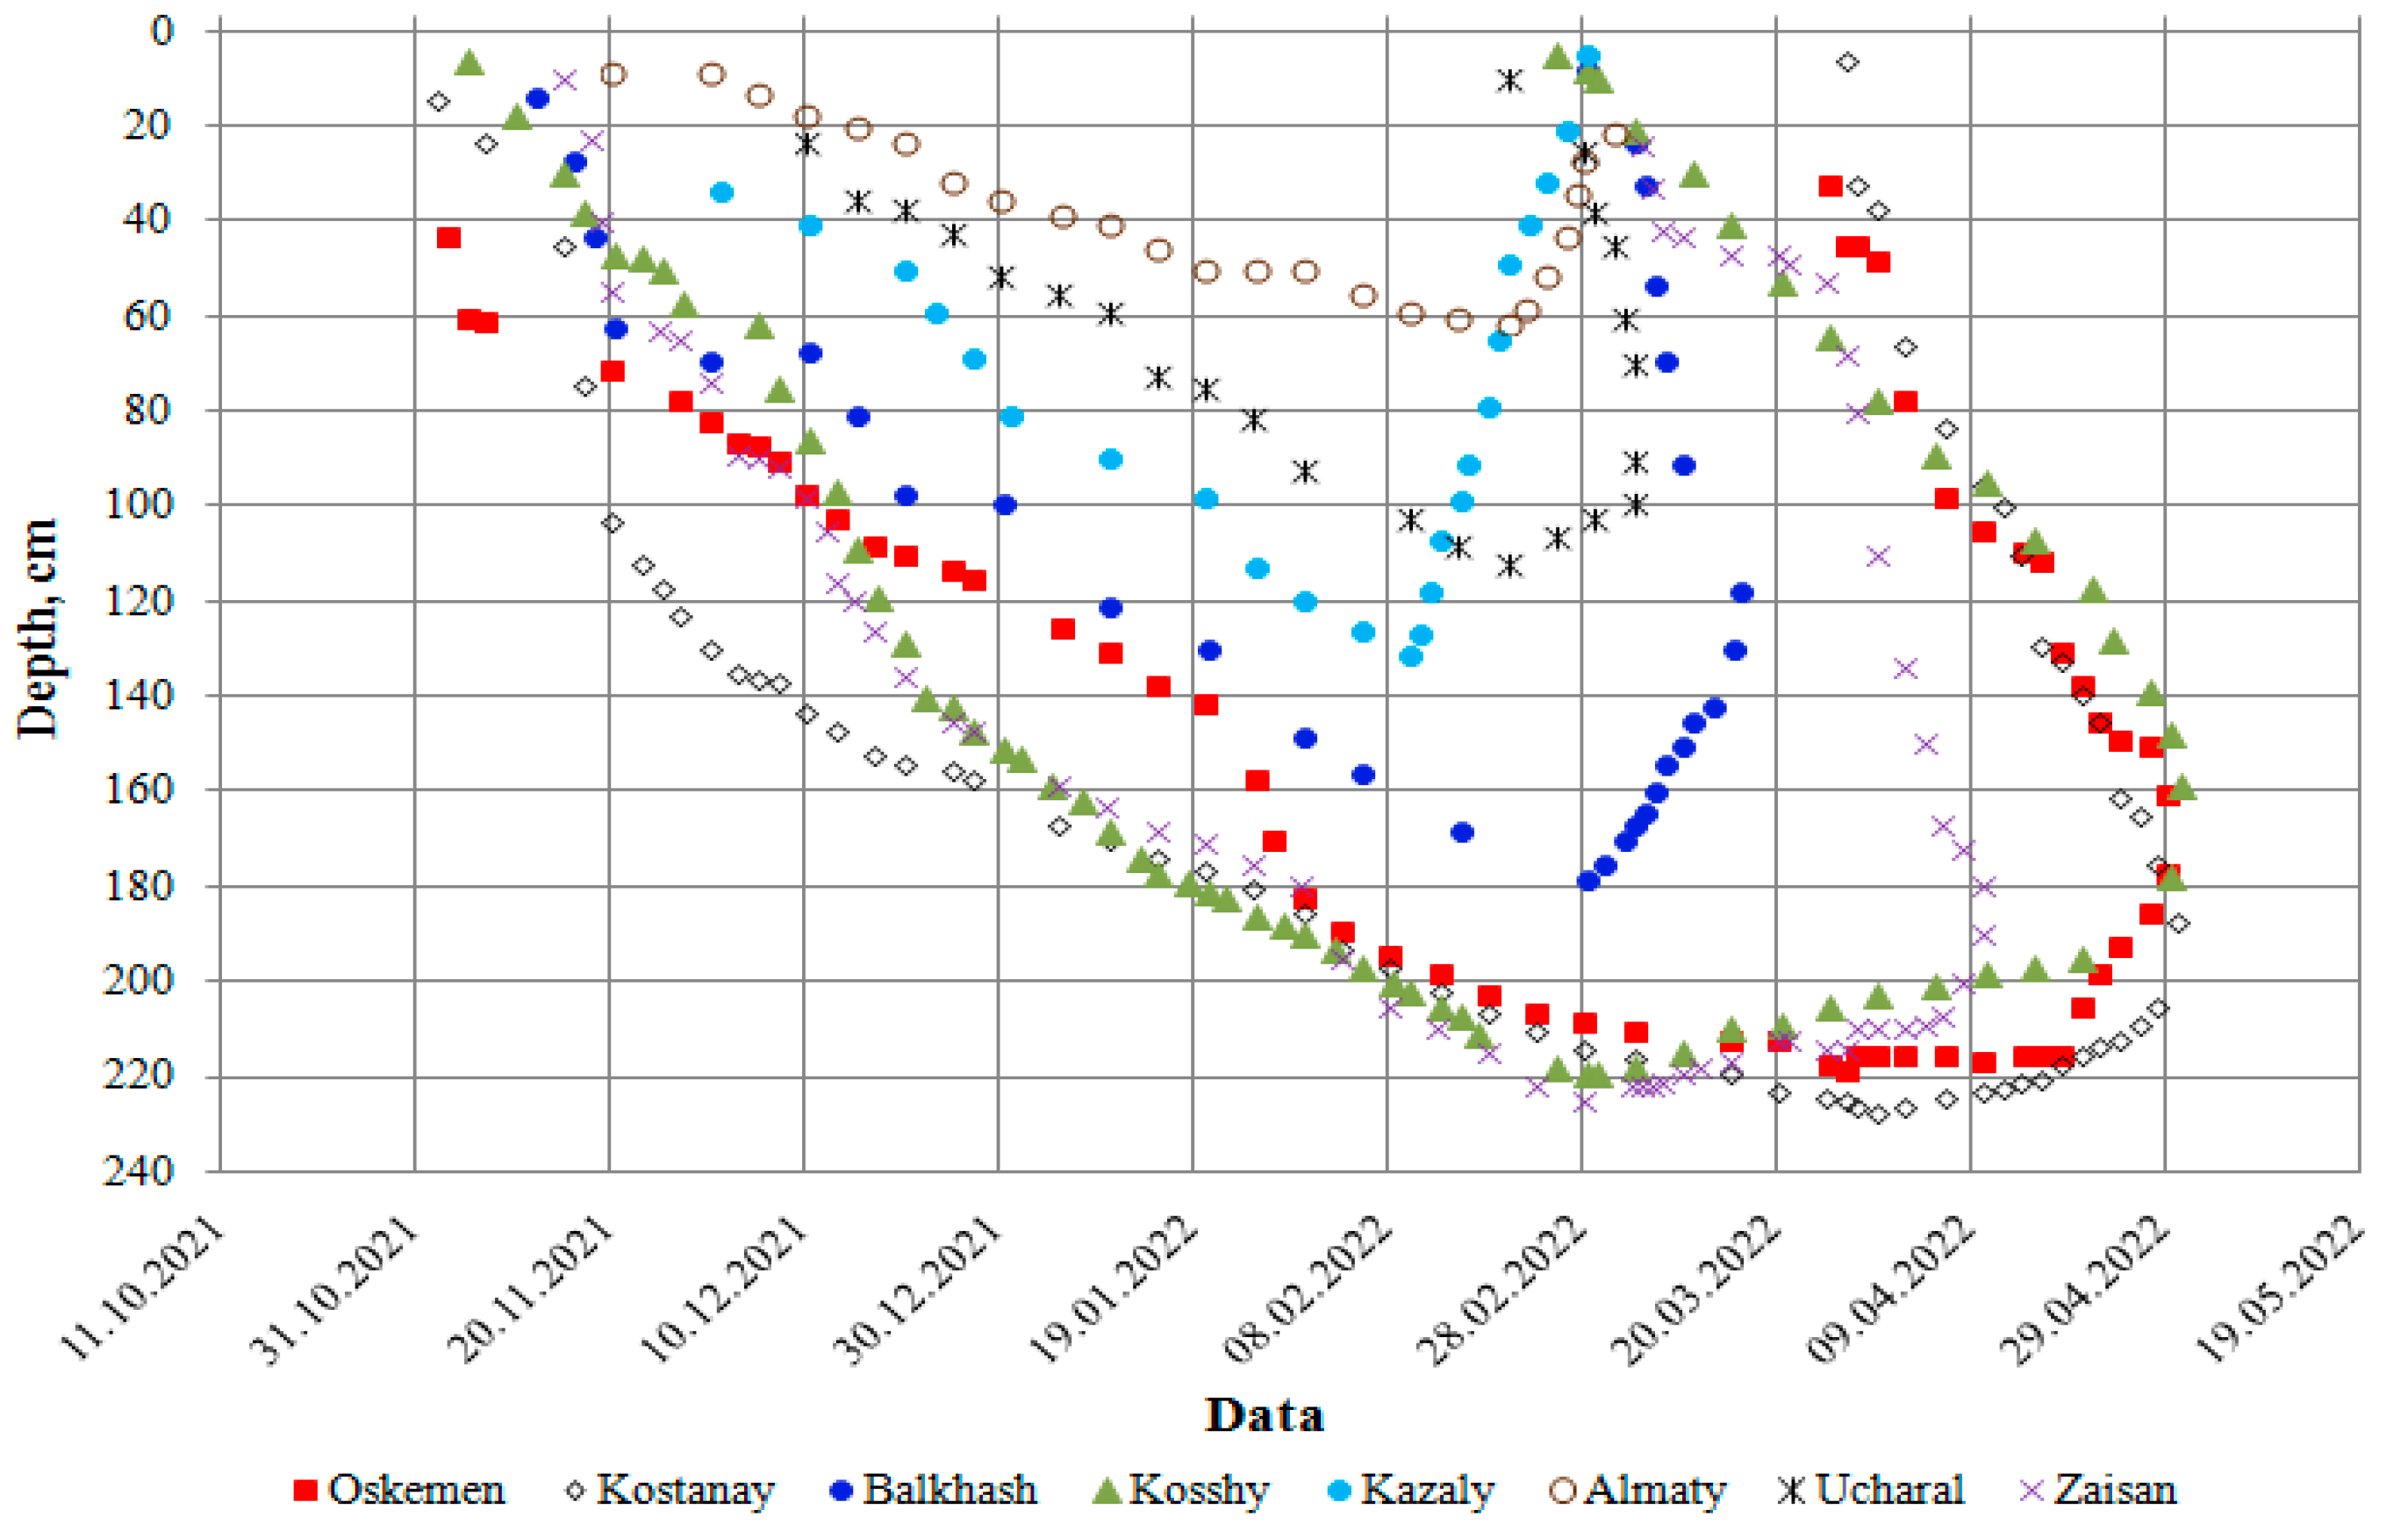
- During the cold period under consideration, on the selected section of the highway, the freezing process proceeded according to a complex pattern. The freezing rate varied from 14 cm/day to 0.33 cm/day. The maximum freezing depth was 227 cm.
- (4)
- In the subgrade at the beginning and end of the cold period (when the temperature has a value of approximately 0 °C), there are abrupt changes in moisture, which are explained by phase transitions of the second order: the transition from the liquid state to the solid (ice) at the beginning of the cold period and the transition of moisture from the solid state to liquid at the end of the cold period.
- (5)
- In autumn, on the surface of the subgrade, the moisture is 14%. It increases unevenly to a depth of 180 cm, at whichit reaches its maximum value (30–31%), then to a depth of 300 cm, and it decreases evenly to a value equal to 16–17%. In spring, on the surface of the subgrade, the moisture content is 10–12%. At depths of 78.111, 145, and 180 cm, it has a value equal to 11%, 19%, 18%, and 26%, respectively. In winter, due to the phase transitions in the subgrade, the moisture changes from 5% (on the surface of the subgrade) to 9% (at a depth of 145 cm).
Author Contributions
Funding
Institutional Review Board Statement
Informed Consent Statement
Data Availability Statement
Conflicts of Interest
References
- Leonovich, I.; Vyrko, N. Soil freezing depth as an important factor for water-thermal regime of subgrade. Constr. Sci. Technol. 2011, 5, 27–35. [Google Scholar]
- Zhao, T.; Liu, S.; Xu, J.; He, H.; Wang, D.; Horton, R.; Liu, G. Comparative analysis of seven machine learning algorithms and five empirical models to estimate soil thermal conductivity. Agric. Meteorol. 2022, 323, 109080. [Google Scholar] [CrossRef]
- Côté, J.; Konrad, J.-M. A generalized thermal conductivity model for soils and construction materials. Can. Geotech. J. 2005, 42, 443–458. [Google Scholar] [CrossRef]
- Johansen, O. Thermal conductivity of soils. In Thermal Conductivity of Soils; Cold Regions Research and Engineering Lab.: Hanover, NH, USA, 1977. [Google Scholar] [CrossRef]
- Lu, S.; Ren, T.; Gong, Y.; Horton, R. An improved model for predicting soil thermal conductivity from water content at room temperature. Soil Sci. Soc. Am. J. 2007, 71, 8–14. [Google Scholar] [CrossRef]
- Ming, J.; Zhao, Y.; Wu, Q.; Het, H.; Gao, L. Soil temperature dynamics and freezing processes for biocrustal soils in frozen soil regions on the Qinghai–tibet plateau. Geoderma 2022, 409, 115655. [Google Scholar] [CrossRef]
- Zhang, Y.F.; Wang, X.-P.; Hu, R.; Pan, Y.-X.; Zhang, H. Variation of albedo to soil moisture for sand dunes and biological soil crusts in arid desert ecosystems. Environ. Earth Sci. 2013, 71, 1281–1288. [Google Scholar] [CrossRef]
- Fahad, S.; Sönmez, O.; Saud, S.; Wang, D.; Wu, C.; Adnan, M.; Turan, V. Plant Growth Regulators for Climate-Smart Agriculture; CRC Press: Boca Raton, FL, USA, 2021. [Google Scholar] [CrossRef]
- Genxu, W.; Guangsheng, L.; Chunjie, L.; Yan, Y. The variability of soil thermal and hydrological dynamics with vegetation cover in a permafrost region. Agric. Meteorol. 2012, 162–163, 44–57. [Google Scholar] [CrossRef]
- Tutubalina, O.V.; Rees, W.G. Vegetation degradation in a permafrost region as seen from space: Noril’sk (1961–1999). Cold Reg. Sci. Technol. 2001, 32, 191–203. [Google Scholar] [CrossRef]
- Jin, H.J.; Sun, L.P.; Wang, S.L.; He, R.X.; Lü, L.Z.; Yu, S.P. Dual influences of local environmental variables on ground temperatures on the Qinghai- Tibet Plateau (I): Vegetation and snow cover. J. Glaciol. Geocryol. 2008, 30, 535–545. [Google Scholar]
- Puzakov, N.A.; Sidenko, V.M. Water-Thermal Regime of Subgrade and Pavements; Zolotar, I.A., Ed.; Transport: Moscow, Russia, 1971; p. 413.
- Puzakov, N.A. Water-Thermal Regime of Subgrade for Highways; Transport: Moscow, Russia, 1960; p. 128.
- Chen, J.; Wang, H.; Xie, P. Pavement temperature prediction: Theoretical models and critical affecting factors. Appl. Therm. Eng. 2019, 158, 113755. [Google Scholar] [CrossRef]
- Chandrappa, A.K.; Biligiri, K.P. Development of pavement-surface temperature predictive models: Parametric approach. J. Mater. Civ. Eng. 2016, 28, 04015143. [Google Scholar] [CrossRef]
- Godoy, J.; Haber, R.; Muñoz, J.J.; Matía, F.; García, Á. Smart sensing of pavement temperature based on low-cost sensors and V2I communications. Sensors 2018, 18, 2092. [Google Scholar] [CrossRef] [PubMed] [Green Version]
- Dawson, T.; Baladi, G.; Musunuru, G.; Prohaska, M.; Jiang, Y. Global procedure for temperature adjustment of measured pavement deflection data: Based on the long-term pavement performance seasonal monitoring program. Transp. Res. Rec. J. Transp. Res. Board 2016, 2589, 146–153. [Google Scholar] [CrossRef]
- Corej, J.; Korenko, M.; Remisova, E. Climatic characteristics and the temperature regime of asphalt pavements. Commun.—Sci. Lett. Univ. Zilina 2004, 6, 31–36. [Google Scholar] [CrossRef]
- Jones, S.B.; Wraith, J.M.; Or, D. Time domain reflectometry measurement principles and applications. Hydrol. Process. 2002, 16, 141–153. [Google Scholar] [CrossRef]
- Chanzy, A.; Gaudu, J.-C.; Marloie, O. Correcting the temperature influence on soil capacitance sensors using diurnal temperature and water content cycles. Sensors 2012, 12, 9773–9790. [Google Scholar] [CrossRef] [Green Version]
- Bogena, H.R.; Huisman, J.A.; Oberdörster, C.; Vereecken, H. Evaluation of a low-cost soil water content sensor for wireless network applications. J. Hydrol. 2007, 344, 32–42. [Google Scholar] [CrossRef]
- Wilczek, A.; Szypłowska, A.; Kafarski, M.; Skierucha, W. A time-domain reflectometry method with variable needle pulse width for measuring the dielectric properties of materials. Sensors 2016, 16, 191. [Google Scholar] [CrossRef] [Green Version]
- Skierucha, W.; Wilczek, A.; Szypłowska, A.; Sławiński, C.; Lamorski, K.A. TDR-based soil moisture monitoring system with simultaneous measurement of soil temperature and electrical conductivity. Sensors 2012, 12, 13545–13566. [Google Scholar] [CrossRef]
- Teltayev, B.; Liu, J.; Suppes, E. Distribution of temperature, moisture, stress and strain in the highway. Mag. Civ. Eng. 2018, 7, 102–113. [Google Scholar] [CrossRef]
- Teltayev, B.; Suppes, E.; Liu, J. Impact of freezing of subgrade on pavement deformation. In Proceedings of the 19th International Conference on Soil Mechanics and Geotechnical Engineering, Seoul, Republic of Korea, 17–20 September 2017; pp. 1419–1422. [Google Scholar]
- Teltayev, B.B.; Suppes, E.A. Temperature and moisture in a highway in the south of Kazakhstan. Transp.Geotech. 2019, 21, 100292. [Google Scholar] [CrossRef]
- Teltayev, B.B.; Suppes, E.A. Temperature in pavement and subgrade and its effect on moisture. Case Stud. Therm. Eng. 2019, 13, 100363. [Google Scholar] [CrossRef]
- Teltayev, B.B.; Baibatyrov, A.I.; Suppes, E.A. Characteristics of highway subgrade frost penetration in regions of the Kazakhstan. Jpn. Geotech. Soc. Spec. Publ. 2016, 2, 1664–1668. [Google Scholar] [CrossRef]
- Teltayev, B.B.; Loprencipe, G.; Bonin, G.; Suppes, E.A.; Tileu, T.B. Temperature and moisture in highways in different regions of Kazakhstan. Mag. Civ. Eng. 2020, 8, 1–21. [Google Scholar]


| Name of Materials for Structural Layers and Soils | Layers Thickness, cm |
|---|---|
| Fine-grained (20 mm) dense asphalt concrete | h1 = 5 |
| Coarse-grained (40 mm) porous asphalt concrete | h2 = 13 |
| Coarse-grained (40 mm) high porous asphalt concrete | h3 = 9 |
| Mixture of crushed stone, gravel, and sand (80 mm) | h4 = 35 |
| Sandy loam | h5 = 90 |
| Black soil | h6 = 148 |
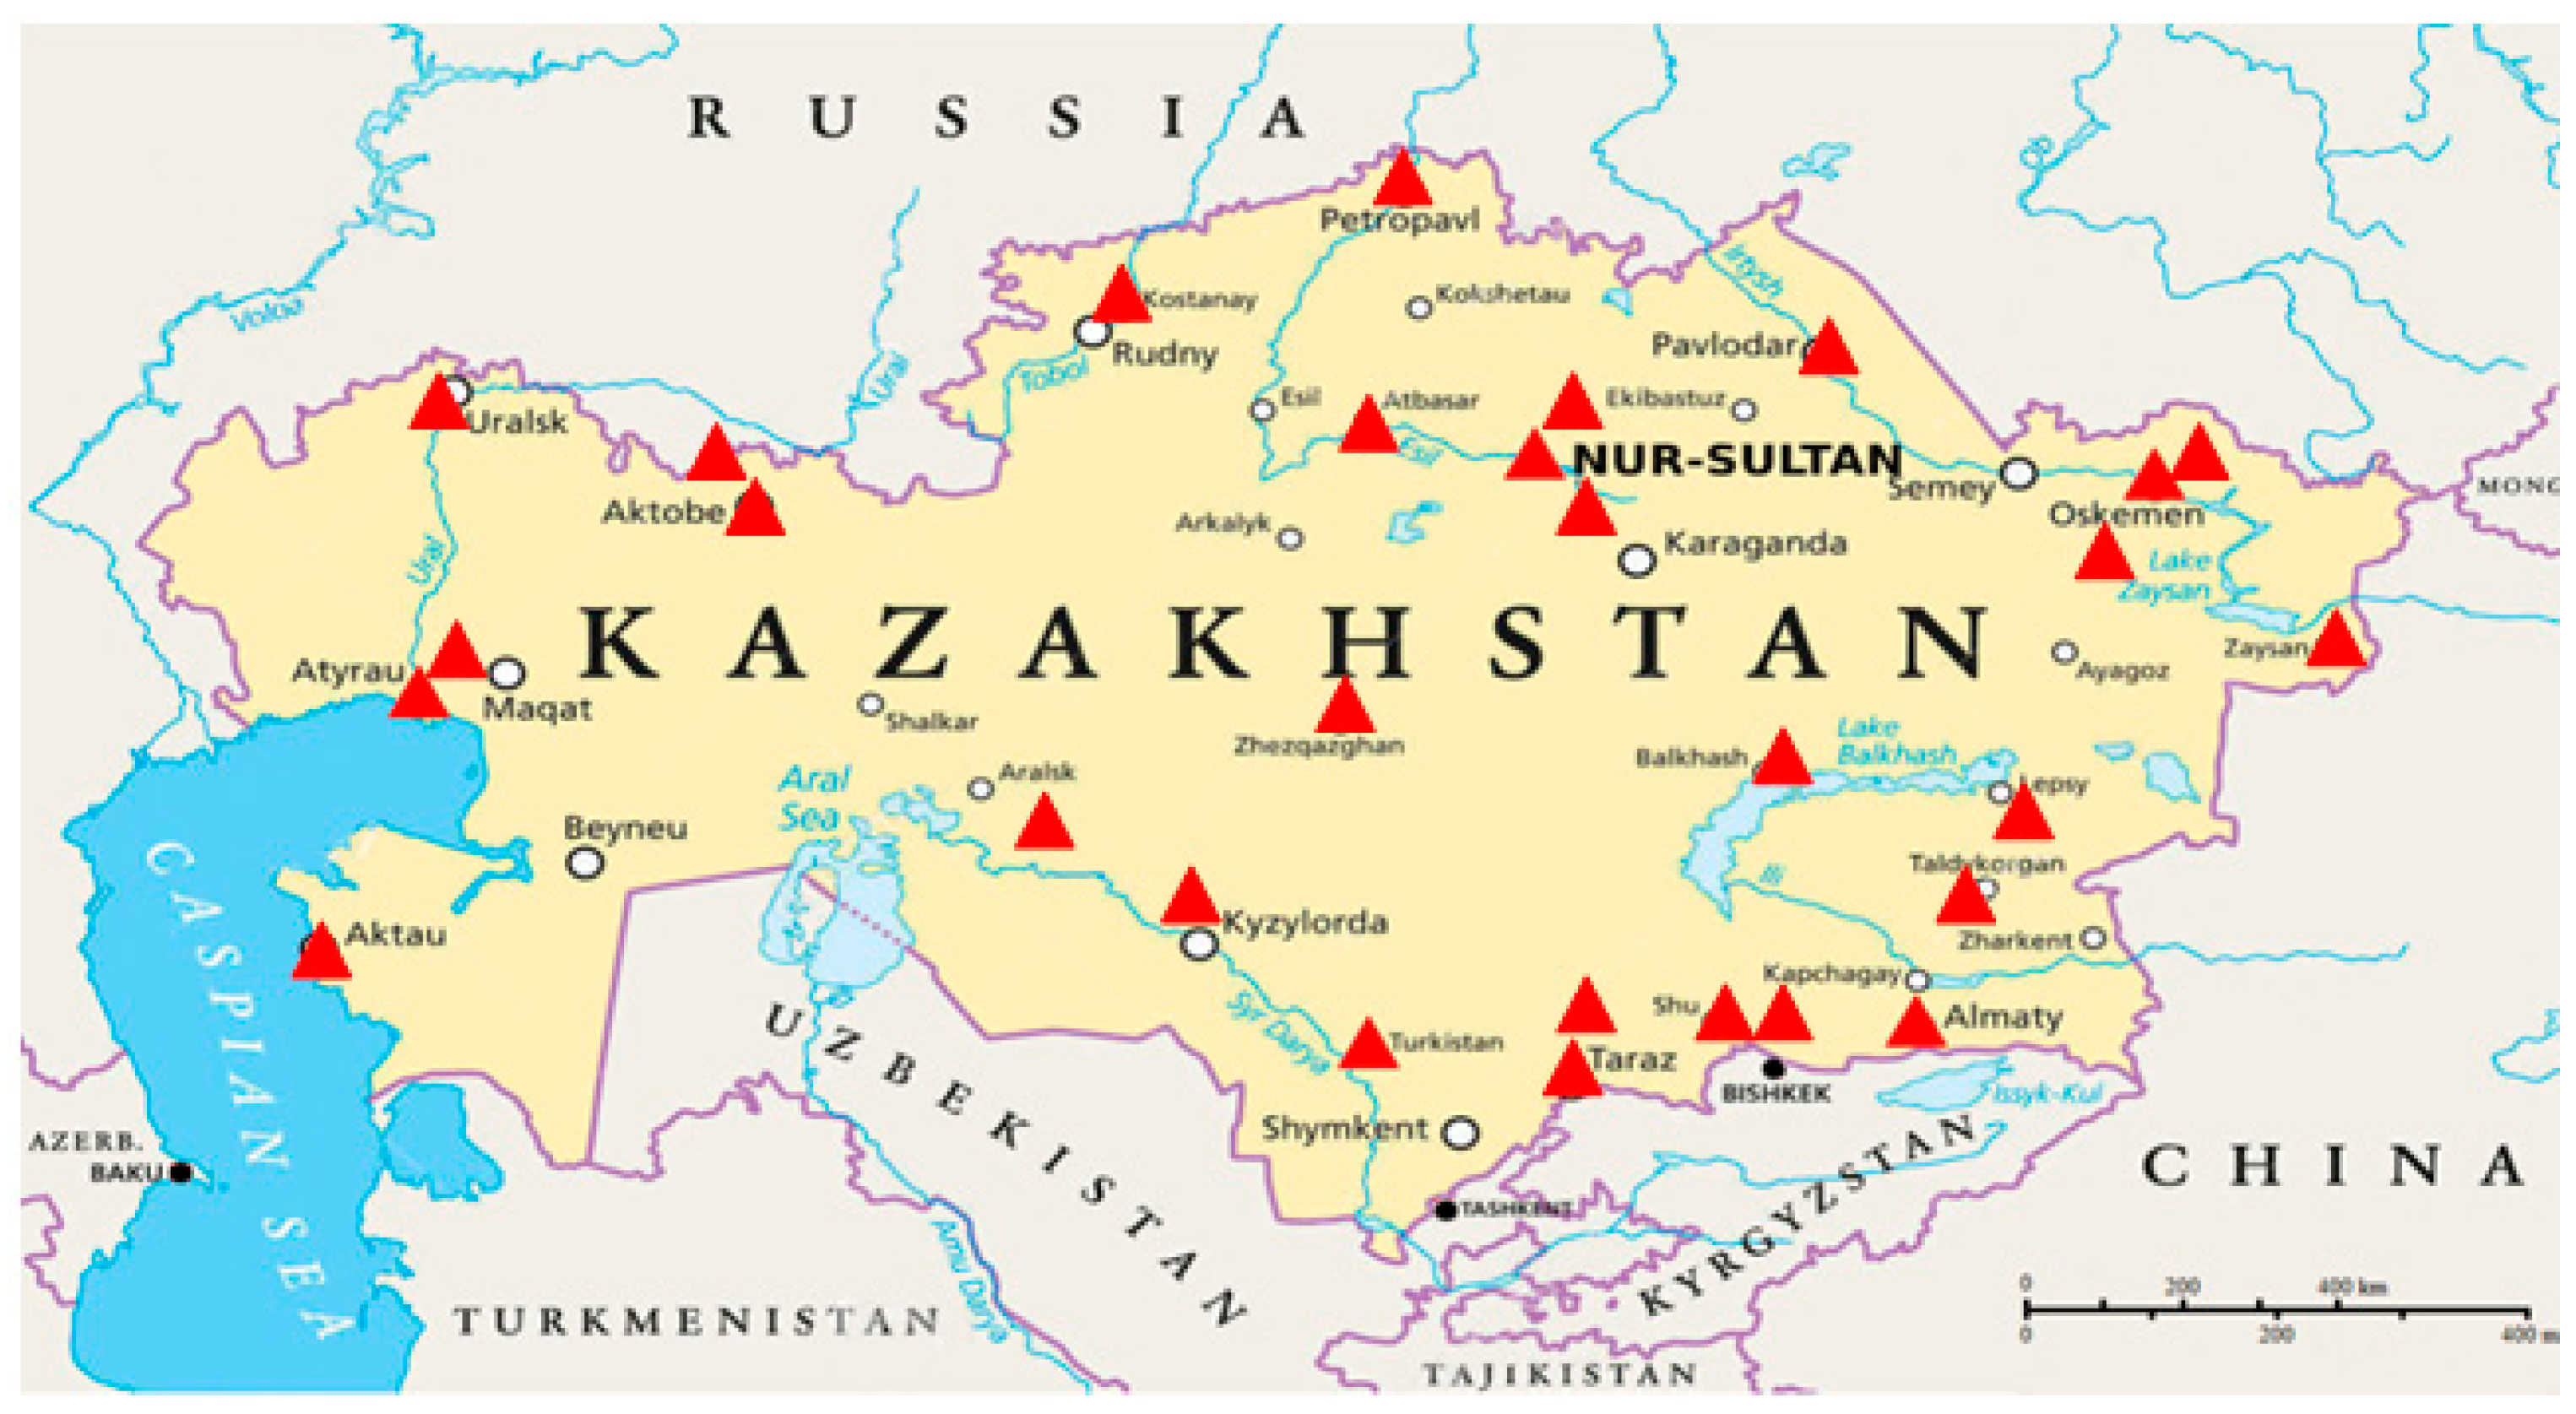
| Station Name | Freezing Start | End of Thawing | Maximum Freezing Depth, cm |
|---|---|---|---|
| Oskemen | 03.11.21 | 29.04.22 | 218 |
| Kostanai | 02.11.21 | 30.04.22 | 227 |
| Balkhash | 12.11.21 | 10.03.22 | 178 |
| Kosshy | 05.11.21 | 30.04.22 | 219 |
| Kazaly | 01.12.21 | 30.04.22 | 131 |
| Almaty | 20.11.21 | 03.03.22 | 61 |
| Ucharal | 10.12.21 | 05.03.22 | 112 |
| Zaisan | 02.11.21 | 10.04.22 | 225 |
Publisher’s Note: MDPI stays neutral with regard to jurisdictional claims in published maps and institutional affiliations. |
© 2022 by the authors. Licensee MDPI, Basel, Switzerland. This article is an open access article distributed under the terms and conditions of the Creative Commons Attribution (CC BY) license (https://creativecommons.org/licenses/by/4.0/).
Share and Cite
Teltayev, B.; Oliviero Rossi, C.; Aitbayev, K.; Suppes, E.; Yelshibayev, A.; Nugmanova, A. Freezing and Thawing Processes of Highways in Kazakhstan. Appl. Sci. 2022, 12, 11938. https://doi.org/10.3390/app122311938
Teltayev B, Oliviero Rossi C, Aitbayev K, Suppes E, Yelshibayev A, Nugmanova A. Freezing and Thawing Processes of Highways in Kazakhstan. Applied Sciences. 2022; 12(23):11938. https://doi.org/10.3390/app122311938
Chicago/Turabian StyleTeltayev, Bagdat, Cesare Oliviero Rossi, Koblanbek Aitbayev, Elena Suppes, Aidos Yelshibayev, and Assel Nugmanova. 2022. "Freezing and Thawing Processes of Highways in Kazakhstan" Applied Sciences 12, no. 23: 11938. https://doi.org/10.3390/app122311938