Article

Influence and Control of SARS-CoV-2 Transmission under Two Different Models

1
School of Information Science & Engineering, Dalian University, Dalian 116600, China
2
School of Mathematical Science, Dalian University of Technology, Dalian 116024, China
3
School of Innovation and Entrepreneurship, Dalian University of Technology, Dalian 116024, China
4
School of Information Science & Engineering, Dalian Ocean University, Dalian 116024, China
*
Authors to whom correspondence should be addressed.
These authors contributed equally to this work.
Appl. Sci. 2022, 12(22), 11849; https://doi.org/10.3390/app122211849
Submission received: 8 October 2022 / Revised: 10 November 2022 / Accepted: 10 November 2022 / Published: 21 November 2022

Abstract

:
SARS-CoV-2 is transmitted by contacting; however, the virus is so active that it can attach to objects and be transmitted from objects to humans via such contacting. The virus, which spreads through some living or inanimate-mediated processes, is more dangerous. On the basis of the routine contact transmission of infectious diseases, this paper further discusses the scope and efficiency of infectious diseases with indirect transmission. Through the study of two different transmission routes, the dynamic models of infectious diseases were constructed. The propagation of these two processes is theoretically studied using a differential equation model and stability analysis theory, and some actual virus propagation processes are simulated by numerical solutions. The prevention and control methods of infectious diseases are given, which lay the theoretical foundation for the discussion of related problems in practical application.

1. Introduction

In March 2020, the World Health Organization declared COVID-19 a global pandemic [1,2,3], a disease caused by the severe acute respiratory syndrome Coronavirus 2 (SARS-CoV-2) [2]. The novel Coronavirus is considered to be contagious during the incubation period, which is usually observed for three–seven days, but could last for up to 14 days [4,5]. Numerous studies have reported the transmission of SARS-CoV-2 from patients who have not yet developed symptoms, and COVID-19 can have multiple clinical manifestations [4,6]. The most common symptoms of the disease include fever, cough, fatigue, muscle aches, headaches and difficulty breathing [5,7,8,9].
In the latest COVID-19 outbreak, most patients developed a very mild, self-limiting viral respiratory illness. The statistical results show that the average recovery time of mild and moderate patients was 10.63 ± 1.93 days, and for severe patients, it was 18.70 ± 2.50 days, that is, two to three weeks [10,11,12]. The continued outbreak of COVID-19, which began in 2019, has posed huge challenges to people’s livelihoods. The existing literature mainly uses mathematical models to predict the incidence level, transmission trend, peak time and the impact of prevention and control measures on the pandemic [13]. These models usually assume that the population is well mixed. As the results of these models are sensitive to initial values and assumptions, there are large differences between the models, particularly in estimating the basic regeneration number (the number of people infected per infected person in a susceptible population), which suggests that 25 to 70 per cent of the population will eventually become infected. The GEP model proposed by Salgotra et al. can be used as a benchmark for time series prediction [14]. As of 14 April 2022, the cumulative number of COVID-19 cases associated with COVID-19 has reached 500,186,525 globally, with more than 6,190,349 cumulative deaths. It is still in the pandemic phase, with more than 900,000 new cases per day [15]. Model results suggest that only strict lockdown measures and social distancing restrictions can effectively control and contain the pandemic [16,17,18]. In order to study and control the spread of infectious diseases, people have made unremitting efforts in many aspects. Different degrees of progress have been made regarding the study of the origin [19,20,21], transmission [13,22,23,24,25,26], control [27,28,29,30] and treatment [10,31,32] of the virus.
What are the introduction mechanisms and transmission routes of 2019-nCoV? Most importantly, 2019-nCoV is a novel enveloped single-stranded zoonotic RNA virus belonging to the genus β-coronavirus [9]. It has been reported to share a 96% homology with bat coronavirus, 91% homology with pangolin coronavirus, and 79% homology with SARS coronavirus [33,34]. The Centers for Disease Control and Prevention (CDC) reports that respiratory droplets, aerosols, and close contact (less than 1 m) are the primary modes of transmission [9,35,36]. Droplets can be spread by coughing, sneezing, talking, singing, and touching mucous membranes, especially those of the nose, eyes, or mouth. They stay in the air longer and can travel distances of more than one meter. Aerosol-generating procedures can also lead to airborne transmission [37].
Khan M.A. and Atangana A. [38] devised a model on the assumption that the seafood market has a sufficient number of infection sources with which to infect people. Pei et al. [39] developed and validated an ensemble forecast system for predicting the spatiotemporal spread of influenza that readily uses accessible human mobility data and a metapopulation model. Dayong Zhou et al. [40] presented the concept of safe medical resources, i.e., the minimum amount of medical resources needed to prevent their overburden, and explore the impacts of medical resources on the spread of emerging, self-limiting infectious diseases.
However, the unusual route of transmission in the recent SARS-CoV-2 outbreak has drawn attention. The initial transmission process was only common person-to-person contact transmission, but since SARS-CoV-2 has rapid mutation and transmission speeds, a long incubation period and a strong concealment [41,42], it has caused great problems to human epidemic prevention [43].
Recently, new changes have taken place in the transmission route of SARS-CoV-2. In many areas, seafood, fruit, clothing, express delivery, cold-chain food, etc., have been found to be positive and have transmitted the virus to humans [44,45]. This indicates that SARS-CoV-2 has evolved from the original human-to-human transmission process into an object-to-human transmission process. In other words, SARS-CoV-2 can spread through some kind of inanimate-mediated process. Due to the diversity of mediums, this new route of transmission has caused great problems to the prevention and control of the pandemic. The frequency and range of disinfection have become a problem that must be considered.
In this paper, differential equations are used to establish two models. The first model only discusses the direct viral transmission to humans in the initial stage without detection and prevention and control. The second model introduces mediators (living or inanimate) between living organisms (humans or wild animals) and healthy humans, and indirectly transmits the virus to humans.
In short, this is a process of viral human–object–human transmission. While there was no direct human-to-human transmission, the diversity of inanimate-mediated processes made the transmission more hidden, increasing the difficulty of detection and elimination, and provided enough time for the spread of the virus. The influence of intermediate media on virus transmission in the early stage of transmission was also investigated. This paper discusses the role of inanimate-mediated processes in the transmission chain and provides a theoretical basis of the frequency and range of inanimate-mediated disinfection, so as to provide a method of blocking the virus transmission chain.

2. Model

In order to compare the influence of an inanimate-mediated process on virus transmission, two models were established, direct transmission and indirect transmission, and they are described in this section.

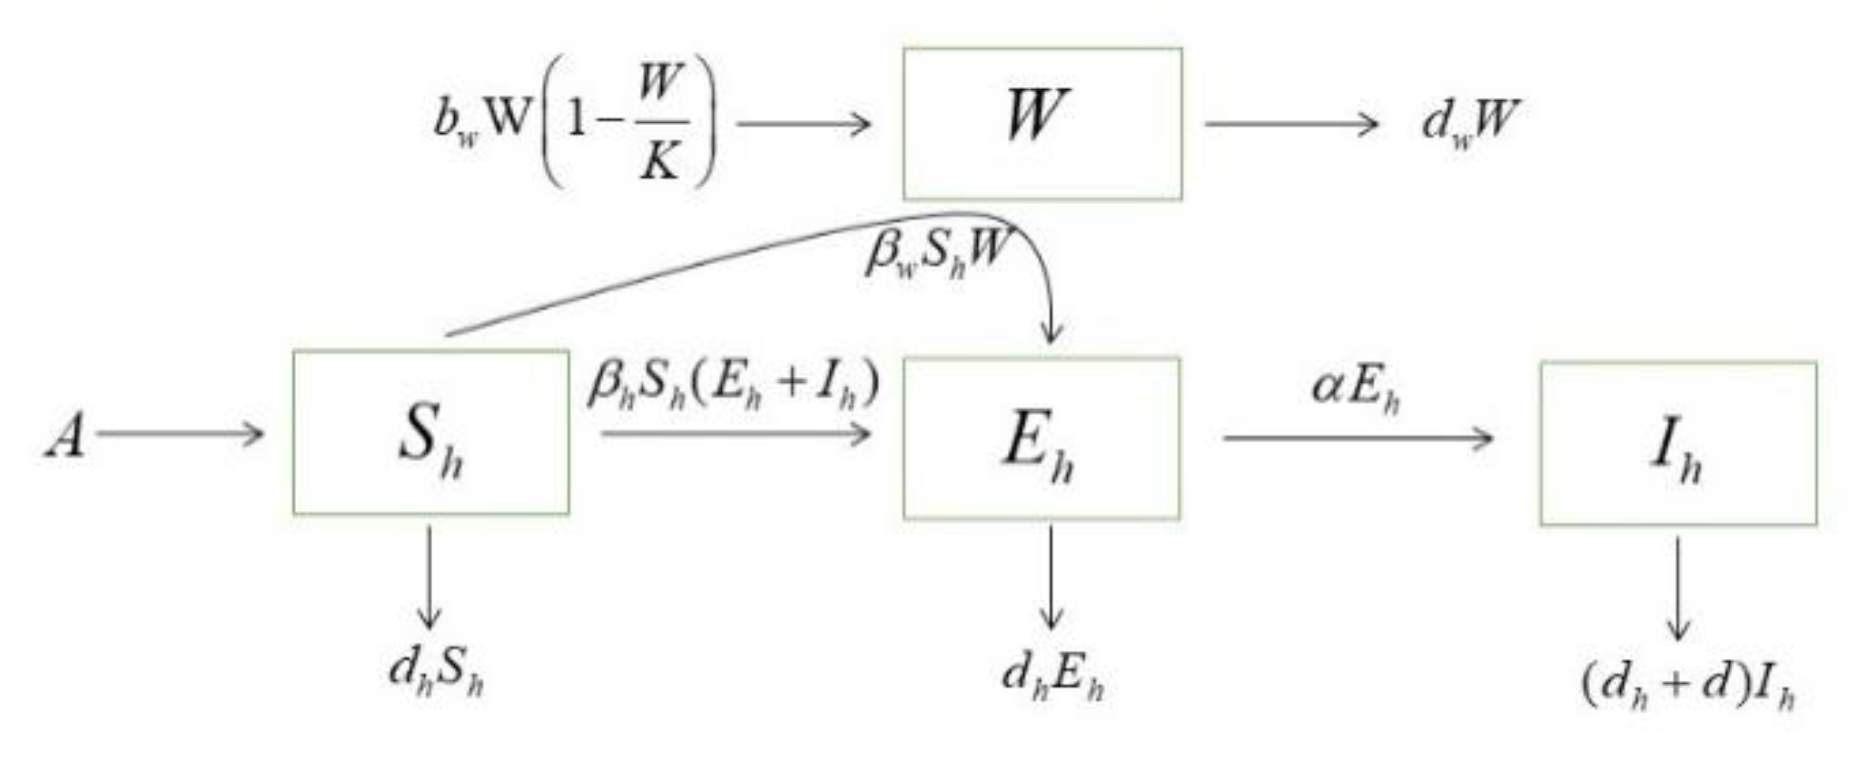
2.1. Direct Transmission Model

We consider a population of humans within a certain range, and there is an invasive population of a certain disease source, where W represents the pathogenic population; this could be animals or humans. The pathogenic population is limited by the carrying capacity K , which propagates with b w and exits the system with d w . For virus transmission in humans using the SEI model, the subscript h denotes the human population; S h , E h , I h are susceptible, incubation, and infected population, respectively. The incubation population is not easy to distinguish, but it is infectious. Infected population means diagnosis, and no longer contact with a susceptible population.
The direct transmission process is represented by the following transmission diagram:
According to Figure 1, the ordinary differential equations are established as follows:
W ˙ = b w W 1 W K d w W S ˙ h = A β h S h ( E h + I h ) β w S h W d h S h E ˙ h = β h S h ( E h + I h ) + β w S h W α E h d h E h I ˙ h = α E h ( d h + d ) I h
with the initial condition W ( 0 ) = 100 , S h ( 0 ) = 1,000,000 , E h ( 0 ) = 0 , I h ( 0 ) = 0 .

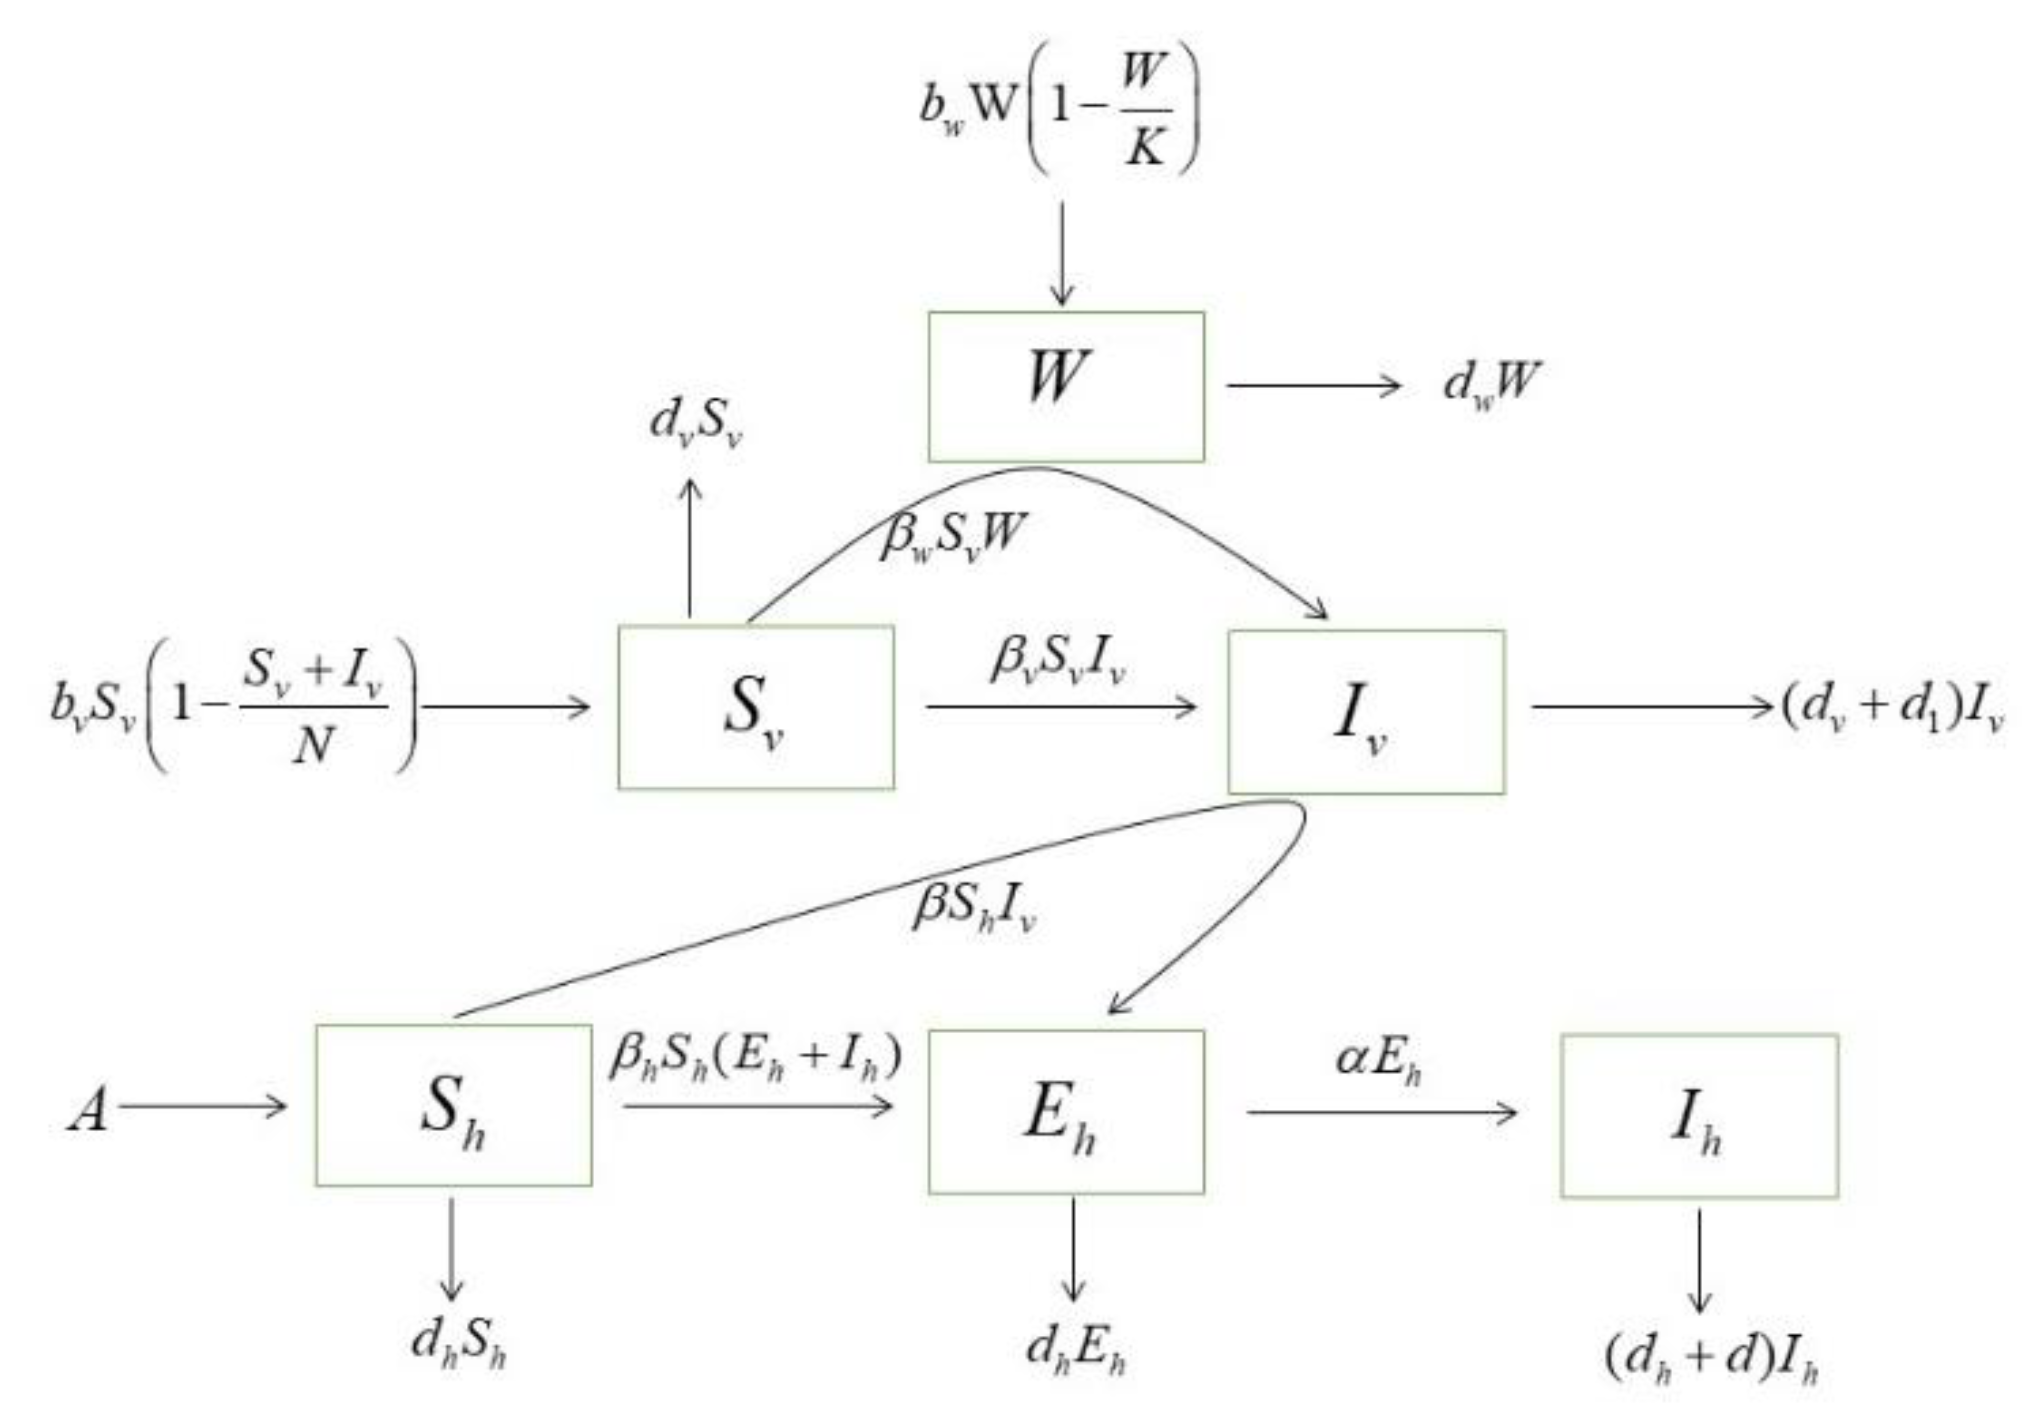
2.2. Indirect Transmission Model

As above, use W to denote the pathogenic population, subscript v to denote the inanimate-mediated processes, and subscript h to denote humans. The inanimate-mediated processes were divided into susceptible S v (without the virus) and infected I v (with the virus). In inanimate-mediated processes, the virus is mainly derived from contact with the pathogenic population, and the transmission rate is β w .
Humans are also divided into susceptible ( S h ), incubation ( E h ), and infected ( I h ) population. Considering that humans are not in direct contact with the pathogenic population, they can become infected from exposure to an infected inanimate-mediated processes, and the transmission rate is β . The remaining parameter settings are shown in Table 1.
The process of person–object–person transmission is represented by the following transmission diagram:
At the same time, the corresponding differential equation model is established, according to Figure 2.
W ˙ = b w W 1 W K d w W S ˙ v = b v S v 1 S v + I v N β v S v I v β w S v W d v S v I ˙ v = β v S v I v + β w S v W ( d v + d 1 ) I v S ˙ h = A β S h I v β h S h ( E h + I h ) d h S h E ˙ h = β S h I v + β h S h ( E h + I h ) α E h d h E h I ˙ h = α E h ( d h + d ) I h
with the initial condition W ( 0 ) = 100 , S v ( 0 ) = 100 , I v ( 0 ) = 0 , S h ( 0 ) = 1,000,000 , E h ( 0 ) = 0 , I h ( 0 ) = 0 .

3. Results

3.1. Equilibrium Stability and Basic Reproduction Number

By using the stability analysis of the equilibrium point of the differential equation model, the long-term stable state of the model can be studied.
For model 1, the following equilibrium points are found:
E 1 ( 0 , A d h , 0 , 0 )
E 2 ( 0 , ( α + d h ) ( d h + d ) β h ( α + d h + d ) , A β h ( α + d h + d ) d h ( α + d h ) ( d h + d ) β h ( α + d h + d ) ( α + d h ) , α ( A β h ( α + d h + d ) d h ( α + d h ) ( d h + d ) ) β h ( α + d h + d ) ( α + d h ) ( d h + d ) )
E 3 ( W , S h , E h , I h )
where W = K ( b w d w ) b w , S h = S h , E h = A S h d h α + d h , I h = α ( b w ( A S h d h ) S h β w K ( b w d w ) ) S h β h b w ( α + d + d h ) .
S h is the positive real root of equation:
β h b w d h ( α + d + d h ) S h 2 + ( β w K ( b w d w ) ( d + d h ) ( α + d h ) b w d h ( α + d h ) ( d + d h ) A β h b w ( α + d + d h ) ) S h + A b w ( d + d h ) ( α + d h ) = 0
To prove the stability of the disease-free equilibrium, the Jacobian matrix can be calculated:
J = b w ( 1 W K ) b w W K d w 0 0 0 β w S h β w W β h ( E h + I h ) d h β h S h β h S h β w S h β h ( E h + I h ) + β w W β h S h α d d h β h S h 0 0 α d d h
For the disease-free equilibrium E 1 ( 0 , A d h , 0 , 0 ) , eigenvalues of the Jacobian determinant are b w d w , d h , α d d h and A β h d d h d h 2 d h .
For the eigenvalue b w d w , when b w d w < 0 , the disease-free equilibrium is asymptotically stable.
In other words, when the incidence rate of the pathogenic population is lower than the removal rate, the disease-free equilibrium is stable. This situation requires control of the population of the pathogenic population.
In other cases, if no action is taken, the pathogenic population will eventually carry the disease. Due to the number of human interventions, we also focus on disease development at the beginning of model development (60 days).
We are mainly concerned with the state of transmission in its early stages. Using the stability theory of differential equations, the equilibrium points of model 2 are discussed.
E 1 ( 0 , 0 , 0 , A d h , 0 , 0 )
E 2 ( K ( b w d w ) b w , 0 , 0 , A d h , 0 , 0 )
E 3 ( 0 , N ( b v d v ) b v , 0 , A d h , 0 , 0 )
E 4 ( 0 , 0 , 0 , S h 1 , E h 1 , I h 1 )
E 5 ( K ( b w d w ) b w , 0 , 0 , S h 1 , E h 1 , I h 1 )
E 6 ( 0 , N ( b v d v ) b v , 0 , S h 1 , E h 1 , I h 1 )
E 7 ( 0 , d v + d 1 β v , β v N b v β v N d v b v d 1 b v d v β v ( β v N + b v ) , S h , E h , I h )
E 8 ( K ( b w d w ) b w , S v , I v , S h , E h , I h )
The representation of each symbol is shown in Appendix A.
We use a next-generation matrix to calculate the basic reproduction number of model 1. There is a disease-free equilibrium point E 1 ( 0 , A d h , 0 , 0 ) . From model 1, it can be obtained that:
F = β h S h β h S h β w S h 0 0 0 0 0 0 ;   V = α + d h 0 0 α d h + d 0 0 0 d w b w + 2 b w W K
R 0 = ρ ( F V 1 ) = β h S h ( α + d + d h ) ( d + d h ) ( α + d h )
As in model 1, we obtained the following for model 2:
F = β h S h β S h β h S h 0 0 β v S v 0 β w S v 0 0 0 0 0 0 0 0
V = α + d h 0 0 0 0 d v + d 1 0 0 α 0 d h + d 0 0 0 0 d w b w + 2 W b w K
For the disease-free equilibrium point E 3 ( 0 , N ( b v d v ) b v , 0 , A d h , 0 , 0 ) , the basic reproduction number of model 2 is: R = max { R 1 , R 2 } , where R 1 = β h S h ( α + d + d h ) ( α + d h ) ( d + d h ) , R 2 = β v S v d v + d 1 .
In the long term, if nothing is added, the model will eventually stabilize the co-existence of the disease. In the actual process, when the spread of the disease was isolated, disinfection, treatment, vaccine and other effective measures were used to balance the condition. We do not pay attention to how this model functions in the stable state; instead, we pay more attention to the incipient stage of the disease.
In the next section, we compare the numerical solutions of the two models, focusing on the transmission status of the disease at the beginning stage, and via a comparison, we investigate whether changes occur in the early stage of infection when SARS-CoV-2 has a new transmission route of person–object–person, and how to control such changes.

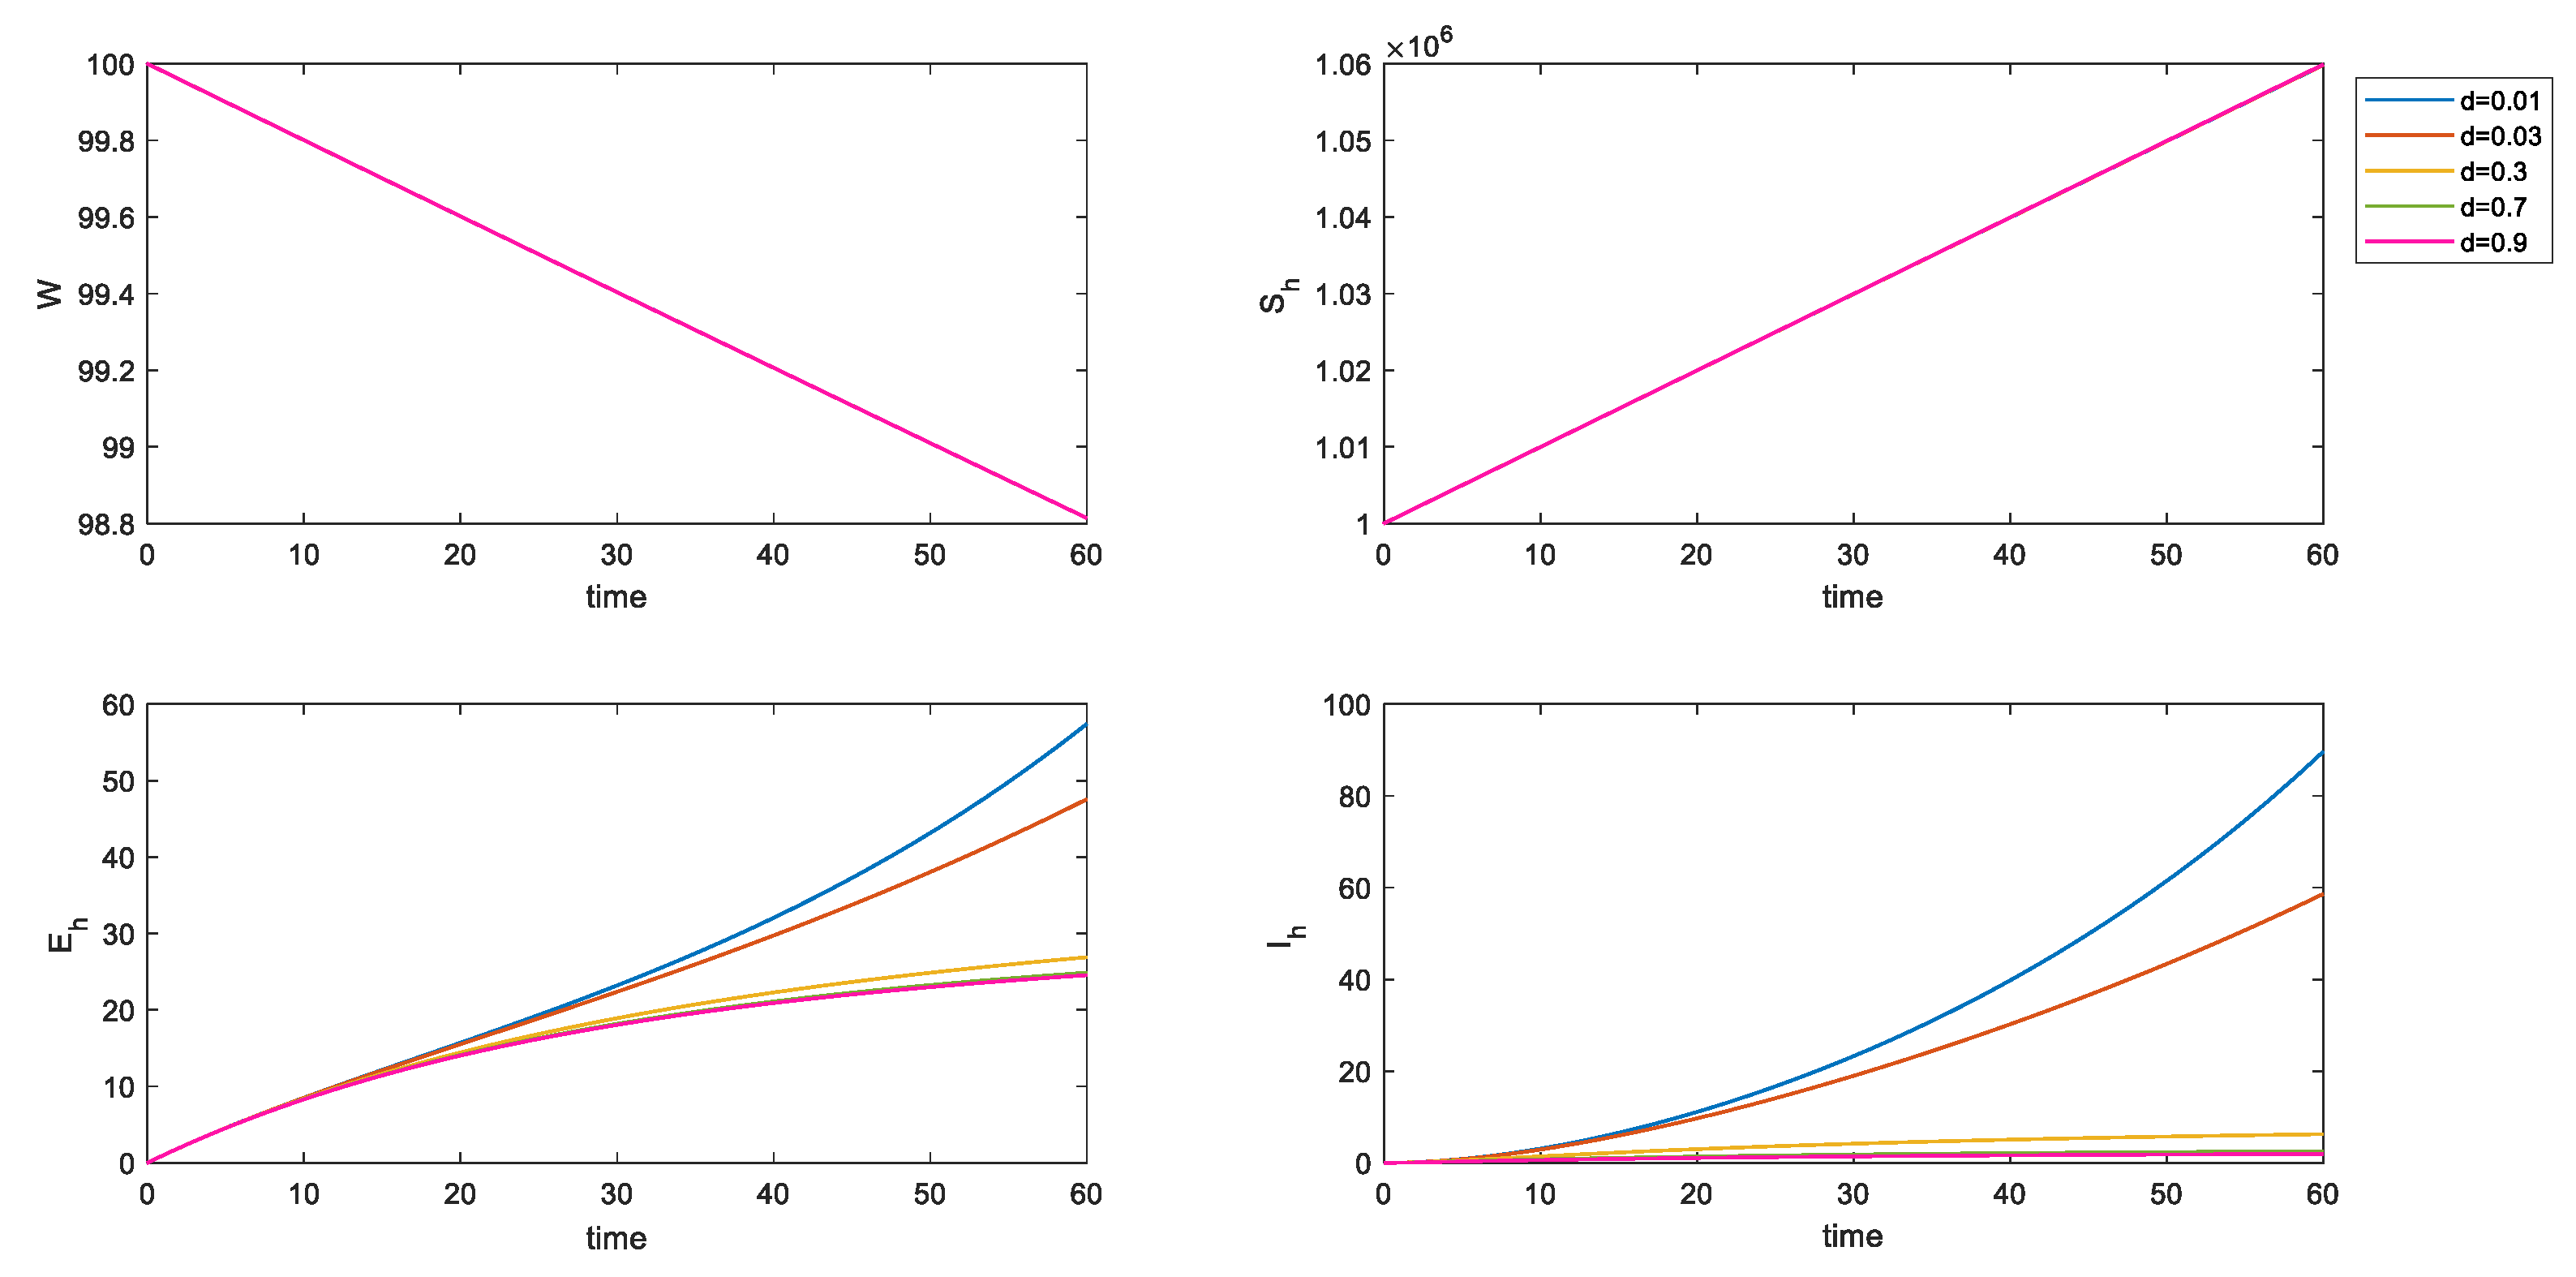
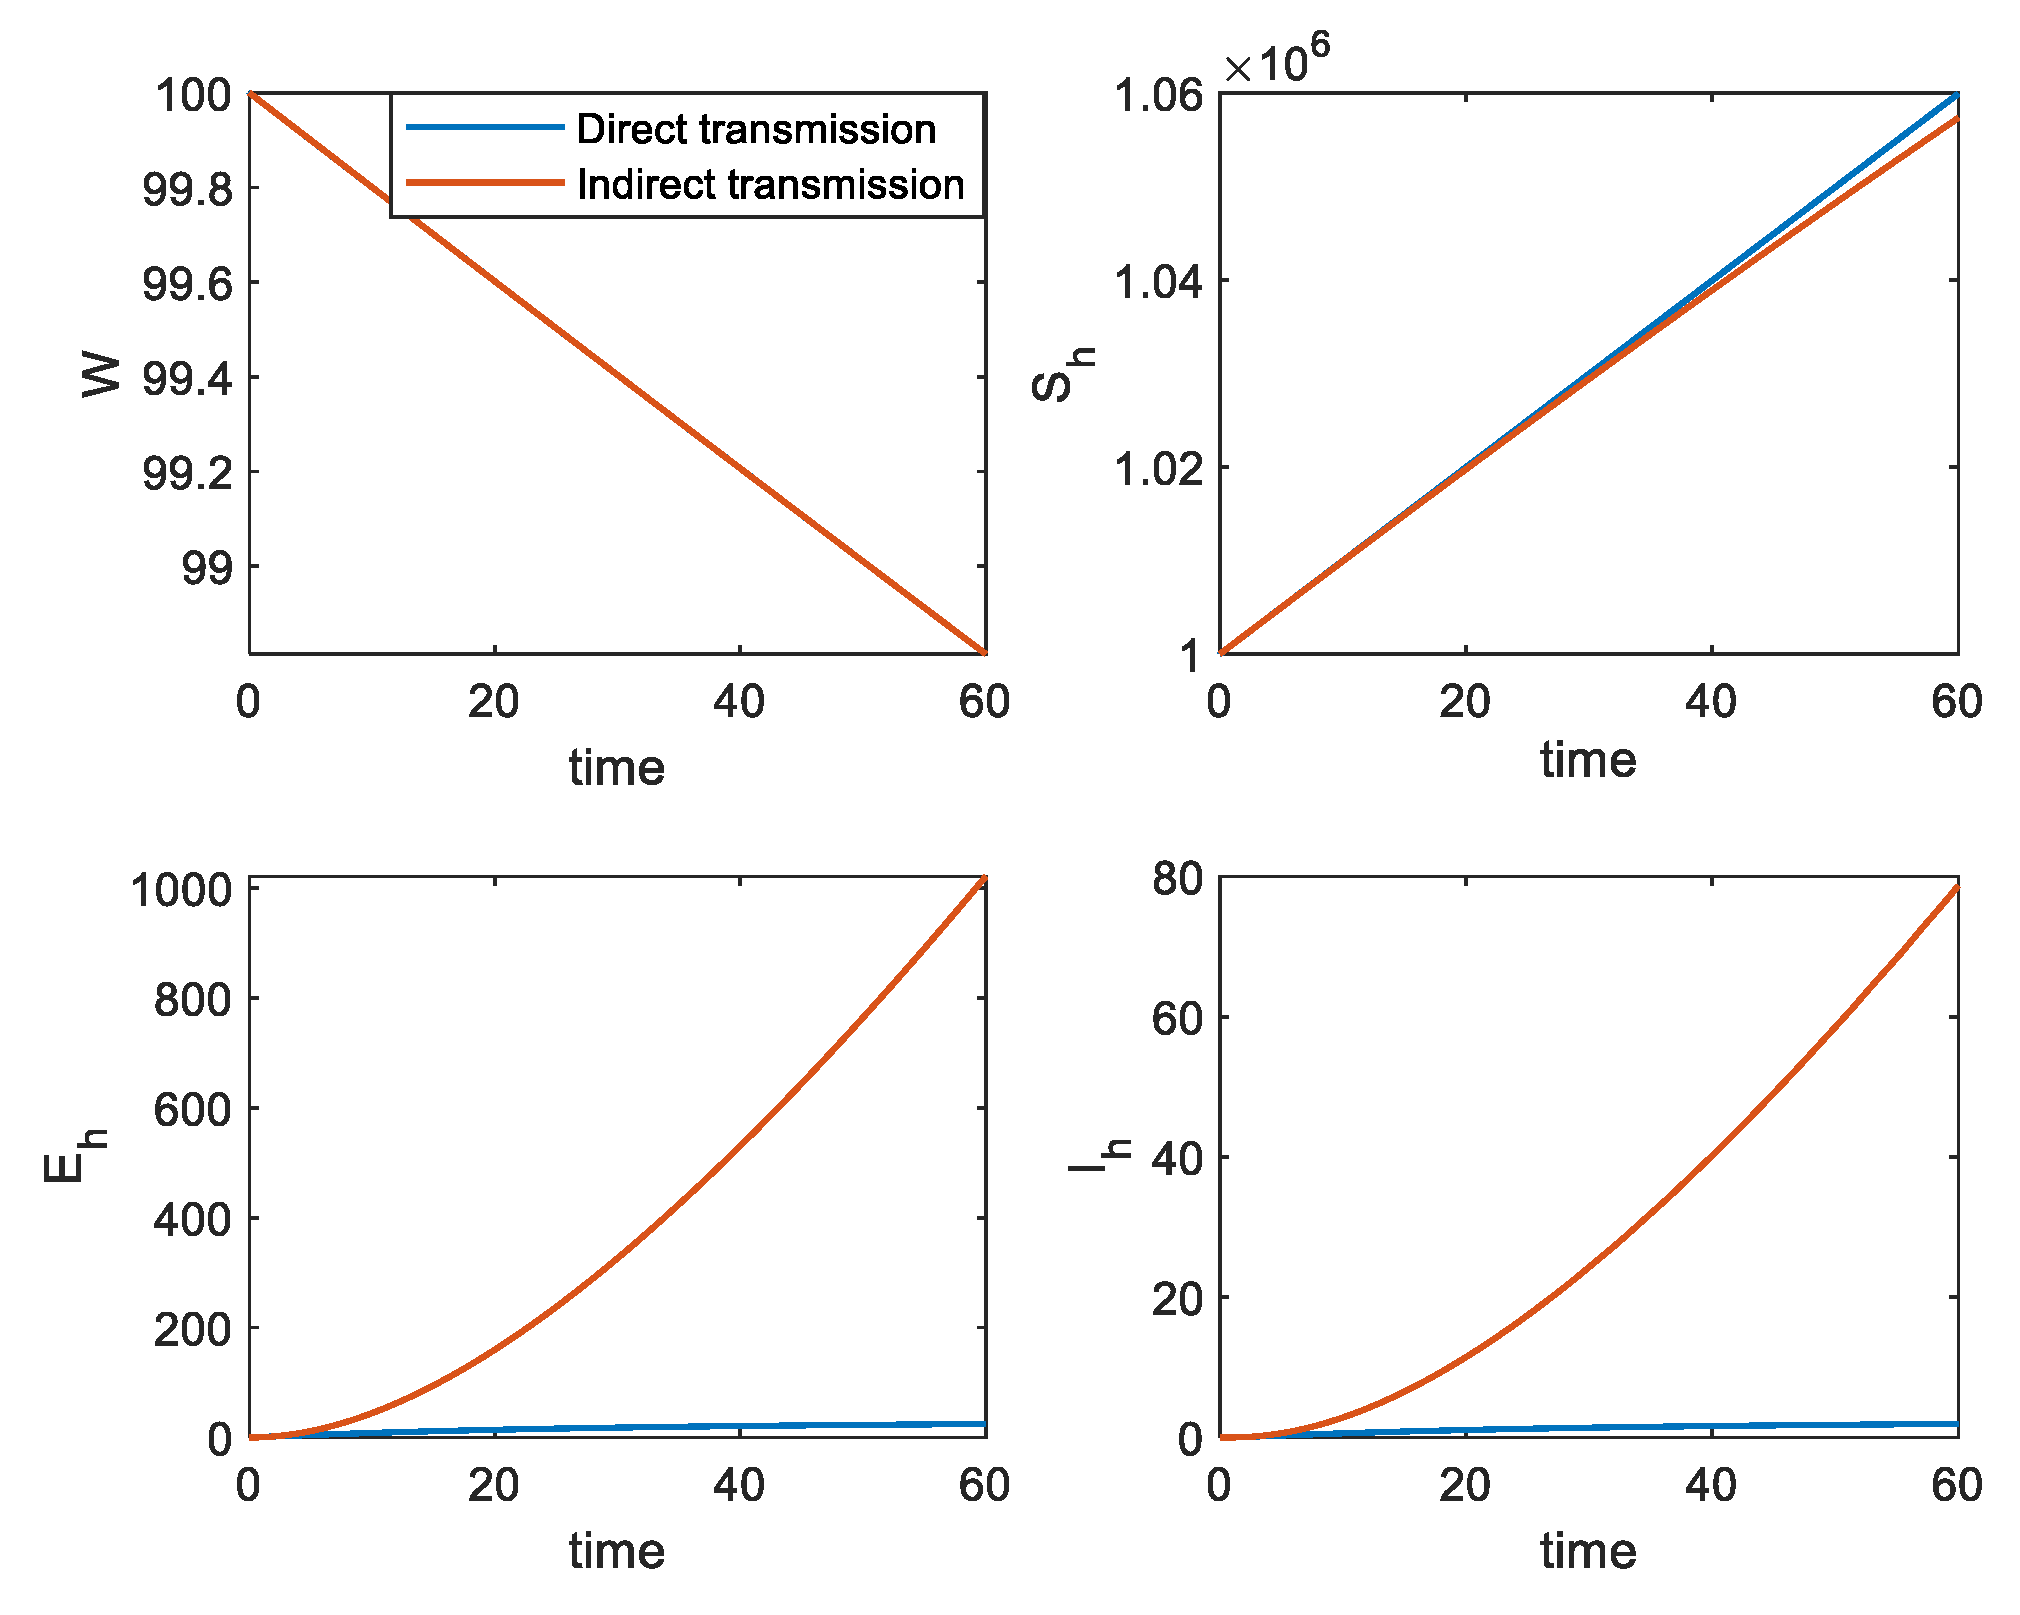
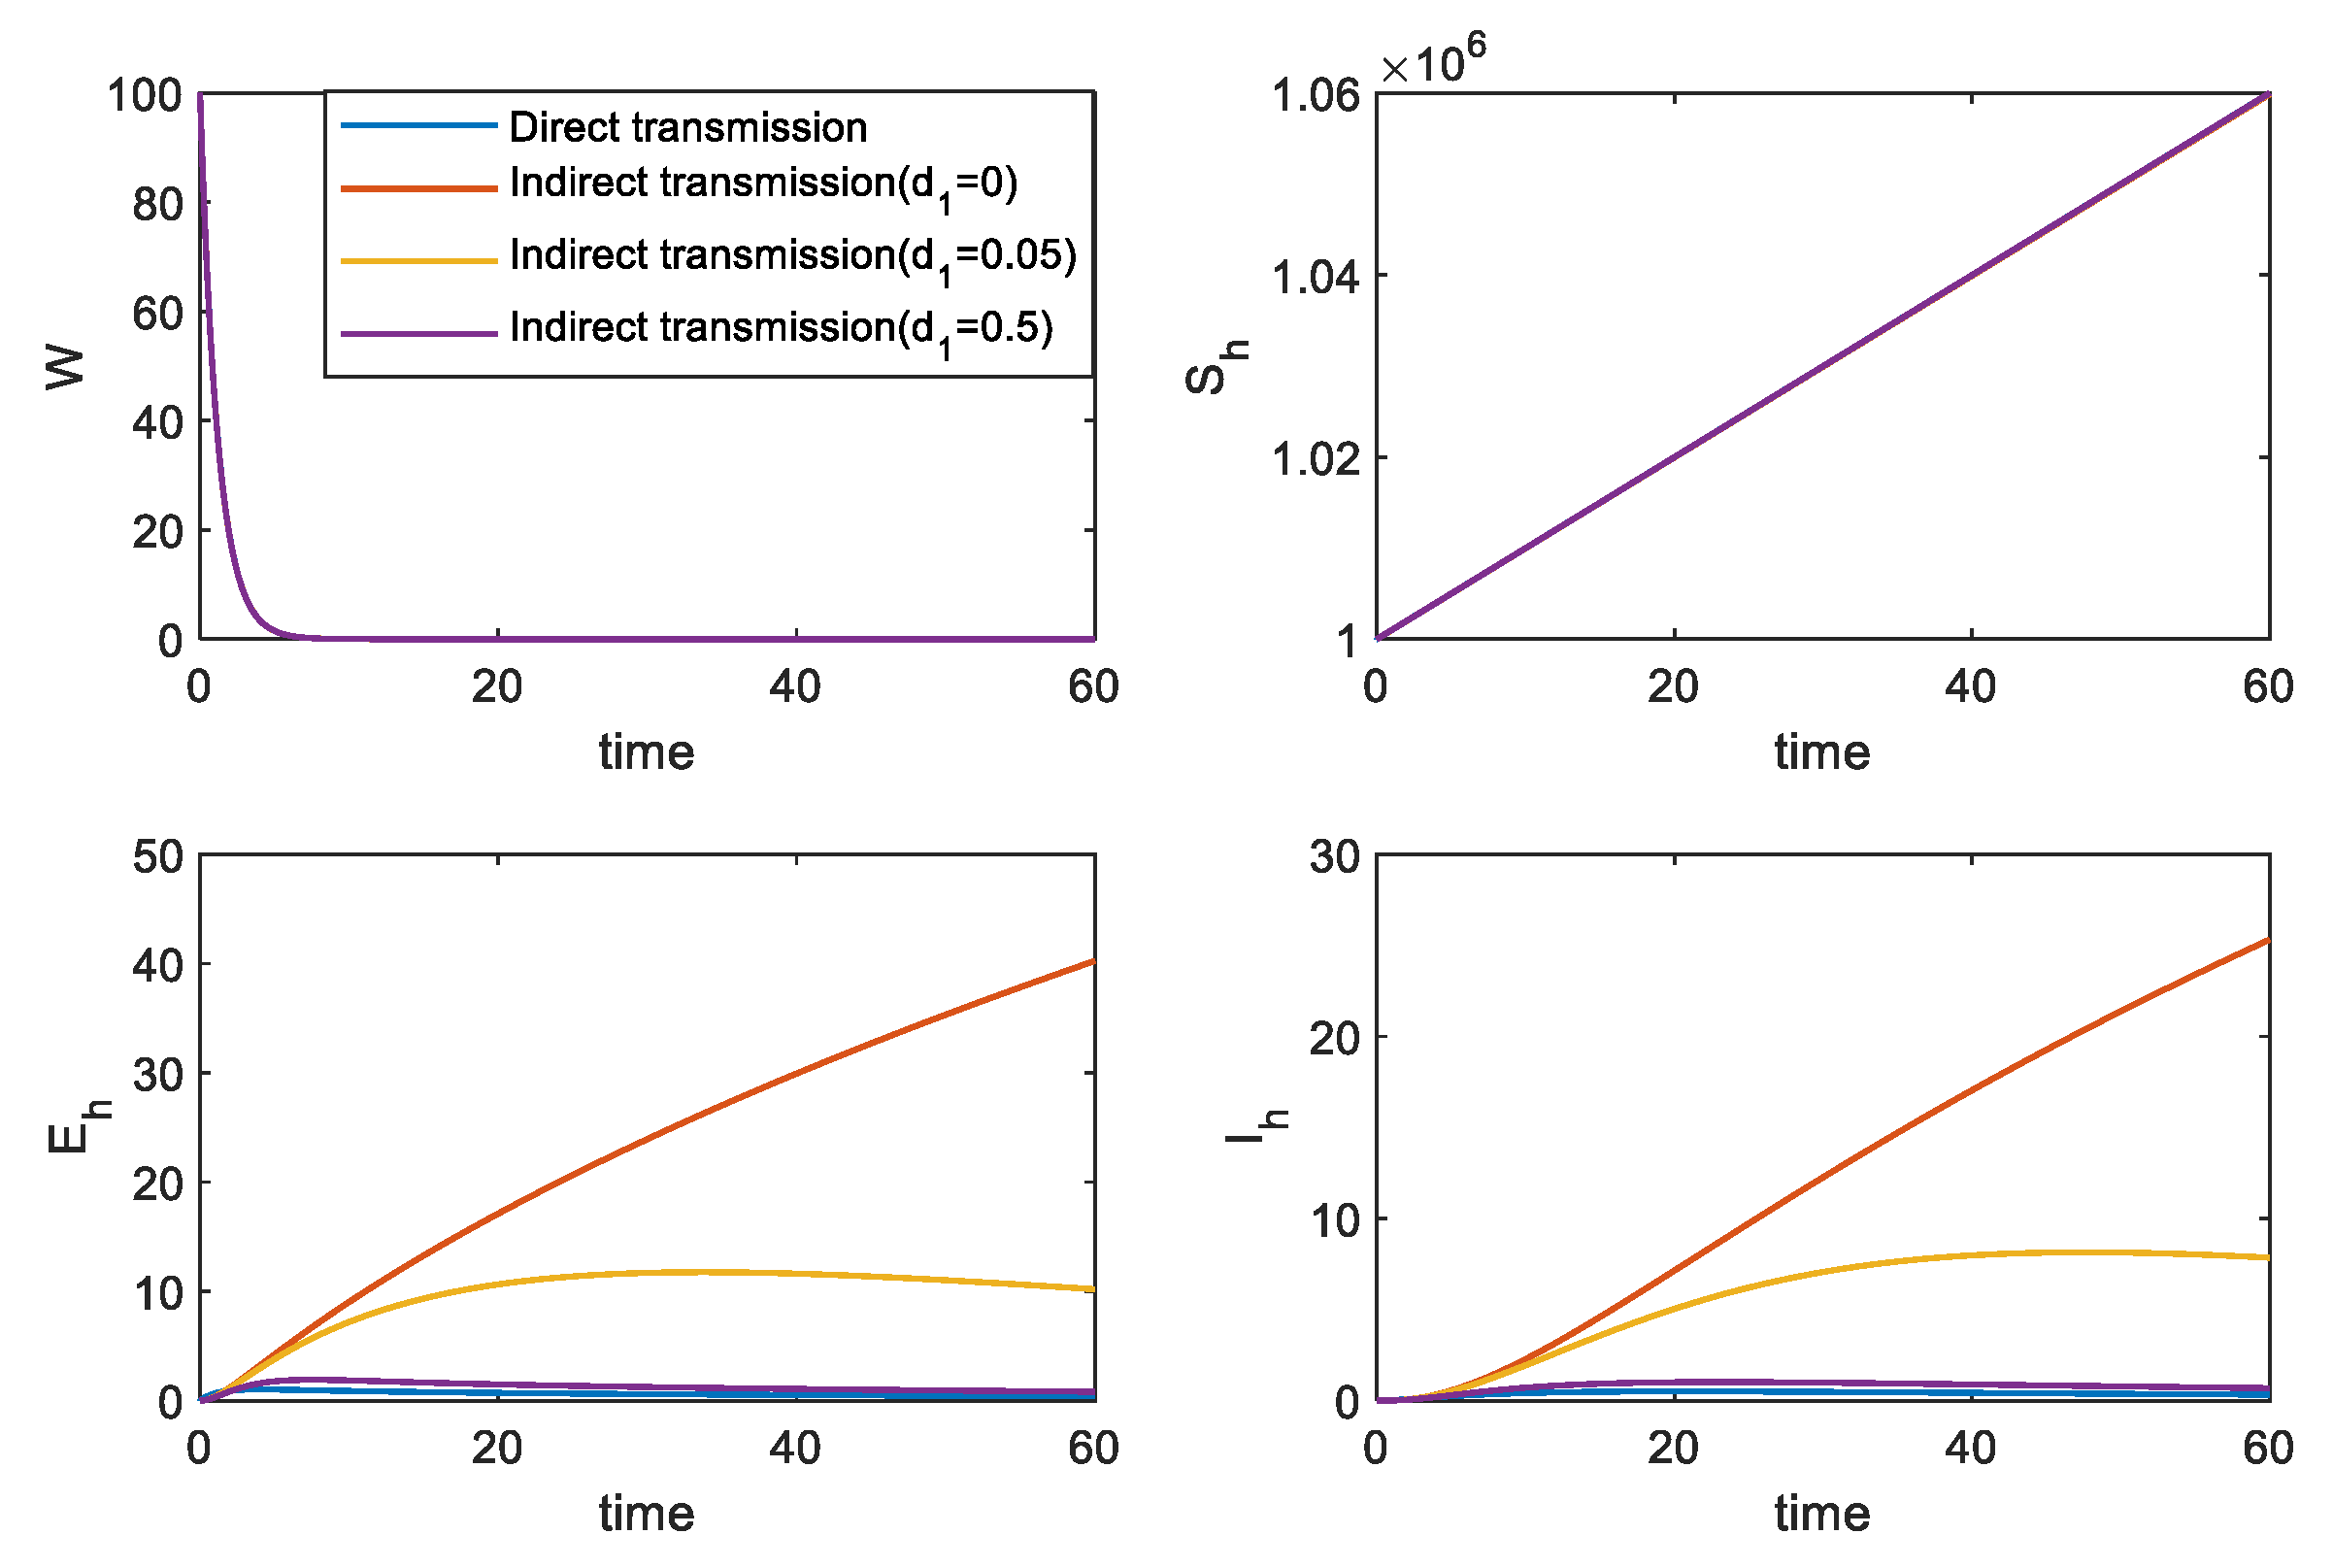
3.2. Numerical Simulation

In the actual experiment, we are not interested in the stability of the model after an infinite amount of time. Based on prevention and treatment methods and the status of COVID-19 at the present stage, it is vital to understand the disease transmission status in the early stage of virus development.
The most important steps are to reduce the scope, speed and number of people infected at an early stage. In this part of the discussion, we mainly discuss the influence of two different parameters on two different models.
At the same time, we only focus on the change in the population of pathogen and different human populations and do not consider the change in the number of inanimate-mediated populations. The changes in the numbers of various groups during the first two months of infection (60 days) were also considered.
Model 1 is derived from a traditional infectious disease prevention and control model. In order to reduce or even block the impact of infectious sources on human beings, combined with the current epidemic prevention measures, the influence of two parameters, d w and d , on disease prevention and control is given.
If parameter d w increases, the removal rate of pathogenic population increases, and the mortality rate is certain. This parameter generally refers to increased efforts to prevent the entry of the pathogenic population into the system. In terms of the epidemic prevention and control situation, it means that a nation has adopted strict border control and effective prevention and control of pathogenic populations that are imported from abroad.
The pathogen population that infects the immune system will be forced into isolation and other measures will force it out of this system.
It is clearly observed in Figure 3 that, with the increase in d w , the increase in the removal rate of the pathogenic population, the number of incubation populations and infected populations are effectively controlled in the early stage of the infection, and isolation measures, which were adopted for this externally imported pathogenic population, are very effective.
In Figure 4, the role of parameter d in model 1 can be observed. Parameter d represents the removal of I h . Due to the improvement in treatment methods, the extra mortality rate of patients is low. Therefore, d mainly refers to the proportion of patients who are forced into social isolation, which is determined by the rate of diagnosis.
Thus, the increase in d mainly indicates an improvement in the diagnosis rate.
The results show that, in the early stage of infection, increasing the rate of confirmed diagnosis was especially effective for the proportion control of infected patients, but for the patients in the early stage, because direct diagnosis isolation was not considered, the control of the number of patients in the incubation period was effective; however, this effect was not as strong as the effect of controlling confirmed patients.
Regarding disease transmission via inanimate-mediated processes, we are still primarily concerned with the initial changes in the number of S h , E h , and I h . We need to understand the role that the addition of mediators plays in disease transmission. Does it influence the effect of the parameters? How much does it affect them? In the following, we use the same parameters, as shown in Model 1, to discuss the influence of the changes in parameters d w (Figure 5) and d (Figure 6) on Model 2.
The influence of d w in the two models and the change trend in population are essentially the same. However, through a comparison of the three groups of different d w , it is not clear that, when d w is the same, regardless of whether it is a direct or indirect infection, there is essentially no difference in the level of pathogenic populations and susceptible populations. However, there is a significant difference between the number of incubation populations and infected populations. Indirect infection is more conducive to the spread of the disease. In the initial stage, even if d w = 0.85 , the number of incubation populations and infected populations can still reach about 40 and 20, respectively. When d w is smaller, the numbers of both populations are larger, and it is essentially impossible to control as a direct infection.
In Figure 7, direct infection and indirect infection have very little difference in the number of pathogenic populations and susceptible populations, but there is a significant difference between the number of infected populations in general and in the incubation period.
In Figure 8, for the same value of d , disease control in indirect infections is not as good as in direct infections, when d = 0.9 , such a high removal rate is still not satisfactory for the control of disease transmission. The numbers of incubation populations and infected populations were as high as 1000 and 80, respectively.
The parameter D represents the removal rate of the inanimate-mediated process of the virus. This is mainly expressed as disinfection rate. In the above discussion, the disinfection rate d 1 = 0 , and thus it is not considered. The addition of an inanimate-mediated process makes the infection more subtle, and the same changing parameters make the disease spread faster.
The above two parameters can effectively control disease transmission in direct transmission, but their effect on indirect transmission is not clear, and is insufficient for controlling disease transmission.
The following figure shows the influence of a change in d 1 :
It is not difficult to see in Figure 9 that, by increasing d 1 , the number of susceptible populations do not change by much, but the number of incubation population and infected population significantly decreases. Via inanimate-mediated disinfection, you can actually control the spread of the disease in the population. When the disinfection rate was increased from 0 to 0.05, the numbers of the incubation and infected populations after 60 days were controlled. When the disinfection rate is increased to 0.5, the control effect is very clear.
In order to clarify the effect of the disinfection rate, we discussed the influence of the change in disinfection rate on the number of incubation and infected populations under the values of d w and d that are most conducive to disease control. When the disinfection rate is increased to 0.5, the negative effect of the inanimate-mediated can essentially be offset, that can be seen in Figure 10 and Figure 11.

4. Discussion

The Occupational Safety and Health Administration declared that all AGPs pose an extremely high risk of spreading COVID-19 from patients with known or suspected infections.
The Centers for Disease Control and Prevention (CDC) reports that respiratory droplets, aerosols, and close contact (less than 1 m) are the primary modes of transmission [35]. Aerosols are small particles (less than 5–10 μm in diameter) that travel long distances, and thus are easily inhaled [8,36]. Droplets can be spread by coughing, sneezing, talking, singing, and touching mucous membranes, especially those of the nose, eyes, or mouth [46].
Contaminants in an infected person’s immediate environment can carry the virus, and these contaminants are all able to spread COVID-19 [47]. Biopsies confirmed the gastrointestinal mucosal tropism of SARS-CoV-2. As the virus is present in stools, it can also be spread through the gastrointestinal tract [3,48]. This means that more objects could be infected with the virus and become vectors of transmission.
All of these conclusions indicate that, in the process of virus prevention and control, in addition to cutting off close contact between people, more attention should be paid to the elimination of the close-contact items of infected people. For high-risk industries that produce aerosols, such as dental care workers, their associated materials can easily contribute to the spread of disease.
However, in order to further clarify associated risks, more research is needed to confirm the route of transmission of SARS-CoV-2 and to measure the risk of COVID-19 among dental health professionals (DHCPs) who perform aerosol generation procedures (agp). Additionally, the effectiveness of personal protective equipment (PPE) should be evaluated to ease the concerns of the DHCP [35].

5. Conclusions

By comparing the two models of direct and indirect infection, the effect of the inanimate-mediated process in the early stage of infection was illustrated, which clearly increased the speed and range of virus transmission.
Regarding direct infection, the parameters d w and d , can accurately control the spread of the virus by limiting the entry of pathogenic populations and effective isolation of infected population, and the spread of the virus can be effectively contained. In the process of indirect transmission, the same restrictions and effective isolation are not as effective as they should be.
In order to control the spread of the virus during indirect transmission, we increased the removal rate of the virus-carrying inanimate-mediated process via inanimate-mediated disinfection. Through a numerical analysis, it is found that increasing the disinfection rate is a very effective method to control infection. When the disinfection rate is increased to 0.5, the transmission risk caused by the inanimate-mediated process is essentially offset. When the disinfection rate increases further, the spread of the virus will be further curbed.
Therefore, it is suggested that, while limiting the entry of the pathogenic population and effective isolation of the infected population, inanimate-mediated disinfection should be carried out as necessary.

Author Contributions

Conceptualization, X.G. and Q.P.; methodology, X.G., S.C. and M.H.; software, X.G.; validation, L.Q., S.C. and Q.P.; formal analysis, X.G., S.C. and L.Q.; Funding acquisition, S.C.; writing—original draft preparation, X.G.; writing—review and editing, X.G. and M.H.; visualization, X.G. and L.Q.; supervision, M.H. All authors have read and agreed to the published version of the manuscript.

Funding

The High-level Talents Innovation Support Program of Dalian No.2021RQ062.

Institutional Review Board Statement

Not applicable.

Informed Consent Statement

Informed consent was obtained from all the subjects involved in the study.

Data Availability Statement

Not applicable.

Conflicts of Interest

The authors declare no conflict of interest.

Appendix A

S h 1 = ( d h + d ) ( α + d h ) β h ( α + d + d h )
E h 1 = β h A ( α + d + d h ) d h ( α + d h ) ( d h + d ) β h ( α + d h ) ( α + d + d h )
I h 1 = α ( β h A ( α + d + d h ) d h ( α + d h ) ( d h + d ) ) β h ( α + d + d h ) ( α + d h ) ( d + d h )
E h = A S h d h α + d h
I h = α ( β v 2 N S h d h β v N S h β b v + β v N S h β d v + β v 2 A N β v S h d h b v + d 1 S h β b v + d v S h β b v + β v A b v ) β h β v S h ( α + d + d h ) ( β v N + b v )
where S h is the positive real root of equation.
β h β v d h ( α + d + d h ) ( β v N + b v ) S h * 2 + ( β h β v 2 A N α β h β v 2 A N d β h β v 2 A N d h β v 2 N α d d h β v 2 N α d h 2 β v 2 N d h 3 β v N α β b v d β v N α β b v d h + β v N α β d v d + β v N α β d v d h β v N β b v d d h β v N β b v d h 2 + β v N β d v d d h + β v N β d v d h 2 β v β h A α b v β v β h A d b v β v β h A d h b v β v α d d h b v β v α d h 2 b v β v d b v d h 2 β v b v d h 3 + α β d 1 d b v + α β d 1 d h b v + α β d v d b v + α β d h d v b v + β d 1 d d h b v + β d 1 d h 2 b v + β d h d d v b v + β d v d h 2 b v ) S h * + β v A ( d + d h ) ( α + d h ) ( β v N + b v ) = 0
S v = β v T N + β w K N b w β w K N d w + b v T b v N b w + d v N b w b v b w
I v = T b w
S h = Q
E h = A Q d h α + d h
I h = α ( A b w Q T β Q d h b w ) b w β h Q ( α + d + d h )
where Q is the root of equation.
( β h α b w d h + β h b w d h d + β h b w d h 2 ) Q 2 + ( A α β h b w β h A d b w β h A d h b w T α β d T α β d h T β d d h T β d h 2 α d h d b w α d h 2 b w d h 2 d b w d h 3 b w ) Q + A α d b w + A α d h b w + A d d h b w + A d h 2 b w = 0
where T is the root of equation.
( β v 2 N + β v b v ) T 2 + ( 2 β v β w K N b w 2 β v β w K N d w β v N b v b w + β v N d v b w + β w K b v b w β w K b v d w + d 1 b v b w + d v b v b w ) T + β w 2 K 2 N b w 2 2 β w 2 K 2 N b w d w + β w 2 K 2 N d w 2 β w K N b v b w 2 + β w K N b v b w d w + β w K N d v b w 2 β w K N d v b w d w = 0

References

  1. Cummings, B.E. Potted plants do A review and analysis Persistence of coronaviruses on inanimate surfaces and their inactivation with biocidal agents. J. Hosp. Infect. 2020, 104, 246–251. [Google Scholar]
  2. Abubakr, N.; Salem, Z.A.; Kamel, A.H.M. Oral manifestations in mild-to-moderate cases of COVID-19 viral infection in the adult population. Dent. Med. Probl. 2021, 58, 7–15. [Google Scholar] [CrossRef] [PubMed]
  3. Gu, J.; Han, B.; Wang, J. COVID-19: Gastrointestinal manifestations and potential fecal–oral transmission. Gastroenterology 2020, 158, 1518–1519. [Google Scholar] [CrossRef] [PubMed]
  4. Yu, P.; Zhu, J.; Zhang, Z.; Han, Y. A familial cluster of infection associated with the 2019 novel coronavirus indicating possible person-to-person transmission during the incubation period. J. Infect. Dis. 2020, 221, 1757–1761. [Google Scholar] [CrossRef] [PubMed] [Green Version]
  5. Huang, C.; Wang, Y.; Li, X.; Ren, L.; Zhao, J.; Hu, Y.; Zhang, L.; Fan, G.; Xu, J.; Gu, X.; et al. Clinical features of patients infected with 2019 novel coronavirus in Wuhan, China. Lancet 2020, 395, 497–506. [Google Scholar] [CrossRef] [Green Version]
  6. Bai, Y.; Yao, L.; Wei, T.; Tian, F.; Jin, D.Y.; Chen, L.; Wang, M. Presumed asymptomatic carrier transmission of COVID-19. JAMA 2020, 323, 1406–1407. [Google Scholar] [CrossRef] [Green Version]
  7. Liu, Y.C.; Liao, C.H.; Chang, C.F.; Chou, C.C.; Lin, Y.R. A Locally Transmitted Case of SARS-CoV-2 Infection in Taiwan. N. Engl. J. Med. 2020, 382, 1070–1072. [Google Scholar] [CrossRef] [Green Version]
  8. Paradowska-Stolarz, A.M. Oral manifestations of COVID-19: Brief review. Dent. Med. Probl. 2021, 58, 123–126. [Google Scholar] [CrossRef]
  9. Torul, D.; Omezli, M.M. Is saliva a reliable biofluid for the detection of COVID-19? Dent. Med. Probl. 2021, 58, 229–235. [Google Scholar] [CrossRef]
  10. Rubulotta, F.; Soliman-Aboumarie, H.; Filbey, K. Technologies to optimize the care of severe coronavirus disease 2019 patients for health care providers challenged by limited resources. Anesth. Analgesia. 2020, 131, 351–364. [Google Scholar] [CrossRef]
  11. Riggioni, C.; Comberiati, P.; Giovannini, M.; Agache, I.; Akdis, M.; Alves-Correia, M.; Antó, J.M.; Arcolaci, A.; Azkur, A.K.; Azkur, D.; et al. A compendium answering 150 questions on COVID-19 and SARS-CoV-2. Allergy 2020, 75, 2503–2541. [Google Scholar] [CrossRef]
  12. Voinsky, I.; Baristaite, G.; Gurwitz, D. Effects of age and sex on recovery from COVID-19: Analysis of 5769 Israeli patients. J. Infect. 2020, 81, e102–e103. [Google Scholar] [CrossRef]
  13. Martynowicz, H.; Jodkowska, A.; Poręba, R.; Mazur, G.; Więckiewicz, M. Demographic, clinical, laboratory, and genetic risk factors associated with COVID-19 severity in adults: A narrative review. Dent. Med. Probl. 2021, 58, 115–121. [Google Scholar] [CrossRef]
  14. Salgotra, R.; Gandomi, M.; Gandomi, A.H. Time series analysis and forecast of the COVID-19 pandemic in India using genetic programming. Chaos Solitons Fractals 2020, 138, 109945. [Google Scholar] [CrossRef]
  15. Coronavirus WHO. Available online: https://COVID19.who.int/ (accessed on 15 March 2021).
  16. Lam, S.K.; Kwong, E.W.; Hung, M.S.; Chien, W.T. Investigating the strategies adopted by emergency nurses to address uncertainty and change in the event of emerging infectious diseases: A grounded theory study. Int. J. Environ. Res. Public Health 2020, 17, 2490. [Google Scholar] [CrossRef] [Green Version]
  17. Cupertino, M.C.; Resende, M.B.; Mayer, N.A.; Carvalho, L.M.; Siqueira-Batista, R. Emerging and re-emerging human infectious diseases: A systematic review of the role of wild animals with a focus on public health impact. Asian Pac. J. Trop. Med. 2020, 13, 99. [Google Scholar] [CrossRef]
  18. Ambat, A.S.; Vyas, N. Assessment of preparedness against emerging infectious disease among private hospitals in a district of South India. Med. J. Armed Forces India 2022, 78, 42–46. [Google Scholar] [CrossRef]
  19. Wu, Z.; Yang, L.; Ren, X.; He, G.; Zhang, J.; Yang, J.; Qian, Z.; Dong, J.; Sun, L.; Zhu, Y.; et al. Deciphering the bat virome catalog to better understand the ecological diversity of bat viruses and the bat origin of emerging infectious diseases. ISME J. 2016, 10, 609–620. [Google Scholar] [CrossRef] [Green Version]
  20. Wu, Z.; Lu, L.; Du, J.; Yang, L.; Ren, X.; Liu, B.; Jiang, J.; Jiang, Y.; Dong, J.; Sun, L.; et al. Comparative analysis of rodent and small mammal viromes to better understand the wildlife origin of emerging infectious diseases. Microbiome 2018, 6, 1–14. [Google Scholar] [CrossRef]
  21. Rachowicz, L.J.; Hero, J.M.; Alford, R.A.; Taylor, J.W.; Morgan, J.A.T.; Vredenburg, V.T.; Collins, J.P.; Briggs, C.J. The novel and endemic pathogen hypotheses: Competing explanations for the origin of emerging infectious diseases of wildlife. Conserv. Biol. 2005, 19, 1441–1448. [Google Scholar] [CrossRef]
  22. Oei, W.; Janssen, M.P.; van der Poel, C.L.; van Steenbergen, J.E.; Rehmet, S.; Kretzschmar, M.E. Modeling the transmission risk of emerging infectious diseases through blood transfusion. Transfusion 2013, 53, 1421–1428. [Google Scholar] [CrossRef] [PubMed]
  23. McBryde, E. The value of early transmission dynamic studies in emerging infectious diseases. Lancet Infect. Dis. 2020, 20, 512–513. [Google Scholar] [CrossRef] [Green Version]
  24. Sarkar, K.; Khajanchi, S.; Nieto, J.J. Modeling and forecasting the COVID-19 pandemic in India. Chaos Solitons Fractals 2020, 139, 110049. [Google Scholar] [CrossRef] [PubMed]
  25. Yang, Z.; Zeng, Z.; Wang, K.; Wong, S.-S.; Liang, W.; Zanin, M.; Liu, P.; Cao, X.; Gao, Z.; Mai, Z.; et al. Modified SEIR and AI prediction of the epidemics trend of COVID-19 in China under public health interventions. J. Thorac. Dis. 2020, 12, 165. [Google Scholar] [CrossRef]
  26. Tang, B.; Wang, X.; Li, Q.; Bragazzi, N.L.; Tang, S.; Xiao, Y.; Wu, J. Estimation of the transmission risk of the 2019-nCoV and its implication for public health interventions. J. Clin. Med. 2020, 9, 462. [Google Scholar] [CrossRef] [Green Version]
  27. Maki, D.G. SARS revisited: The challenge of controlling emerging infectious diseases at the local, regional, federal, and global levels. In Mayo Clinic Proceedings; Elsevier: Amsterdam, The Netherlands, 2004; Volume 79, pp. 1359–1366. [Google Scholar]
  28. Brug, J.; Aro, A.R.; Richardus, J.H. Risk Perceptions and Behaviour: Towards Pandemic Control of Emerging Infectious Diseases. Int. J. Behav. Med. 2009, 16, 3–6. [Google Scholar] [CrossRef] [Green Version]
  29. Li, G.; Dong, Y. Dynamic modelling of the impact of public health education on the control of emerging infectious disease. J. Biol. Dyn. 2019, 13, 502–517. [Google Scholar] [CrossRef]
  30. Pan, Q.; Gao, T.; He, M. Influence of isolation measures for patients with mild symptoms on the spread of COVID-19. Chaos Solitons Fractals 2020, 139, 110022. [Google Scholar] [CrossRef]
  31. Kumar, S.; Thakur, K.; Sharma, B.; Bhardwaj, T.R.; Prasad, D.N.; Singh, R.K. Recent Advances in Vaccine Development for the Treatment of Emerging Infectious Diseases. Indian J. Pharm. Educ. Res. 2019, 53, 343–354. [Google Scholar] [CrossRef] [Green Version]
  32. Krause, R.M.; Dimmock, N.J.; Morens, D.M. Summary of antibody workshop: The role of humoral immunity in the treatment and prevention of emerging and extant infectious diseases. J. Infect. Dis. 1997, 176, 549–559. [Google Scholar] [CrossRef] [Green Version]
  33. Wood, C.S.; Thomas, M.R.; Budd, J.; Mashamba-Thompson, T.; Herbst, K.; Pillay, D.; Peeling, R.W.; Johnson, A.M.; McKendry, R.A.; Stevens, M.M. Taking connected mobile-health diagnostics of infectious diseases to the field. Nature 2019, 566, 467–474. [Google Scholar] [CrossRef]
  34. Han, P.; Ivanovski, S. Saliva—Friend and foe in the COVID-19 outbreak. Diagnostics 2020, 10, 290. [Google Scholar] [CrossRef]
  35. Manzar, S.; Kazmi, F.; Shahzad, H.B.; Qureshi, F.A.; Shahbaz, M.; Rashid, S. Estimation of the risk of COVID-19 transmission through aerosol-generating procedures. Dent. Med. Probl. 2022; published ahead of print. [Google Scholar] [CrossRef]
  36. Meyerowitz, E.A.; Richterman, A.; Gandhi, R.T.; Sax, P.E. Transmission of SARS-CoV-2: A review of viral, host, and environmental factors. Ann. Intern. Med. 2021, 174, 69–79. [Google Scholar] [CrossRef]
  37. Sun, H.; Lau, A.; Heo, Y.C.; Lin, L.; DeLong, R.; Fok, A. Relationships between tissue properties and operational parameters of a dental handpiece during simulated cavity preparation. J. Dent. Biomech. 2013, 4, 1758736013483747. [Google Scholar] [CrossRef] [Green Version]
  38. Khan, M.A.; Atangana, A. Modeling the dynamics of novel coronavirus (2019-nCov) with fractional derivative. Alex. Eng. J. 2020, 59, 2379–2389. [Google Scholar] [CrossRef]
  39. Pei, S.; Kandula, S.; Yang, W.; Shaman, J. Forecasting the spatial transmission of influenza in the United States. Proc. Natl. Acad. Sci. USA 2018, 115, 2752–2757. [Google Scholar] [CrossRef] [Green Version]
  40. Zhou, D.; Gao, L.; Pan, Q.; He, M. The Impacts of Medical Resources on Emerging Self-Limiting Infectious Diseases. Appl. Sci. 2022, 12, 4255. [Google Scholar] [CrossRef]
  41. Viana, R.; Moyo, S.; Amoako, D.G.; Tegally, H.; Scheepers, C.; Althaus, C.L.; Anyaneji, U.J.; Bester, P.A.; Boni, M.F.; Chand, M.; et al. Rapid epidemic expansion of the SARS-CoV-2 Omicron variant in southern Africa. Nature 2022, 603, 679–686. [Google Scholar] [CrossRef]
  42. Shuai, H.; Chan, J.F.W.; Hu, B.; Chai, Y.; Yuen, T.; Yin, F.; Huang, X.; Yoon, C.; Ju, J.-C.; Liu, H.; et al. Attenuated replication and pathogenicity of SARS-CoV-2 B.1.1.529 Omicron. Nature 2022, 603, 693–699. [Google Scholar] [CrossRef]
  43. Li, R.; Pei, S.; Chen, B.; Song, Y.; Zhang, T.; Yang, W.; Shaman, J. Substantial undocumented infection facilitates the rapid dissemination of novel coronavirus (SARS-CoV2). Science 2020, 16, eabb3221. [Google Scholar] [CrossRef]
  44. Blavatska, V.; Holovatch, Y. Spreading processes in post-epidemic environments. Phys. A Stat. Mech. Appl. 2021, 573, 125980. [Google Scholar] [CrossRef]
  45. Lu, L.; Quintela, I.; Lin, C.; Lin, T.-C.; Lin, C.-H.; Wu, V.C.H.; Lin, C.-S. A review of epidemic investigation on cold-chain food-mediated SARS-CoV-2 transmission and food safety consideration during COVID-19 pandemic. J. Food Saf. 2021, 41, e12932. [Google Scholar] [CrossRef] [PubMed]
  46. Chen, J.I.P.; Hsu, L.Y.; Cook, A.R.; Yap, J.C.H. COVID-19 Containment Measures. In Uncovering the Science Of COVID-19; World Scientific: Singapore, 2022; pp. 147–203. [Google Scholar]
  47. Checchi, V.; Bellini, P.; Bencivenni, D.; Consolo, U. COVID-19 dentistry-related aspects: A literature overview. Int. Dent. J. 2021, 71, 21–26. [Google Scholar] [CrossRef] [PubMed]
  48. Dziedzic, A.; Wojtyczka, R. The impact of coronavirus infectious disease 19 (COVID-19) on oral health. Oral Dis. 2021, 27, 703–706. [Google Scholar] [CrossRef]
Figure 1. Transforming relationships with direct transmission.
Applsci 12 11849 g001
Figure 2. Transforming relationships with indirect transmission.
Applsci 12 11849 g002
Figure 3. Changes in the number of W , S h , E h , and I h with different d w in model 1.
Applsci 12 11849 g003
Figure 4. Changes in the number of W , S h , E h , and I h with different d in model 1.
Applsci 12 11849 g004
Figure 5. Changes in the numbers of W , S h , E h , and I h with different d w in model 2.
Applsci 12 11849 g005
Figure 6. Changes in the numbers of W , S h , E h , and I h with d w = 0.85 in model 1 (direct transmission) and 2 (indirect transmission).
Applsci 12 11849 g006
Figure 7. Changes in the numbers of W , S h , E h , and I h with different d in model 2.
Applsci 12 11849 g007
Figure 8. Changes in the numbers of W , S h , E h , and I h with d = 0.9 in model 1 (direct transmission) and 2 (indirect transmission).
Applsci 12 11849 g008
Figure 9. Changes in the numbers of W , S v , I v , S h , E h , and I h with different d 1 in model 2.
Applsci 12 11849 g009
Figure 10. Changes in the numbers of W , S h , E h , and I h with different d and d w = 0.85 in model 2.
Applsci 12 11849 g010
Figure 11. Changes in the numbers of W , S h , E h , and I h with different d and d w = 0.9 in model 2.
Applsci 12 11849 g011
Table 1. The parameters in models.
ParametersDefinitionsValueUnit
K Carrying capacity of pathogenic population 5000 Quantity
b w Incidence rate of pathogenic population 0.01 Day−1
d w Removal rate of pathogenic population 0.01 Day−1
A Recruitment rate of human 1000 Quantity
d h Removal rate of humans 3.6 × 10 8 Day−1
β h Transmission rate among human 3 × 10 8 Day−1
β w Transmission rate from pathogenic population to human 1 × 10 8 Day−1
α Average latency period 1 14 Dimensionless
d Removal rate of infected human 0.09817 Day−1
N Carrying capacity of inanimate-mediated 5000 Quantity
β v Transmission rate among inanimate-mediated 1 × 10 6 Day−1
b v The growth rate of inanimate-mediated 0.001 Day−1
d v Removal rate of inanimate-mediated 0.0001 Day−1
d 1 Disinfection rate 0 1 Day−1
β Transmission rate from inanimate-mediated to human 0.01 Day−1
Publisher’s Note: MDPI stays neutral with regard to jurisdictional claims in published maps and institutional affiliations.

