1. Introduction
The excessive increase of data on various web applications has made the process of extracting useful information very difficult because of the information overload. Various information retrieval techniques are proposed to handle this overwhelming amount of data [
1]. Collaborative filtering (CF) has become the vital tool of information retrieval, due to its efficiency and simplicity. Memory-based (MeB) CF is the most prevalent approach to predict the interests of a user automatically and more precisely. For that, it collects preferences or tastes findings from an extensive number of users. Given a set of users’ likes or dislikes about different movies, a CF-based recommendation system (RS) for movie preferences could infer assumptions regarding which movie a user would like [
2,
3]. MeB CF utilizes a user-item rating dataset to determine how similar users or items are. An example of MeB CF is item-based and user-based Top-N recommendations. However, in practise, consumers typically assess a small number of things, making the datasets used in many commercial RS sparse. In a sparse circumstance where there are fewer co-rated items, prevalent similarity metrics/measures (SeMs) have significant accuracy problems. Only a few studies address the aforementioned problem, despite the fact that numerous works have been done to increase the CF’s accuracy in sparse datasets.
Patra et al. proposed a novel SeM to address the above issue by exploiting the Bhattacharyya coefficient (BC) [
4]. When calculating similarity, the ratings produced by the two users are taken into account. The final similarity value is calculated using both local and global information. However, this approach failed to compute the similarity between two disjoint rating vectors, as Jaccard similarity in such cases will be zero. The following table explains the conditions when SeM using BC is also unable to determine the similarity value between users as with in similar fashion.
Table 1 signifies the rating information of 3 users on six movies, whereas all related genres of each movie are represented in
Table 2. As mentioned in
Table 1, all widely used SeMs are unable to find the similarity between users in such a situation. Furthermore, categorical attributes of the item, suggested by Ye et al., have been used to obtain the similarity [
5]. The performance of CF using categorical attributes can be improved by using a modified prediction approach. The categorical attributes of items are utilized in the proposed methodology since they naturally stimulate users’ interest [
6,
7,
8]. A user’s bias for a certain attribute of an item is possible. For instance, if a user gave an action movie a rating ‘of 5’, we can infer from the categorical attributes that users are interested in an action movie.
Therefore, we consider a reasonable approach to alleviate the aforementioned issue. The proposed methodology is based on the following assumptions: (i) If two users’ tastes/rating patterns are identical, they will enjoy items with same features, (ii) a user may like the product liked by the ’most’ similar neighbor. The motivation behind the above assumptions is twofold: (i) it does not require a co-rated item to obtain the closest neighbors and (ii) the prediction result will be more accurate in a situation where the similarity value of Top-N neighbors varies significantly. The important contributions to this manuscript are listed below.
Utilizing the item’s categorical features, a modified similarity measure has been employed.
The most similar neighbor is used to predict the rating in the prediction approach.
The comparison between the proposed method utilizing the modified similarity measure and prediction approach and the traditional collaborative filtering algorithms has been done based on MAE and RMSE.
The remaining structure of this paper is as follows: The Background and Literature Survey is represented in
Section 2, where we provide the background of RS and some prevalent works of CF-based RS. The proposed recommendation approach is discussed in
Section 3, where we illustrate the proposed framework of CF-based RS. The main subsections used in
Section 3 are Data Collection (user feedback extraction), Similarity Calculation (Exploring Top-k Co-Related Neighbors), Predicting the Rating (Computing the Rating Predicted for an Item), Recommending Top-N Item to the Target User, and Illustrative Example. Additionally,
Section 4 offers a comparative examination of this work, and
Section 5 concludes the paper.
2. Background and Literature Survey
2.1. Recommendation Systems
Goldberg et al. throw light on CF-based RS in 1992 [
9]. Several RS approaches have emerged due to the inspiration provided by their recent practical implementation. These techniques have often been divided into four broad categories:
Based on the presumption that people with comparable physical and personal traits, such as age, geography, gender, etc., possibly have common interests, the demographic filtering technique gives suggestions to the active user [
10].
An item is suggested and recommended to a user in the content-based filtering approach by examining the specifications of the item that they have previously selected [
11,
12]. These systems do not care about the ratings customers offer the products.
The recommendations in the CF approach are based on the items’ user ratings [
11,
13]. In order to estimate user ratings for unrated products, users having similar ratings are used.
The benefits of collaborative filtered approach and content based are combined in the hybrid filtering technique to address the issues with overspecialization, sparsity, cold start [
14,
15], and other issues in MeB CF [
16].
CF, the most commonly used RS approach, can be categorized into neighbor-hood-based (memory-based) CF and model-based CF. In neighborhood-based CF, a user-item rating matrix is utilized to compute co-related users and rating predictions. In model-based CF approaches, a user-item rating database generates a learning, or statistical model [
17]. Subsequently, it is used for predictions and does not require whole rating data when the model is completely built [
1,
18]. Some approaches of model-based CF are more efficient than neighborhood-based CF in the prediction of rating [
19,
20]. Neighborhood-based CF is a popular strategy in the e-commerce industry because: (i) It is easy to use, intuitive, and doesn’t require any training [
21]. (ii) It uses one parameter, namely the neighborhood’s K-number, whereas a model-based approach requires various factors, including regularisation and learning parameters, etc. [
22].
Related Work of CF-Based ReS
Traditionally SeMs, including the Pearson correlation coefficient, and cosine similarity, are vital measures to calculate user similarities [
23,
24]. Numerous SeMs variations are introduced to enhance the functionality of current CF-based RS. Examples include Constrained Pearson Correlation Coefficient and Adjusted Cosine similarity [
25]. However, they are restricted by a sparse dataset that includes few or no co-rated items [
26]. For the said metrics, the other drawback that can be identified includes frequently revealing high user similarity when there are fewer items [
27]. Additionally, these computations exclude all user ratings for the specific pair, which are taken into consideration by the Jaccard SeM. Hence, it is affected with a few co-rated item problems when the dataset is highly sparse.
To resolve the aforementioned problem and enhance the functionality of CF-based RS, different SeMs have been proposed in the literature. Among these traditional SeMs, PIP is the prominent favored measure in RS. The three key factors are popularity, impact, and proximity within two rating patterns, used in PIP measure [
28]. The proximity factor is computed as the intra-arithmetic difference between two rating patterns of an item. The depiction of the impact factor indicates the strongness of how a preference is held or disliked by a user, whereas a rating is given importance by the popularity factor.
To address the drawbacks of the conventional SeMs, Bobadilla et al. presented some of SeMs [
29,
30]. They integrated Jaccard and Mean squared difference in their proposed technique (JMSD) [
24]. They demonstrated that the JMSD-based CF surpassed the PIP-based CF on the basis of mean absolute error. A similar method, known as the Cosine-Jaccard-Mean Measure of Divergence (CJacMMD), has been produced by Suryakantet al. It combines the Mean Measure of Divergence, Jaccard, and Cosine [
31]. All three said measures lack some co-rated items problem in a sparse rating dataset. In such a scenario, Patra et al. have introduced a SeM using the Bhattacharyya coefficient when few or no items are co-rated [
4]. Their proposed SeM has been utilized to attain the overall co-relations among users, and local and global rating data are used.
In literature, there are many prominent SeMs and prediction methodologies applied in the CF-based RS. The following
Table 3 and
Table 4 represent the vital references and computational equations of SeMs and prediction approaches.
Here, BC, CS, ED, ACS, SC, and PC denote Bhattacharyya Coefficient, Cosine Similarity, Euclidean Distance, Adjusted Cosine Similarity, Spearman Correlation, and Pearson Correlation respectively. The similarity of users u and v is determined by Cor(u,v). Jacc(u,v) notify the similarity of users u and v by Jaccard Similarity. The Bhattacharyya coefficient is used by BC(i,j) to determine how similar two items i and j are, whereas identifies the local similarity between users u and v with regard to items i and j. Users u and v’s ratings on item i are shown by and respectively, whereas, and indicate, accordingly, the average rating of users u and v. and indicate the order in which users u and v rated item i, whereas, and represent accordingly, the average rank based on the ratings of users u and v.
Here,
represents the predicted value of item
i for active user
u.
and
are the standard deviation of rating of item
i &
j respectively.In this paper, we use BC for the comparative analysis because similarity measure using BC provides a more accurate recommendation, as discussed earlier.
Table 5 represents a list of notable literature that discusses modified SeM.
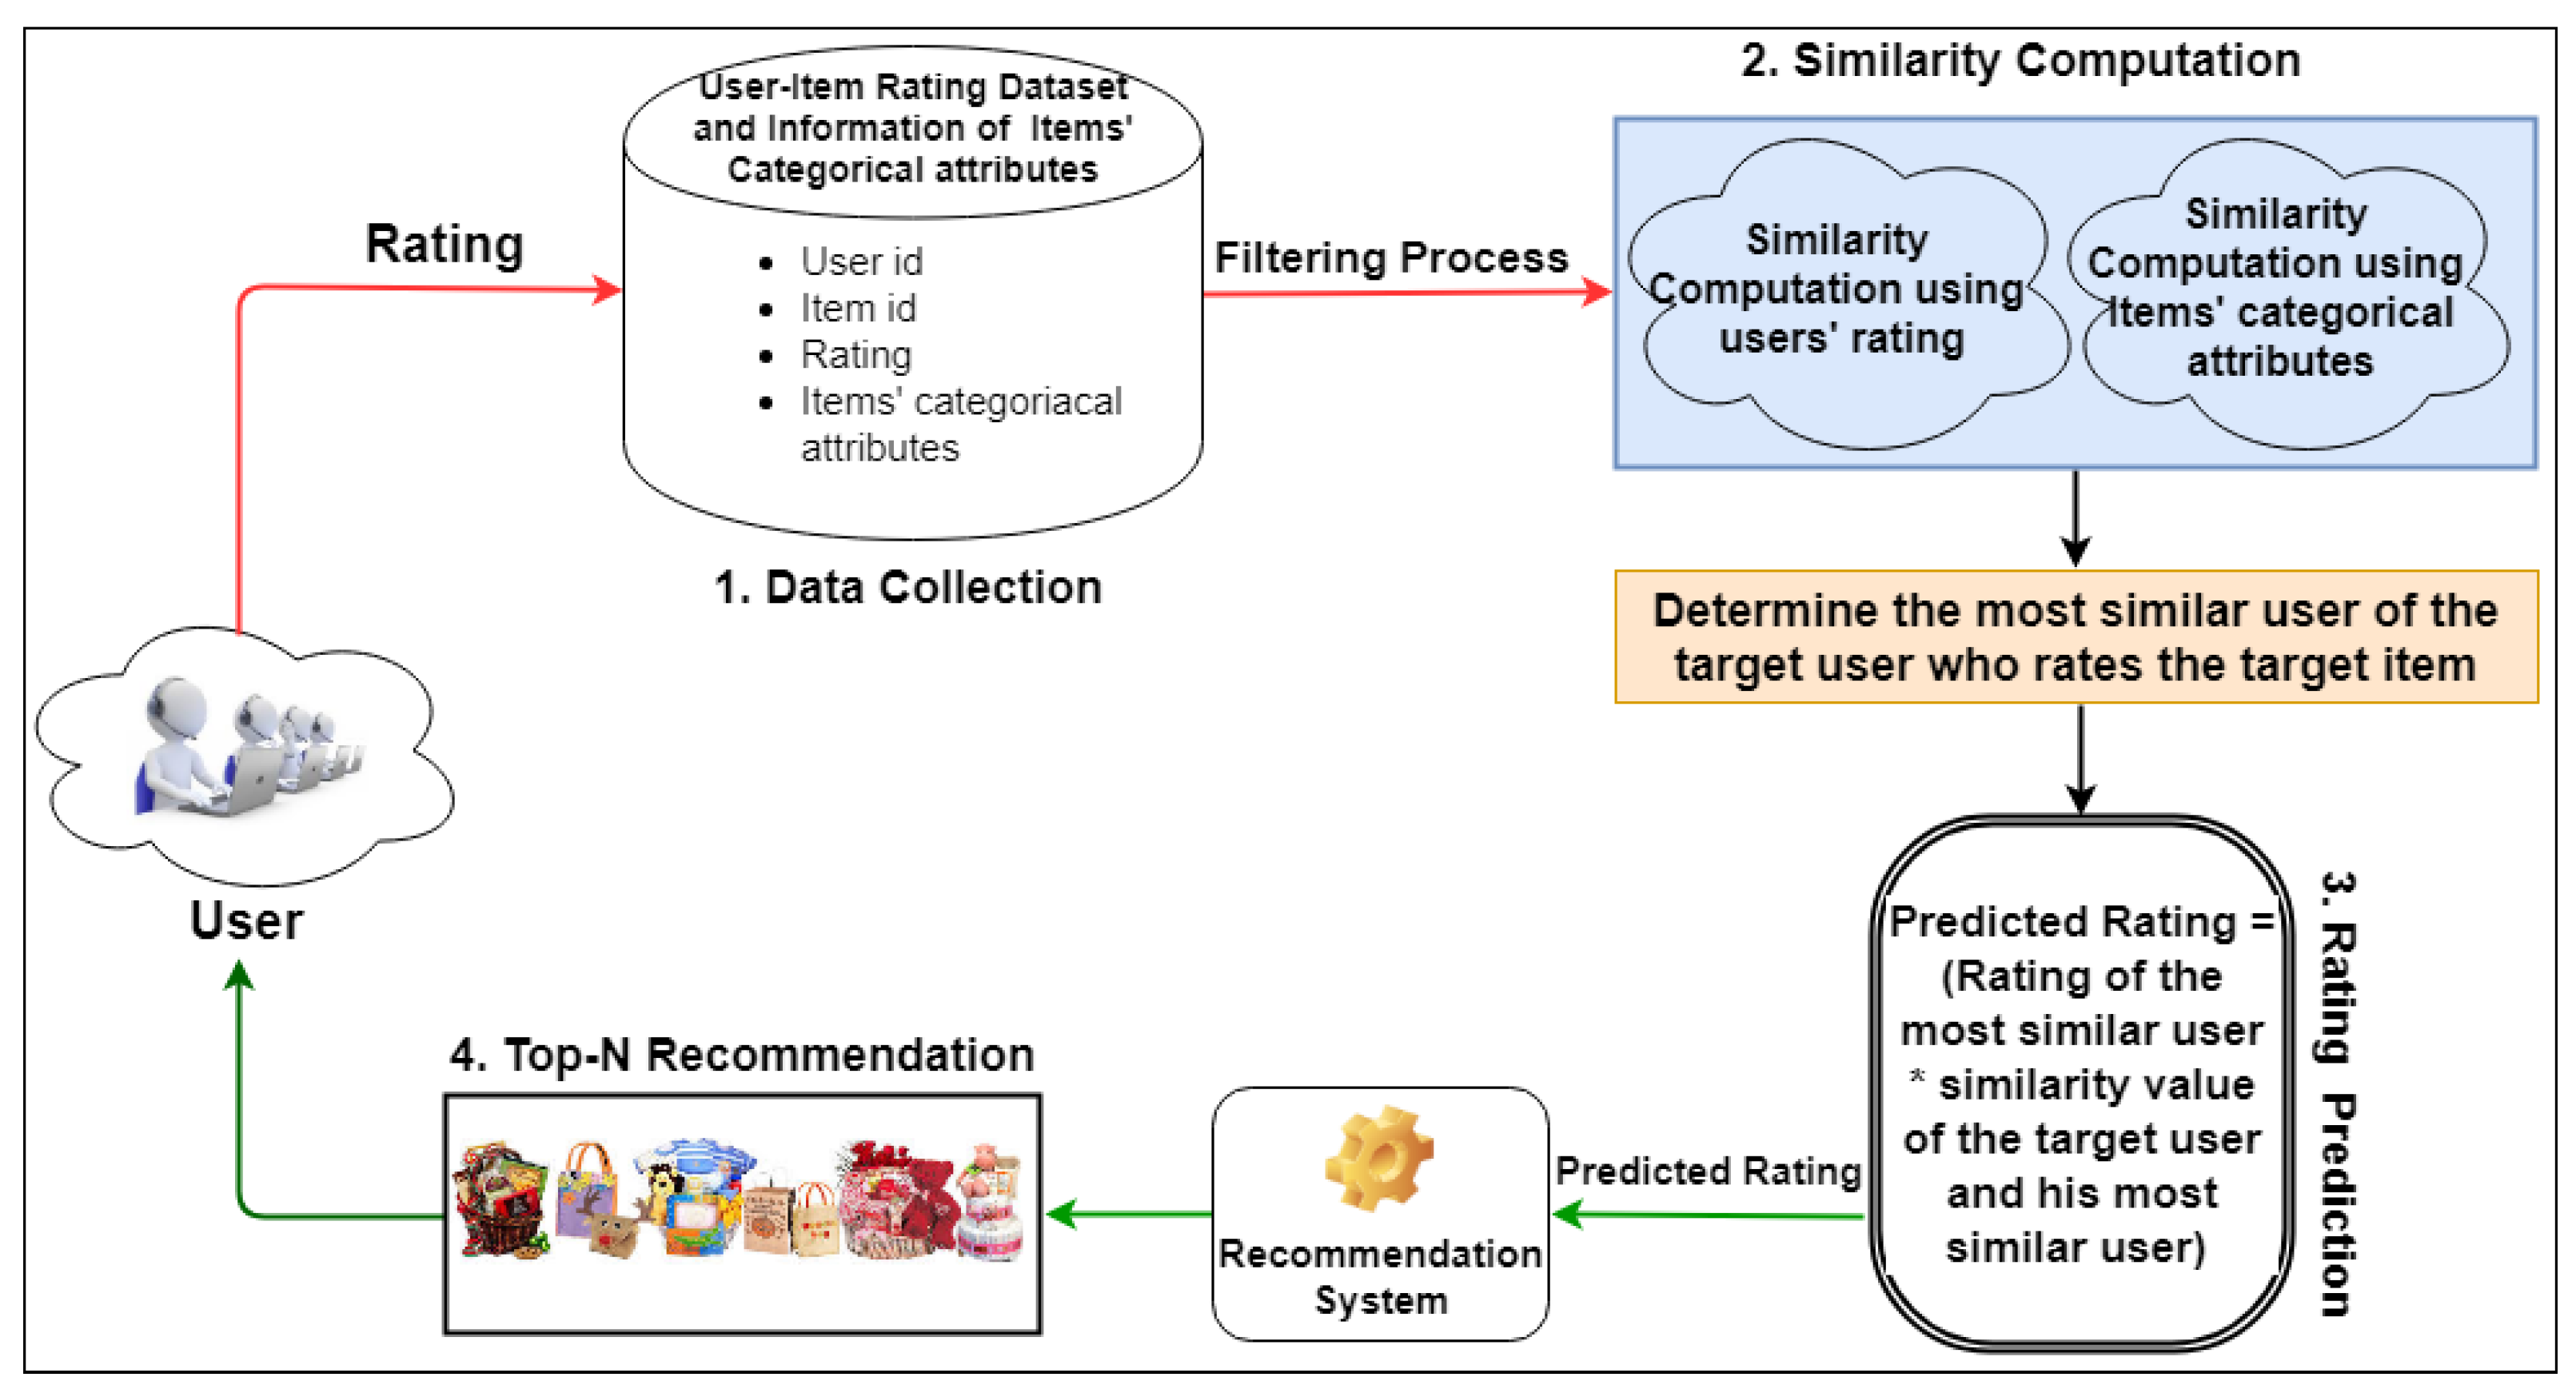
3. Proposed Recommendation Approach (MSMPPA)
Although CF is the most reliable and effective recommendation method for movies, music, news, e-commerce, etc., it is unable to identify correlation in an extremely sparse dataset. The accuracy of CF-based RS decreases in a sparse dataset due to the unavailability of co-rated items in similarity computation. To mitigate this problem, a SeM using BC has been introduced. But, still, there is a scope for improvement as similarity computation using the Bhattacharya coefficient is not suitable when rating vectors are disjoint. In this paper, we are motivated to utilize the benefits of collaborative filtering. When rating vectors are disjoint, the difficulty of similarity computation using BC can be mitigated if a categorical attribute (ICA) of items is considered. To begin, user centric-attribute matrix is converted from user centric-item matrix into a, where the columns and rows, respectively, reflect the user along with their interest in a particular feature’s item.
Figure 1 represents the general framework of the proposed approach, which can be viewed as follows:
3.1. Data Collection (User Feedback Extraction)
The key component of CF is user feedback or rating. A rating value is inherited from the users’ preferences and interests (UI) toward the specific item. If two users have identical rating patterns for items they have in common, they are considered to be ’most’ similar neighbors. In CF-based RS, two methods—implicit and explicit—are employed to gather user input or ratings. The system aims to gather data from user activity in an implicit rating gathering. These actions include how long visitors spend looking for something, how many times they click on anything, how they move the mouse, etc. Contrarily, with the collection of explicit ratings, every user offers feedback by directly rating a specific item in the range of numerical values.
3.2. Similarity Calculation (Exploring Top-k Co-Related Neighbors)
The proposed methodology follows several stages while computing similarity, i.e.,
Calculating similarity based on explicit user ratings, i.e., .
Calculating similarity based on user interest in categorical attributes of items, i.e., .
Combine
and
making use of the equilibrium factor. The final similarity equation becomes:
Here, displays the balance factor that regulates the import of and .
In the proposed Correlated similarity computation, is calculated using at least one of the traditional SeMs, whereas the proposed approach uses the below-mentioned procedures to calculate .
3.2.1. Items’ Categorical Attribute (ICA)
Numerous categories/attributes can be applied to an item. All parametric attributes that define a specific item are contained within the item’s categorical attribute set. For instance, the category attribute set of a movie can take actors, directors, and genre into account.
Table 6 depicts a collection of
n items, each of which has
k category attributes. The value of
will be considered as 1 if a particular item
i exists in the
kth parametric attribute else the value will be considered as 0.
3.2.2. Findings of User’s Interest on Items’ Categorical Attributes
More ICA occurrences indicate that a user is more interested in this category trait. A matrix of size zxk is represented in
Table 7, where z and k identify the total number of users and ICA, respectively.
Here,
defines how the
qth user is dependent on
kth parametric attribute of an item.
is obtained by
.
signifies the total ratings count the
kth parametric attribute by user
q, whereas
shows the overall ratings provided by user
q. The proposed approach uses
Table 7 in the calculation of
value.
3.3. Predicting the Rating (Compute the Rating Predicted for an Item)
The prediction approach signifies a major role in attaining accuracy in the recommendation of CF-based RS. Therefore, a novel equation is also introduced to obtain the estimated rating for the desired item. The aforesaid equation becomes:
Here, represents the predicted rating of target user u on item i. (i,j) denotes the ’most’ similar item j of target item i, and shows the rating of target user u on item j.
3.4. Recommending Top-N Item to the Target User
The final section of the conceptual framework offers top-n best items to the targeted user. Considering the expected rating of items determined by the preceding component of the framework, the system creates a list of the top-n best items and recommends these items to the target-ted user. Due to the expected rating, the RS has solely relied on this created list to provide recommendations. Algorithm 1 defines the algorithmic design of the proposed approach.
| Algorithm 1 Recommending Top-N Items to the Target User. |
- 1:
Input: User–Item rating dataset (UI), a list of users (U), a list of items (I), a list of items’ attributes k, and the equilibrium factor . - 2:
Output: A list of Top-N items that are recommended to target user u. - 3:
For ∀i ∈ I, ∀j ∈ k, compute a matrix of items’ categorical attribute - 4:
For ∀u ∈ U, ∀v ∈ U, u ≠ v, calculate the similarity of users’ u, vs. () by one of the traditional SeMs. - 5:
For ∀u ∈ U, ∀v ∈ U, u ≠ v, calculate correlated similarity within users u and vs. () by user’s interest of items’ categorical attributes. - 6:
Combine and on a specific value of balance factor . - 7:
Apply the proposed prediction approach and calculate the predicted rating of each target item. - 8:
Making a list of Top-N best items based on the rating predicted for each targeted user.
|
3.5. Illustrative Example
The proposed approach uses the following procedures to address the shortcomings of conventional SMs.
Step1: The similarity value has been calculated on users’ explicit rating from
Table 1.
Table 8 represents the value of
calculated by traditional BC.
Step2:Table 1 can be converted to
Table 9 by utilizing the
Section 3.2.1 and
Section 3.2.2.
Table 9 shows the users’ interest in items’ categorical attributes. Furthermore,
Table 10 represents the similarity value on the user’s interest of items’ categorical attributes (
), i.e., computed using
Table 9.
Step3: The final correlated value within users is displayed in
Table 11 with the balance factor
= 0.5.
Table 8.
Computed Correlated Value of the user obtained from explicit rating.
Table 8.
Computed Correlated Value of the user obtained from explicit rating.
| User | User1 | User2 | User3 |
|---|
| One | Nil | Nil |
| Nil | One | Nil |
| Nil | Nil | One |
Table 9.
User’s interest on items’ categorical attributes.
Table 9.
User’s interest on items’ categorical attributes.
| | Attribute |
Action
|
Romantic
|
Thriller
|
Horror
|
Animated
|
Children
|
|---|
| User | |
|---|
| 0.4 | 0.4 | 0.2 | 0 | 0 | 0 |
| 0 | 0.2 | 0.4 | 0.4 | 0 | 0 |
| 0 | 0.2 | 0.4 | 0.4 | 0 | 0 |
Table 10.
User’s correlated value on items’ categorical attributes.
Table 10.
User’s correlated value on items’ categorical attributes.
| User | User1 | User2 | User3 |
|---|
| 1 | 0.5194 | 0.5194 |
| 0.5194 | 1 | 1.1861 |
| 0.5194 | 1.1861 | 1 |
Table 11.
User’s similarity value.
Table 11.
User’s similarity value.
| User | User1 | User2 | User3 |
|---|
| 1 | 0.2597 | 0.2597 |
| 0.2597 | 1 | 0.5931 |
| 0.2597 | 0.5931 | 1 |
With the help of the illustrative example of this section, We notice that it’s simple to determine how similar two users are using items’ categorical attributes when the ratings of co-rated items are disjoint, few, or zero.
Table 12 represents the complete user-movie rating dataset, where ratings (highlighted in blue) show the predicted rating using the proposed RS.
4. Comparative Analysis
We have collected the Movielens datasets for the comparisons of this study makes [
58].
Table 13 shows the descriptions of these collected datasets.
To represent the effectiveness of the proposed recommendation algorithm, the collected datasets are further divided into various subsets of different sparsity levels by removing 20%, 30%, and 40% given ratings [
58,
59]. Detailed explanations of these subsets are shown in
Table 14.
Furthermore, These removed ratings are predicted using various CF algorithms, and This section’s comparative findings can be separated into two subsections, where = 0.5, the equilibrium factor, has been taken into account.
Comparison to justify the need for UI or ICA in SeM over traditional CF algorithms.
Comparison to show the effectiveness of the categorical attributes of the item in a SeM and the ‘most’ similar neighbor in the prediction approach.
ICA can be utilized to determine how similar users are when there is no co-rated items exist. In the following analysis, we conduct the comparative results of traditional and proposed SM in all traditional prediction approaches, i.e., MC, WA, and ZS. In the following
Table 15, BC represents the traditional SeM computed on explicit ratings, and UIBC shows the SeM computed on both ICA and explicit ratings using BC. Furthermore, other notations used in this analysis are shown in
Table 15.
The computational equations of performance metrics, i.e., MAE, and root mean squared error (RMSE) as follows [
59,
60,
61].
Here, the predicted and actual rating of item i are denoted by and respectively, whereas, N is the total number of items that were expected.
4.1. Comparison of Traditional CF Algorithms and CF Algorithm Which Includes Items’ Categorical Attributes
4.1.1. When Top-k Nearest Neighbor Is Applied
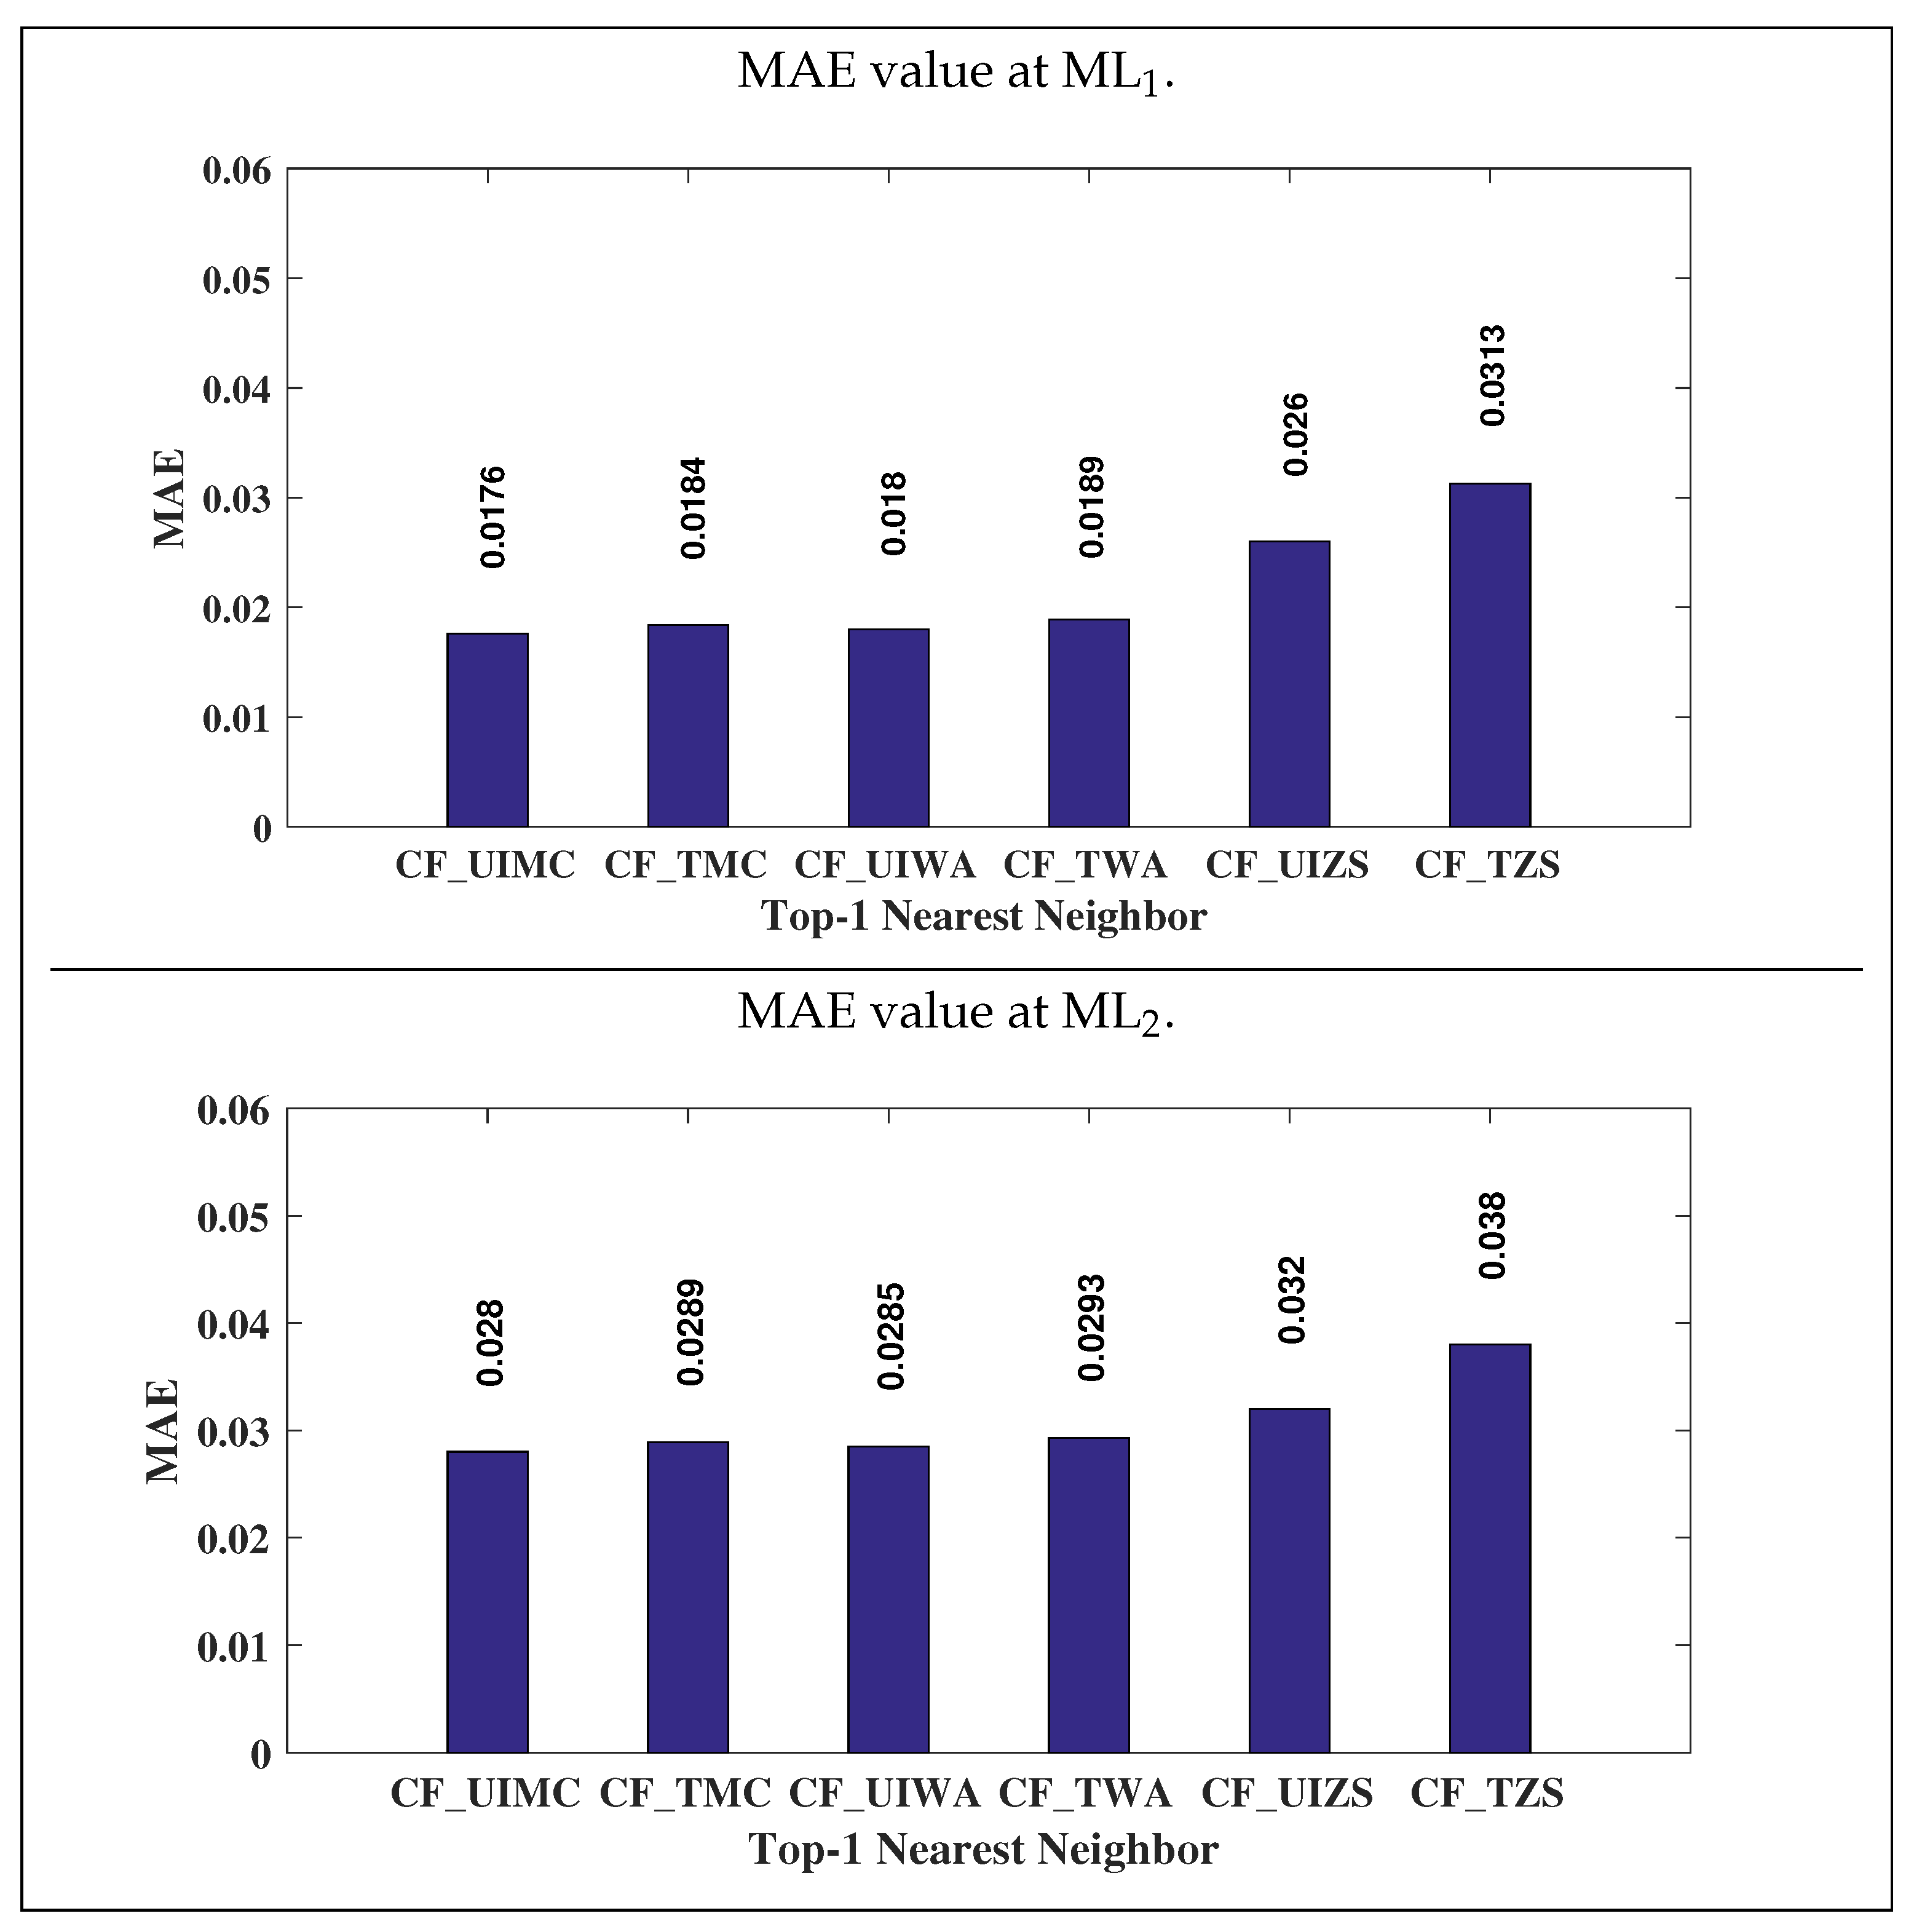
The
Figure 2 shows the comparison between traditional CF algorithms (CF_TMC, CF_TWA, and CF_TZS) and CF algorithms using items’ categorical attributes (CF_UIMC, CF_UIWA and CF_UIZS), based on MAE value at various datasets ML
and ML
. In the graph CF algorithms using items’ categorical attributes attain low prediction error than traditional CF algorithms for all considerable values of k in top-k neighbors in all traditional prediction approaches. Therefore, CF_UIMC, CF_UIWA, and CF_UIZS provide more accurate recommendation results than CF_TMC, CF_TWA, and CF_TZS respectively.
The
Figure 3 depicts the comparison between traditional CF algorithms and CF algorithms using items’ categorical attributes, based on MAE value at various datasets ML
, ML
and ML
. We can notice that CF algorithms using items’ categorical attributes provide less prediction error in all traditional prediction approaches (i.e., MC, WA, and ZS) at all considerable values of k in top-k neighbors. Therefore, CF_UIMC, CF_UIWA and CF_UIZS outperform CF_TMC, CF_TWA and CF_TZS respectively.
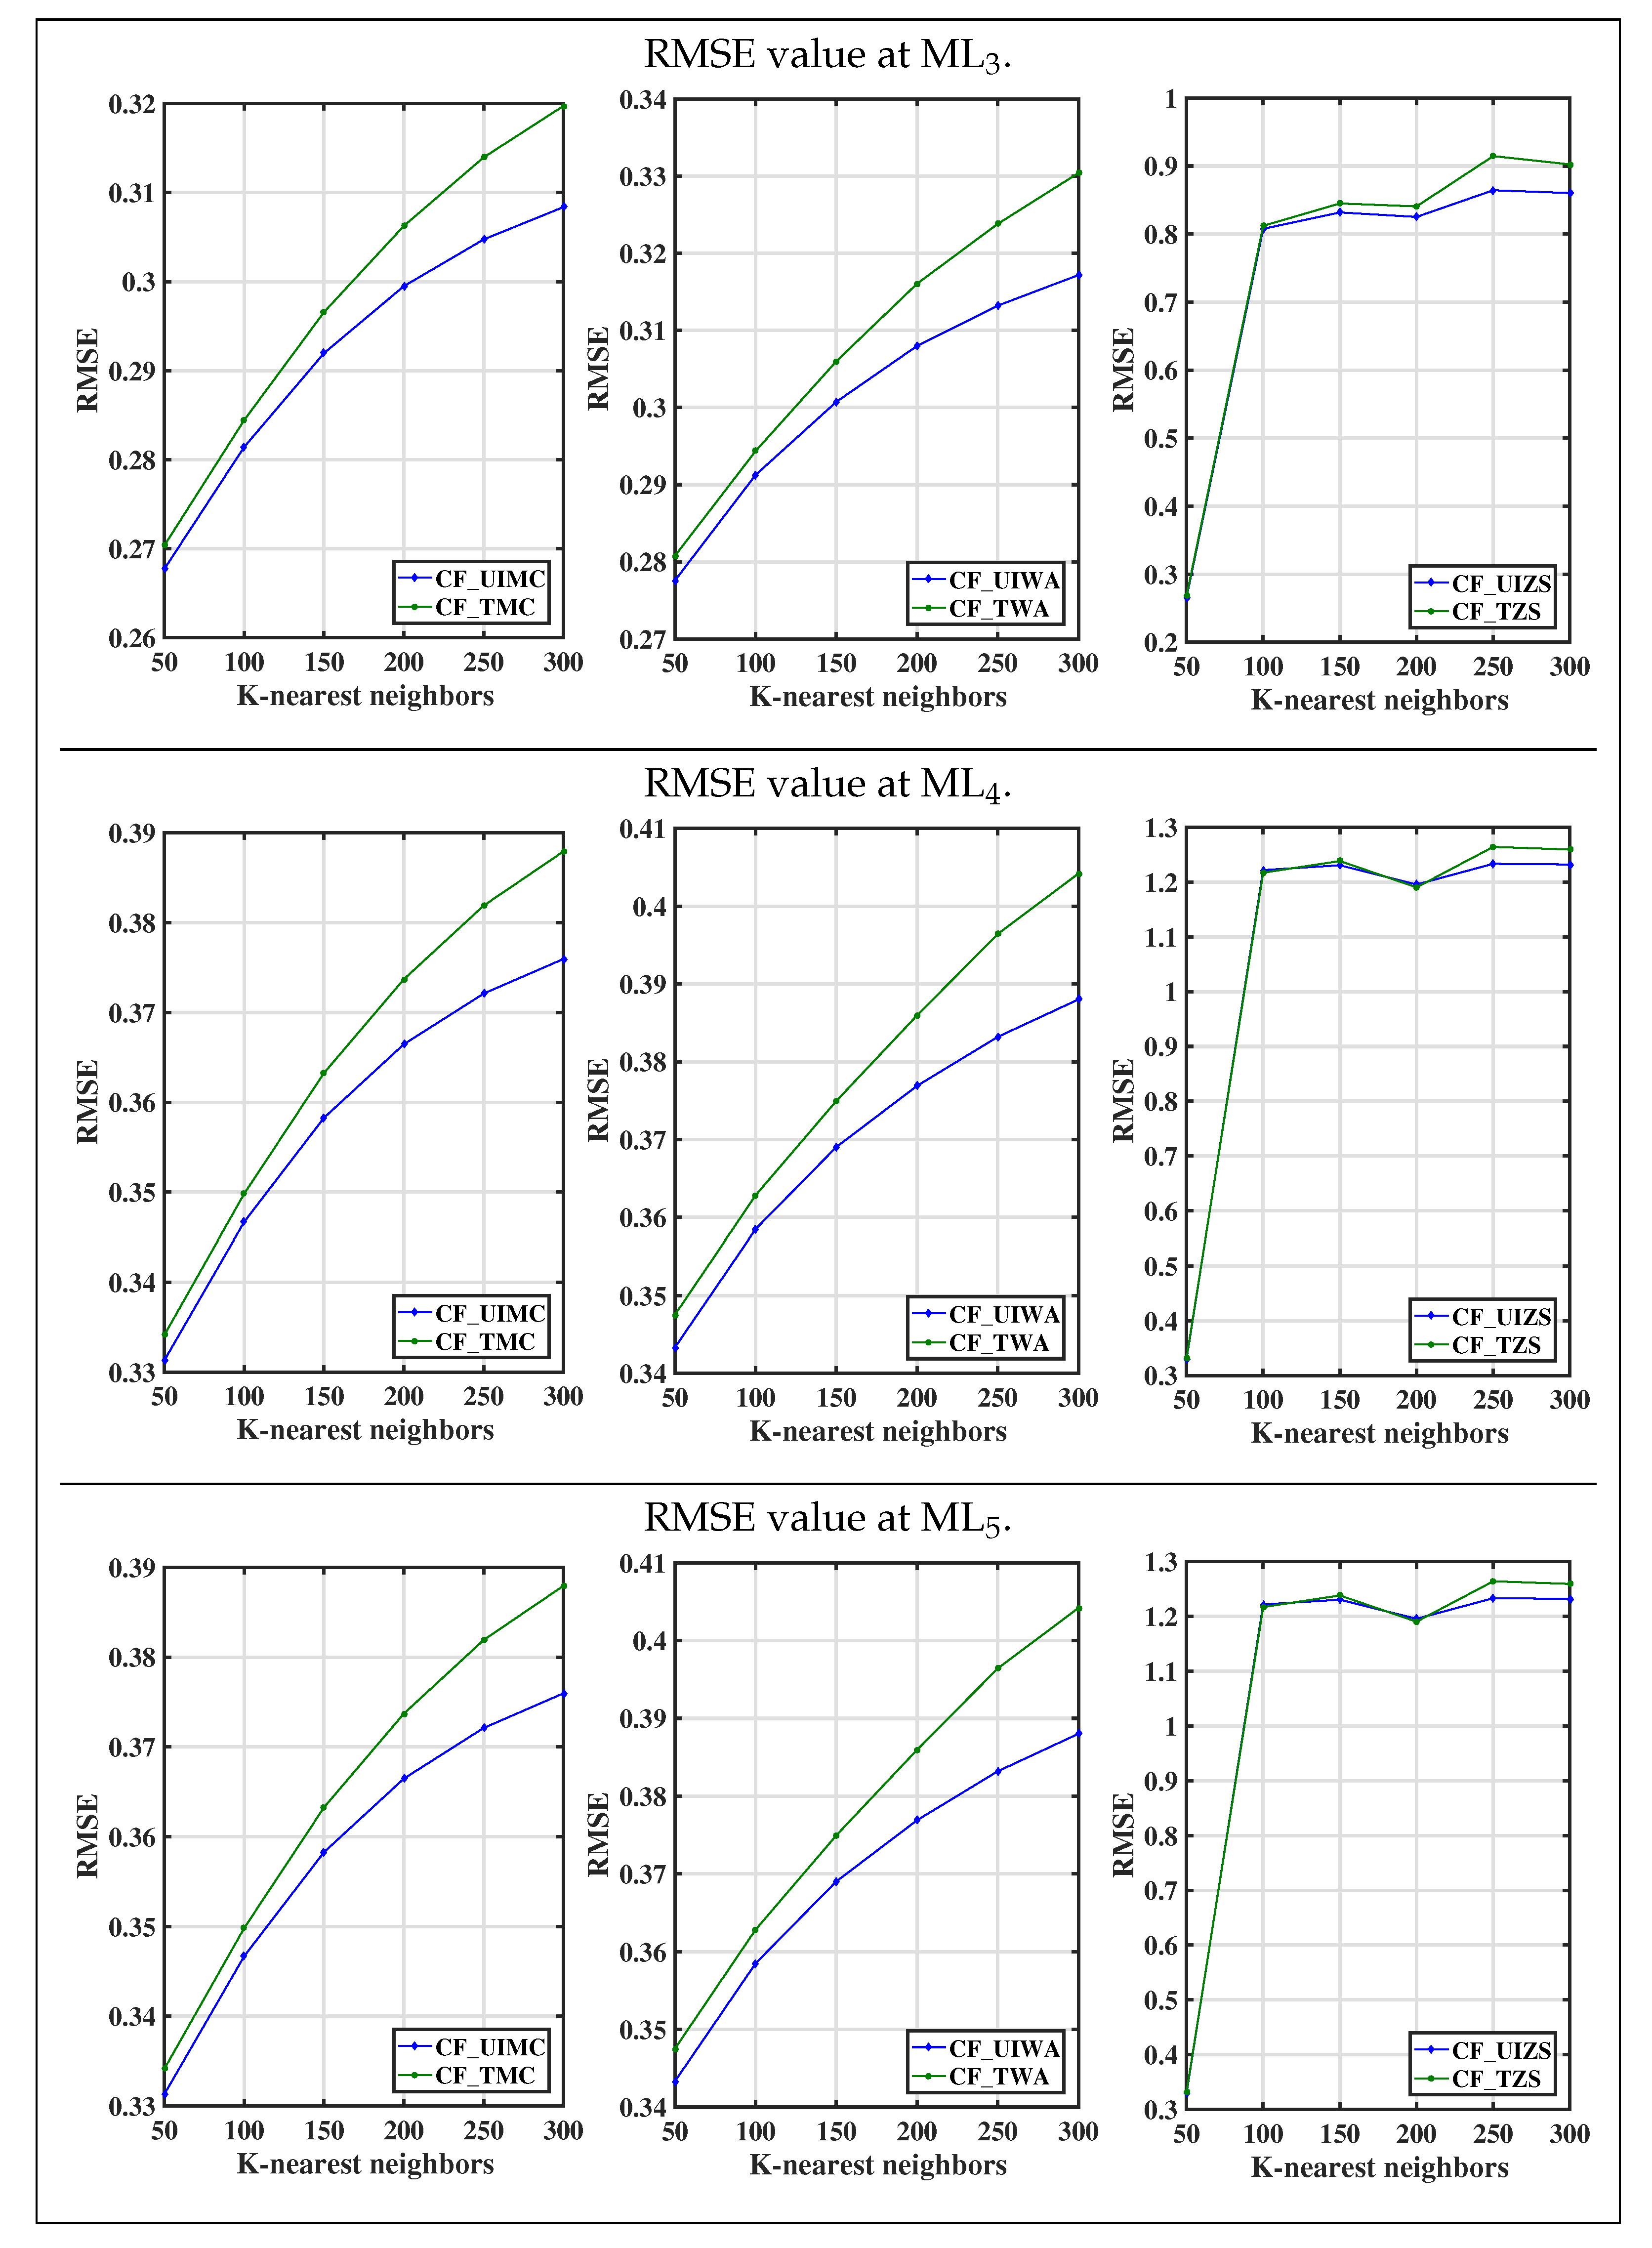
Figure 4 shows the comparison between traditional CF algorithms and CF algorithms using items’ categorical attributes, based on RMSE value at various datasets ML
and ML
. As shown in the above graph, at all considerable values of k in top-k neighbors, CF algorithms using items’ categorical attributes have comparatively low RMSE values than traditional CF algorithms. Therefore, the comparative results of the above graph uphold the fact that CF_UIMC, CF_UIWA, and CF_UIZS are better CF algorithms than CF_TMC, CF_TWA, and CF_TZS respectively.
The
Figure 5 represents the comparison between traditional CF algorithms and CF algorithms using items’ categorical attributes, based on RMSE value at various datasets ML
, ML
and ML
. The CF algorithms using items’ categorical attributes have a minimal prediction error than traditional CF algorithms for all traditional prediction approaches (i.e., MC, WA, and ZS) at all considerable values of k in top-k neighbors. Therefore, on the basis of the accuracy of recommendation, CF_UIMC, CF_UIWA, and CF_UIZS are preferable algorithms to CF_TMC, CF_TWA, and CF_TZS, respectively.
4.1.2. When Top-1 Nearest Neighbor Is Used
The
Figure 6 shows the comparison between traditional CF algorithms (CF_TMC, CF_TWA, and CF_TZS) and CF algorithms using items’ categorical attributes (CF_UIMC, CF_UIWA and CF_UIZS), based on MAE value using Top-1 nearest neighbor at datasets ML
and ML
. In the graph CF algorithms using items’ categorical attributes attain low prediction errors than traditional CF algorithms in all traditional prediction approaches. Therefore, CF_UIMC, CF_UIWA, and CF_UIZS provide more accurate recommendation results than CF_TMC, CF_TWA, and CF_TZS respectively.
The
Figure 7 depicts the comparison between traditional CF algorithms and CF algorithms using items’ categorical attributes, based on MAE value at various datasets ML
, ML
and ML
. We can notice that CF algorithms using items’ categorical attributes provide less prediction error in all traditional prediction approaches (i.e., MC, WA, and ZS). Therefore, CF_UIMC, CF_UIWA and CF_UIZS outperform CF_TMC, CF_TWA and CF_TZS respectively.
The
Figure 8 shows the comparison between traditional CF algorithms and CF algorithms using items’ categorical attributes, based on RMSE value at Top-1 nearest neighbor. As shown in the graph, CF algorithms using items’ categorical attributes have comparatively low RMSE values than traditional CF algorithms. Therefore, the comparative results of the above graph uphold the fact that CF_UIMC, CF_UIWA, and CF_UIZS are better CF algorithms than CF_TMC, CF_TWA, and CF_TZS respectively.
The
Figure 9 represents the comparison between traditional CF algorithms and CF algorithms using items’ categorical attributes, based on RMSE value at various datasets ML
, ML
and ML
. The CF algorithms using items’ categorical attributes have a minimal prediction error than traditional CF algorithms for all traditional prediction approaches (i.e., MC, WA, and ZS) Therefore, on the basis of RMSE, CF_UIMC, CF_UIWA and CF_UIZS are more preferable algorithms than CF_TMC, CF_TWA, and CF_TZS respectively.
From
Figure 2,
Figure 3,
Figure 4,
Figure 5,
Figure 6,
Figure 7,
Figure 8 and
Figure 9, we can easily observe that UIBC achieves comparatively lower MAE and RMSE than BC for all k values. Therefore, we can claim that SeM using items’ categorical attributes enhances the recommendation accuracy under all traditional prediction approaches.
4.2. Comparison of the Proposed Recommendation Approach and CF Algorithm Using Items’ Categorical Attributes
However, ICA contributes a considerable impact on the accuracy of the prediction of CF. In this section, we explain the importance of ’most’ similar neighbor in a prediction approach for the sparse dataset. The following
Figure 10,
Figure 11,
Figure 12,
Figure 13,
Figure 14,
Figure 15,
Figure 16 and
Figure 17 represent the comparative results of the proposed recommendation approach and CF using ICA.
4.2.1. When Top-k Nearest Neighbor Is Used
The
Figure 10 represents the comparison between the proposed recommendation approach (MSMPPA) and CF algorithms using items’ categorical attributes (CF_UIMC, CF_UIWA and CF_UIZS) based on MAE value at various datasets ML
and ML
. As shown in the above graph, the proposed recommendation approach has a comparatively low MAE value than other CF algorithms. Therefore, the comparative results of the above graph clarify that MSMPPA is better to approach than CF_UIMC, CF_UIWA and CF_UIZS.
The
Figure 11 depicts the comparison between the proposed recommendation approach and CF algorithms using items’ categorical attributes, based on MAE value at various datasets ML
, ML
and ML
. The proposed recommendation approach has a comparatively low prediction error than CF algorithms using items’ categorical attributes for all traditional prediction approaches (i.e., MC, WA, and ZS). Therefore, on the basis of the accuracy of recommendation, MSMPPA is more preferable approach than CF_UIMC, CF_UIWA and CF_UIZS.
Figure 12 shows the comparison between the proposed recommendation approach and CF algorithms using items’ categorical attributes based on RMSE value at various datasets ML
and ML
. In the graph, CF algorithms using items’ categorical attributes attain high prediction errors than the proposed recommendation approach. Therefore, CF_UIMC, CF_UIWA, and CF_UIZS provide less accurate recommendation results than MSMPPA.
The
Figure 13 depicts the comparison between the proposed prediction approach and CF algorithms using items’ categorical attributes, based on RMSE value at various datasets ML
, ML
and ML
. We can notice that the proposed prediction approach provides less prediction error. Therefore, MSMPPA outperforms CF_UIMC, CF_UIWA, and CF_UIZS.
4.2.2. When Top-1 Nearest Neighbor Is Used
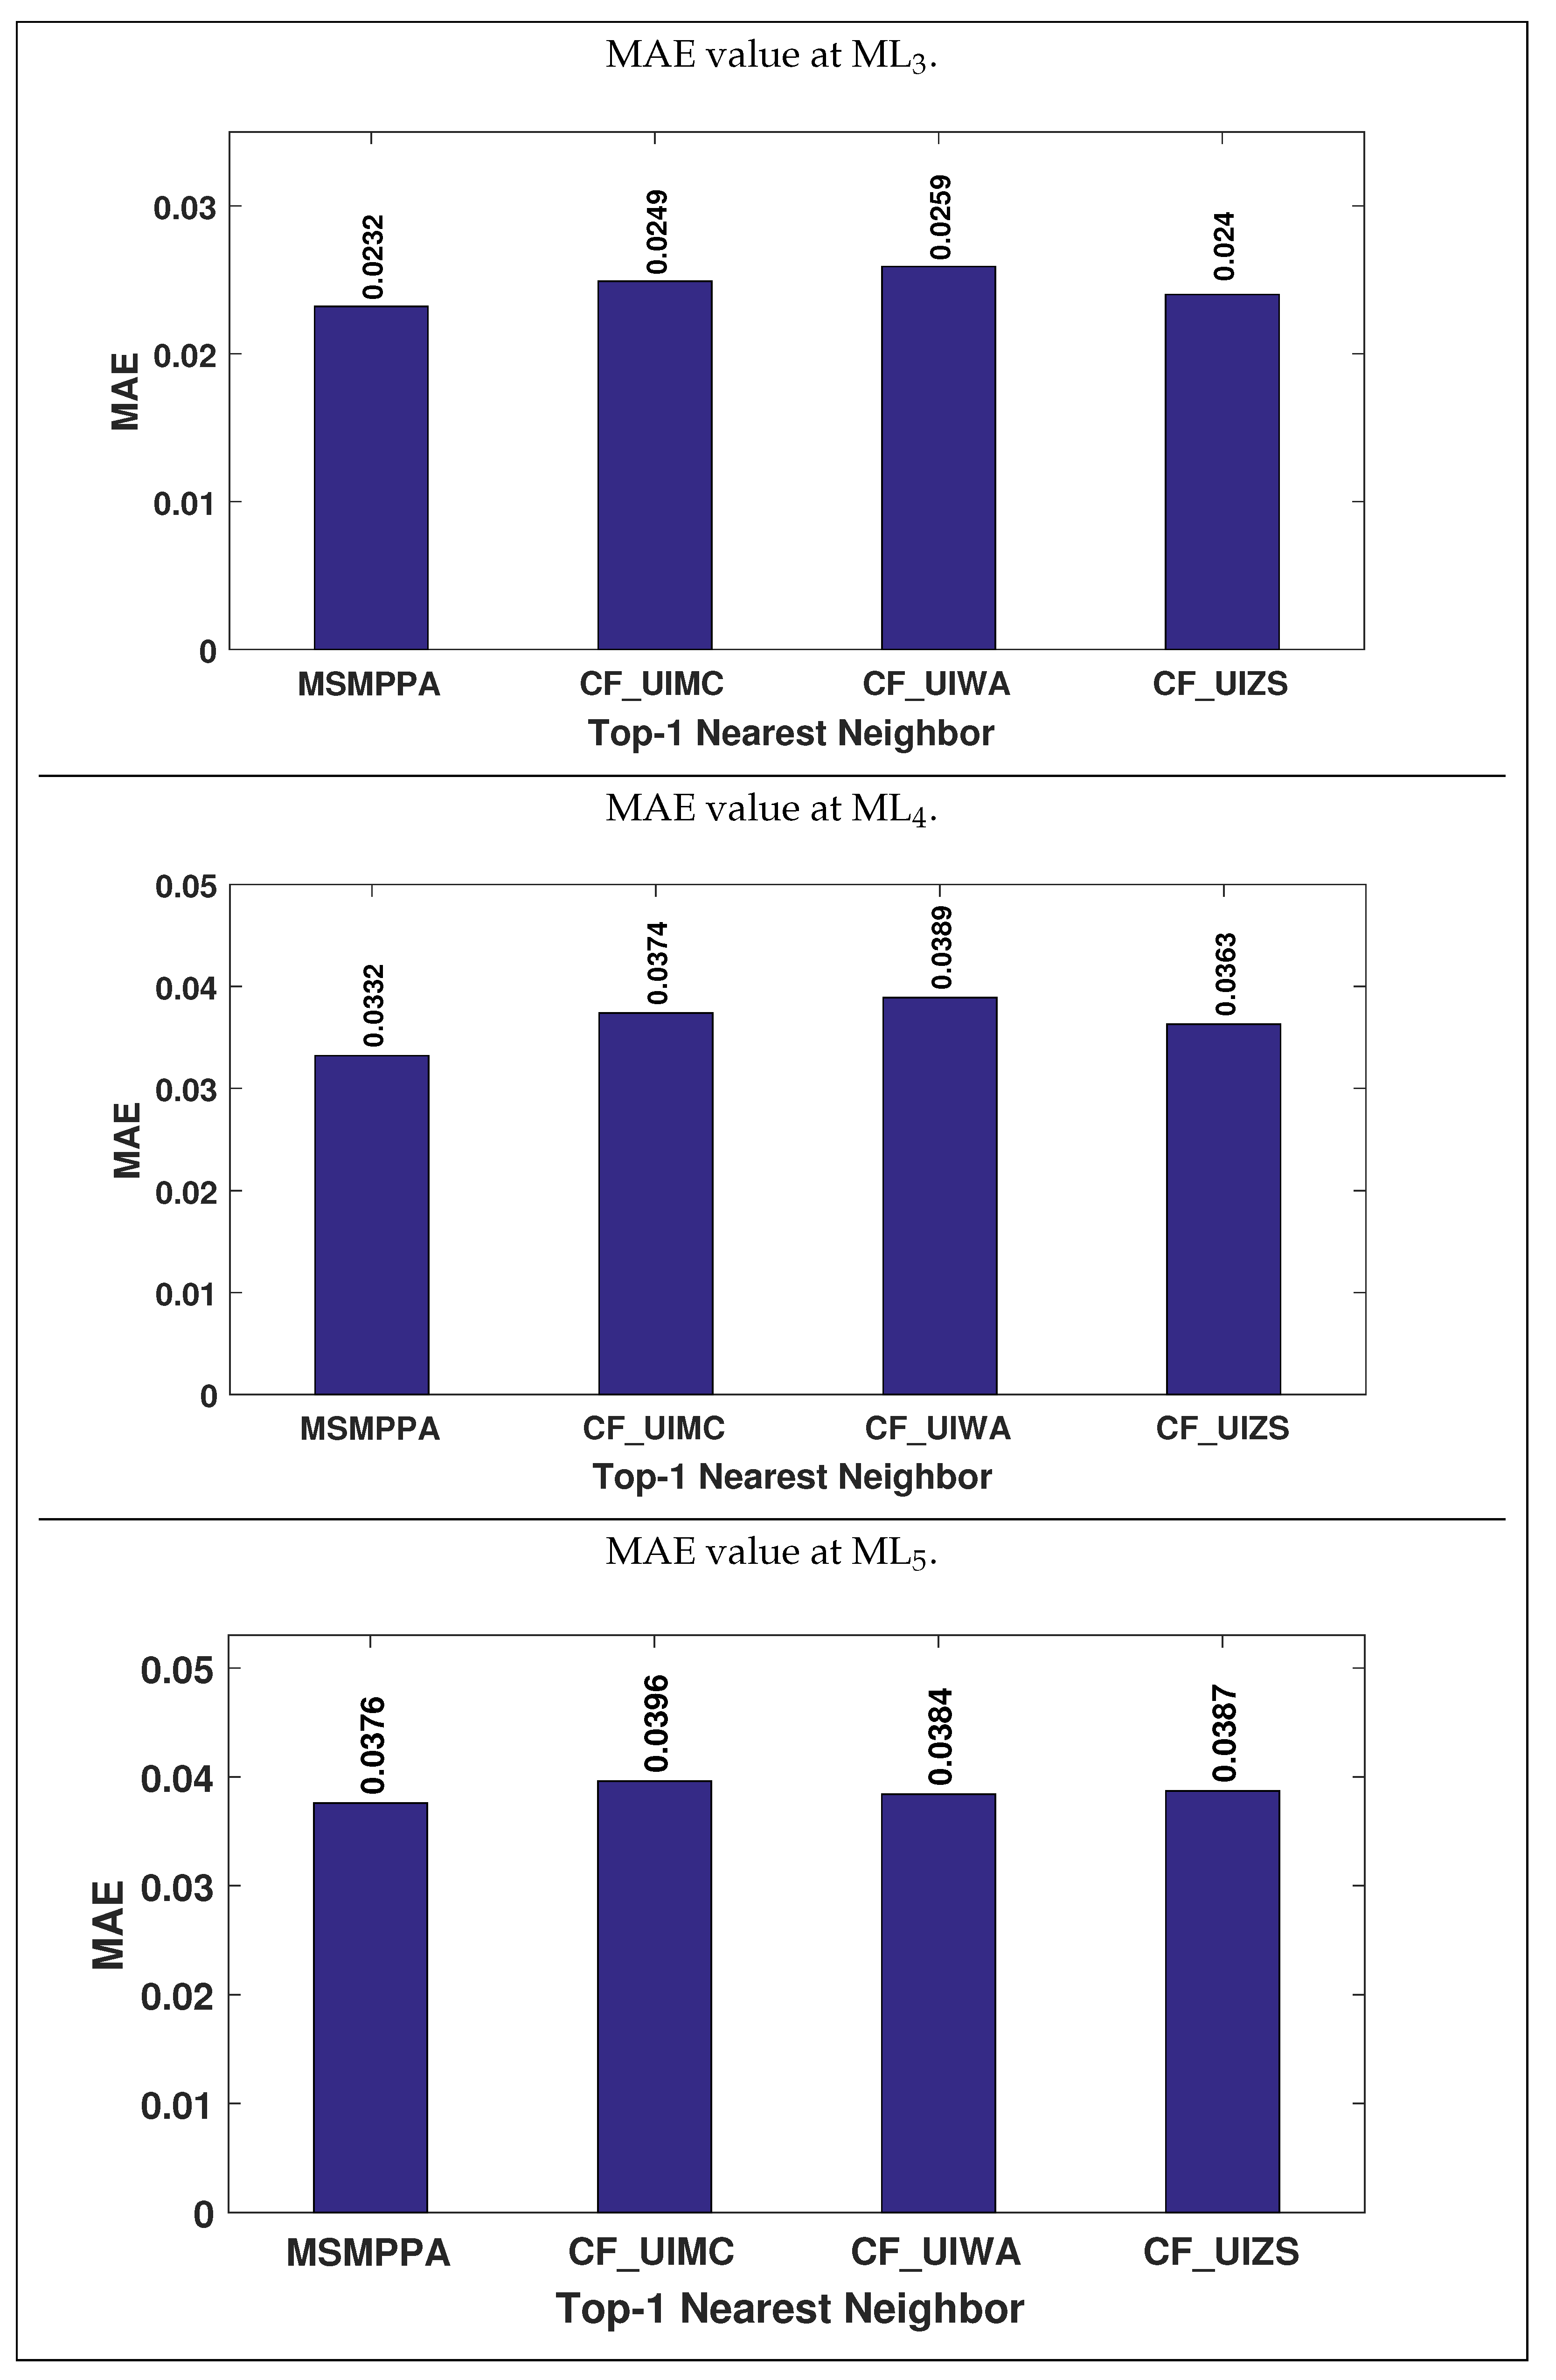
The
Figure 14 represents the comparison between the proposed recommendation approach (MSMPPA) and CF algorithms using items’ categorical attributes (CF_UIMC, CF_UIWA and CF_UIZS) based on MAE value at Top-1 nearest neighbor. As shown in the graph, the proposed recommendation approach has a comparatively low MAE value than other CF algorithms. Therefore, the comparative results of the above graph clarify that MSMPPA is better to approach than CF_UIMC, CF_UIWA and CF_UIZS.
The
Figure 15 shows the comparison between the proposed recommendation approach and CF algorithms using items’ categorical attributes, based on MAE value at various datasets ML
, ML
and ML
. The proposed recommendation approach has a comparatively low prediction error than CF algorithms using items’ categorical attributes for all traditional prediction approaches (i.e., MC, WA, and ZS). Therefore, on the basis of the accuracy of recommendation, MSMPPA is more preferable approach than CF_UIMC, CF_UIWA, and CF_UIZS.
The
Figure 16 shows the comparison between the proposed recommendation approach and CF algorithms using items’ categorical attributes, based on RMSE value at various datasets ML
and ML
. In the graph, CF algorithms using items’ categorical attributes attain high prediction errors than the proposed recommendation approach. Therefore, CF_UIMC, CF_UIWA, and CF_UIZS provide less accurate recommendation results than MSMPPA.
The
Figure 17 depicts the comparison between the proposed prediction approach and CF algorithms using items’ categorical attributes, based on RMSE value at various datasets ML
, ML
and ML
. We can notice that the proposed prediction approach provides less prediction error. Therefore, MSMPPA outperforms CF_UIMC, CF_UIWA and CF_UIZS.
From aforementioned
Figure 2,
Figure 3,
Figure 4,
Figure 5,
Figure 6,
Figure 7,
Figure 8,
Figure 9,
Figure 10,
Figure 11,
Figure 12,
Figure 13,
Figure 14,
Figure 15,
Figure 16 and
Figure 17, we can conclude that ICA in SeM and
’most’ similar neighbor in prediction approach surpass recommendation results from the other state-of-the-art in CF. The justification of the aforementioned statement is clarified by the comparative outcomes of the stated recommendation approach.
5. Conclusions
The state-of-the-art modified SeM and traditional prediction approaches of CF cannot lead to decent recommendations to the active user as they cannot compute the similarity value of those two users whose ratings are non-co-rated and disjoint to each other. In this case, the results of top-n similar neighbors of an active user become unattainable; therefore, the accuracy of CF-based RS considerably drops in a sparse dataset.
This study of the proposed recommendation approach adopts a new attribute in the similarity computation as well as considers only the ‘most’ similar neighbor in a rating prediction. As a result, the algorithm can determine how similar two users are based on their shared interests, but their ratings are non-co-rated and distinct from each other. Finding a `most’ similar neighbor is a comparatively easy task than the findings of top-n close neighbors in a sparse situation, Therefore, we mainly think about the most similar neighbor in a rating prediction approach to attain improved recommendation accuracy.
For the justification of the proposed recommendation approach, we conduct a number of comparisons on the collected MovieLens datasets. The comparative analysis is divided into two parts and uses the MAE and RMSE performance indicators. In the first section of the study, it is explained why categorical attributes of items must be taken into account when calculating similarity. As a result, a similarity measure using items’ categorical attributes provides considerably enhanced recommendation outcomes than other traditional CF algorithms. In the second part of the analysis, we justify that a modified prediction approach with the aforementioned similarity measure can also play a major role in enhancing the accuracy of CF. Therefore, all improved CF algorithms we get from the first part of the analysis are compared with the proposed recommendation approach. The comparative results of the above two sections show the effectiveness of the proposed recommendation over other CF algorithms. Furthermore, our study allows us to ensure the future direction of improving the recommendation accuracy of CF by modified similarity measures with an improved prediction approach. In the proposed approach, we have used the balance factor value of “0.5.” The effectiveness of ReS might be enhanced by an optimized algorithm for selecting the value of this balancing factor.
Author Contributions
Conceptualization, P.K.S., A.K.S. and R.K.S.; methodology, R.K.S. and J.P.S.; validation, P.K.S., A.K.S., R.K.S. and S.D.; formal analysis, J.P.S. and S.D.; investigation, P.K.S.; resources, R.K.S., P.K.S. and P.K.S.; writing—original draft preparation, S.D. and J.P.S.; writing—review and editing, R.K.S., P.K.S., A.K.S., J.P.S. and S.D.; visualization, P.K.S. and S.D.; final version writing—review, editing, S.D. All authors have read and agreed to the published version of the manuscript.
Funding
This research received no external funding.
Institutional Review Board Statement
Not applicable.
Informed Consent Statement
Not applicable.
Data Availability Statement
The data presented in this study are available upon request from the corresponding author.
Conflicts of Interest
There are no conflict of interest among authors.
References
- Govil, N.; Kushwaha, A.; Sahgal, H. Analyzing the behaviour of java–based movie recommendation system using machine learning. In Proceedings of the Second International Conference on Electronics and Sustainable Communication Systems (ICESC), Coimbatore, India, 4–6 August 2021; pp. 1485–1489. [Google Scholar]
- Lu, J.; Wu, D.; Mao, M.; Wang, W.; Zhang, G. Recommender system application developments: A survey. Decis. Support Syst. 2015, 74, 12–32. [Google Scholar] [CrossRef]
- Rajpoot, V.; Agrawal, R.; Chaturvedi, A.; Goyal, K. An empirical study of sentiment analysis on movie review using machine learning based classification approach. In Proceedings of the 5th International Conference on Information Systems and Computer Networks (ISCON), Mathura, India, 22–23 October 2021; pp. 1–4. [Google Scholar]
- Patra, B.K.; Launonen, R.; Ollikainen, V.; Nandi, S. Exploiting bhattacharyya similarity measure to diminish user cold-start problem in sparse data. In Proceedings of the International Conference on Discovery Science, Bled, Slovenia, 9 September 2014; pp. 252–263. [Google Scholar]
- Shen, K.; Liu, Y.; Zhang, Z. Modified similarity algorithm for collaborative filtering. In Knowledge Management in Organizations; Uden, L., Lu, W., Ting, I.-H., Eds.; Springer International Publishing: Cham, Switzerland, 2017; pp. 378–385. [Google Scholar]
- Singh, P.K.; Pramanik, P.K.D.; Choudhury, P. Mitigating sparsity using Bhattacharyya Coefficient and items’ categorical attributes: Improving the performance of collaborative filtering based recommendation systems. Appl. Intell. 2022, 52, 5513–5536. [Google Scholar] [CrossRef]
- Singh, P.K.; Pramanik, P.K.D.; Choudhury, P. An improved similarity calculation method for collaborative filtering-based recommendation, considering the liking and disliking of categorical attributes of items. J. Inf. Optim. Sci. 2019, 40, 397–412. [Google Scholar] [CrossRef]
- Singh, P.K.; Setta, S.; Pramanik, P.K.D.; Choudhury, P. Improving the accuracy of collaborative filtering based recommendations by considering the temporal variance of top-n neighbors. In Proceedings of the International Conference on Innovative Computing and Communication (ICICC-2019), Ostrava, Czech Republic, 21–22 March 2019. [Google Scholar]
- Goldberg, D.; Nichols, D.; Oki, B.M.; Terry, D. Using collaborative filtering to weave an information tapestry. Commun. ACM 1992, 35, 61–70. [Google Scholar] [CrossRef]
- Al-Shamri, M.Y.H. User profiling approaches for demographic recommender systems. Knowl.-Based Syst. 2016, 100, 175–187. [Google Scholar] [CrossRef]
- Salter, J.; Antonopoulos, N. Cinemascreen recommender agent: Combining collaborative and content-based filtering. IEEE Intell. Syst. 2006, 21, 35–41. [Google Scholar] [CrossRef]
- Kim, H.-N.; Ha, I.; Lee, K.-S.; Jo, G.-S.; El-Saddik, A. Collaborative user modeling for enhanced content filtering in recommender systems. Decis. Support Syst. 2011, 51, 772–781. [Google Scholar] [CrossRef]
- Singh, P.K.; Pramanik, P.K.D.; Choudhury, P. Collaborative filtering in recommender systems: Technicalities, challenges, applications and research trends. In New Age Analytics: Transforming Internet; Shrivastava, G., Peng, S.L., Bansal, H., Sharma, K., Sharma, M., Eds.; Apple Academic Press: Palm Bay, FL, USA, 2019. [Google Scholar]
- Zhang, J.; Ma, C.; Zhong, C.; Zhao, P.; Mu, X. Combining feature importance and neighbor node interactions for cold start recommendation. Eng. Appl. Artif. Intell. 2022, 112, 104864. [Google Scholar] [CrossRef]
- Feng, J.; Xia, Z.; Feng, X.; Peng, J. RBPR: A hybrid model for the new user cold start problem in recommender systems. Knowl.-Based Syst. 2021, 214, 106732. [Google Scholar] [CrossRef]
- Wang, H.-C.; Jhou, H.-T.; Tsai, Y.-S. Adapting topic map and social influence to the personalized hybrid recommender system. Inf. Sci. 2018, 575, 762–778. [Google Scholar] [CrossRef]
- Aggarwal, C.C. Model-Based Collaborative Filtering; Springer International Publishing: Cham, Switzerland, 2016; pp. 71–138. [Google Scholar]
- Rathor, S.; Prakash, Y. Application of machine learning for sentiment analysis of movies using imdb rating. In Proceedings of the IEEE 11th International Conference on Communication Systems and Network Technologies (CSNT), Indore, India, 23–24 April 2022; pp. 196–199. [Google Scholar]
- Koren, Y. Factorization meets the neighborhood: A multifaceted collaborative filtering model. In Proceedings of the 14th ACM SIGKDD International Conference on Knowledge Discovery and Data Mining, Las Vegas, NV, USA, 24–27 August 2008; pp. 426–434, recommendation, 2017; pp. 149–159. [Google Scholar]
- Paterek, A. Improving regularized singular value decomposition for collaborative filtering. In Proceedings of the KDD Cup and Workshop, San Jose, CA, USA, 12 August 2007; Volume 2007, pp. 5–8. [Google Scholar]
- Koren, Y. Factor in the neighbors: Scalable and accurate collaborative filtering. ACM Trans. Knowl. Discov. Data (TKDD) 2010, 4, 1. [Google Scholar] [CrossRef]
- Patra, B.K.; Launonen, R.; Ollikainen, V.; Nandi, S. A new similarity measure using bhattacharyya coefficient for collaborative filtering in sparse data. Knowl.-Based Syst. 2015, 82, 163–177. [Google Scholar] [CrossRef]
- Ekstr, M.D.; Riedl, J.T.; Konstan, J.A. Collaborative filtering recommender systems. Found. Trends® Hum.—Comput. Interact. 2011, 4, 81–173. [Google Scholar] [CrossRef]
- Salton, G.; McGill, M.J. Introduction to Modern Information Retrieval; Facet Publishing: London, UK, 1986. [Google Scholar]
- Shardanand, U.; Maes, P. Social information filtering: Algorithms for automating “word of mouth”. In Proceedings of the SIGCHI Conference on Human Factors in Computing Systems, Denver, CO, USA, 7–11 May 1995; Volume 95, pp. 210–217. [Google Scholar]
- Yildirim, H.; Krishnamoorthy, M.S. A random walk method for alleviating the sparsity problem in collaborative filtering. In Proceedings of the 2008 ACM conference on Recommender systems, Lausanne, Switzerland, 23–25 October 2008; pp. 131–138. [Google Scholar]
- Ortega, F.; SaNchez, J.-L.; Bobadilla, J.; GutieRrez, A. Improving collaborative filtering-based recommender systems results using pareto dominance. Inf. Sci. 2013, 239, 50–61. [Google Scholar] [CrossRef]
- Ahn, H.J. A new similarity measure for collaborative filtering to alleviate the new user cold-starting problem. Inf. Sci. 2008, 178, 37–51. [Google Scholar] [CrossRef]
- Bobadilla, J.; Hernando, A.; Ortega, F.; Gutierrez, A. Collaborative filtering based on significances. Inf. Sci. 2012, 185, 1–17. [Google Scholar] [CrossRef]
- Bobadilla, J.; Serradilla, F.; Bernal, J. A new collaborative filtering metric that improves the behavior of recommender systems. Knowl.-Based Syst. 2010, 23, 520–528. [Google Scholar] [CrossRef]
- Mahara, T. A new similarity measure based on mean measure of divergence for collaborative filtering in sparse environment. Procedia Comput. Sci. 2016, 89, 450–456. [Google Scholar]
- Sarwar, B.; Karypis, G.; Konstan, J.; Riedl, J. Item-based collaborative filtering recommendation algorithms. In Proceedings of the 10th International Conference on World Wide Web, Hong Kong, China, 1–5 May 2001; pp. 285–295. [Google Scholar]
- Choi, K.; Suh, Y. A new similarity function for selecting neighbors for each target item in collaborative filtering. Knowl.-Based Syst. 2013, 37, 146–153. [Google Scholar] [CrossRef]
- Ricci, F.; Rokach, L.; Shapira, B.; Kantor, P.B. Recommender Systems Handbook, 1st ed.; Springer: New York, NY, USA, 2010. [Google Scholar]
- Wu, J.; Chen, L.; Feng, Y.; Zheng, Z.; Zhou, M.; Wu, Z. Predicting quality of service for selection by neighborhood-based collaborative filtering. IEEE Trans. Syst. 2013, 43, 428–439. [Google Scholar]
- I Mansilla, A.T.; De la Rosa i Esteva, J.L. Asknext: An agent protocol for social search. Inf. Sci. 2012, 190, 144–161. [Google Scholar] [CrossRef]
- Palak, R.; Nguyen, N.T. An effective collaborative filtering based method for movie recommendation. In Multimedia and Network Information Systems; Springer: Cham, Switzerland, 2017; pp. 149–159. [Google Scholar]
- Boratto, L.; Carta, S.; Fenu, G. Investigating the role of the rating prediction task in granularity-based group recommender systems and big data scenarios. Inf. Sci. 2017, 378, 424–443. [Google Scholar] [CrossRef]
- Koohi, H.; Kiani, K. A new method to find neighbor users that improves the performance of collaborative filtering. Expert Syst. Appl. 2007, 83, 30–39. [Google Scholar] [CrossRef]
- Stephen, S.C.; Xie, H.; Rai, S. Measures of similarity in memorybased collaborative filtering recommender system: A comparison. In Proceedings of the 4th Multidisciplinary International Social Networks Conference, Bangkok, Thailand, 17–19 July 2017; pp. 1–8. [Google Scholar]
- Liu, Y.; Feng, J.; Lu, J. Collaborative filtering algorithm based on rating distance. In Proceedings of the 11th International Conference on Ubiquitous Information Management and Communication, Beppu, Japan, 5–7 January 2017; pp. 1–7. [Google Scholar]
- Birtolo, C.; Ronca, D. Advances in clustering collaborative filtering by means of fuzzy c-means and trust. Expert Syst. Appl. 2013, 40, 6997–7009. [Google Scholar] [CrossRef]
- Ghazarian, S.; Nematbakhsh, M.A. Enhancing memory-based collaborative filtering for group recommender systems. Expert Syst. Appl. 2015, 42, 3801–3812. [Google Scholar] [CrossRef]
- Guo, G. Integrating trust and similarity to ameliorate the data sparsity and cold start for recommender systems. In Proceedings of the Seventh ACM Conference on Recommender Systems, Hong Kong, China, 12–16 October 2013; pp. 451–454. [Google Scholar]
- Guo, G.; Zhang, J.; Thalmann, D. Merging trust in collaborative filtering to alleviate data sparsity and cold start. Knowl.-Based Syst. 2014, 57, 57–68. [Google Scholar] [CrossRef]
- Sun, D.; Luo, Z.; Zhang, F. A novel approach for collaborative filtering to alleviate the new item cold-start problem. In Proceedings of the 11th International Symposium on Communications and Information Technologies, ISCIT, Hangzhou, China, 12–14 October 2011; pp. 402–406. [Google Scholar]
- Jorge, A.M.; Vinagre, J.; Domingues, M.; Gama, J.; Soares, C.; Matuszyk, P.; Spiliopoulou, M. Scalable Online Top-N Recommender Systems, 3rd ed.; Springer International Publishing: Cham, Switzerland, 2017; pp. 3–20. [Google Scholar]
- Geuens, S.; Coussement, K.; De Bock, K.W. A framework for configuring collaborative filtering-based recommendations derived from purchase data. Eur. J. Oper. Res. 2018, 265, 208–218. [Google Scholar] [CrossRef]
- Herlocker, J.; Konstan, J.A.; Riedl, J. An empirical analysis of design choices in neighborhood-based collaborative filtering algorithms. Inf. Retr. 2002, 5, 287–310. [Google Scholar] [CrossRef]
- Herlocker, J.L.; Konstan, J.A.; Borchers, A.; Riedl, J. An algorithmic framework for performing collaborative filtering. In Proceedings of the 22nd Annual International ACM SIGIR Conference on Research and Development in Information Retrieval, Berkeley, CA, USA, 15–19 August 1999; pp. 230–237. [Google Scholar]
- Adamopoulos, P. Notes on Recommender Systems: A Survey of State-of-the-Art Algorithms, beyond Rating Prediction Accuracy Approaches and Business Value Perspectives; Leonard N. Stern School of Business, New York University: New York, NY, USA, 2013. [Google Scholar]
- Lohr, S.L. Sampling: Design and Analysis: Design and Analysis; CRC Press: Boca Raton, FL, USA, 2019. [Google Scholar]
- HJamalzehi, S.; Menhaj, M.B. A new similarity measure based on item proximity and closeness for collaborative filtering recommendation. In Proceedings of the 2016 4th International Conference on Control, Instrumentation, and Automation (ICCIA), Qazvin, Iran, 27–28 January 2016; pp. 445–450. [Google Scholar]
- Cheng, Q.; Wang, X.; Yin, D.; Niu, Y.; Xiang, X.; Yang, J.; Shen, L. The new similarity measure based on user preference models for collaborative filtering. In Proceedings of the 2015 IEEE International Conference on Information and Automation, Lijiang, China, 8–10 August 2015; pp. 577–582. [Google Scholar]
- Al-Bashiri, H.; Abdulgabber, M.A.; Romli, A.; Salehudin, N. A developed collaborative filtering similarity method to improve the accuracy of recommendations under data sparsity. Int. J. Adv. Comput. Sci. Appl. (IJACSA) 2018, 9, 135–142. [Google Scholar] [CrossRef] [Green Version]
- Kumar, N.P.; Fan, Z. Hybrid user-item based collaborative filtering. Procedia Comput. Sci. 2015, 60, 1453–1461. [Google Scholar] [CrossRef] [Green Version]
- Wu, X.; Huang, Y.; Wang, S. A new similarity computation method in collaborative filtering based recommendation system. In Proceedings of the 2017 IEEE 86th Vehicular Technology Conference (VTC-Fall), Toronto, ON, Canada, 24–27 September 2017; pp. 1–5. [Google Scholar]
- Singh, P.K.; Pramanik, P.K.D.; Choudhury, P. A comparative study of different similarity metrics in highly sparse rating dataset. In Data Management, Analytics and Innovation; Balas, V., Sharma, N., Chakrabarti, A., Eds.; Springer International Publishing: Cham, Switzerland, 2018; Volume 2, pp. 45–60. [Google Scholar]
- Singh, P.K.; Pramanik, P.K.D.; Debnath, N.C.; Choudhury, P. A novel neighborhood calculation method by assessing users’ varying preferences in collaborative filtering. In Proceedings of the 34th International Conference on Computers and Their Applications (CATA 2019) Number 58 in EPiC Series in Computing, Honolulu, HA, USA, 18–20 March 2019; pp. 345–355. [Google Scholar]
- Sharma, H.; Jalal, A.S. A survey of methods, datasets and evaluation metrics for visual question answering. Image Vision Comput. 2021, 116, 104327. [Google Scholar] [CrossRef]
- Gupta, V.; Sharma, D.K.; Dixit, A. Review of Information Retrieval: Models, Performance Evaluation Techniques and Applications. Int. J. Sens. Wirel. Commun. Control 2021, 11, 896–909. [Google Scholar] [CrossRef]
Figure 1.
The Systematic Flow Diagram of the Proposed Recommender System.
Figure 1.
The Systematic Flow Diagram of the Proposed Recommender System.
Figure 2.
MAE Value at Dataset1.
Figure 2.
MAE Value at Dataset1.
Figure 3.
MAE Value at Dataset2.
Figure 3.
MAE Value at Dataset2.
Figure 4.
RMSE Value at Dataset1.
Figure 4.
RMSE Value at Dataset1.
Figure 5.
RMSE Value at Dataset2.
Figure 5.
RMSE Value at Dataset2.
Figure 6.
MAE Value at Dataset1.
Figure 6.
MAE Value at Dataset1.
Figure 7.
MAE Value at Dataset2.
Figure 7.
MAE Value at Dataset2.
Figure 8.
RMSE Value at Dataset1.
Figure 8.
RMSE Value at Dataset1.
Figure 9.
RMSE Value at Dataset2.
Figure 9.
RMSE Value at Dataset2.
Figure 10.
MAE Value at Dataset1.
Figure 10.
MAE Value at Dataset1.
Figure 11.
MAE Value at Dataset2.
Figure 11.
MAE Value at Dataset2.
Figure 12.
RMSE Value at Dataset1.
Figure 12.
RMSE Value at Dataset1.
Figure 13.
RMSE Value at Dataset2.
Figure 13.
RMSE Value at Dataset2.
Figure 14.
MAE Value at Dataset1.
Figure 14.
MAE Value at Dataset1.
Figure 15.
MAE Value at Dataset2.
Figure 15.
MAE Value at Dataset2.
Figure 16.
RMSE Value at Dataset1.
Figure 16.
RMSE Value at Dataset1.
Figure 17.
RMSE Value at Dataset2.
Figure 17.
RMSE Value at Dataset2.
Table 1.
User-Movie rating dataset.
Table 1.
User-Movie rating dataset.
| | Movie | Obj1 | Obj2 | Obj3 | Obj4 | Obj5 | Obj6 |
|---|
| User | |
|---|
| 1 | 1 | 0 | 0 | 0 | 0 |
| 0 | 0 | 4 | 0 | 2 | 0 |
| 0 | 0 | 0 | 5 | 0 | 5 |
Table 2.
Details of Movies.
Table 2.
Details of Movies.
| | Genre | Action | Romantic | Thriller | Horror |
|---|
| Movies | |
|---|
| Y | Y | | |
| Y | Y | Y | |
| | Y | Y | Y |
| | Y | Y | Y |
| Y | | Y | Y |
| | | Y | Y |
Table 3.
Co-relation Metric.
Table 3.
Co-relation Metric.
| Co-Relation Metric | Reference | Equation |
|---|
| (BC) | [4] | |
| (CS) | [32] | |
| (ED) | [33] | |
| (ACS) | [32] | |
| (SC) | [29,34] | |
| (PC) | [32] | |
Table 4.
Prediction Approach.
Table 4.
Prediction Approach.
| Prediction Approach and References | Equation |
|---|
Mean Centering (MC)
[4,5,28,33,35,36,37,38,39,40,41,42,43] | |
Weighted Average (WA)
[12,32,38,44,45,46,47,48] | |
Z-Score (ZS)
[49,50,51,52] | |
Table 5.
A list of notable references on the improvement of CF-based RS via a new SeM.
Table 5.
A list of notable references on the improvement of CF-based RS via a new SeM.
| Reference | Proposed a New
Similarity
Measure | Used Prediction
Approach |
|---|
| [22,31,53,54,55] | | MC |
| [56,57] | | WA |
Table 6.
A binary matrix with k categorical attributes and x items.
Table 6.
A binary matrix with k categorical attributes and x items.
| | Attribute | Att1 | … | … | Attj | … | … | Attk |
|---|
| Item | |
|---|
| | … | … | | … | … | |
| … | … | … | … | … | … | … | … |
| … | … | … | … | … | … | … | … |
| | … | … | | … | … | |
| … | … | … | … | … | … | … | … |
| … | … | … | … | … | … | … | … |
| | … | … | | … | … | |
Table 7.
User’s interest on items’ categorical attributes.
Table 7.
User’s interest on items’ categorical attributes.
| | Attribute | Att1 | … | … | Attj | … | … | Attk |
|---|
| User | |
|---|
| | … | … | | … | … | |
| … | … | … | … | … | … | … | … |
| … | … | … | … | … | … | … | … |
| | … | … | | … | … | |
| … | … | … | … | … | … | … | … |
| … | … | … | … | … | … | … | … |
| | … | … | | … | … | |
Table 12.
User-Movie rating dataset.
Table 12.
User-Movie rating dataset.
| | Movie | Mo1 | Mo2 | Mo3 | Mo4 | Mo5 | Mo6 |
|---|
| User | |
|---|
| 3 | 3 | ≈1 | ≈1.5 | ≈0.5 | ≈1.5 |
| ≈1 | ≈1 | 4 | ≈3 | 2 | ≈3 |
| ≈1 | ≈1 | ≈2.5 | 5 | ≈1 | 5 |
Table 13.
Descriptons of the collected datasets.
Table 13.
Descriptons of the collected datasets.
|
Dataset
| Description |
Domain
|
User Count
|
Item Count
|
Rating Count
|
Sparse (%)
|
Rating Range
|
|---|
| Dataset1 |
MovieLens
ml-1m |
Movie
|
6040
|
3952
|
1,000,209
|
95.809
|
1 to 5.0
with one increments
|
| Dataset2 |
MovieLens
ml-100k |
Movie
|
943
|
1682
|
100,000
|
93.695
|
1 to 5.0
with one increments
|
Table 14.
Details of the subsets used in the experiments.
Table 14.
Details of the subsets used in the experiments.
| Dataset | # Users
(U) | # Items
(I) | Subset | Density Index
| | |
|---|
| Dataset1 | 6040 | 3706 | ML | 3.57 | 132.47 | 215.911 |
| ML | 3.12 | 115.91 | 188.922 |
| | | | ML | 5.04 | 84.835 | 47.56 |
| Dataset2 | 943 | 1682 | ML | 4.41 | 74.23 | 41.61 |
| | | | ML | 3.78 | 63.62 | 35.67 |
Table 15.
Details of used similarity metrics and prediction approach.
Table 15.
Details of used similarity metrics and prediction approach.
| CF Algorithm | Used
Similarity Measure | Used
Prediction Approach |
|---|
| Traditional | CF_TMC | Traditional (BC) | MC |
| CF_TWA | Traditional (BC) | WA |
| CF_TZS | Traditional (BC) | ZS |
| Proposed | CF_UIMC | UIBC | MC |
| CF_UIWA | UIBC | WA |
| CF_UIZS | UIBC | ZS |
| Publisher’s Note: MDPI stays neutral with regard to jurisdictional claims in published maps and institutional affiliations. |
© 2022 by the authors. Licensee MDPI, Basel, Switzerland. This article is an open access article distributed under the terms and conditions of the Creative Commons Attribution (CC BY) license (https://creativecommons.org/licenses/by/4.0/).

 ,
, 


